Fort Ann, NY
Fort Ann Map
Fort Ann Overview
511
TOTAL POPULATION
280
MALE POPULATION
231
FEMALE POPULATION
121.21
MALES / 100 FEMALES
82.50
FEMALES / 100 MALES
32.0
MEDIAN AGE
3.6
AVG FAMILY SIZE
2.7
AVG HOUSEHOLD SIZE
$33,360
PER CAPITA INCOME
$100,729
AVG FAMILY INCOME
$92,321
AVG HOUSEHOLD INCOME
13.7%
WAGE / INCOME GAP [ % ]
86.3¢/ $1
WAGE / INCOME GAP [ $ ]
0.31
INEQUALITY / GINI INDEX
302
LABOR FORCE [ PEOPLE ]
74.8%
PERCENT IN LABOR FORCE
Fort Ann Zip Codes
Fort Ann Area Codes
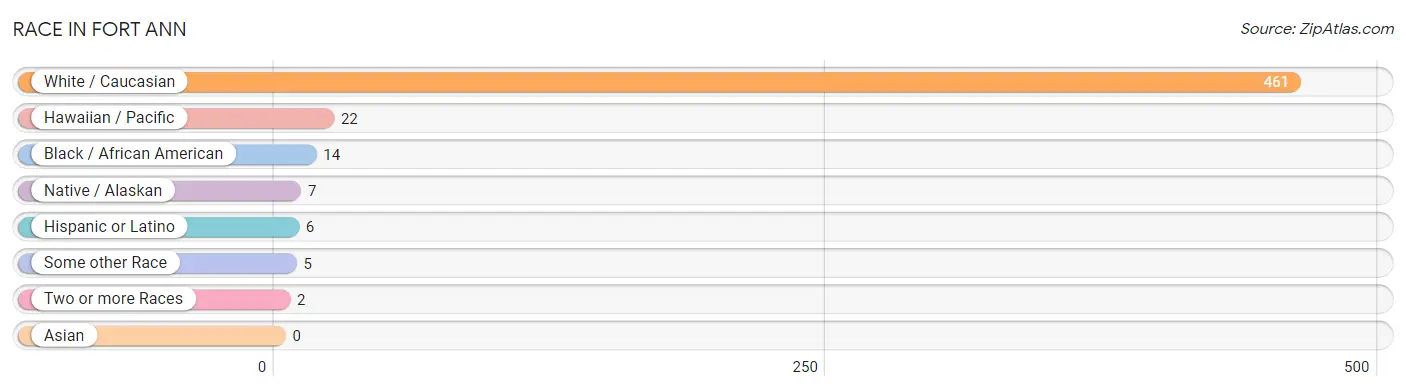
Race in Fort Ann
The most populous races in Fort Ann are White / Caucasian (461 | 90.2%), Hawaiian / Pacific (22 | 4.3%), and Black / African American (14 | 2.7%).
| Race | # Population | % Population |
| Asian | 0 | 0.0% |
| Black / African American | 14 | 2.7% |
| Hawaiian / Pacific | 22 | 4.3% |
| Hispanic or Latino | 6 | 1.2% |
| Native / Alaskan | 7 | 1.4% |
| White / Caucasian | 461 | 90.2% |
| Two or more Races | 2 | 0.4% |
| Some other Race | 5 | 1.0% |
| Total | 511 | 100.0% |
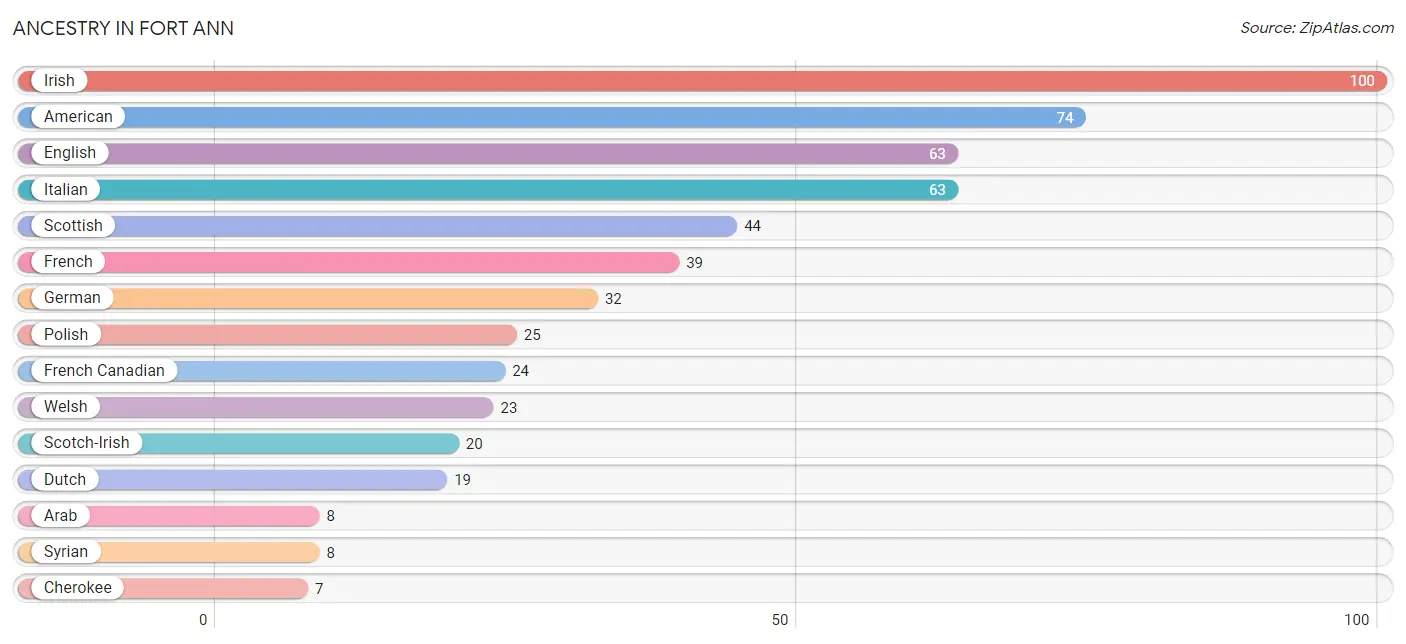
Ancestry in Fort Ann
The most populous ancestries reported in Fort Ann are Irish (100 | 19.6%), American (74 | 14.5%), English (63 | 12.3%), Italian (63 | 12.3%), and Scottish (44 | 8.6%), together accounting for 67.3% of all Fort Ann residents.
| Ancestry | # Population | % Population |
| American | 74 | 14.5% |
| Arab | 8 | 1.6% |
| British | 2 | 0.4% |
| Canadian | 6 | 1.2% |
| Cherokee | 7 | 1.4% |
| Dutch | 19 | 3.7% |
| English | 63 | 12.3% |
| French | 39 | 7.6% |
| French Canadian | 24 | 4.7% |
| German | 32 | 6.3% |
| Irish | 100 | 19.6% |
| Iroquois | 7 | 1.4% |
| Italian | 63 | 12.3% |
| Polish | 25 | 4.9% |
| Puerto Rican | 6 | 1.2% |
| Scotch-Irish | 20 | 3.9% |
| Scottish | 44 | 8.6% |
| Swiss | 2 | 0.4% |
| Syrian | 8 | 1.6% |
| Welsh | 23 | 4.5% | View All 20 Rows |
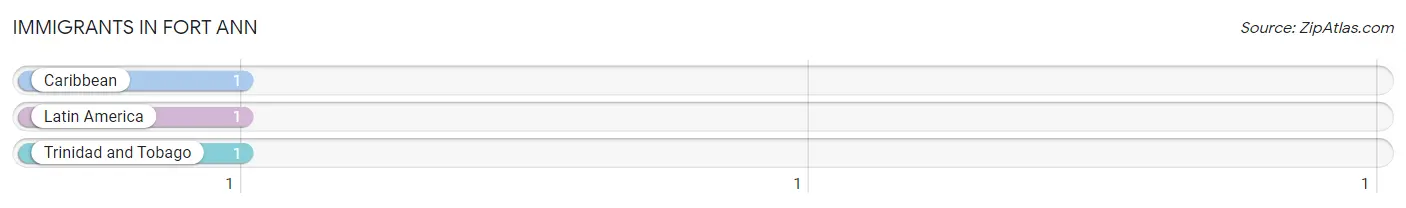
Immigrants in Fort Ann
The most numerous immigrant groups reported in Fort Ann came from Caribbean (1 | 0.2%), Latin America (1 | 0.2%), and Trinidad and Tobago (1 | 0.2%), together accounting for 0.6% of all Fort Ann residents.
| Immigration Origin | # Population | % Population |
| Caribbean | 1 | 0.2% |
| Latin America | 1 | 0.2% |
| Trinidad and Tobago | 1 | 0.2% | View All 3 Rows |
Sex and Age in Fort Ann
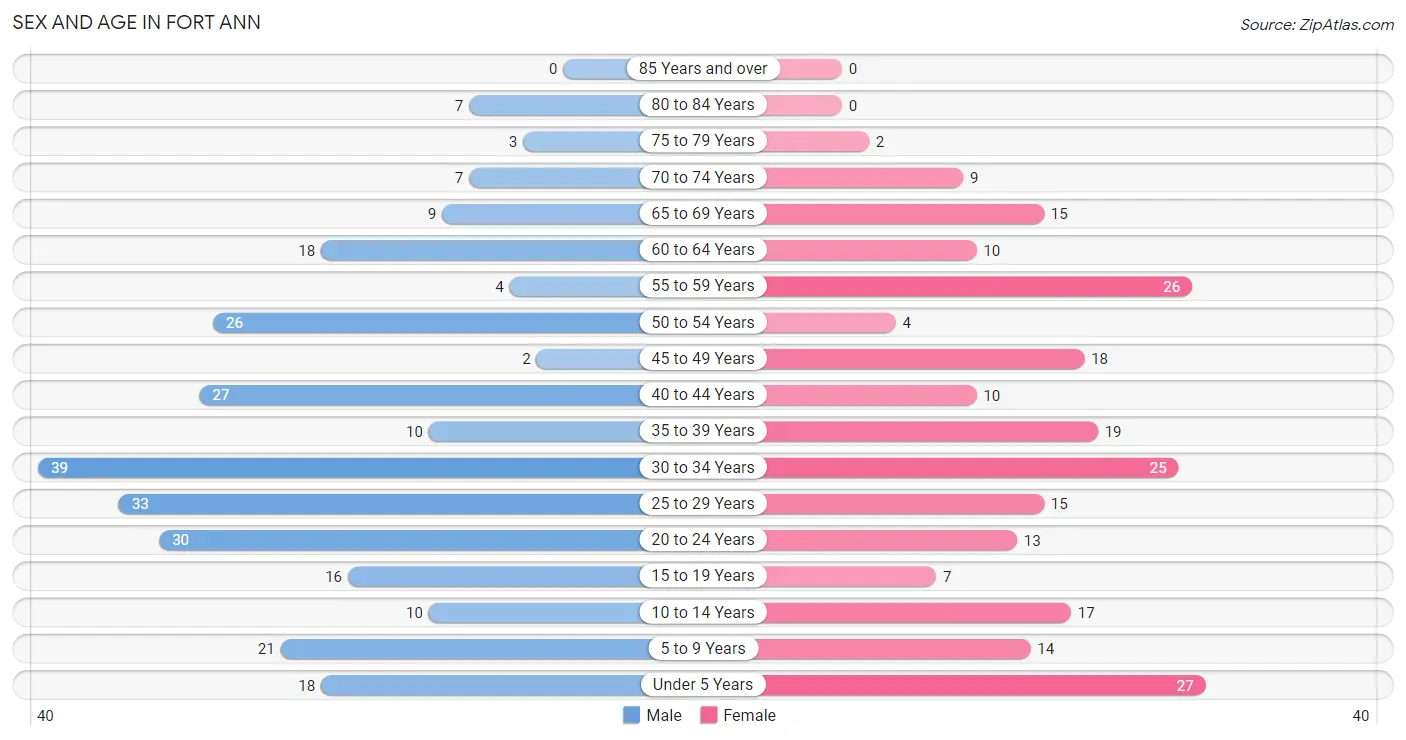
Sex and Age in Fort Ann
The most populous age groups in Fort Ann are 30 to 34 Years (39 | 13.9%) for men and Under 5 Years (27 | 11.7%) for women.
| Age Bracket | Male | Female |
| Under 5 Years | 18 (6.4%) | 27 (11.7%) |
| 5 to 9 Years | 21 (7.5%) | 14 (6.1%) |
| 10 to 14 Years | 10 (3.6%) | 17 (7.4%) |
| 15 to 19 Years | 16 (5.7%) | 7 (3.0%) |
| 20 to 24 Years | 30 (10.7%) | 13 (5.6%) |
| 25 to 29 Years | 33 (11.8%) | 15 (6.5%) |
| 30 to 34 Years | 39 (13.9%) | 25 (10.8%) |
| 35 to 39 Years | 10 (3.6%) | 19 (8.2%) |
| 40 to 44 Years | 27 (9.6%) | 10 (4.3%) |
| 45 to 49 Years | 2 (0.7%) | 18 (7.8%) |
| 50 to 54 Years | 26 (9.3%) | 4 (1.7%) |
| 55 to 59 Years | 4 (1.4%) | 26 (11.3%) |
| 60 to 64 Years | 18 (6.4%) | 10 (4.3%) |
| 65 to 69 Years | 9 (3.2%) | 15 (6.5%) |
| 70 to 74 Years | 7 (2.5%) | 9 (3.9%) |
| 75 to 79 Years | 3 (1.1%) | 2 (0.9%) |
| 80 to 84 Years | 7 (2.5%) | 0 (0.0%) |
| 85 Years and over | 0 (0.0%) | 0 (0.0%) |
| Total | 280 (100.0%) | 231 (100.0%) |
Families and Households in Fort Ann
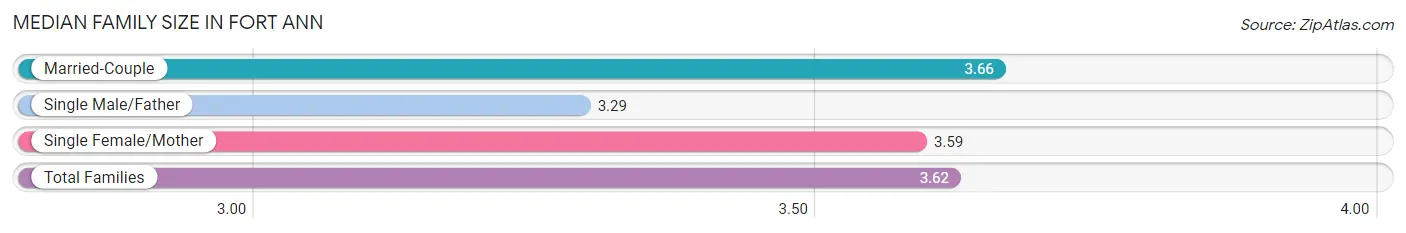
Median Family Size in Fort Ann
The median family size in Fort Ann is 3.62 persons per family, with married-couple families (82 | 73.9%) accounting for the largest median family size of 3.66 persons per family. On the other hand, single male/father families (7 | 6.3%) represent the smallest median family size with 3.29 persons per family.
| Family Type | # Families | Family Size |
| Married-Couple | 82 (73.9%) | 3.66 |
| Single Male/Father | 7 (6.3%) | 3.29 |
| Single Female/Mother | 22 (19.8%) | 3.59 |
| Total Families | 111 (100.0%) | 3.62 |
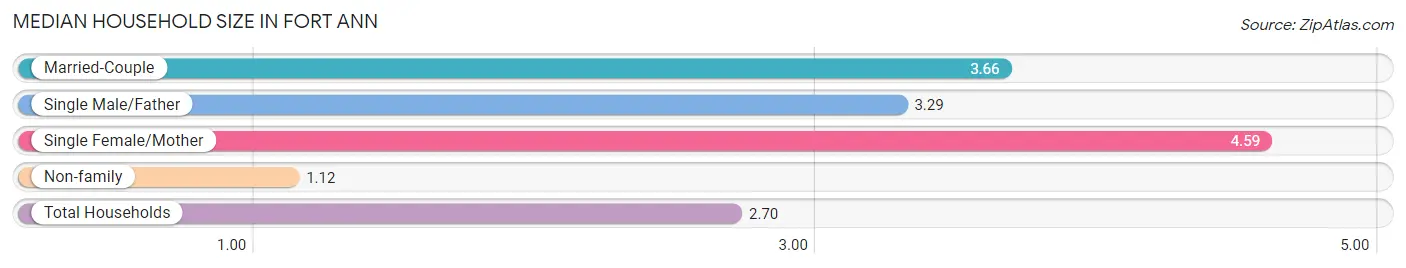
Median Household Size in Fort Ann
The median household size in Fort Ann is 2.70 persons per household, with single female/mother households (22 | 11.6%) accounting for the largest median household size of 4.59 persons per household. non-family households (78 | 41.3%) represent the smallest median household size with 1.12 persons per household.
| Household Type | # Households | Household Size |
| Married-Couple | 82 (43.4%) | 3.66 |
| Single Male/Father | 7 (3.7%) | 3.29 |
| Single Female/Mother | 22 (11.6%) | 4.59 |
| Non-family | 78 (41.3%) | 1.12 |
| Total Households | 189 (100.0%) | 2.70 |
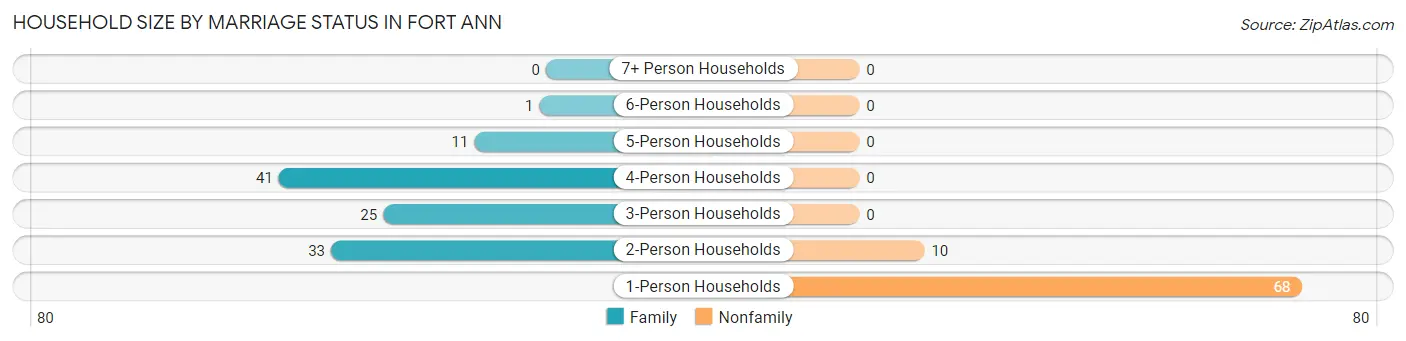
Household Size by Marriage Status in Fort Ann
Out of a total of 189 households in Fort Ann, 111 (58.7%) are family households, while 78 (41.3%) are nonfamily households. The most numerous type of family households are 4-person households, comprising 41, and the most common type of nonfamily households are 1-person households, comprising 68.
| Household Size | Family Households | Nonfamily Households |
| 1-Person Households | - | 68 (36.0%) |
| 2-Person Households | 33 (17.5%) | 10 (5.3%) |
| 3-Person Households | 25 (13.2%) | 0 (0.0%) |
| 4-Person Households | 41 (21.7%) | 0 (0.0%) |
| 5-Person Households | 11 (5.8%) | 0 (0.0%) |
| 6-Person Households | 1 (0.5%) | 0 (0.0%) |
| 7+ Person Households | 0 (0.0%) | 0 (0.0%) |
| Total | 111 (58.7%) | 78 (41.3%) |
Female Fertility in Fort Ann
Fertility by Age in Fort Ann
Average fertility rate in Fort Ann is 110.0 births per 1,000 women. Women in the age bracket of 20 to 34 years have the highest fertility rate with 226.0 births per 1,000 women. Women in the age bracket of 20 to 34 years acount for 100.0% of all women with births.
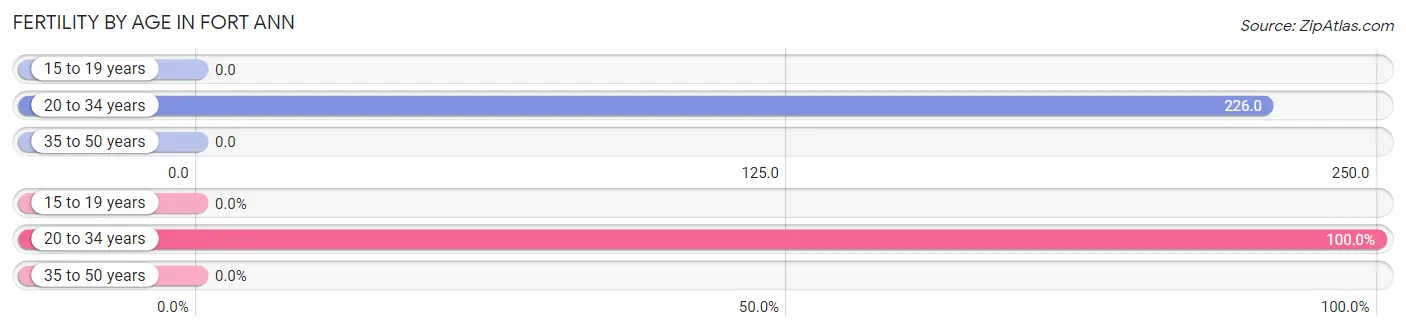
| Age Bracket | Women with Births | Births / 1,000 Women |
| 15 to 19 years | 0 (0.0%) | 0.0 |
| 20 to 34 years | 12 (100.0%) | 226.0 |
| 35 to 50 years | 0 (0.0%) | 0.0 |
| Total | 12 (100.0%) | 110.0 |
Fertility by Age by Marriage Status in Fort Ann
33.3% of women with births (12) in Fort Ann are married. The highest percentage of unmarried women with births falls into 20 to 34 years age bracket with 66.7% of them unmarried at the time of birth, while the lowest percentage of unmarried women with births belong to 20 to 34 years age bracket with 66.7% of them unmarried.
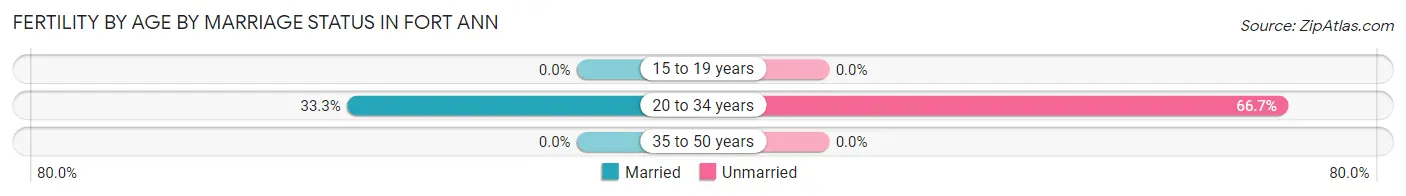
| Age Bracket | Married | Unmarried |
| 15 to 19 years | 0 (0.0%) | 0 (0.0%) |
| 20 to 34 years | 4 (33.3%) | 8 (66.7%) |
| 35 to 50 years | 0 (0.0%) | 0 (0.0%) |
| Total | 4 (33.3%) | 8 (66.7%) |
Fertility by Education in Fort Ann
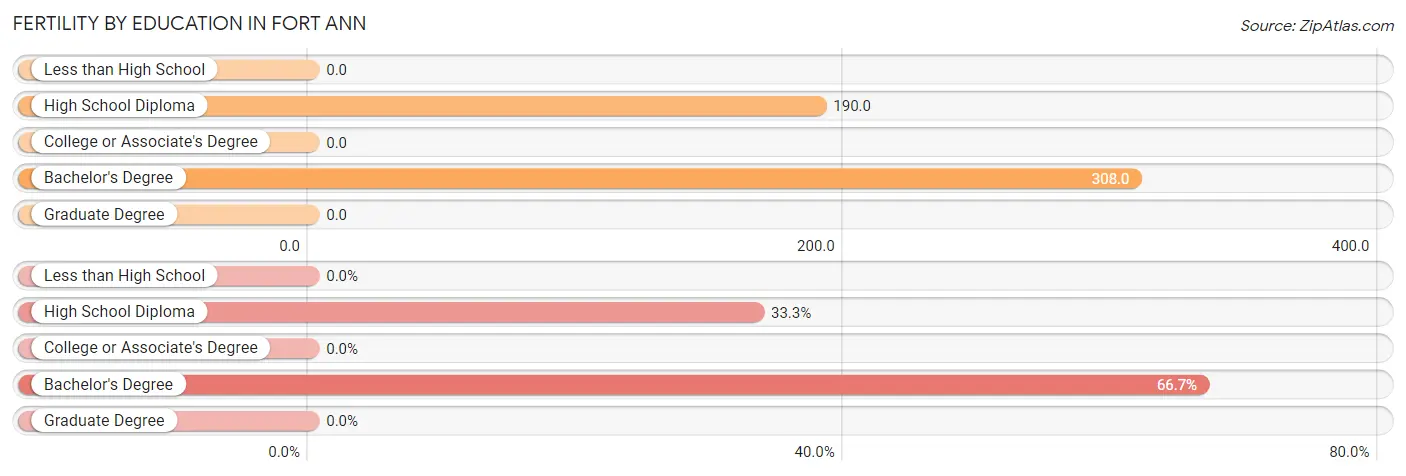
| Educational Attainment | Women with Births | Births / 1,000 Women |
| Less than High School | 0 (0.0%) | 0.0 |
| High School Diploma | 4 (33.3%) | 190.0 |
| College or Associate's Degree | 0 (0.0%) | 0.0 |
| Bachelor's Degree | 8 (66.7%) | 308.0 |
| Graduate Degree | 0 (0.0%) | 0.0 |
| Total | 12 (100.0%) | 110.0 |
Fertility by Education by Marriage Status in Fort Ann
66.7% of women with births in Fort Ann are unmarried. Women with the educational attainment of high school diploma are most likely to be married with 100.0% of them married at childbirth, while women with the educational attainment of bachelor's degree are least likely to be married with 100.0% of them unmarried at childbirth.
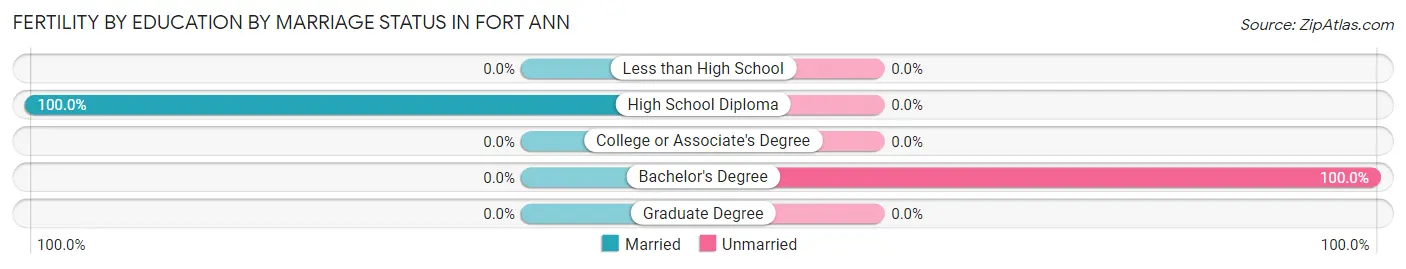
| Educational Attainment | Married | Unmarried |
| Less than High School | 0 (0.0%) | 0 (0.0%) |
| High School Diploma | 4 (100.0%) | 0 (0.0%) |
| College or Associate's Degree | 0 (0.0%) | 0 (0.0%) |
| Bachelor's Degree | 0 (0.0%) | 8 (100.0%) |
| Graduate Degree | 0 (0.0%) | 0 (0.0%) |
| Total | 4 (33.3%) | 8 (66.7%) |
Income in Fort Ann
Income Overview in Fort Ann
Per Capita Income in Fort Ann is $33,360, while median incomes of families and households are $100,729 and $92,321 respectively.
| Characteristic | Number | Measure |
| Per Capita Income | 511 | $33,360 |
| Median Family Income | 111 | $100,729 |
| Mean Family Income | 111 | $95,986 |
| Median Household Income | 189 | $92,321 |
| Mean Household Income | 189 | $85,016 |
| Income Deficit | 111 | $0 |
| Wage / Income Gap (%) | 511 | 13.69% |
| Wage / Income Gap ($) | 511 | 86.31¢ per $1 |
| Gini / Inequality Index | 511 | 0.31 |
Earnings by Sex in Fort Ann
Average Earnings in Fort Ann are $41,667, $38,958 for men and $45,139 for women, a difference of 13.7%.
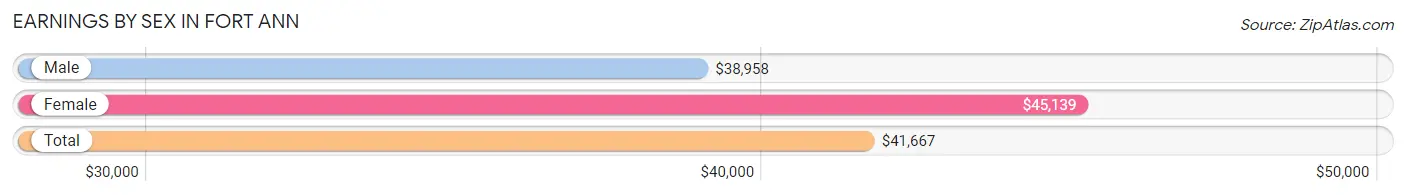
| Sex | Number | Average Earnings |
| Male | 179 (56.3%) | $38,958 |
| Female | 139 (43.7%) | $45,139 |
| Total | 318 (100.0%) | $41,667 |
Earnings by Sex by Income Bracket in Fort Ann
The most common earnings brackets in Fort Ann are $15,000 to $17,499 for men (34 | 19.0%) and $55,000 to $64,999 for women (35 | 25.2%).
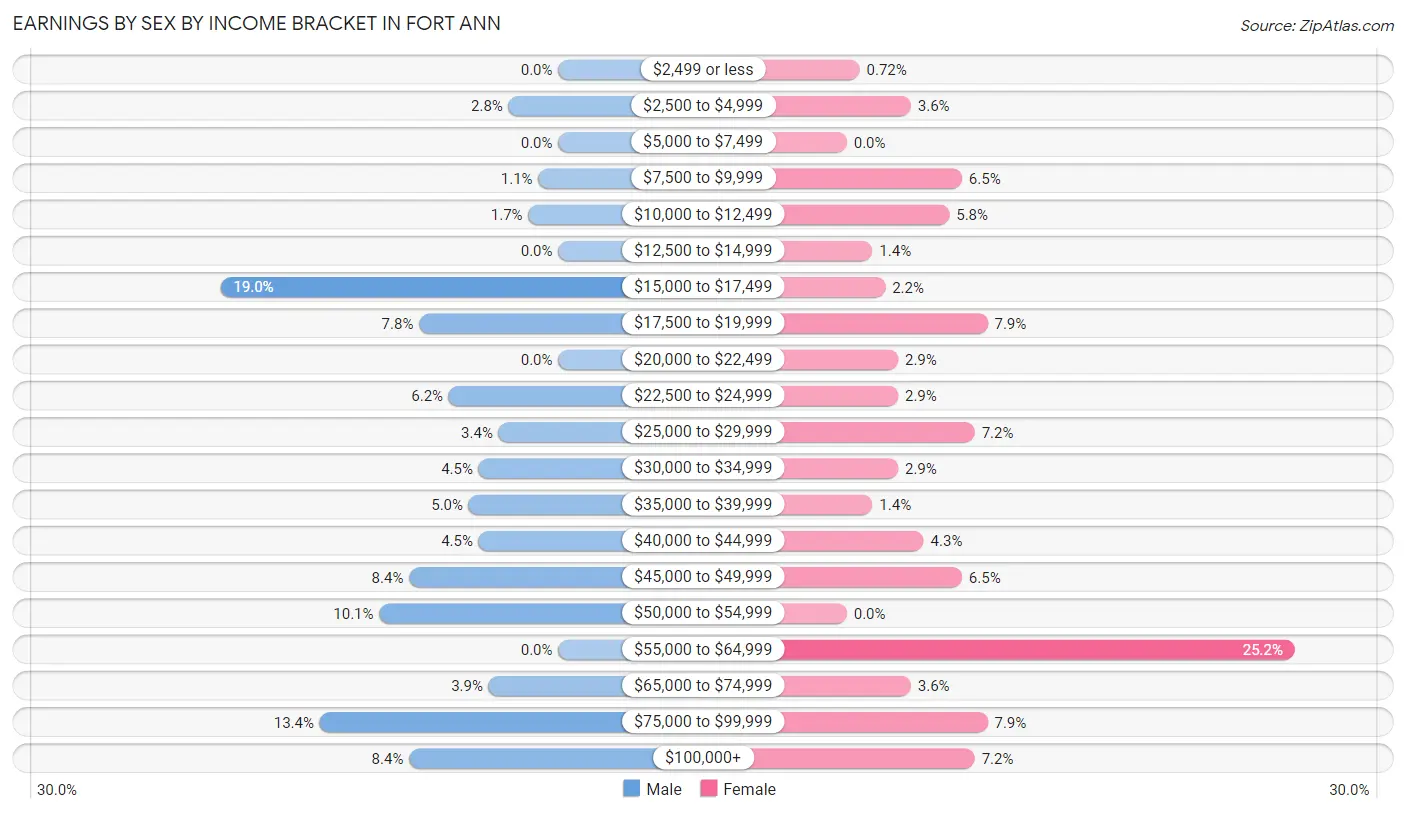
| Income | Male | Female |
| $2,499 or less | 0 (0.0%) | 1 (0.7%) |
| $2,500 to $4,999 | 5 (2.8%) | 5 (3.6%) |
| $5,000 to $7,499 | 0 (0.0%) | 0 (0.0%) |
| $7,500 to $9,999 | 2 (1.1%) | 9 (6.5%) |
| $10,000 to $12,499 | 3 (1.7%) | 8 (5.8%) |
| $12,500 to $14,999 | 0 (0.0%) | 2 (1.4%) |
| $15,000 to $17,499 | 34 (19.0%) | 3 (2.2%) |
| $17,500 to $19,999 | 14 (7.8%) | 11 (7.9%) |
| $20,000 to $22,499 | 0 (0.0%) | 4 (2.9%) |
| $22,500 to $24,999 | 11 (6.1%) | 4 (2.9%) |
| $25,000 to $29,999 | 6 (3.4%) | 10 (7.2%) |
| $30,000 to $34,999 | 8 (4.5%) | 4 (2.9%) |
| $35,000 to $39,999 | 9 (5.0%) | 2 (1.4%) |
| $40,000 to $44,999 | 8 (4.5%) | 6 (4.3%) |
| $45,000 to $49,999 | 15 (8.4%) | 9 (6.5%) |
| $50,000 to $54,999 | 18 (10.1%) | 0 (0.0%) |
| $55,000 to $64,999 | 0 (0.0%) | 35 (25.2%) |
| $65,000 to $74,999 | 7 (3.9%) | 5 (3.6%) |
| $75,000 to $99,999 | 24 (13.4%) | 11 (7.9%) |
| $100,000+ | 15 (8.4%) | 10 (7.2%) |
| Total | 179 (100.0%) | 139 (100.0%) |
Earnings by Sex by Educational Attainment in Fort Ann
Average earnings in Fort Ann are $46,607 for men and $46,806 for women, a difference of 0.4%. Men with an educational attainment of college or associate's degree enjoy the highest average annual earnings of $88,523, while those with high school diploma education earn the least with $42,500. Women with an educational attainment of bachelor's degree earn the most with the average annual earnings of $57,031, while those with college or associate's degree education have the smallest earnings of $23,125.
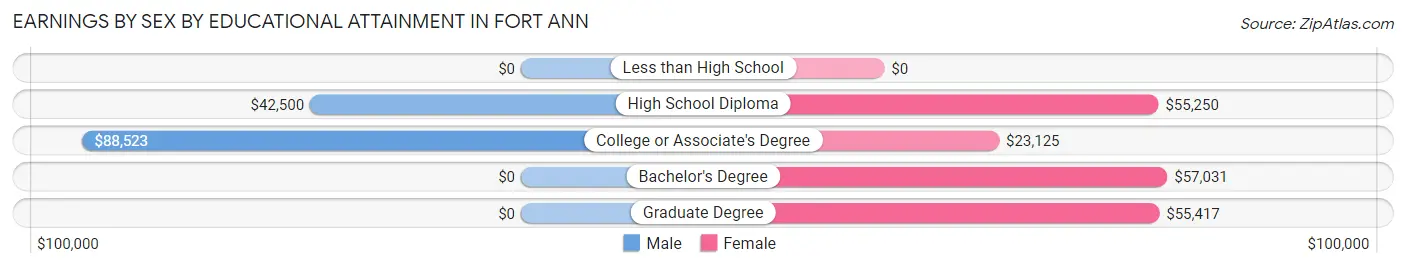
| Educational Attainment | Male Income | Female Income |
| Less than High School | - | - |
| High School Diploma | $42,500 | $55,250 |
| College or Associate's Degree | $88,523 | $23,125 |
| Bachelor's Degree | - | - |
| Graduate Degree | - | - |
| Total | $46,607 | $46,806 |
Family Income in Fort Ann
Family Income Brackets in Fort Ann
According to the Fort Ann family income data, there are 46 families falling into the $100,000 to $149,999 income range, which is the most common income bracket and makes up 41.4% of all families.
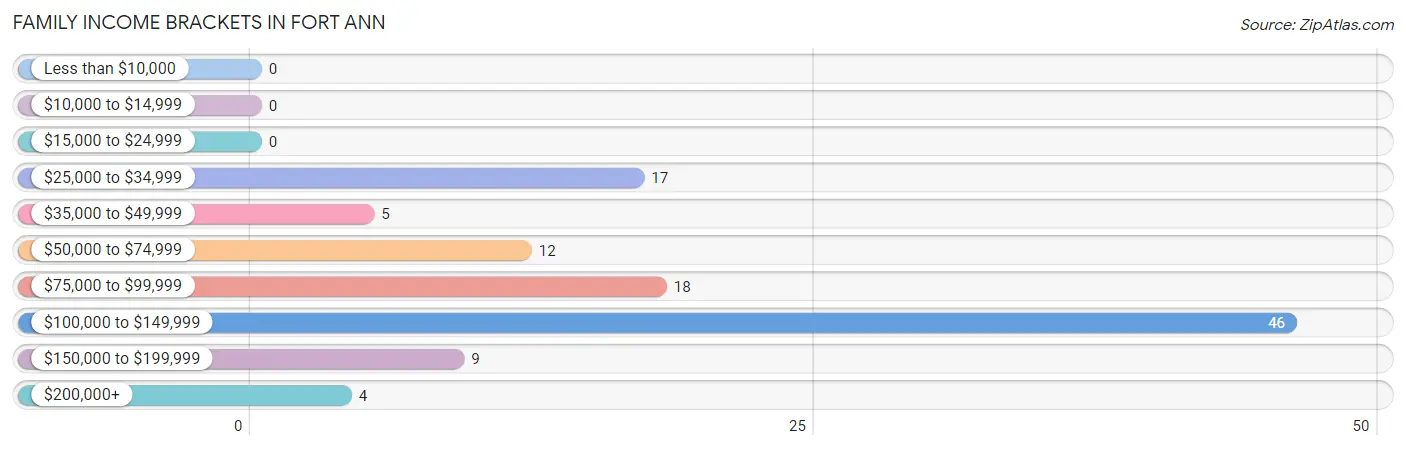
| Income Bracket | # Families | % Families |
| Less than $10,000 | 0 | 0.0% |
| $10,000 to $14,999 | 0 | 0.0% |
| $15,000 to $24,999 | 0 | 0.0% |
| $25,000 to $34,999 | 17 | 15.3% |
| $35,000 to $49,999 | 5 | 4.5% |
| $50,000 to $74,999 | 12 | 10.8% |
| $75,000 to $99,999 | 18 | 16.2% |
| $100,000 to $149,999 | 46 | 41.4% |
| $150,000 to $199,999 | 9 | 8.1% |
| $200,000+ | 4 | 3.6% |
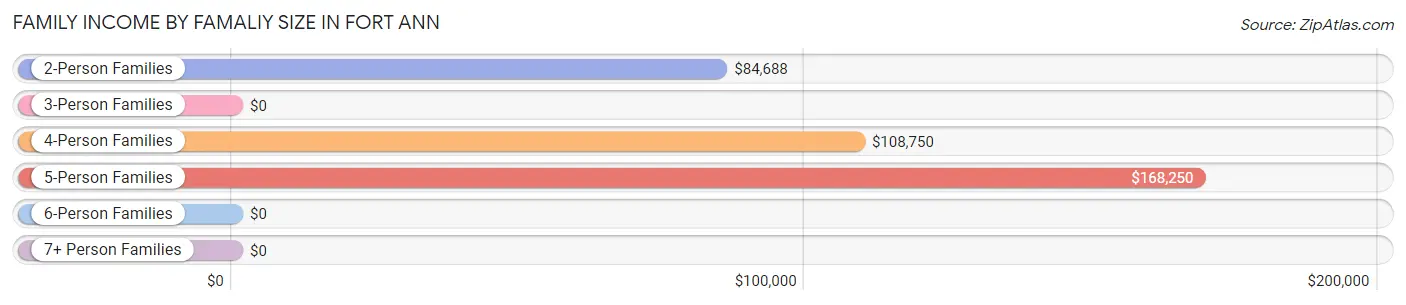
Family Income by Famaliy Size in Fort Ann
5-person families (11 | 9.9%) account for the highest median family income in Fort Ann with $168,250 per family, while 2-person families (41 | 36.9%) have the highest median income of $42,344 per family member.
| Income Bracket | # Families | Median Income |
| 2-Person Families | 41 (36.9%) | $84,688 |
| 3-Person Families | 23 (20.7%) | $0 |
| 4-Person Families | 35 (31.5%) | $108,750 |
| 5-Person Families | 11 (9.9%) | $168,250 |
| 6-Person Families | 1 (0.9%) | $0 |
| 7+ Person Families | 0 (0.0%) | $0 |
| Total | 111 (100.0%) | $100,729 |
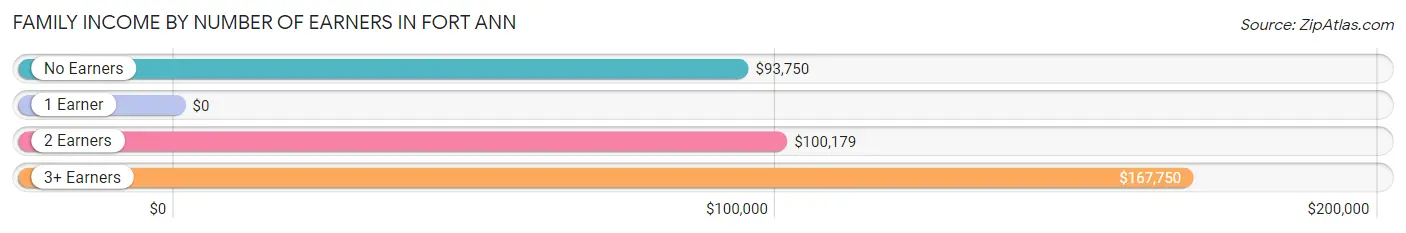
Family Income by Number of Earners in Fort Ann
| Number of Earners | # Families | Median Income |
| No Earners | 10 (9.0%) | $93,750 |
| 1 Earner | 27 (24.3%) | $0 |
| 2 Earners | 61 (54.9%) | $100,179 |
| 3+ Earners | 13 (11.7%) | $167,750 |
| Total | 111 (100.0%) | $100,729 |
Household Income in Fort Ann
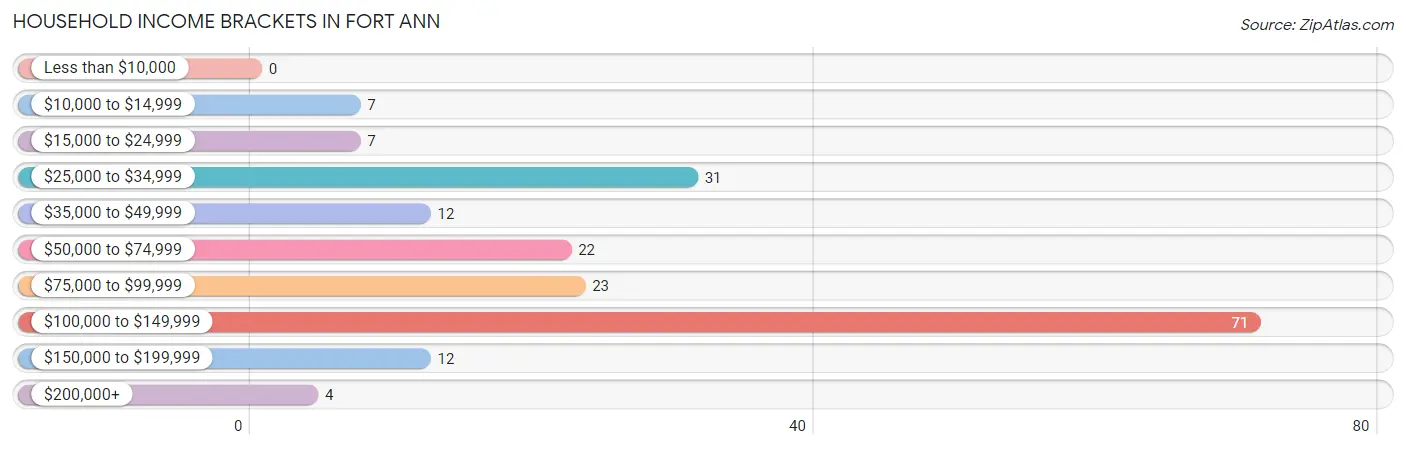
Household Income Brackets in Fort Ann
With 71 households falling in the category, the $100,000 to $149,999 income range is the most frequent in Fort Ann, accounting for 37.6% of all households.
| Income Bracket | # Households | % Households |
| Less than $10,000 | 0 | 0.0% |
| $10,000 to $14,999 | 7 | 3.7% |
| $15,000 to $24,999 | 7 | 3.7% |
| $25,000 to $34,999 | 31 | 16.4% |
| $35,000 to $49,999 | 12 | 6.3% |
| $50,000 to $74,999 | 22 | 11.6% |
| $75,000 to $99,999 | 23 | 12.2% |
| $100,000 to $149,999 | 71 | 37.6% |
| $150,000 to $199,999 | 12 | 6.3% |
| $200,000+ | 4 | 2.1% |
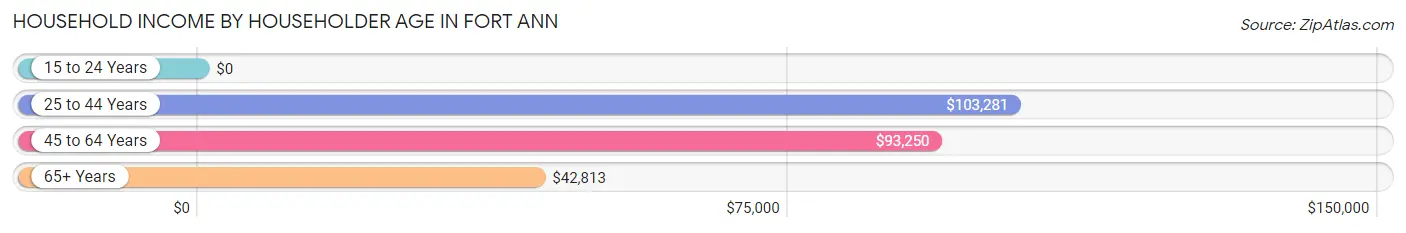
Household Income by Householder Age in Fort Ann
The median household income in Fort Ann is $92,321, with the highest median household income of $103,281 found in the 25 to 44 years age bracket for the primary householder. A total of 85 households (45.0%) fall into this category.
| Income Bracket | # Households | Median Income |
| 15 to 24 Years | 0 (0.0%) | $0 |
| 25 to 44 Years | 85 (45.0%) | $103,281 |
| 45 to 64 Years | 65 (34.4%) | $93,250 |
| 65+ Years | 39 (20.6%) | $42,813 |
| Total | 189 (100.0%) | $92,321 |
Poverty in Fort Ann
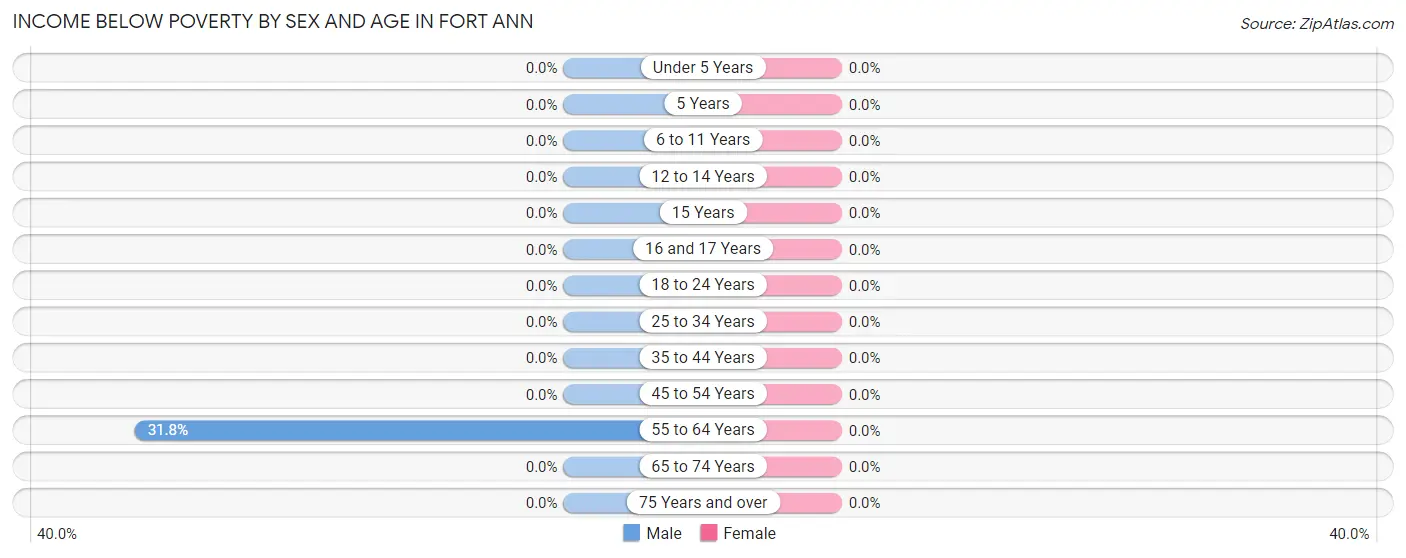
Income Below Poverty by Sex and Age in Fort Ann
| Age Bracket | Male | Female |
| Under 5 Years | 0 (0.0%) | 0 (0.0%) |
| 5 Years | 0 (0.0%) | 0 (0.0%) |
| 6 to 11 Years | 0 (0.0%) | 0 (0.0%) |
| 12 to 14 Years | 0 (0.0%) | 0 (0.0%) |
| 15 Years | 0 (0.0%) | 0 (0.0%) |
| 16 and 17 Years | 0 (0.0%) | 0 (0.0%) |
| 18 to 24 Years | 0 (0.0%) | 0 (0.0%) |
| 25 to 34 Years | 0 (0.0%) | 0 (0.0%) |
| 35 to 44 Years | 0 (0.0%) | 0 (0.0%) |
| 45 to 54 Years | 0 (0.0%) | 0 (0.0%) |
| 55 to 64 Years | 7 (31.8%) | 0 (0.0%) |
| 65 to 74 Years | 0 (0.0%) | 0 (0.0%) |
| 75 Years and over | 0 (0.0%) | 0 (0.0%) |
| Total | 7 (2.5%) | 0 (0.0%) |
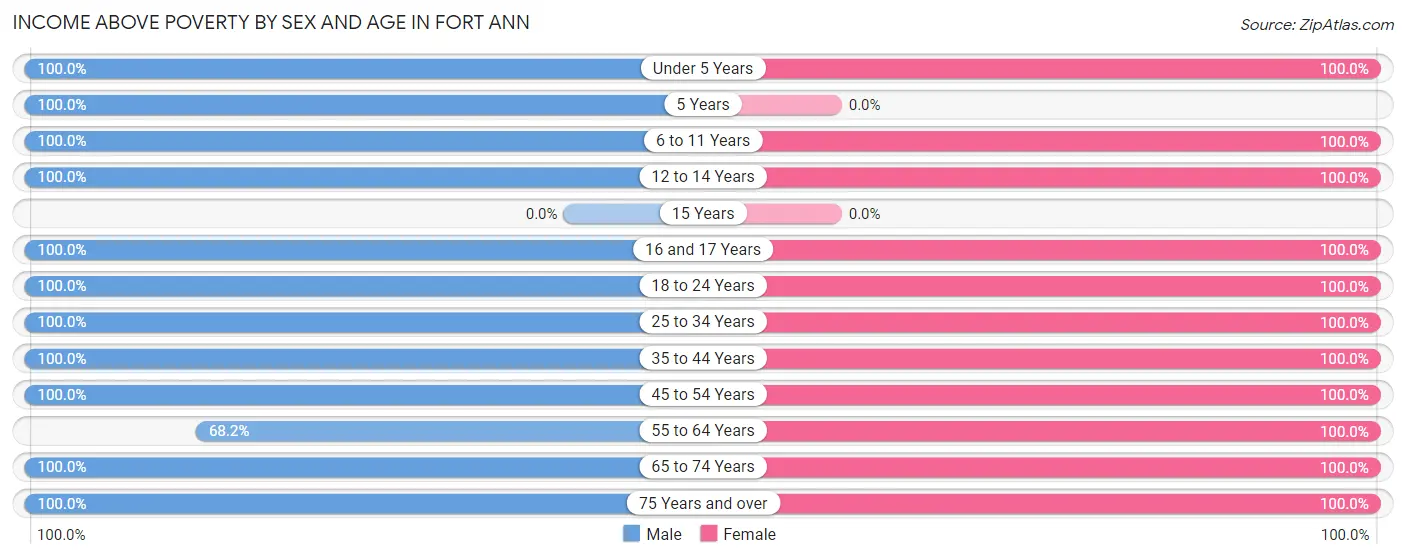
Income Above Poverty by Sex and Age in Fort Ann
According to the poverty statistics in Fort Ann, males aged under 5 years and females aged under 5 years are the age groups that are most secure financially, with 100.0% of males and 100.0% of females in these age groups living above the poverty line.
| Age Bracket | Male | Female |
| Under 5 Years | 18 (100.0%) | 27 (100.0%) |
| 5 Years | 19 (100.0%) | 0 (0.0%) |
| 6 to 11 Years | 8 (100.0%) | 23 (100.0%) |
| 12 to 14 Years | 4 (100.0%) | 8 (100.0%) |
| 15 Years | 0 (0.0%) | 0 (0.0%) |
| 16 and 17 Years | 14 (100.0%) | 7 (100.0%) |
| 18 to 24 Years | 32 (100.0%) | 13 (100.0%) |
| 25 to 34 Years | 72 (100.0%) | 40 (100.0%) |
| 35 to 44 Years | 37 (100.0%) | 29 (100.0%) |
| 45 to 54 Years | 28 (100.0%) | 22 (100.0%) |
| 55 to 64 Years | 15 (68.2%) | 36 (100.0%) |
| 65 to 74 Years | 16 (100.0%) | 24 (100.0%) |
| 75 Years and over | 10 (100.0%) | 2 (100.0%) |
| Total | 273 (97.5%) | 231 (100.0%) |
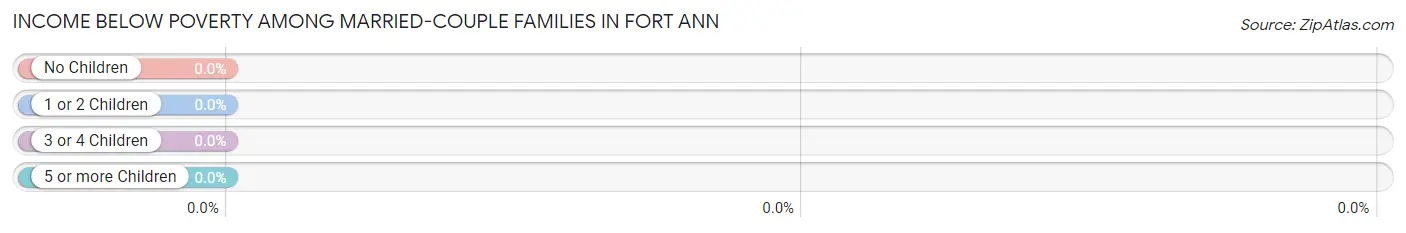
Income Below Poverty Among Married-Couple Families in Fort Ann
| Children | Above Poverty | Below Poverty |
| No Children | 33 (100.0%) | 0 (0.0%) |
| 1 or 2 Children | 48 (100.0%) | 0 (0.0%) |
| 3 or 4 Children | 1 (100.0%) | 0 (0.0%) |
| 5 or more Children | 0 (0.0%) | 0 (0.0%) |
| Total | 82 (100.0%) | 0 (0.0%) |
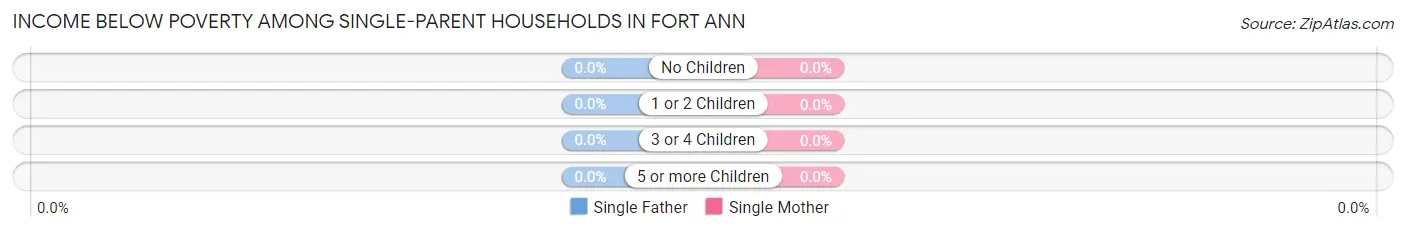
Income Below Poverty Among Single-Parent Households in Fort Ann
| Children | Single Father | Single Mother |
| No Children | 0 (0.0%) | 0 (0.0%) |
| 1 or 2 Children | 0 (0.0%) | 0 (0.0%) |
| 3 or 4 Children | 0 (0.0%) | 0 (0.0%) |
| 5 or more Children | 0 (0.0%) | 0 (0.0%) |
| Total | 0 (0.0%) | 0 (0.0%) |
Income Below Poverty Among Married-Couple vs Single-Parent Households in Fort Ann
| Children | Married-Couple Families | Single-Parent Households |
| No Children | 0 (0.0%) | 0 (0.0%) |
| 1 or 2 Children | 0 (0.0%) | 0 (0.0%) |
| 3 or 4 Children | 0 (0.0%) | 0 (0.0%) |
| 5 or more Children | 0 (0.0%) | 0 (0.0%) |
| Total | 0 (0.0%) | 0 (0.0%) |
Employment Characteristics in Fort Ann
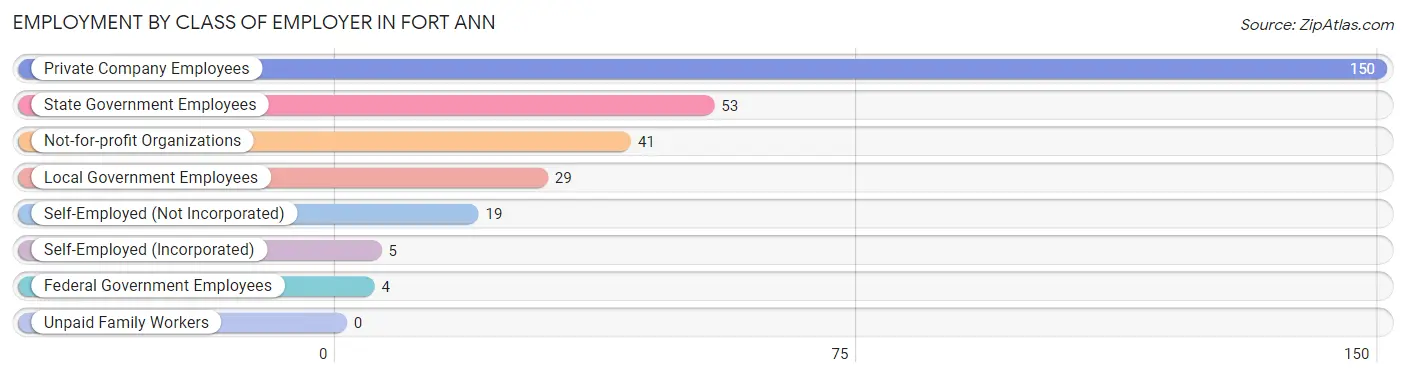
Employment by Class of Employer in Fort Ann
Among the 301 employed individuals in Fort Ann, private company employees (150 | 49.8%), state government employees (53 | 17.6%), and not-for-profit organizations (41 | 13.6%) make up the most common classes of employment.
| Employer Class | # Employees | % Employees |
| Private Company Employees | 150 | 49.8% |
| Self-Employed (Incorporated) | 5 | 1.7% |
| Self-Employed (Not Incorporated) | 19 | 6.3% |
| Not-for-profit Organizations | 41 | 13.6% |
| Local Government Employees | 29 | 9.6% |
| State Government Employees | 53 | 17.6% |
| Federal Government Employees | 4 | 1.3% |
| Unpaid Family Workers | 0 | 0.0% |
| Total | 301 | 100.0% |
Employment Status by Age in Fort Ann
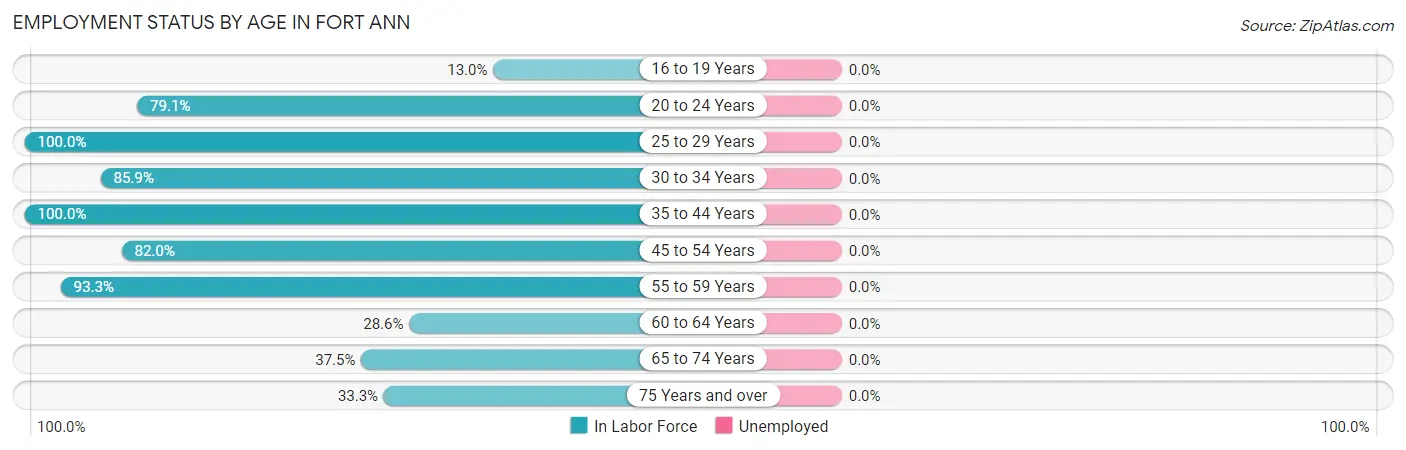
| Age Bracket | In Labor Force | Unemployed |
| 16 to 19 Years | 3 (13.0%) | 0 (0.0%) |
| 20 to 24 Years | 34 (79.1%) | 0 (0.0%) |
| 25 to 29 Years | 48 (100.0%) | 0 (0.0%) |
| 30 to 34 Years | 55 (85.9%) | 0 (0.0%) |
| 35 to 44 Years | 66 (100.0%) | 0 (0.0%) |
| 45 to 54 Years | 41 (82.0%) | 0 (0.0%) |
| 55 to 59 Years | 28 (93.3%) | 0 (0.0%) |
| 60 to 64 Years | 8 (28.6%) | 0 (0.0%) |
| 65 to 74 Years | 15 (37.5%) | 0 (0.0%) |
| 75 Years and over | 4 (33.3%) | 0 (0.0%) |
| Total | 302 (74.8%) | 0 (0.0%) |
Employment Status by Educational Attainment in Fort Ann
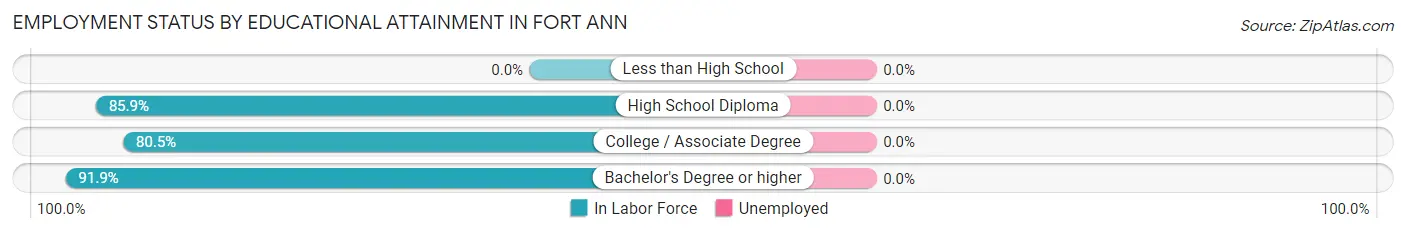
| Educational Attainment | In Labor Force | Unemployed |
| Less than High School | 0 (0.0%) | 0 (0.0%) |
| High School Diploma | 116 (85.9%) | 0 (0.0%) |
| College / Associate Degree | 62 (80.5%) | 0 (0.0%) |
| Bachelor's Degree or higher | 68 (91.9%) | 0 (0.0%) |
| Total | 246 (86.0%) | 0 (0.0%) |
Employment Occupations by Sex in Fort Ann
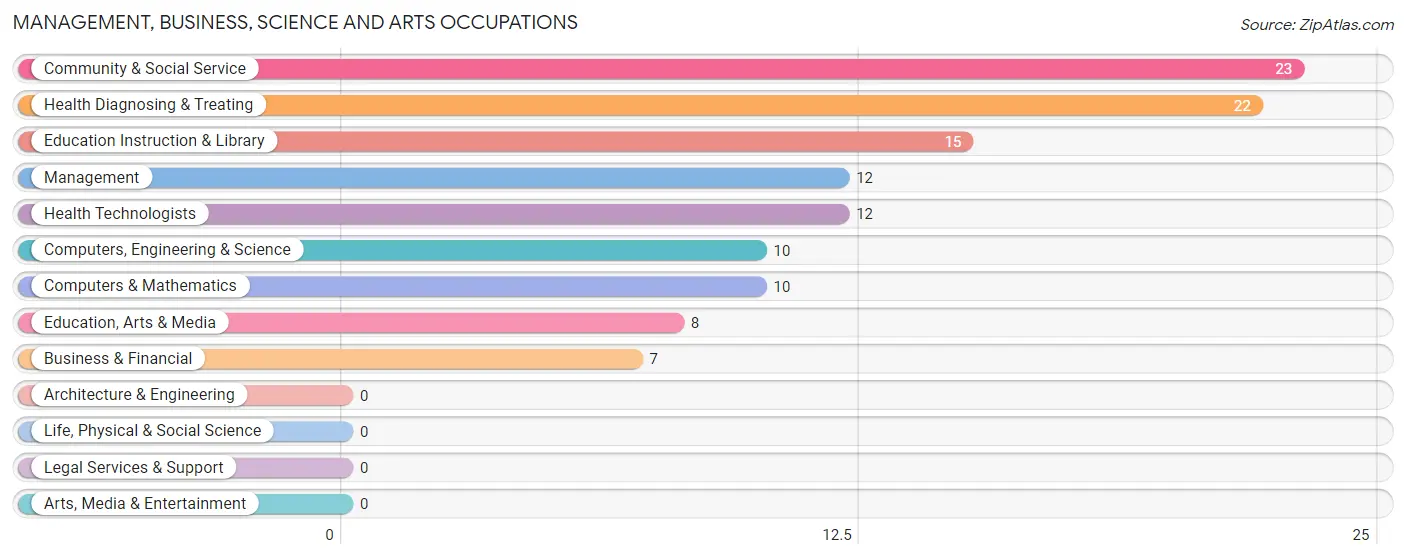
Management, Business, Science and Arts Occupations
The most common Management, Business, Science and Arts occupations in Fort Ann are Community & Social Service (23 | 7.6%), Health Diagnosing & Treating (22 | 7.3%), Education Instruction & Library (15 | 5.0%), Management (12 | 4.0%), and Health Technologists (12 | 4.0%).
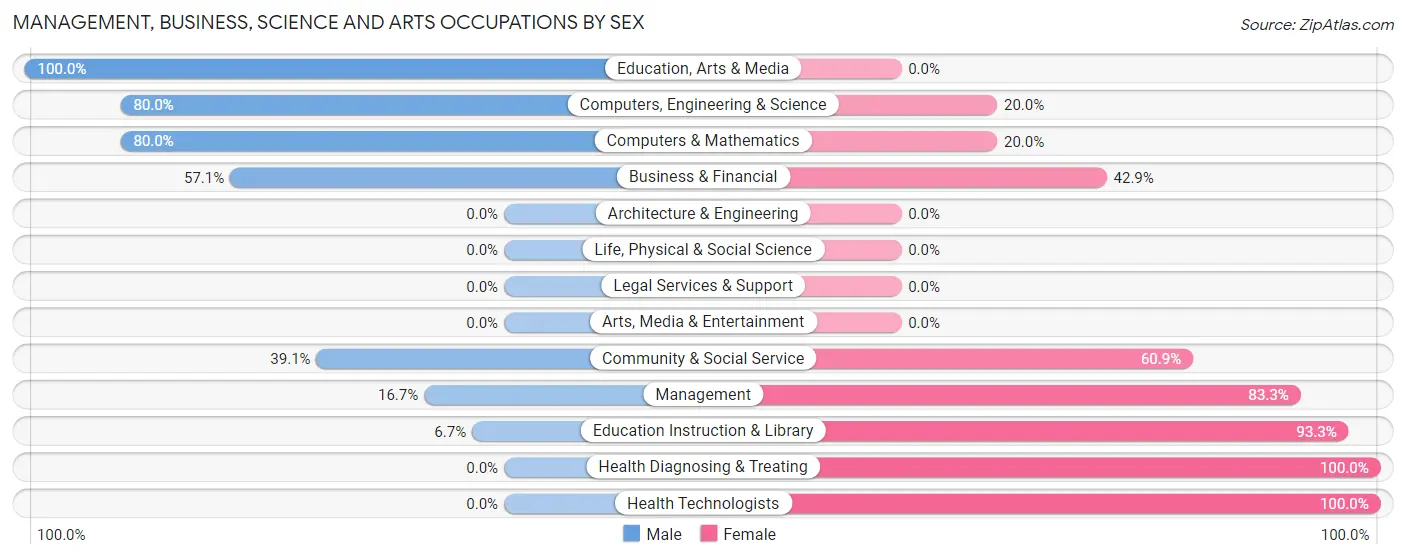
Management, Business, Science and Arts Occupations by Sex
Within the Management, Business, Science and Arts occupations in Fort Ann, the most male-oriented occupations are Education, Arts & Media (100.0%), Computers, Engineering & Science (80.0%), and Computers & Mathematics (80.0%), while the most female-oriented occupations are Health Diagnosing & Treating (100.0%), Health Technologists (100.0%), and Education Instruction & Library (93.3%).
| Occupation | Male | Female |
| Management | 2 (16.7%) | 10 (83.3%) |
| Business & Financial | 4 (57.1%) | 3 (42.9%) |
| Computers, Engineering & Science | 8 (80.0%) | 2 (20.0%) |
| Computers & Mathematics | 8 (80.0%) | 2 (20.0%) |
| Architecture & Engineering | 0 (0.0%) | 0 (0.0%) |
| Life, Physical & Social Science | 0 (0.0%) | 0 (0.0%) |
| Community & Social Service | 9 (39.1%) | 14 (60.9%) |
| Education, Arts & Media | 8 (100.0%) | 0 (0.0%) |
| Legal Services & Support | 0 (0.0%) | 0 (0.0%) |
| Education Instruction & Library | 1 (6.7%) | 14 (93.3%) |
| Arts, Media & Entertainment | 0 (0.0%) | 0 (0.0%) |
| Health Diagnosing & Treating | 0 (0.0%) | 22 (100.0%) |
| Health Technologists | 0 (0.0%) | 12 (100.0%) |
| Total (Category) | 23 (31.1%) | 51 (68.9%) |
| Total (Overall) | 179 (59.3%) | 123 (40.7%) |
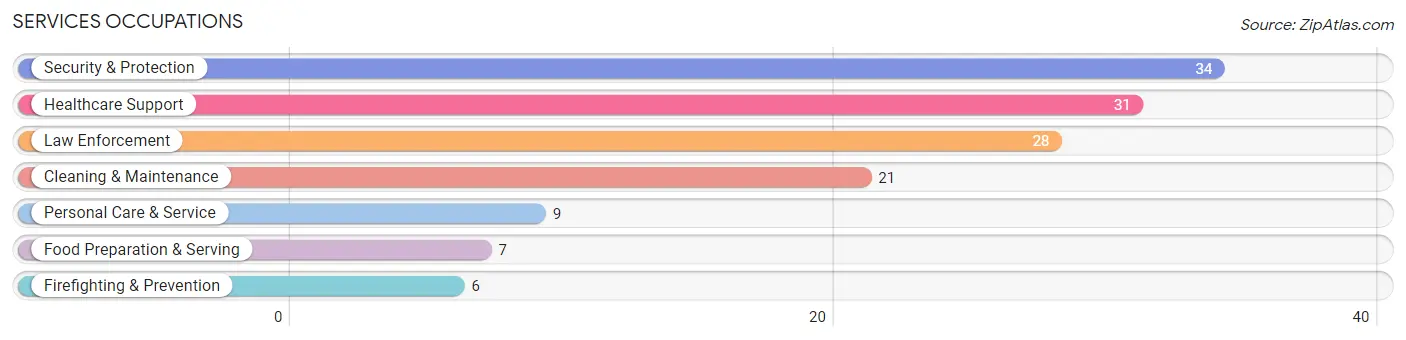
Services Occupations
The most common Services occupations in Fort Ann are Security & Protection (34 | 11.3%), Healthcare Support (31 | 10.3%), Law Enforcement (28 | 9.3%), Cleaning & Maintenance (21 | 7.0%), and Personal Care & Service (9 | 3.0%).
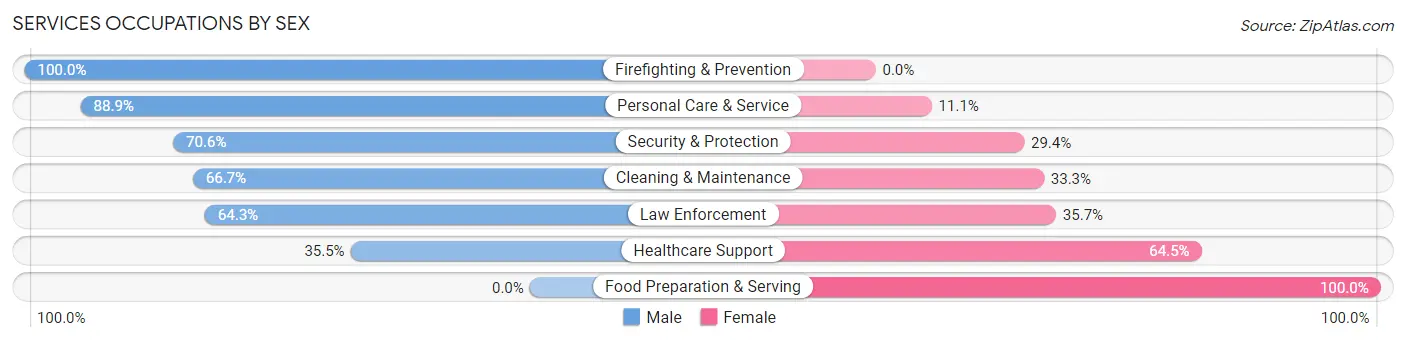
Services Occupations by Sex
Within the Services occupations in Fort Ann, the most male-oriented occupations are Firefighting & Prevention (100.0%), Personal Care & Service (88.9%), and Security & Protection (70.6%), while the most female-oriented occupations are Food Preparation & Serving (100.0%), Healthcare Support (64.5%), and Law Enforcement (35.7%).
| Occupation | Male | Female |
| Healthcare Support | 11 (35.5%) | 20 (64.5%) |
| Security & Protection | 24 (70.6%) | 10 (29.4%) |
| Firefighting & Prevention | 6 (100.0%) | 0 (0.0%) |
| Law Enforcement | 18 (64.3%) | 10 (35.7%) |
| Food Preparation & Serving | 0 (0.0%) | 7 (100.0%) |
| Cleaning & Maintenance | 14 (66.7%) | 7 (33.3%) |
| Personal Care & Service | 8 (88.9%) | 1 (11.1%) |
| Total (Category) | 57 (55.9%) | 45 (44.1%) |
| Total (Overall) | 179 (59.3%) | 123 (40.7%) |
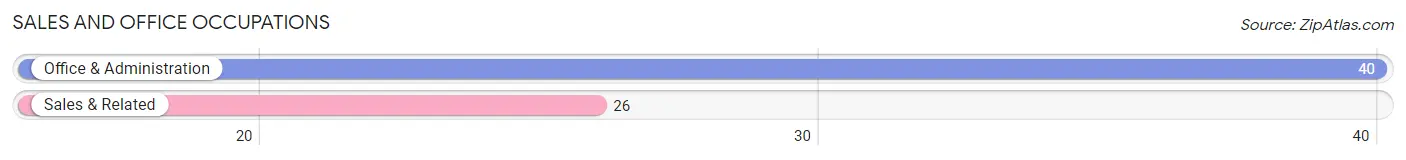
Sales and Office Occupations
The most common Sales and Office occupations in Fort Ann are Office & Administration (40 | 13.3%), and Sales & Related (26 | 8.6%).
Sales and Office Occupations by Sex
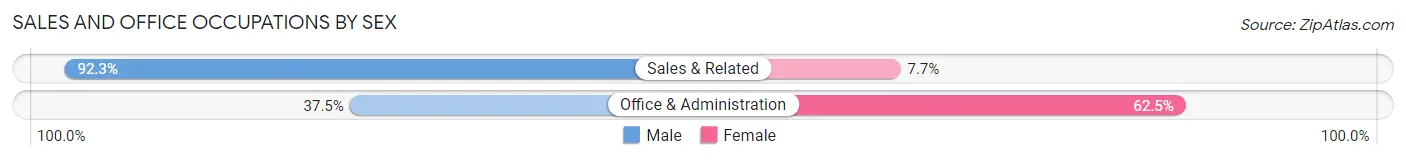
| Occupation | Male | Female |
| Sales & Related | 24 (92.3%) | 2 (7.7%) |
| Office & Administration | 15 (37.5%) | 25 (62.5%) |
| Total (Category) | 39 (59.1%) | 27 (40.9%) |
| Total (Overall) | 179 (59.3%) | 123 (40.7%) |
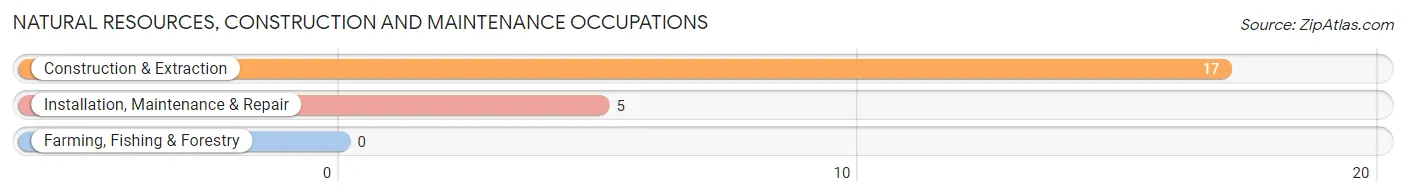
Natural Resources, Construction and Maintenance Occupations
The most common Natural Resources, Construction and Maintenance occupations in Fort Ann are Construction & Extraction (17 | 5.6%), and Installation, Maintenance & Repair (5 | 1.7%).
Natural Resources, Construction and Maintenance Occupations by Sex
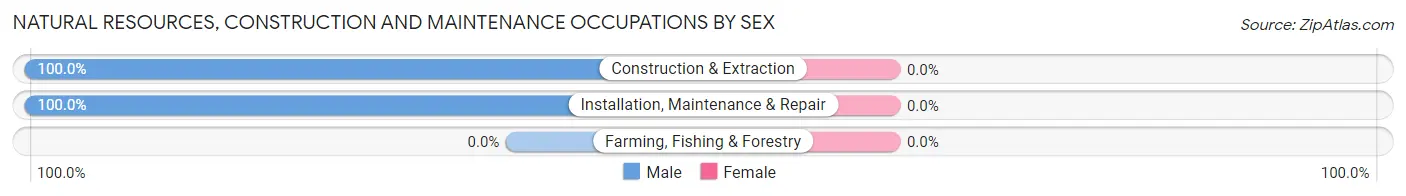
| Occupation | Male | Female |
| Farming, Fishing & Forestry | 0 (0.0%) | 0 (0.0%) |
| Construction & Extraction | 17 (100.0%) | 0 (0.0%) |
| Installation, Maintenance & Repair | 5 (100.0%) | 0 (0.0%) |
| Total (Category) | 22 (100.0%) | 0 (0.0%) |
| Total (Overall) | 179 (59.3%) | 123 (40.7%) |
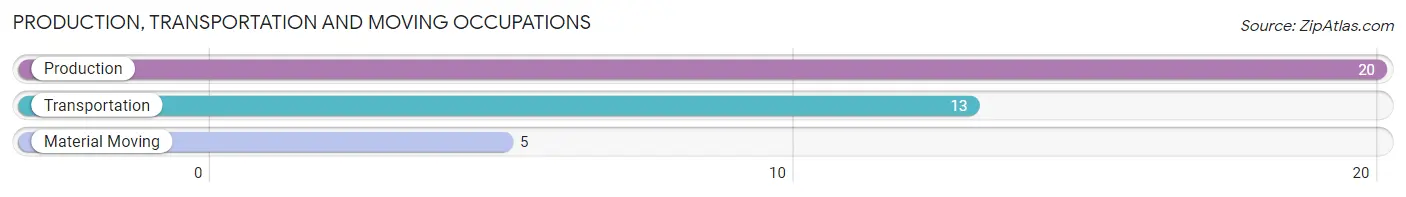
Production, Transportation and Moving Occupations
The most common Production, Transportation and Moving occupations in Fort Ann are Production (20 | 6.6%), Transportation (13 | 4.3%), and Material Moving (5 | 1.7%).
Production, Transportation and Moving Occupations by Sex
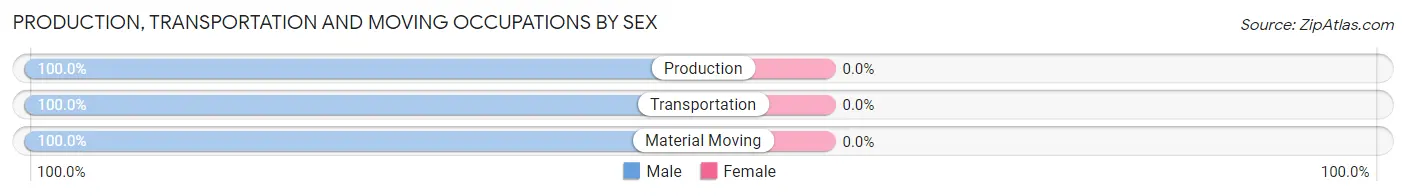
| Occupation | Male | Female |
| Production | 20 (100.0%) | 0 (0.0%) |
| Transportation | 13 (100.0%) | 0 (0.0%) |
| Material Moving | 5 (100.0%) | 0 (0.0%) |
| Total (Category) | 38 (100.0%) | 0 (0.0%) |
| Total (Overall) | 179 (59.3%) | 123 (40.7%) |
Employment Industries by Sex in Fort Ann
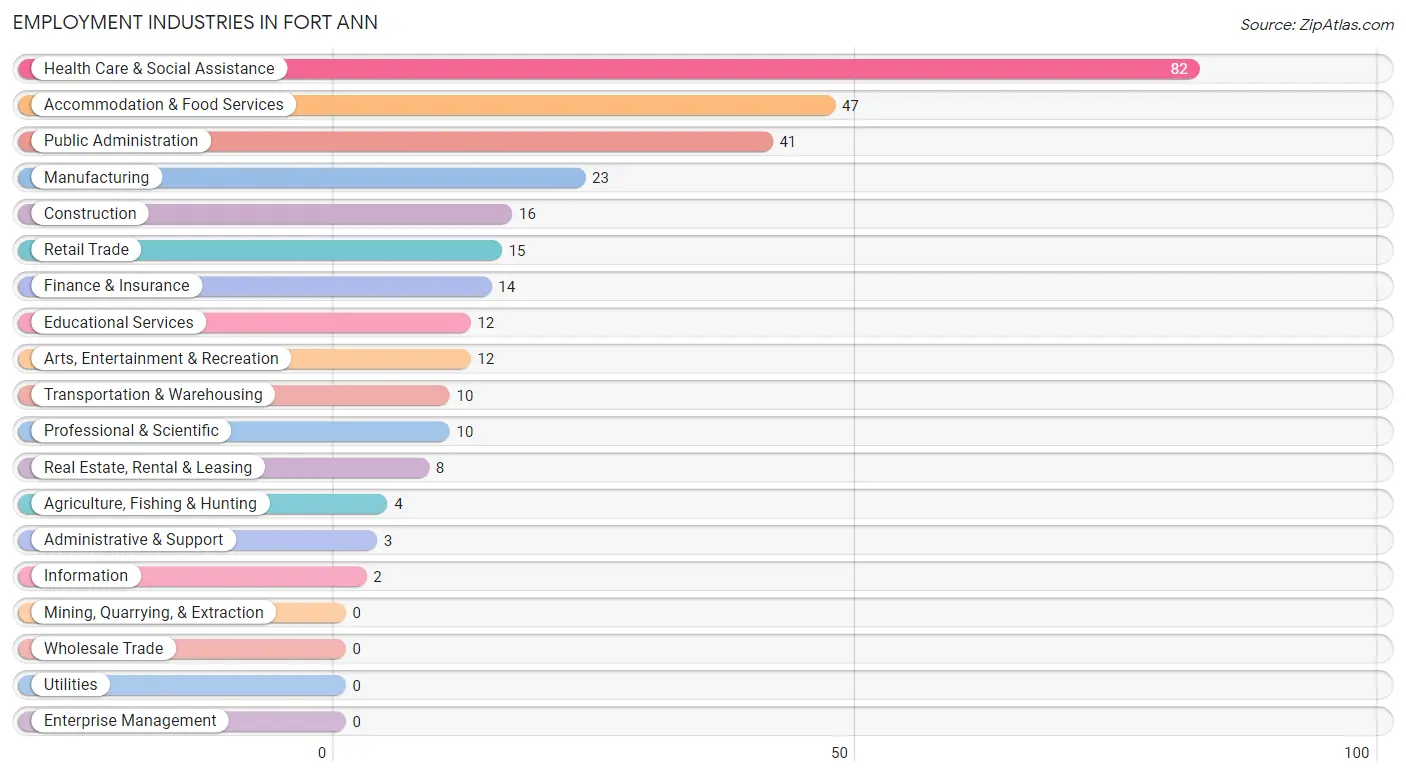
Employment Industries in Fort Ann
The major employment industries in Fort Ann include Health Care & Social Assistance (82 | 27.2%), Accommodation & Food Services (47 | 15.6%), Public Administration (41 | 13.6%), Manufacturing (23 | 7.6%), and Construction (16 | 5.3%).
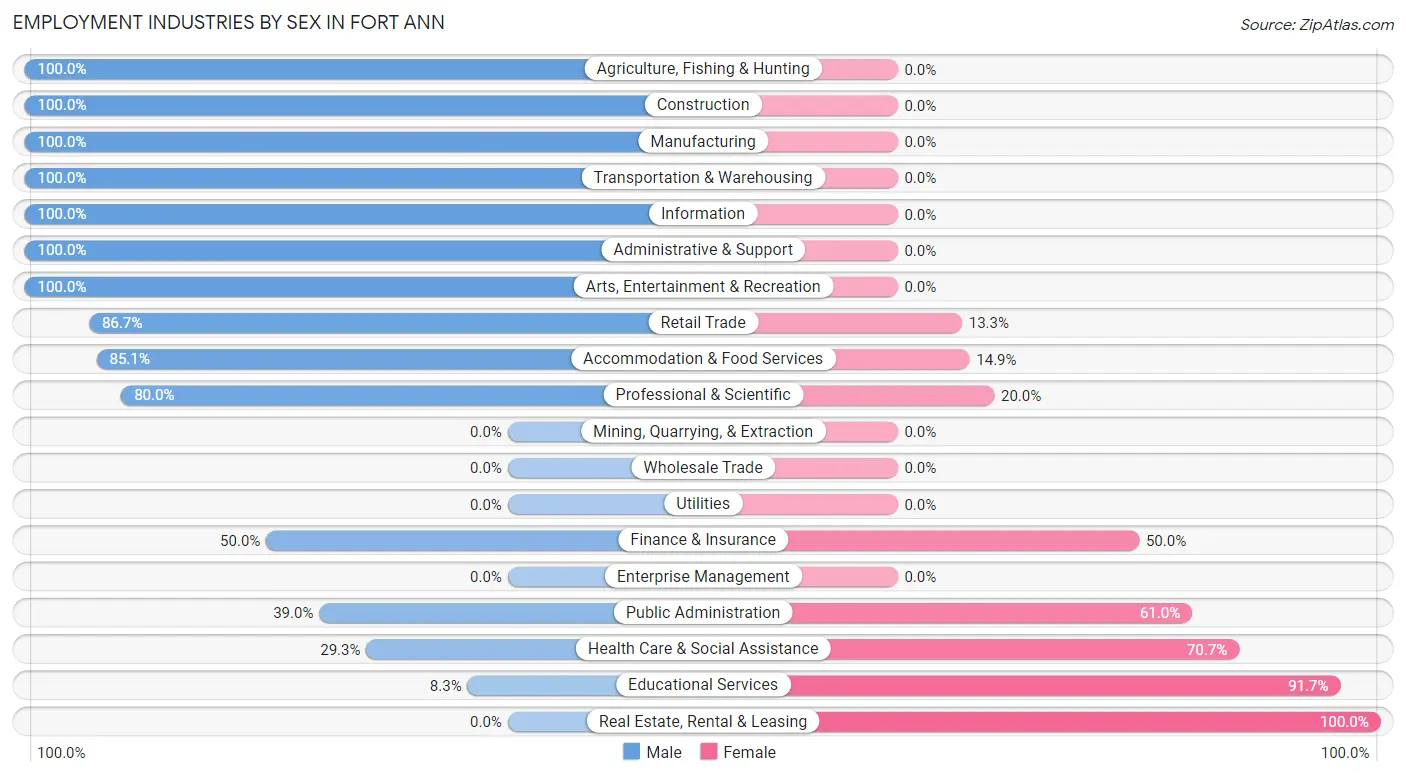
Employment Industries by Sex in Fort Ann
The Fort Ann industries that see more men than women are Agriculture, Fishing & Hunting (100.0%), Construction (100.0%), and Manufacturing (100.0%), whereas the industries that tend to have a higher number of women are Real Estate, Rental & Leasing (100.0%), Educational Services (91.7%), and Health Care & Social Assistance (70.7%).
| Industry | Male | Female |
| Agriculture, Fishing & Hunting | 4 (100.0%) | 0 (0.0%) |
| Mining, Quarrying, & Extraction | 0 (0.0%) | 0 (0.0%) |
| Construction | 16 (100.0%) | 0 (0.0%) |
| Manufacturing | 23 (100.0%) | 0 (0.0%) |
| Wholesale Trade | 0 (0.0%) | 0 (0.0%) |
| Retail Trade | 13 (86.7%) | 2 (13.3%) |
| Transportation & Warehousing | 10 (100.0%) | 0 (0.0%) |
| Utilities | 0 (0.0%) | 0 (0.0%) |
| Information | 2 (100.0%) | 0 (0.0%) |
| Finance & Insurance | 7 (50.0%) | 7 (50.0%) |
| Real Estate, Rental & Leasing | 0 (0.0%) | 8 (100.0%) |
| Professional & Scientific | 8 (80.0%) | 2 (20.0%) |
| Enterprise Management | 0 (0.0%) | 0 (0.0%) |
| Administrative & Support | 3 (100.0%) | 0 (0.0%) |
| Educational Services | 1 (8.3%) | 11 (91.7%) |
| Health Care & Social Assistance | 24 (29.3%) | 58 (70.7%) |
| Arts, Entertainment & Recreation | 12 (100.0%) | 0 (0.0%) |
| Accommodation & Food Services | 40 (85.1%) | 7 (14.9%) |
| Public Administration | 16 (39.0%) | 25 (61.0%) |
| Total | 179 (59.3%) | 123 (40.7%) |
Education in Fort Ann
School Enrollment in Fort Ann
The most common levels of schooling among the 94 students in Fort Ann are high school (25 | 26.6%), middle school (21 | 22.3%), and elementary school (20 | 21.3%).
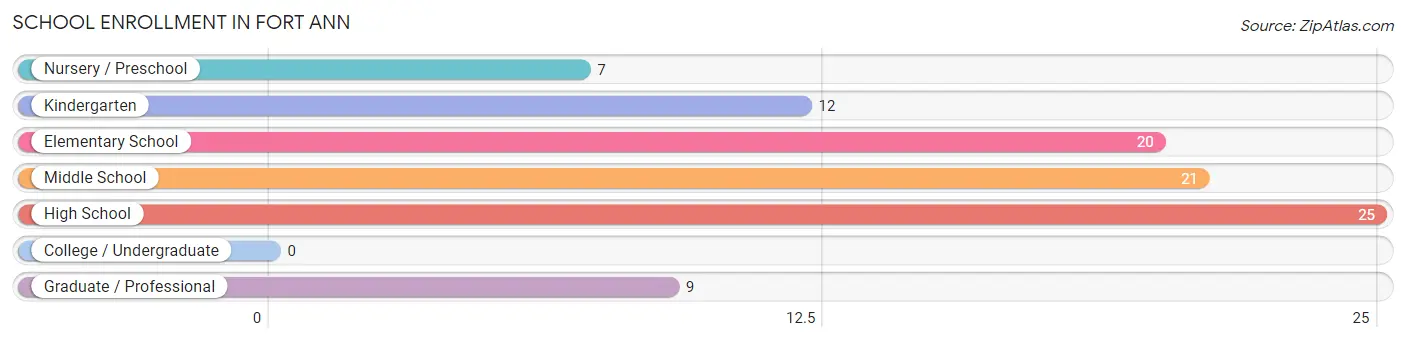
| School Level | # Students | % Students |
| Nursery / Preschool | 7 | 7.4% |
| Kindergarten | 12 | 12.8% |
| Elementary School | 20 | 21.3% |
| Middle School | 21 | 22.3% |
| High School | 25 | 26.6% |
| College / Undergraduate | 0 | 0.0% |
| Graduate / Professional | 9 | 9.6% |
| Total | 94 | 100.0% |
School Enrollment by Age by Funding Source in Fort Ann
Out of a total of 94 students who are enrolled in schools in Fort Ann, 4 (4.3%) attend a private institution, while the remaining 90 (95.7%) are enrolled in public schools. The age group of 20 to 24 year olds has the highest likelihood of being enrolled in private schools, with 2 (100.0% in the age bracket) enrolled. Conversely, the age group of 5 to 9 year old has the lowest likelihood of being enrolled in a private school, with 35 (100.0% in the age bracket) attending a public institution.
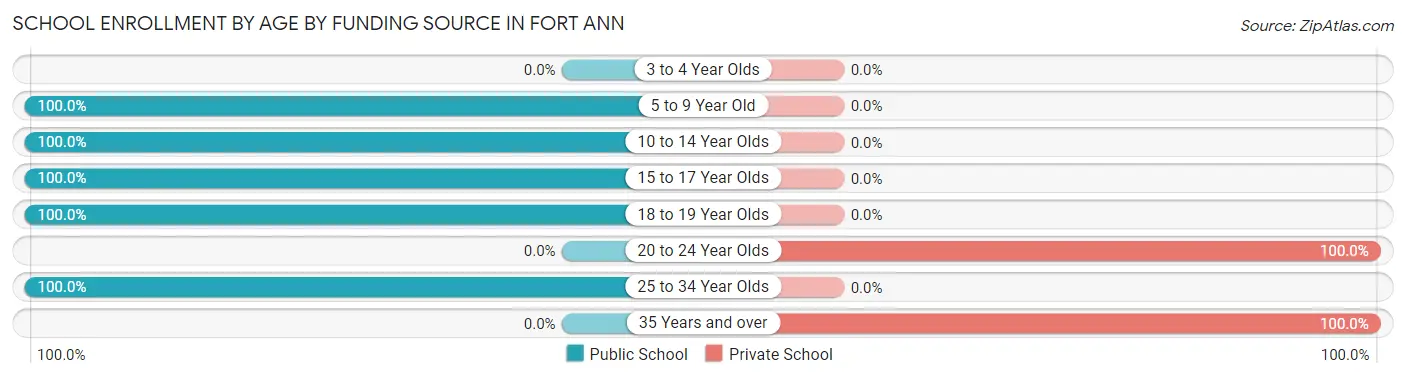
| Age Bracket | Public School | Private School |
| 3 to 4 Year Olds | 0 (0.0%) | 0 (0.0%) |
| 5 to 9 Year Old | 35 (100.0%) | 0 (0.0%) |
| 10 to 14 Year Olds | 27 (100.0%) | 0 (0.0%) |
| 15 to 17 Year Olds | 21 (100.0%) | 0 (0.0%) |
| 18 to 19 Year Olds | 2 (100.0%) | 0 (0.0%) |
| 20 to 24 Year Olds | 0 (0.0%) | 2 (100.0%) |
| 25 to 34 Year Olds | 5 (100.0%) | 0 (0.0%) |
| 35 Years and over | 0 (0.0%) | 2 (100.0%) |
| Total | 90 (95.7%) | 4 (4.3%) |
Educational Attainment by Field of Study in Fort Ann
Science & technology (20 | 20.0%), education (15 | 15.0%), arts & humanities (15 | 15.0%), bio, nature & agricultural (12 | 12.0%), and psychology (8 | 8.0%) are the most common fields of study among 100 individuals in Fort Ann who have obtained a bachelor's degree or higher.
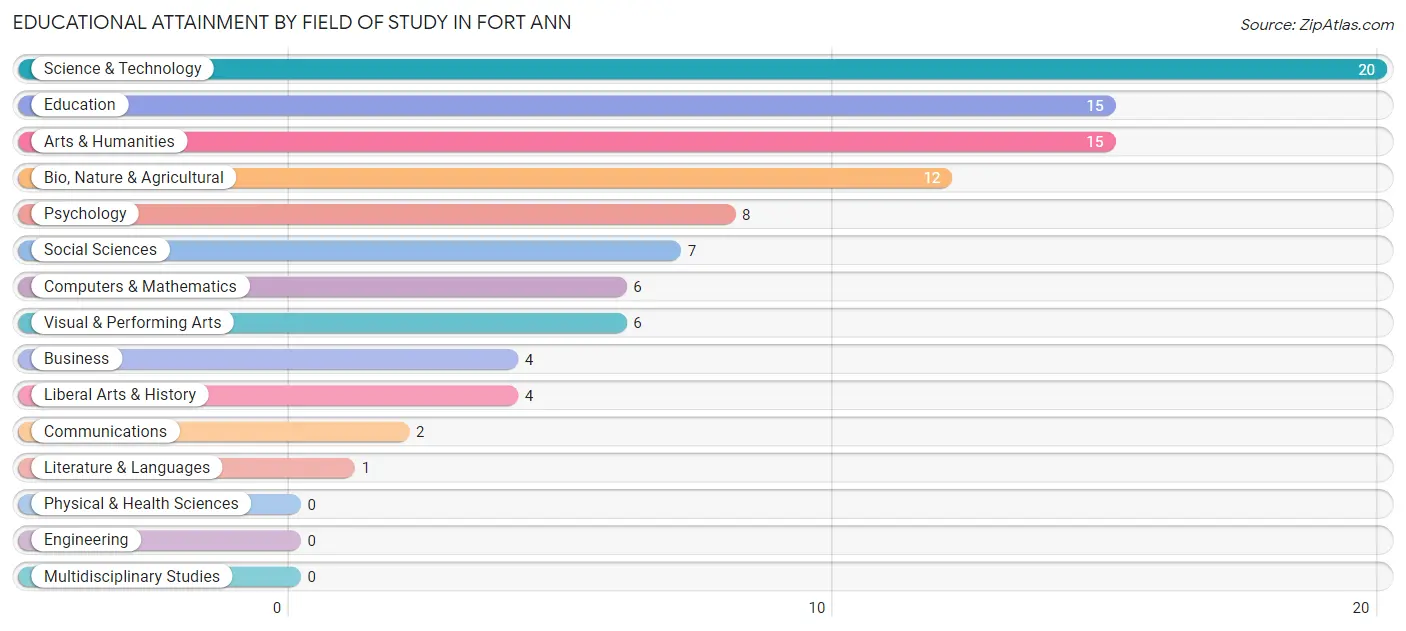
| Field of Study | # Graduates | % Graduates |
| Computers & Mathematics | 6 | 6.0% |
| Bio, Nature & Agricultural | 12 | 12.0% |
| Physical & Health Sciences | 0 | 0.0% |
| Psychology | 8 | 8.0% |
| Social Sciences | 7 | 7.0% |
| Engineering | 0 | 0.0% |
| Multidisciplinary Studies | 0 | 0.0% |
| Science & Technology | 20 | 20.0% |
| Business | 4 | 4.0% |
| Education | 15 | 15.0% |
| Literature & Languages | 1 | 1.0% |
| Liberal Arts & History | 4 | 4.0% |
| Visual & Performing Arts | 6 | 6.0% |
| Communications | 2 | 2.0% |
| Arts & Humanities | 15 | 15.0% |
| Total | 100 | 100.0% |
Transportation & Commute in Fort Ann
Vehicle Availability by Sex in Fort Ann
The most prevalent vehicle ownership categories in Fort Ann are males with 2 vehicles (78, accounting for 43.6%) and females with 2 vehicles (56, making up 63.9%).
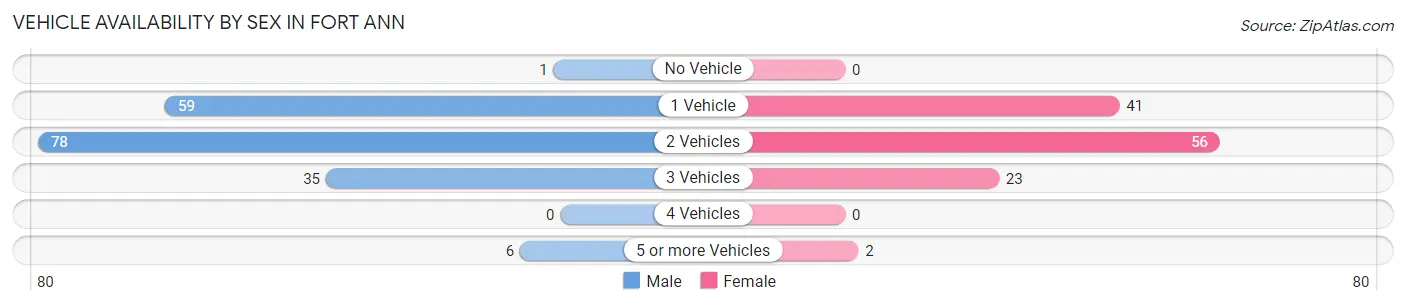
| Vehicles Available | Male | Female |
| No Vehicle | 1 (0.6%) | 0 (0.0%) |
| 1 Vehicle | 59 (33.0%) | 41 (33.6%) |
| 2 Vehicles | 78 (43.6%) | 56 (45.9%) |
| 3 Vehicles | 35 (19.6%) | 23 (18.9%) |
| 4 Vehicles | 0 (0.0%) | 0 (0.0%) |
| 5 or more Vehicles | 6 (3.4%) | 2 (1.6%) |
| Total | 179 (100.0%) | 122 (100.0%) |
Commute Time in Fort Ann
The most frequently occuring commute durations in Fort Ann are 20 to 24 minutes (74 commuters, 26.0%), less than 5 minutes (47 commuters, 16.5%), and 25 to 29 minutes (44 commuters, 15.4%).
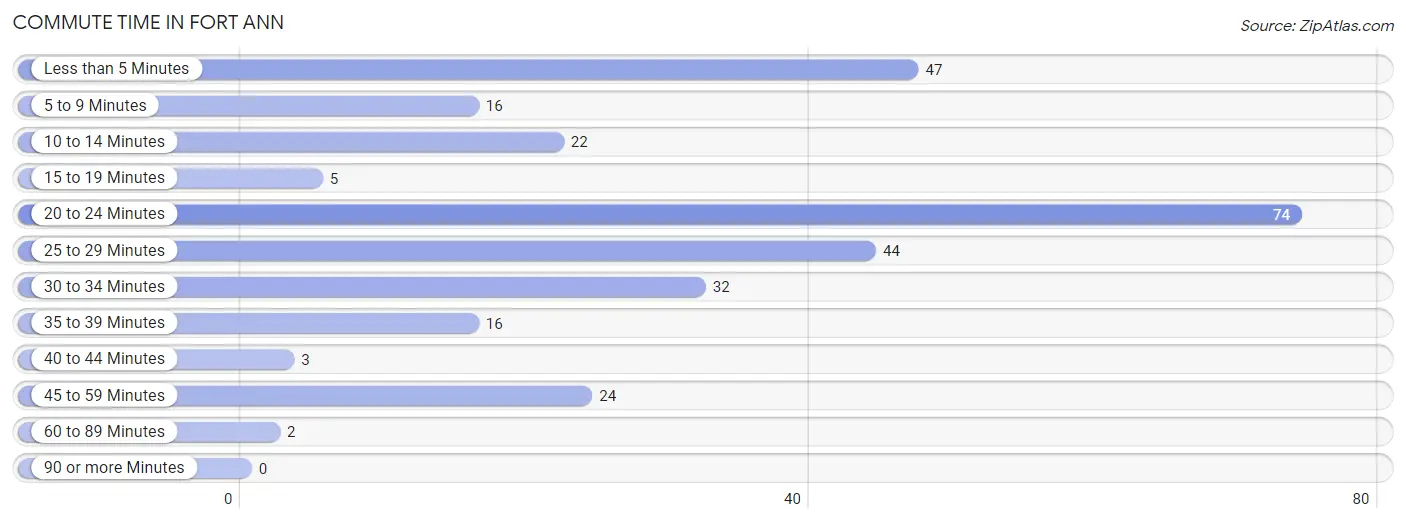
| Commute Time | # Commuters | % Commuters |
| Less than 5 Minutes | 47 | 16.5% |
| 5 to 9 Minutes | 16 | 5.6% |
| 10 to 14 Minutes | 22 | 7.7% |
| 15 to 19 Minutes | 5 | 1.8% |
| 20 to 24 Minutes | 74 | 26.0% |
| 25 to 29 Minutes | 44 | 15.4% |
| 30 to 34 Minutes | 32 | 11.2% |
| 35 to 39 Minutes | 16 | 5.6% |
| 40 to 44 Minutes | 3 | 1.1% |
| 45 to 59 Minutes | 24 | 8.4% |
| 60 to 89 Minutes | 2 | 0.7% |
| 90 or more Minutes | 0 | 0.0% |
Commute Time by Sex in Fort Ann
The most common commute times in Fort Ann are 20 to 24 minutes (47 commuters, 27.5%) for males and 25 to 29 minutes (31 commuters, 27.2%) for females.
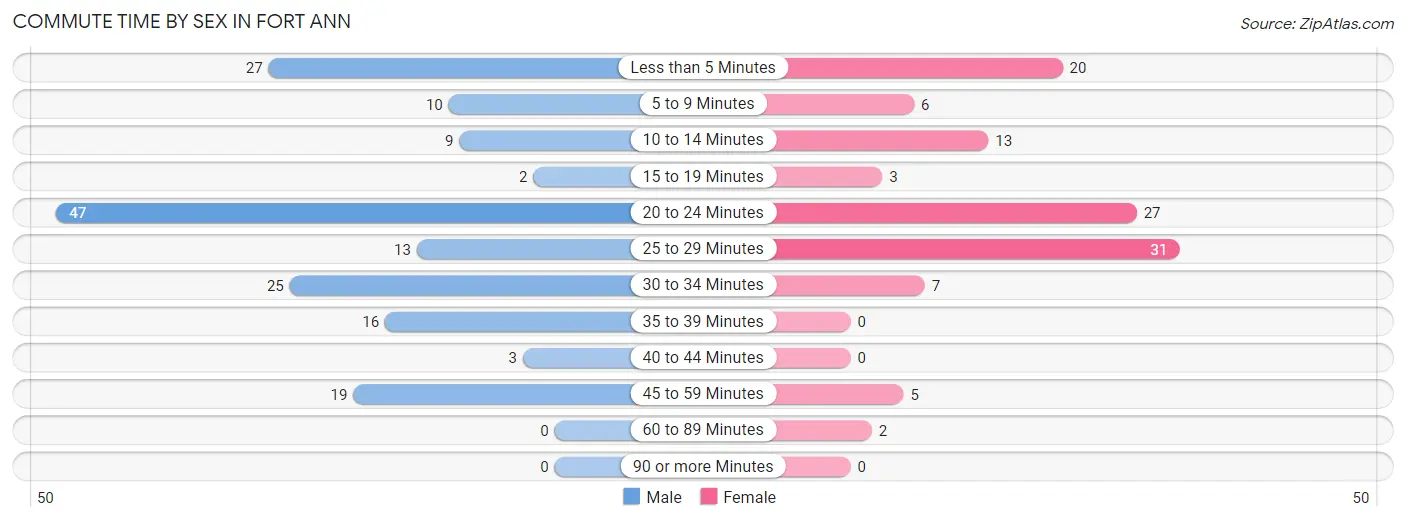
| Commute Time | Male | Female |
| Less than 5 Minutes | 27 (15.8%) | 20 (17.5%) |
| 5 to 9 Minutes | 10 (5.9%) | 6 (5.3%) |
| 10 to 14 Minutes | 9 (5.3%) | 13 (11.4%) |
| 15 to 19 Minutes | 2 (1.2%) | 3 (2.6%) |
| 20 to 24 Minutes | 47 (27.5%) | 27 (23.7%) |
| 25 to 29 Minutes | 13 (7.6%) | 31 (27.2%) |
| 30 to 34 Minutes | 25 (14.6%) | 7 (6.1%) |
| 35 to 39 Minutes | 16 (9.4%) | 0 (0.0%) |
| 40 to 44 Minutes | 3 (1.8%) | 0 (0.0%) |
| 45 to 59 Minutes | 19 (11.1%) | 5 (4.4%) |
| 60 to 89 Minutes | 0 (0.0%) | 2 (1.8%) |
| 90 or more Minutes | 0 (0.0%) | 0 (0.0%) |
Time of Departure to Work by Sex in Fort Ann
The most frequent times of departure to work in Fort Ann are 12:00 PM to 3:59 PM (66, 38.6%) for males and 7:30 AM to 7:59 AM (26, 22.8%) for females.
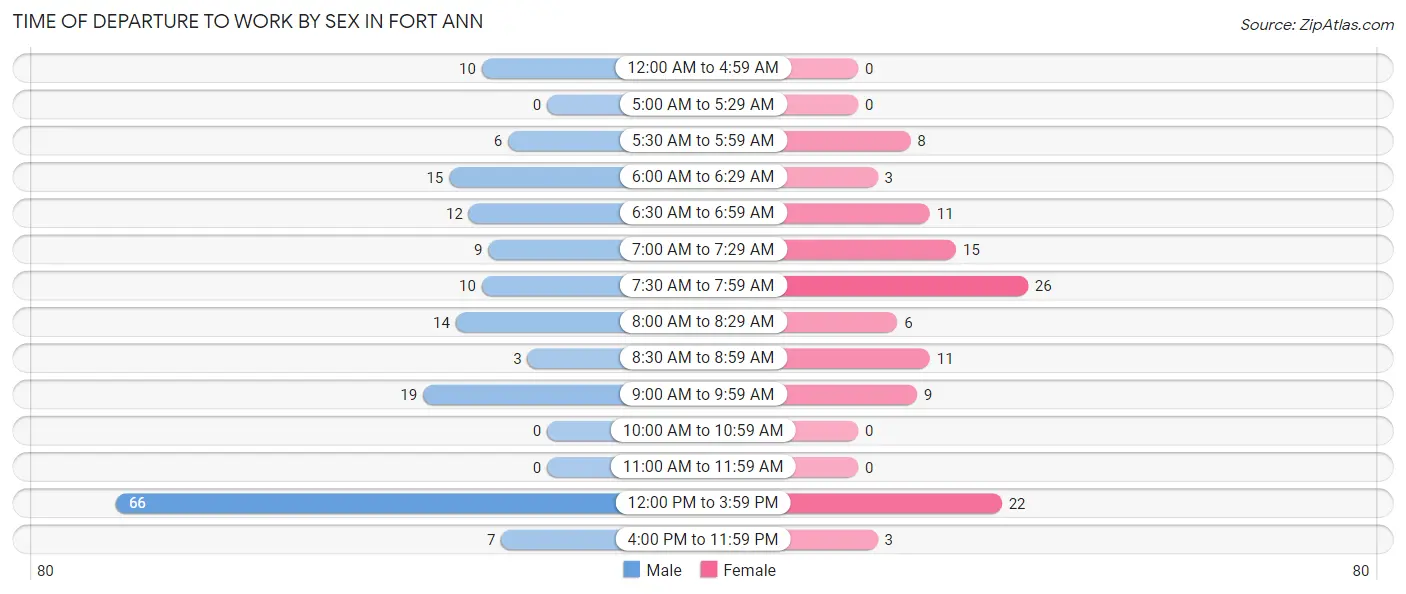
| Time of Departure | Male | Female |
| 12:00 AM to 4:59 AM | 10 (5.9%) | 0 (0.0%) |
| 5:00 AM to 5:29 AM | 0 (0.0%) | 0 (0.0%) |
| 5:30 AM to 5:59 AM | 6 (3.5%) | 8 (7.0%) |
| 6:00 AM to 6:29 AM | 15 (8.8%) | 3 (2.6%) |
| 6:30 AM to 6:59 AM | 12 (7.0%) | 11 (9.7%) |
| 7:00 AM to 7:29 AM | 9 (5.3%) | 15 (13.2%) |
| 7:30 AM to 7:59 AM | 10 (5.9%) | 26 (22.8%) |
| 8:00 AM to 8:29 AM | 14 (8.2%) | 6 (5.3%) |
| 8:30 AM to 8:59 AM | 3 (1.8%) | 11 (9.7%) |
| 9:00 AM to 9:59 AM | 19 (11.1%) | 9 (7.9%) |
| 10:00 AM to 10:59 AM | 0 (0.0%) | 0 (0.0%) |
| 11:00 AM to 11:59 AM | 0 (0.0%) | 0 (0.0%) |
| 12:00 PM to 3:59 PM | 66 (38.6%) | 22 (19.3%) |
| 4:00 PM to 11:59 PM | 7 (4.1%) | 3 (2.6%) |
| Total | 171 (100.0%) | 114 (100.0%) |
Housing Occupancy in Fort Ann
Occupancy by Ownership in Fort Ann
Of the total 189 dwellings in Fort Ann, owner-occupied units account for 161 (85.2%), while renter-occupied units make up 28 (14.8%).
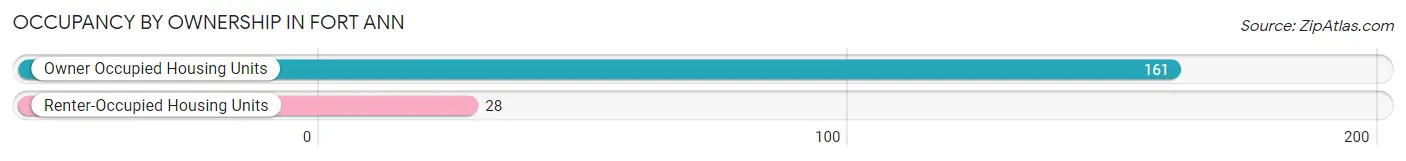
| Occupancy | # Housing Units | % Housing Units |
| Owner Occupied Housing Units | 161 | 85.2% |
| Renter-Occupied Housing Units | 28 | 14.8% |
| Total Occupied Housing Units | 189 | 100.0% |
Occupancy by Household Size in Fort Ann
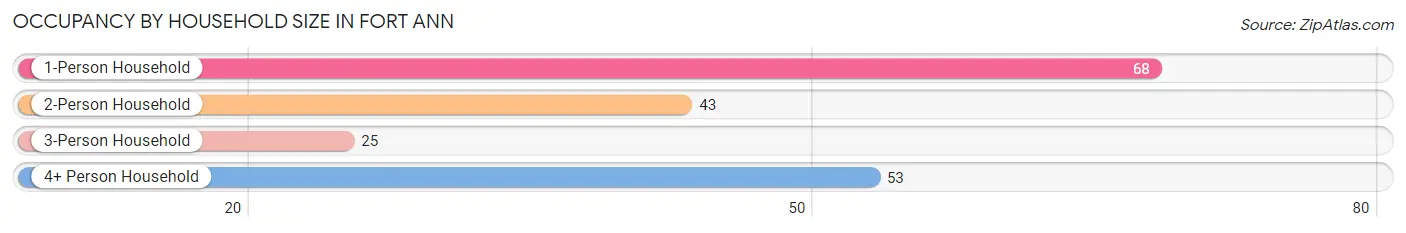
| Household Size | # Housing Units | % Housing Units |
| 1-Person Household | 68 | 36.0% |
| 2-Person Household | 43 | 22.8% |
| 3-Person Household | 25 | 13.2% |
| 4+ Person Household | 53 | 28.0% |
| Total Housing Units | 189 | 100.0% |
Occupancy by Ownership by Household Size in Fort Ann
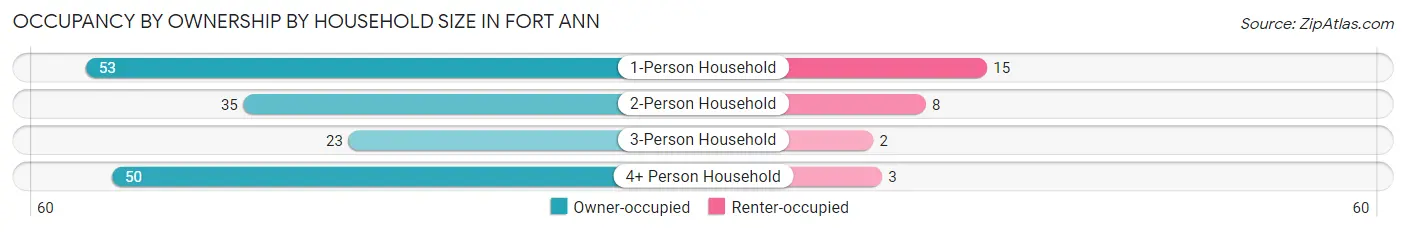
| Household Size | Owner-occupied | Renter-occupied |
| 1-Person Household | 53 (77.9%) | 15 (22.1%) |
| 2-Person Household | 35 (81.4%) | 8 (18.6%) |
| 3-Person Household | 23 (92.0%) | 2 (8.0%) |
| 4+ Person Household | 50 (94.3%) | 3 (5.7%) |
| Total Housing Units | 161 (85.2%) | 28 (14.8%) |
Occupancy by Educational Attainment in Fort Ann
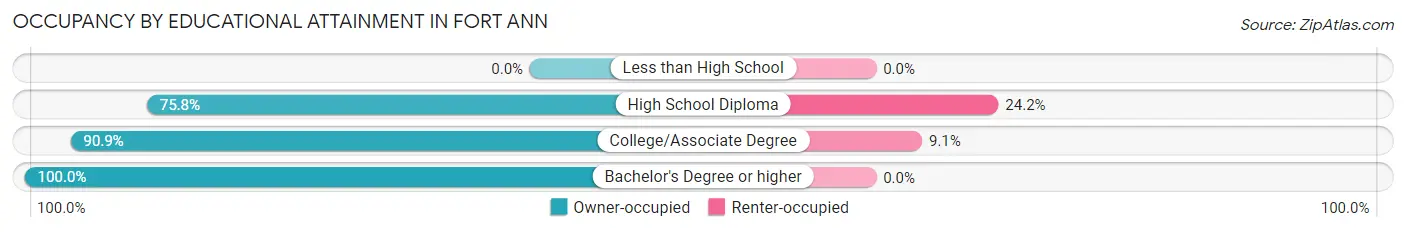
| Household Size | Owner-occupied | Renter-occupied |
| Less than High School | 0 (0.0%) | 0 (0.0%) |
| High School Diploma | 75 (75.8%) | 24 (24.2%) |
| College/Associate Degree | 40 (90.9%) | 4 (9.1%) |
| Bachelor's Degree or higher | 46 (100.0%) | 0 (0.0%) |
Occupancy by Age of Householder in Fort Ann
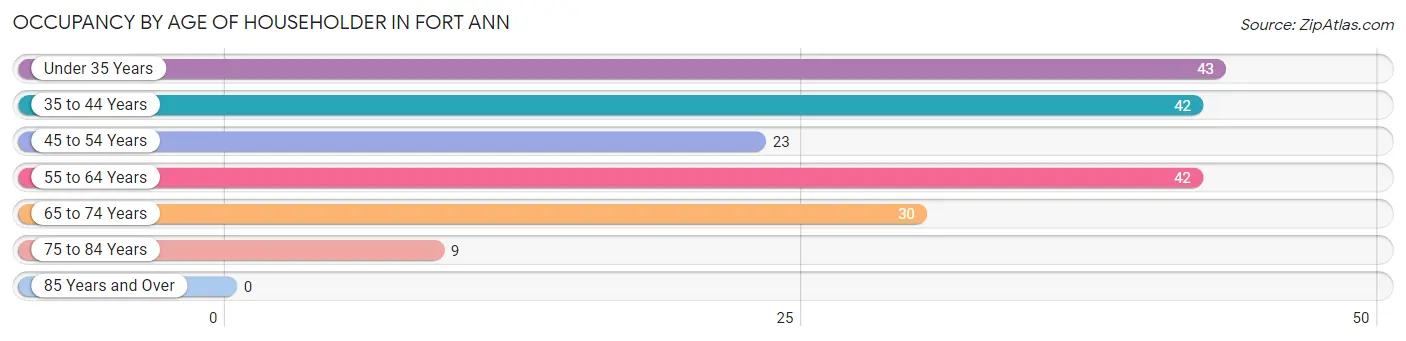
| Age Bracket | # Households | % Households |
| Under 35 Years | 43 | 22.8% |
| 35 to 44 Years | 42 | 22.2% |
| 45 to 54 Years | 23 | 12.2% |
| 55 to 64 Years | 42 | 22.2% |
| 65 to 74 Years | 30 | 15.9% |
| 75 to 84 Years | 9 | 4.8% |
| 85 Years and Over | 0 | 0.0% |
| Total | 189 | 100.0% |
Housing Finances in Fort Ann
Median Income by Occupancy in Fort Ann
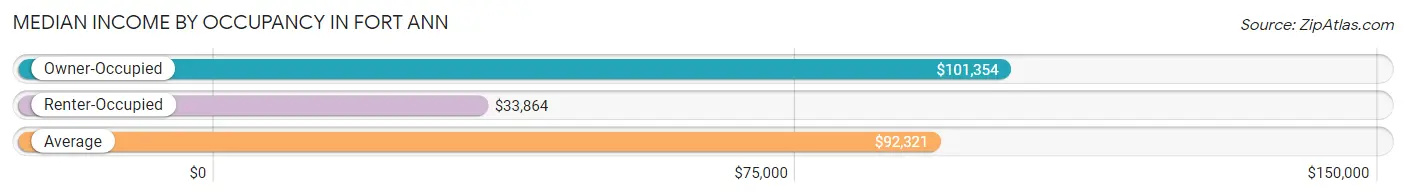
| Occupancy Type | # Households | Median Income |
| Owner-Occupied | 161 (85.2%) | $101,354 |
| Renter-Occupied | 28 (14.8%) | $33,864 |
| Average | 189 (100.0%) | $92,321 |
Occupancy by Householder Income Bracket in Fort Ann
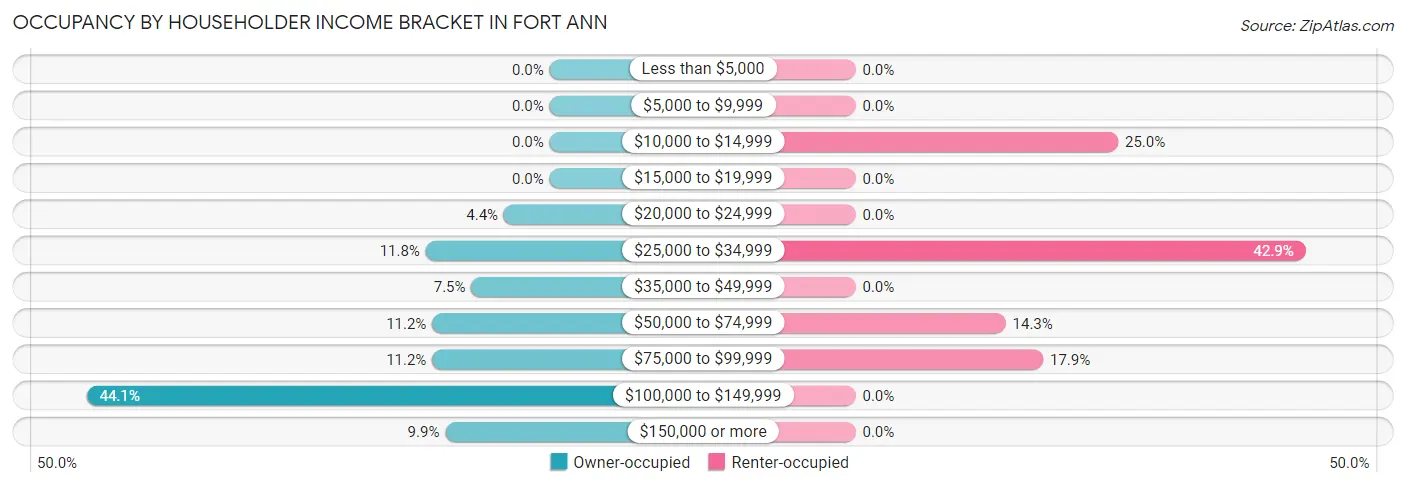
| Income Bracket | Owner-occupied | Renter-occupied |
| Less than $5,000 | 0 (0.0%) | 0 (0.0%) |
| $5,000 to $9,999 | 0 (0.0%) | 0 (0.0%) |
| $10,000 to $14,999 | 0 (0.0%) | 7 (25.0%) |
| $15,000 to $19,999 | 0 (0.0%) | 0 (0.0%) |
| $20,000 to $24,999 | 7 (4.3%) | 0 (0.0%) |
| $25,000 to $34,999 | 19 (11.8%) | 12 (42.9%) |
| $35,000 to $49,999 | 12 (7.4%) | 0 (0.0%) |
| $50,000 to $74,999 | 18 (11.2%) | 4 (14.3%) |
| $75,000 to $99,999 | 18 (11.2%) | 5 (17.9%) |
| $100,000 to $149,999 | 71 (44.1%) | 0 (0.0%) |
| $150,000 or more | 16 (9.9%) | 0 (0.0%) |
| Total | 161 (100.0%) | 28 (100.0%) |
Monthly Housing Cost Tiers in Fort Ann
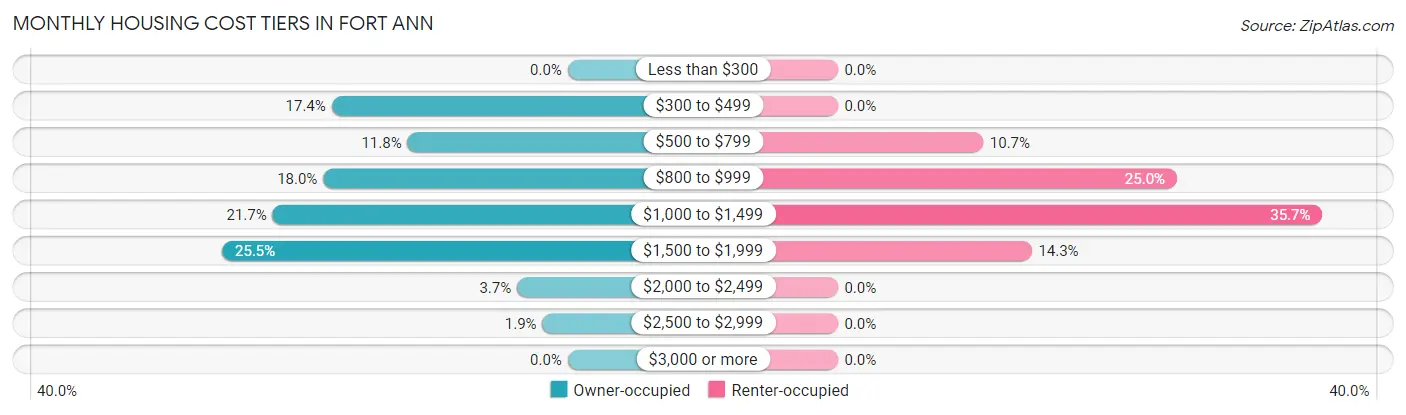
| Monthly Cost | Owner-occupied | Renter-occupied |
| Less than $300 | 0 (0.0%) | 0 (0.0%) |
| $300 to $499 | 28 (17.4%) | 0 (0.0%) |
| $500 to $799 | 19 (11.8%) | 3 (10.7%) |
| $800 to $999 | 29 (18.0%) | 7 (25.0%) |
| $1,000 to $1,499 | 35 (21.7%) | 10 (35.7%) |
| $1,500 to $1,999 | 41 (25.5%) | 4 (14.3%) |
| $2,000 to $2,499 | 6 (3.7%) | 0 (0.0%) |
| $2,500 to $2,999 | 3 (1.9%) | 0 (0.0%) |
| $3,000 or more | 0 (0.0%) | 0 (0.0%) |
| Total | 161 (100.0%) | 28 (100.0%) |
Physical Housing Characteristics in Fort Ann
Housing Structures in Fort Ann
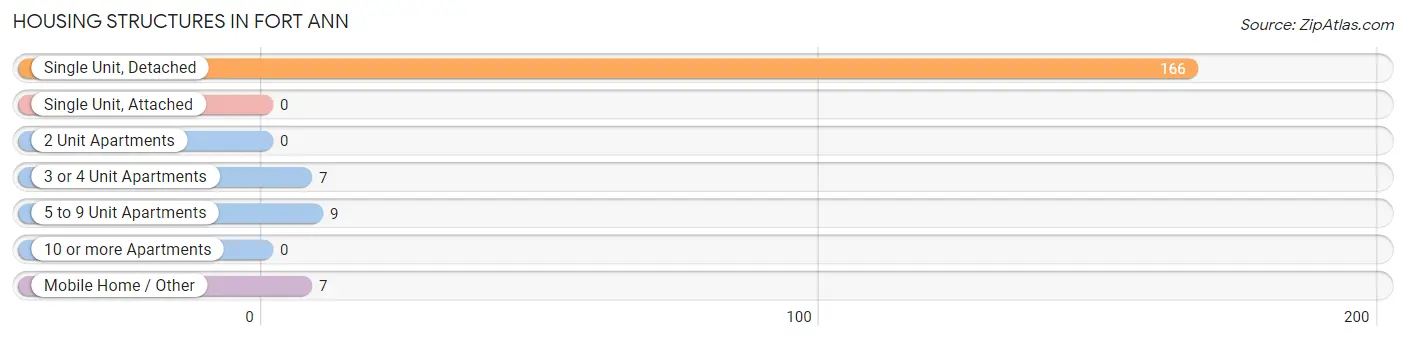
| Structure Type | # Housing Units | % Housing Units |
| Single Unit, Detached | 166 | 87.8% |
| Single Unit, Attached | 0 | 0.0% |
| 2 Unit Apartments | 0 | 0.0% |
| 3 or 4 Unit Apartments | 7 | 3.7% |
| 5 to 9 Unit Apartments | 9 | 4.8% |
| 10 or more Apartments | 0 | 0.0% |
| Mobile Home / Other | 7 | 3.7% |
| Total | 189 | 100.0% |
Housing Structures by Occupancy in Fort Ann
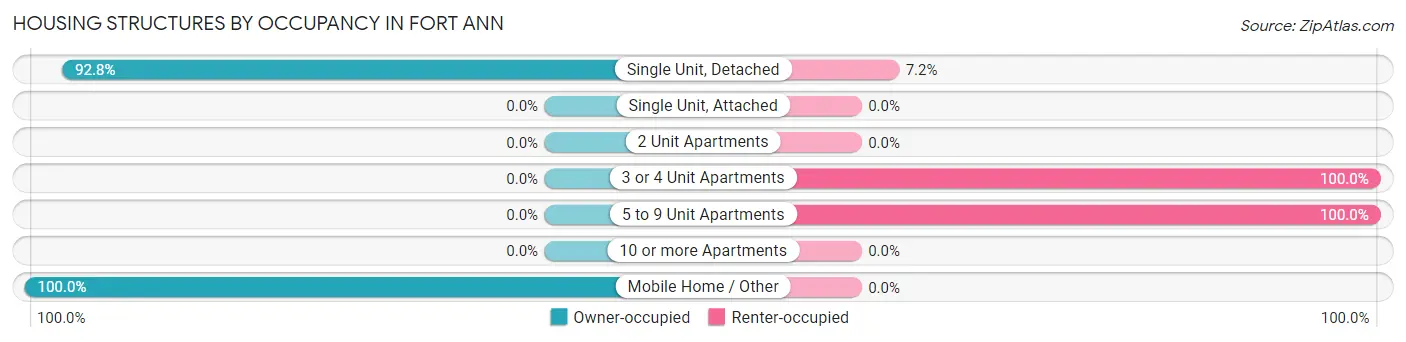
| Structure Type | Owner-occupied | Renter-occupied |
| Single Unit, Detached | 154 (92.8%) | 12 (7.2%) |
| Single Unit, Attached | 0 (0.0%) | 0 (0.0%) |
| 2 Unit Apartments | 0 (0.0%) | 0 (0.0%) |
| 3 or 4 Unit Apartments | 0 (0.0%) | 7 (100.0%) |
| 5 to 9 Unit Apartments | 0 (0.0%) | 9 (100.0%) |
| 10 or more Apartments | 0 (0.0%) | 0 (0.0%) |
| Mobile Home / Other | 7 (100.0%) | 0 (0.0%) |
| Total | 161 (85.2%) | 28 (14.8%) |
Housing Structures by Number of Rooms in Fort Ann
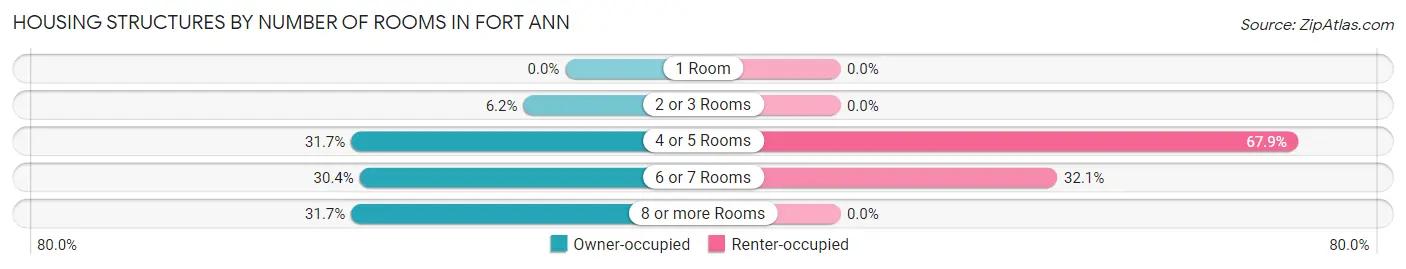
| Number of Rooms | Owner-occupied | Renter-occupied |
| 1 Room | 0 (0.0%) | 0 (0.0%) |
| 2 or 3 Rooms | 10 (6.2%) | 0 (0.0%) |
| 4 or 5 Rooms | 51 (31.7%) | 19 (67.9%) |
| 6 or 7 Rooms | 49 (30.4%) | 9 (32.1%) |
| 8 or more Rooms | 51 (31.7%) | 0 (0.0%) |
| Total | 161 (100.0%) | 28 (100.0%) |
Housing Structure by Heating Type in Fort Ann
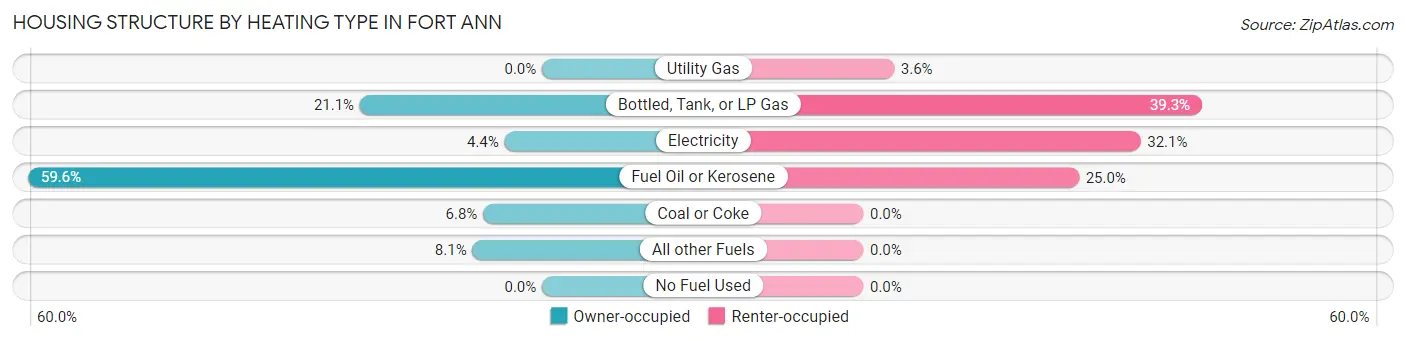
| Heating Type | Owner-occupied | Renter-occupied |
| Utility Gas | 0 (0.0%) | 1 (3.6%) |
| Bottled, Tank, or LP Gas | 34 (21.1%) | 11 (39.3%) |
| Electricity | 7 (4.3%) | 9 (32.1%) |
| Fuel Oil or Kerosene | 96 (59.6%) | 7 (25.0%) |
| Coal or Coke | 11 (6.8%) | 0 (0.0%) |
| All other Fuels | 13 (8.1%) | 0 (0.0%) |
| No Fuel Used | 0 (0.0%) | 0 (0.0%) |
| Total | 161 (100.0%) | 28 (100.0%) |
Household Vehicle Usage in Fort Ann
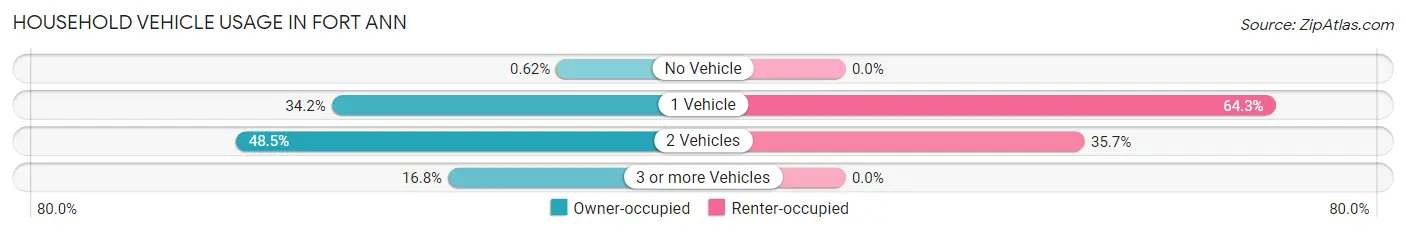
| Vehicles per Household | Owner-occupied | Renter-occupied |
| No Vehicle | 1 (0.6%) | 0 (0.0%) |
| 1 Vehicle | 55 (34.2%) | 18 (64.3%) |
| 2 Vehicles | 78 (48.4%) | 10 (35.7%) |
| 3 or more Vehicles | 27 (16.8%) | 0 (0.0%) |
| Total | 161 (100.0%) | 28 (100.0%) |
Real Estate & Mortgages in Fort Ann
Real Estate and Mortgage Overview in Fort Ann
| Characteristic | Without Mortgage | With Mortgage |
| Housing Units | 43 | 118 |
| Median Property Value | - | - |
| Median Household Income | $93,250 | $12 |
| Monthly Housing Costs | $450 | $0 |
| Real Estate Taxes | $1,925 | $12 |
Property Value by Mortgage Status in Fort Ann
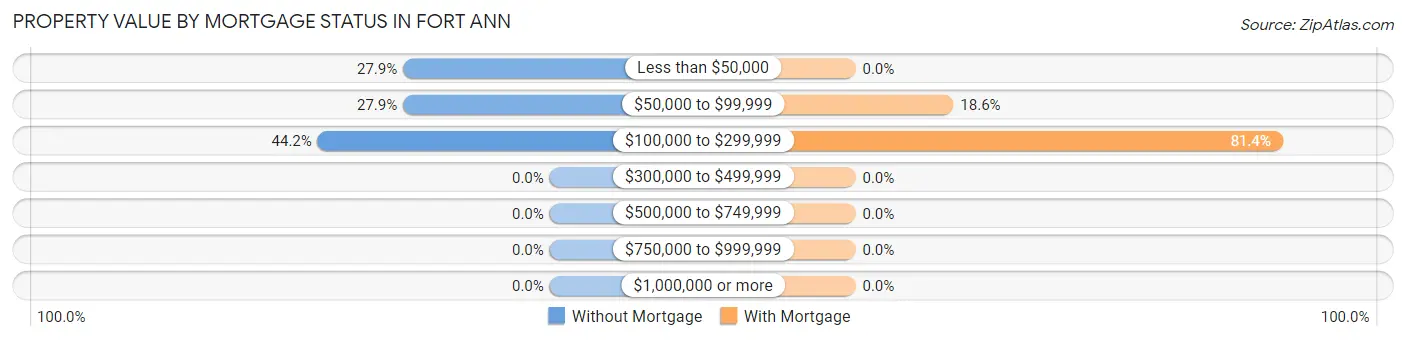
| Property Value | Without Mortgage | With Mortgage |
| Less than $50,000 | 12 (27.9%) | 0 (0.0%) |
| $50,000 to $99,999 | 12 (27.9%) | 22 (18.6%) |
| $100,000 to $299,999 | 19 (44.2%) | 96 (81.4%) |
| $300,000 to $499,999 | 0 (0.0%) | 0 (0.0%) |
| $500,000 to $749,999 | 0 (0.0%) | 0 (0.0%) |
| $750,000 to $999,999 | 0 (0.0%) | 0 (0.0%) |
| $1,000,000 or more | 0 (0.0%) | 0 (0.0%) |
| Total | 43 (100.0%) | 118 (100.0%) |
Household Income by Mortgage Status in Fort Ann
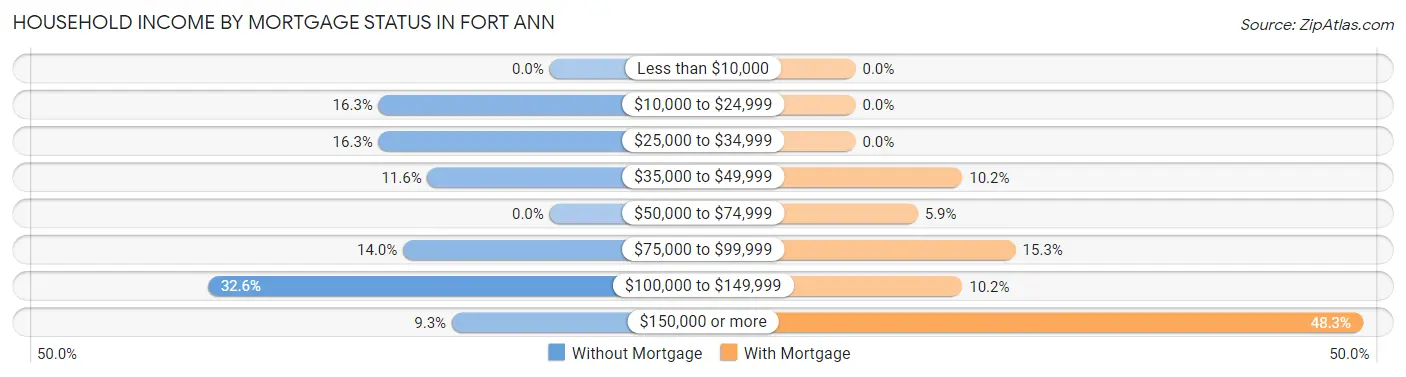
| Household Income | Without Mortgage | With Mortgage |
| Less than $10,000 | 0 (0.0%) | 0 (0.0%) |
| $10,000 to $24,999 | 7 (16.3%) | 0 (0.0%) |
| $25,000 to $34,999 | 7 (16.3%) | 0 (0.0%) |
| $35,000 to $49,999 | 5 (11.6%) | 12 (10.2%) |
| $50,000 to $74,999 | 0 (0.0%) | 7 (5.9%) |
| $75,000 to $99,999 | 6 (14.0%) | 18 (15.2%) |
| $100,000 to $149,999 | 14 (32.6%) | 12 (10.2%) |
| $150,000 or more | 4 (9.3%) | 57 (48.3%) |
| Total | 43 (100.0%) | 118 (100.0%) |
Property Value to Household Income Ratio in Fort Ann
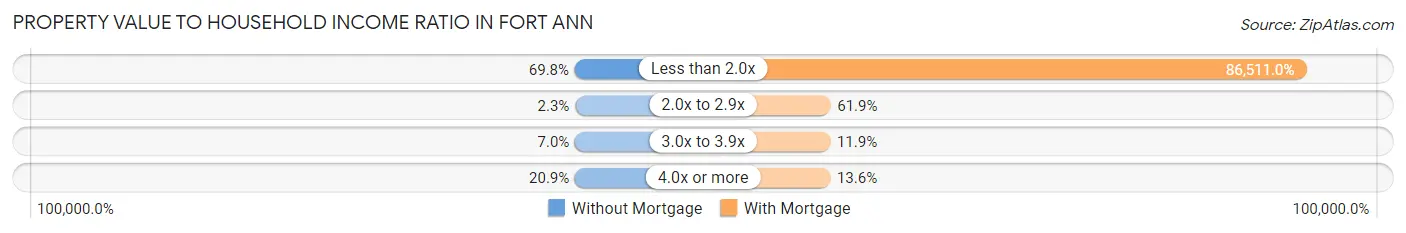
| Value-to-Income Ratio | Without Mortgage | With Mortgage |
| Less than 2.0x | 30 (69.8%) | 102,083 (86,511.0%) |
| 2.0x to 2.9x | 1 (2.3%) | 73 (61.9%) |
| 3.0x to 3.9x | 3 (7.0%) | 14 (11.9%) |
| 4.0x or more | 9 (20.9%) | 16 (13.6%) |
| Total | 43 (100.0%) | 118 (100.0%) |
Real Estate Taxes by Mortgage Status in Fort Ann
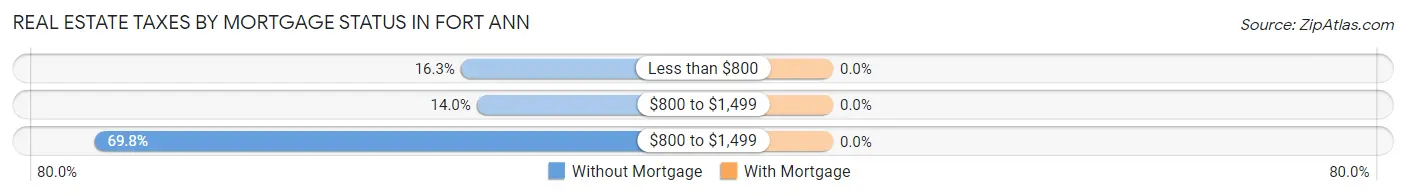
| Property Taxes | Without Mortgage | With Mortgage |
| Less than $800 | 7 (16.3%) | 0 (0.0%) |
| $800 to $1,499 | 6 (14.0%) | 0 (0.0%) |
| $800 to $1,499 | 30 (69.8%) | 0 (0.0%) |
| Total | 43 (100.0%) | 118 (100.0%) |
Health & Disability in Fort Ann
Health Insurance Coverage by Age in Fort Ann
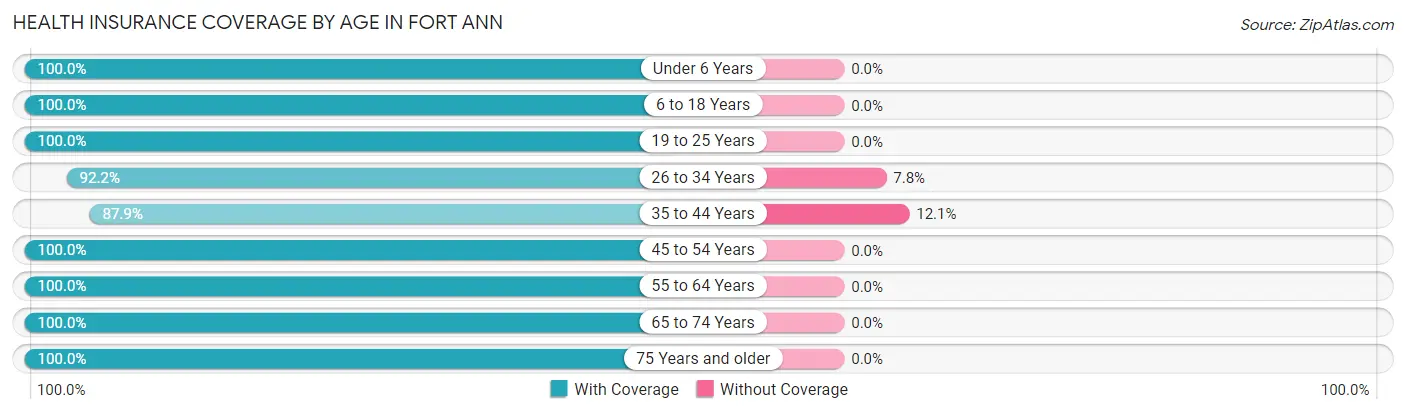
| Age Bracket | With Coverage | Without Coverage |
| Under 6 Years | 64 (100.0%) | 0 (0.0%) |
| 6 to 18 Years | 66 (100.0%) | 0 (0.0%) |
| 19 to 25 Years | 53 (100.0%) | 0 (0.0%) |
| 26 to 34 Years | 94 (92.2%) | 8 (7.8%) |
| 35 to 44 Years | 58 (87.9%) | 8 (12.1%) |
| 45 to 54 Years | 50 (100.0%) | 0 (0.0%) |
| 55 to 64 Years | 58 (100.0%) | 0 (0.0%) |
| 65 to 74 Years | 40 (100.0%) | 0 (0.0%) |
| 75 Years and older | 12 (100.0%) | 0 (0.0%) |
| Total | 495 (96.9%) | 16 (3.1%) |
Health Insurance Coverage by Citizenship Status in Fort Ann
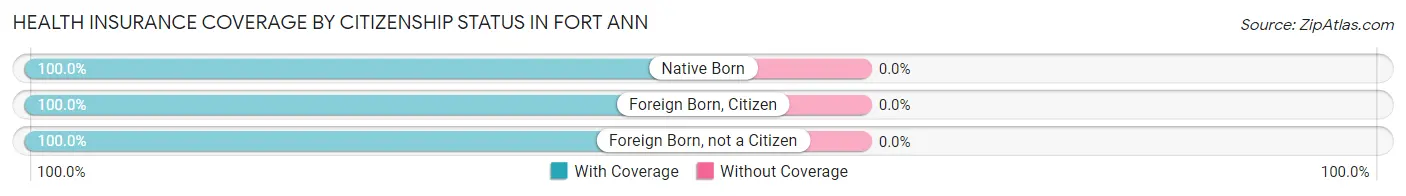
| Citizenship Status | With Coverage | Without Coverage |
| Native Born | 64 (100.0%) | 0 (0.0%) |
| Foreign Born, Citizen | 66 (100.0%) | 0 (0.0%) |
| Foreign Born, not a Citizen | 53 (100.0%) | 0 (0.0%) |
Health Insurance Coverage by Household Income in Fort Ann
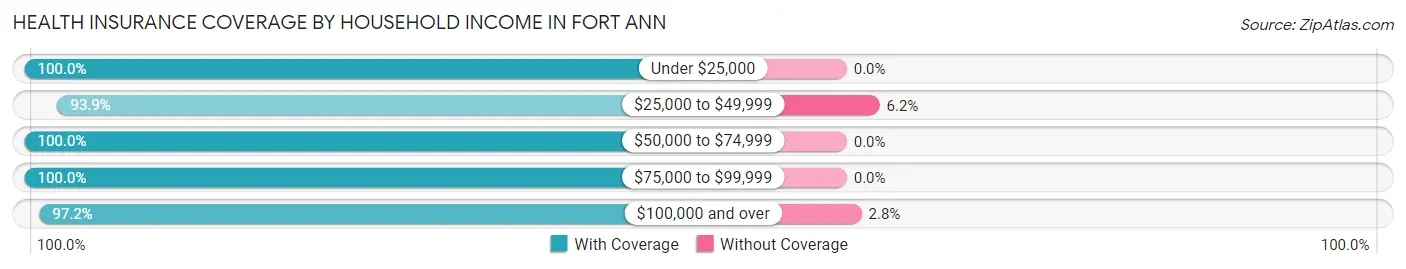
| Household Income | With Coverage | Without Coverage |
| Under $25,000 | 14 (100.0%) | 0 (0.0%) |
| $25,000 to $49,999 | 122 (93.9%) | 8 (6.1%) |
| $50,000 to $74,999 | 25 (100.0%) | 0 (0.0%) |
| $75,000 to $99,999 | 54 (100.0%) | 0 (0.0%) |
| $100,000 and over | 280 (97.2%) | 8 (2.8%) |
Public vs Private Health Insurance Coverage by Age in Fort Ann
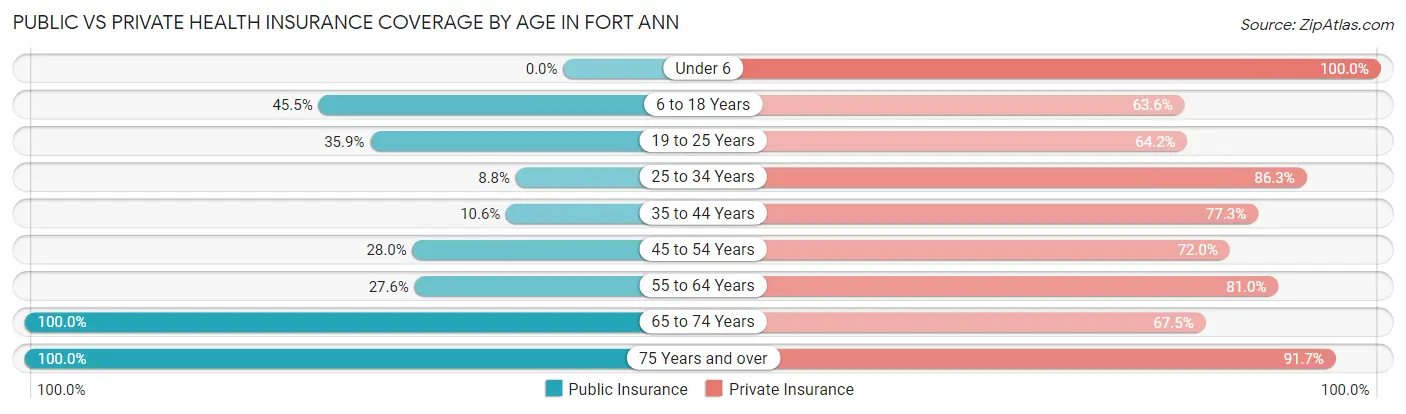
| Age Bracket | Public Insurance | Private Insurance |
| Under 6 | 0 (0.0%) | 64 (100.0%) |
| 6 to 18 Years | 30 (45.5%) | 42 (63.6%) |
| 19 to 25 Years | 19 (35.8%) | 34 (64.1%) |
| 25 to 34 Years | 9 (8.8%) | 88 (86.3%) |
| 35 to 44 Years | 7 (10.6%) | 51 (77.3%) |
| 45 to 54 Years | 14 (28.0%) | 36 (72.0%) |
| 55 to 64 Years | 16 (27.6%) | 47 (81.0%) |
| 65 to 74 Years | 40 (100.0%) | 27 (67.5%) |
| 75 Years and over | 12 (100.0%) | 11 (91.7%) |
| Total | 147 (28.8%) | 400 (78.3%) |
Disability Status by Sex by Age in Fort Ann
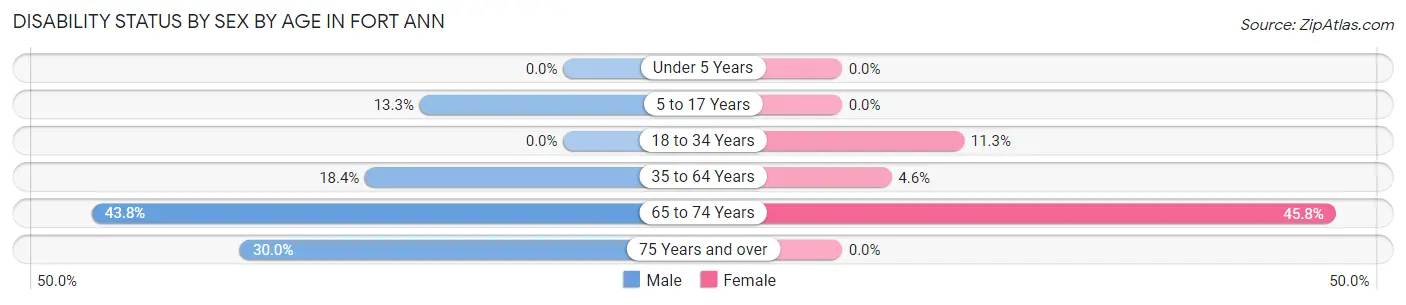
| Age Bracket | Male | Female |
| Under 5 Years | 0 (0.0%) | 0 (0.0%) |
| 5 to 17 Years | 6 (13.3%) | 0 (0.0%) |
| 18 to 34 Years | 0 (0.0%) | 6 (11.3%) |
| 35 to 64 Years | 16 (18.4%) | 4 (4.6%) |
| 65 to 74 Years | 7 (43.8%) | 11 (45.8%) |
| 75 Years and over | 3 (30.0%) | 0 (0.0%) |
Disability Class by Sex by Age in Fort Ann
Disability Class: Hearing Difficulty
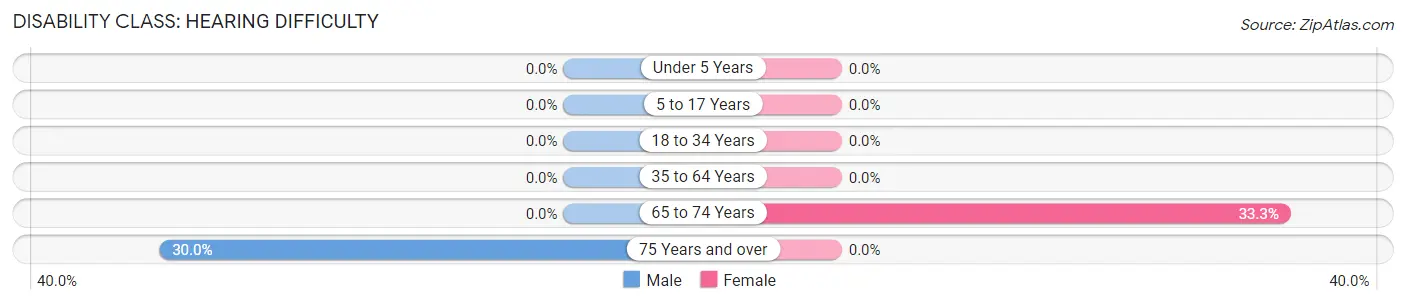
| Age Bracket | Male | Female |
| Under 5 Years | 0 (0.0%) | 0 (0.0%) |
| 5 to 17 Years | 0 (0.0%) | 0 (0.0%) |
| 18 to 34 Years | 0 (0.0%) | 0 (0.0%) |
| 35 to 64 Years | 0 (0.0%) | 0 (0.0%) |
| 65 to 74 Years | 0 (0.0%) | 8 (33.3%) |
| 75 Years and over | 3 (30.0%) | 0 (0.0%) |
Disability Class: Vision Difficulty
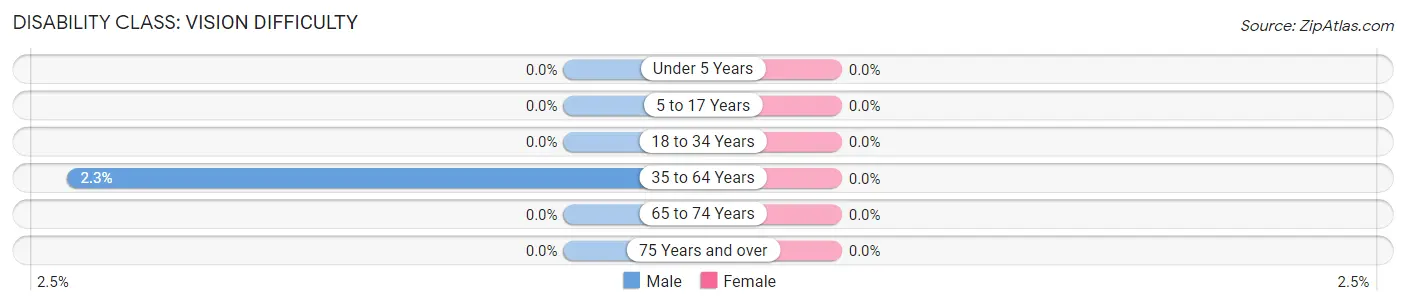
| Age Bracket | Male | Female |
| Under 5 Years | 0 (0.0%) | 0 (0.0%) |
| 5 to 17 Years | 0 (0.0%) | 0 (0.0%) |
| 18 to 34 Years | 0 (0.0%) | 0 (0.0%) |
| 35 to 64 Years | 2 (2.3%) | 0 (0.0%) |
| 65 to 74 Years | 0 (0.0%) | 0 (0.0%) |
| 75 Years and over | 0 (0.0%) | 0 (0.0%) |
Disability Class: Cognitive Difficulty
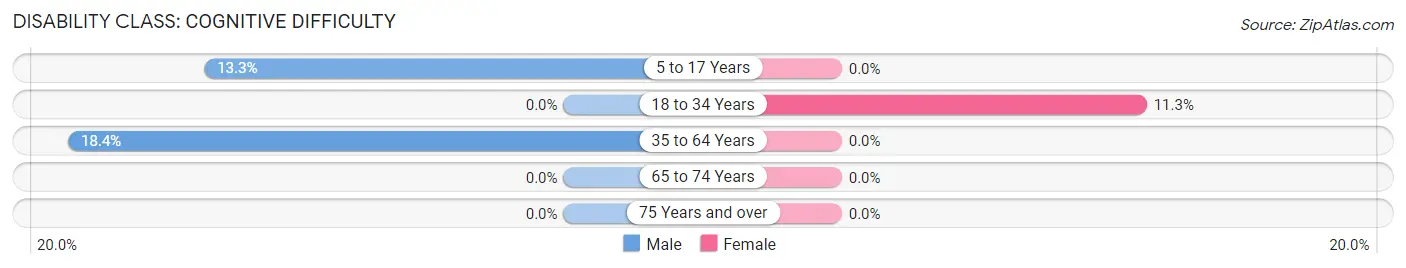
| Age Bracket | Male | Female |
| 5 to 17 Years | 6 (13.3%) | 0 (0.0%) |
| 18 to 34 Years | 0 (0.0%) | 6 (11.3%) |
| 35 to 64 Years | 16 (18.4%) | 0 (0.0%) |
| 65 to 74 Years | 0 (0.0%) | 0 (0.0%) |
| 75 Years and over | 0 (0.0%) | 0 (0.0%) |
Disability Class: Ambulatory Difficulty
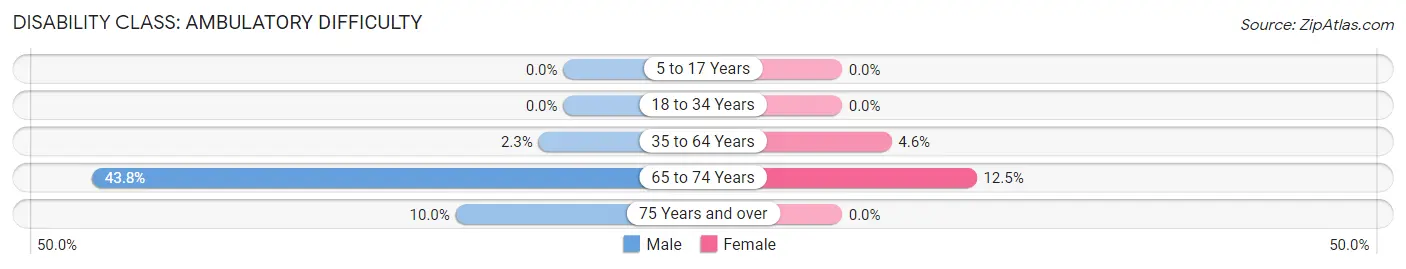
| Age Bracket | Male | Female |
| 5 to 17 Years | 0 (0.0%) | 0 (0.0%) |
| 18 to 34 Years | 0 (0.0%) | 0 (0.0%) |
| 35 to 64 Years | 2 (2.3%) | 4 (4.6%) |
| 65 to 74 Years | 7 (43.8%) | 3 (12.5%) |
| 75 Years and over | 1 (10.0%) | 0 (0.0%) |
Disability Class: Self-Care Difficulty
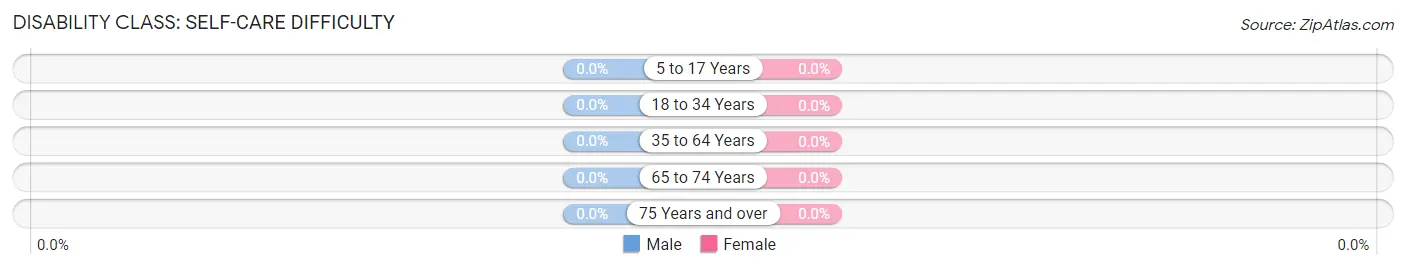
| Age Bracket | Male | Female |
| 5 to 17 Years | 0 (0.0%) | 0 (0.0%) |
| 18 to 34 Years | 0 (0.0%) | 0 (0.0%) |
| 35 to 64 Years | 0 (0.0%) | 0 (0.0%) |
| 65 to 74 Years | 0 (0.0%) | 0 (0.0%) |
| 75 Years and over | 0 (0.0%) | 0 (0.0%) |
Technology Access in Fort Ann
Computing Device Access in Fort Ann
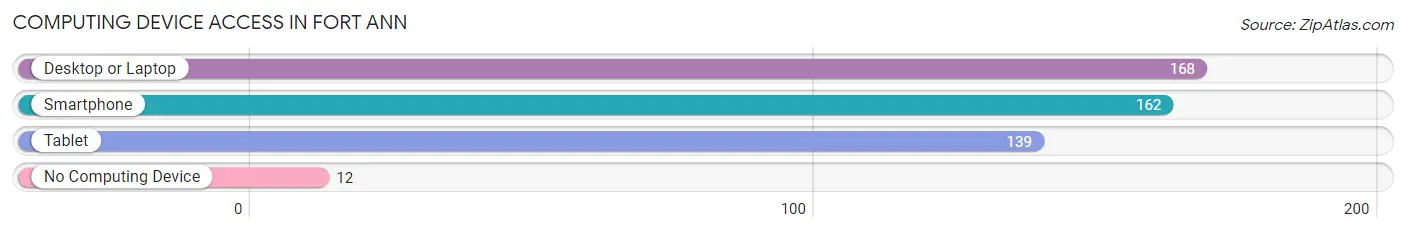
| Device Type | # Households | % Households |
| Desktop or Laptop | 168 | 88.9% |
| Smartphone | 162 | 85.7% |
| Tablet | 139 | 73.5% |
| No Computing Device | 12 | 6.4% |
| Total | 189 | 100.0% |
Internet Access in Fort Ann
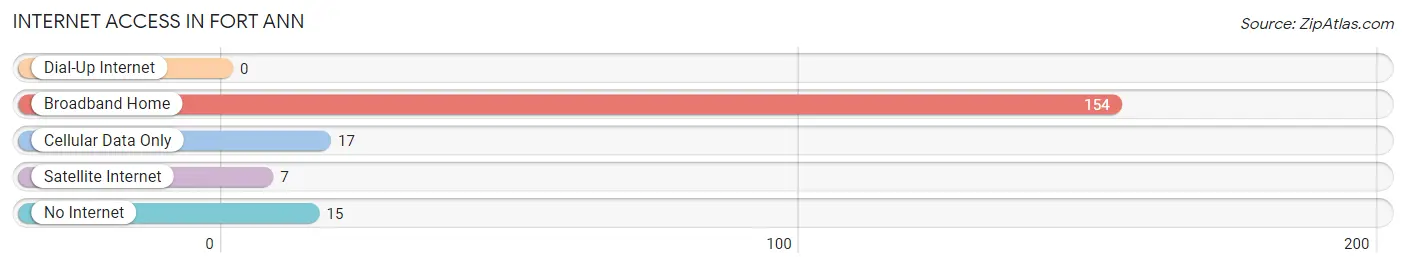
| Internet Type | # Households | % Households |
| Dial-Up Internet | 0 | 0.0% |
| Broadband Home | 154 | 81.5% |
| Cellular Data Only | 17 | 9.0% |
| Satellite Internet | 7 | 3.7% |
| No Internet | 15 | 7.9% |
| Total | 189 | 100.0% |
Fort Ann Summary
History
Fort Ann is a town located in Washington County, New York, United States. The town was first settled in 1764 and was originally known as “Fort Ann” due to its location near Fort Edward. The town was officially established in 1786 and was named after Queen Anne of Great Britain.
The town of Fort Ann is located in the foothills of the Adirondack Mountains and is home to several small lakes, including Lake George, Lake Champlain, and Lake Luzerne. The town is also home to several small villages, including Fort Ann, West Fort Ann, and South Bay.
The town of Fort Ann has a rich history that dates back to the early days of the American Revolution. During the war, the town was the site of several battles, including the Battle of Fort Ann in 1777. The town was also the site of the Battle of Saratoga in 1777, which was a major turning point in the war.
The town of Fort Ann has also been home to several notable people, including the famous American author, Washington Irving. Irving was born in the town in 1783 and wrote several of his most famous works while living in the town.
Geography
The town of Fort Ann is located in the foothills of the Adirondack Mountains in Washington County, New York. The town is bordered by the towns of Whitehall to the north, Kingsbury to the east, and Fort Edward to the south. The town is also bordered by the Hudson River to the west.
The town of Fort Ann is located in a rural area and is home to several small lakes, including Lake George, Lake Champlain, and Lake Luzerne. The town is also home to several small villages, including Fort Ann, West Fort Ann, and South Bay.
The town of Fort Ann has a total area of 33.2 square miles, of which 32.9 square miles is land and 0.3 square miles is water. The town is located at an elevation of 1,000 feet above sea level.
Economy
The economy of the town of Fort Ann is largely based on tourism and agriculture. The town is home to several small businesses, including restaurants, shops, and lodging. The town is also home to several farms, which produce a variety of crops, including corn, hay, and apples.
The town of Fort Ann is also home to several manufacturing companies, including a paper mill and a furniture factory. The town is also home to several small businesses, including a winery, a brewery, and a distillery.
Demographics
As of the 2010 census, the town of Fort Ann had a population of 2,845. The population density was 85.7 people per square mile. The racial makeup of the town was 97.3% White, 0.7% African American, 0.3% Native American, 0.3% Asian, 0.1% Pacific Islander, 0.3% from other races, and 1.0% from two or more races. Hispanic or Latino of any race were 1.3% of the population.
The median income for a household in the town was $45,000 and the median income for a family was $50,000. The per capita income for the town was $20,000. About 10.3% of families and 13.2% of the population were below the poverty line, including 17.2% of those under age 18 and 8.3% of those age 65 or over.
Common Questions
What is the Total Population of Fort Ann?
Total Population of Fort Ann is 511.
What is the Total Male Population of Fort Ann?
Total Male Population of Fort Ann is 280.
What is the Total Female Population of Fort Ann?
Total Female Population of Fort Ann is 231.
What is the Ratio of Males per 100 Females in Fort Ann?
There are 121.21 Males per 100 Females in Fort Ann.
What is the Ratio of Females per 100 Males in Fort Ann?
There are 82.50 Females per 100 Males in Fort Ann.
What is the Median Population Age in Fort Ann?
Median Population Age in Fort Ann is 32.0 Years.
What is the Average Family Size in Fort Ann
Average Family Size in Fort Ann is 3.6 People.
What is the Average Household Size in Fort Ann
Average Household Size in Fort Ann is 2.7 People.
What is Per Capita Income in Fort Ann?
Per Capita income in Fort Ann is $33,360.
What is the Median Family Income in Fort Ann?
Median Family Income in Fort Ann is $100,729.
What is the Median Household income in Fort Ann?
Median Household Income in Fort Ann is $92,321.
What is Income or Wage Gap in Fort Ann?
Income or Wage Gap in Fort Ann is 13.7%.
Women in Fort Ann earn 86.3 cents for every dollar earned by a man.
What is Inequality or Gini Index in Fort Ann?
Inequality or Gini Index in Fort Ann is 0.31.
How Large is the Labor Force in Fort Ann?
There are 302 People in the Labor Forcein in Fort Ann.
What is the Percentage of People in the Labor Force in Fort Ann?
74.8% of People are in the Labor Force in Fort Ann.