Falconer, NY
Falconer Map
Falconer Overview
2,193
TOTAL POPULATION
1,059
MALE POPULATION
1,134
FEMALE POPULATION
93.39
MALES / 100 FEMALES
107.08
FEMALES / 100 MALES
46.4
MEDIAN AGE
2.9
AVG FAMILY SIZE
2.2
AVG HOUSEHOLD SIZE
$27,367
PER CAPITA INCOME
$68,289
AVG FAMILY INCOME
$50,625
AVG HOUSEHOLD INCOME
35.7%
WAGE / INCOME GAP [ % ]
64.3¢/ $1
WAGE / INCOME GAP [ $ ]
0.39
INEQUALITY / GINI INDEX
1,089
LABOR FORCE [ PEOPLE ]
58.2%
PERCENT IN LABOR FORCE
7.3%
UNEMPLOYMENT RATE
Falconer Zip Codes
Falconer Area Codes
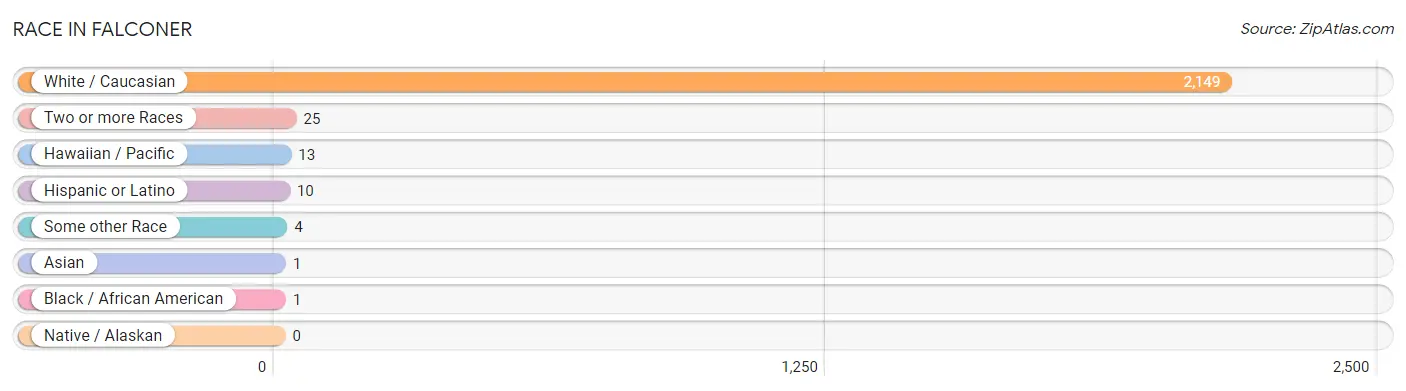
Race in Falconer
The most populous races in Falconer are White / Caucasian (2,149 | 98.0%), Two or more Races (25 | 1.1%), and Hawaiian / Pacific (13 | 0.6%).
| Race | # Population | % Population |
| Asian | 1 | 0.1% |
| Black / African American | 1 | 0.1% |
| Hawaiian / Pacific | 13 | 0.6% |
| Hispanic or Latino | 10 | 0.5% |
| Native / Alaskan | 0 | 0.0% |
| White / Caucasian | 2,149 | 98.0% |
| Two or more Races | 25 | 1.1% |
| Some other Race | 4 | 0.2% |
| Total | 2,193 | 100.0% |
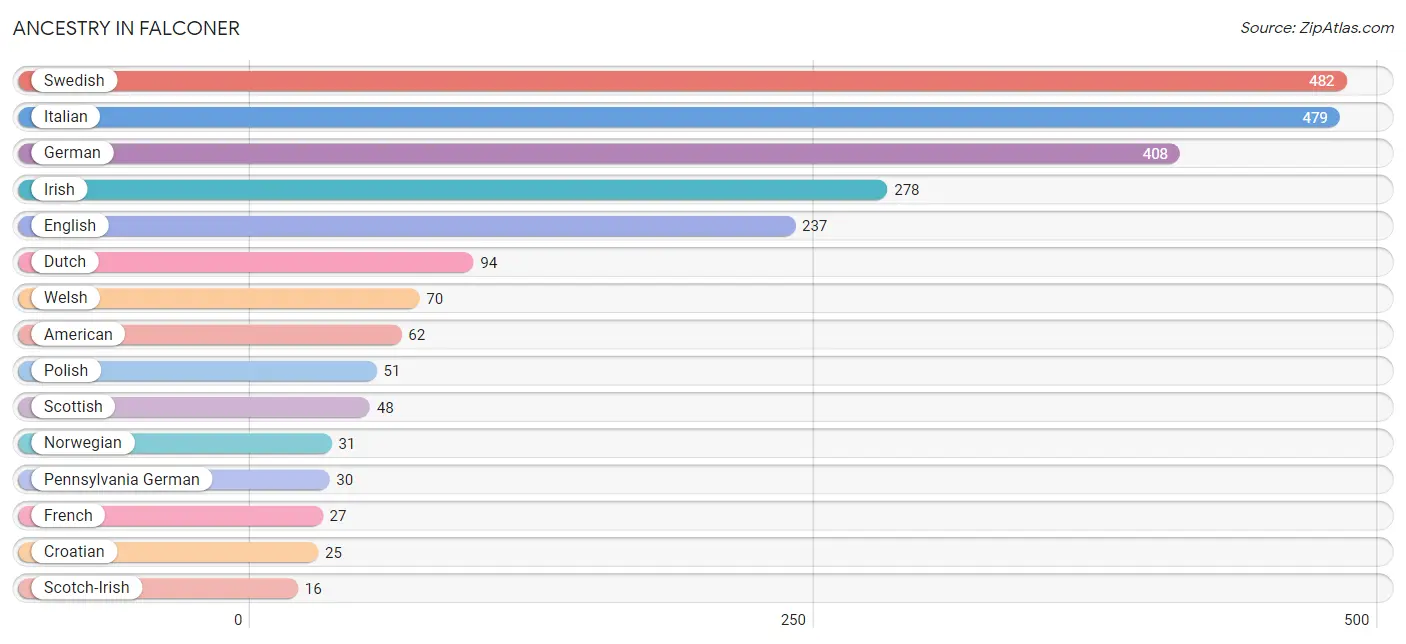
Ancestry in Falconer
The most populous ancestries reported in Falconer are Swedish (482 | 22.0%), Italian (479 | 21.8%), German (408 | 18.6%), Irish (278 | 12.7%), and English (237 | 10.8%), together accounting for 85.9% of all Falconer residents.
| Ancestry | # Population | % Population |
| American | 62 | 2.8% |
| Arab | 8 | 0.4% |
| Austrian | 7 | 0.3% |
| British | 5 | 0.2% |
| Burmese | 4 | 0.2% |
| Canadian | 6 | 0.3% |
| Celtic | 6 | 0.3% |
| Croatian | 25 | 1.1% |
| Dutch | 94 | 4.3% |
| English | 237 | 10.8% |
| French | 27 | 1.2% |
| German | 408 | 18.6% |
| Hungarian | 5 | 0.2% |
| Irish | 278 | 12.7% |
| Iroquois | 8 | 0.4% |
| Italian | 479 | 21.8% |
| Native Hawaiian | 13 | 0.6% |
| Norwegian | 31 | 1.4% |
| Pennsylvania German | 30 | 1.4% |
| Polish | 51 | 2.3% |
| Puerto Rican | 10 | 0.5% |
| Russian | 7 | 0.3% |
| Scotch-Irish | 16 | 0.7% |
| Scottish | 48 | 2.2% |
| Swedish | 482 | 22.0% |
| Swiss | 16 | 0.7% |
| Welsh | 70 | 3.2% | View All 27 Rows |
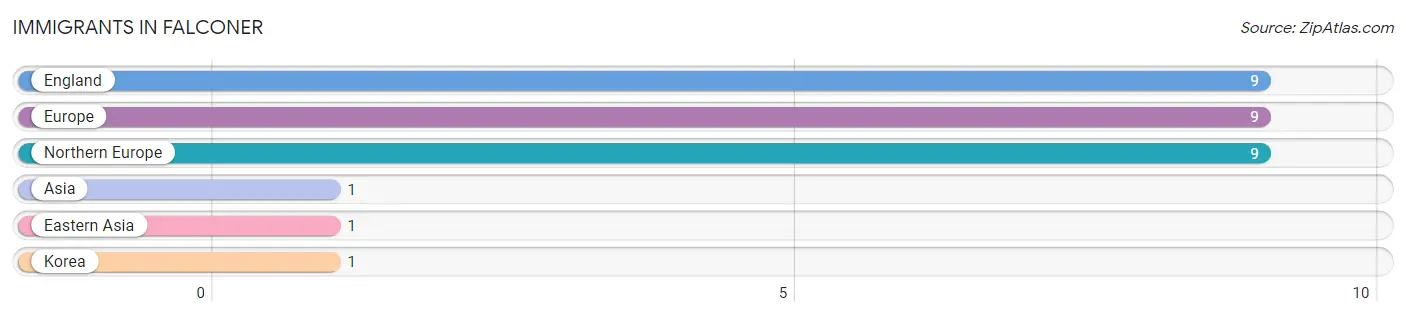
Immigrants in Falconer
The most numerous immigrant groups reported in Falconer came from England (9 | 0.4%), Europe (9 | 0.4%), Northern Europe (9 | 0.4%), Asia (1 | 0.1%), and Eastern Asia (1 | 0.1%), together accounting for 1.3% of all Falconer residents.
| Immigration Origin | # Population | % Population |
| Asia | 1 | 0.1% |
| Eastern Asia | 1 | 0.1% |
| England | 9 | 0.4% |
| Europe | 9 | 0.4% |
| Korea | 1 | 0.1% |
| Northern Europe | 9 | 0.4% | View All 6 Rows |
Sex and Age in Falconer
Sex and Age in Falconer
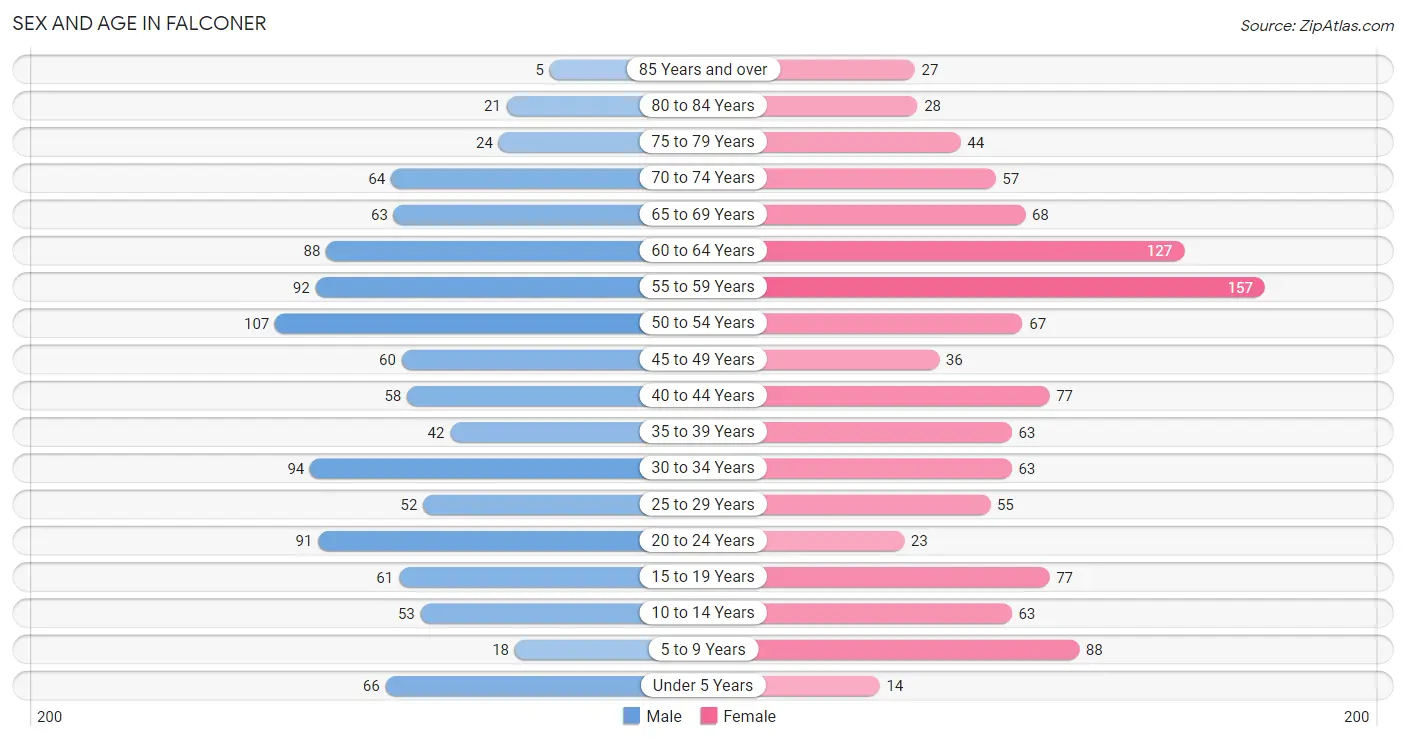
The most populous age groups in Falconer are 50 to 54 Years (107 | 10.1%) for men and 55 to 59 Years (157 | 13.8%) for women.
| Age Bracket | Male | Female |
| Under 5 Years | 66 (6.2%) | 14 (1.2%) |
| 5 to 9 Years | 18 (1.7%) | 88 (7.8%) |
| 10 to 14 Years | 53 (5.0%) | 63 (5.6%) |
| 15 to 19 Years | 61 (5.8%) | 77 (6.8%) |
| 20 to 24 Years | 91 (8.6%) | 23 (2.0%) |
| 25 to 29 Years | 52 (4.9%) | 55 (4.9%) |
| 30 to 34 Years | 94 (8.9%) | 63 (5.6%) |
| 35 to 39 Years | 42 (4.0%) | 63 (5.6%) |
| 40 to 44 Years | 58 (5.5%) | 77 (6.8%) |
| 45 to 49 Years | 60 (5.7%) | 36 (3.2%) |
| 50 to 54 Years | 107 (10.1%) | 67 (5.9%) |
| 55 to 59 Years | 92 (8.7%) | 157 (13.8%) |
| 60 to 64 Years | 88 (8.3%) | 127 (11.2%) |
| 65 to 69 Years | 63 (5.9%) | 68 (6.0%) |
| 70 to 74 Years | 64 (6.0%) | 57 (5.0%) |
| 75 to 79 Years | 24 (2.3%) | 44 (3.9%) |
| 80 to 84 Years | 21 (2.0%) | 28 (2.5%) |
| 85 Years and over | 5 (0.5%) | 27 (2.4%) |
| Total | 1,059 (100.0%) | 1,134 (100.0%) |
Families and Households in Falconer
Median Family Size in Falconer
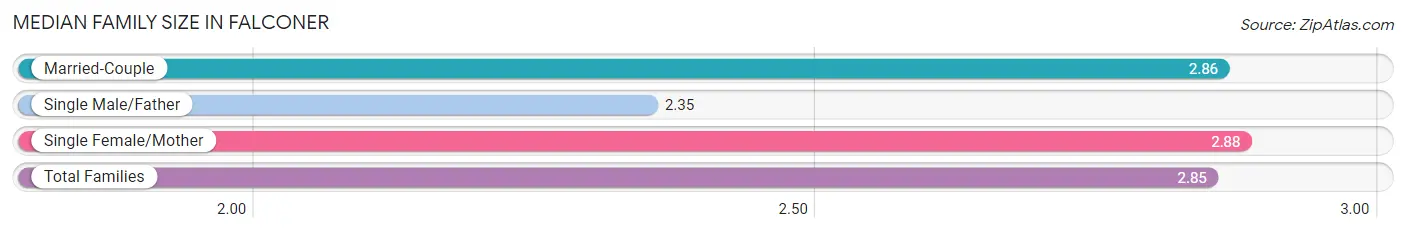
The median family size in Falconer is 2.85 persons per family, with single female/mother families (158 | 26.4%) accounting for the largest median family size of 2.88 persons per family. On the other hand, single male/father families (23 | 3.8%) represent the smallest median family size with 2.35 persons per family.
| Family Type | # Families | Family Size |
| Married-Couple | 417 (69.7%) | 2.86 |
| Single Male/Father | 23 (3.8%) | 2.35 |
| Single Female/Mother | 158 (26.4%) | 2.88 |
| Total Families | 598 (100.0%) | 2.85 |
Median Household Size in Falconer
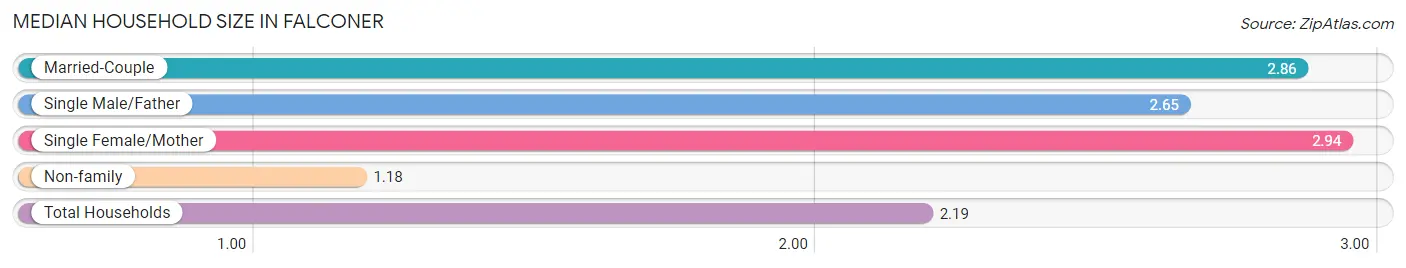
The median household size in Falconer is 2.19 persons per household, with single female/mother households (158 | 15.8%) accounting for the largest median household size of 2.94 persons per household. non-family households (402 | 40.2%) represent the smallest median household size with 1.18 persons per household.
| Household Type | # Households | Household Size |
| Married-Couple | 417 (41.7%) | 2.86 |
| Single Male/Father | 23 (2.3%) | 2.65 |
| Single Female/Mother | 158 (15.8%) | 2.94 |
| Non-family | 402 (40.2%) | 1.18 |
| Total Households | 1,000 (100.0%) | 2.19 |
Household Size by Marriage Status in Falconer
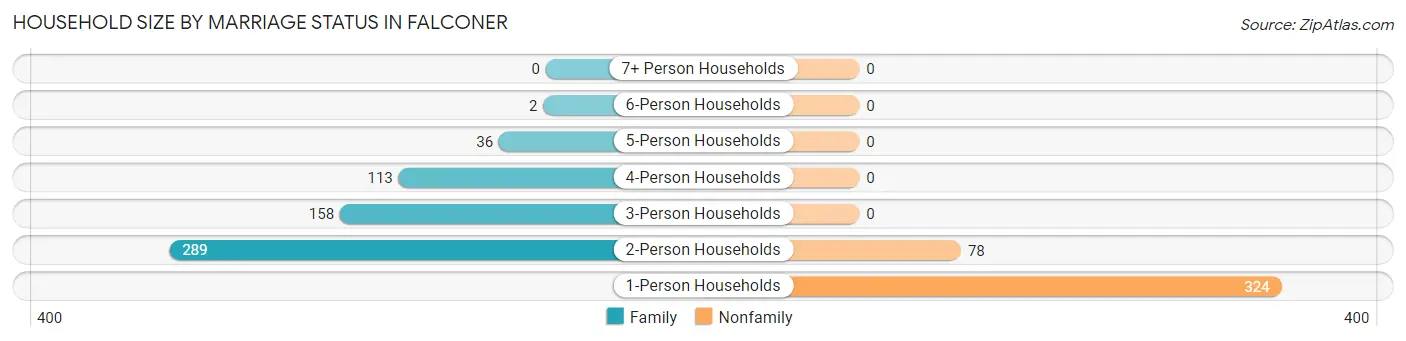
Out of a total of 1,000 households in Falconer, 598 (59.8%) are family households, while 402 (40.2%) are nonfamily households. The most numerous type of family households are 2-person households, comprising 289, and the most common type of nonfamily households are 1-person households, comprising 324.
| Household Size | Family Households | Nonfamily Households |
| 1-Person Households | - | 324 (32.4%) |
| 2-Person Households | 289 (28.9%) | 78 (7.8%) |
| 3-Person Households | 158 (15.8%) | 0 (0.0%) |
| 4-Person Households | 113 (11.3%) | 0 (0.0%) |
| 5-Person Households | 36 (3.6%) | 0 (0.0%) |
| 6-Person Households | 2 (0.2%) | 0 (0.0%) |
| 7+ Person Households | 0 (0.0%) | 0 (0.0%) |
| Total | 598 (59.8%) | 402 (40.2%) |
Female Fertility in Falconer
Fertility by Age in Falconer
Average fertility rate in Falconer is 85.0 births per 1,000 women. Women in the age bracket of 20 to 34 years have the highest fertility rate with 184.0 births per 1,000 women. Women in the age bracket of 20 to 34 years acount for 76.5% of all women with births.
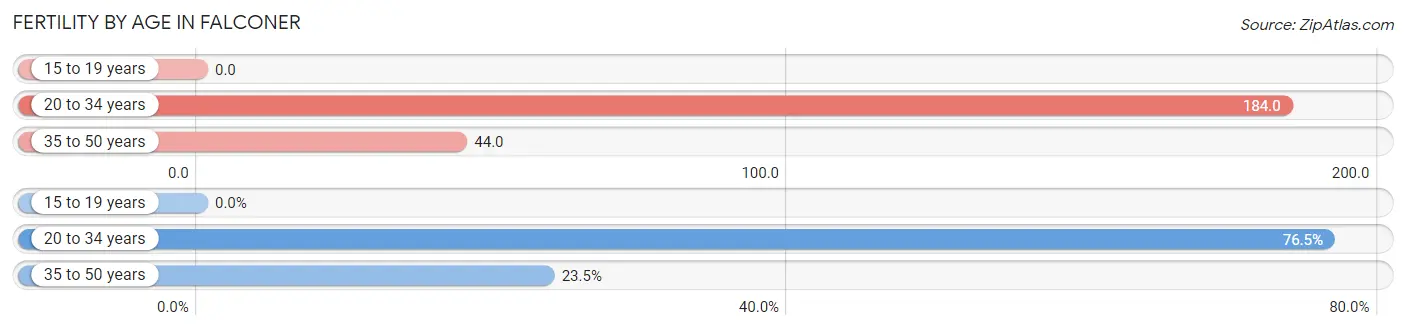
| Age Bracket | Women with Births | Births / 1,000 Women |
| 15 to 19 years | 0 (0.0%) | 0.0 |
| 20 to 34 years | 26 (76.5%) | 184.0 |
| 35 to 50 years | 8 (23.5%) | 44.0 |
| Total | 34 (100.0%) | 85.0 |
Fertility by Age by Marriage Status in Falconer
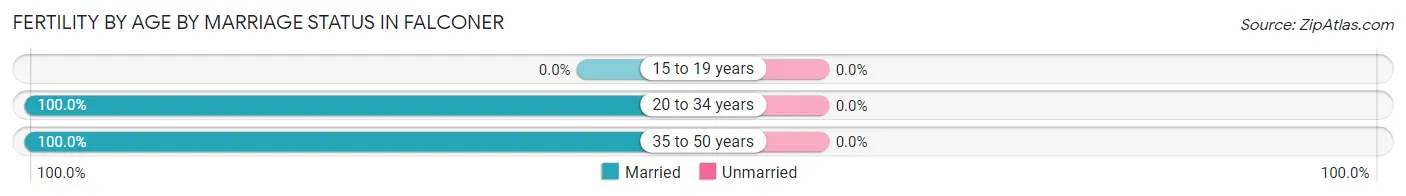
| Age Bracket | Married | Unmarried |
| 15 to 19 years | 0 (0.0%) | 0 (0.0%) |
| 20 to 34 years | 26 (100.0%) | 0 (0.0%) |
| 35 to 50 years | 8 (100.0%) | 0 (0.0%) |
| Total | 34 (100.0%) | 0 (0.0%) |
Fertility by Education in Falconer
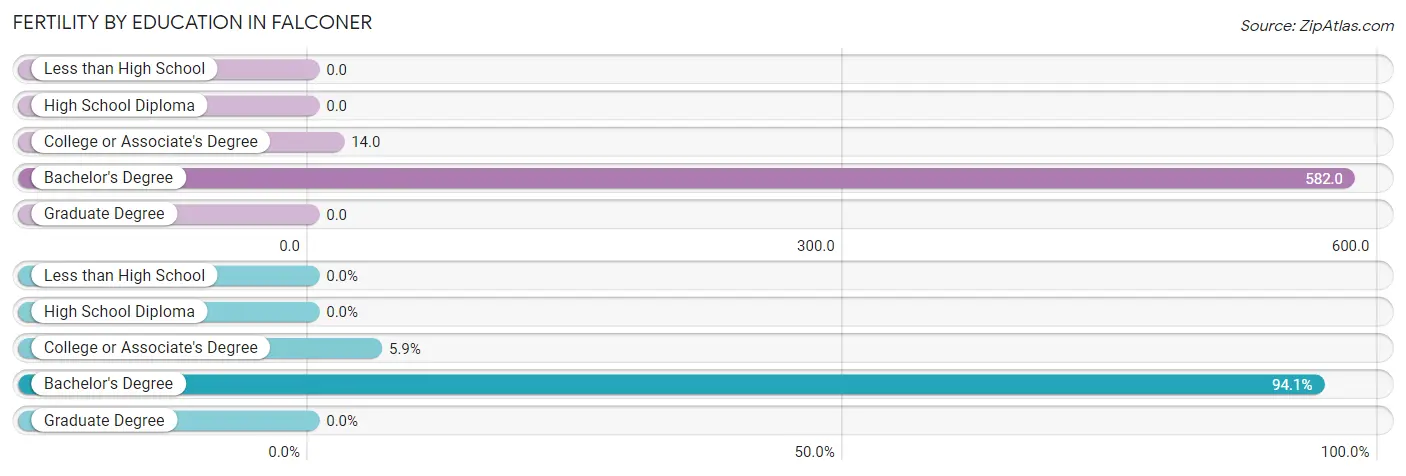
| Educational Attainment | Women with Births | Births / 1,000 Women |
| Less than High School | 0 (0.0%) | 0.0 |
| High School Diploma | 0 (0.0%) | 0.0 |
| College or Associate's Degree | 2 (5.9%) | 14.0 |
| Bachelor's Degree | 32 (94.1%) | 582.0 |
| Graduate Degree | 0 (0.0%) | 0.0 |
| Total | 34 (100.0%) | 85.0 |
Fertility by Education by Marriage Status in Falconer
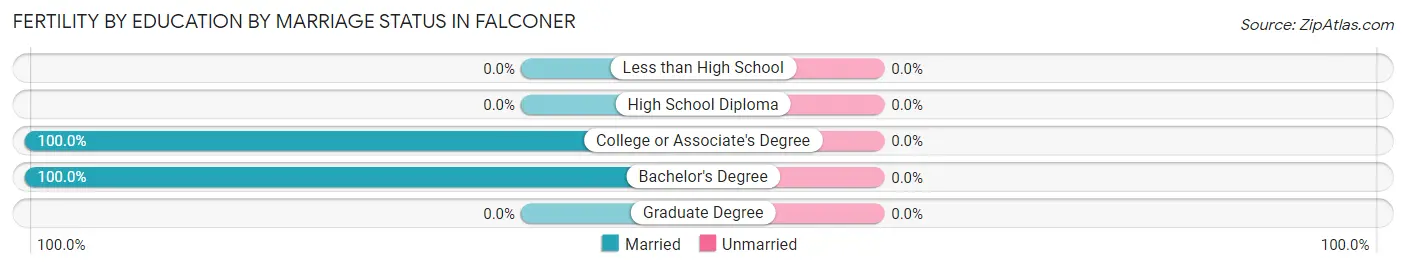
| Educational Attainment | Married | Unmarried |
| Less than High School | 0 (0.0%) | 0 (0.0%) |
| High School Diploma | 0 (0.0%) | 0 (0.0%) |
| College or Associate's Degree | 2 (100.0%) | 0 (0.0%) |
| Bachelor's Degree | 32 (100.0%) | 0 (0.0%) |
| Graduate Degree | 0 (0.0%) | 0 (0.0%) |
| Total | 34 (100.0%) | 0 (0.0%) |
Income in Falconer
Income Overview in Falconer
Per Capita Income in Falconer is $27,367, while median incomes of families and households are $68,289 and $50,625 respectively.
| Characteristic | Number | Measure |
| Per Capita Income | 2,193 | $27,367 |
| Median Family Income | 598 | $68,289 |
| Mean Family Income | 598 | $72,909 |
| Median Household Income | 1,000 | $50,625 |
| Mean Household Income | 1,000 | $59,851 |
| Income Deficit | 598 | $0 |
| Wage / Income Gap (%) | 2,193 | 35.71% |
| Wage / Income Gap ($) | 2,193 | 64.29¢ per $1 |
| Gini / Inequality Index | 2,193 | 0.39 |
Earnings by Sex in Falconer
Average Earnings in Falconer are $29,808, $40,792 for men and $26,224 for women, a difference of 35.7%.
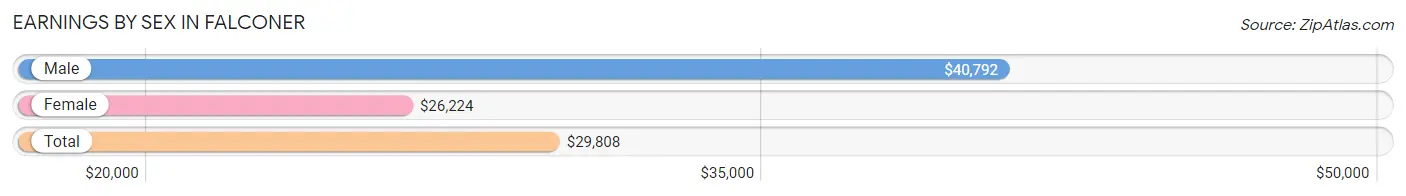
| Sex | Number | Average Earnings |
| Male | 563 (47.9%) | $40,792 |
| Female | 613 (52.1%) | $26,224 |
| Total | 1,176 (100.0%) | $29,808 |
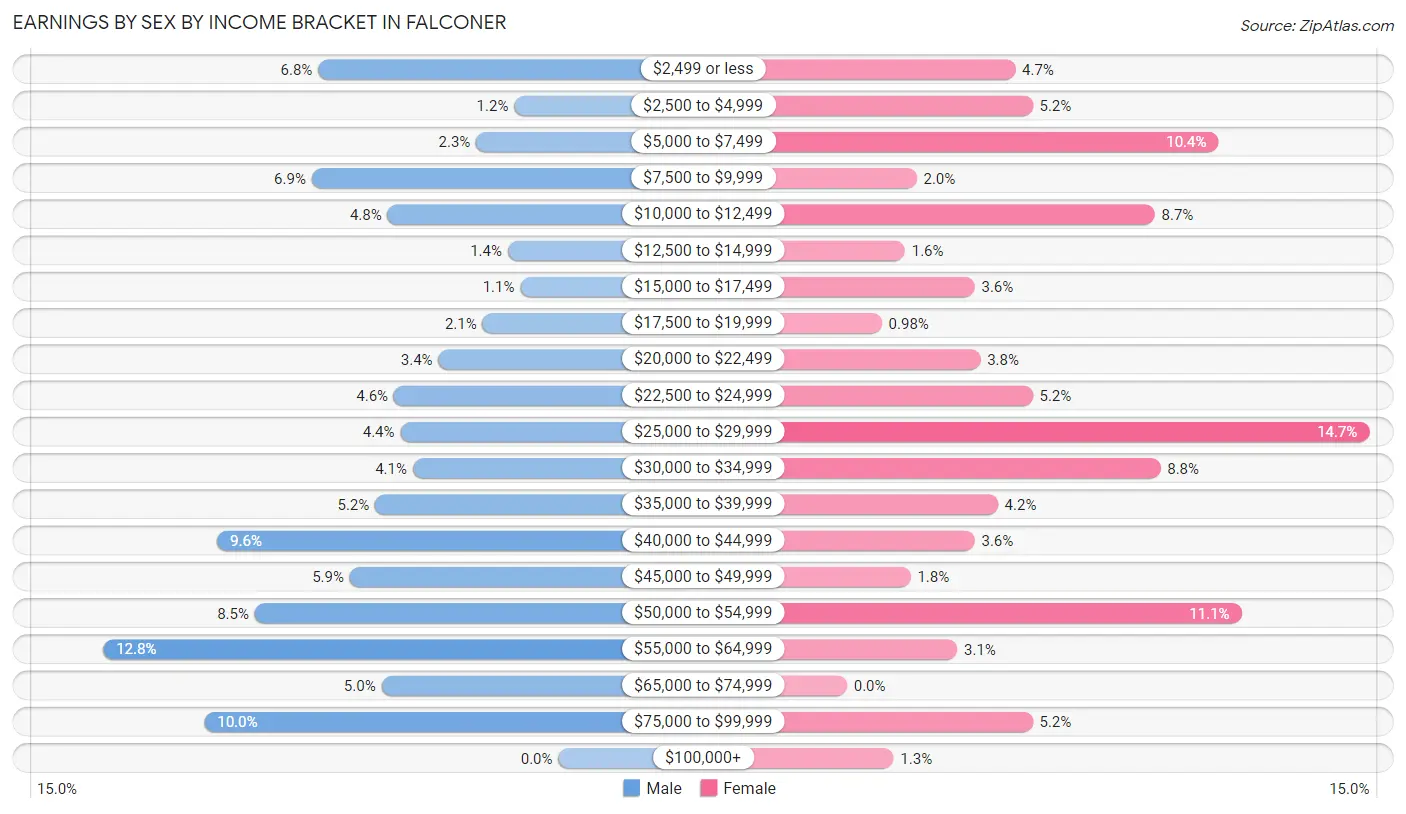
Earnings by Sex by Income Bracket in Falconer
The most common earnings brackets in Falconer are $55,000 to $64,999 for men (72 | 12.8%) and $25,000 to $29,999 for women (90 | 14.7%).
| Income | Male | Female |
| $2,499 or less | 38 (6.8%) | 29 (4.7%) |
| $2,500 to $4,999 | 7 (1.2%) | 32 (5.2%) |
| $5,000 to $7,499 | 13 (2.3%) | 64 (10.4%) |
| $7,500 to $9,999 | 39 (6.9%) | 12 (2.0%) |
| $10,000 to $12,499 | 27 (4.8%) | 53 (8.6%) |
| $12,500 to $14,999 | 8 (1.4%) | 10 (1.6%) |
| $15,000 to $17,499 | 6 (1.1%) | 22 (3.6%) |
| $17,500 to $19,999 | 12 (2.1%) | 6 (1.0%) |
| $20,000 to $22,499 | 19 (3.4%) | 23 (3.7%) |
| $22,500 to $24,999 | 26 (4.6%) | 32 (5.2%) |
| $25,000 to $29,999 | 25 (4.4%) | 90 (14.7%) |
| $30,000 to $34,999 | 23 (4.1%) | 54 (8.8%) |
| $35,000 to $39,999 | 29 (5.1%) | 26 (4.2%) |
| $40,000 to $44,999 | 54 (9.6%) | 22 (3.6%) |
| $45,000 to $49,999 | 33 (5.9%) | 11 (1.8%) |
| $50,000 to $54,999 | 48 (8.5%) | 68 (11.1%) |
| $55,000 to $64,999 | 72 (12.8%) | 19 (3.1%) |
| $65,000 to $74,999 | 28 (5.0%) | 0 (0.0%) |
| $75,000 to $99,999 | 56 (10.0%) | 32 (5.2%) |
| $100,000+ | 0 (0.0%) | 8 (1.3%) |
| Total | 563 (100.0%) | 613 (100.0%) |
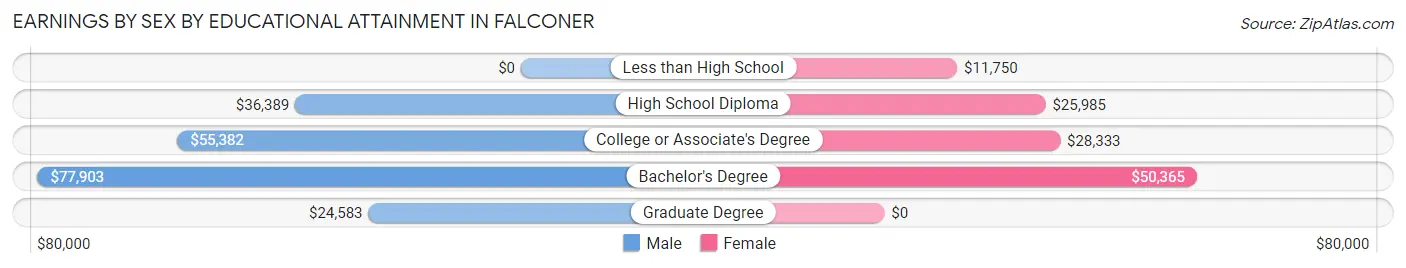
Earnings by Sex by Educational Attainment in Falconer
Average earnings in Falconer are $43,281 for men and $27,500 for women, a difference of 36.5%. Men with an educational attainment of bachelor's degree enjoy the highest average annual earnings of $77,903, while those with graduate degree education earn the least with $24,583. Women with an educational attainment of bachelor's degree earn the most with the average annual earnings of $50,365, while those with less than high school education have the smallest earnings of $11,750.
| Educational Attainment | Male Income | Female Income |
| Less than High School | - | - |
| High School Diploma | $36,389 | $25,985 |
| College or Associate's Degree | $55,382 | $28,333 |
| Bachelor's Degree | $77,903 | $50,365 |
| Graduate Degree | $24,583 | $0 |
| Total | $43,281 | $27,500 |
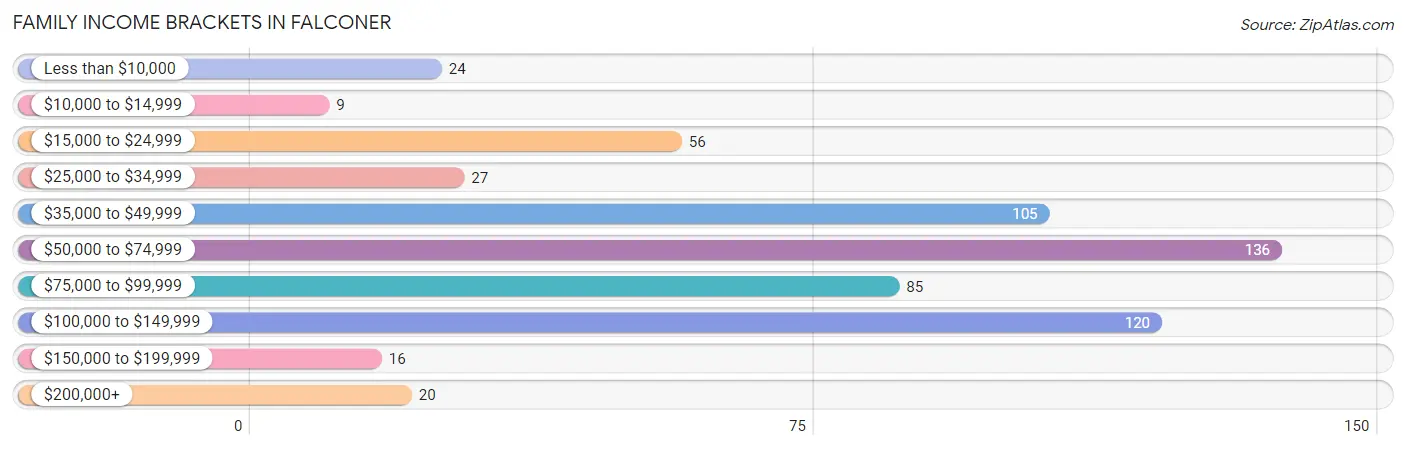
Family Income in Falconer
Family Income Brackets in Falconer
According to the Falconer family income data, there are 136 families falling into the $50,000 to $74,999 income range, which is the most common income bracket and makes up 22.7% of all families. Conversely, the $10,000 to $14,999 income bracket is the least frequent group with only 9 families (1.5%) belonging to this category.
| Income Bracket | # Families | % Families |
| Less than $10,000 | 24 | 4.0% |
| $10,000 to $14,999 | 9 | 1.5% |
| $15,000 to $24,999 | 56 | 9.4% |
| $25,000 to $34,999 | 27 | 4.5% |
| $35,000 to $49,999 | 105 | 17.6% |
| $50,000 to $74,999 | 136 | 22.7% |
| $75,000 to $99,999 | 85 | 14.2% |
| $100,000 to $149,999 | 120 | 20.1% |
| $150,000 to $199,999 | 16 | 2.7% |
| $200,000+ | 20 | 3.3% |
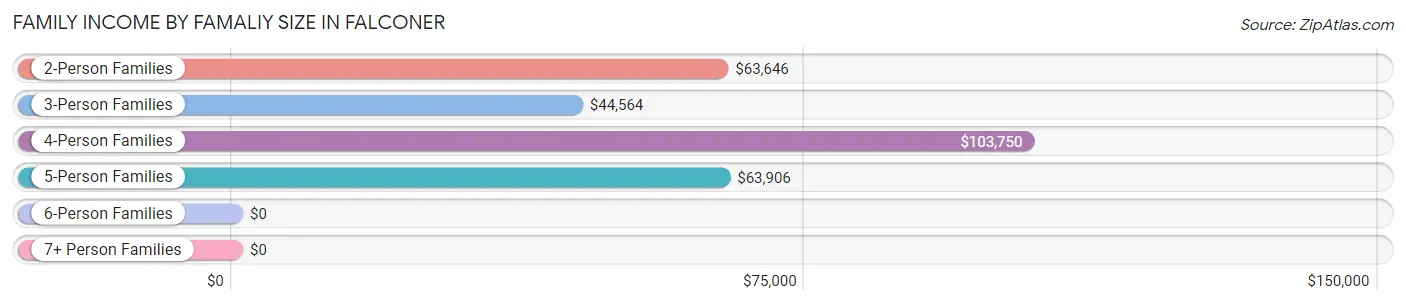
Family Income by Famaliy Size in Falconer
4-person families (115 | 19.2%) account for the highest median family income in Falconer with $103,750 per family, while 2-person families (289 | 48.3%) have the highest median income of $31,823 per family member.
| Income Bracket | # Families | Median Income |
| 2-Person Families | 289 (48.3%) | $63,646 |
| 3-Person Families | 165 (27.6%) | $44,564 |
| 4-Person Families | 115 (19.2%) | $103,750 |
| 5-Person Families | 27 (4.5%) | $63,906 |
| 6-Person Families | 2 (0.3%) | $0 |
| 7+ Person Families | 0 (0.0%) | $0 |
| Total | 598 (100.0%) | $68,289 |
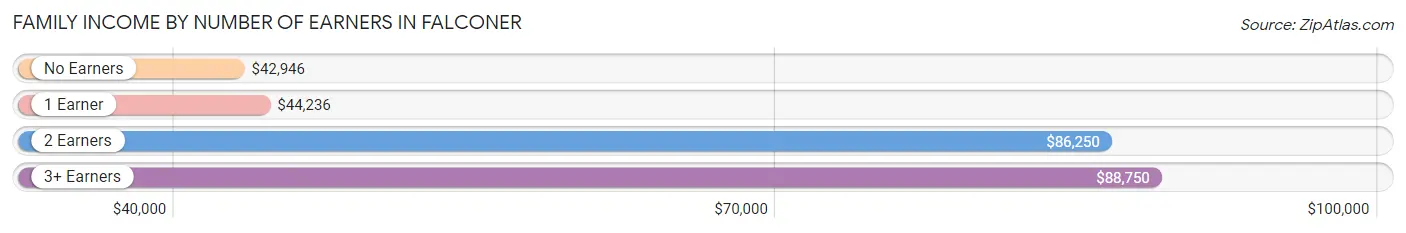
Family Income by Number of Earners in Falconer
The median family income in Falconer is $68,289, with families comprising 3+ earners (53) having the highest median family income of $88,750, while families with no earners (107) have the lowest median family income of $42,946, accounting for 8.9% and 17.9% of families, respectively.
| Number of Earners | # Families | Median Income |
| No Earners | 107 (17.9%) | $42,946 |
| 1 Earner | 214 (35.8%) | $44,236 |
| 2 Earners | 224 (37.5%) | $86,250 |
| 3+ Earners | 53 (8.9%) | $88,750 |
| Total | 598 (100.0%) | $68,289 |
Household Income in Falconer
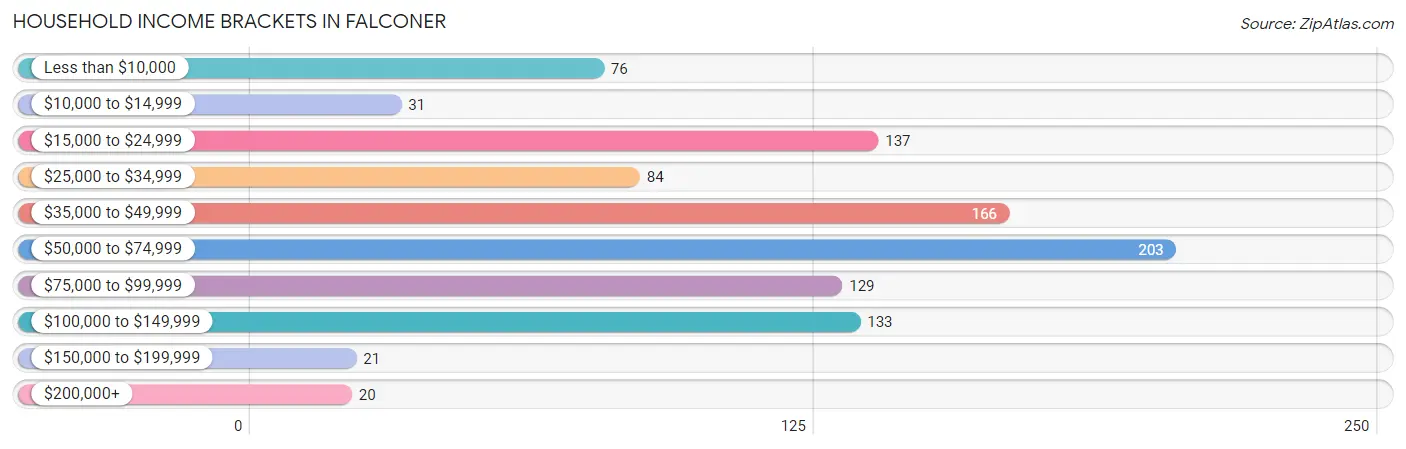
Household Income Brackets in Falconer
With 203 households falling in the category, the $50,000 to $74,999 income range is the most frequent in Falconer, accounting for 20.3% of all households. In contrast, only 20 households (2.0%) fall into the $200,000+ income bracket, making it the least populous group.
| Income Bracket | # Households | % Households |
| Less than $10,000 | 76 | 7.6% |
| $10,000 to $14,999 | 31 | 3.1% |
| $15,000 to $24,999 | 137 | 13.7% |
| $25,000 to $34,999 | 84 | 8.4% |
| $35,000 to $49,999 | 166 | 16.6% |
| $50,000 to $74,999 | 203 | 20.3% |
| $75,000 to $99,999 | 129 | 12.9% |
| $100,000 to $149,999 | 133 | 13.3% |
| $150,000 to $199,999 | 21 | 2.1% |
| $200,000+ | 20 | 2.0% |
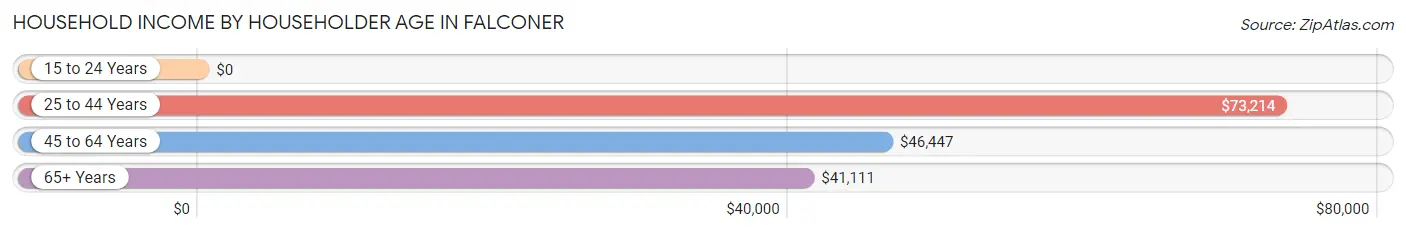
Household Income by Householder Age in Falconer
The median household income in Falconer is $50,625, with the highest median household income of $73,214 found in the 25 to 44 years age bracket for the primary householder. A total of 264 households (26.4%) fall into this category. Meanwhile, the 15 to 24 years age bracket for the primary householder has the lowest median household income of $0, with 20 households (2.0%) in this group.
| Income Bracket | # Households | Median Income |
| 15 to 24 Years | 20 (2.0%) | $0 |
| 25 to 44 Years | 264 (26.4%) | $73,214 |
| 45 to 64 Years | 476 (47.6%) | $46,447 |
| 65+ Years | 240 (24.0%) | $41,111 |
| Total | 1,000 (100.0%) | $50,625 |
Poverty in Falconer
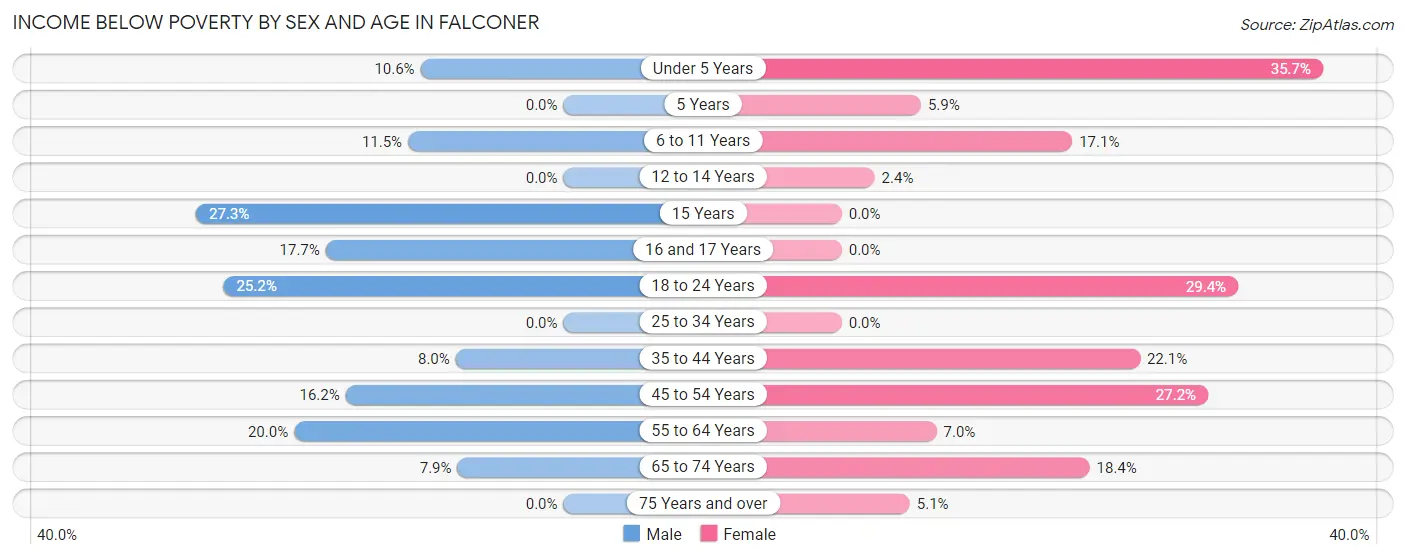
Income Below Poverty by Sex and Age in Falconer
With 12.3% poverty level for males and 13.1% for females among the residents of Falconer, 15 year old males and under 5 year old females are the most vulnerable to poverty, with 3 males (27.3%) and 5 females (35.7%) in their respective age groups living below the poverty level.
| Age Bracket | Male | Female |
| Under 5 Years | 7 (10.6%) | 5 (35.7%) |
| 5 Years | 0 (0.0%) | 2 (5.9%) |
| 6 to 11 Years | 6 (11.5%) | 13 (17.1%) |
| 12 to 14 Years | 0 (0.0%) | 1 (2.4%) |
| 15 Years | 3 (27.3%) | 0 (0.0%) |
| 16 and 17 Years | 6 (17.6%) | 0 (0.0%) |
| 18 to 24 Years | 27 (25.2%) | 20 (29.4%) |
| 25 to 34 Years | 0 (0.0%) | 0 (0.0%) |
| 35 to 44 Years | 8 (8.0%) | 31 (22.1%) |
| 45 to 54 Years | 27 (16.2%) | 28 (27.2%) |
| 55 to 64 Years | 36 (20.0%) | 20 (7.0%) |
| 65 to 74 Years | 10 (7.9%) | 23 (18.4%) |
| 75 Years and over | 0 (0.0%) | 5 (5.1%) |
| Total | 130 (12.3%) | 148 (13.1%) |
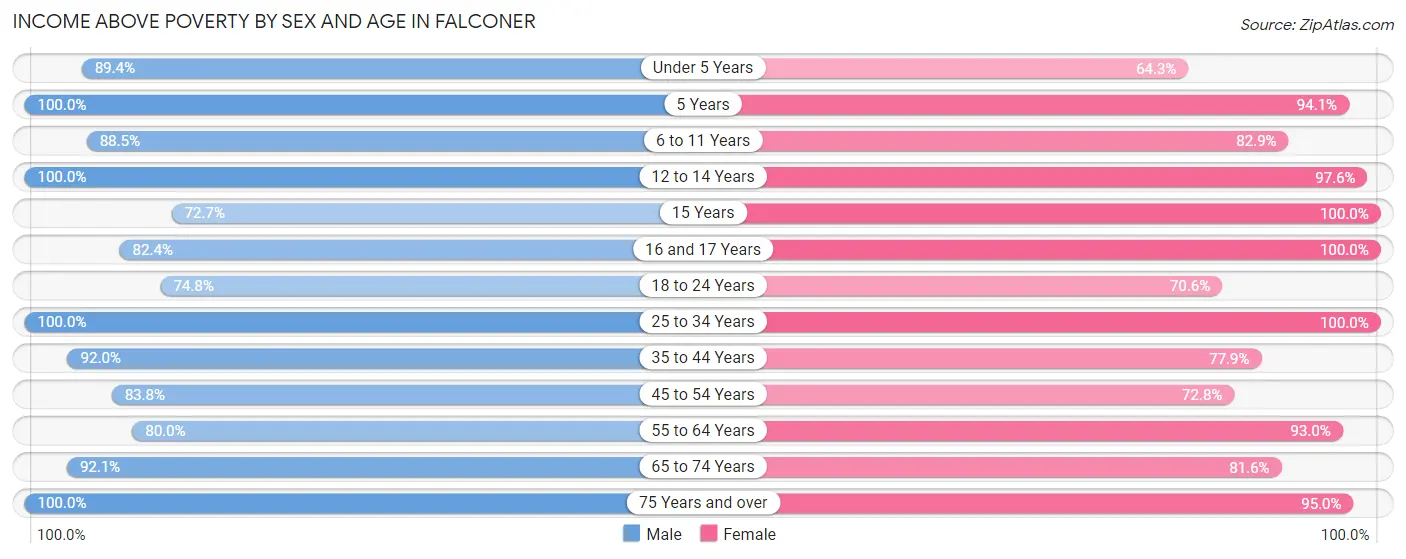
Income Above Poverty by Sex and Age in Falconer
According to the poverty statistics in Falconer, males aged 5 years and females aged 15 years are the age groups that are most secure financially, with 100.0% of males and 100.0% of females in these age groups living above the poverty line.
| Age Bracket | Male | Female |
| Under 5 Years | 59 (89.4%) | 9 (64.3%) |
| 5 Years | 10 (100.0%) | 32 (94.1%) |
| 6 to 11 Years | 46 (88.5%) | 63 (82.9%) |
| 12 to 14 Years | 9 (100.0%) | 40 (97.6%) |
| 15 Years | 8 (72.7%) | 9 (100.0%) |
| 16 and 17 Years | 28 (82.4%) | 23 (100.0%) |
| 18 to 24 Years | 80 (74.8%) | 48 (70.6%) |
| 25 to 34 Years | 146 (100.0%) | 118 (100.0%) |
| 35 to 44 Years | 92 (92.0%) | 109 (77.9%) |
| 45 to 54 Years | 140 (83.8%) | 75 (72.8%) |
| 55 to 64 Years | 144 (80.0%) | 264 (93.0%) |
| 65 to 74 Years | 117 (92.1%) | 102 (81.6%) |
| 75 Years and over | 50 (100.0%) | 94 (95.0%) |
| Total | 929 (87.7%) | 986 (87.0%) |
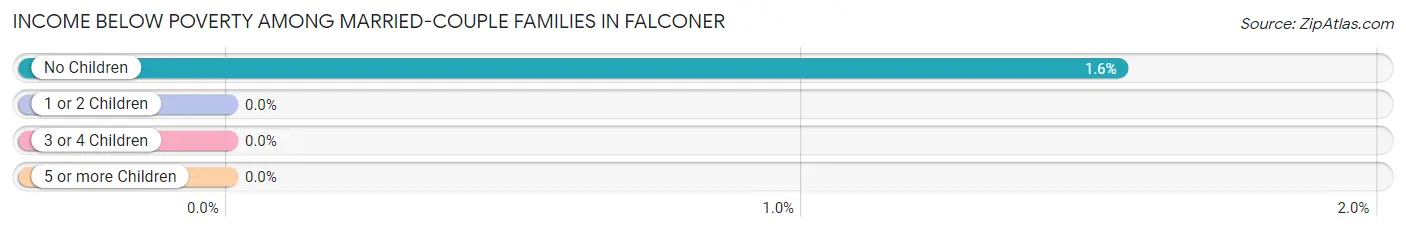
Income Below Poverty Among Married-Couple Families in Falconer
The poverty statistics for married-couple families in Falconer show that 1.0% or 4 of the total 417 families live below the poverty line. Families with no children have the highest poverty rate of 1.5%, comprising of 4 families. On the other hand, families with 1 or 2 children have the lowest poverty rate of 0.0%, which includes 0 families.
| Children | Above Poverty | Below Poverty |
| No Children | 254 (98.5%) | 4 (1.5%) |
| 1 or 2 Children | 149 (100.0%) | 0 (0.0%) |
| 3 or 4 Children | 10 (100.0%) | 0 (0.0%) |
| 5 or more Children | 0 (0.0%) | 0 (0.0%) |
| Total | 413 (99.0%) | 4 (1.0%) |
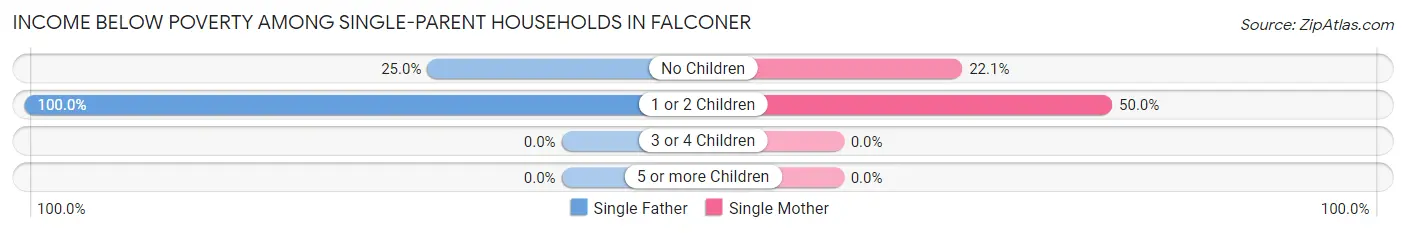
Income Below Poverty Among Single-Parent Households in Falconer
According to the poverty data in Falconer, 47.8% or 11 single-father households and 33.5% or 53 single-mother households are living below the poverty line. Among single-father households, those with 1 or 2 children have the highest poverty rate, with 7 households (100.0%) experiencing poverty. Likewise, among single-mother households, those with 1 or 2 children have the highest poverty rate, with 36 households (50.0%) falling below the poverty line.
| Children | Single Father | Single Mother |
| No Children | 4 (25.0%) | 17 (22.1%) |
| 1 or 2 Children | 7 (100.0%) | 36 (50.0%) |
| 3 or 4 Children | 0 (0.0%) | 0 (0.0%) |
| 5 or more Children | 0 (0.0%) | 0 (0.0%) |
| Total | 11 (47.8%) | 53 (33.5%) |
Income Below Poverty Among Married-Couple vs Single-Parent Households in Falconer
The poverty data for Falconer shows that 4 of the married-couple family households (1.0%) and 64 of the single-parent households (35.4%) are living below the poverty level. Within the married-couple family households, those with no children have the highest poverty rate, with 4 households (1.5%) falling below the poverty line. Among the single-parent households, those with 1 or 2 children have the highest poverty rate, with 43 household (54.4%) living below poverty.
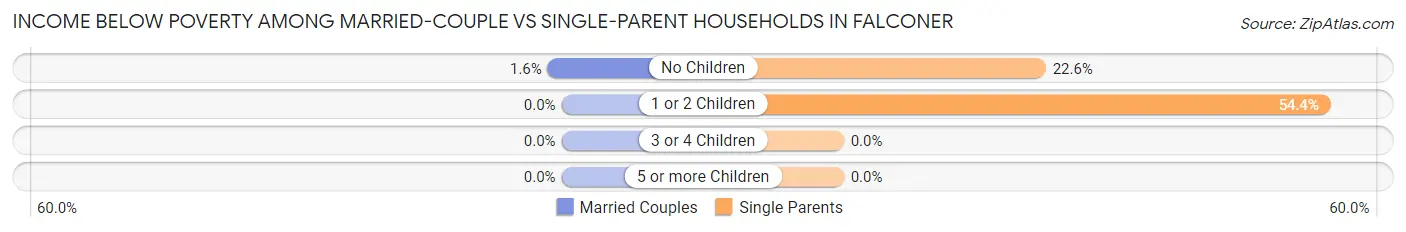
| Children | Married-Couple Families | Single-Parent Households |
| No Children | 4 (1.5%) | 21 (22.6%) |
| 1 or 2 Children | 0 (0.0%) | 43 (54.4%) |
| 3 or 4 Children | 0 (0.0%) | 0 (0.0%) |
| 5 or more Children | 0 (0.0%) | 0 (0.0%) |
| Total | 4 (1.0%) | 64 (35.4%) |
Employment Characteristics in Falconer
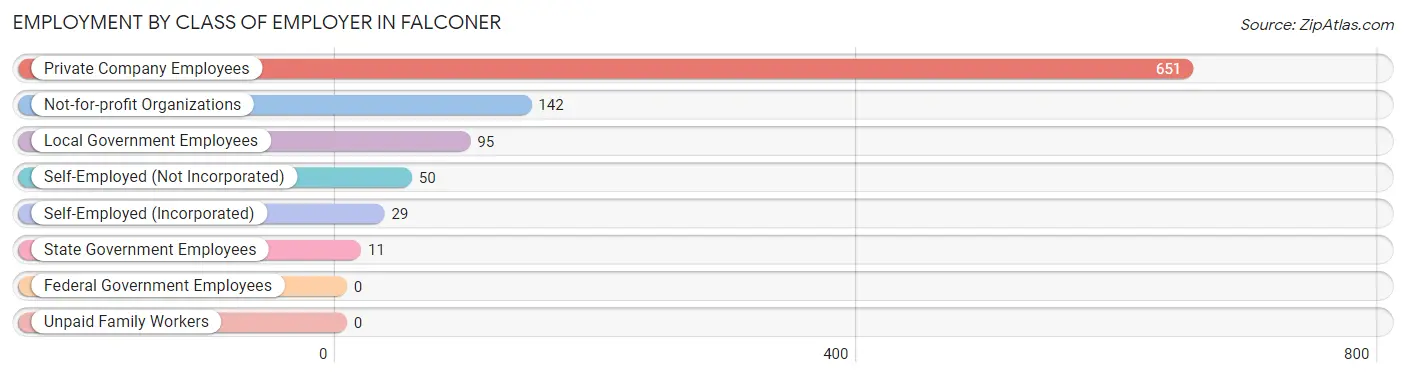
Employment by Class of Employer in Falconer
Among the 978 employed individuals in Falconer, private company employees (651 | 66.6%), not-for-profit organizations (142 | 14.5%), and local government employees (95 | 9.7%) make up the most common classes of employment.
| Employer Class | # Employees | % Employees |
| Private Company Employees | 651 | 66.6% |
| Self-Employed (Incorporated) | 29 | 3.0% |
| Self-Employed (Not Incorporated) | 50 | 5.1% |
| Not-for-profit Organizations | 142 | 14.5% |
| Local Government Employees | 95 | 9.7% |
| State Government Employees | 11 | 1.1% |
| Federal Government Employees | 0 | 0.0% |
| Unpaid Family Workers | 0 | 0.0% |
| Total | 978 | 100.0% |
Employment Status by Age in Falconer
According to the labor force statistics for Falconer, out of the total population over 16 years of age (1,871), 58.2% or 1,089 individuals are in the labor force, with 7.3% or 79 of them unemployed. The age group with the highest labor force participation rate is 20 to 24 years, with 91.2% or 104 individuals in the labor force. Within the labor force, the 20 to 24 years age range has the highest percentage of unemployed individuals, with 38.5% or 40 of them being unemployed.
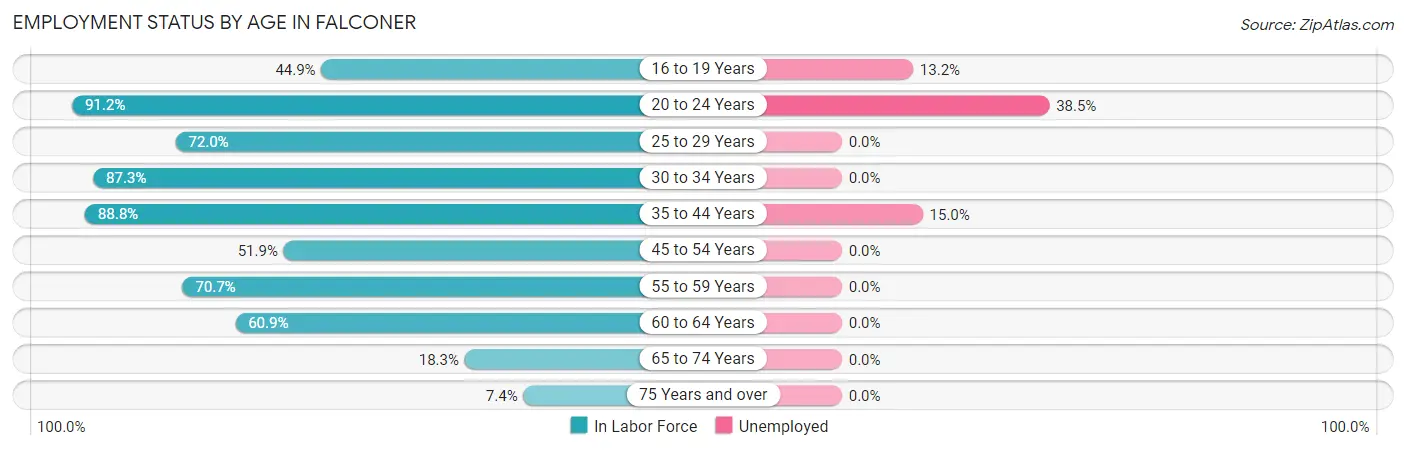
| Age Bracket | In Labor Force | Unemployed |
| 16 to 19 Years | 53 (44.9%) | 7 (13.2%) |
| 20 to 24 Years | 104 (91.2%) | 40 (38.5%) |
| 25 to 29 Years | 77 (72.0%) | 0 (0.0%) |
| 30 to 34 Years | 137 (87.3%) | 0 (0.0%) |
| 35 to 44 Years | 213 (88.8%) | 32 (15.0%) |
| 45 to 54 Years | 140 (51.9%) | 0 (0.0%) |
| 55 to 59 Years | 176 (70.7%) | 0 (0.0%) |
| 60 to 64 Years | 131 (60.9%) | 0 (0.0%) |
| 65 to 74 Years | 46 (18.3%) | 0 (0.0%) |
| 75 Years and over | 11 (7.4%) | 0 (0.0%) |
| Total | 1,089 (58.2%) | 79 (7.3%) |
Employment Status by Educational Attainment in Falconer
According to labor force statistics for Falconer, 70.6% of individuals (874) out of the total population between 25 and 64 years of age (1,238) are in the labor force, with 3.7% or 32 of them being unemployed. The group with the highest labor force participation rate are those with the educational attainment of bachelor's degree or higher, with 88.0% or 161 individuals in the labor force. Within the labor force, individuals with less than high school education have the highest percentage of unemployment, with 35.9% or 23 of them being unemployed.
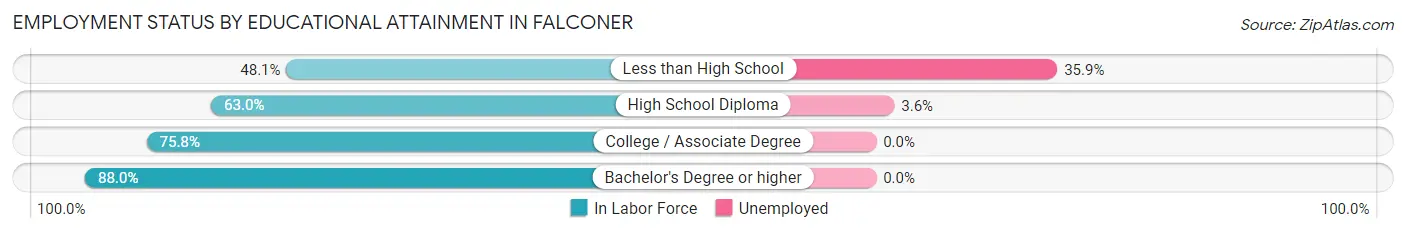
| Educational Attainment | In Labor Force | Unemployed |
| Less than High School | 64 (48.1%) | 48 (35.9%) |
| High School Diploma | 247 (63.0%) | 14 (3.6%) |
| College / Associate Degree | 402 (75.8%) | 0 (0.0%) |
| Bachelor's Degree or higher | 161 (88.0%) | 0 (0.0%) |
| Total | 874 (70.6%) | 46 (3.7%) |
Employment Occupations by Sex in Falconer
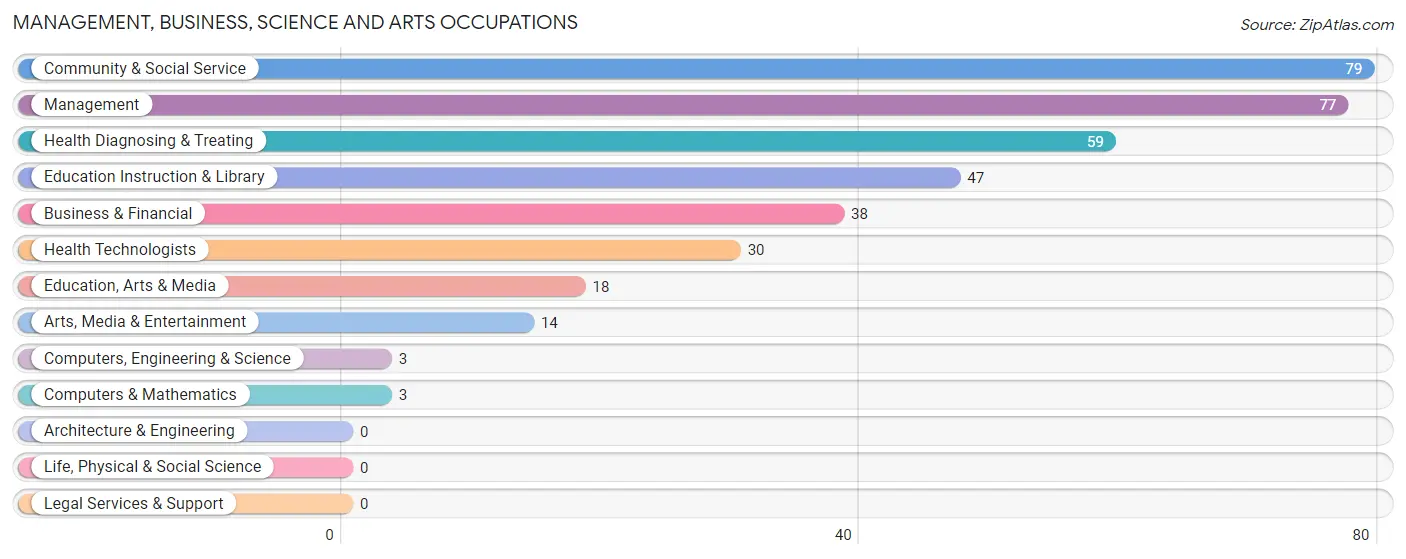
Management, Business, Science and Arts Occupations
The most common Management, Business, Science and Arts occupations in Falconer are Community & Social Service (79 | 7.8%), Management (77 | 7.6%), Health Diagnosing & Treating (59 | 5.9%), Education Instruction & Library (47 | 4.7%), and Business & Financial (38 | 3.8%).
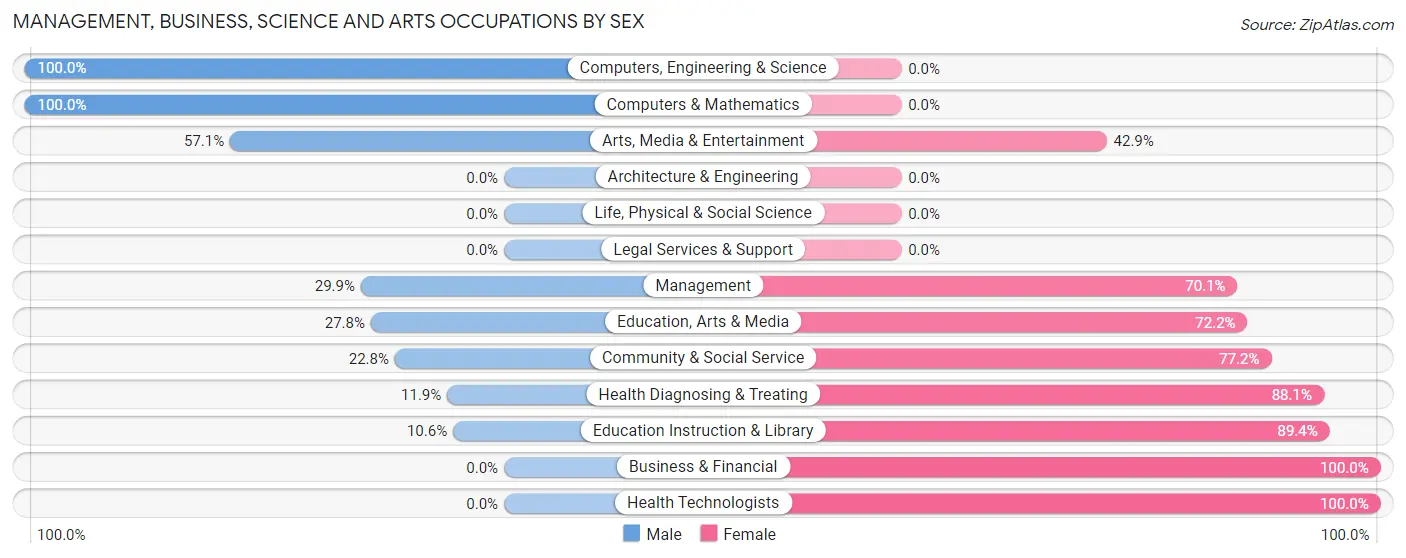
Management, Business, Science and Arts Occupations by Sex
Within the Management, Business, Science and Arts occupations in Falconer, the most male-oriented occupations are Computers, Engineering & Science (100.0%), Computers & Mathematics (100.0%), and Arts, Media & Entertainment (57.1%), while the most female-oriented occupations are Business & Financial (100.0%), Health Technologists (100.0%), and Education Instruction & Library (89.4%).
| Occupation | Male | Female |
| Management | 23 (29.9%) | 54 (70.1%) |
| Business & Financial | 0 (0.0%) | 38 (100.0%) |
| Computers, Engineering & Science | 3 (100.0%) | 0 (0.0%) |
| Computers & Mathematics | 3 (100.0%) | 0 (0.0%) |
| Architecture & Engineering | 0 (0.0%) | 0 (0.0%) |
| Life, Physical & Social Science | 0 (0.0%) | 0 (0.0%) |
| Community & Social Service | 18 (22.8%) | 61 (77.2%) |
| Education, Arts & Media | 5 (27.8%) | 13 (72.2%) |
| Legal Services & Support | 0 (0.0%) | 0 (0.0%) |
| Education Instruction & Library | 5 (10.6%) | 42 (89.4%) |
| Arts, Media & Entertainment | 8 (57.1%) | 6 (42.9%) |
| Health Diagnosing & Treating | 7 (11.9%) | 52 (88.1%) |
| Health Technologists | 0 (0.0%) | 30 (100.0%) |
| Total (Category) | 51 (19.9%) | 205 (80.1%) |
| Total (Overall) | 467 (46.3%) | 542 (53.7%) |
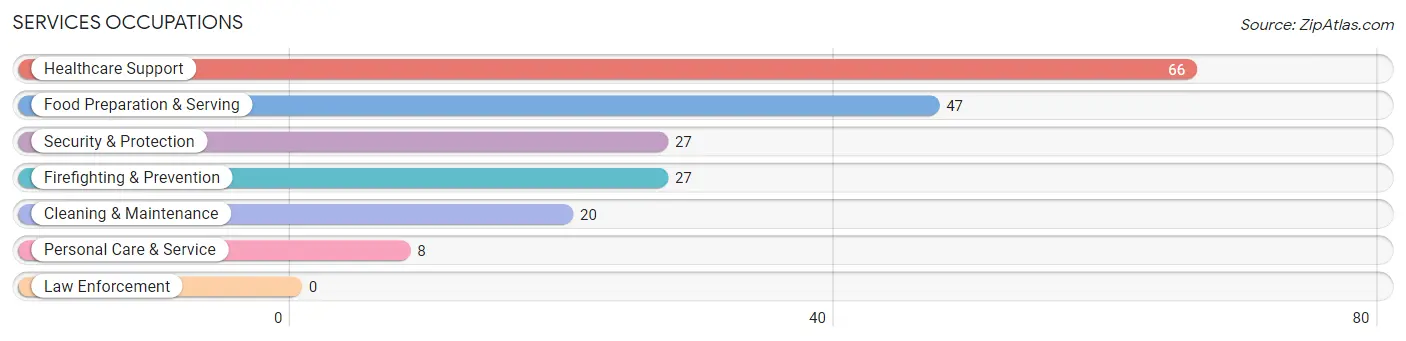
Services Occupations
The most common Services occupations in Falconer are Healthcare Support (66 | 6.5%), Food Preparation & Serving (47 | 4.7%), Security & Protection (27 | 2.7%), Firefighting & Prevention (27 | 2.7%), and Cleaning & Maintenance (20 | 2.0%).
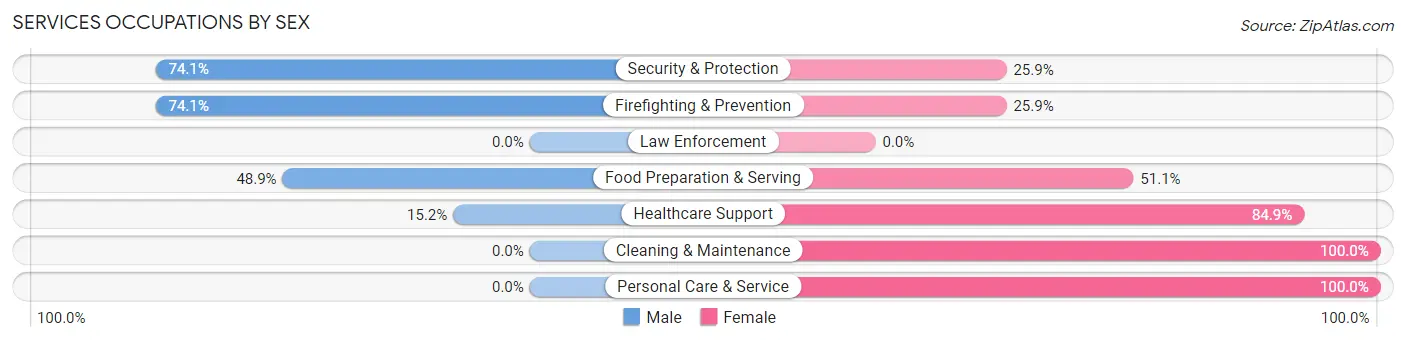
Services Occupations by Sex
Within the Services occupations in Falconer, the most male-oriented occupations are Security & Protection (74.1%), Firefighting & Prevention (74.1%), and Food Preparation & Serving (48.9%), while the most female-oriented occupations are Cleaning & Maintenance (100.0%), Personal Care & Service (100.0%), and Healthcare Support (84.9%).
| Occupation | Male | Female |
| Healthcare Support | 10 (15.1%) | 56 (84.9%) |
| Security & Protection | 20 (74.1%) | 7 (25.9%) |
| Firefighting & Prevention | 20 (74.1%) | 7 (25.9%) |
| Law Enforcement | 0 (0.0%) | 0 (0.0%) |
| Food Preparation & Serving | 23 (48.9%) | 24 (51.1%) |
| Cleaning & Maintenance | 0 (0.0%) | 20 (100.0%) |
| Personal Care & Service | 0 (0.0%) | 8 (100.0%) |
| Total (Category) | 53 (31.6%) | 115 (68.4%) |
| Total (Overall) | 467 (46.3%) | 542 (53.7%) |
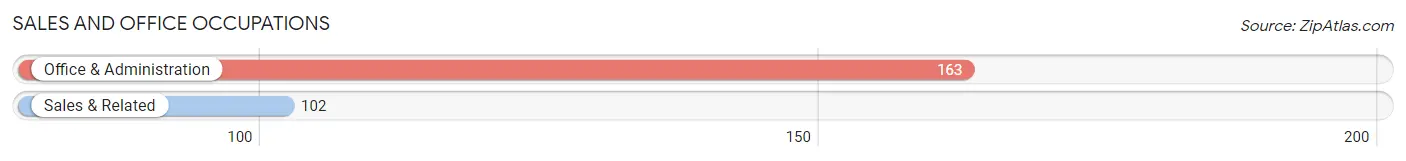
Sales and Office Occupations
The most common Sales and Office occupations in Falconer are Office & Administration (163 | 16.2%), and Sales & Related (102 | 10.1%).
Sales and Office Occupations by Sex
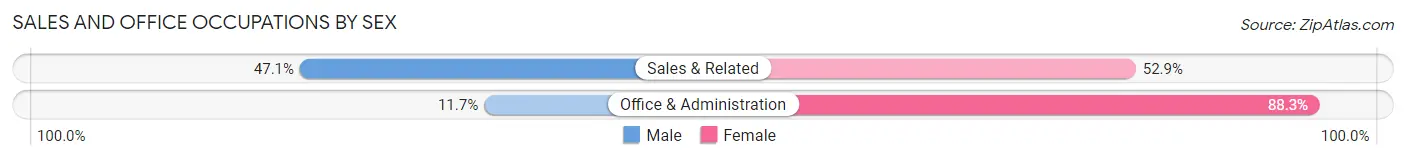
| Occupation | Male | Female |
| Sales & Related | 48 (47.1%) | 54 (52.9%) |
| Office & Administration | 19 (11.7%) | 144 (88.3%) |
| Total (Category) | 67 (25.3%) | 198 (74.7%) |
| Total (Overall) | 467 (46.3%) | 542 (53.7%) |
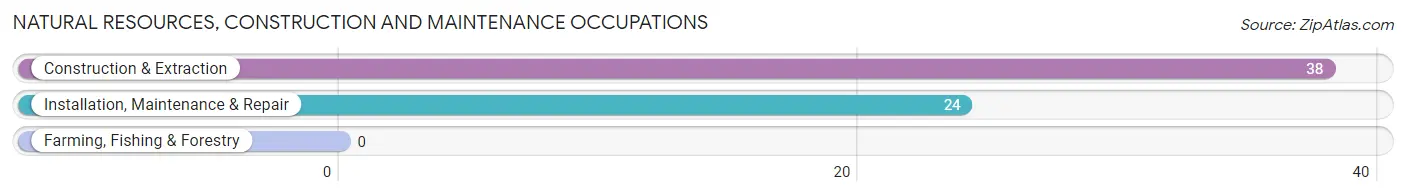
Natural Resources, Construction and Maintenance Occupations
The most common Natural Resources, Construction and Maintenance occupations in Falconer are Construction & Extraction (38 | 3.8%), and Installation, Maintenance & Repair (24 | 2.4%).
Natural Resources, Construction and Maintenance Occupations by Sex
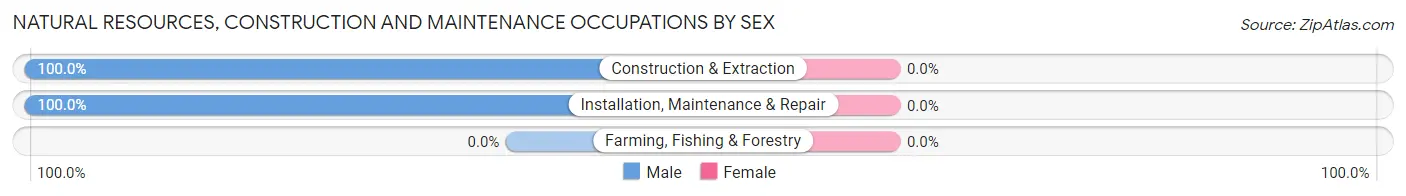
| Occupation | Male | Female |
| Farming, Fishing & Forestry | 0 (0.0%) | 0 (0.0%) |
| Construction & Extraction | 38 (100.0%) | 0 (0.0%) |
| Installation, Maintenance & Repair | 24 (100.0%) | 0 (0.0%) |
| Total (Category) | 62 (100.0%) | 0 (0.0%) |
| Total (Overall) | 467 (46.3%) | 542 (53.7%) |
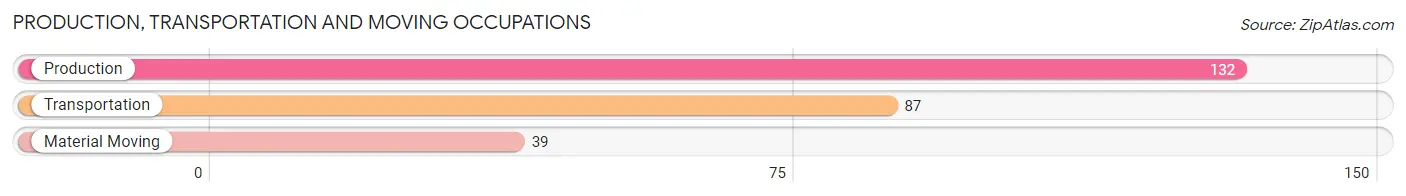
Production, Transportation and Moving Occupations
The most common Production, Transportation and Moving occupations in Falconer are Production (132 | 13.1%), Transportation (87 | 8.6%), and Material Moving (39 | 3.9%).
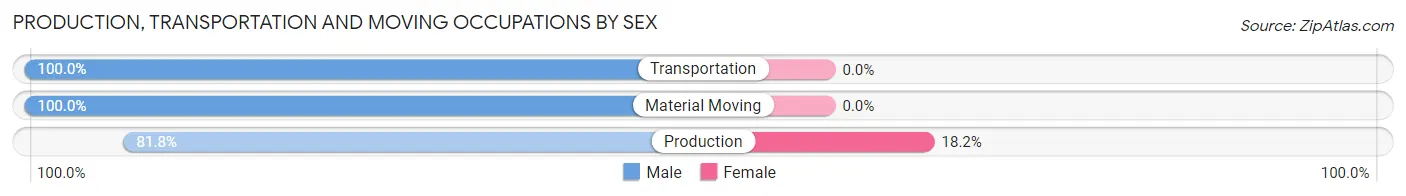
Production, Transportation and Moving Occupations by Sex
| Occupation | Male | Female |
| Production | 108 (81.8%) | 24 (18.2%) |
| Transportation | 87 (100.0%) | 0 (0.0%) |
| Material Moving | 39 (100.0%) | 0 (0.0%) |
| Total (Category) | 234 (90.7%) | 24 (9.3%) |
| Total (Overall) | 467 (46.3%) | 542 (53.7%) |
Employment Industries by Sex in Falconer
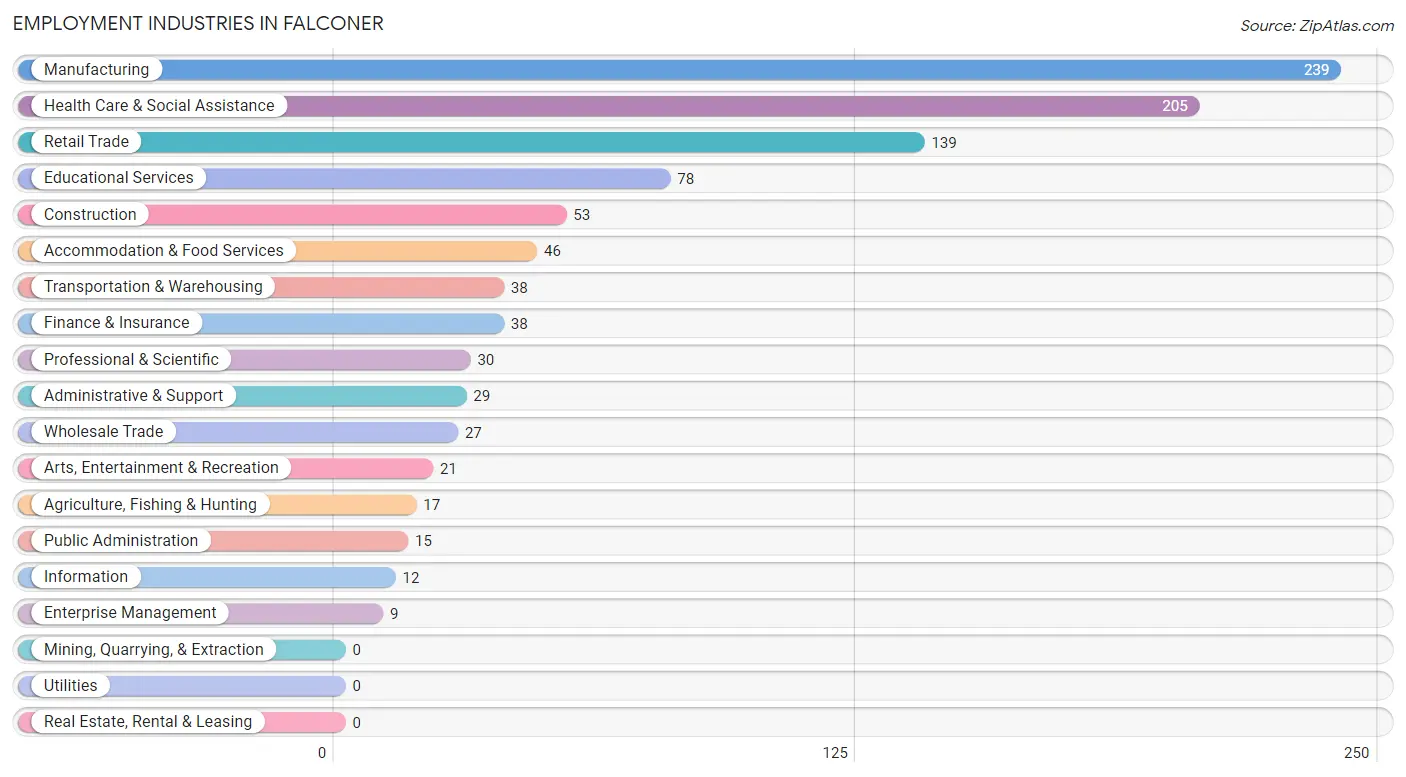
Employment Industries in Falconer
The major employment industries in Falconer include Manufacturing (239 | 23.7%), Health Care & Social Assistance (205 | 20.3%), Retail Trade (139 | 13.8%), Educational Services (78 | 7.7%), and Construction (53 | 5.2%).
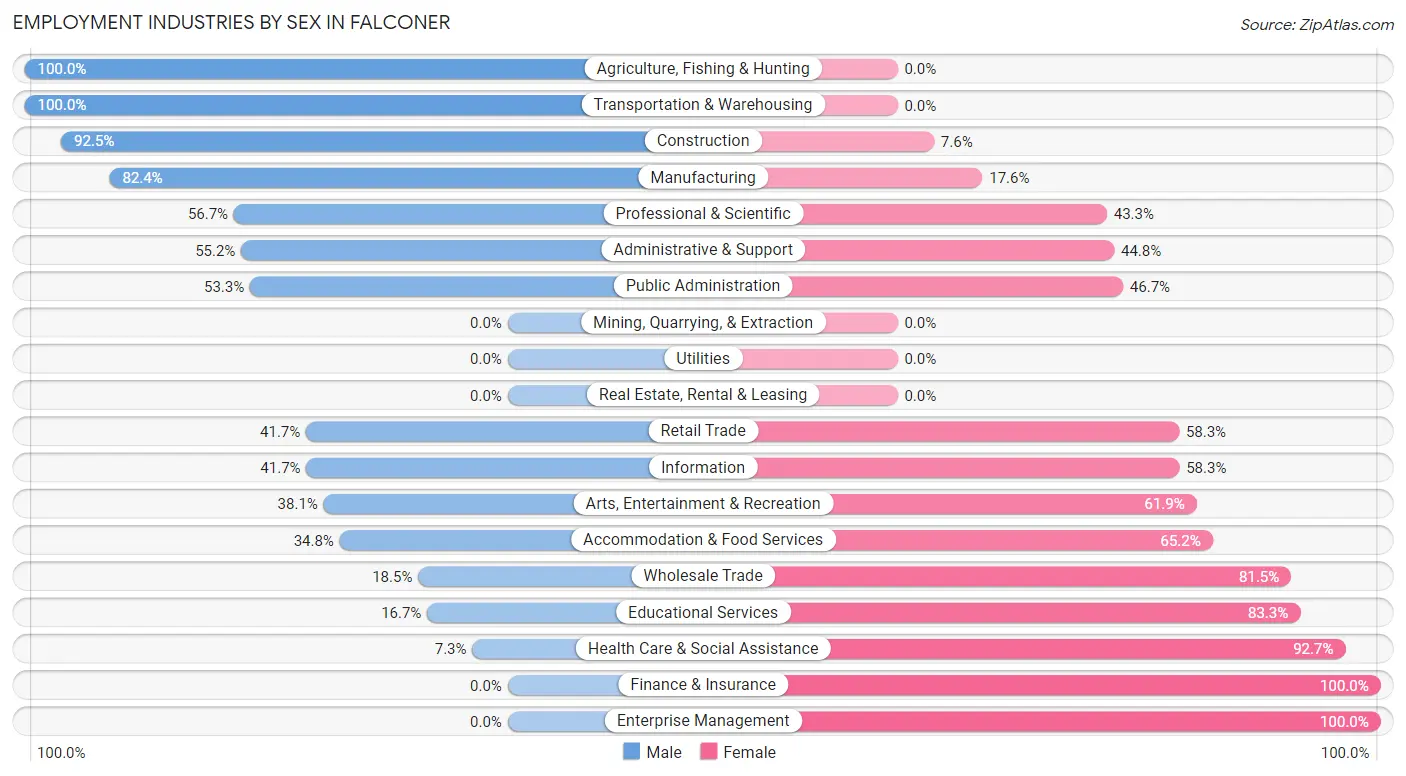
Employment Industries by Sex in Falconer
The Falconer industries that see more men than women are Agriculture, Fishing & Hunting (100.0%), Transportation & Warehousing (100.0%), and Construction (92.4%), whereas the industries that tend to have a higher number of women are Finance & Insurance (100.0%), Enterprise Management (100.0%), and Health Care & Social Assistance (92.7%).
| Industry | Male | Female |
| Agriculture, Fishing & Hunting | 17 (100.0%) | 0 (0.0%) |
| Mining, Quarrying, & Extraction | 0 (0.0%) | 0 (0.0%) |
| Construction | 49 (92.4%) | 4 (7.5%) |
| Manufacturing | 197 (82.4%) | 42 (17.6%) |
| Wholesale Trade | 5 (18.5%) | 22 (81.5%) |
| Retail Trade | 58 (41.7%) | 81 (58.3%) |
| Transportation & Warehousing | 38 (100.0%) | 0 (0.0%) |
| Utilities | 0 (0.0%) | 0 (0.0%) |
| Information | 5 (41.7%) | 7 (58.3%) |
| Finance & Insurance | 0 (0.0%) | 38 (100.0%) |
| Real Estate, Rental & Leasing | 0 (0.0%) | 0 (0.0%) |
| Professional & Scientific | 17 (56.7%) | 13 (43.3%) |
| Enterprise Management | 0 (0.0%) | 9 (100.0%) |
| Administrative & Support | 16 (55.2%) | 13 (44.8%) |
| Educational Services | 13 (16.7%) | 65 (83.3%) |
| Health Care & Social Assistance | 15 (7.3%) | 190 (92.7%) |
| Arts, Entertainment & Recreation | 8 (38.1%) | 13 (61.9%) |
| Accommodation & Food Services | 16 (34.8%) | 30 (65.2%) |
| Public Administration | 8 (53.3%) | 7 (46.7%) |
| Total | 467 (46.3%) | 542 (53.7%) |
Education in Falconer
School Enrollment in Falconer
The most common levels of schooling among the 418 students in Falconer are middle school (109 | 26.1%), high school (108 | 25.8%), and college / undergraduate (77 | 18.4%).
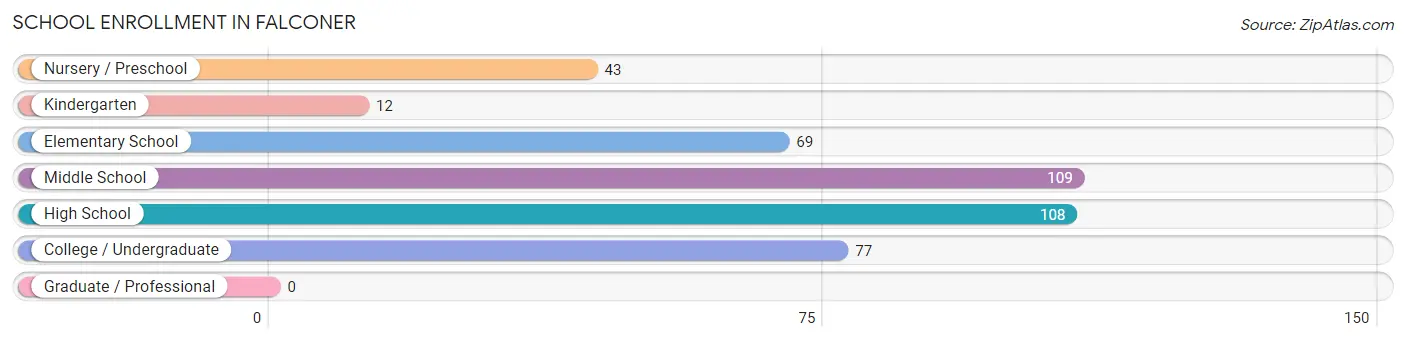
| School Level | # Students | % Students |
| Nursery / Preschool | 43 | 10.3% |
| Kindergarten | 12 | 2.9% |
| Elementary School | 69 | 16.5% |
| Middle School | 109 | 26.1% |
| High School | 108 | 25.8% |
| College / Undergraduate | 77 | 18.4% |
| Graduate / Professional | 0 | 0.0% |
| Total | 418 | 100.0% |
School Enrollment by Age by Funding Source in Falconer
Out of a total of 418 students who are enrolled in schools in Falconer, 15 (3.6%) attend a private institution, while the remaining 403 (96.4%) are enrolled in public schools. The age group of 18 to 19 year olds has the highest likelihood of being enrolled in private schools, with 7 (30.4% in the age bracket) enrolled. Conversely, the age group of 3 to 4 year olds has the lowest likelihood of being enrolled in a private school, with 11 (100.0% in the age bracket) attending a public institution.
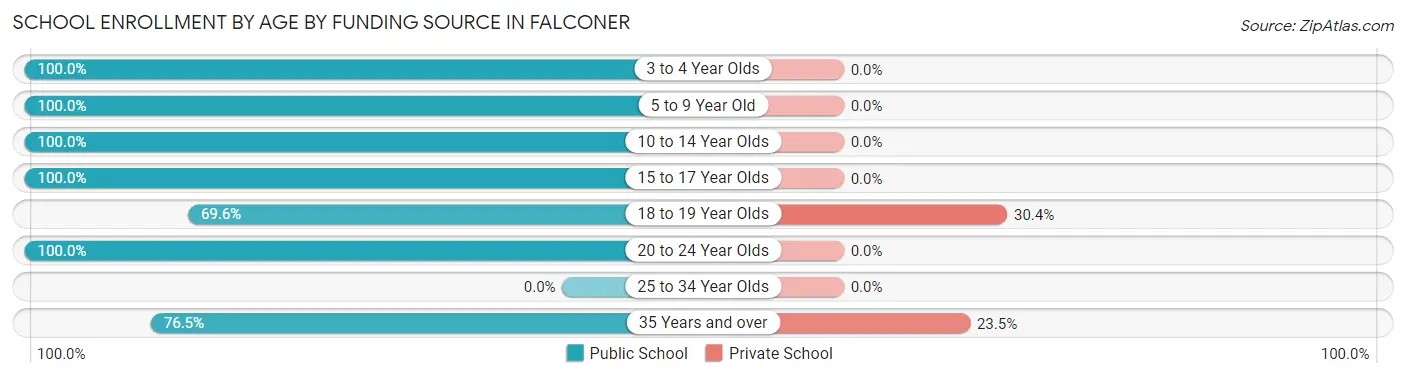
| Age Bracket | Public School | Private School |
| 3 to 4 Year Olds | 11 (100.0%) | 0 (0.0%) |
| 5 to 9 Year Old | 106 (100.0%) | 0 (0.0%) |
| 10 to 14 Year Olds | 116 (100.0%) | 0 (0.0%) |
| 15 to 17 Year Olds | 77 (100.0%) | 0 (0.0%) |
| 18 to 19 Year Olds | 16 (69.6%) | 7 (30.4%) |
| 20 to 24 Year Olds | 51 (100.0%) | 0 (0.0%) |
| 25 to 34 Year Olds | 0 (0.0%) | 0 (0.0%) |
| 35 Years and over | 26 (76.5%) | 8 (23.5%) |
| Total | 403 (96.4%) | 15 (3.6%) |
Educational Attainment by Field of Study in Falconer
Education (56 | 18.3%), bio, nature & agricultural (44 | 14.4%), physical & health sciences (44 | 14.4%), liberal arts & history (33 | 10.8%), and business (32 | 10.5%) are the most common fields of study among 306 individuals in Falconer who have obtained a bachelor's degree or higher.
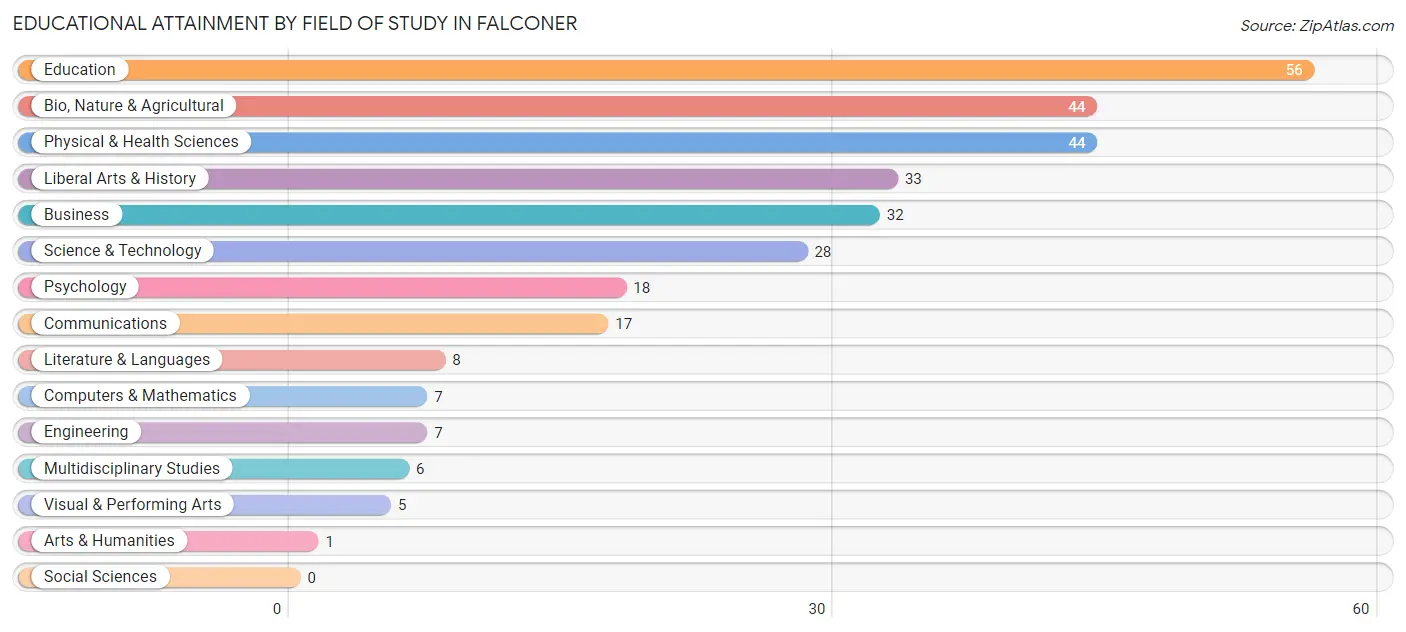
| Field of Study | # Graduates | % Graduates |
| Computers & Mathematics | 7 | 2.3% |
| Bio, Nature & Agricultural | 44 | 14.4% |
| Physical & Health Sciences | 44 | 14.4% |
| Psychology | 18 | 5.9% |
| Social Sciences | 0 | 0.0% |
| Engineering | 7 | 2.3% |
| Multidisciplinary Studies | 6 | 2.0% |
| Science & Technology | 28 | 9.1% |
| Business | 32 | 10.5% |
| Education | 56 | 18.3% |
| Literature & Languages | 8 | 2.6% |
| Liberal Arts & History | 33 | 10.8% |
| Visual & Performing Arts | 5 | 1.6% |
| Communications | 17 | 5.6% |
| Arts & Humanities | 1 | 0.3% |
| Total | 306 | 100.0% |
Transportation & Commute in Falconer
Vehicle Availability by Sex in Falconer
The most prevalent vehicle ownership categories in Falconer are males with 2 vehicles (286, accounting for 62.6%) and females with 2 vehicles (251, making up 54.9%).
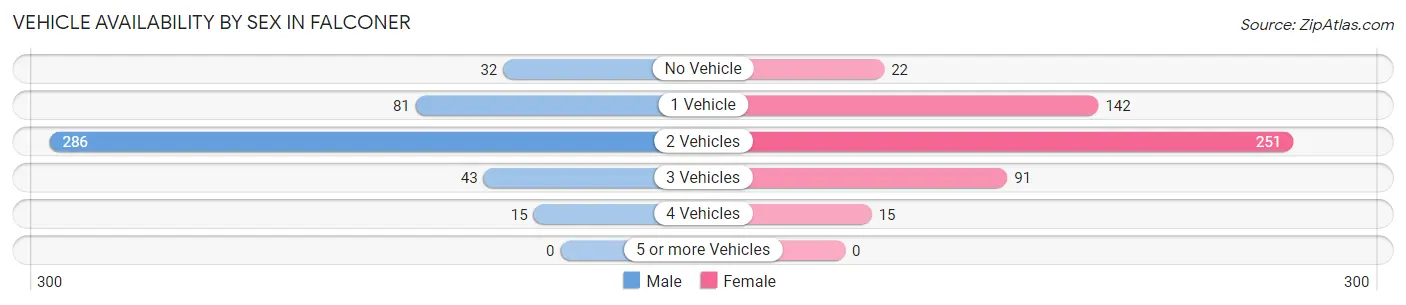
| Vehicles Available | Male | Female |
| No Vehicle | 32 (7.0%) | 22 (4.2%) |
| 1 Vehicle | 81 (17.7%) | 142 (27.3%) |
| 2 Vehicles | 286 (62.6%) | 251 (48.2%) |
| 3 Vehicles | 43 (9.4%) | 91 (17.5%) |
| 4 Vehicles | 15 (3.3%) | 15 (2.9%) |
| 5 or more Vehicles | 0 (0.0%) | 0 (0.0%) |
| Total | 457 (100.0%) | 521 (100.0%) |
Commute Time in Falconer
The most frequently occuring commute durations in Falconer are 20 to 24 minutes (230 commuters, 24.6%), 5 to 9 minutes (229 commuters, 24.5%), and 15 to 19 minutes (168 commuters, 18.0%).
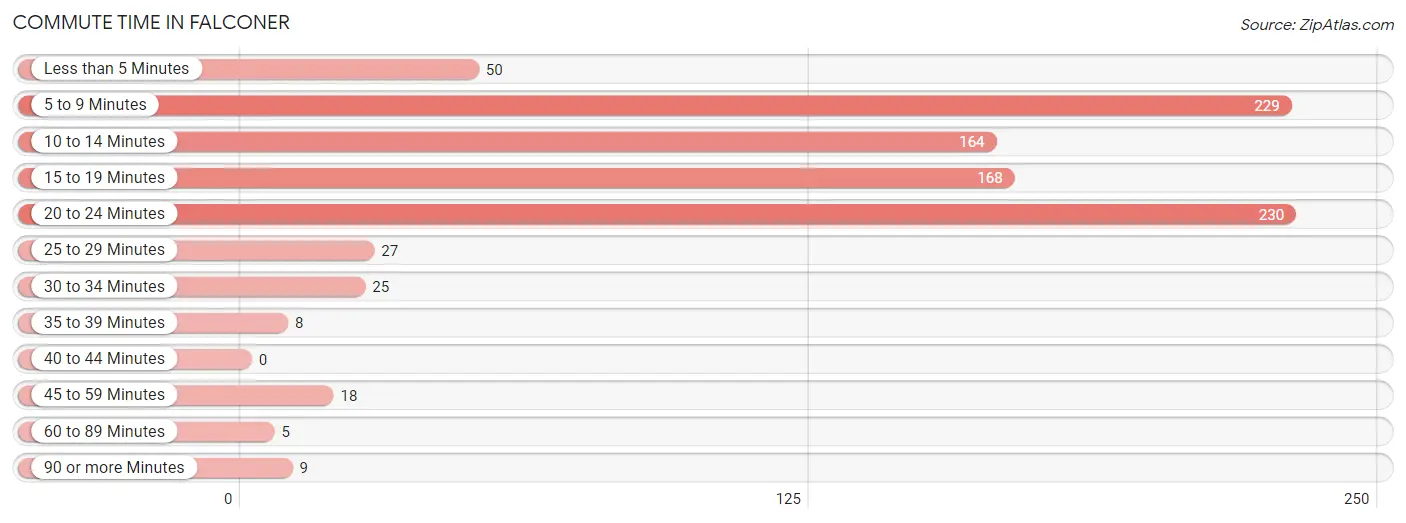
| Commute Time | # Commuters | % Commuters |
| Less than 5 Minutes | 50 | 5.4% |
| 5 to 9 Minutes | 229 | 24.5% |
| 10 to 14 Minutes | 164 | 17.6% |
| 15 to 19 Minutes | 168 | 18.0% |
| 20 to 24 Minutes | 230 | 24.6% |
| 25 to 29 Minutes | 27 | 2.9% |
| 30 to 34 Minutes | 25 | 2.7% |
| 35 to 39 Minutes | 8 | 0.9% |
| 40 to 44 Minutes | 0 | 0.0% |
| 45 to 59 Minutes | 18 | 1.9% |
| 60 to 89 Minutes | 5 | 0.5% |
| 90 or more Minutes | 9 | 1.0% |
Commute Time by Sex in Falconer
The most common commute times in Falconer are 5 to 9 minutes (113 commuters, 25.2%) for males and 20 to 24 minutes (156 commuters, 32.2%) for females.
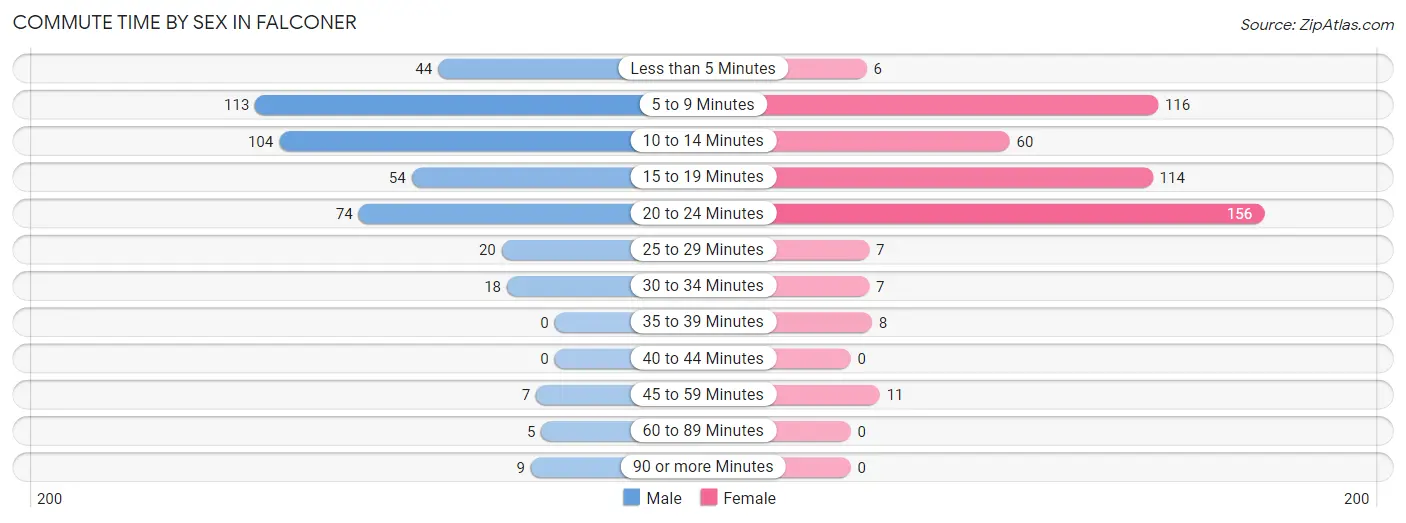
| Commute Time | Male | Female |
| Less than 5 Minutes | 44 (9.8%) | 6 (1.2%) |
| 5 to 9 Minutes | 113 (25.2%) | 116 (23.9%) |
| 10 to 14 Minutes | 104 (23.2%) | 60 (12.4%) |
| 15 to 19 Minutes | 54 (12.0%) | 114 (23.5%) |
| 20 to 24 Minutes | 74 (16.5%) | 156 (32.2%) |
| 25 to 29 Minutes | 20 (4.5%) | 7 (1.4%) |
| 30 to 34 Minutes | 18 (4.0%) | 7 (1.4%) |
| 35 to 39 Minutes | 0 (0.0%) | 8 (1.7%) |
| 40 to 44 Minutes | 0 (0.0%) | 0 (0.0%) |
| 45 to 59 Minutes | 7 (1.6%) | 11 (2.3%) |
| 60 to 89 Minutes | 5 (1.1%) | 0 (0.0%) |
| 90 or more Minutes | 9 (2.0%) | 0 (0.0%) |
Time of Departure to Work by Sex in Falconer
The most frequent times of departure to work in Falconer are 12:00 AM to 4:59 AM (76, 17.0%) for males and 8:00 AM to 8:29 AM (111, 22.9%) for females.
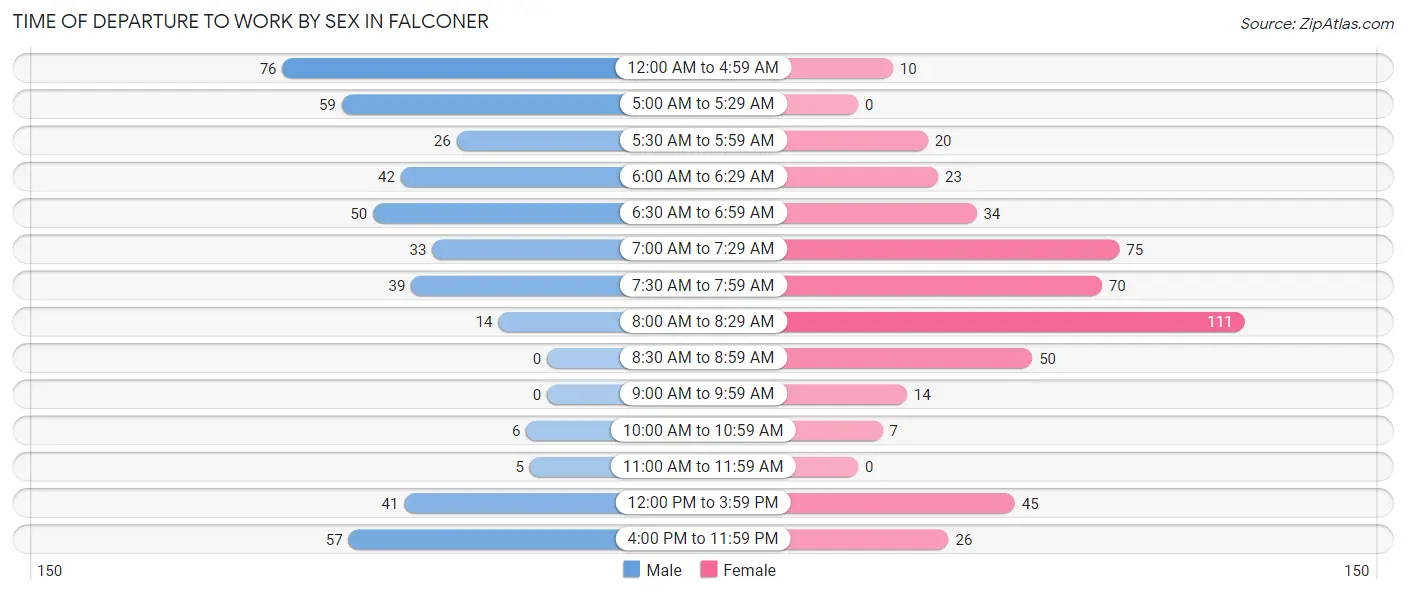
| Time of Departure | Male | Female |
| 12:00 AM to 4:59 AM | 76 (17.0%) | 10 (2.1%) |
| 5:00 AM to 5:29 AM | 59 (13.2%) | 0 (0.0%) |
| 5:30 AM to 5:59 AM | 26 (5.8%) | 20 (4.1%) |
| 6:00 AM to 6:29 AM | 42 (9.4%) | 23 (4.7%) |
| 6:30 AM to 6:59 AM | 50 (11.2%) | 34 (7.0%) |
| 7:00 AM to 7:29 AM | 33 (7.4%) | 75 (15.5%) |
| 7:30 AM to 7:59 AM | 39 (8.7%) | 70 (14.4%) |
| 8:00 AM to 8:29 AM | 14 (3.1%) | 111 (22.9%) |
| 8:30 AM to 8:59 AM | 0 (0.0%) | 50 (10.3%) |
| 9:00 AM to 9:59 AM | 0 (0.0%) | 14 (2.9%) |
| 10:00 AM to 10:59 AM | 6 (1.3%) | 7 (1.4%) |
| 11:00 AM to 11:59 AM | 5 (1.1%) | 0 (0.0%) |
| 12:00 PM to 3:59 PM | 41 (9.1%) | 45 (9.3%) |
| 4:00 PM to 11:59 PM | 57 (12.7%) | 26 (5.4%) |
| Total | 448 (100.0%) | 485 (100.0%) |
Housing Occupancy in Falconer
Occupancy by Ownership in Falconer
Of the total 1,000 dwellings in Falconer, owner-occupied units account for 694 (69.4%), while renter-occupied units make up 306 (30.6%).
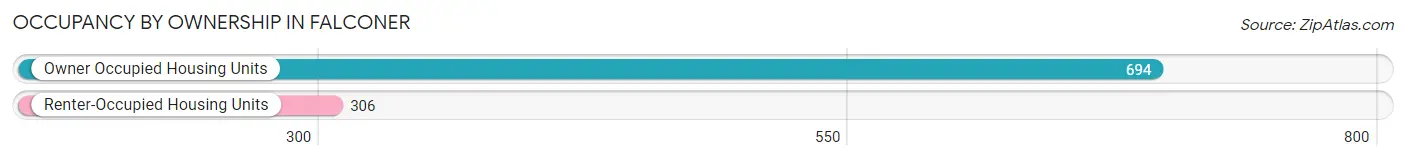
| Occupancy | # Housing Units | % Housing Units |
| Owner Occupied Housing Units | 694 | 69.4% |
| Renter-Occupied Housing Units | 306 | 30.6% |
| Total Occupied Housing Units | 1,000 | 100.0% |
Occupancy by Household Size in Falconer
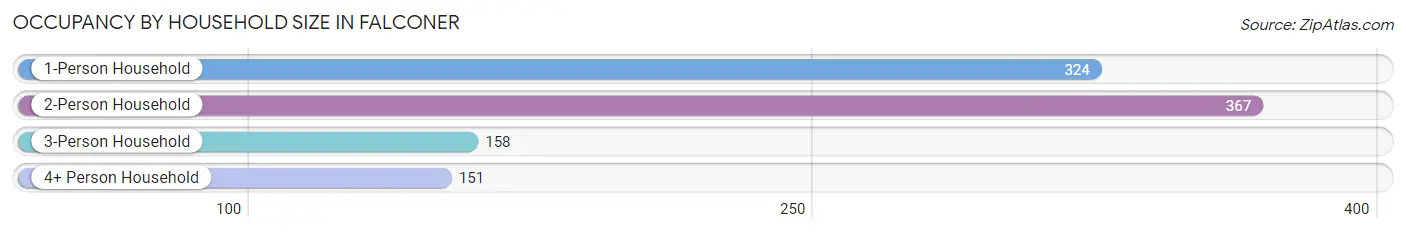
| Household Size | # Housing Units | % Housing Units |
| 1-Person Household | 324 | 32.4% |
| 2-Person Household | 367 | 36.7% |
| 3-Person Household | 158 | 15.8% |
| 4+ Person Household | 151 | 15.1% |
| Total Housing Units | 1,000 | 100.0% |
Occupancy by Ownership by Household Size in Falconer
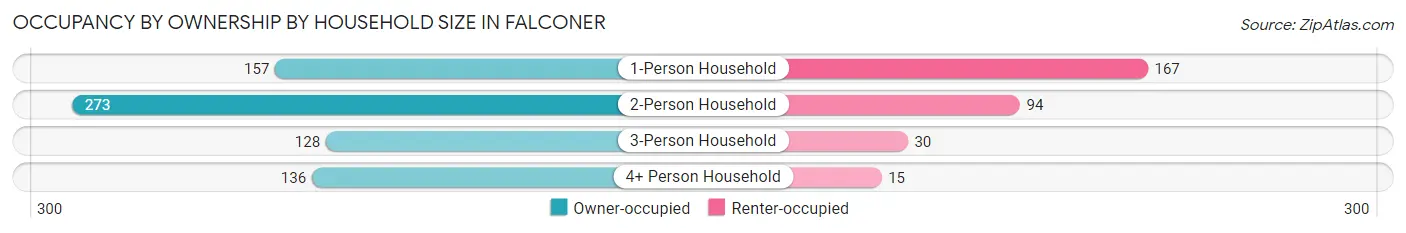
| Household Size | Owner-occupied | Renter-occupied |
| 1-Person Household | 157 (48.5%) | 167 (51.5%) |
| 2-Person Household | 273 (74.4%) | 94 (25.6%) |
| 3-Person Household | 128 (81.0%) | 30 (19.0%) |
| 4+ Person Household | 136 (90.1%) | 15 (9.9%) |
| Total Housing Units | 694 (69.4%) | 306 (30.6%) |
Occupancy by Educational Attainment in Falconer
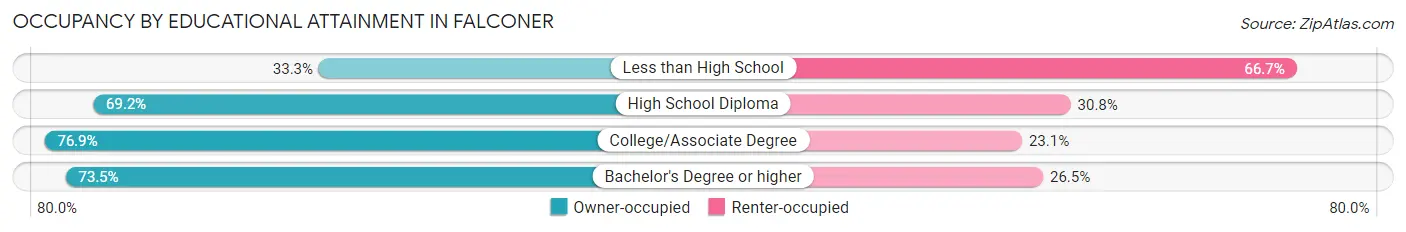
| Household Size | Owner-occupied | Renter-occupied |
| Less than High School | 34 (33.3%) | 68 (66.7%) |
| High School Diploma | 231 (69.2%) | 103 (30.8%) |
| College/Associate Degree | 329 (76.9%) | 99 (23.1%) |
| Bachelor's Degree or higher | 100 (73.5%) | 36 (26.5%) |
Occupancy by Age of Householder in Falconer
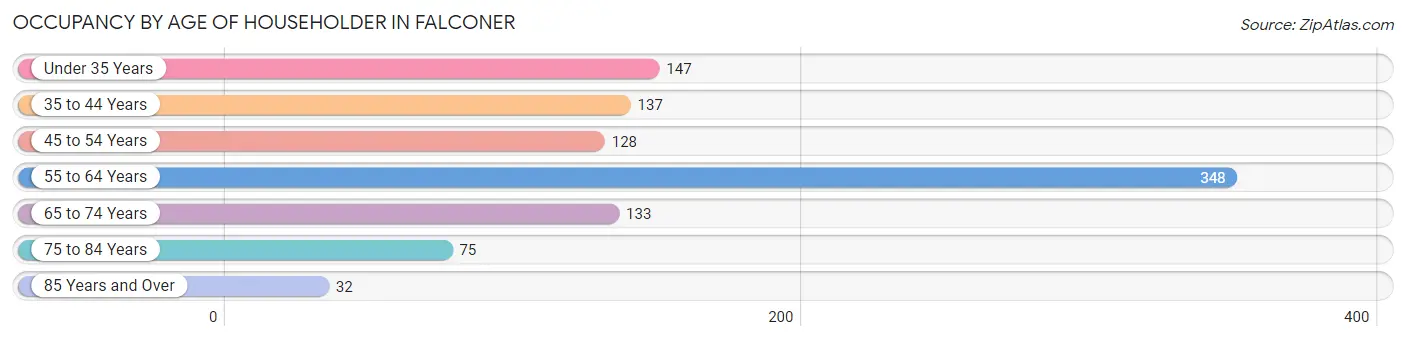
| Age Bracket | # Households | % Households |
| Under 35 Years | 147 | 14.7% |
| 35 to 44 Years | 137 | 13.7% |
| 45 to 54 Years | 128 | 12.8% |
| 55 to 64 Years | 348 | 34.8% |
| 65 to 74 Years | 133 | 13.3% |
| 75 to 84 Years | 75 | 7.5% |
| 85 Years and Over | 32 | 3.2% |
| Total | 1,000 | 100.0% |
Housing Finances in Falconer
Median Income by Occupancy in Falconer
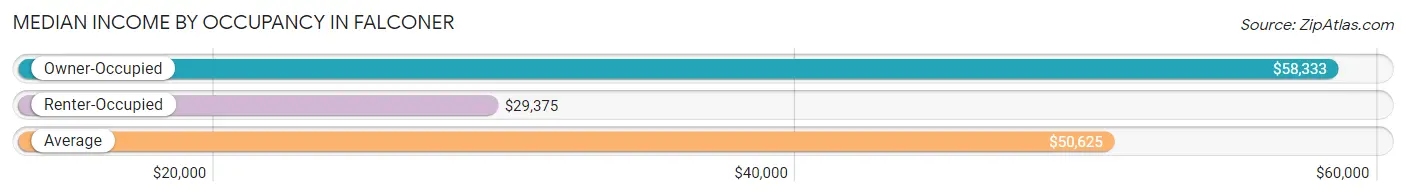
| Occupancy Type | # Households | Median Income |
| Owner-Occupied | 694 (69.4%) | $58,333 |
| Renter-Occupied | 306 (30.6%) | $29,375 |
| Average | 1,000 (100.0%) | $50,625 |
Occupancy by Householder Income Bracket in Falconer
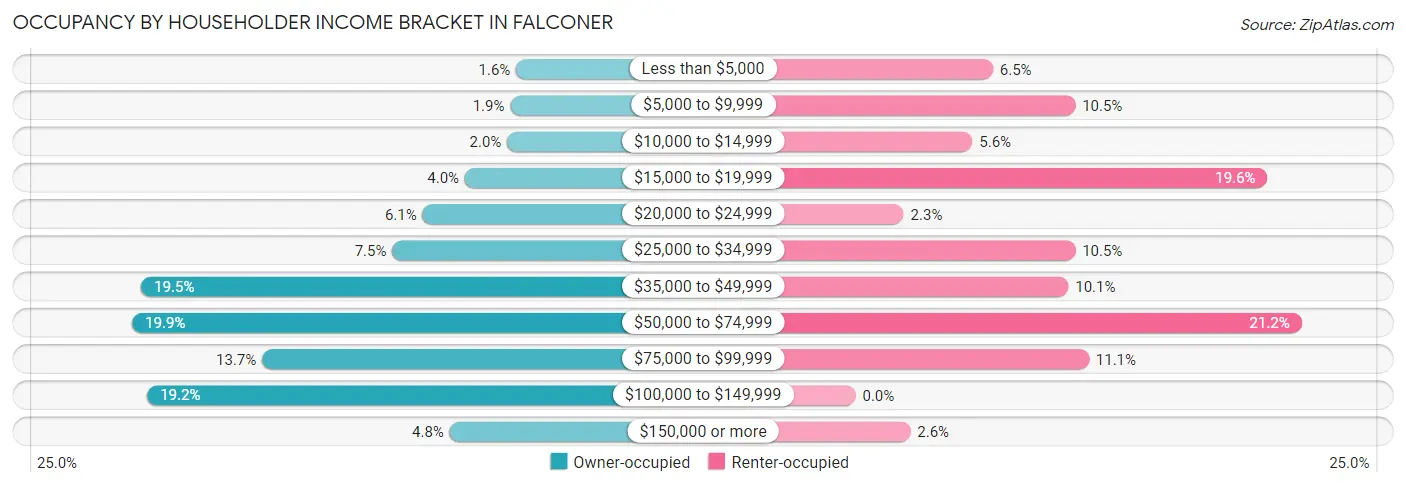
| Income Bracket | Owner-occupied | Renter-occupied |
| Less than $5,000 | 11 (1.6%) | 20 (6.5%) |
| $5,000 to $9,999 | 13 (1.9%) | 32 (10.5%) |
| $10,000 to $14,999 | 14 (2.0%) | 17 (5.6%) |
| $15,000 to $19,999 | 28 (4.0%) | 60 (19.6%) |
| $20,000 to $24,999 | 42 (6.0%) | 7 (2.3%) |
| $25,000 to $34,999 | 52 (7.5%) | 32 (10.5%) |
| $35,000 to $49,999 | 135 (19.5%) | 31 (10.1%) |
| $50,000 to $74,999 | 138 (19.9%) | 65 (21.2%) |
| $75,000 to $99,999 | 95 (13.7%) | 34 (11.1%) |
| $100,000 to $149,999 | 133 (19.2%) | 0 (0.0%) |
| $150,000 or more | 33 (4.8%) | 8 (2.6%) |
| Total | 694 (100.0%) | 306 (100.0%) |
Monthly Housing Cost Tiers in Falconer
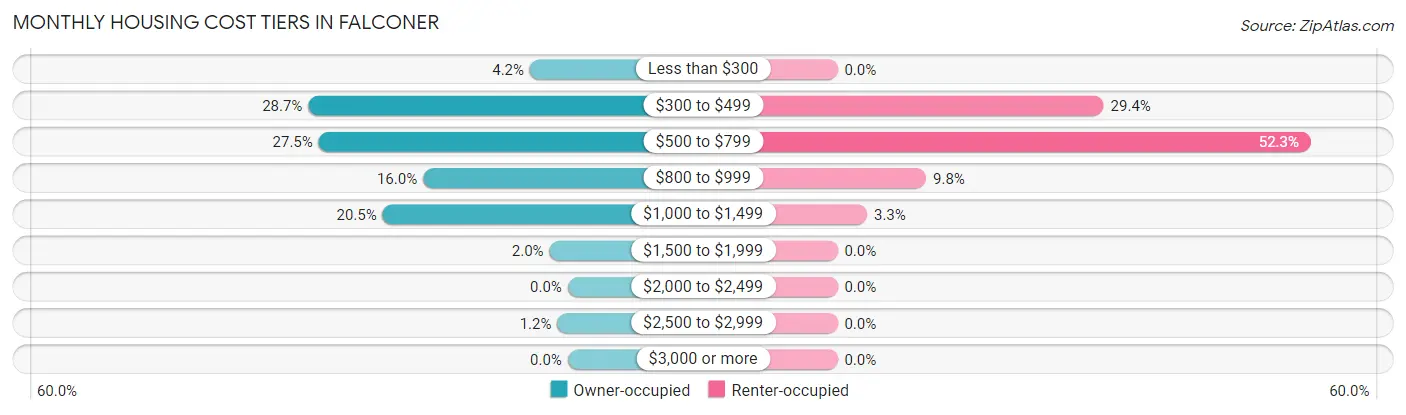
| Monthly Cost | Owner-occupied | Renter-occupied |
| Less than $300 | 29 (4.2%) | 0 (0.0%) |
| $300 to $499 | 199 (28.7%) | 90 (29.4%) |
| $500 to $799 | 191 (27.5%) | 160 (52.3%) |
| $800 to $999 | 111 (16.0%) | 30 (9.8%) |
| $1,000 to $1,499 | 142 (20.5%) | 10 (3.3%) |
| $1,500 to $1,999 | 14 (2.0%) | 0 (0.0%) |
| $2,000 to $2,499 | 0 (0.0%) | 0 (0.0%) |
| $2,500 to $2,999 | 8 (1.1%) | 0 (0.0%) |
| $3,000 or more | 0 (0.0%) | 0 (0.0%) |
| Total | 694 (100.0%) | 306 (100.0%) |
Physical Housing Characteristics in Falconer
Housing Structures in Falconer
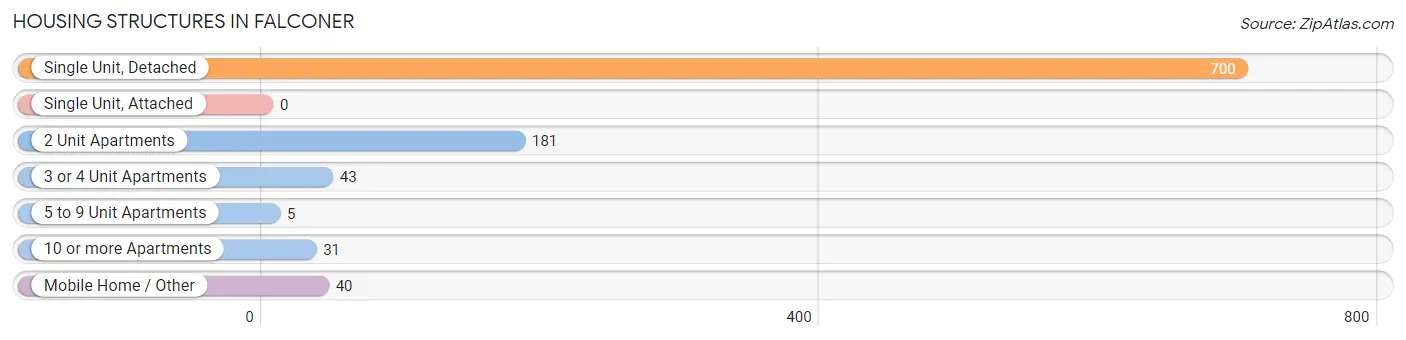
| Structure Type | # Housing Units | % Housing Units |
| Single Unit, Detached | 700 | 70.0% |
| Single Unit, Attached | 0 | 0.0% |
| 2 Unit Apartments | 181 | 18.1% |
| 3 or 4 Unit Apartments | 43 | 4.3% |
| 5 to 9 Unit Apartments | 5 | 0.5% |
| 10 or more Apartments | 31 | 3.1% |
| Mobile Home / Other | 40 | 4.0% |
| Total | 1,000 | 100.0% |
Housing Structures by Occupancy in Falconer
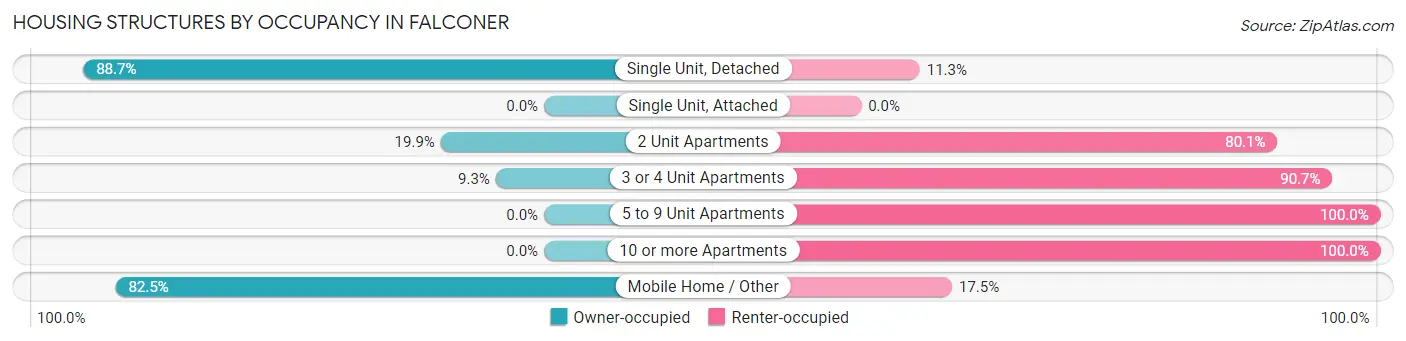
| Structure Type | Owner-occupied | Renter-occupied |
| Single Unit, Detached | 621 (88.7%) | 79 (11.3%) |
| Single Unit, Attached | 0 (0.0%) | 0 (0.0%) |
| 2 Unit Apartments | 36 (19.9%) | 145 (80.1%) |
| 3 or 4 Unit Apartments | 4 (9.3%) | 39 (90.7%) |
| 5 to 9 Unit Apartments | 0 (0.0%) | 5 (100.0%) |
| 10 or more Apartments | 0 (0.0%) | 31 (100.0%) |
| Mobile Home / Other | 33 (82.5%) | 7 (17.5%) |
| Total | 694 (69.4%) | 306 (30.6%) |
Housing Structures by Number of Rooms in Falconer
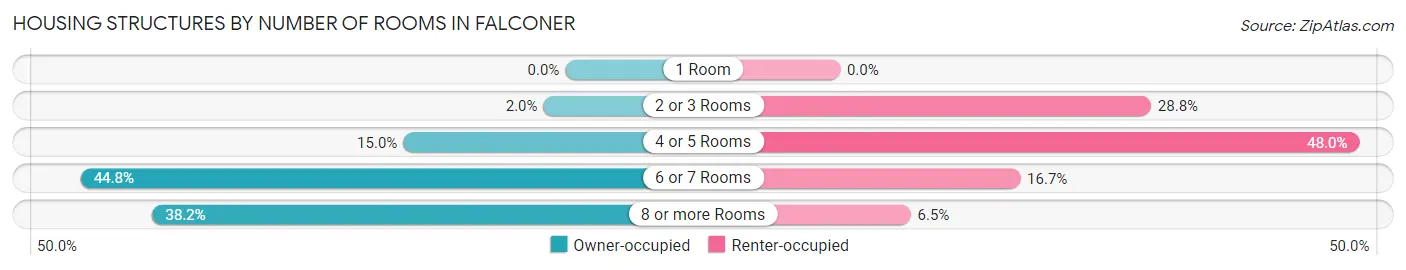
| Number of Rooms | Owner-occupied | Renter-occupied |
| 1 Room | 0 (0.0%) | 0 (0.0%) |
| 2 or 3 Rooms | 14 (2.0%) | 88 (28.8%) |
| 4 or 5 Rooms | 104 (15.0%) | 147 (48.0%) |
| 6 or 7 Rooms | 311 (44.8%) | 51 (16.7%) |
| 8 or more Rooms | 265 (38.2%) | 20 (6.5%) |
| Total | 694 (100.0%) | 306 (100.0%) |
Housing Structure by Heating Type in Falconer
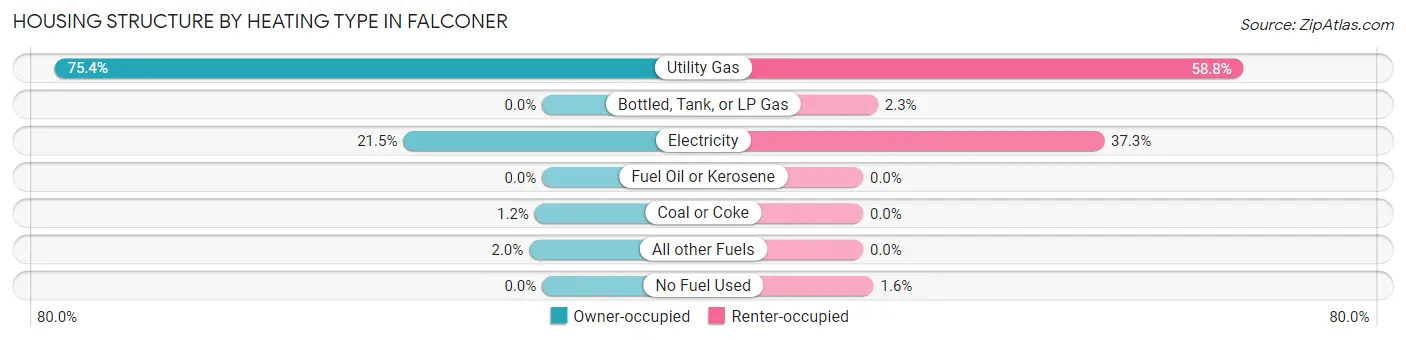
| Heating Type | Owner-occupied | Renter-occupied |
| Utility Gas | 523 (75.4%) | 180 (58.8%) |
| Bottled, Tank, or LP Gas | 0 (0.0%) | 7 (2.3%) |
| Electricity | 149 (21.5%) | 114 (37.2%) |
| Fuel Oil or Kerosene | 0 (0.0%) | 0 (0.0%) |
| Coal or Coke | 8 (1.1%) | 0 (0.0%) |
| All other Fuels | 14 (2.0%) | 0 (0.0%) |
| No Fuel Used | 0 (0.0%) | 5 (1.6%) |
| Total | 694 (100.0%) | 306 (100.0%) |
Household Vehicle Usage in Falconer
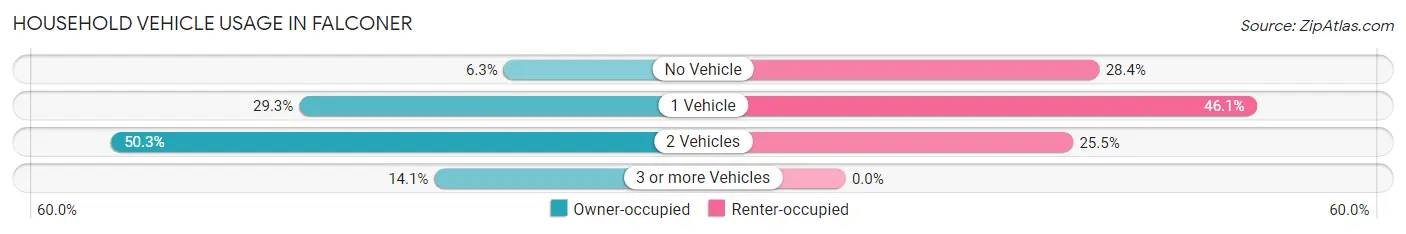
| Vehicles per Household | Owner-occupied | Renter-occupied |
| No Vehicle | 44 (6.3%) | 87 (28.4%) |
| 1 Vehicle | 203 (29.2%) | 141 (46.1%) |
| 2 Vehicles | 349 (50.3%) | 78 (25.5%) |
| 3 or more Vehicles | 98 (14.1%) | 0 (0.0%) |
| Total | 694 (100.0%) | 306 (100.0%) |
Real Estate & Mortgages in Falconer
Real Estate and Mortgage Overview in Falconer
| Characteristic | Without Mortgage | With Mortgage |
| Housing Units | 342 | 352 |
| Median Property Value | $78,500 | $89,100 |
| Median Household Income | $49,423 | $8 |
| Monthly Housing Costs | $421 | $0 |
| Real Estate Taxes | $2,172 | $5 |
Property Value by Mortgage Status in Falconer
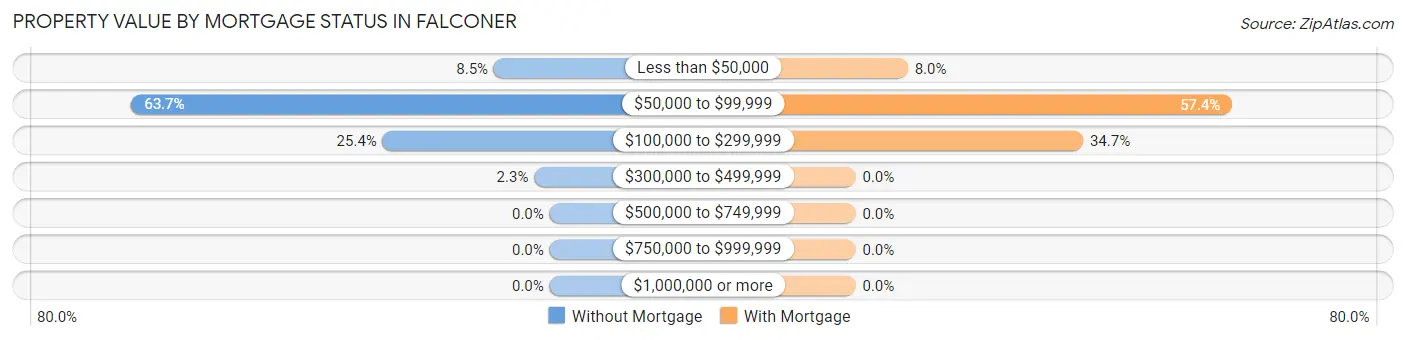
| Property Value | Without Mortgage | With Mortgage |
| Less than $50,000 | 29 (8.5%) | 28 (8.0%) |
| $50,000 to $99,999 | 218 (63.7%) | 202 (57.4%) |
| $100,000 to $299,999 | 87 (25.4%) | 122 (34.7%) |
| $300,000 to $499,999 | 8 (2.3%) | 0 (0.0%) |
| $500,000 to $749,999 | 0 (0.0%) | 0 (0.0%) |
| $750,000 to $999,999 | 0 (0.0%) | 0 (0.0%) |
| $1,000,000 or more | 0 (0.0%) | 0 (0.0%) |
| Total | 342 (100.0%) | 352 (100.0%) |
Household Income by Mortgage Status in Falconer
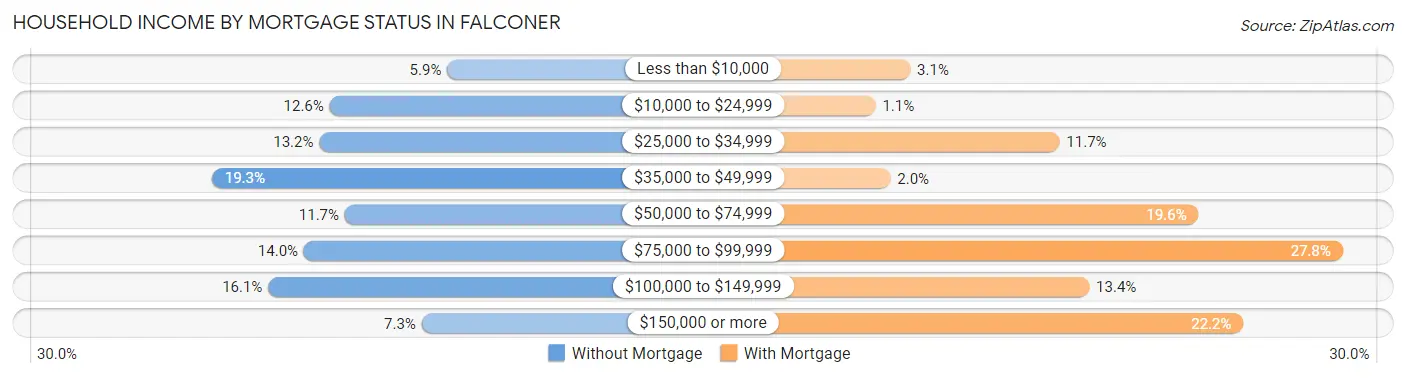
| Household Income | Without Mortgage | With Mortgage |
| Less than $10,000 | 20 (5.9%) | 11 (3.1%) |
| $10,000 to $24,999 | 43 (12.6%) | 4 (1.1%) |
| $25,000 to $34,999 | 45 (13.2%) | 41 (11.7%) |
| $35,000 to $49,999 | 66 (19.3%) | 7 (2.0%) |
| $50,000 to $74,999 | 40 (11.7%) | 69 (19.6%) |
| $75,000 to $99,999 | 48 (14.0%) | 98 (27.8%) |
| $100,000 to $149,999 | 55 (16.1%) | 47 (13.4%) |
| $150,000 or more | 25 (7.3%) | 78 (22.2%) |
| Total | 342 (100.0%) | 352 (100.0%) |
Property Value to Household Income Ratio in Falconer
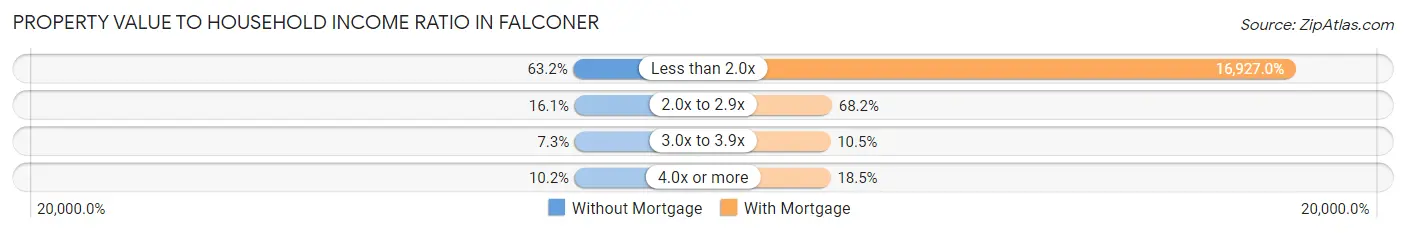
| Value-to-Income Ratio | Without Mortgage | With Mortgage |
| Less than 2.0x | 216 (63.2%) | 59,583 (16,927.0%) |
| 2.0x to 2.9x | 55 (16.1%) | 240 (68.2%) |
| 3.0x to 3.9x | 25 (7.3%) | 37 (10.5%) |
| 4.0x or more | 35 (10.2%) | 65 (18.5%) |
| Total | 342 (100.0%) | 352 (100.0%) |
Real Estate Taxes by Mortgage Status in Falconer
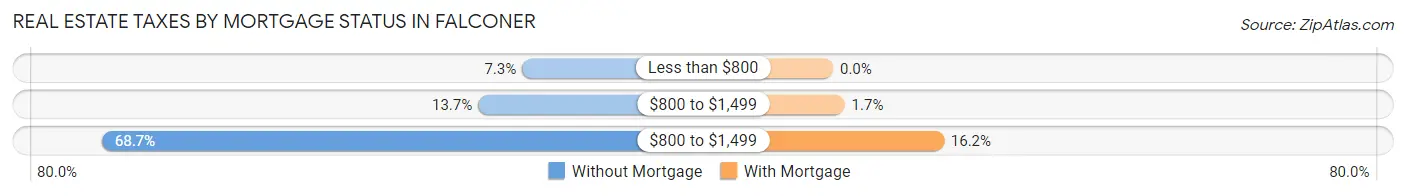
| Property Taxes | Without Mortgage | With Mortgage |
| Less than $800 | 25 (7.3%) | 0 (0.0%) |
| $800 to $1,499 | 47 (13.7%) | 6 (1.7%) |
| $800 to $1,499 | 235 (68.7%) | 57 (16.2%) |
| Total | 342 (100.0%) | 352 (100.0%) |
Health & Disability in Falconer
Health Insurance Coverage by Age in Falconer
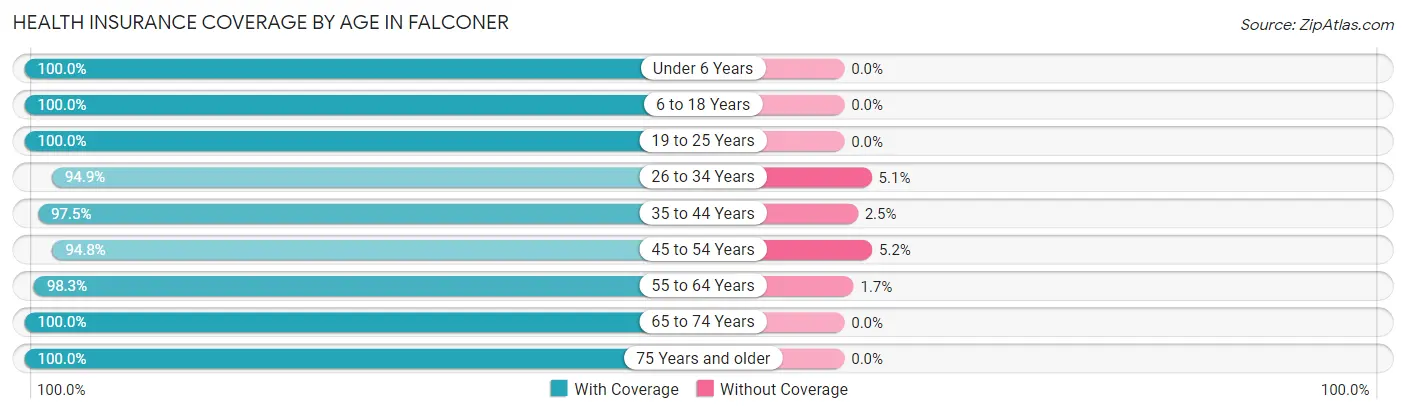
| Age Bracket | With Coverage | Without Coverage |
| Under 6 Years | 124 (100.0%) | 0 (0.0%) |
| 6 to 18 Years | 287 (100.0%) | 0 (0.0%) |
| 19 to 25 Years | 152 (100.0%) | 0 (0.0%) |
| 26 to 34 Years | 242 (94.9%) | 13 (5.1%) |
| 35 to 44 Years | 234 (97.5%) | 6 (2.5%) |
| 45 to 54 Years | 256 (94.8%) | 14 (5.2%) |
| 55 to 64 Years | 456 (98.3%) | 8 (1.7%) |
| 65 to 74 Years | 252 (100.0%) | 0 (0.0%) |
| 75 Years and older | 149 (100.0%) | 0 (0.0%) |
| Total | 2,152 (98.1%) | 41 (1.9%) |
Health Insurance Coverage by Citizenship Status in Falconer

| Citizenship Status | With Coverage | Without Coverage |
| Native Born | 124 (100.0%) | 0 (0.0%) |
| Foreign Born, Citizen | 287 (100.0%) | 0 (0.0%) |
| Foreign Born, not a Citizen | 152 (100.0%) | 0 (0.0%) |
Health Insurance Coverage by Household Income in Falconer
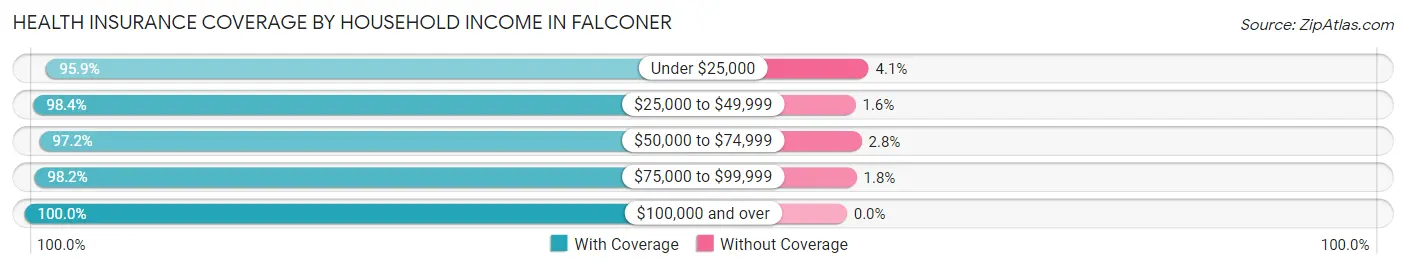
| Household Income | With Coverage | Without Coverage |
| Under $25,000 | 353 (95.9%) | 15 (4.1%) |
| $25,000 to $49,999 | 479 (98.4%) | 8 (1.6%) |
| $50,000 to $74,999 | 419 (97.2%) | 12 (2.8%) |
| $75,000 to $99,999 | 321 (98.2%) | 6 (1.8%) |
| $100,000 and over | 580 (100.0%) | 0 (0.0%) |
Public vs Private Health Insurance Coverage by Age in Falconer
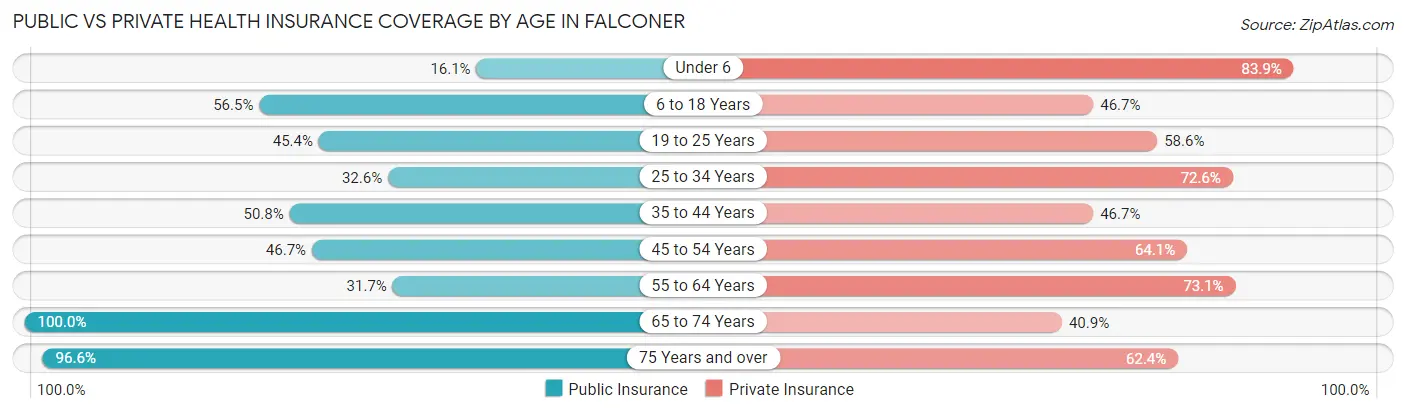
| Age Bracket | Public Insurance | Private Insurance |
| Under 6 | 20 (16.1%) | 104 (83.9%) |
| 6 to 18 Years | 162 (56.5%) | 134 (46.7%) |
| 19 to 25 Years | 69 (45.4%) | 89 (58.6%) |
| 25 to 34 Years | 83 (32.6%) | 185 (72.6%) |
| 35 to 44 Years | 122 (50.8%) | 112 (46.7%) |
| 45 to 54 Years | 126 (46.7%) | 173 (64.1%) |
| 55 to 64 Years | 147 (31.7%) | 339 (73.1%) |
| 65 to 74 Years | 252 (100.0%) | 103 (40.9%) |
| 75 Years and over | 144 (96.6%) | 93 (62.4%) |
| Total | 1,125 (51.3%) | 1,332 (60.7%) |
Disability Status by Sex by Age in Falconer
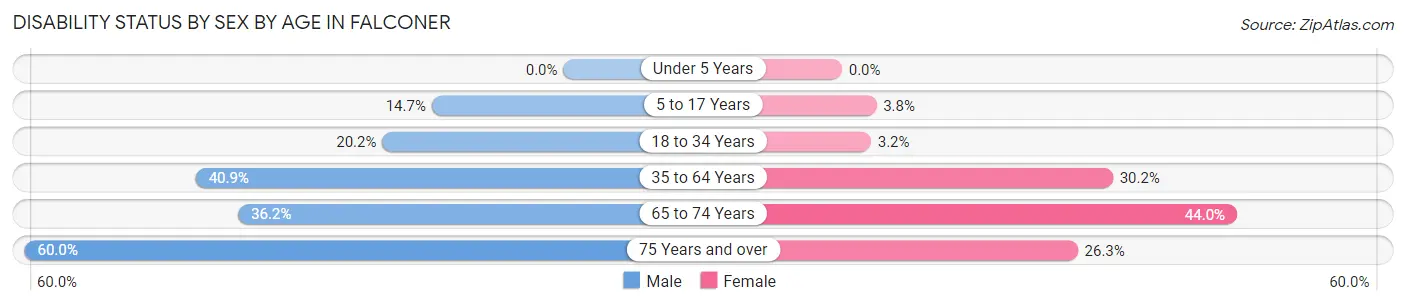
| Age Bracket | Male | Female |
| Under 5 Years | 0 (0.0%) | 0 (0.0%) |
| 5 to 17 Years | 17 (14.7%) | 7 (3.8%) |
| 18 to 34 Years | 51 (20.2%) | 6 (3.2%) |
| 35 to 64 Years | 183 (40.9%) | 159 (30.2%) |
| 65 to 74 Years | 46 (36.2%) | 55 (44.0%) |
| 75 Years and over | 30 (60.0%) | 26 (26.3%) |
Disability Class by Sex by Age in Falconer
Disability Class: Hearing Difficulty
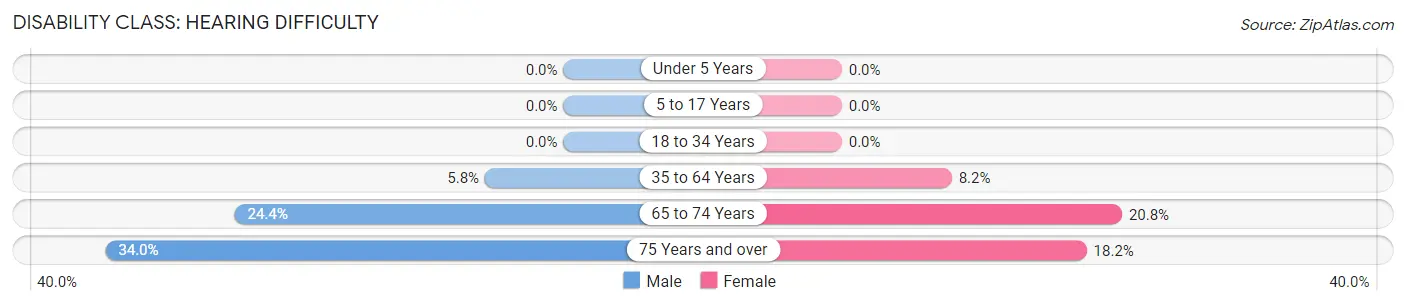
| Age Bracket | Male | Female |
| Under 5 Years | 0 (0.0%) | 0 (0.0%) |
| 5 to 17 Years | 0 (0.0%) | 0 (0.0%) |
| 18 to 34 Years | 0 (0.0%) | 0 (0.0%) |
| 35 to 64 Years | 26 (5.8%) | 43 (8.2%) |
| 65 to 74 Years | 31 (24.4%) | 26 (20.8%) |
| 75 Years and over | 17 (34.0%) | 18 (18.2%) |
Disability Class: Vision Difficulty
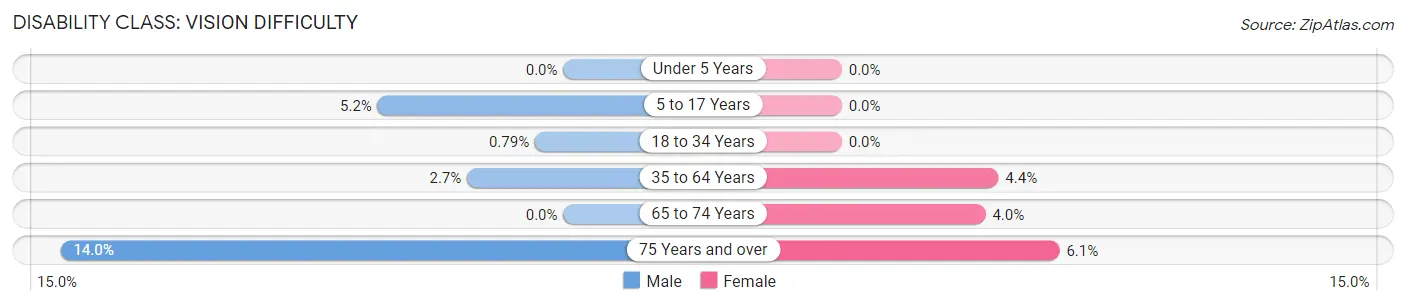
| Age Bracket | Male | Female |
| Under 5 Years | 0 (0.0%) | 0 (0.0%) |
| 5 to 17 Years | 6 (5.2%) | 0 (0.0%) |
| 18 to 34 Years | 2 (0.8%) | 0 (0.0%) |
| 35 to 64 Years | 12 (2.7%) | 23 (4.4%) |
| 65 to 74 Years | 0 (0.0%) | 5 (4.0%) |
| 75 Years and over | 7 (14.0%) | 6 (6.1%) |
Disability Class: Cognitive Difficulty
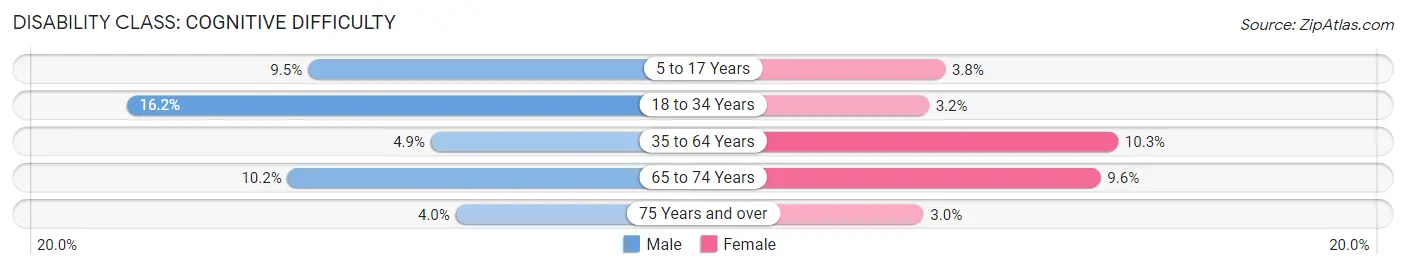
| Age Bracket | Male | Female |
| 5 to 17 Years | 11 (9.5%) | 7 (3.8%) |
| 18 to 34 Years | 41 (16.2%) | 6 (3.2%) |
| 35 to 64 Years | 22 (4.9%) | 54 (10.2%) |
| 65 to 74 Years | 13 (10.2%) | 12 (9.6%) |
| 75 Years and over | 2 (4.0%) | 3 (3.0%) |
Disability Class: Ambulatory Difficulty
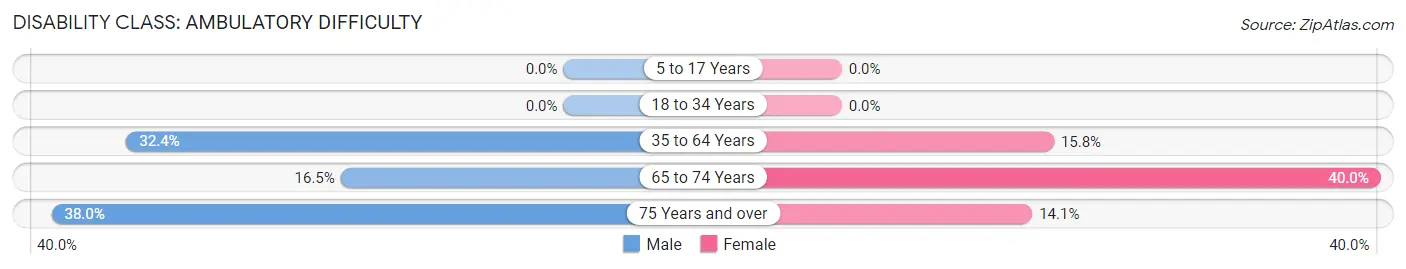
| Age Bracket | Male | Female |
| 5 to 17 Years | 0 (0.0%) | 0 (0.0%) |
| 18 to 34 Years | 0 (0.0%) | 0 (0.0%) |
| 35 to 64 Years | 145 (32.4%) | 83 (15.8%) |
| 65 to 74 Years | 21 (16.5%) | 50 (40.0%) |
| 75 Years and over | 19 (38.0%) | 14 (14.1%) |
Disability Class: Self-Care Difficulty
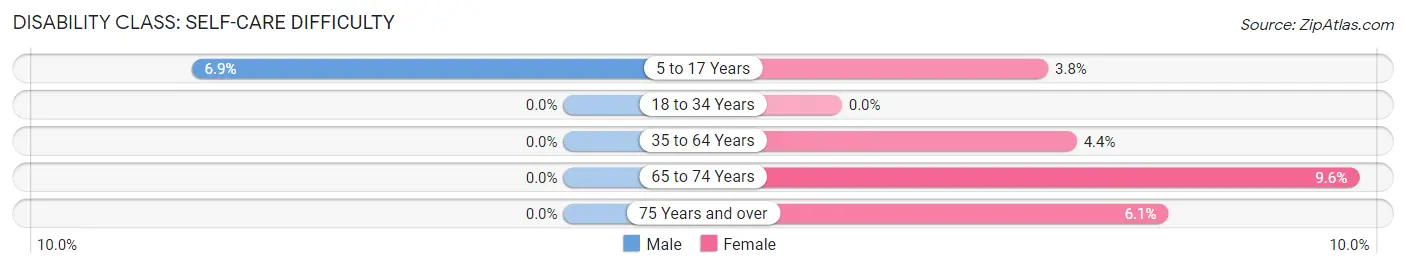
| Age Bracket | Male | Female |
| 5 to 17 Years | 8 (6.9%) | 7 (3.8%) |
| 18 to 34 Years | 0 (0.0%) | 0 (0.0%) |
| 35 to 64 Years | 0 (0.0%) | 23 (4.4%) |
| 65 to 74 Years | 0 (0.0%) | 12 (9.6%) |
| 75 Years and over | 0 (0.0%) | 6 (6.1%) |
Technology Access in Falconer
Computing Device Access in Falconer
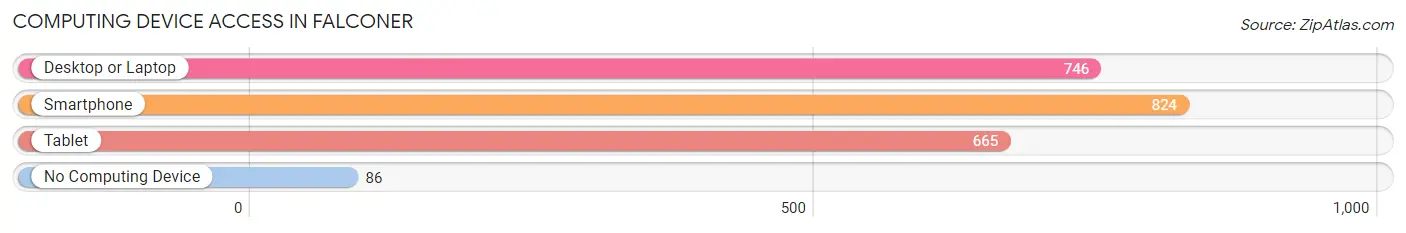
| Device Type | # Households | % Households |
| Desktop or Laptop | 746 | 74.6% |
| Smartphone | 824 | 82.4% |
| Tablet | 665 | 66.5% |
| No Computing Device | 86 | 8.6% |
| Total | 1,000 | 100.0% |
Internet Access in Falconer
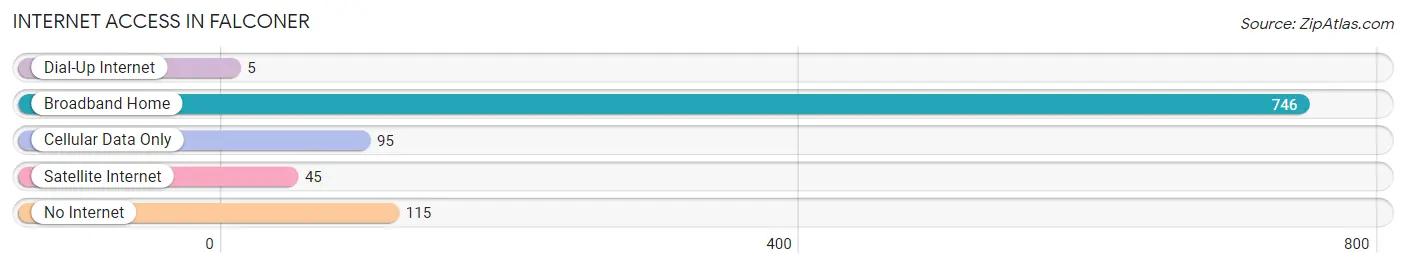
| Internet Type | # Households | % Households |
| Dial-Up Internet | 5 | 0.5% |
| Broadband Home | 746 | 74.6% |
| Cellular Data Only | 95 | 9.5% |
| Satellite Internet | 45 | 4.5% |
| No Internet | 115 | 11.5% |
| Total | 1,000 | 100.0% |
Falconer Summary
Falconer is a village located in the town of Ellicott in Chautauqua County, New York. It is situated on the eastern edge of the county, near the Pennsylvania border. The village is located on the banks of the Chadakoin River, and is home to a population of approximately 2,500 people.
History
The area that is now Falconer was first settled in 1806 by a group of settlers from Connecticut. The village was originally known as "Chadakoin," after the river that runs through it. In 1820, the village was renamed "Falconer" after a local landowner, John Falconer.
The village was incorporated in 1853, and the first mayor was elected in 1854. The village grew rapidly in the late 19th century, and by the early 20th century, it had become a major industrial center. The village was home to several factories, including a paper mill, a tannery, and a furniture factory.
In the late 20th century, the village experienced a decline in industry, and many of the factories closed. However, the village has since experienced a resurgence in recent years, and is now home to several small businesses and a growing population.
Geography
Falconer is located in the eastern part of Chautauqua County, near the Pennsylvania border. The village is situated on the banks of the Chadakoin River, and is surrounded by rolling hills and farmland. The village is located approximately 25 miles south of Buffalo, and is accessible by Interstate 86.
The village has a total area of 1.2 square miles, all of which is land. The village is located at an elevation of 1,068 feet above sea level.
Economy
The economy of Falconer is largely based on small businesses and manufacturing. The village is home to several small businesses, including restaurants, retail stores, and professional services. The village is also home to several manufacturing companies, including a paper mill, a tannery, and a furniture factory.
The village is also home to a number of educational institutions, including Jamestown Community College and the State University of New York at Fredonia.
Demographics
As of the 2010 census, the population of Falconer was 2,500. The racial makeup of the village was 97.2% White, 0.8% African American, 0.4% Native American, 0.4% Asian, and 0.8% from other races. Hispanic or Latino of any race were 1.2% of the population.
The median household income in Falconer was $37,500, and the median family income was $45,000. The per capita income for the village was $19,000. About 11.2% of families and 14.2% of the population were below the poverty line, including 18.2% of those under age 18 and 8.2% of those age 65 or over.
Common Questions
What is the Total Population of Falconer?
Total Population of Falconer is 2,193.
What is the Total Male Population of Falconer?
Total Male Population of Falconer is 1,059.
What is the Total Female Population of Falconer?
Total Female Population of Falconer is 1,134.
What is the Ratio of Males per 100 Females in Falconer?
There are 93.39 Males per 100 Females in Falconer.
What is the Ratio of Females per 100 Males in Falconer?
There are 107.08 Females per 100 Males in Falconer.
What is the Median Population Age in Falconer?
Median Population Age in Falconer is 46.4 Years.
What is the Average Family Size in Falconer
Average Family Size in Falconer is 2.9 People.
What is the Average Household Size in Falconer
Average Household Size in Falconer is 2.2 People.
What is Per Capita Income in Falconer?
Per Capita income in Falconer is $27,367.
What is the Median Family Income in Falconer?
Median Family Income in Falconer is $68,289.
What is the Median Household income in Falconer?
Median Household Income in Falconer is $50,625.
What is Income or Wage Gap in Falconer?
Income or Wage Gap in Falconer is 35.7%.
Women in Falconer earn 64.3 cents for every dollar earned by a man.
What is Inequality or Gini Index in Falconer?
Inequality or Gini Index in Falconer is 0.39.
How Large is the Labor Force in Falconer?
There are 1,089 People in the Labor Forcein in Falconer.
What is the Percentage of People in the Labor Force in Falconer?
58.2% of People are in the Labor Force in Falconer.
What is the Unemployment Rate in Falconer?
Unemployment Rate in Falconer is 7.3%.