Cranberry Lake, NY
Cranberry Lake Map
Cranberry Lake Overview
124
TOTAL POPULATION
60
MALE POPULATION
64
FEMALE POPULATION
93.75
MALES / 100 FEMALES
106.67
FEMALES / 100 MALES
67.6
MEDIAN AGE
2.3
AVG FAMILY SIZE
1.8
AVG HOUSEHOLD SIZE
$59,526
PER CAPITA INCOME
$93,750
AVG FAMILY INCOME
$86,250
AVG HOUSEHOLD INCOME
0.46
INEQUALITY / GINI INDEX
33
LABOR FORCE [ PEOPLE ]
27.5%
PERCENT IN LABOR FORCE
Cranberry Lake Zip Codes
Cranberry Lake Area Codes
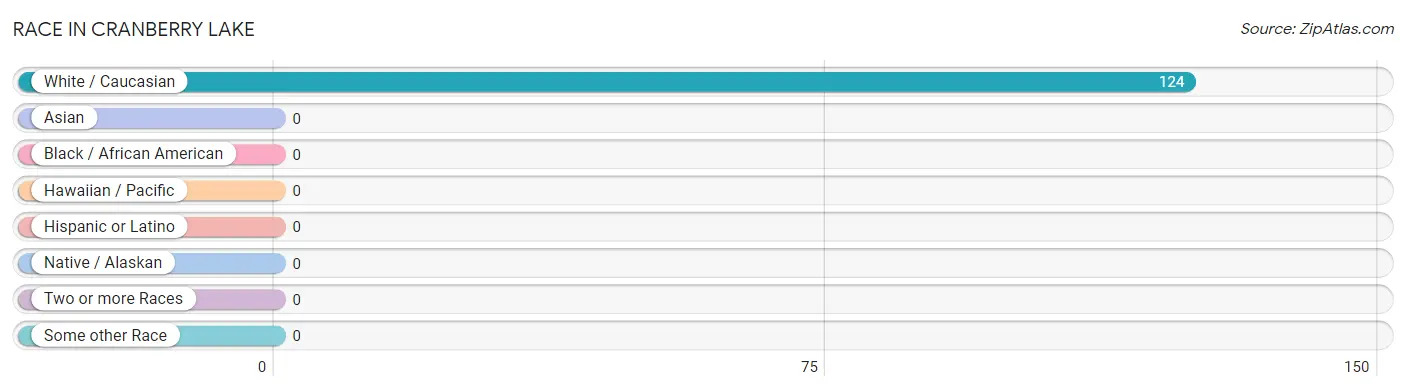
Race in Cranberry Lake
The most populous races in Cranberry Lake are , and White / Caucasian (124 | 100.0%).
| Race | # Population | % Population |
| Asian | 0 | 0.0% |
| Black / African American | 0 | 0.0% |
| Hawaiian / Pacific | 0 | 0.0% |
| Hispanic or Latino | 0 | 0.0% |
| Native / Alaskan | 0 | 0.0% |
| White / Caucasian | 124 | 100.0% |
| Two or more Races | 0 | 0.0% |
| Some other Race | 0 | 0.0% |
| Total | 124 | 100.0% |
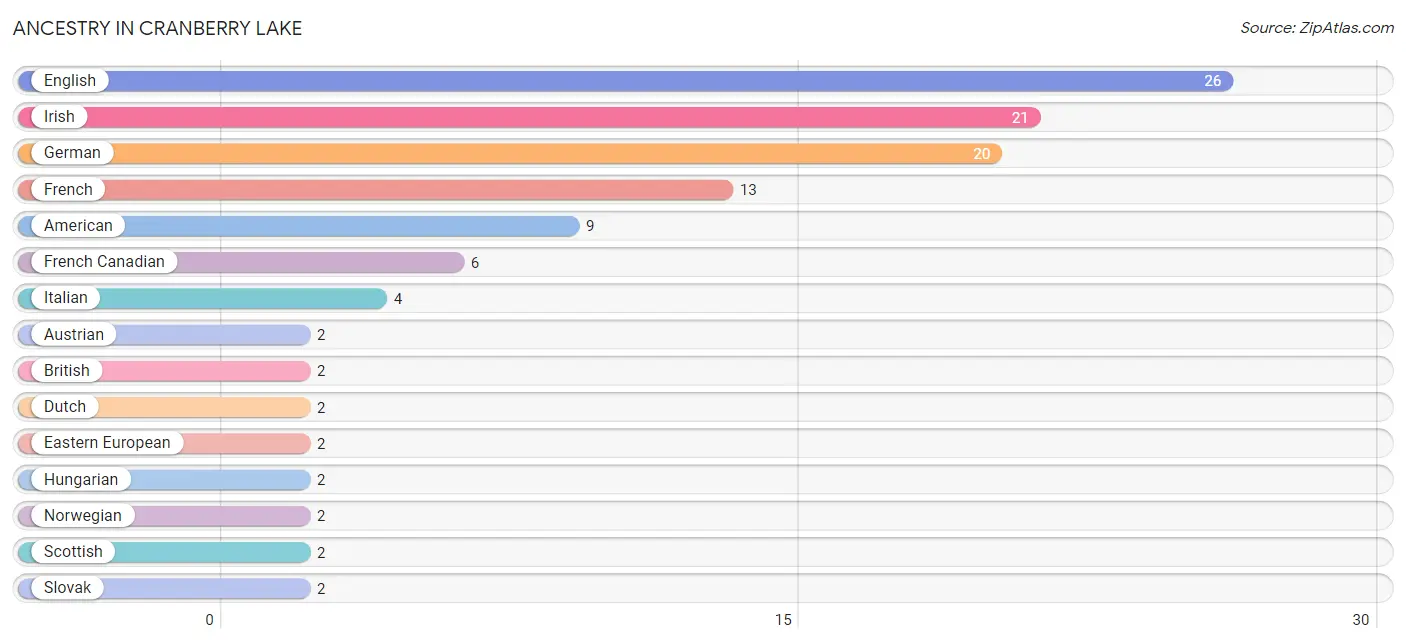
Ancestry in Cranberry Lake
The most populous ancestries reported in Cranberry Lake are English (26 | 21.0%), Irish (21 | 16.9%), German (20 | 16.1%), French (13 | 10.5%), and American (9 | 7.3%), together accounting for 71.8% of all Cranberry Lake residents.
| Ancestry | # Population | % Population |
| American | 9 | 7.3% |
| Austrian | 2 | 1.6% |
| British | 2 | 1.6% |
| Dutch | 2 | 1.6% |
| Eastern European | 2 | 1.6% |
| English | 26 | 21.0% |
| French | 13 | 10.5% |
| French Canadian | 6 | 4.8% |
| German | 20 | 16.1% |
| Hungarian | 2 | 1.6% |
| Irish | 21 | 16.9% |
| Italian | 4 | 3.2% |
| Norwegian | 2 | 1.6% |
| Scandinavian | 1 | 0.8% |
| Scottish | 2 | 1.6% |
| Slovak | 2 | 1.6% |
| Swedish | 2 | 1.6% |
| Ukrainian | 1 | 0.8% |
| Welsh | 2 | 1.6% | View All 19 Rows |
Immigrants in Cranberry Lake

| Immigration Origin | # Population | % Population | View All 0 Rows |
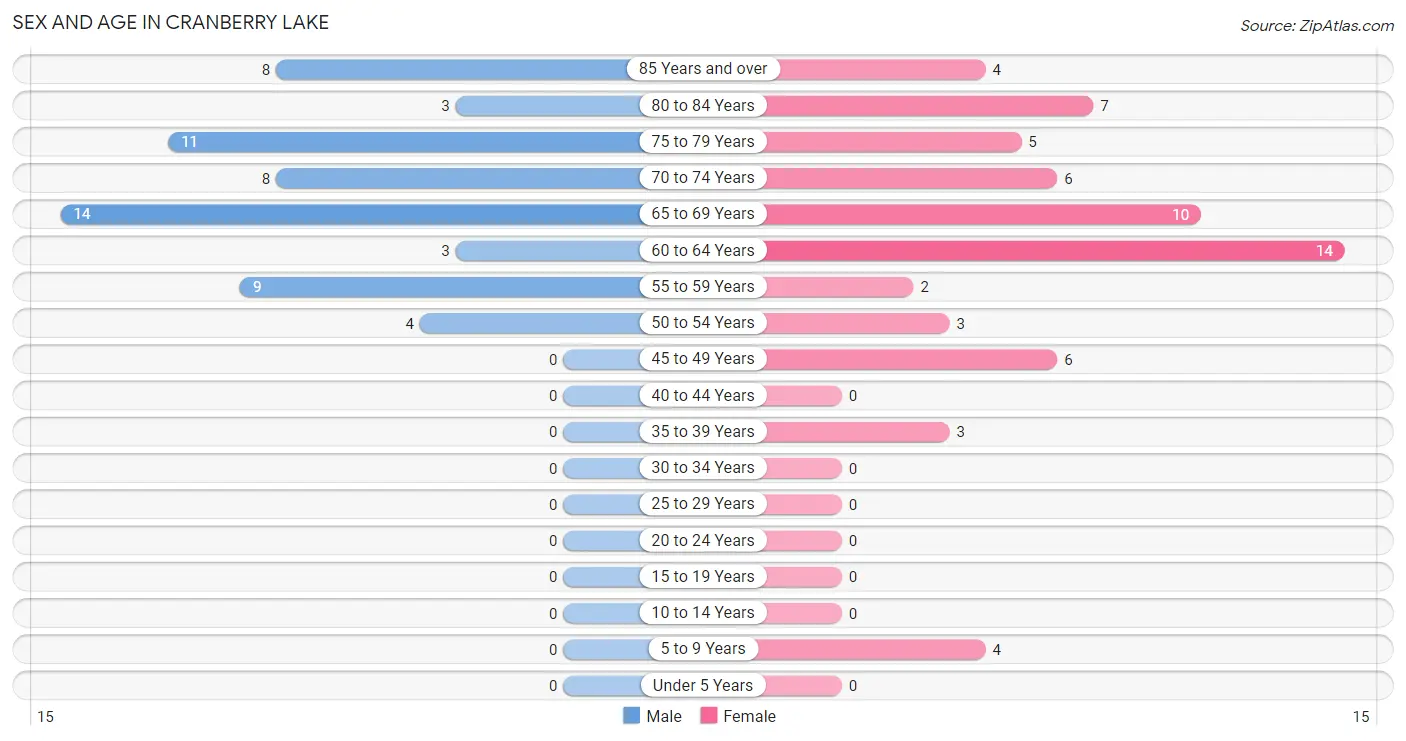
Sex and Age in Cranberry Lake
Sex and Age in Cranberry Lake
The most populous age groups in Cranberry Lake are 65 to 69 Years (14 | 23.3%) for men and 60 to 64 Years (14 | 21.9%) for women.
| Age Bracket | Male | Female |
| Under 5 Years | 0 (0.0%) | 0 (0.0%) |
| 5 to 9 Years | 0 (0.0%) | 4 (6.2%) |
| 10 to 14 Years | 0 (0.0%) | 0 (0.0%) |
| 15 to 19 Years | 0 (0.0%) | 0 (0.0%) |
| 20 to 24 Years | 0 (0.0%) | 0 (0.0%) |
| 25 to 29 Years | 0 (0.0%) | 0 (0.0%) |
| 30 to 34 Years | 0 (0.0%) | 0 (0.0%) |
| 35 to 39 Years | 0 (0.0%) | 3 (4.7%) |
| 40 to 44 Years | 0 (0.0%) | 0 (0.0%) |
| 45 to 49 Years | 0 (0.0%) | 6 (9.4%) |
| 50 to 54 Years | 4 (6.7%) | 3 (4.7%) |
| 55 to 59 Years | 9 (15.0%) | 2 (3.1%) |
| 60 to 64 Years | 3 (5.0%) | 14 (21.9%) |
| 65 to 69 Years | 14 (23.3%) | 10 (15.6%) |
| 70 to 74 Years | 8 (13.3%) | 6 (9.4%) |
| 75 to 79 Years | 11 (18.3%) | 5 (7.8%) |
| 80 to 84 Years | 3 (5.0%) | 7 (10.9%) |
| 85 Years and over | 8 (13.3%) | 4 (6.2%) |
| Total | 60 (100.0%) | 64 (100.0%) |
Families and Households in Cranberry Lake
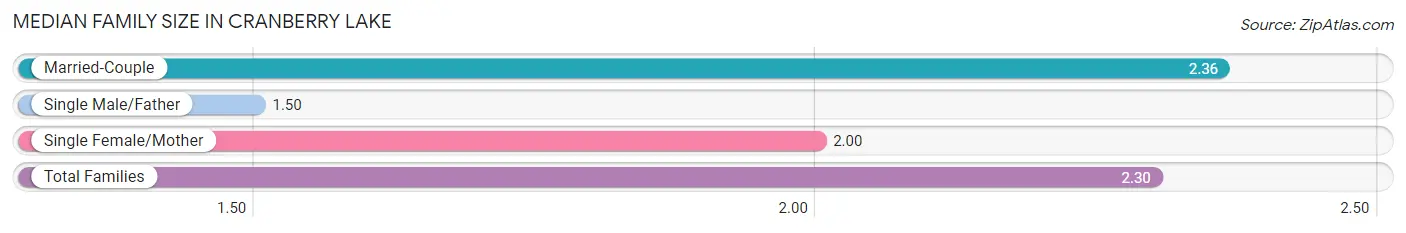
Median Family Size in Cranberry Lake
The median family size in Cranberry Lake is 2.30 persons per family, with married-couple families (36 | 90.0%) accounting for the largest median family size of 2.36 persons per family. On the other hand, single male/father families (2 | 5.0%) represent the smallest median family size with 1.50 persons per family.
| Family Type | # Families | Family Size |
| Married-Couple | 36 (90.0%) | 2.36 |
| Single Male/Father | 2 (5.0%) | 1.50 |
| Single Female/Mother | 2 (5.0%) | 2.00 |
| Total Families | 40 (100.0%) | 2.30 |
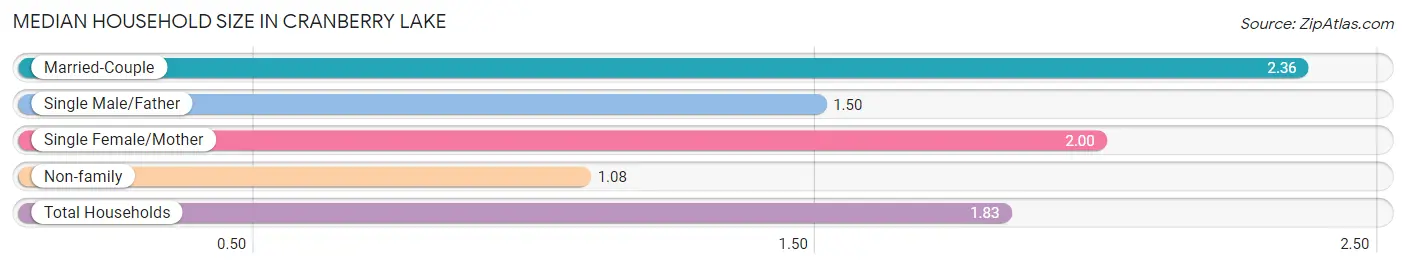
Median Household Size in Cranberry Lake
The median household size in Cranberry Lake is 1.83 persons per household, with married-couple households (36 | 55.4%) accounting for the largest median household size of 2.36 persons per household. non-family households (25 | 38.5%) represent the smallest median household size with 1.08 persons per household.
| Household Type | # Households | Household Size |
| Married-Couple | 36 (55.4%) | 2.36 |
| Single Male/Father | 2 (3.1%) | 1.50 |
| Single Female/Mother | 2 (3.1%) | 2.00 |
| Non-family | 25 (38.5%) | 1.08 |
| Total Households | 65 (100.0%) | 1.83 |
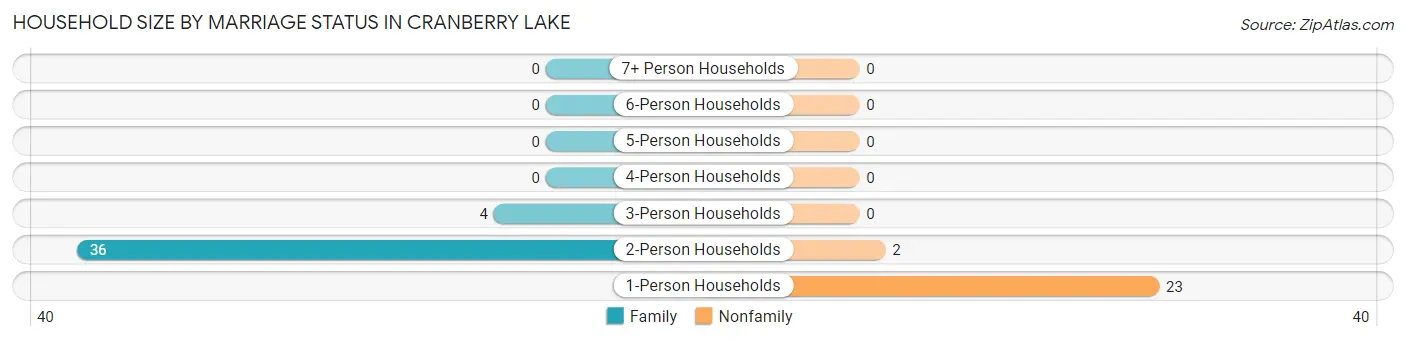
Household Size by Marriage Status in Cranberry Lake
Out of a total of 65 households in Cranberry Lake, 40 (61.5%) are family households, while 25 (38.5%) are nonfamily households. The most numerous type of family households are 2-person households, comprising 36, and the most common type of nonfamily households are 1-person households, comprising 23.
| Household Size | Family Households | Nonfamily Households |
| 1-Person Households | - | 23 (35.4%) |
| 2-Person Households | 36 (55.4%) | 2 (3.1%) |
| 3-Person Households | 4 (6.1%) | 0 (0.0%) |
| 4-Person Households | 0 (0.0%) | 0 (0.0%) |
| 5-Person Households | 0 (0.0%) | 0 (0.0%) |
| 6-Person Households | 0 (0.0%) | 0 (0.0%) |
| 7+ Person Households | 0 (0.0%) | 0 (0.0%) |
| Total | 40 (61.5%) | 25 (38.5%) |
Female Fertility in Cranberry Lake
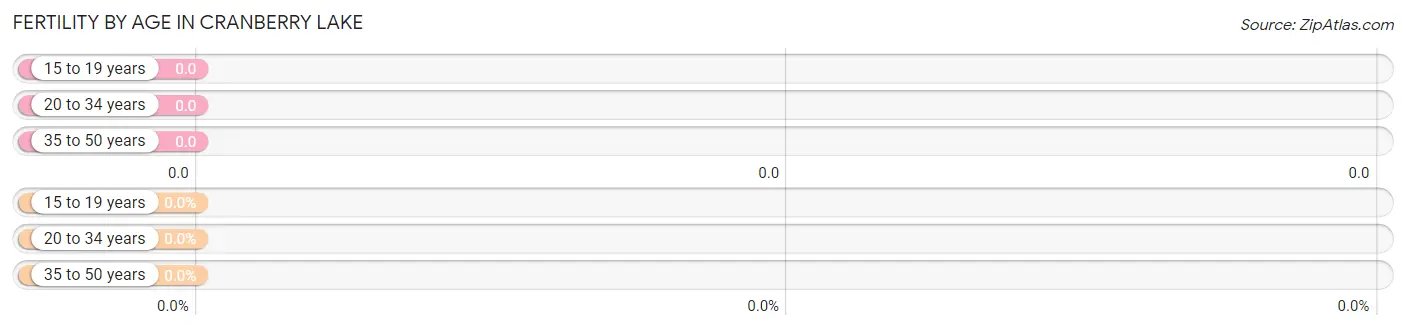
Fertility by Age in Cranberry Lake
| Age Bracket | Women with Births | Births / 1,000 Women |
| 15 to 19 years | 0 (0.0%) | 0.0 |
| 20 to 34 years | 0 (0.0%) | 0.0 |
| 35 to 50 years | 0 (0.0%) | 0.0 |
| Total | 0 (0.0%) | 0.0 |
Fertility by Age by Marriage Status in Cranberry Lake
| Age Bracket | Married | Unmarried |
| 15 to 19 years | 0 (0.0%) | 0 (0.0%) |
| 20 to 34 years | 0 (0.0%) | 0 (0.0%) |
| 35 to 50 years | 0 (0.0%) | 0 (0.0%) |
| Total | 0 (0.0%) | 0 (0.0%) |
Fertility by Education in Cranberry Lake
| Educational Attainment | Women with Births | Births / 1,000 Women |
| Less than High School | 0 (0.0%) | 0.0 |
| High School Diploma | 0 (0.0%) | 0.0 |
| College or Associate's Degree | 0 (0.0%) | 0.0 |
| Bachelor's Degree | 0 (0.0%) | 0.0 |
| Graduate Degree | 0 (0.0%) | 0.0 |
| Total | 0 (0.0%) | 0.0 |
Fertility by Education by Marriage Status in Cranberry Lake
| Educational Attainment | Married | Unmarried |
| Less than High School | 0 (0.0%) | 0 (0.0%) |
| High School Diploma | 0 (0.0%) | 0 (0.0%) |
| College or Associate's Degree | 0 (0.0%) | 0 (0.0%) |
| Bachelor's Degree | 0 (0.0%) | 0 (0.0%) |
| Graduate Degree | 0 (0.0%) | 0 (0.0%) |
| Total | 0 (0.0%) | 0 (0.0%) |
Income in Cranberry Lake
Income Overview in Cranberry Lake
Per Capita Income in Cranberry Lake is $59,526, while median incomes of families and households are $93,750 and $86,250 respectively.
| Characteristic | Number | Measure |
| Per Capita Income | 124 | $59,526 |
| Median Family Income | 40 | $93,750 |
| Mean Family Income | 40 | $91,085 |
| Median Household Income | 65 | $86,250 |
| Mean Household Income | 65 | $107,525 |
| Income Deficit | 40 | $0 |
| Wage / Income Gap (%) | 124 | 0.00% |
| Wage / Income Gap ($) | 124 | 100.00¢ per $1 |
| Gini / Inequality Index | 124 | 0.46 |
Earnings by Sex in Cranberry Lake
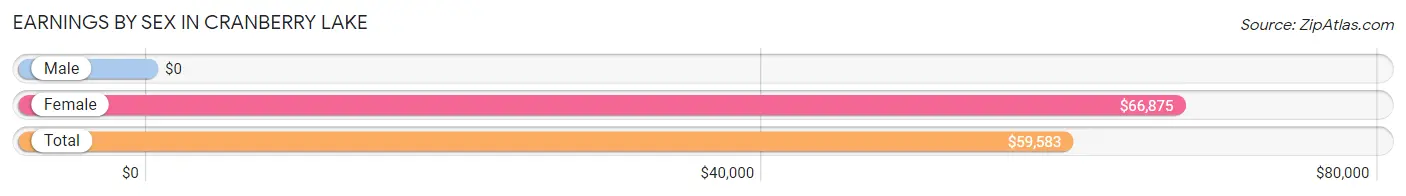
| Sex | Number | Average Earnings |
| Male | 10 (30.3%) | $0 |
| Female | 23 (69.7%) | $66,875 |
| Total | 33 (100.0%) | $59,583 |
Earnings by Sex by Income Bracket in Cranberry Lake
The most common earnings brackets in Cranberry Lake are $25,000 to $29,999 for men (3 | 30.0%) and $75,000 to $99,999 for women (11 | 47.8%).
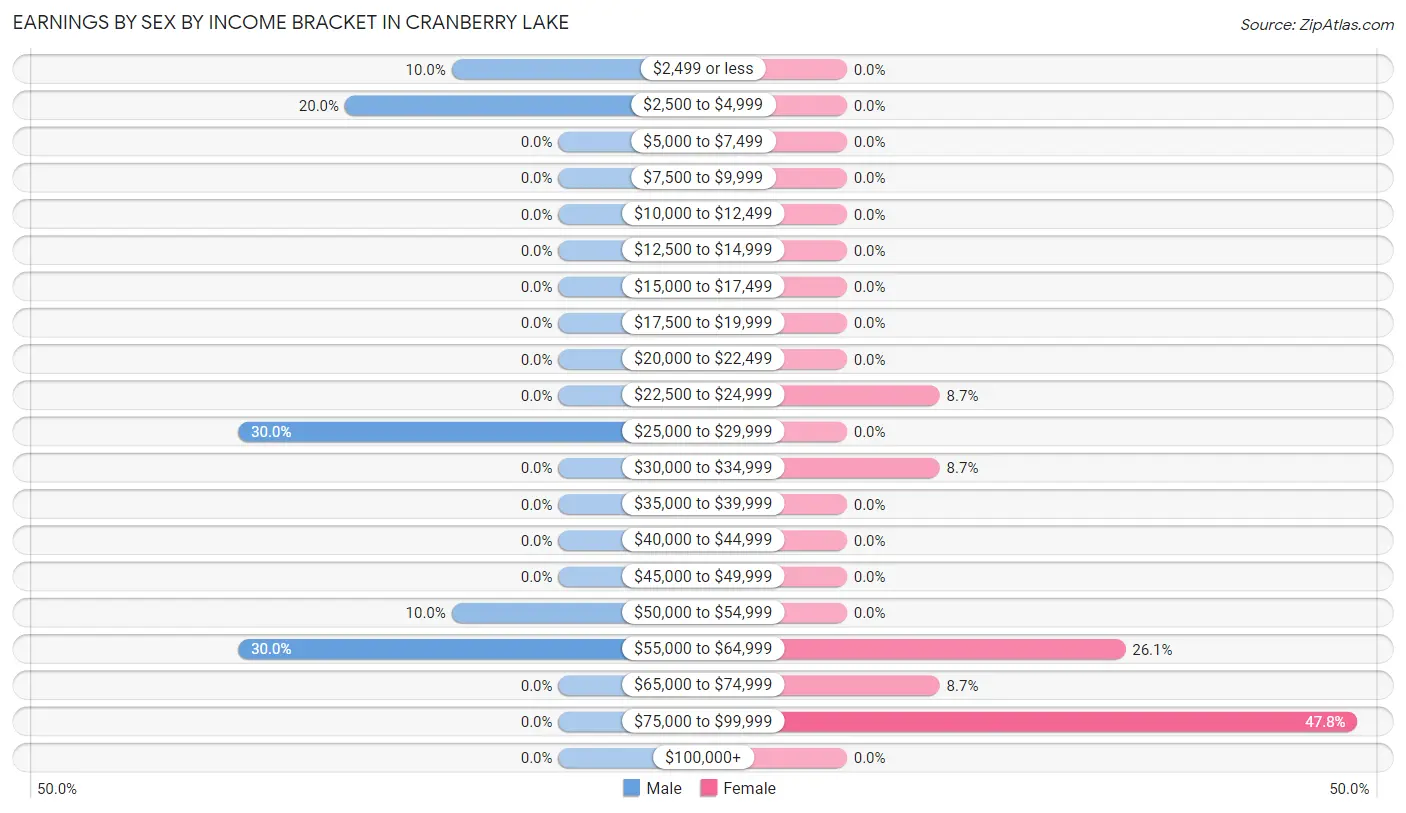
| Income | Male | Female |
| $2,499 or less | 1 (10.0%) | 0 (0.0%) |
| $2,500 to $4,999 | 2 (20.0%) | 0 (0.0%) |
| $5,000 to $7,499 | 0 (0.0%) | 0 (0.0%) |
| $7,500 to $9,999 | 0 (0.0%) | 0 (0.0%) |
| $10,000 to $12,499 | 0 (0.0%) | 0 (0.0%) |
| $12,500 to $14,999 | 0 (0.0%) | 0 (0.0%) |
| $15,000 to $17,499 | 0 (0.0%) | 0 (0.0%) |
| $17,500 to $19,999 | 0 (0.0%) | 0 (0.0%) |
| $20,000 to $22,499 | 0 (0.0%) | 0 (0.0%) |
| $22,500 to $24,999 | 0 (0.0%) | 2 (8.7%) |
| $25,000 to $29,999 | 3 (30.0%) | 0 (0.0%) |
| $30,000 to $34,999 | 0 (0.0%) | 2 (8.7%) |
| $35,000 to $39,999 | 0 (0.0%) | 0 (0.0%) |
| $40,000 to $44,999 | 0 (0.0%) | 0 (0.0%) |
| $45,000 to $49,999 | 0 (0.0%) | 0 (0.0%) |
| $50,000 to $54,999 | 1 (10.0%) | 0 (0.0%) |
| $55,000 to $64,999 | 3 (30.0%) | 6 (26.1%) |
| $65,000 to $74,999 | 0 (0.0%) | 2 (8.7%) |
| $75,000 to $99,999 | 0 (0.0%) | 11 (47.8%) |
| $100,000+ | 0 (0.0%) | 0 (0.0%) |
| Total | 10 (100.0%) | 23 (100.0%) |
Earnings by Sex by Educational Attainment in Cranberry Lake
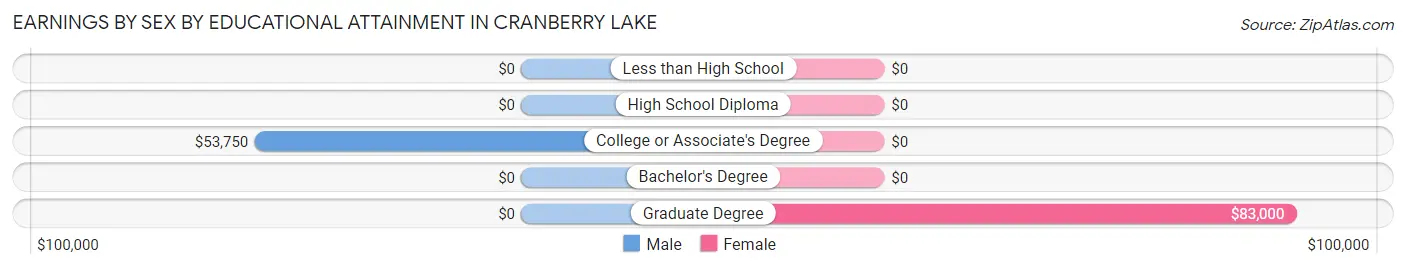
| Educational Attainment | Male Income | Female Income |
| Less than High School | - | - |
| High School Diploma | - | - |
| College or Associate's Degree | $53,750 | $0 |
| Bachelor's Degree | - | - |
| Graduate Degree | - | - |
| Total | - | - |
Family Income in Cranberry Lake
Family Income Brackets in Cranberry Lake
According to the Cranberry Lake family income data, there are 16 families falling into the $100,000 to $149,999 income range, which is the most common income bracket and makes up 40.0% of all families.
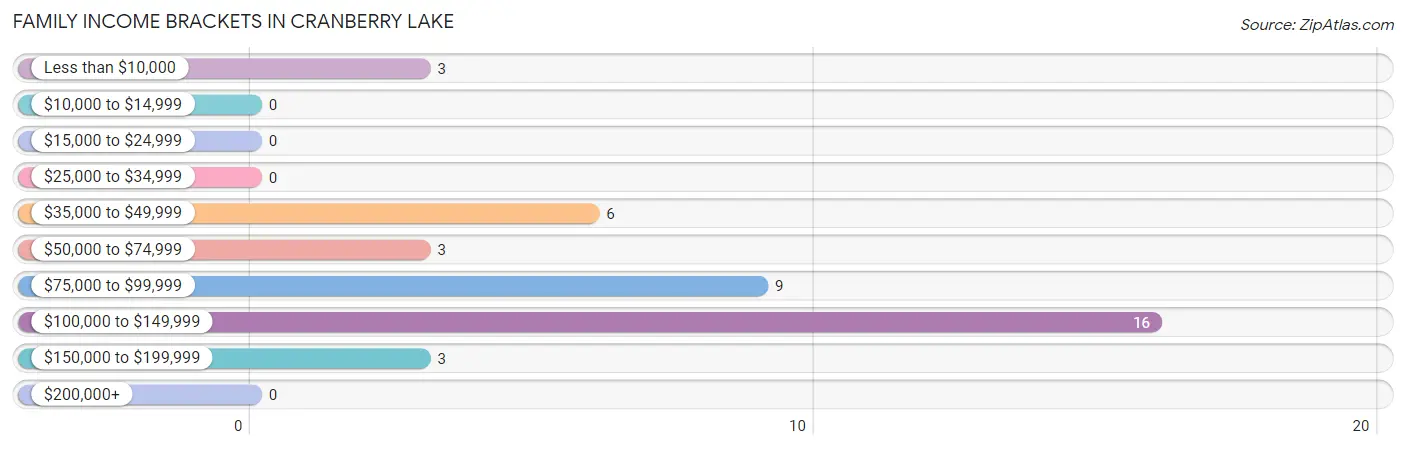
| Income Bracket | # Families | % Families |
| Less than $10,000 | 3 | 7.5% |
| $10,000 to $14,999 | 0 | 0.0% |
| $15,000 to $24,999 | 0 | 0.0% |
| $25,000 to $34,999 | 0 | 0.0% |
| $35,000 to $49,999 | 6 | 15.0% |
| $50,000 to $74,999 | 3 | 7.5% |
| $75,000 to $99,999 | 9 | 22.5% |
| $100,000 to $149,999 | 16 | 40.0% |
| $150,000 to $199,999 | 3 | 7.5% |
| $200,000+ | 0 | 0.0% |
Family Income by Famaliy Size in Cranberry Lake
2-person families (36 | 90.0%) account for the highest median family income in Cranberry Lake with $87,500 per family, while 2-person families (36 | 90.0%) have the highest median income of $43,750 per family member.
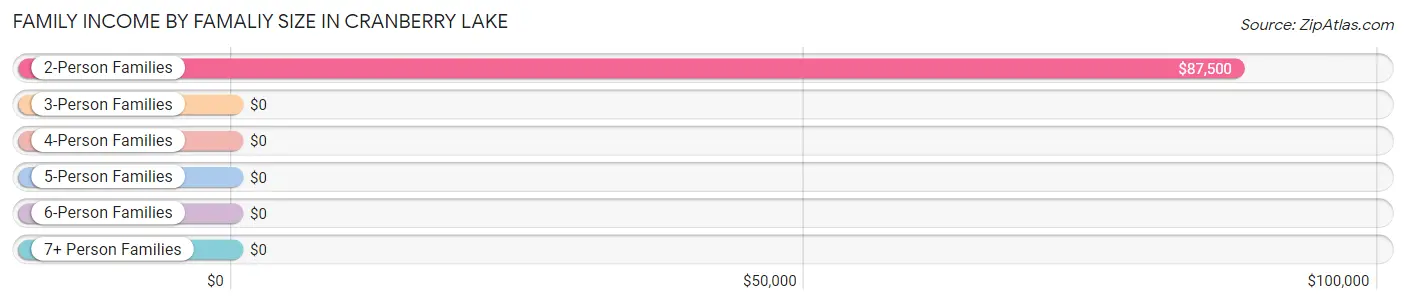
| Income Bracket | # Families | Median Income |
| 2-Person Families | 36 (90.0%) | $87,500 |
| 3-Person Families | 4 (10.0%) | $0 |
| 4-Person Families | 0 (0.0%) | $0 |
| 5-Person Families | 0 (0.0%) | $0 |
| 6-Person Families | 0 (0.0%) | $0 |
| 7+ Person Families | 0 (0.0%) | $0 |
| Total | 40 (100.0%) | $93,750 |
Family Income by Number of Earners in Cranberry Lake
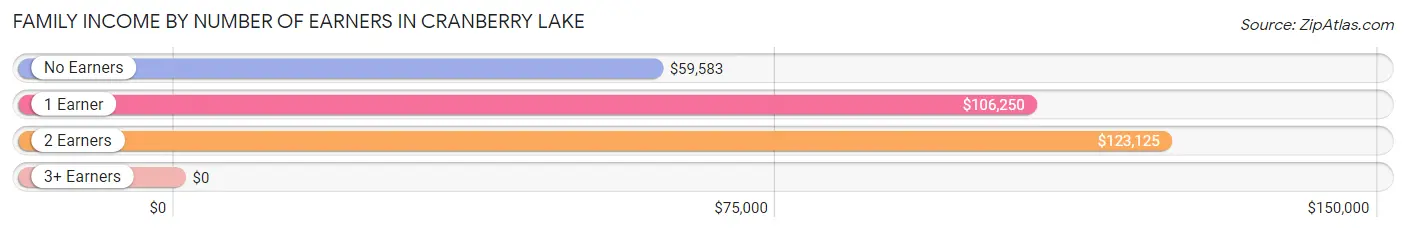
| Number of Earners | # Families | Median Income |
| No Earners | 23 (57.5%) | $59,583 |
| 1 Earner | 8 (20.0%) | $106,250 |
| 2 Earners | 9 (22.5%) | $123,125 |
| 3+ Earners | 0 (0.0%) | $0 |
| Total | 40 (100.0%) | $93,750 |
Household Income in Cranberry Lake
Household Income Brackets in Cranberry Lake
With 18 households falling in the category, the $100,000 to $149,999 income range is the most frequent in Cranberry Lake, accounting for 27.7% of all households.
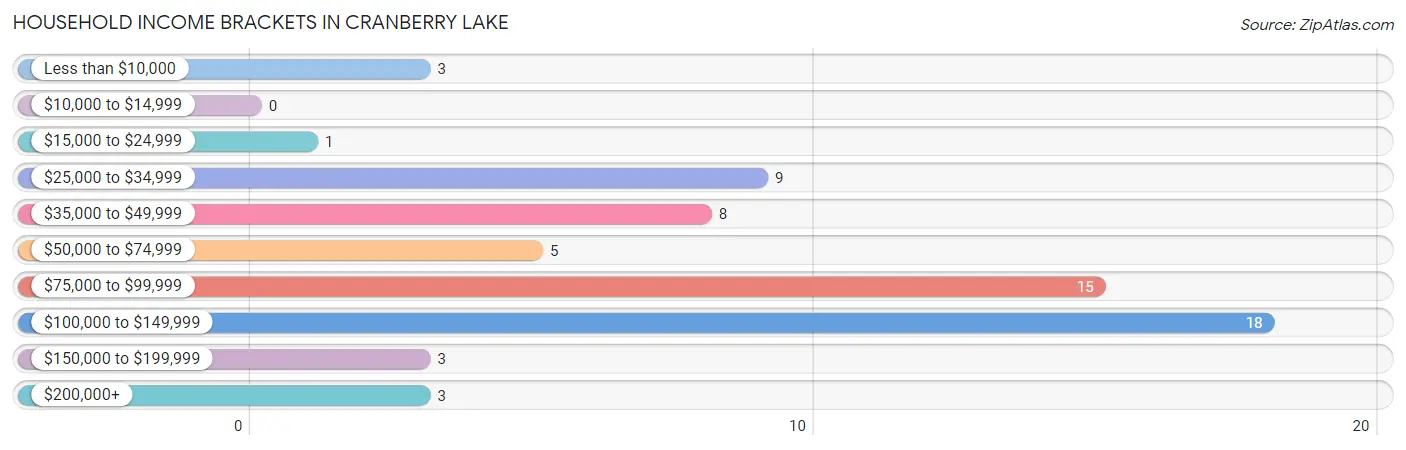
| Income Bracket | # Households | % Households |
| Less than $10,000 | 3 | 4.6% |
| $10,000 to $14,999 | 0 | 0.0% |
| $15,000 to $24,999 | 1 | 1.5% |
| $25,000 to $34,999 | 9 | 13.8% |
| $35,000 to $49,999 | 8 | 12.3% |
| $50,000 to $74,999 | 5 | 7.7% |
| $75,000 to $99,999 | 15 | 23.1% |
| $100,000 to $149,999 | 18 | 27.7% |
| $150,000 to $199,999 | 3 | 4.6% |
| $200,000+ | 3 | 4.6% |
Household Income by Householder Age in Cranberry Lake
The median household income in Cranberry Lake is $86,250, with the highest median household income of $87,500 found in the 45 to 64 years age bracket for the primary householder. A total of 16 households (24.6%) fall into this category.
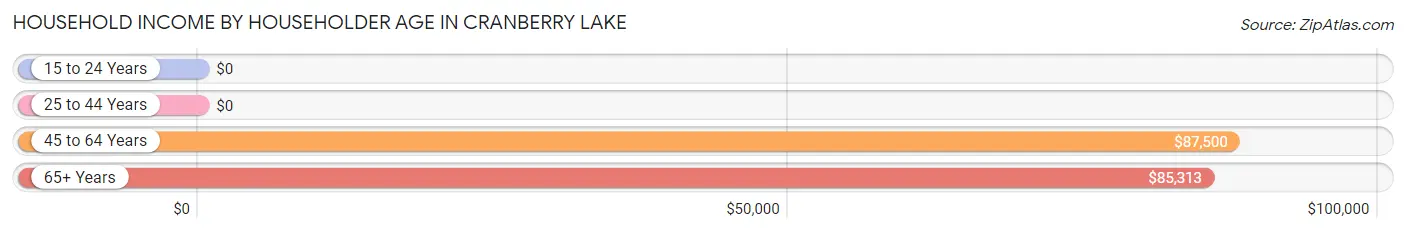
| Income Bracket | # Households | Median Income |
| 15 to 24 Years | 0 (0.0%) | $0 |
| 25 to 44 Years | 0 (0.0%) | $0 |
| 45 to 64 Years | 16 (24.6%) | $87,500 |
| 65+ Years | 49 (75.4%) | $85,313 |
| Total | 65 (100.0%) | $86,250 |
Poverty in Cranberry Lake
Income Below Poverty by Sex and Age in Cranberry Lake
With 10.0% poverty level for males and 3.1% for females among the residents of Cranberry Lake, 55 to 64 year old males and 55 to 64 year old females are the most vulnerable to poverty, with 4 males (33.3%) and 2 females (12.5%) in their respective age groups living below the poverty level.
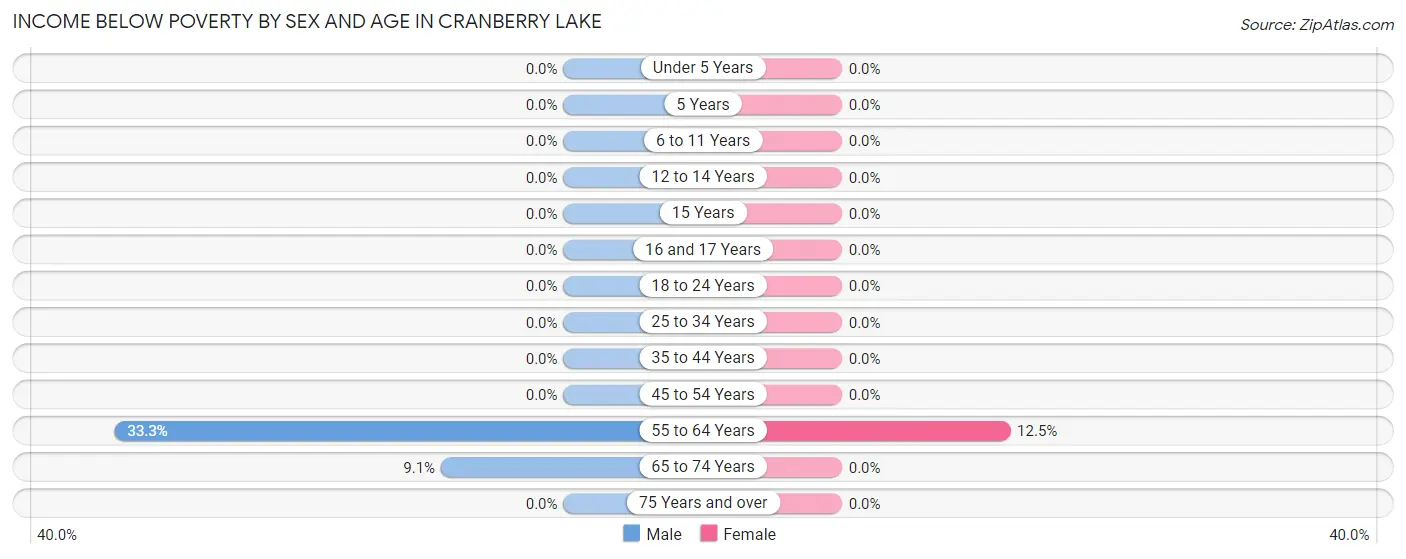
| Age Bracket | Male | Female |
| Under 5 Years | 0 (0.0%) | 0 (0.0%) |
| 5 Years | 0 (0.0%) | 0 (0.0%) |
| 6 to 11 Years | 0 (0.0%) | 0 (0.0%) |
| 12 to 14 Years | 0 (0.0%) | 0 (0.0%) |
| 15 Years | 0 (0.0%) | 0 (0.0%) |
| 16 and 17 Years | 0 (0.0%) | 0 (0.0%) |
| 18 to 24 Years | 0 (0.0%) | 0 (0.0%) |
| 25 to 34 Years | 0 (0.0%) | 0 (0.0%) |
| 35 to 44 Years | 0 (0.0%) | 0 (0.0%) |
| 45 to 54 Years | 0 (0.0%) | 0 (0.0%) |
| 55 to 64 Years | 4 (33.3%) | 2 (12.5%) |
| 65 to 74 Years | 2 (9.1%) | 0 (0.0%) |
| 75 Years and over | 0 (0.0%) | 0 (0.0%) |
| Total | 6 (10.0%) | 2 (3.1%) |
Income Above Poverty by Sex and Age in Cranberry Lake
According to the poverty statistics in Cranberry Lake, males aged 45 to 54 years and females aged 6 to 11 years are the age groups that are most secure financially, with 100.0% of males and 100.0% of females in these age groups living above the poverty line.
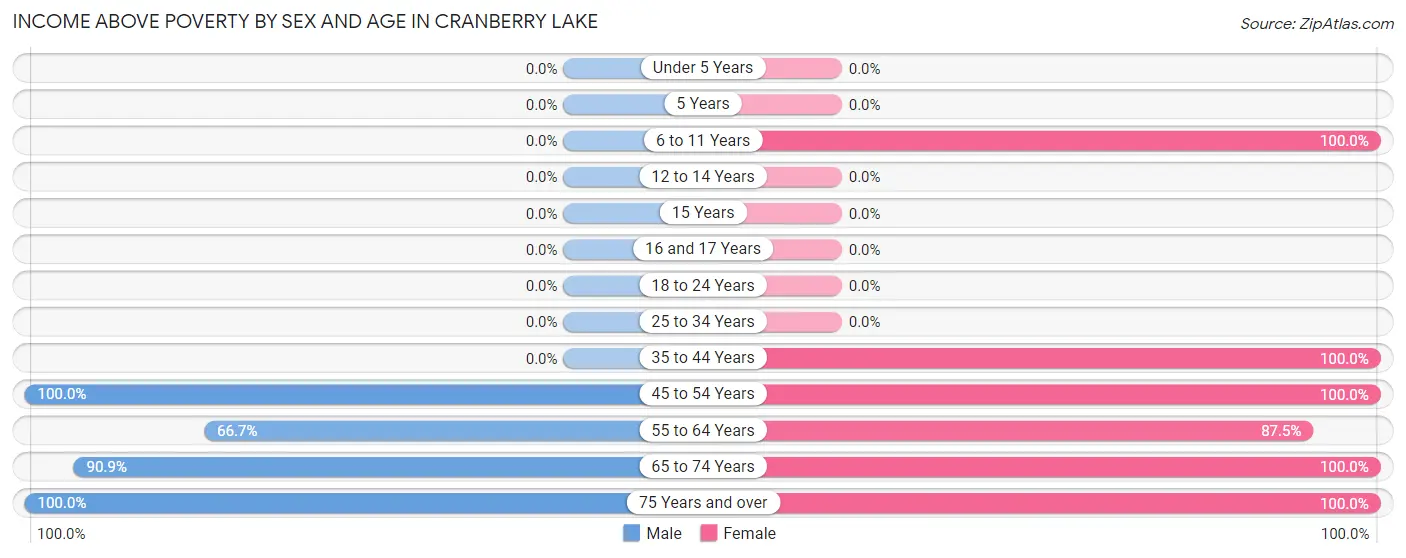
| Age Bracket | Male | Female |
| Under 5 Years | 0 (0.0%) | 0 (0.0%) |
| 5 Years | 0 (0.0%) | 0 (0.0%) |
| 6 to 11 Years | 0 (0.0%) | 4 (100.0%) |
| 12 to 14 Years | 0 (0.0%) | 0 (0.0%) |
| 15 Years | 0 (0.0%) | 0 (0.0%) |
| 16 and 17 Years | 0 (0.0%) | 0 (0.0%) |
| 18 to 24 Years | 0 (0.0%) | 0 (0.0%) |
| 25 to 34 Years | 0 (0.0%) | 0 (0.0%) |
| 35 to 44 Years | 0 (0.0%) | 3 (100.0%) |
| 45 to 54 Years | 4 (100.0%) | 9 (100.0%) |
| 55 to 64 Years | 8 (66.7%) | 14 (87.5%) |
| 65 to 74 Years | 20 (90.9%) | 16 (100.0%) |
| 75 Years and over | 22 (100.0%) | 16 (100.0%) |
| Total | 54 (90.0%) | 62 (96.9%) |
Income Below Poverty Among Married-Couple Families in Cranberry Lake
The poverty statistics for married-couple families in Cranberry Lake show that 8.3% or 3 of the total 36 families live below the poverty line. Families with no children have the highest poverty rate of 9.4%, comprising of 3 families. On the other hand, families with 1 or 2 children have the lowest poverty rate of 0.0%, which includes 0 families.
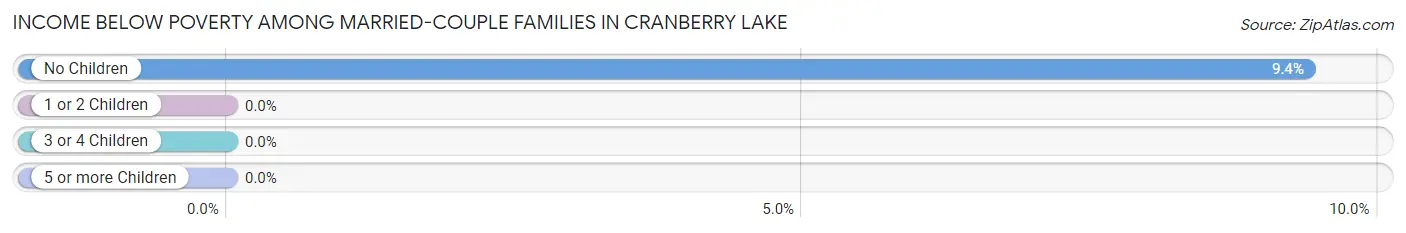
| Children | Above Poverty | Below Poverty |
| No Children | 29 (90.6%) | 3 (9.4%) |
| 1 or 2 Children | 4 (100.0%) | 0 (0.0%) |
| 3 or 4 Children | 0 (0.0%) | 0 (0.0%) |
| 5 or more Children | 0 (0.0%) | 0 (0.0%) |
| Total | 33 (91.7%) | 3 (8.3%) |
Income Below Poverty Among Single-Parent Households in Cranberry Lake
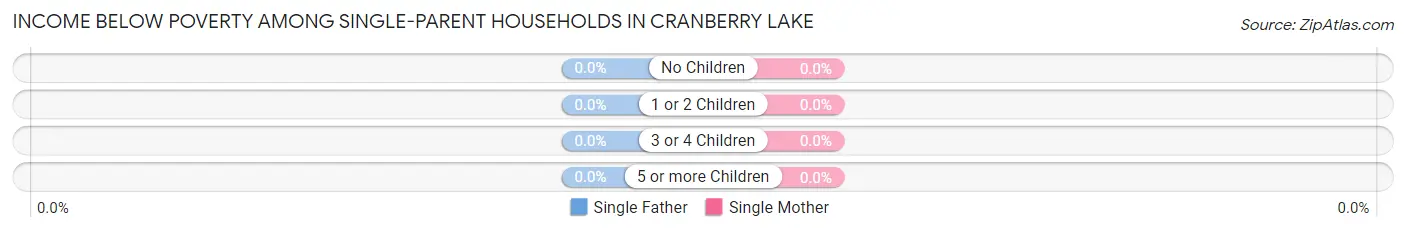
| Children | Single Father | Single Mother |
| No Children | 0 (0.0%) | 0 (0.0%) |
| 1 or 2 Children | 0 (0.0%) | 0 (0.0%) |
| 3 or 4 Children | 0 (0.0%) | 0 (0.0%) |
| 5 or more Children | 0 (0.0%) | 0 (0.0%) |
| Total | 0 (0.0%) | 0 (0.0%) |
Income Below Poverty Among Married-Couple vs Single-Parent Households in Cranberry Lake
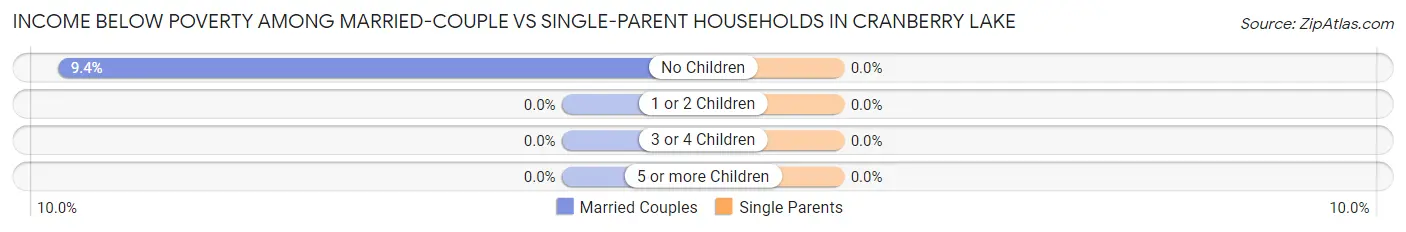
| Children | Married-Couple Families | Single-Parent Households |
| No Children | 3 (9.4%) | 0 (0.0%) |
| 1 or 2 Children | 0 (0.0%) | 0 (0.0%) |
| 3 or 4 Children | 0 (0.0%) | 0 (0.0%) |
| 5 or more Children | 0 (0.0%) | 0 (0.0%) |
| Total | 3 (8.3%) | 0 (0.0%) |
Employment Characteristics in Cranberry Lake
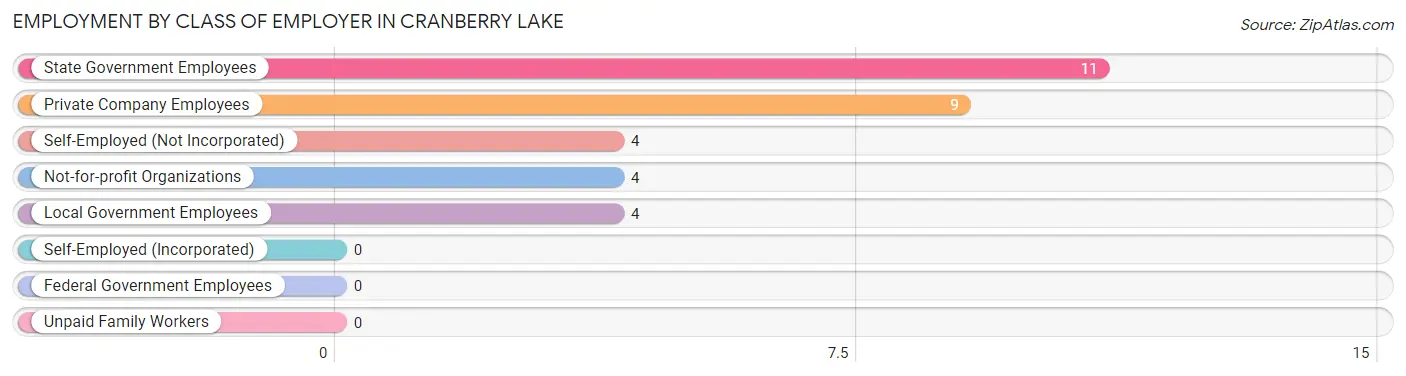
Employment by Class of Employer in Cranberry Lake
Among the 32 employed individuals in Cranberry Lake, state government employees (11 | 34.4%), private company employees (9 | 28.1%), and self-employed (not incorporated) (4 | 12.5%) make up the most common classes of employment.
| Employer Class | # Employees | % Employees |
| Private Company Employees | 9 | 28.1% |
| Self-Employed (Incorporated) | 0 | 0.0% |
| Self-Employed (Not Incorporated) | 4 | 12.5% |
| Not-for-profit Organizations | 4 | 12.5% |
| Local Government Employees | 4 | 12.5% |
| State Government Employees | 11 | 34.4% |
| Federal Government Employees | 0 | 0.0% |
| Unpaid Family Workers | 0 | 0.0% |
| Total | 32 | 100.0% |
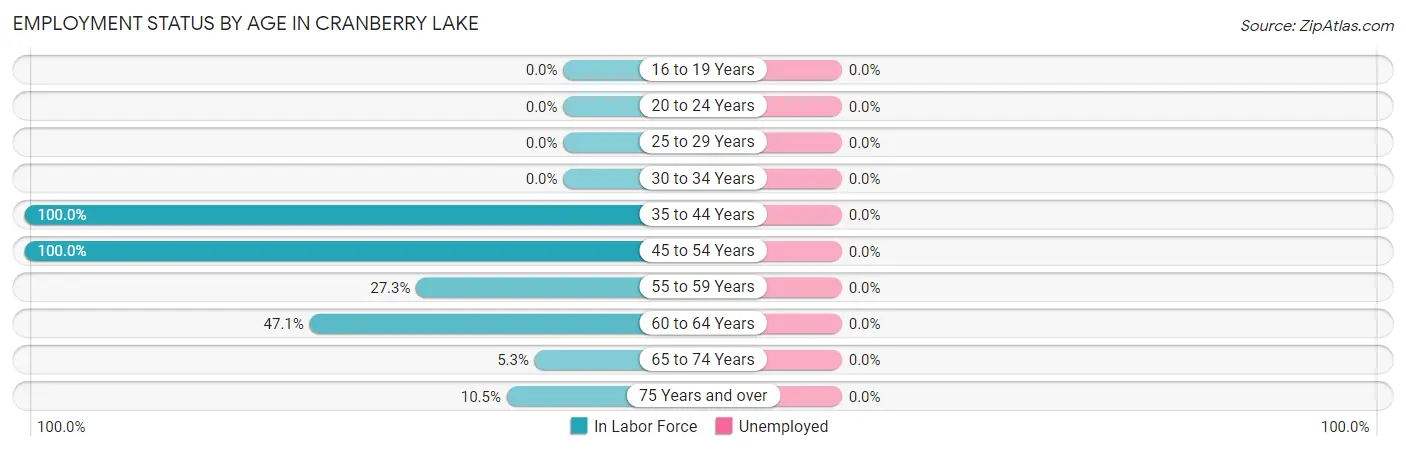
Employment Status by Age in Cranberry Lake
| Age Bracket | In Labor Force | Unemployed |
| 16 to 19 Years | 0 (0.0%) | 0 (0.0%) |
| 20 to 24 Years | 0 (0.0%) | 0 (0.0%) |
| 25 to 29 Years | 0 (0.0%) | 0 (0.0%) |
| 30 to 34 Years | 0 (0.0%) | 0 (0.0%) |
| 35 to 44 Years | 3 (100.0%) | 0 (0.0%) |
| 45 to 54 Years | 13 (100.0%) | 0 (0.0%) |
| 55 to 59 Years | 3 (27.3%) | 0 (0.0%) |
| 60 to 64 Years | 8 (47.1%) | 0 (0.0%) |
| 65 to 74 Years | 2 (5.3%) | 0 (0.0%) |
| 75 Years and over | 4 (10.5%) | 0 (0.0%) |
| Total | 33 (27.5%) | 0 (0.0%) |
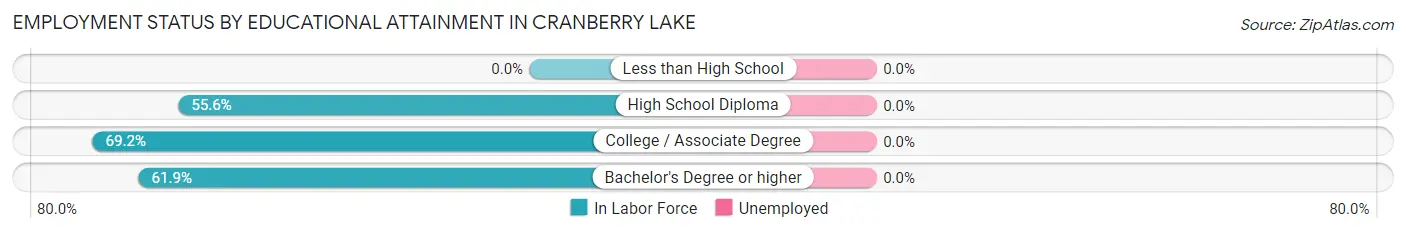
Employment Status by Educational Attainment in Cranberry Lake
| Educational Attainment | In Labor Force | Unemployed |
| Less than High School | 0 (0.0%) | 0 (0.0%) |
| High School Diploma | 5 (55.6%) | 0 (0.0%) |
| College / Associate Degree | 9 (69.2%) | 0 (0.0%) |
| Bachelor's Degree or higher | 13 (61.9%) | 0 (0.0%) |
| Total | 27 (61.4%) | 0 (0.0%) |
Employment Occupations by Sex in Cranberry Lake
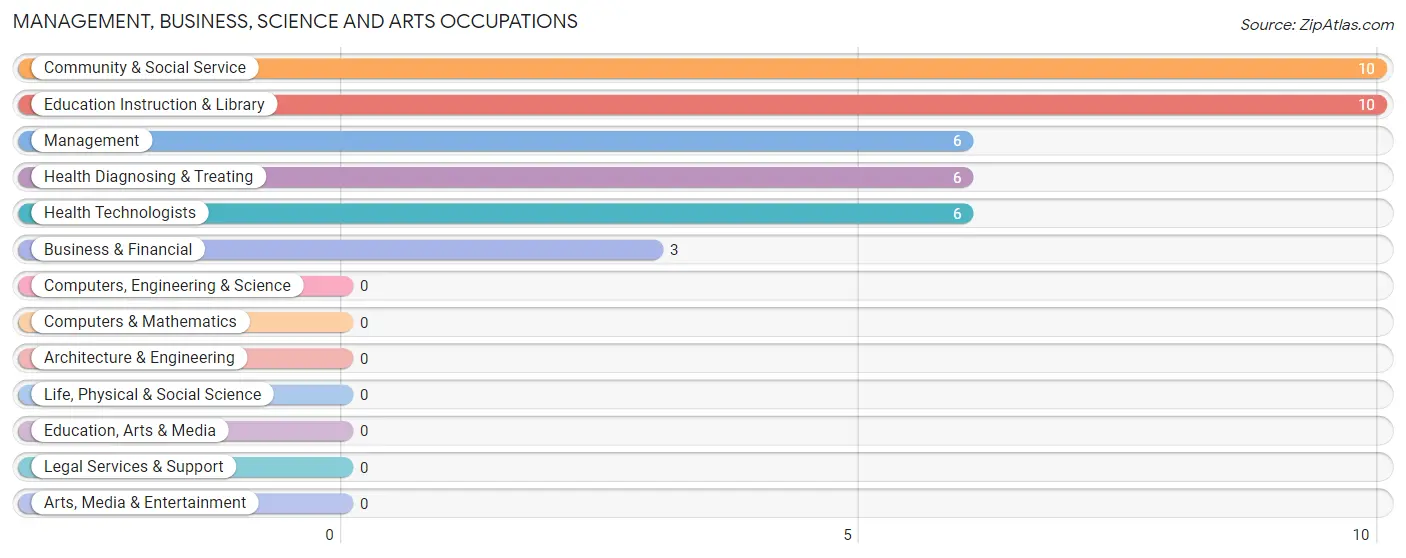
Management, Business, Science and Arts Occupations
The most common Management, Business, Science and Arts occupations in Cranberry Lake are Community & Social Service (10 | 30.3%), Education Instruction & Library (10 | 30.3%), Management (6 | 18.2%), Health Diagnosing & Treating (6 | 18.2%), and Health Technologists (6 | 18.2%).
Management, Business, Science and Arts Occupations by Sex
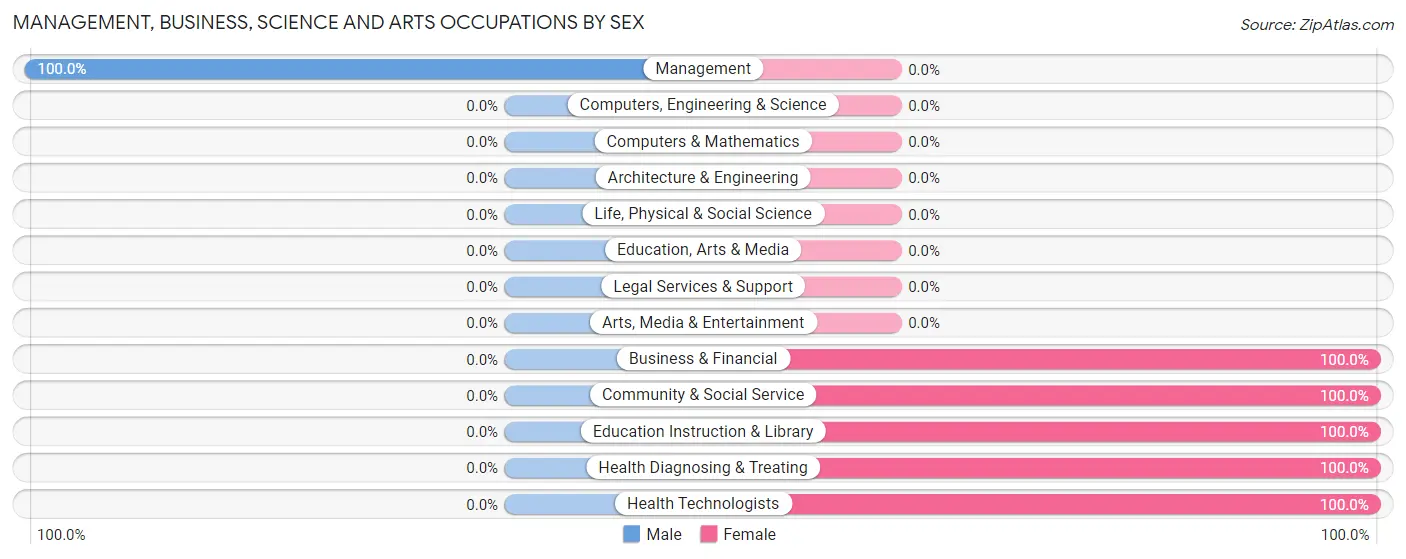
| Occupation | Male | Female |
| Management | 6 (100.0%) | 0 (0.0%) |
| Business & Financial | 0 (0.0%) | 3 (100.0%) |
| Computers, Engineering & Science | 0 (0.0%) | 0 (0.0%) |
| Computers & Mathematics | 0 (0.0%) | 0 (0.0%) |
| Architecture & Engineering | 0 (0.0%) | 0 (0.0%) |
| Life, Physical & Social Science | 0 (0.0%) | 0 (0.0%) |
| Community & Social Service | 0 (0.0%) | 10 (100.0%) |
| Education, Arts & Media | 0 (0.0%) | 0 (0.0%) |
| Legal Services & Support | 0 (0.0%) | 0 (0.0%) |
| Education Instruction & Library | 0 (0.0%) | 10 (100.0%) |
| Arts, Media & Entertainment | 0 (0.0%) | 0 (0.0%) |
| Health Diagnosing & Treating | 0 (0.0%) | 6 (100.0%) |
| Health Technologists | 0 (0.0%) | 6 (100.0%) |
| Total (Category) | 6 (24.0%) | 19 (76.0%) |
| Total (Overall) | 10 (30.3%) | 23 (69.7%) |
Services Occupations
Services Occupations by Sex
| Occupation | Male | Female |
| Healthcare Support | 0 (0.0%) | 0 (0.0%) |
| Security & Protection | 0 (0.0%) | 0 (0.0%) |
| Firefighting & Prevention | 0 (0.0%) | 0 (0.0%) |
| Law Enforcement | 0 (0.0%) | 0 (0.0%) |
| Food Preparation & Serving | 0 (0.0%) | 0 (0.0%) |
| Cleaning & Maintenance | 0 (0.0%) | 0 (0.0%) |
| Personal Care & Service | 0 (0.0%) | 0 (0.0%) |
| Total (Category) | 0 (0.0%) | 0 (0.0%) |
| Total (Overall) | 10 (30.3%) | 23 (69.7%) |
Sales and Office Occupations
The most common Sales and Office occupations in Cranberry Lake are Sales & Related (2 | 6.1%), and Office & Administration (2 | 6.1%).
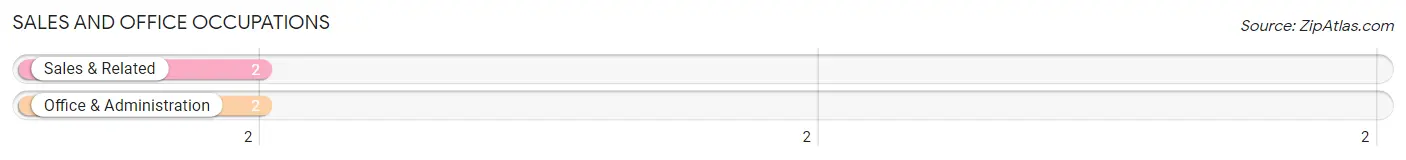
Sales and Office Occupations by Sex
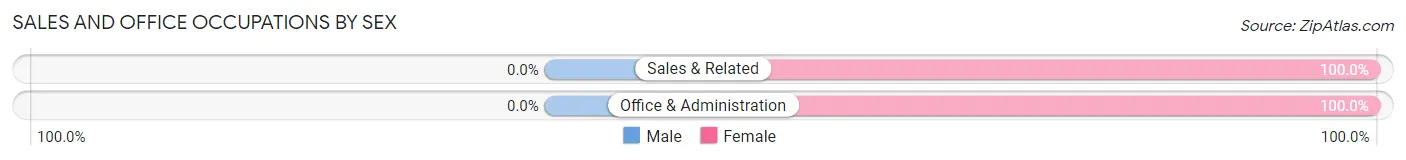
| Occupation | Male | Female |
| Sales & Related | 0 (0.0%) | 2 (100.0%) |
| Office & Administration | 0 (0.0%) | 2 (100.0%) |
| Total (Category) | 0 (0.0%) | 4 (100.0%) |
| Total (Overall) | 10 (30.3%) | 23 (69.7%) |
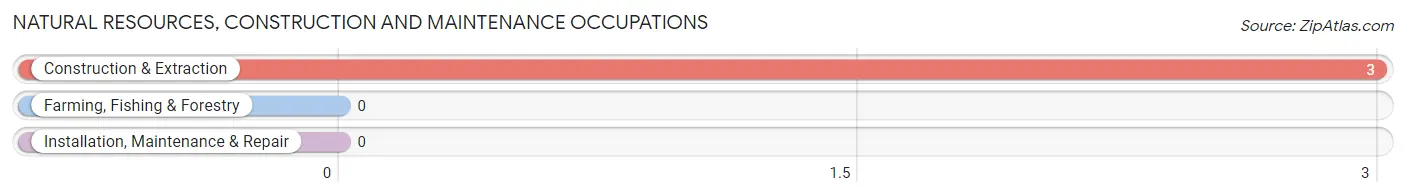
Natural Resources, Construction and Maintenance Occupations
The most common Natural Resources, Construction and Maintenance occupations in Cranberry Lake are , and Construction & Extraction (3 | 9.1%).
Natural Resources, Construction and Maintenance Occupations by Sex
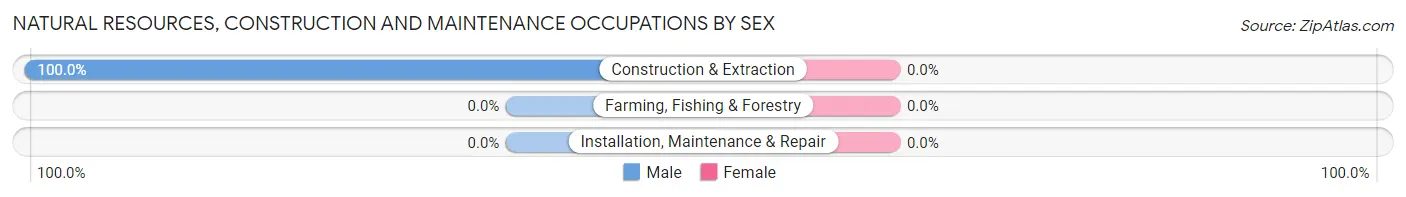
| Occupation | Male | Female |
| Farming, Fishing & Forestry | 0 (0.0%) | 0 (0.0%) |
| Construction & Extraction | 3 (100.0%) | 0 (0.0%) |
| Installation, Maintenance & Repair | 0 (0.0%) | 0 (0.0%) |
| Total (Category) | 3 (100.0%) | 0 (0.0%) |
| Total (Overall) | 10 (30.3%) | 23 (69.7%) |
Production, Transportation and Moving Occupations
The most common Production, Transportation and Moving occupations in Cranberry Lake are , and Material Moving (1 | 3.0%).
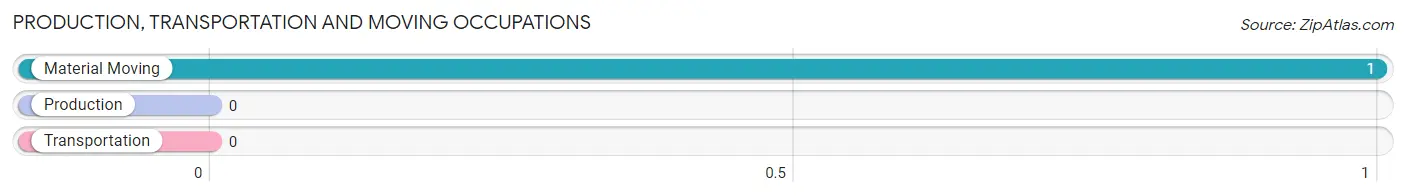
Production, Transportation and Moving Occupations by Sex
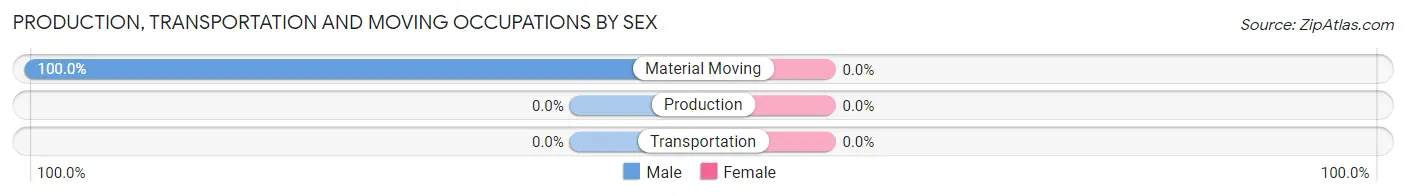
| Occupation | Male | Female |
| Production | 0 (0.0%) | 0 (0.0%) |
| Transportation | 0 (0.0%) | 0 (0.0%) |
| Material Moving | 1 (100.0%) | 0 (0.0%) |
| Total (Category) | 1 (100.0%) | 0 (0.0%) |
| Total (Overall) | 10 (30.3%) | 23 (69.7%) |
Employment Industries by Sex in Cranberry Lake
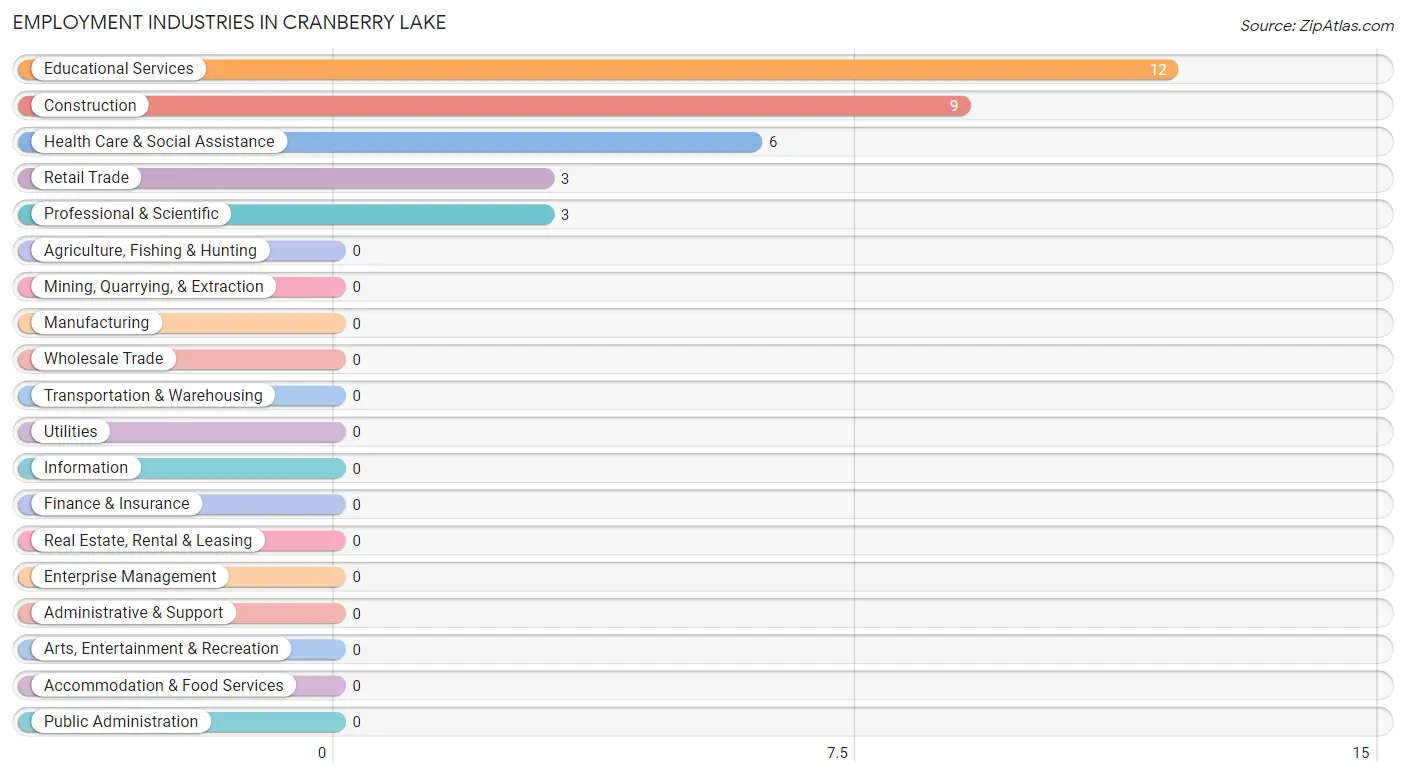
Employment Industries in Cranberry Lake
The major employment industries in Cranberry Lake include Educational Services (12 | 36.4%), Construction (9 | 27.3%), Health Care & Social Assistance (6 | 18.2%), Retail Trade (3 | 9.1%), and Professional & Scientific (3 | 9.1%).
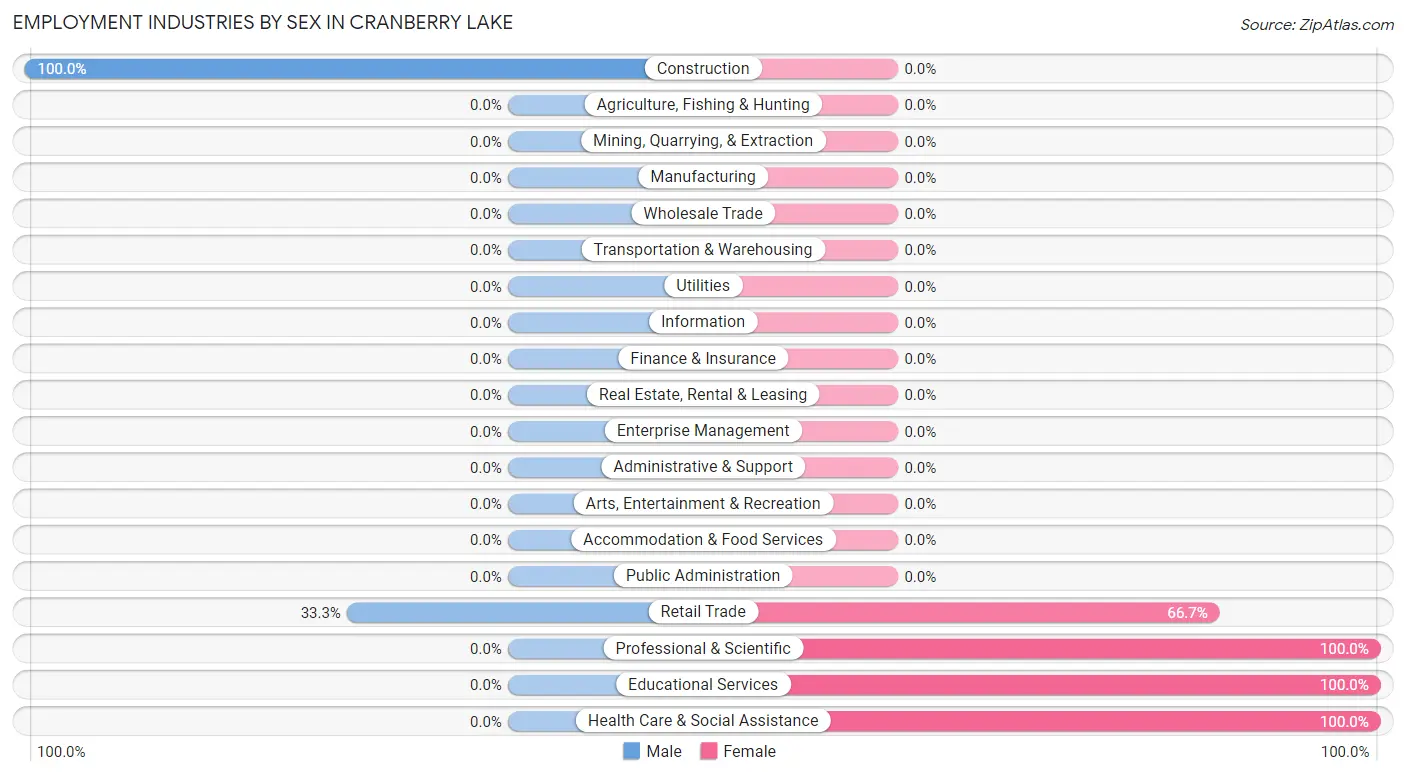
Employment Industries by Sex in Cranberry Lake
The Cranberry Lake industries that see more men than women are Construction (100.0%), and Retail Trade (33.3%), whereas the industries that tend to have a higher number of women are Professional & Scientific (100.0%), Educational Services (100.0%), and Health Care & Social Assistance (100.0%).
| Industry | Male | Female |
| Agriculture, Fishing & Hunting | 0 (0.0%) | 0 (0.0%) |
| Mining, Quarrying, & Extraction | 0 (0.0%) | 0 (0.0%) |
| Construction | 9 (100.0%) | 0 (0.0%) |
| Manufacturing | 0 (0.0%) | 0 (0.0%) |
| Wholesale Trade | 0 (0.0%) | 0 (0.0%) |
| Retail Trade | 1 (33.3%) | 2 (66.7%) |
| Transportation & Warehousing | 0 (0.0%) | 0 (0.0%) |
| Utilities | 0 (0.0%) | 0 (0.0%) |
| Information | 0 (0.0%) | 0 (0.0%) |
| Finance & Insurance | 0 (0.0%) | 0 (0.0%) |
| Real Estate, Rental & Leasing | 0 (0.0%) | 0 (0.0%) |
| Professional & Scientific | 0 (0.0%) | 3 (100.0%) |
| Enterprise Management | 0 (0.0%) | 0 (0.0%) |
| Administrative & Support | 0 (0.0%) | 0 (0.0%) |
| Educational Services | 0 (0.0%) | 12 (100.0%) |
| Health Care & Social Assistance | 0 (0.0%) | 6 (100.0%) |
| Arts, Entertainment & Recreation | 0 (0.0%) | 0 (0.0%) |
| Accommodation & Food Services | 0 (0.0%) | 0 (0.0%) |
| Public Administration | 0 (0.0%) | 0 (0.0%) |
| Total | 10 (30.3%) | 23 (69.7%) |
Education in Cranberry Lake
School Enrollment in Cranberry Lake
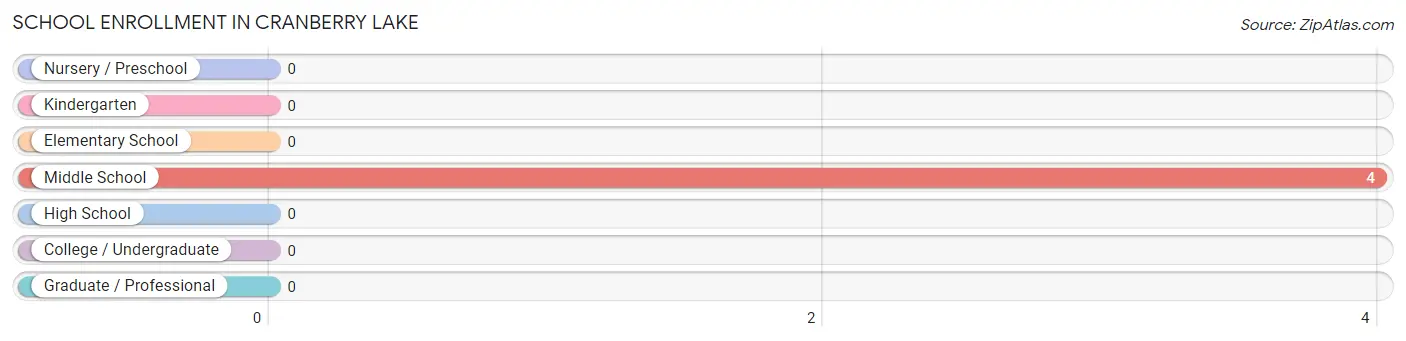
| School Level | # Students | % Students |
| Nursery / Preschool | 0 | 0.0% |
| Kindergarten | 0 | 0.0% |
| Elementary School | 0 | 0.0% |
| Middle School | 4 | 100.0% |
| High School | 0 | 0.0% |
| College / Undergraduate | 0 | 0.0% |
| Graduate / Professional | 0 | 0.0% |
| Total | 4 | 100.0% |
School Enrollment by Age by Funding Source in Cranberry Lake
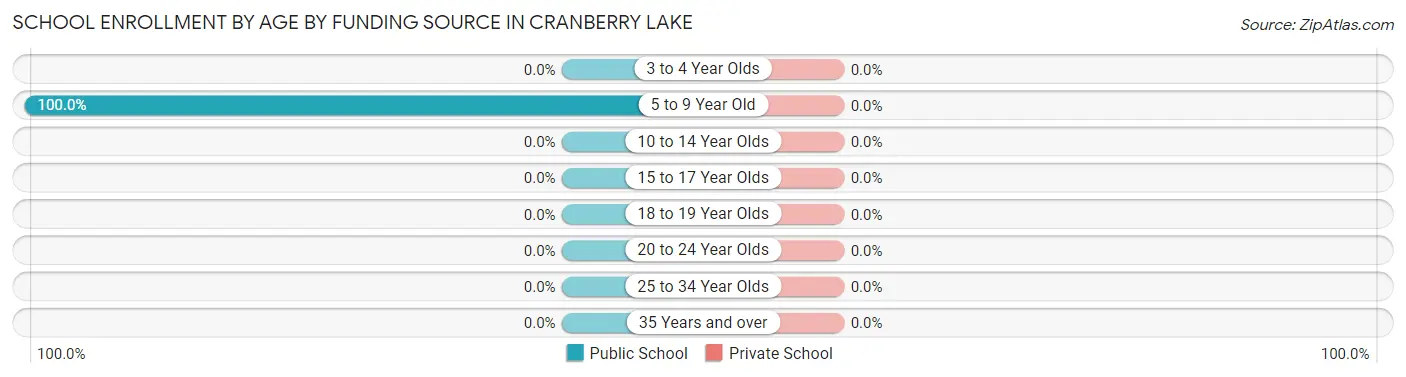
| Age Bracket | Public School | Private School |
| 3 to 4 Year Olds | 0 (0.0%) | 0 (0.0%) |
| 5 to 9 Year Old | 4 (100.0%) | 0 (0.0%) |
| 10 to 14 Year Olds | 0 (0.0%) | 0 (0.0%) |
| 15 to 17 Year Olds | 0 (0.0%) | 0 (0.0%) |
| 18 to 19 Year Olds | 0 (0.0%) | 0 (0.0%) |
| 20 to 24 Year Olds | 0 (0.0%) | 0 (0.0%) |
| 25 to 34 Year Olds | 0 (0.0%) | 0 (0.0%) |
| 35 Years and over | 0 (0.0%) | 0 (0.0%) |
| Total | 4 (100.0%) | 0 (0.0%) |
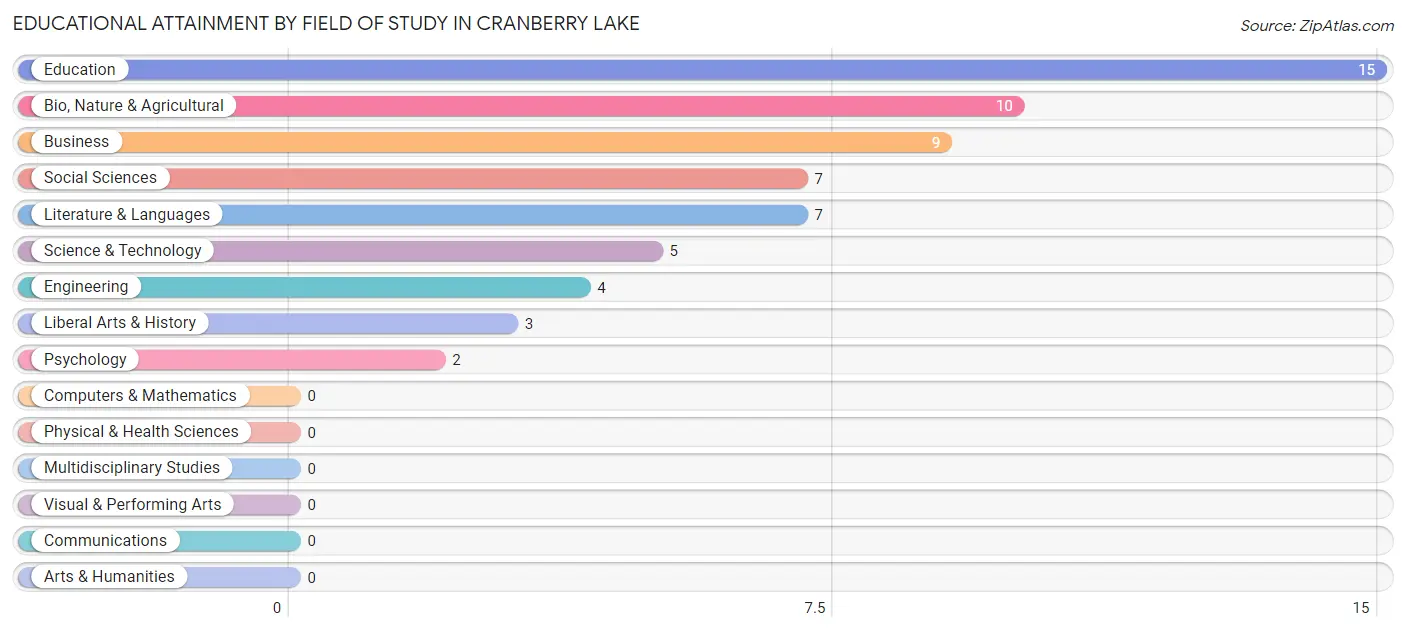
Educational Attainment by Field of Study in Cranberry Lake
Education (15 | 24.2%), bio, nature & agricultural (10 | 16.1%), business (9 | 14.5%), social sciences (7 | 11.3%), and literature & languages (7 | 11.3%) are the most common fields of study among 62 individuals in Cranberry Lake who have obtained a bachelor's degree or higher.
| Field of Study | # Graduates | % Graduates |
| Computers & Mathematics | 0 | 0.0% |
| Bio, Nature & Agricultural | 10 | 16.1% |
| Physical & Health Sciences | 0 | 0.0% |
| Psychology | 2 | 3.2% |
| Social Sciences | 7 | 11.3% |
| Engineering | 4 | 6.5% |
| Multidisciplinary Studies | 0 | 0.0% |
| Science & Technology | 5 | 8.1% |
| Business | 9 | 14.5% |
| Education | 15 | 24.2% |
| Literature & Languages | 7 | 11.3% |
| Liberal Arts & History | 3 | 4.8% |
| Visual & Performing Arts | 0 | 0.0% |
| Communications | 0 | 0.0% |
| Arts & Humanities | 0 | 0.0% |
| Total | 62 | 100.0% |
Transportation & Commute in Cranberry Lake
Vehicle Availability by Sex in Cranberry Lake
The most prevalent vehicle ownership categories in Cranberry Lake are males with 2 vehicles (6, accounting for 66.7%) and females with 2 vehicles (18, making up 26.1%).
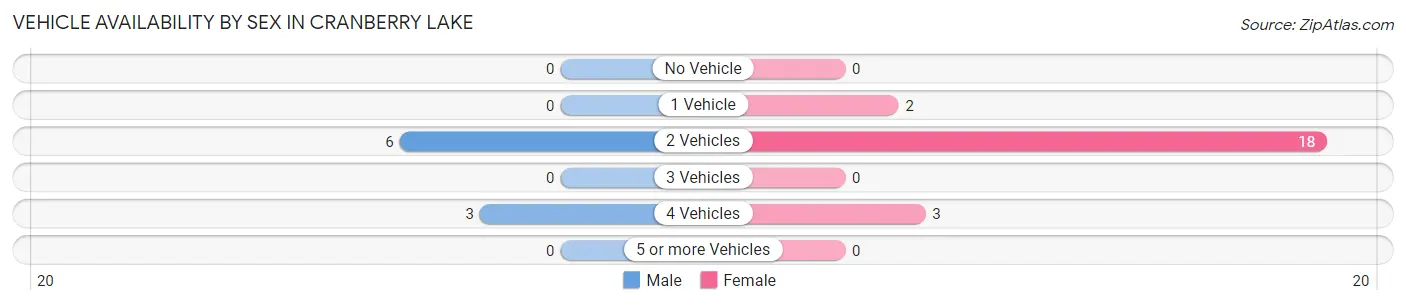
| Vehicles Available | Male | Female |
| No Vehicle | 0 (0.0%) | 0 (0.0%) |
| 1 Vehicle | 0 (0.0%) | 2 (8.7%) |
| 2 Vehicles | 6 (66.7%) | 18 (78.3%) |
| 3 Vehicles | 0 (0.0%) | 0 (0.0%) |
| 4 Vehicles | 3 (33.3%) | 3 (13.0%) |
| 5 or more Vehicles | 0 (0.0%) | 0 (0.0%) |
| Total | 9 (100.0%) | 23 (100.0%) |
Commute Time in Cranberry Lake
The most frequently occuring commute durations in Cranberry Lake are 35 to 39 minutes (6 commuters, 21.4%), 20 to 24 minutes (5 commuters, 17.9%), and 40 to 44 minutes (5 commuters, 17.9%).
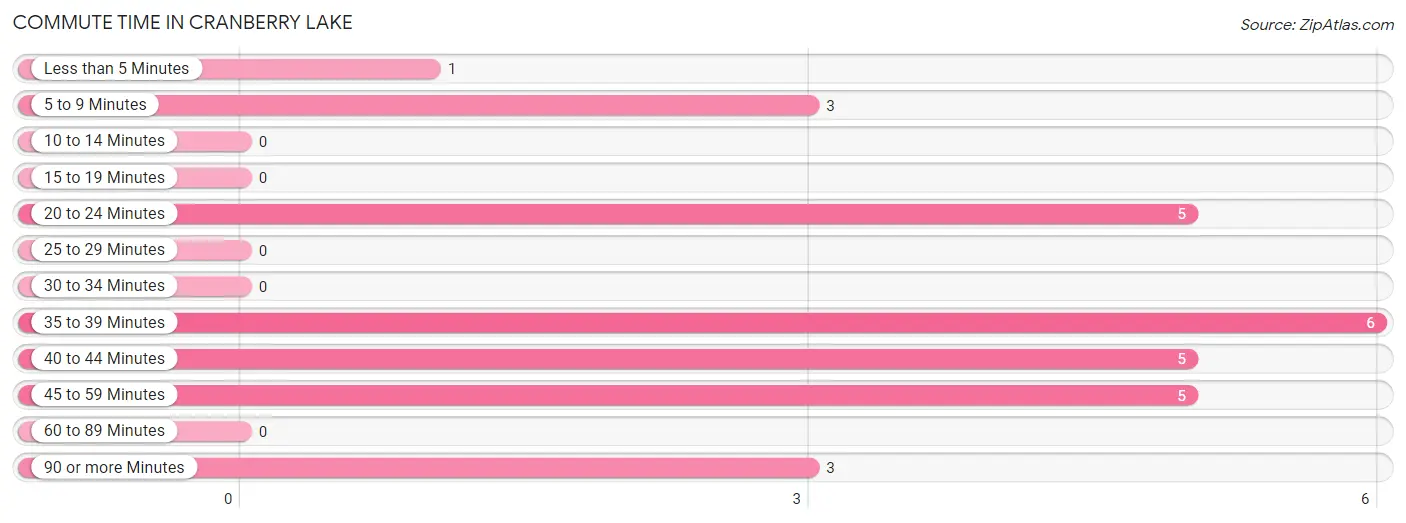
| Commute Time | # Commuters | % Commuters |
| Less than 5 Minutes | 1 | 3.6% |
| 5 to 9 Minutes | 3 | 10.7% |
| 10 to 14 Minutes | 0 | 0.0% |
| 15 to 19 Minutes | 0 | 0.0% |
| 20 to 24 Minutes | 5 | 17.9% |
| 25 to 29 Minutes | 0 | 0.0% |
| 30 to 34 Minutes | 0 | 0.0% |
| 35 to 39 Minutes | 6 | 21.4% |
| 40 to 44 Minutes | 5 | 17.9% |
| 45 to 59 Minutes | 5 | 17.9% |
| 60 to 89 Minutes | 0 | 0.0% |
| 90 or more Minutes | 3 | 10.7% |
Commute Time by Sex in Cranberry Lake
The most common commute times in Cranberry Lake are 5 to 9 minutes (3 commuters, 42.9%) for males and 35 to 39 minutes (6 commuters, 28.6%) for females.
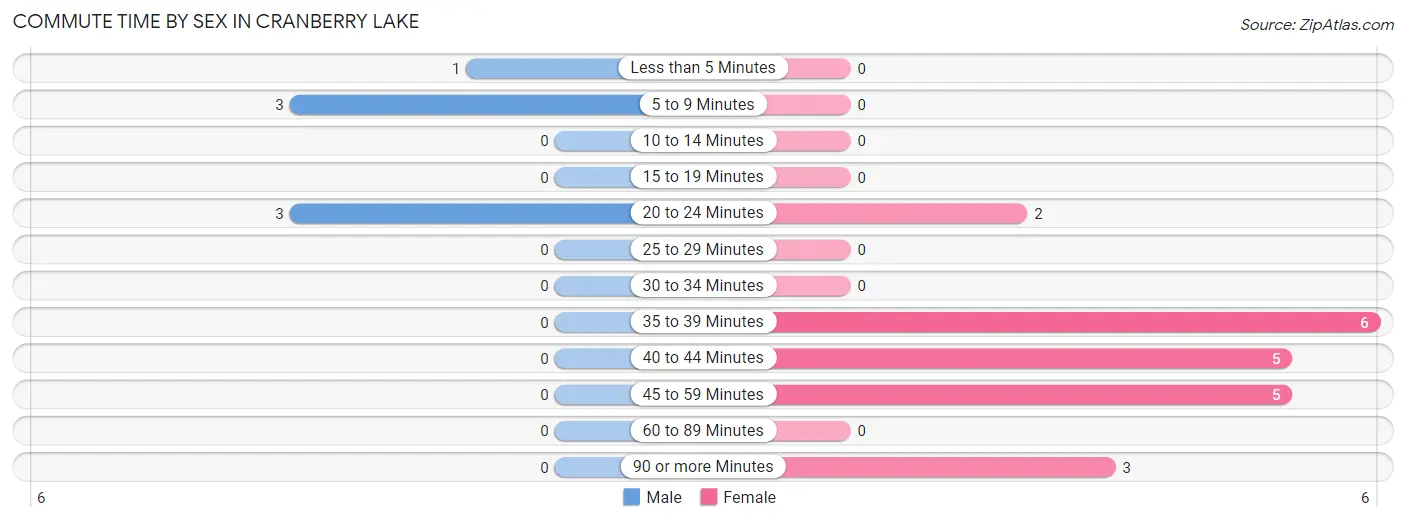
| Commute Time | Male | Female |
| Less than 5 Minutes | 1 (14.3%) | 0 (0.0%) |
| 5 to 9 Minutes | 3 (42.9%) | 0 (0.0%) |
| 10 to 14 Minutes | 0 (0.0%) | 0 (0.0%) |
| 15 to 19 Minutes | 0 (0.0%) | 0 (0.0%) |
| 20 to 24 Minutes | 3 (42.9%) | 2 (9.5%) |
| 25 to 29 Minutes | 0 (0.0%) | 0 (0.0%) |
| 30 to 34 Minutes | 0 (0.0%) | 0 (0.0%) |
| 35 to 39 Minutes | 0 (0.0%) | 6 (28.6%) |
| 40 to 44 Minutes | 0 (0.0%) | 5 (23.8%) |
| 45 to 59 Minutes | 0 (0.0%) | 5 (23.8%) |
| 60 to 89 Minutes | 0 (0.0%) | 0 (0.0%) |
| 90 or more Minutes | 0 (0.0%) | 3 (14.3%) |
Time of Departure to Work by Sex in Cranberry Lake
The most frequent times of departure to work in Cranberry Lake are 7:30 AM to 7:59 AM (3, 42.9%) for males and 6:00 AM to 6:29 AM (8, 38.1%) for females.
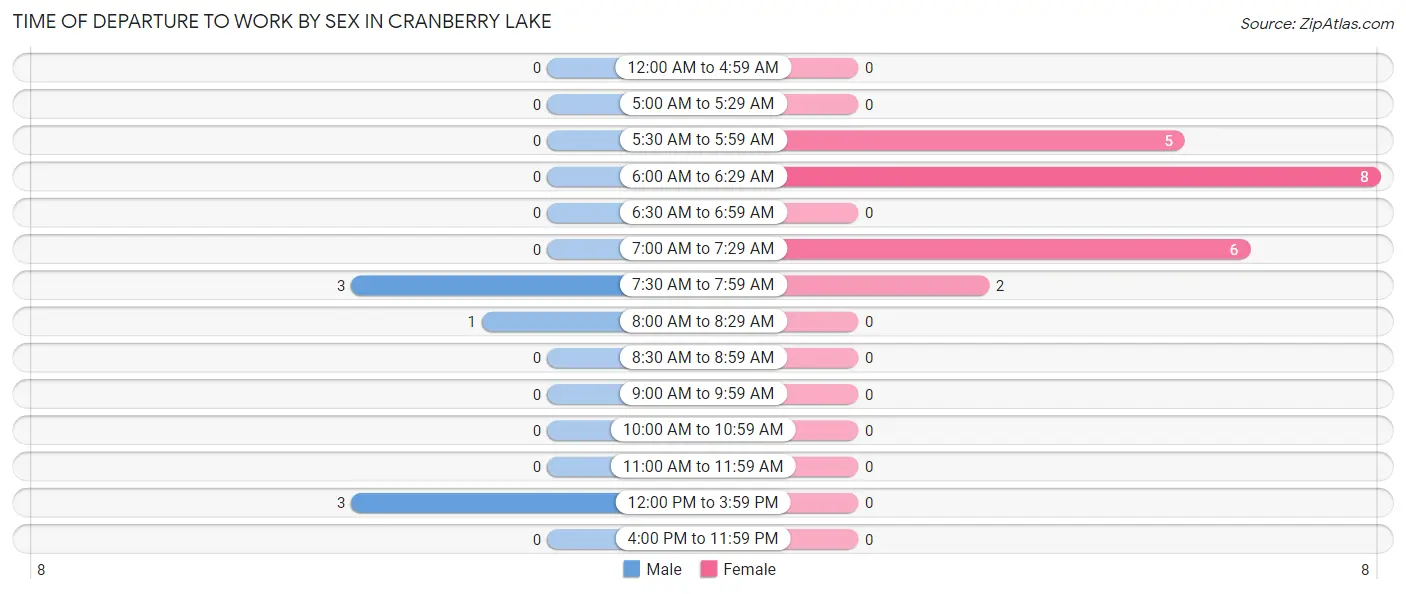
| Time of Departure | Male | Female |
| 12:00 AM to 4:59 AM | 0 (0.0%) | 0 (0.0%) |
| 5:00 AM to 5:29 AM | 0 (0.0%) | 0 (0.0%) |
| 5:30 AM to 5:59 AM | 0 (0.0%) | 5 (23.8%) |
| 6:00 AM to 6:29 AM | 0 (0.0%) | 8 (38.1%) |
| 6:30 AM to 6:59 AM | 0 (0.0%) | 0 (0.0%) |
| 7:00 AM to 7:29 AM | 0 (0.0%) | 6 (28.6%) |
| 7:30 AM to 7:59 AM | 3 (42.9%) | 2 (9.5%) |
| 8:00 AM to 8:29 AM | 1 (14.3%) | 0 (0.0%) |
| 8:30 AM to 8:59 AM | 0 (0.0%) | 0 (0.0%) |
| 9:00 AM to 9:59 AM | 0 (0.0%) | 0 (0.0%) |
| 10:00 AM to 10:59 AM | 0 (0.0%) | 0 (0.0%) |
| 11:00 AM to 11:59 AM | 0 (0.0%) | 0 (0.0%) |
| 12:00 PM to 3:59 PM | 3 (42.9%) | 0 (0.0%) |
| 4:00 PM to 11:59 PM | 0 (0.0%) | 0 (0.0%) |
| Total | 7 (100.0%) | 21 (100.0%) |
Housing Occupancy in Cranberry Lake
Occupancy by Ownership in Cranberry Lake
Of the total 65 dwellings in Cranberry Lake, owner-occupied units account for 65 (100.0%), while renter-occupied units make up 0 (0.0%).
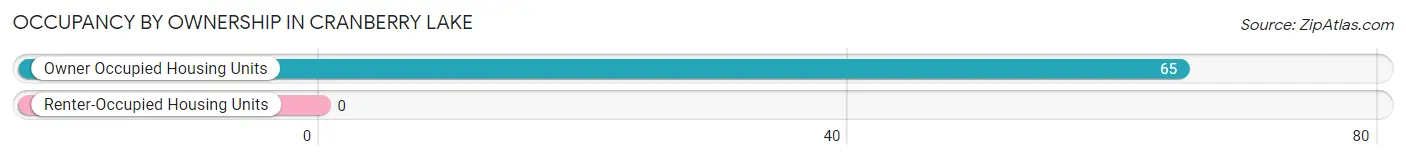
| Occupancy | # Housing Units | % Housing Units |
| Owner Occupied Housing Units | 65 | 100.0% |
| Renter-Occupied Housing Units | 0 | 0.0% |
| Total Occupied Housing Units | 65 | 100.0% |
Occupancy by Household Size in Cranberry Lake
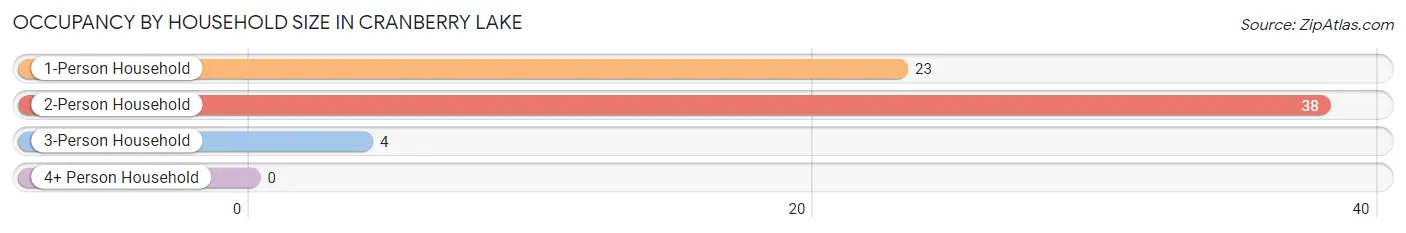
| Household Size | # Housing Units | % Housing Units |
| 1-Person Household | 23 | 35.4% |
| 2-Person Household | 38 | 58.5% |
| 3-Person Household | 4 | 6.1% |
| 4+ Person Household | 0 | 0.0% |
| Total Housing Units | 65 | 100.0% |
Occupancy by Ownership by Household Size in Cranberry Lake
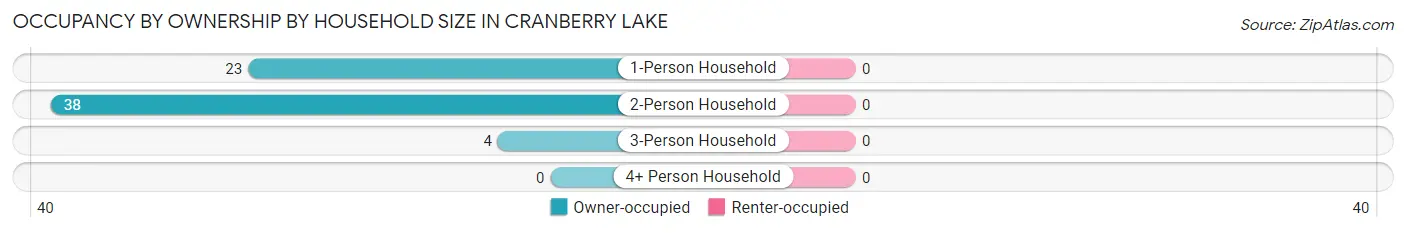
| Household Size | Owner-occupied | Renter-occupied |
| 1-Person Household | 23 (100.0%) | 0 (0.0%) |
| 2-Person Household | 38 (100.0%) | 0 (0.0%) |
| 3-Person Household | 4 (100.0%) | 0 (0.0%) |
| 4+ Person Household | 0 (0.0%) | 0 (0.0%) |
| Total Housing Units | 65 (100.0%) | 0 (0.0%) |
Occupancy by Educational Attainment in Cranberry Lake
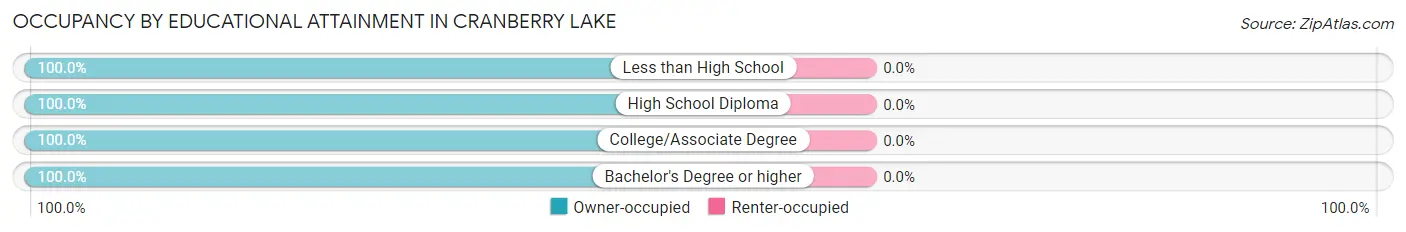
| Household Size | Owner-occupied | Renter-occupied |
| Less than High School | 3 (100.0%) | 0 (0.0%) |
| High School Diploma | 12 (100.0%) | 0 (0.0%) |
| College/Associate Degree | 19 (100.0%) | 0 (0.0%) |
| Bachelor's Degree or higher | 31 (100.0%) | 0 (0.0%) |
Occupancy by Age of Householder in Cranberry Lake
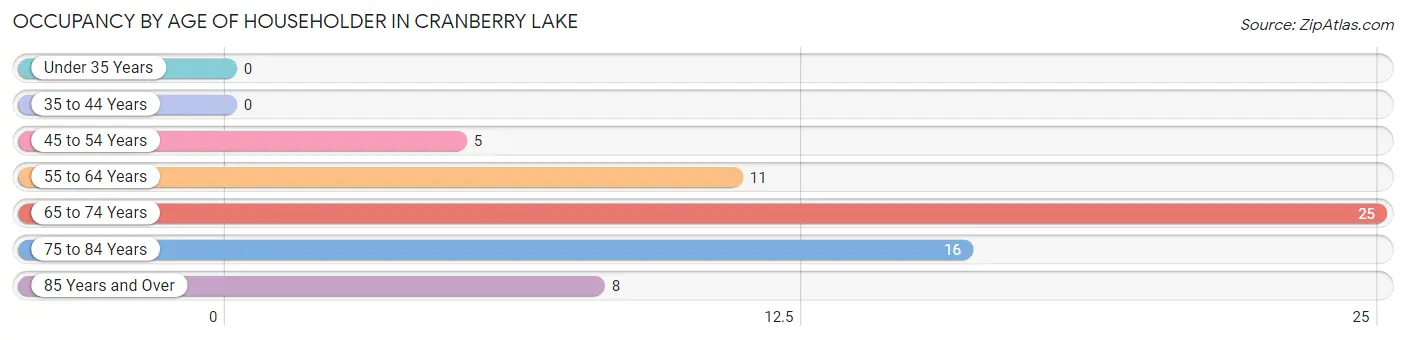
| Age Bracket | # Households | % Households |
| Under 35 Years | 0 | 0.0% |
| 35 to 44 Years | 0 | 0.0% |
| 45 to 54 Years | 5 | 7.7% |
| 55 to 64 Years | 11 | 16.9% |
| 65 to 74 Years | 25 | 38.5% |
| 75 to 84 Years | 16 | 24.6% |
| 85 Years and Over | 8 | 12.3% |
| Total | 65 | 100.0% |
Housing Finances in Cranberry Lake
Median Income by Occupancy in Cranberry Lake
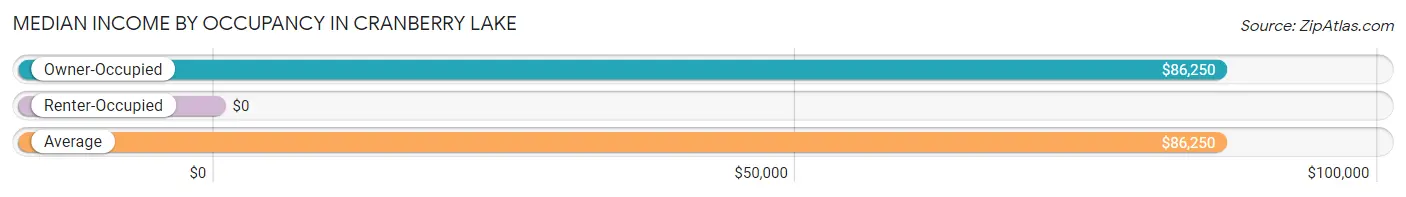
| Occupancy Type | # Households | Median Income |
| Owner-Occupied | 65 (100.0%) | $86,250 |
| Renter-Occupied | 0 (0.0%) | $0 |
| Average | 65 (100.0%) | $86,250 |
Occupancy by Householder Income Bracket in Cranberry Lake
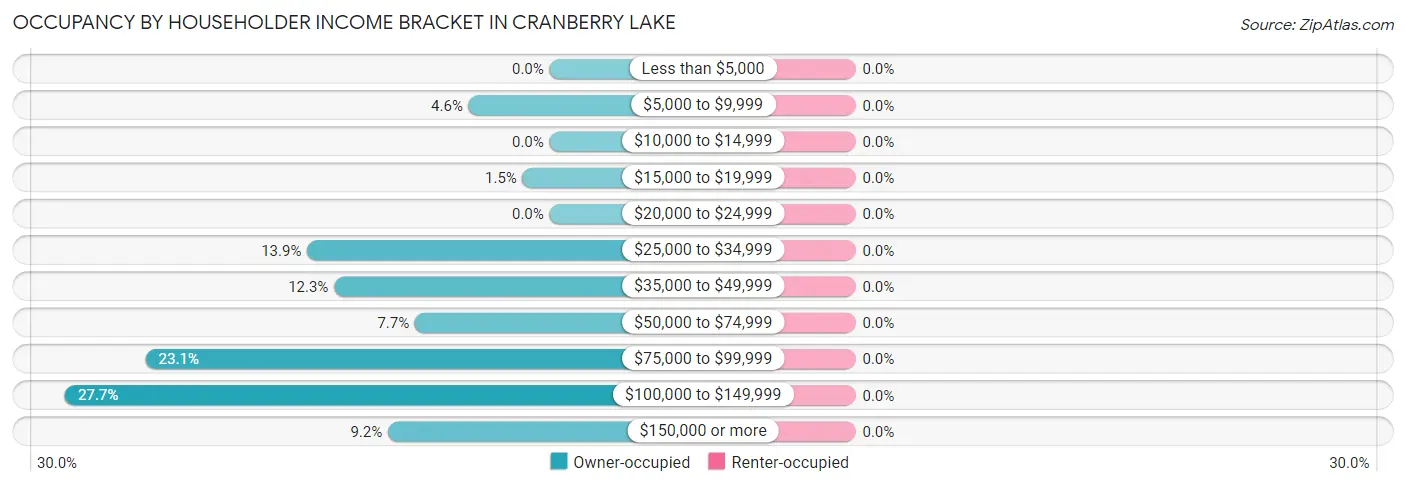
| Income Bracket | Owner-occupied | Renter-occupied |
| Less than $5,000 | 0 (0.0%) | 0 (0.0%) |
| $5,000 to $9,999 | 3 (4.6%) | 0 (0.0%) |
| $10,000 to $14,999 | 0 (0.0%) | 0 (0.0%) |
| $15,000 to $19,999 | 1 (1.5%) | 0 (0.0%) |
| $20,000 to $24,999 | 0 (0.0%) | 0 (0.0%) |
| $25,000 to $34,999 | 9 (13.9%) | 0 (0.0%) |
| $35,000 to $49,999 | 8 (12.3%) | 0 (0.0%) |
| $50,000 to $74,999 | 5 (7.7%) | 0 (0.0%) |
| $75,000 to $99,999 | 15 (23.1%) | 0 (0.0%) |
| $100,000 to $149,999 | 18 (27.7%) | 0 (0.0%) |
| $150,000 or more | 6 (9.2%) | 0 (0.0%) |
| Total | 65 (100.0%) | 0 (0.0%) |
Monthly Housing Cost Tiers in Cranberry Lake
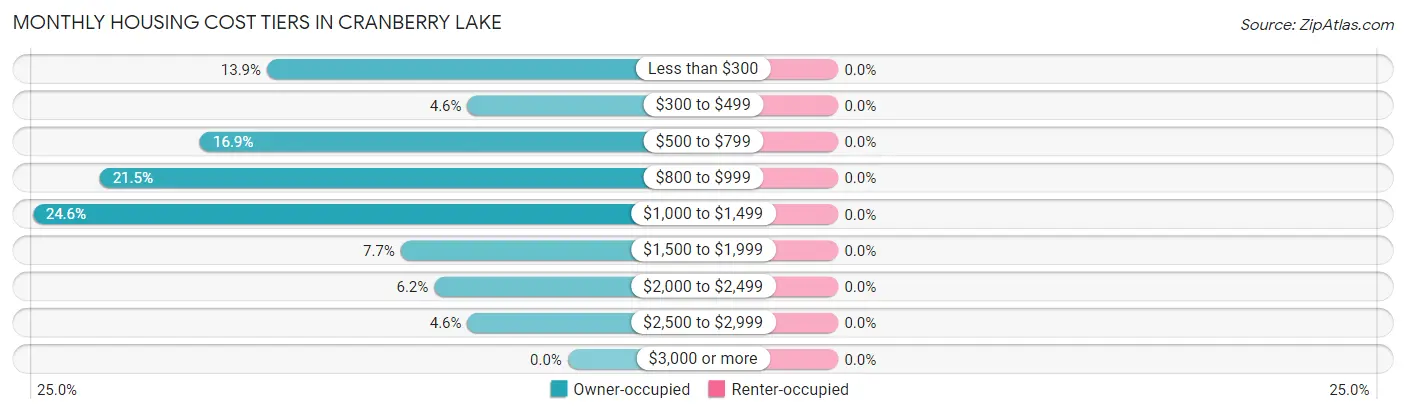
| Monthly Cost | Owner-occupied | Renter-occupied |
| Less than $300 | 9 (13.9%) | 0 (0.0%) |
| $300 to $499 | 3 (4.6%) | 0 (0.0%) |
| $500 to $799 | 11 (16.9%) | 0 (0.0%) |
| $800 to $999 | 14 (21.5%) | 0 (0.0%) |
| $1,000 to $1,499 | 16 (24.6%) | 0 (0.0%) |
| $1,500 to $1,999 | 5 (7.7%) | 0 (0.0%) |
| $2,000 to $2,499 | 4 (6.1%) | 0 (0.0%) |
| $2,500 to $2,999 | 3 (4.6%) | 0 (0.0%) |
| $3,000 or more | 0 (0.0%) | 0 (0.0%) |
| Total | 65 (100.0%) | 0 (0.0%) |
Physical Housing Characteristics in Cranberry Lake
Housing Structures in Cranberry Lake
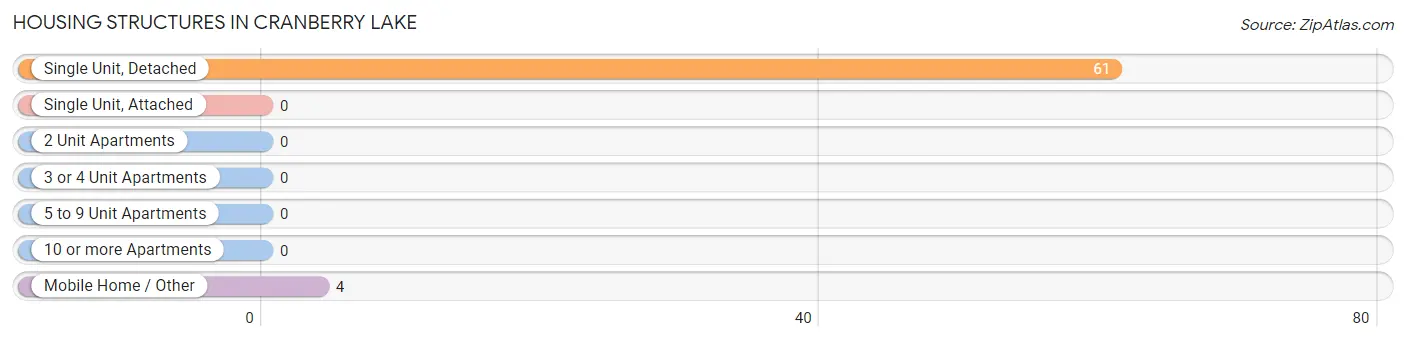
| Structure Type | # Housing Units | % Housing Units |
| Single Unit, Detached | 61 | 93.9% |
| Single Unit, Attached | 0 | 0.0% |
| 2 Unit Apartments | 0 | 0.0% |
| 3 or 4 Unit Apartments | 0 | 0.0% |
| 5 to 9 Unit Apartments | 0 | 0.0% |
| 10 or more Apartments | 0 | 0.0% |
| Mobile Home / Other | 4 | 6.1% |
| Total | 65 | 100.0% |
Housing Structures by Occupancy in Cranberry Lake
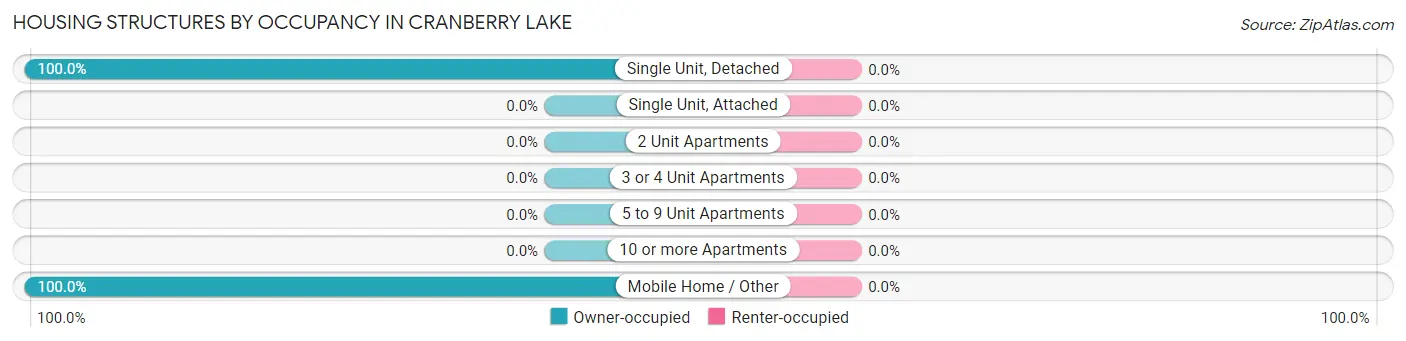
| Structure Type | Owner-occupied | Renter-occupied |
| Single Unit, Detached | 61 (100.0%) | 0 (0.0%) |
| Single Unit, Attached | 0 (0.0%) | 0 (0.0%) |
| 2 Unit Apartments | 0 (0.0%) | 0 (0.0%) |
| 3 or 4 Unit Apartments | 0 (0.0%) | 0 (0.0%) |
| 5 to 9 Unit Apartments | 0 (0.0%) | 0 (0.0%) |
| 10 or more Apartments | 0 (0.0%) | 0 (0.0%) |
| Mobile Home / Other | 4 (100.0%) | 0 (0.0%) |
| Total | 65 (100.0%) | 0 (0.0%) |
Housing Structures by Number of Rooms in Cranberry Lake
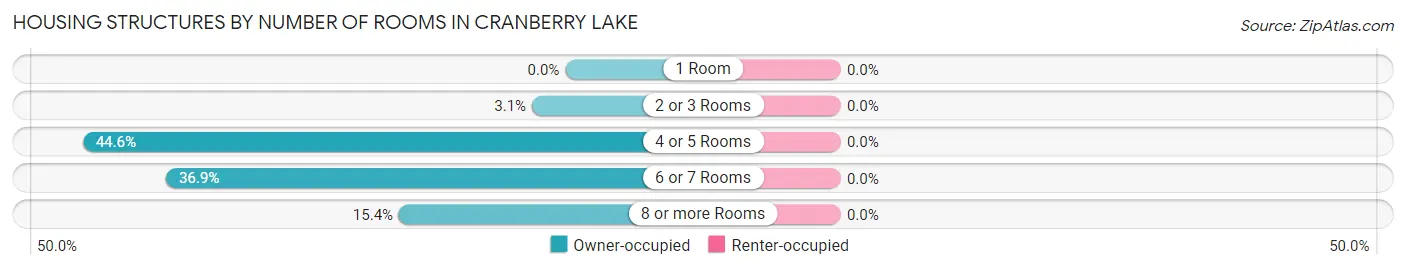
| Number of Rooms | Owner-occupied | Renter-occupied |
| 1 Room | 0 (0.0%) | 0 (0.0%) |
| 2 or 3 Rooms | 2 (3.1%) | 0 (0.0%) |
| 4 or 5 Rooms | 29 (44.6%) | 0 (0.0%) |
| 6 or 7 Rooms | 24 (36.9%) | 0 (0.0%) |
| 8 or more Rooms | 10 (15.4%) | 0 (0.0%) |
| Total | 65 (100.0%) | 0 (0.0%) |
Housing Structure by Heating Type in Cranberry Lake
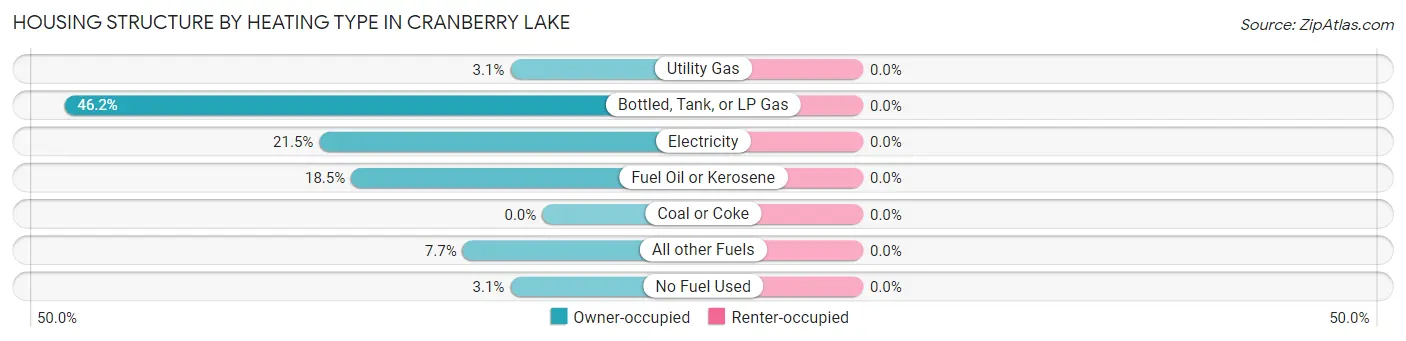
| Heating Type | Owner-occupied | Renter-occupied |
| Utility Gas | 2 (3.1%) | 0 (0.0%) |
| Bottled, Tank, or LP Gas | 30 (46.2%) | 0 (0.0%) |
| Electricity | 14 (21.5%) | 0 (0.0%) |
| Fuel Oil or Kerosene | 12 (18.5%) | 0 (0.0%) |
| Coal or Coke | 0 (0.0%) | 0 (0.0%) |
| All other Fuels | 5 (7.7%) | 0 (0.0%) |
| No Fuel Used | 2 (3.1%) | 0 (0.0%) |
| Total | 65 (100.0%) | 0 (0.0%) |
Household Vehicle Usage in Cranberry Lake
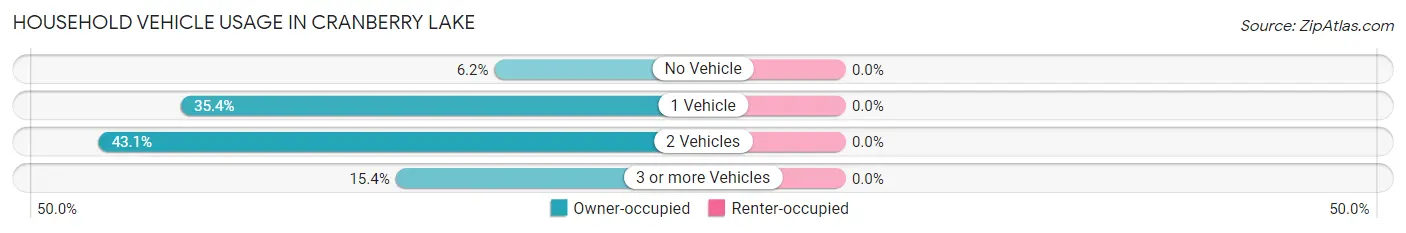
| Vehicles per Household | Owner-occupied | Renter-occupied |
| No Vehicle | 4 (6.1%) | 0 (0.0%) |
| 1 Vehicle | 23 (35.4%) | 0 (0.0%) |
| 2 Vehicles | 28 (43.1%) | 0 (0.0%) |
| 3 or more Vehicles | 10 (15.4%) | 0 (0.0%) |
| Total | 65 (100.0%) | 0 (0.0%) |
Real Estate & Mortgages in Cranberry Lake
Real Estate and Mortgage Overview in Cranberry Lake
| Characteristic | Without Mortgage | With Mortgage |
| Housing Units | 43 | 22 |
| Median Property Value | $295,000 | $140,600 |
| Median Household Income | $78,750 | $0 |
| Monthly Housing Costs | $750 | $0 |
| Real Estate Taxes | $5,500 | $0 |
Property Value by Mortgage Status in Cranberry Lake
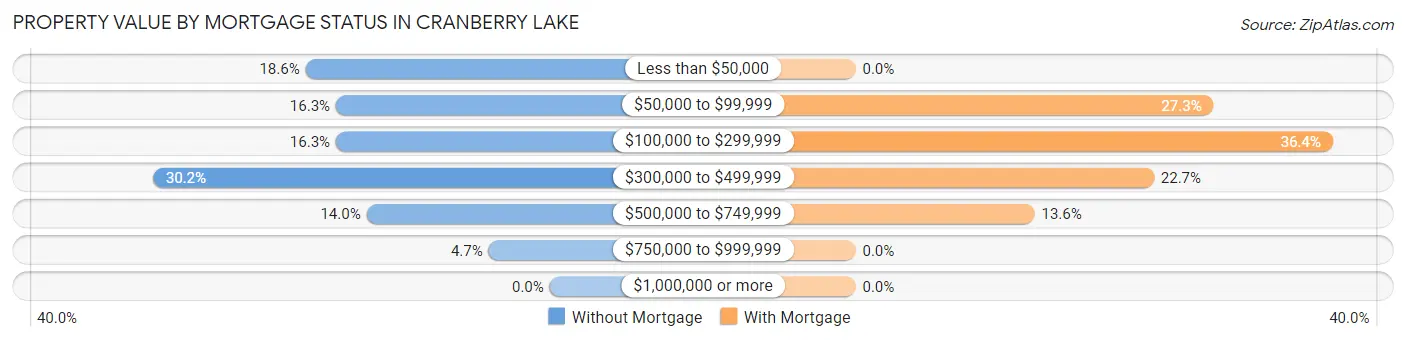
| Property Value | Without Mortgage | With Mortgage |
| Less than $50,000 | 8 (18.6%) | 0 (0.0%) |
| $50,000 to $99,999 | 7 (16.3%) | 6 (27.3%) |
| $100,000 to $299,999 | 7 (16.3%) | 8 (36.4%) |
| $300,000 to $499,999 | 13 (30.2%) | 5 (22.7%) |
| $500,000 to $749,999 | 6 (14.0%) | 3 (13.6%) |
| $750,000 to $999,999 | 2 (4.6%) | 0 (0.0%) |
| $1,000,000 or more | 0 (0.0%) | 0 (0.0%) |
| Total | 43 (100.0%) | 22 (100.0%) |
Household Income by Mortgage Status in Cranberry Lake
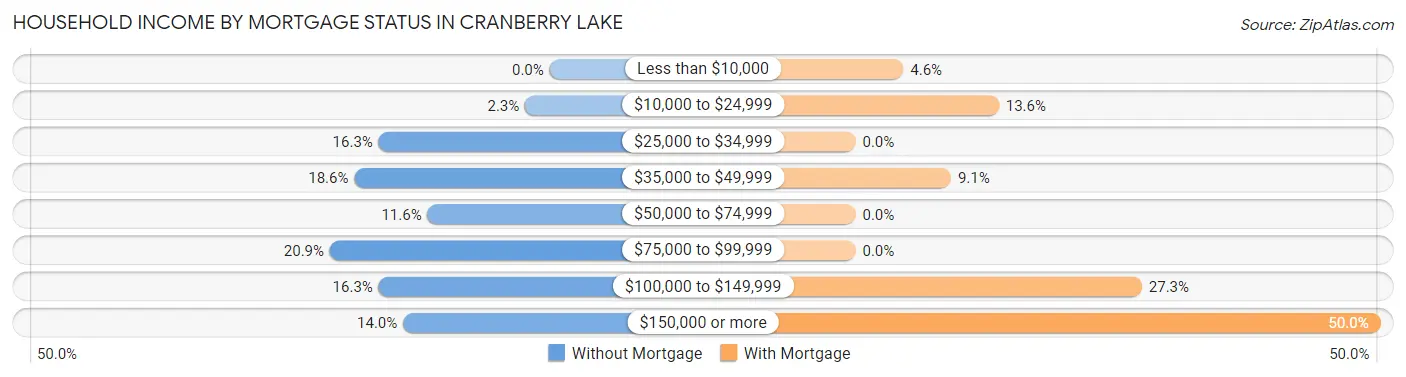
| Household Income | Without Mortgage | With Mortgage |
| Less than $10,000 | 0 (0.0%) | 1 (4.5%) |
| $10,000 to $24,999 | 1 (2.3%) | 3 (13.6%) |
| $25,000 to $34,999 | 7 (16.3%) | 0 (0.0%) |
| $35,000 to $49,999 | 8 (18.6%) | 2 (9.1%) |
| $50,000 to $74,999 | 5 (11.6%) | 0 (0.0%) |
| $75,000 to $99,999 | 9 (20.9%) | 0 (0.0%) |
| $100,000 to $149,999 | 7 (16.3%) | 6 (27.3%) |
| $150,000 or more | 6 (14.0%) | 11 (50.0%) |
| Total | 43 (100.0%) | 22 (100.0%) |
Property Value to Household Income Ratio in Cranberry Lake
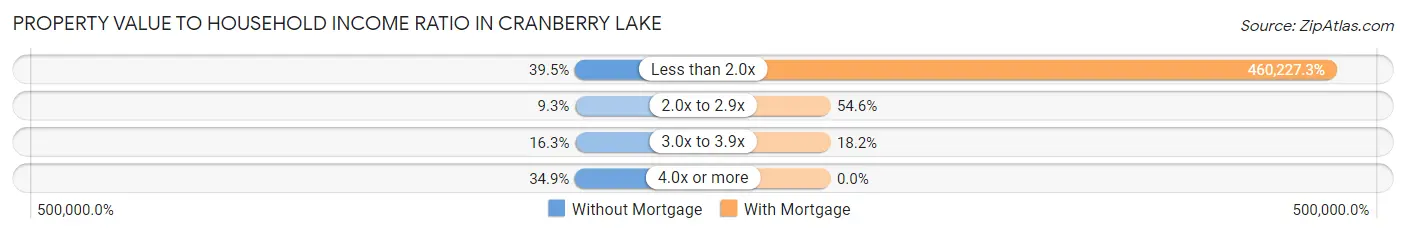
| Value-to-Income Ratio | Without Mortgage | With Mortgage |
| Less than 2.0x | 17 (39.5%) | 101,250 (460,227.3%) |
| 2.0x to 2.9x | 4 (9.3%) | 12 (54.5%) |
| 3.0x to 3.9x | 7 (16.3%) | 4 (18.2%) |
| 4.0x or more | 15 (34.9%) | 0 (0.0%) |
| Total | 43 (100.0%) | 22 (100.0%) |
Real Estate Taxes by Mortgage Status in Cranberry Lake
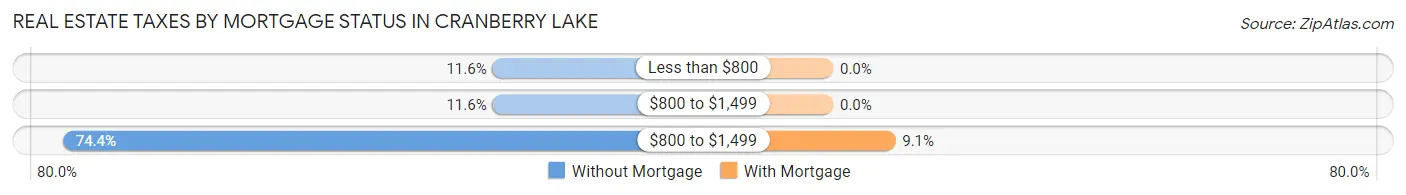
| Property Taxes | Without Mortgage | With Mortgage |
| Less than $800 | 5 (11.6%) | 0 (0.0%) |
| $800 to $1,499 | 5 (11.6%) | 0 (0.0%) |
| $800 to $1,499 | 32 (74.4%) | 2 (9.1%) |
| Total | 43 (100.0%) | 22 (100.0%) |
Health & Disability in Cranberry Lake
Health Insurance Coverage by Age in Cranberry Lake
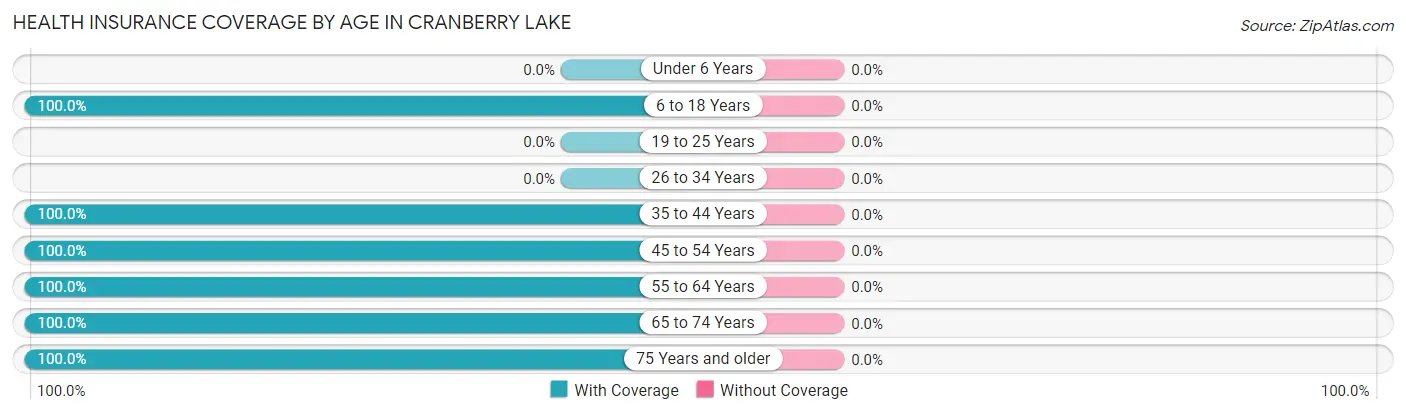
| Age Bracket | With Coverage | Without Coverage |
| Under 6 Years | 0 (0.0%) | 0 (0.0%) |
| 6 to 18 Years | 4 (100.0%) | 0 (0.0%) |
| 19 to 25 Years | 0 (0.0%) | 0 (0.0%) |
| 26 to 34 Years | 0 (0.0%) | 0 (0.0%) |
| 35 to 44 Years | 3 (100.0%) | 0 (0.0%) |
| 45 to 54 Years | 13 (100.0%) | 0 (0.0%) |
| 55 to 64 Years | 28 (100.0%) | 0 (0.0%) |
| 65 to 74 Years | 38 (100.0%) | 0 (0.0%) |
| 75 Years and older | 38 (100.0%) | 0 (0.0%) |
| Total | 124 (100.0%) | 0 (0.0%) |
Health Insurance Coverage by Citizenship Status in Cranberry Lake
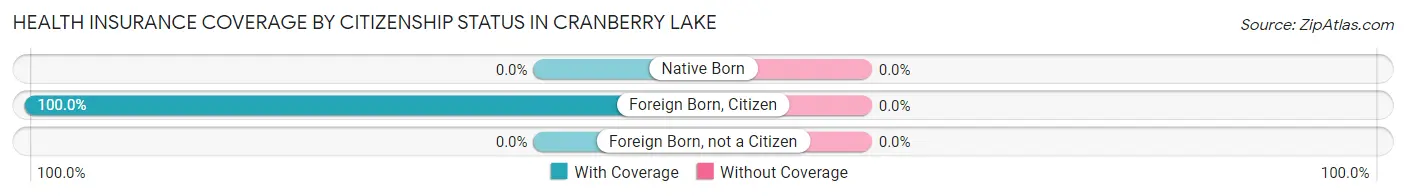
| Citizenship Status | With Coverage | Without Coverage |
| Native Born | 0 (0.0%) | 0 (0.0%) |
| Foreign Born, Citizen | 4 (100.0%) | 0 (0.0%) |
| Foreign Born, not a Citizen | 0 (0.0%) | 0 (0.0%) |
Health Insurance Coverage by Household Income in Cranberry Lake
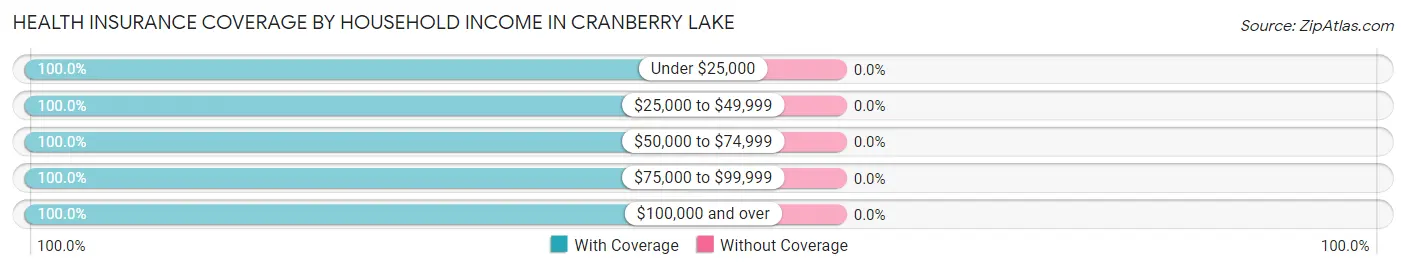
| Household Income | With Coverage | Without Coverage |
| Under $25,000 | 6 (100.0%) | 0 (0.0%) |
| $25,000 to $49,999 | 25 (100.0%) | 0 (0.0%) |
| $50,000 to $74,999 | 9 (100.0%) | 0 (0.0%) |
| $75,000 to $99,999 | 28 (100.0%) | 0 (0.0%) |
| $100,000 and over | 51 (100.0%) | 0 (0.0%) |
Public vs Private Health Insurance Coverage by Age in Cranberry Lake
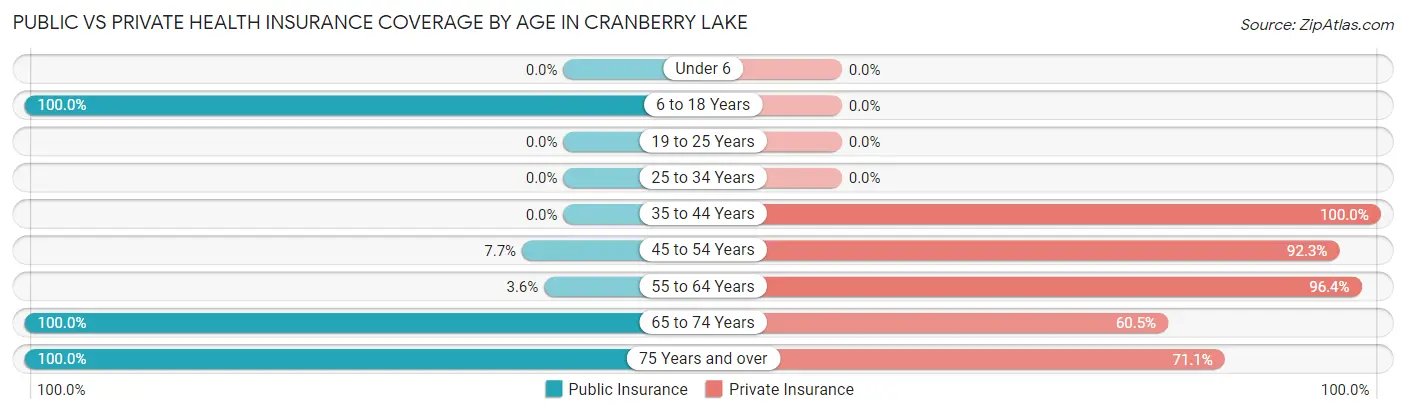
| Age Bracket | Public Insurance | Private Insurance |
| Under 6 | 0 (0.0%) | 0 (0.0%) |
| 6 to 18 Years | 4 (100.0%) | 0 (0.0%) |
| 19 to 25 Years | 0 (0.0%) | 0 (0.0%) |
| 25 to 34 Years | 0 (0.0%) | 0 (0.0%) |
| 35 to 44 Years | 0 (0.0%) | 3 (100.0%) |
| 45 to 54 Years | 1 (7.7%) | 12 (92.3%) |
| 55 to 64 Years | 1 (3.6%) | 27 (96.4%) |
| 65 to 74 Years | 38 (100.0%) | 23 (60.5%) |
| 75 Years and over | 38 (100.0%) | 27 (71.1%) |
| Total | 82 (66.1%) | 92 (74.2%) |
Disability Status by Sex by Age in Cranberry Lake
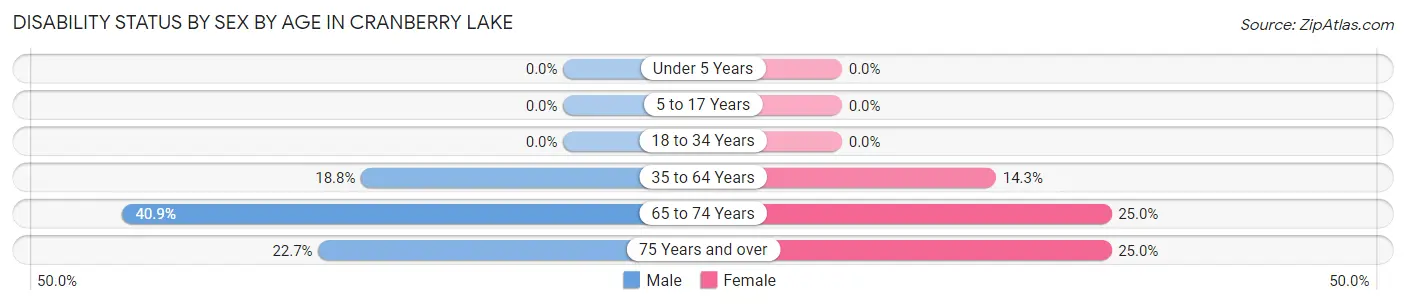
| Age Bracket | Male | Female |
| Under 5 Years | 0 (0.0%) | 0 (0.0%) |
| 5 to 17 Years | 0 (0.0%) | 0 (0.0%) |
| 18 to 34 Years | 0 (0.0%) | 0 (0.0%) |
| 35 to 64 Years | 3 (18.8%) | 4 (14.3%) |
| 65 to 74 Years | 9 (40.9%) | 4 (25.0%) |
| 75 Years and over | 5 (22.7%) | 4 (25.0%) |
Disability Class by Sex by Age in Cranberry Lake
Disability Class: Hearing Difficulty
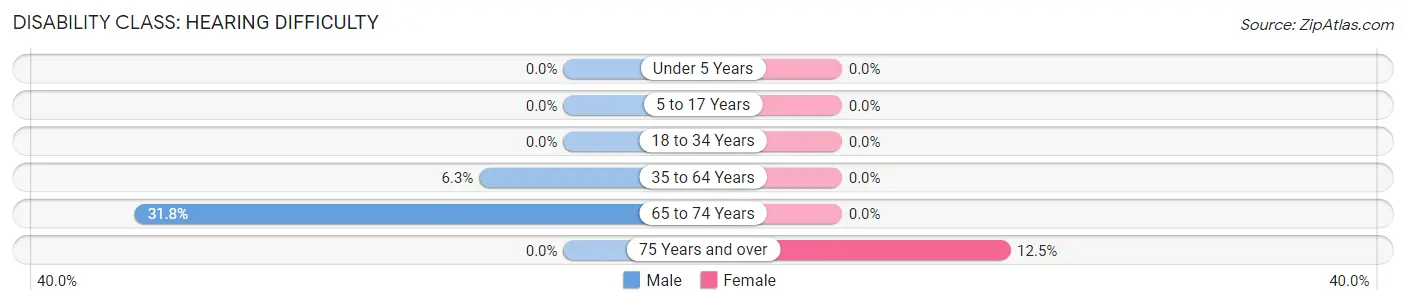
| Age Bracket | Male | Female |
| Under 5 Years | 0 (0.0%) | 0 (0.0%) |
| 5 to 17 Years | 0 (0.0%) | 0 (0.0%) |
| 18 to 34 Years | 0 (0.0%) | 0 (0.0%) |
| 35 to 64 Years | 1 (6.2%) | 0 (0.0%) |
| 65 to 74 Years | 7 (31.8%) | 0 (0.0%) |
| 75 Years and over | 0 (0.0%) | 2 (12.5%) |
Disability Class: Vision Difficulty
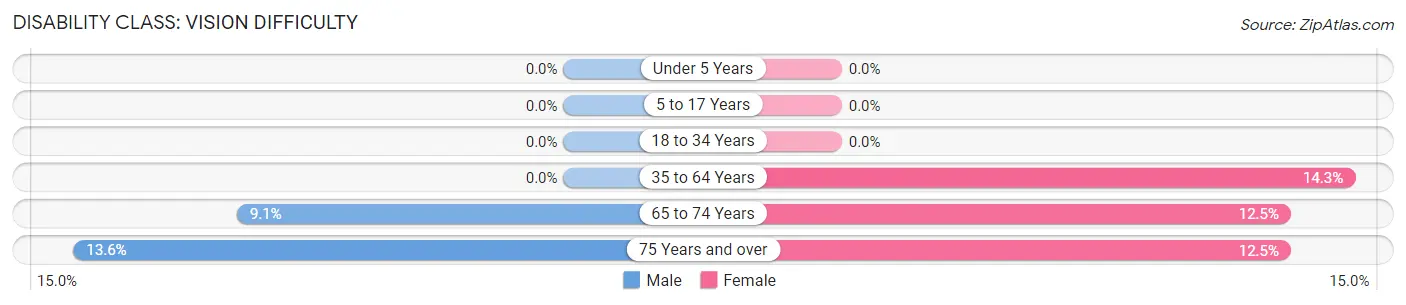
| Age Bracket | Male | Female |
| Under 5 Years | 0 (0.0%) | 0 (0.0%) |
| 5 to 17 Years | 0 (0.0%) | 0 (0.0%) |
| 18 to 34 Years | 0 (0.0%) | 0 (0.0%) |
| 35 to 64 Years | 0 (0.0%) | 4 (14.3%) |
| 65 to 74 Years | 2 (9.1%) | 2 (12.5%) |
| 75 Years and over | 3 (13.6%) | 2 (12.5%) |
Disability Class: Cognitive Difficulty
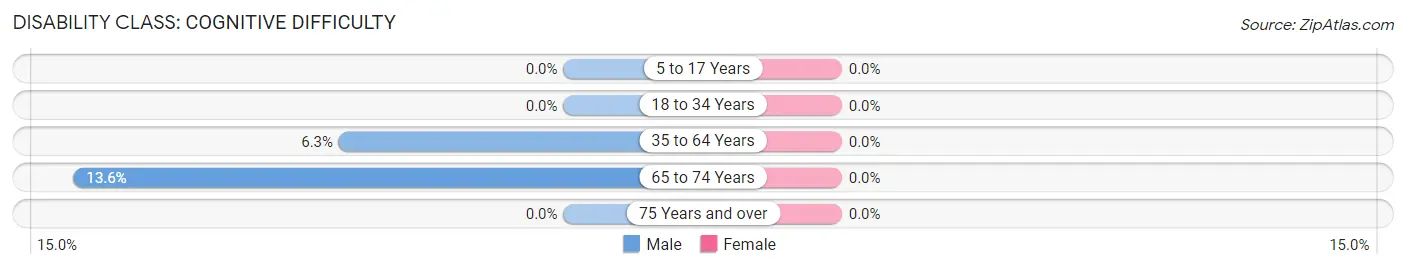
| Age Bracket | Male | Female |
| 5 to 17 Years | 0 (0.0%) | 0 (0.0%) |
| 18 to 34 Years | 0 (0.0%) | 0 (0.0%) |
| 35 to 64 Years | 1 (6.2%) | 0 (0.0%) |
| 65 to 74 Years | 3 (13.6%) | 0 (0.0%) |
| 75 Years and over | 0 (0.0%) | 0 (0.0%) |
Disability Class: Ambulatory Difficulty
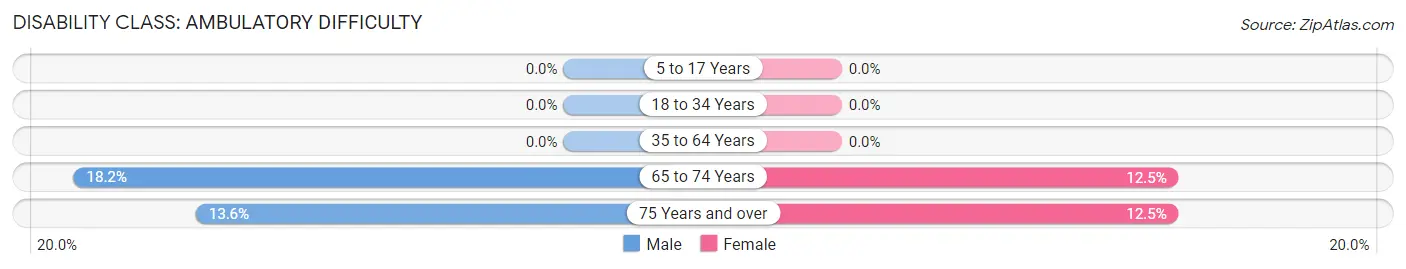
| Age Bracket | Male | Female |
| 5 to 17 Years | 0 (0.0%) | 0 (0.0%) |
| 18 to 34 Years | 0 (0.0%) | 0 (0.0%) |
| 35 to 64 Years | 0 (0.0%) | 0 (0.0%) |
| 65 to 74 Years | 4 (18.2%) | 2 (12.5%) |
| 75 Years and over | 3 (13.6%) | 2 (12.5%) |
Disability Class: Self-Care Difficulty
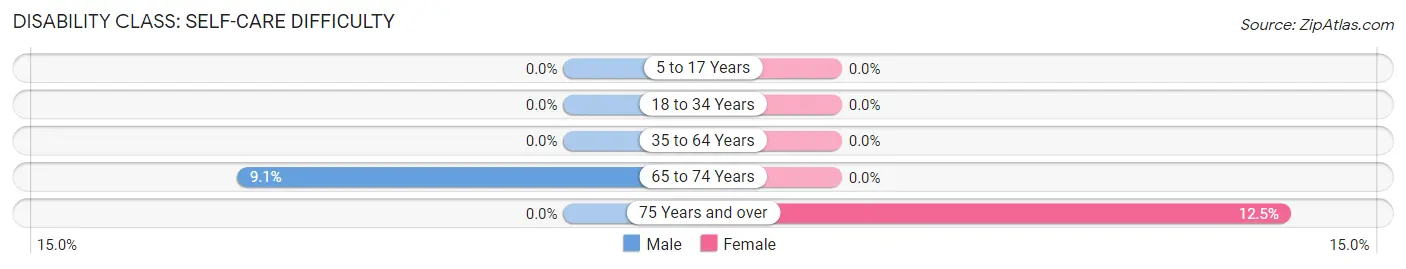
| Age Bracket | Male | Female |
| 5 to 17 Years | 0 (0.0%) | 0 (0.0%) |
| 18 to 34 Years | 0 (0.0%) | 0 (0.0%) |
| 35 to 64 Years | 0 (0.0%) | 0 (0.0%) |
| 65 to 74 Years | 2 (9.1%) | 0 (0.0%) |
| 75 Years and over | 0 (0.0%) | 2 (12.5%) |
Technology Access in Cranberry Lake
Computing Device Access in Cranberry Lake
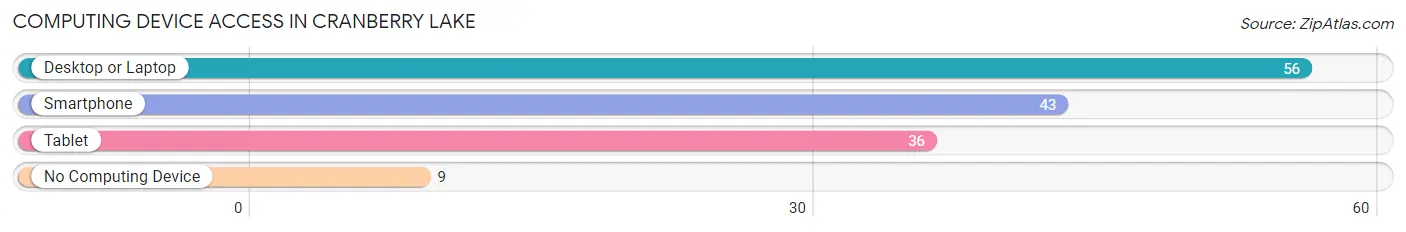
| Device Type | # Households | % Households |
| Desktop or Laptop | 56 | 86.2% |
| Smartphone | 43 | 66.1% |
| Tablet | 36 | 55.4% |
| No Computing Device | 9 | 13.9% |
| Total | 65 | 100.0% |
Internet Access in Cranberry Lake
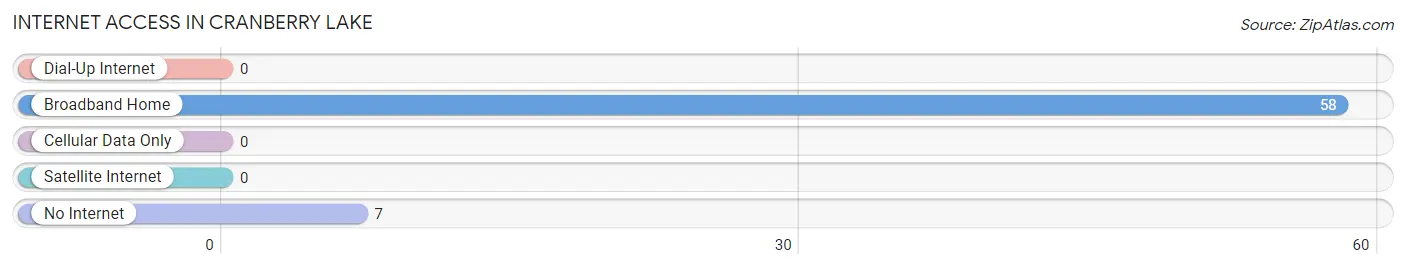
| Internet Type | # Households | % Households |
| Dial-Up Internet | 0 | 0.0% |
| Broadband Home | 58 | 89.2% |
| Cellular Data Only | 0 | 0.0% |
| Satellite Internet | 0 | 0.0% |
| No Internet | 7 | 10.8% |
| Total | 65 | 100.0% |
Cranberry Lake Summary
Cranberry Lake is a hamlet located in the town of Clifton, in St. Lawrence County, New York. It is situated on the western shore of Cranberry Lake, a large lake in the Adirondack Mountains. The hamlet is located approximately 20 miles east of the city of Ogdensburg and is part of the Ogdensburg-Massena Metropolitan Statistical Area.
History
The area around Cranberry Lake was first settled in the early 19th century by settlers from New England. The hamlet was originally known as “Cranberry Pond” and was a popular destination for fishing and hunting. In 1845, the hamlet was officially incorporated as the village of Cranberry Lake.
The hamlet was a popular tourist destination in the late 19th and early 20th centuries. It was home to several hotels, resorts, and summer camps. The hamlet was also home to a number of logging and lumbering operations.
In the mid-20th century, the hamlet began to decline in popularity as a tourist destination. The decline was due in part to the increasing popularity of motorized boats, which made it difficult for the hamlet’s small boats to compete. In the late 20th century, the hamlet began to experience a resurgence in popularity as a recreational destination.
Geography
Cranberry Lake is located in the Adirondack Mountains of northern New York. The hamlet is situated on the western shore of Cranberry Lake, a large lake that is approximately 8 miles long and 2 miles wide. The lake is fed by several small streams and is surrounded by dense forests.
The hamlet is located approximately 20 miles east of the city of Ogdensburg and is part of the Ogdensburg-Massena Metropolitan Statistical Area. The hamlet is accessible by car via New York State Route 3.
Economy
The economy of Cranberry Lake is largely based on tourism. The hamlet is home to several resorts, hotels, and campgrounds. The hamlet is also home to several marinas, which offer boat rentals and other services.
The hamlet is also home to several small businesses, including restaurants, convenience stores, and gift shops. The hamlet is also home to a number of art galleries and craft shops.
Demographics
As of the 2010 census, the population of Cranberry Lake was 1,093. The median age of the population was 44.7 years. The median household income was $41,250. The median home value was $133,000.
The population of Cranberry Lake is predominantly white (97.2%). The largest minority group is Native American (1.2%). The hamlet is also home to a small number of African Americans (0.4%) and Asians (0.2%).
Conclusion
Cranberry Lake is a small hamlet located in the Adirondack Mountains of northern New York. The hamlet is situated on the western shore of Cranberry Lake, a large lake that is popular for fishing and other recreational activities. The hamlet is home to several resorts, hotels, and campgrounds, as well as a number of small businesses. The population of Cranberry Lake is predominantly white and the median household income is $41,250. The hamlet is a popular tourist destination and is experiencing a resurgence in popularity as a recreational destination.
Common Questions
What is the Total Population of Cranberry Lake?
Total Population of Cranberry Lake is 124.
What is the Total Male Population of Cranberry Lake?
Total Male Population of Cranberry Lake is 60.
What is the Total Female Population of Cranberry Lake?
Total Female Population of Cranberry Lake is 64.
What is the Ratio of Males per 100 Females in Cranberry Lake?
There are 93.75 Males per 100 Females in Cranberry Lake.
What is the Ratio of Females per 100 Males in Cranberry Lake?
There are 106.67 Females per 100 Males in Cranberry Lake.
What is the Median Population Age in Cranberry Lake?
Median Population Age in Cranberry Lake is 67.6 Years.
What is the Average Family Size in Cranberry Lake
Average Family Size in Cranberry Lake is 2.3 People.
What is the Average Household Size in Cranberry Lake
Average Household Size in Cranberry Lake is 1.8 People.
What is Per Capita Income in Cranberry Lake?
Per Capita income in Cranberry Lake is $59,526.
What is the Median Family Income in Cranberry Lake?
Median Family Income in Cranberry Lake is $93,750.
What is the Median Household income in Cranberry Lake?
Median Household Income in Cranberry Lake is $86,250.
What is Inequality or Gini Index in Cranberry Lake?
Inequality or Gini Index in Cranberry Lake is 0.46.
How Large is the Labor Force in Cranberry Lake?
There are 33 People in the Labor Forcein in Cranberry Lake.
What is the Percentage of People in the Labor Force in Cranberry Lake?
27.5% of People are in the Labor Force in Cranberry Lake.