Colton, NY
Colton Map
Colton Overview
274
TOTAL POPULATION
132
MALE POPULATION
142
FEMALE POPULATION
92.96
MALES / 100 FEMALES
107.58
FEMALES / 100 MALES
48.0
MEDIAN AGE
2.8
AVG FAMILY SIZE
2.1
AVG HOUSEHOLD SIZE
$35,922
PER CAPITA INCOME
$71,875
AVG FAMILY INCOME
$70,724
AVG HOUSEHOLD INCOME
27.3%
WAGE / INCOME GAP [ % ]
72.7¢/ $1
WAGE / INCOME GAP [ $ ]
0.45
INEQUALITY / GINI INDEX
134
LABOR FORCE [ PEOPLE ]
54.7%
PERCENT IN LABOR FORCE
Colton Zip Codes
Colton Area Codes
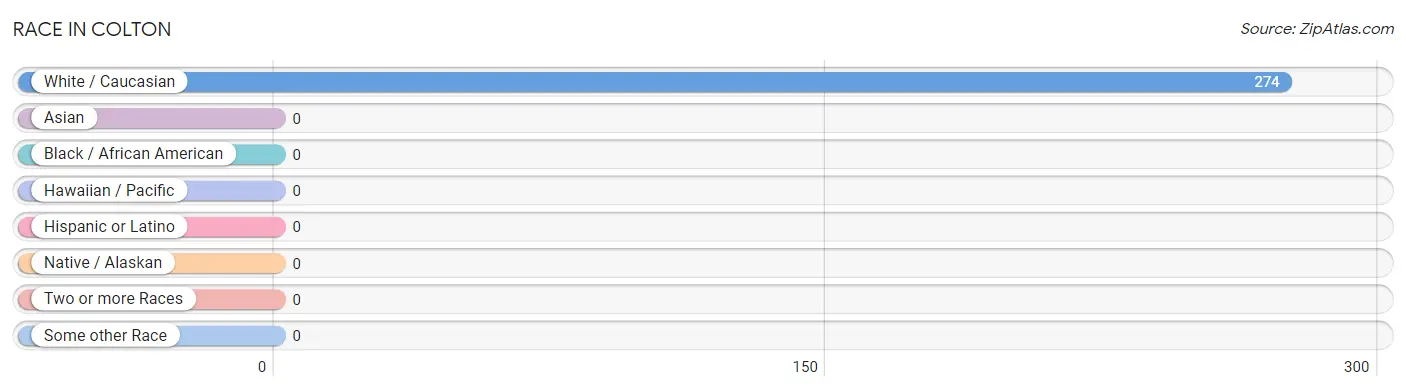
Race in Colton
The most populous races in Colton are , and White / Caucasian (274 | 100.0%).
| Race | # Population | % Population |
| Asian | 0 | 0.0% |
| Black / African American | 0 | 0.0% |
| Hawaiian / Pacific | 0 | 0.0% |
| Hispanic or Latino | 0 | 0.0% |
| Native / Alaskan | 0 | 0.0% |
| White / Caucasian | 274 | 100.0% |
| Two or more Races | 0 | 0.0% |
| Some other Race | 0 | 0.0% |
| Total | 274 | 100.0% |
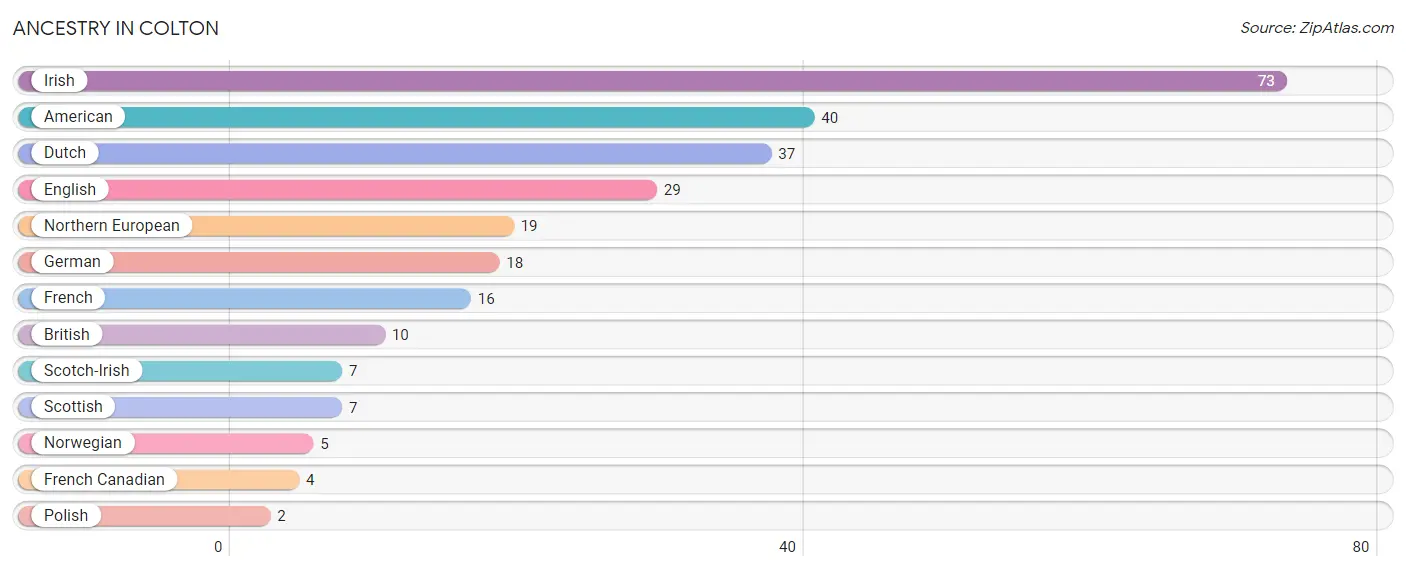
Ancestry in Colton
The most populous ancestries reported in Colton are Irish (73 | 26.6%), American (40 | 14.6%), Dutch (37 | 13.5%), English (29 | 10.6%), and Northern European (19 | 6.9%), together accounting for 72.3% of all Colton residents.
| Ancestry | # Population | % Population |
| American | 40 | 14.6% |
| British | 10 | 3.6% |
| Dutch | 37 | 13.5% |
| English | 29 | 10.6% |
| French | 16 | 5.8% |
| French Canadian | 4 | 1.5% |
| German | 18 | 6.6% |
| Irish | 73 | 26.6% |
| Northern European | 19 | 6.9% |
| Norwegian | 5 | 1.8% |
| Polish | 2 | 0.7% |
| Scotch-Irish | 7 | 2.5% |
| Scottish | 7 | 2.5% | View All 13 Rows |
Immigrants in Colton

| Immigration Origin | # Population | % Population | View All 0 Rows |
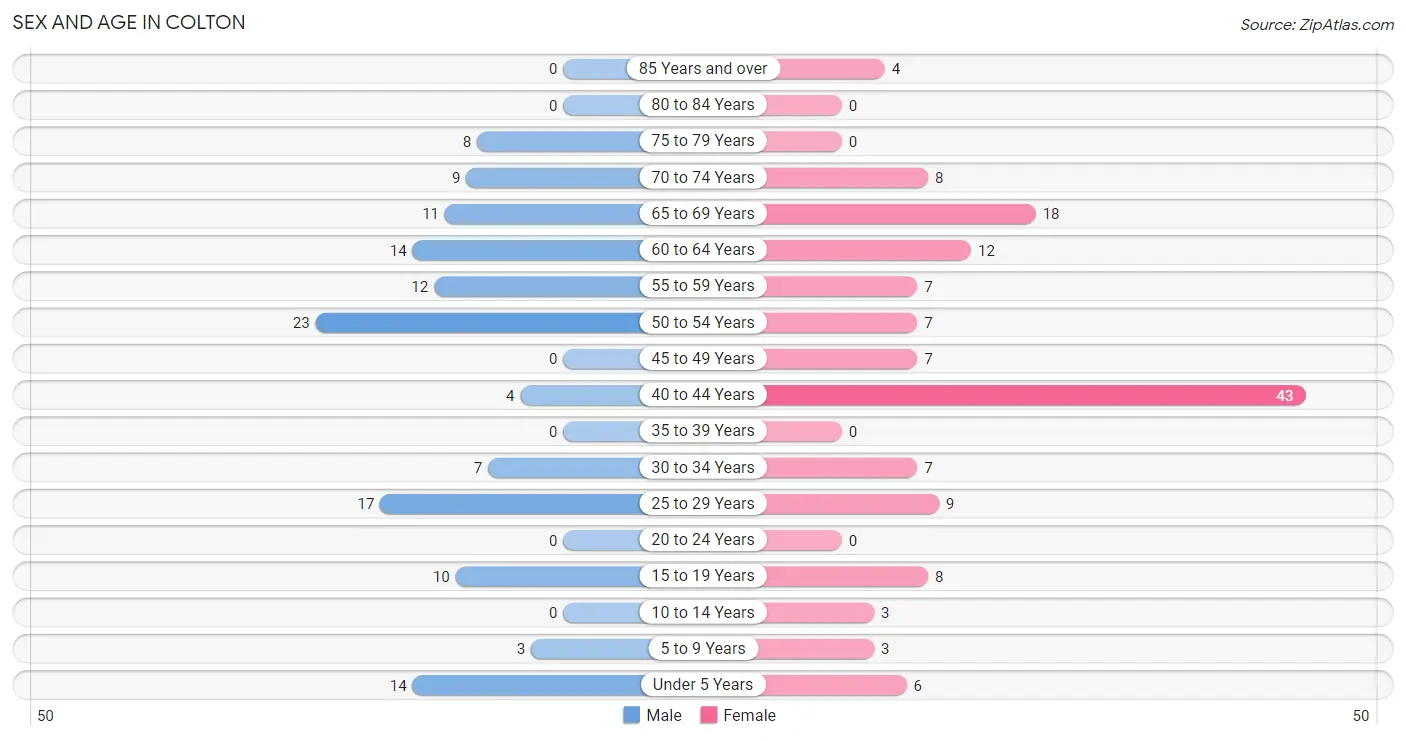
Sex and Age in Colton
Sex and Age in Colton
The most populous age groups in Colton are 50 to 54 Years (23 | 17.4%) for men and 40 to 44 Years (43 | 30.3%) for women.
| Age Bracket | Male | Female |
| Under 5 Years | 14 (10.6%) | 6 (4.2%) |
| 5 to 9 Years | 3 (2.3%) | 3 (2.1%) |
| 10 to 14 Years | 0 (0.0%) | 3 (2.1%) |
| 15 to 19 Years | 10 (7.6%) | 8 (5.6%) |
| 20 to 24 Years | 0 (0.0%) | 0 (0.0%) |
| 25 to 29 Years | 17 (12.9%) | 9 (6.3%) |
| 30 to 34 Years | 7 (5.3%) | 7 (4.9%) |
| 35 to 39 Years | 0 (0.0%) | 0 (0.0%) |
| 40 to 44 Years | 4 (3.0%) | 43 (30.3%) |
| 45 to 49 Years | 0 (0.0%) | 7 (4.9%) |
| 50 to 54 Years | 23 (17.4%) | 7 (4.9%) |
| 55 to 59 Years | 12 (9.1%) | 7 (4.9%) |
| 60 to 64 Years | 14 (10.6%) | 12 (8.5%) |
| 65 to 69 Years | 11 (8.3%) | 18 (12.7%) |
| 70 to 74 Years | 9 (6.8%) | 8 (5.6%) |
| 75 to 79 Years | 8 (6.1%) | 0 (0.0%) |
| 80 to 84 Years | 0 (0.0%) | 0 (0.0%) |
| 85 Years and over | 0 (0.0%) | 4 (2.8%) |
| Total | 132 (100.0%) | 142 (100.0%) |
Families and Households in Colton
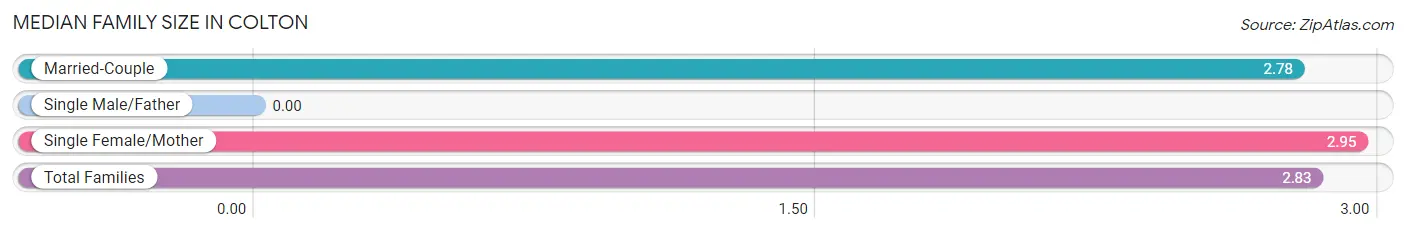
Median Family Size in Colton
| Family Type | # Families | Family Size |
| Married-Couple | 54 (72.0%) | 2.78 |
| Single Male/Father | 0 (0.0%) | - |
| Single Female/Mother | 21 (28.0%) | 2.95 |
| Total Families | 75 (100.0%) | 2.83 |
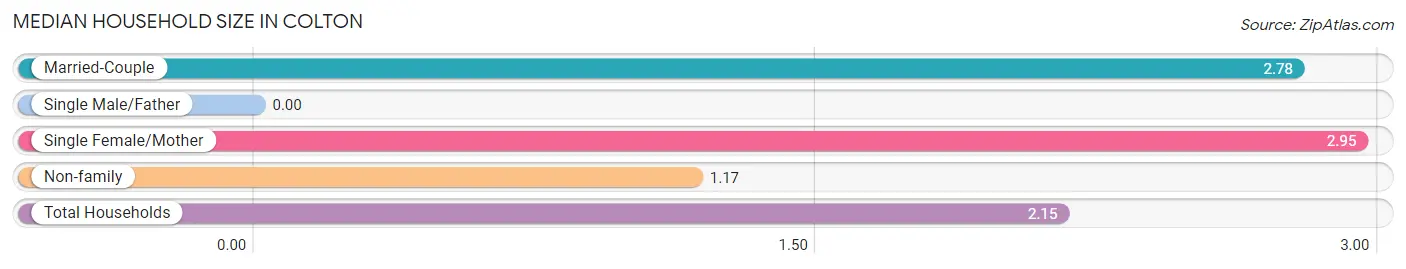
Median Household Size in Colton
| Household Type | # Households | Household Size |
| Married-Couple | 54 (42.5%) | 2.78 |
| Single Male/Father | 0 (0.0%) | - |
| Single Female/Mother | 21 (16.5%) | 2.95 |
| Non-family | 52 (40.9%) | 1.17 |
| Total Households | 127 (100.0%) | 2.15 |
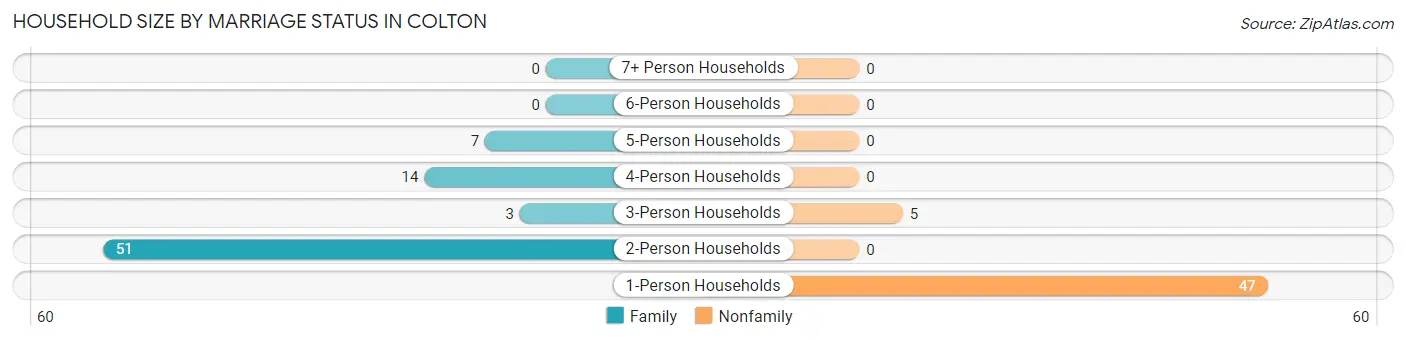
Household Size by Marriage Status in Colton
Out of a total of 127 households in Colton, 75 (59.1%) are family households, while 52 (40.9%) are nonfamily households. The most numerous type of family households are 2-person households, comprising 51, and the most common type of nonfamily households are 1-person households, comprising 47.
| Household Size | Family Households | Nonfamily Households |
| 1-Person Households | - | 47 (37.0%) |
| 2-Person Households | 51 (40.2%) | 0 (0.0%) |
| 3-Person Households | 3 (2.4%) | 5 (3.9%) |
| 4-Person Households | 14 (11.0%) | 0 (0.0%) |
| 5-Person Households | 7 (5.5%) | 0 (0.0%) |
| 6-Person Households | 0 (0.0%) | 0 (0.0%) |
| 7+ Person Households | 0 (0.0%) | 0 (0.0%) |
| Total | 75 (59.1%) | 52 (40.9%) |
Female Fertility in Colton
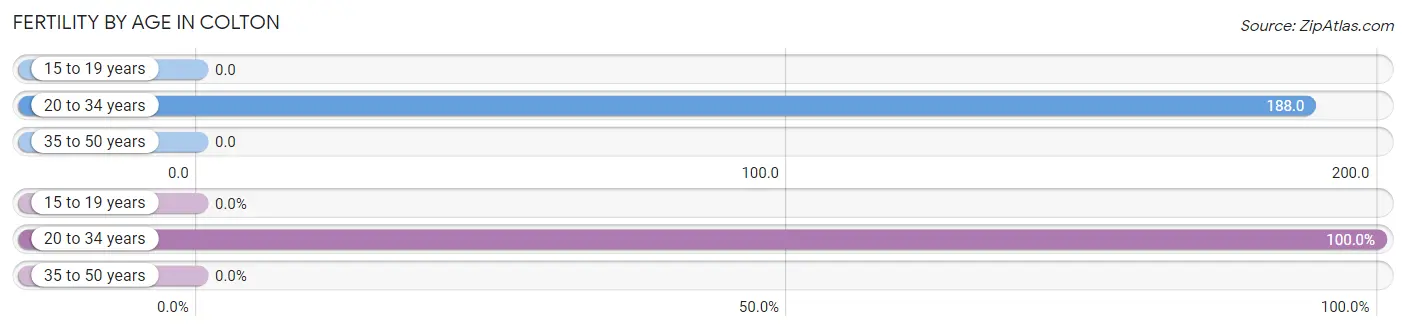
Fertility by Age in Colton
Average fertility rate in Colton is 41.0 births per 1,000 women. Women in the age bracket of 20 to 34 years have the highest fertility rate with 188.0 births per 1,000 women. Women in the age bracket of 20 to 34 years acount for 100.0% of all women with births.
| Age Bracket | Women with Births | Births / 1,000 Women |
| 15 to 19 years | 0 (0.0%) | 0.0 |
| 20 to 34 years | 3 (100.0%) | 188.0 |
| 35 to 50 years | 0 (0.0%) | 0.0 |
| Total | 3 (100.0%) | 41.0 |
Fertility by Age by Marriage Status in Colton
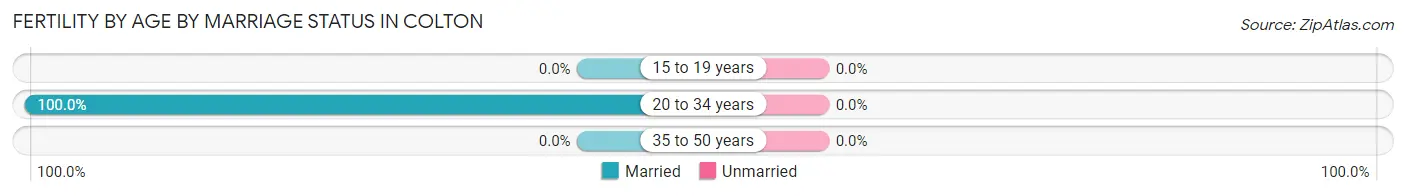
| Age Bracket | Married | Unmarried |
| 15 to 19 years | 0 (0.0%) | 0 (0.0%) |
| 20 to 34 years | 3 (100.0%) | 0 (0.0%) |
| 35 to 50 years | 0 (0.0%) | 0 (0.0%) |
| Total | 3 (100.0%) | 0 (0.0%) |
Fertility by Education in Colton
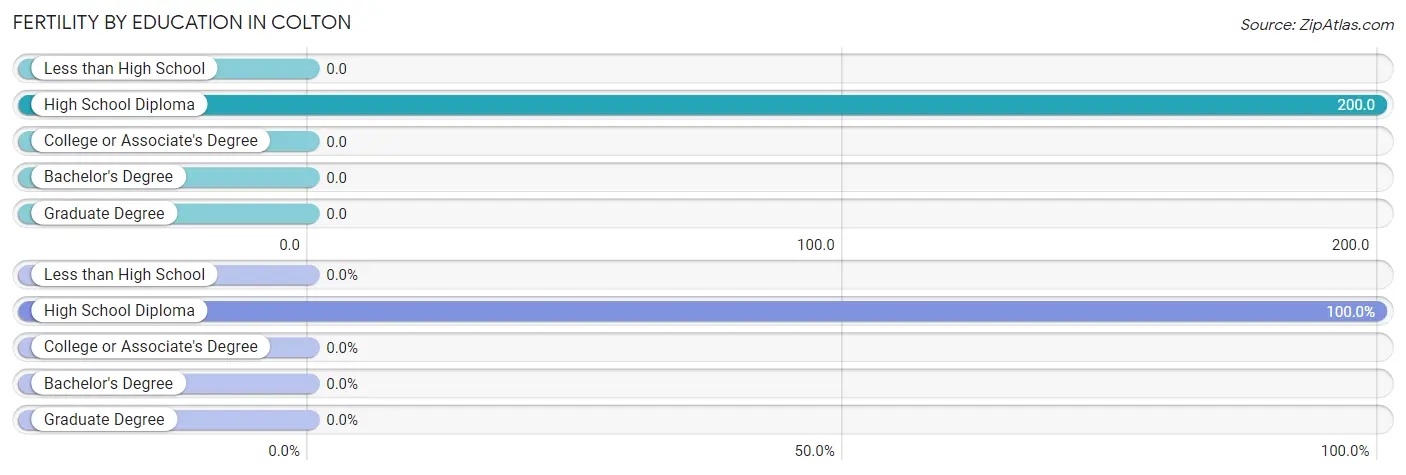
| Educational Attainment | Women with Births | Births / 1,000 Women |
| Less than High School | 0 (0.0%) | 0.0 |
| High School Diploma | 3 (100.0%) | 200.0 |
| College or Associate's Degree | 0 (0.0%) | 0.0 |
| Bachelor's Degree | 0 (0.0%) | 0.0 |
| Graduate Degree | 0 (0.0%) | 0.0 |
| Total | 3 (100.0%) | 41.0 |
Fertility by Education by Marriage Status in Colton
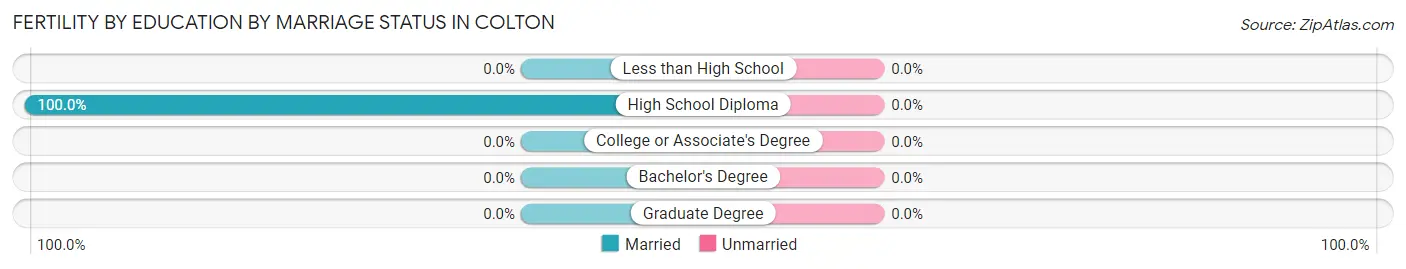
| Educational Attainment | Married | Unmarried |
| Less than High School | 0 (0.0%) | 0 (0.0%) |
| High School Diploma | 3 (100.0%) | 0 (0.0%) |
| College or Associate's Degree | 0 (0.0%) | 0 (0.0%) |
| Bachelor's Degree | 0 (0.0%) | 0 (0.0%) |
| Graduate Degree | 0 (0.0%) | 0 (0.0%) |
| Total | 3 (100.0%) | 0 (0.0%) |
Income in Colton
Income Overview in Colton
Per Capita Income in Colton is $35,922, while median incomes of families and households are $71,875 and $70,724 respectively.
| Characteristic | Number | Measure |
| Per Capita Income | 274 | $35,922 |
| Median Family Income | 75 | $71,875 |
| Mean Family Income | 75 | $87,275 |
| Median Household Income | 127 | $70,724 |
| Mean Household Income | 127 | $72,839 |
| Income Deficit | 75 | $0 |
| Wage / Income Gap (%) | 274 | 27.27% |
| Wage / Income Gap ($) | 274 | 72.73¢ per $1 |
| Gini / Inequality Index | 274 | 0.45 |
Earnings by Sex in Colton
Average Earnings in Colton are $59,688, $49,327 for men and $67,826 for women, a difference of 27.3%.
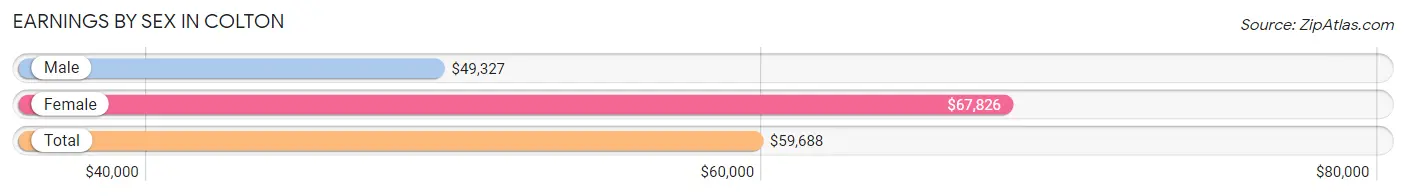
| Sex | Number | Average Earnings |
| Male | 55 (37.9%) | $49,327 |
| Female | 90 (62.1%) | $67,826 |
| Total | 145 (100.0%) | $59,688 |
Earnings by Sex by Income Bracket in Colton
The most common earnings brackets in Colton are $45,000 to $49,999 for men (15 | 27.3%) and $65,000 to $74,999 for women (46 | 51.1%).
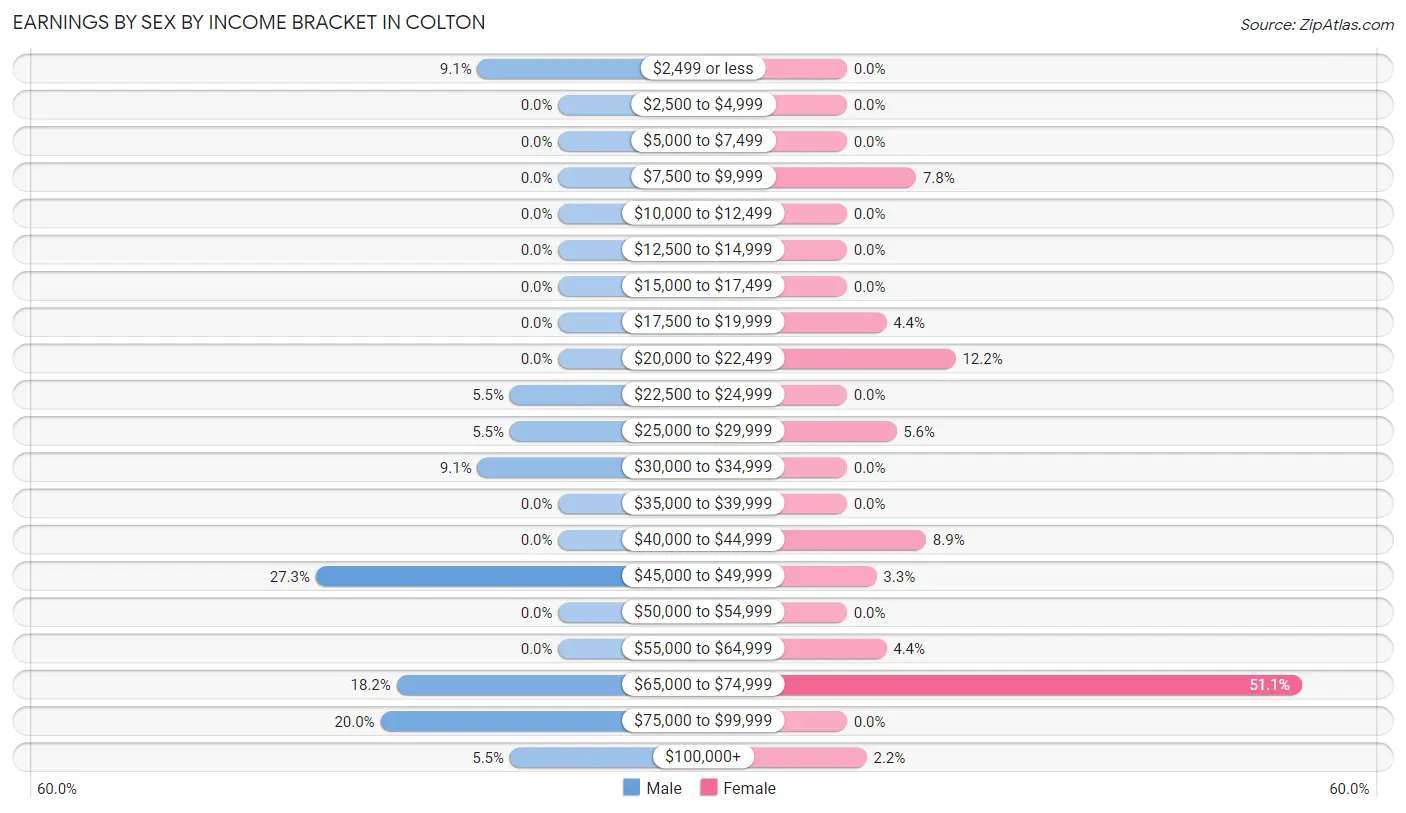
| Income | Male | Female |
| $2,499 or less | 5 (9.1%) | 0 (0.0%) |
| $2,500 to $4,999 | 0 (0.0%) | 0 (0.0%) |
| $5,000 to $7,499 | 0 (0.0%) | 0 (0.0%) |
| $7,500 to $9,999 | 0 (0.0%) | 7 (7.8%) |
| $10,000 to $12,499 | 0 (0.0%) | 0 (0.0%) |
| $12,500 to $14,999 | 0 (0.0%) | 0 (0.0%) |
| $15,000 to $17,499 | 0 (0.0%) | 0 (0.0%) |
| $17,500 to $19,999 | 0 (0.0%) | 4 (4.4%) |
| $20,000 to $22,499 | 0 (0.0%) | 11 (12.2%) |
| $22,500 to $24,999 | 3 (5.4%) | 0 (0.0%) |
| $25,000 to $29,999 | 3 (5.4%) | 5 (5.6%) |
| $30,000 to $34,999 | 5 (9.1%) | 0 (0.0%) |
| $35,000 to $39,999 | 0 (0.0%) | 0 (0.0%) |
| $40,000 to $44,999 | 0 (0.0%) | 8 (8.9%) |
| $45,000 to $49,999 | 15 (27.3%) | 3 (3.3%) |
| $50,000 to $54,999 | 0 (0.0%) | 0 (0.0%) |
| $55,000 to $64,999 | 0 (0.0%) | 4 (4.4%) |
| $65,000 to $74,999 | 10 (18.2%) | 46 (51.1%) |
| $75,000 to $99,999 | 11 (20.0%) | 0 (0.0%) |
| $100,000+ | 3 (5.4%) | 2 (2.2%) |
| Total | 55 (100.0%) | 90 (100.0%) |
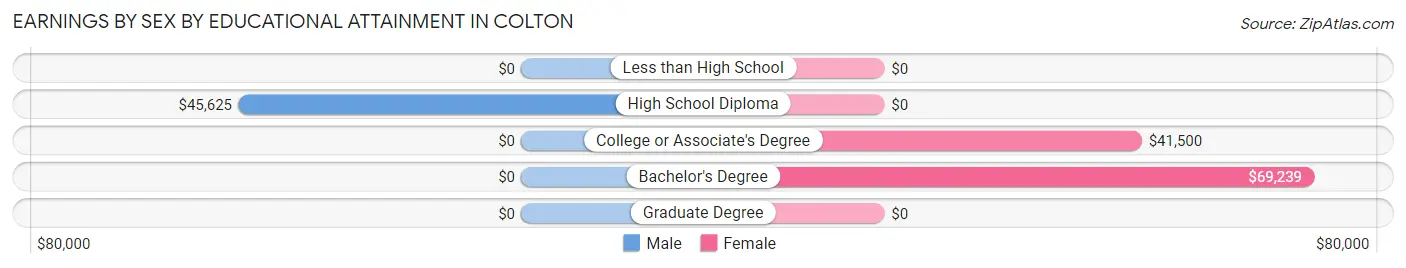
Earnings by Sex by Educational Attainment in Colton
Average earnings in Colton are $49,327 for men and $68,261 for women, a difference of 27.7%. Men with an educational attainment of high school diploma enjoy the highest average annual earnings of $45,625, while those with high school diploma education earn the least with $45,625. Women with an educational attainment of bachelor's degree earn the most with the average annual earnings of $69,239, while those with college or associate's degree education have the smallest earnings of $41,500.
| Educational Attainment | Male Income | Female Income |
| Less than High School | - | - |
| High School Diploma | $45,625 | $0 |
| College or Associate's Degree | - | - |
| Bachelor's Degree | - | - |
| Graduate Degree | - | - |
| Total | $49,327 | $68,261 |
Family Income in Colton
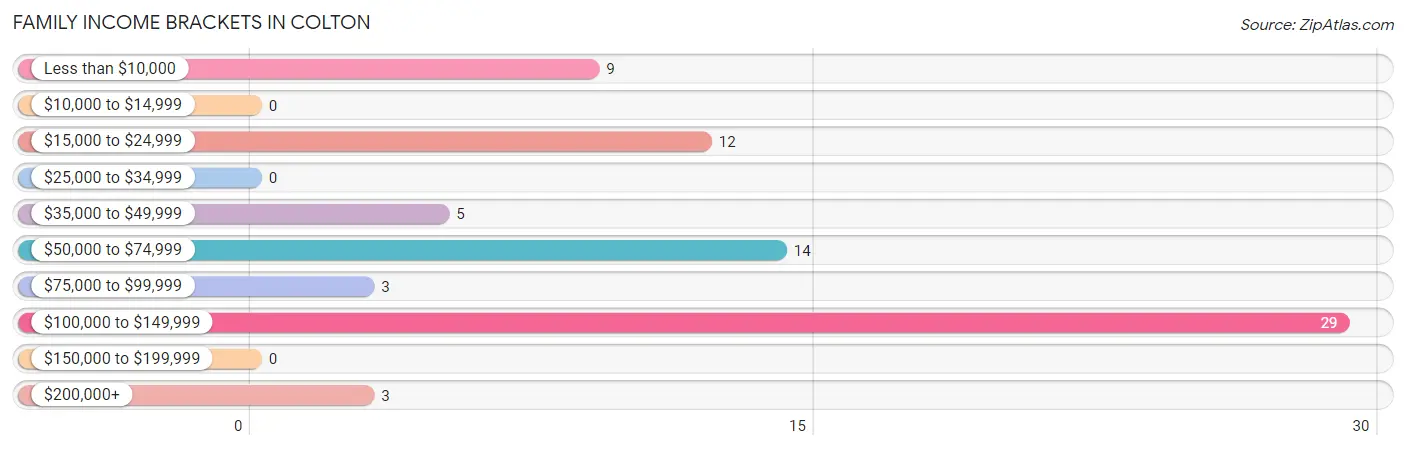
Family Income Brackets in Colton
According to the Colton family income data, there are 29 families falling into the $100,000 to $149,999 income range, which is the most common income bracket and makes up 38.7% of all families.
| Income Bracket | # Families | % Families |
| Less than $10,000 | 9 | 12.0% |
| $10,000 to $14,999 | 0 | 0.0% |
| $15,000 to $24,999 | 12 | 16.0% |
| $25,000 to $34,999 | 0 | 0.0% |
| $35,000 to $49,999 | 5 | 6.7% |
| $50,000 to $74,999 | 14 | 18.7% |
| $75,000 to $99,999 | 3 | 4.0% |
| $100,000 to $149,999 | 29 | 38.7% |
| $150,000 to $199,999 | 0 | 0.0% |
| $200,000+ | 3 | 4.0% |
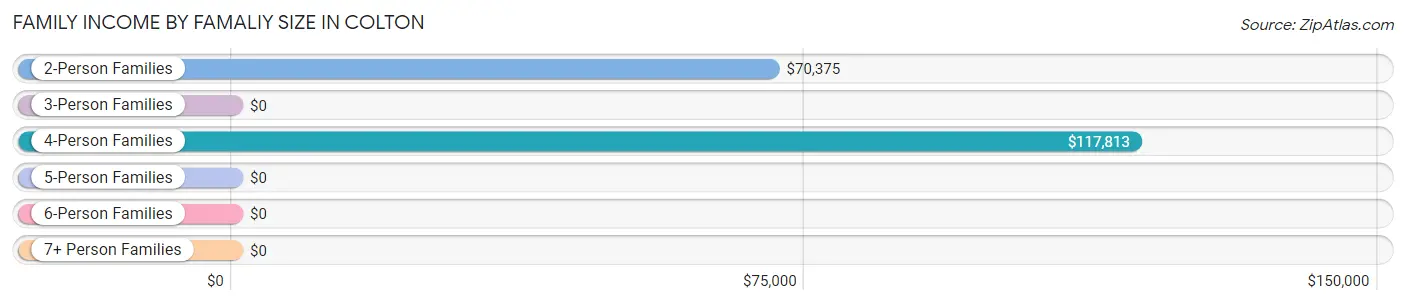
Family Income by Famaliy Size in Colton
4-person families (14 | 18.7%) account for the highest median family income in Colton with $117,813 per family, while 2-person families (51 | 68.0%) have the highest median income of $35,188 per family member.
| Income Bracket | # Families | Median Income |
| 2-Person Families | 51 (68.0%) | $70,375 |
| 3-Person Families | 3 (4.0%) | $0 |
| 4-Person Families | 14 (18.7%) | $117,813 |
| 5-Person Families | 7 (9.3%) | $0 |
| 6-Person Families | 0 (0.0%) | $0 |
| 7+ Person Families | 0 (0.0%) | $0 |
| Total | 75 (100.0%) | $71,875 |
Family Income by Number of Earners in Colton
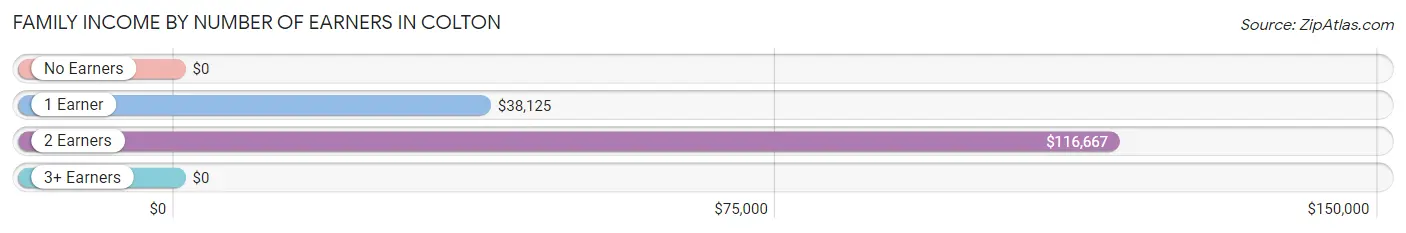
| Number of Earners | # Families | Median Income |
| No Earners | 27 (36.0%) | $0 |
| 1 Earner | 7 (9.3%) | $38,125 |
| 2 Earners | 30 (40.0%) | $116,667 |
| 3+ Earners | 11 (14.7%) | $0 |
| Total | 75 (100.0%) | $71,875 |
Household Income in Colton
Household Income Brackets in Colton
With 34 households falling in the category, the $100,000 to $149,999 income range is the most frequent in Colton, accounting for 26.8% of all households.
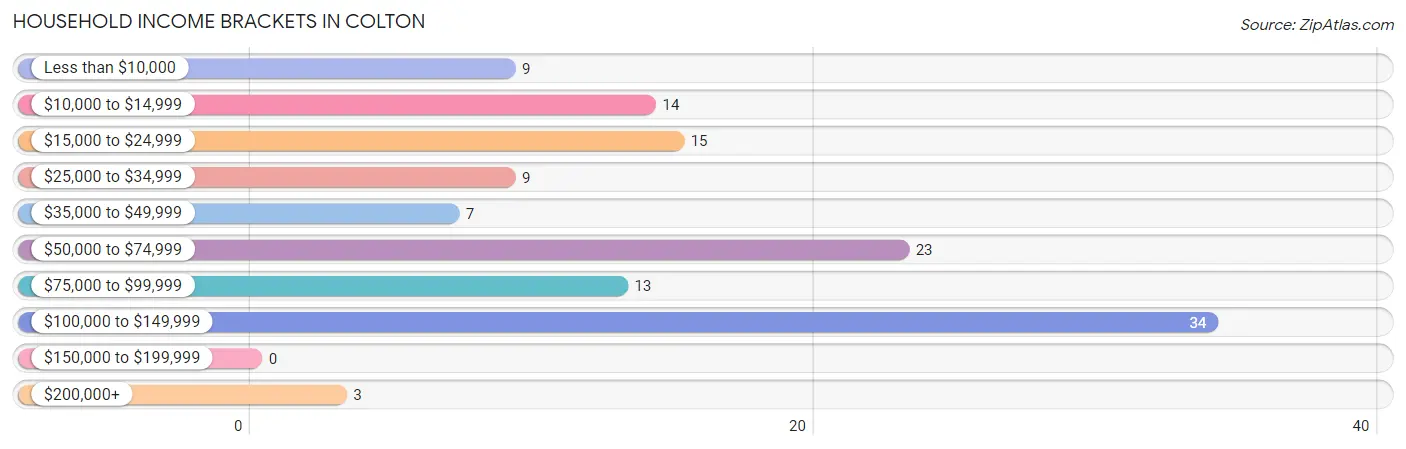
| Income Bracket | # Households | % Households |
| Less than $10,000 | 9 | 7.1% |
| $10,000 to $14,999 | 14 | 11.0% |
| $15,000 to $24,999 | 15 | 11.8% |
| $25,000 to $34,999 | 9 | 7.1% |
| $35,000 to $49,999 | 7 | 5.5% |
| $50,000 to $74,999 | 23 | 18.1% |
| $75,000 to $99,999 | 13 | 10.2% |
| $100,000 to $149,999 | 34 | 26.8% |
| $150,000 to $199,999 | 0 | 0.0% |
| $200,000+ | 3 | 2.4% |
Household Income by Householder Age in Colton
The median household income in Colton is $70,724, with the highest median household income of $122,250 found in the 25 to 44 years age bracket for the primary householder. A total of 29 households (22.8%) fall into this category.
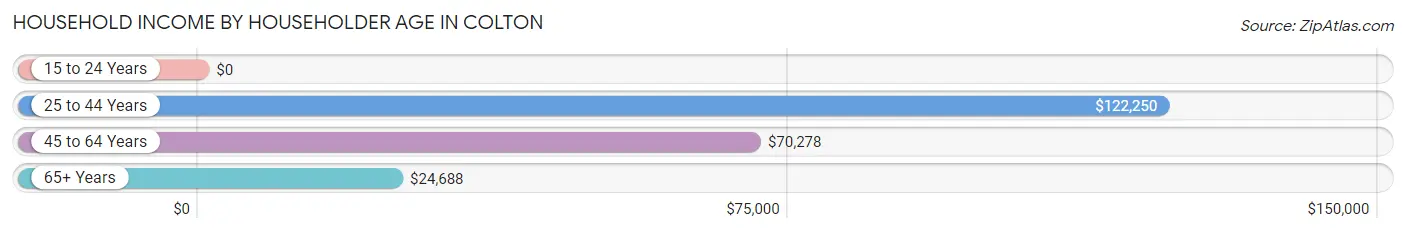
| Income Bracket | # Households | Median Income |
| 15 to 24 Years | 0 (0.0%) | $0 |
| 25 to 44 Years | 29 (22.8%) | $122,250 |
| 45 to 64 Years | 58 (45.7%) | $70,278 |
| 65+ Years | 40 (31.5%) | $24,688 |
| Total | 127 (100.0%) | $70,724 |
Poverty in Colton
Income Below Poverty by Sex and Age in Colton
With 20.4% poverty level for males and 16.9% for females among the residents of Colton, 45 to 54 year old males and 75 year old and over females are the most vulnerable to poverty, with 10 males (43.5%) and 4 females (100.0%) in their respective age groups living below the poverty level.
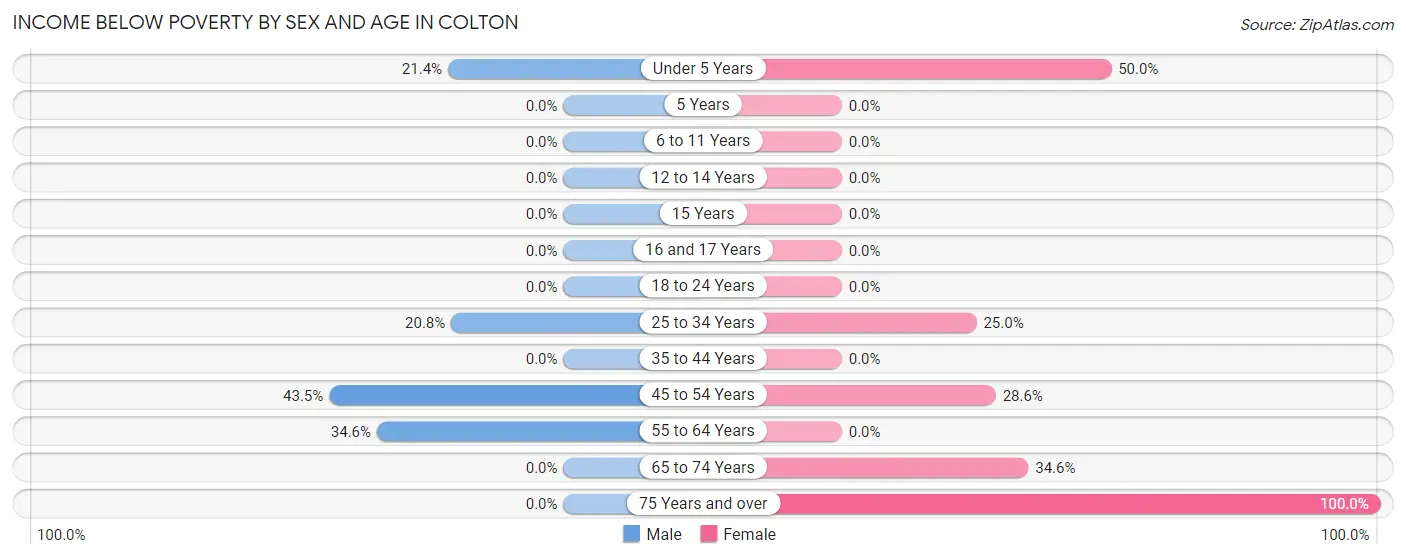
| Age Bracket | Male | Female |
| Under 5 Years | 3 (21.4%) | 3 (50.0%) |
| 5 Years | 0 (0.0%) | 0 (0.0%) |
| 6 to 11 Years | 0 (0.0%) | 0 (0.0%) |
| 12 to 14 Years | 0 (0.0%) | 0 (0.0%) |
| 15 Years | 0 (0.0%) | 0 (0.0%) |
| 16 and 17 Years | 0 (0.0%) | 0 (0.0%) |
| 18 to 24 Years | 0 (0.0%) | 0 (0.0%) |
| 25 to 34 Years | 5 (20.8%) | 4 (25.0%) |
| 35 to 44 Years | 0 (0.0%) | 0 (0.0%) |
| 45 to 54 Years | 10 (43.5%) | 4 (28.6%) |
| 55 to 64 Years | 9 (34.6%) | 0 (0.0%) |
| 65 to 74 Years | 0 (0.0%) | 9 (34.6%) |
| 75 Years and over | 0 (0.0%) | 4 (100.0%) |
| Total | 27 (20.4%) | 24 (16.9%) |
Income Above Poverty by Sex and Age in Colton
According to the poverty statistics in Colton, males aged 5 years and females aged 5 years are the age groups that are most secure financially, with 100.0% of males and 100.0% of females in these age groups living above the poverty line.
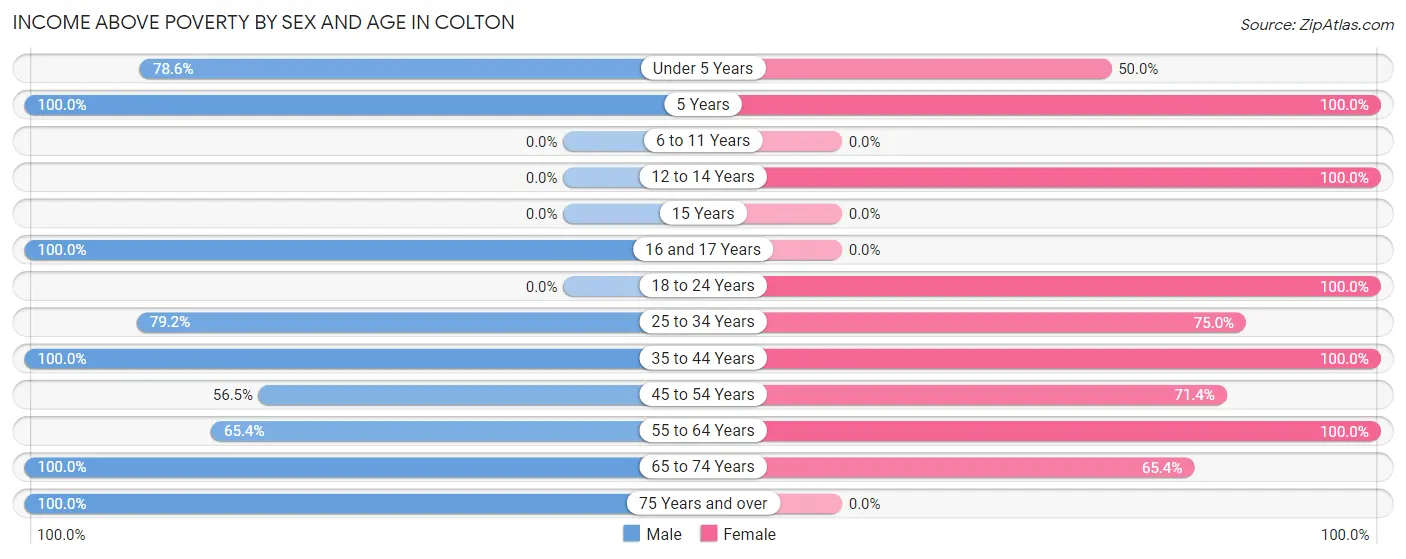
| Age Bracket | Male | Female |
| Under 5 Years | 11 (78.6%) | 3 (50.0%) |
| 5 Years | 3 (100.0%) | 3 (100.0%) |
| 6 to 11 Years | 0 (0.0%) | 0 (0.0%) |
| 12 to 14 Years | 0 (0.0%) | 3 (100.0%) |
| 15 Years | 0 (0.0%) | 0 (0.0%) |
| 16 and 17 Years | 10 (100.0%) | 0 (0.0%) |
| 18 to 24 Years | 0 (0.0%) | 8 (100.0%) |
| 25 to 34 Years | 19 (79.2%) | 12 (75.0%) |
| 35 to 44 Years | 4 (100.0%) | 43 (100.0%) |
| 45 to 54 Years | 13 (56.5%) | 10 (71.4%) |
| 55 to 64 Years | 17 (65.4%) | 19 (100.0%) |
| 65 to 74 Years | 20 (100.0%) | 17 (65.4%) |
| 75 Years and over | 8 (100.0%) | 0 (0.0%) |
| Total | 105 (79.5%) | 118 (83.1%) |
Income Below Poverty Among Married-Couple Families in Colton
The poverty statistics for married-couple families in Colton show that 16.7% or 9 of the total 54 families live below the poverty line. Families with no children have the highest poverty rate of 24.3%, comprising of 9 families. On the other hand, families with 1 or 2 children have the lowest poverty rate of 0.0%, which includes 0 families.
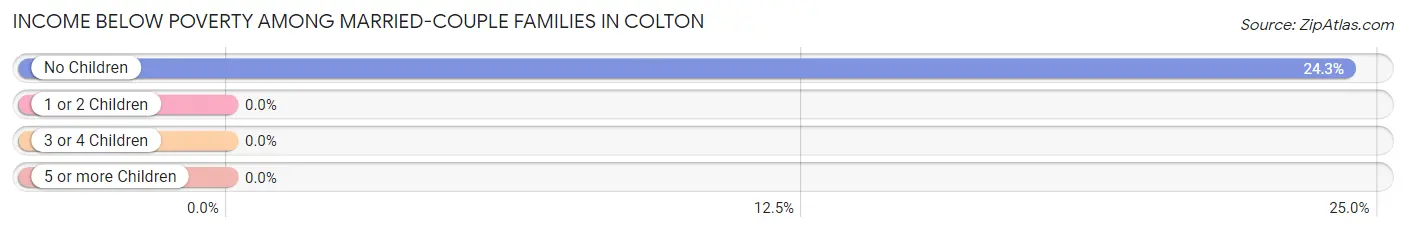
| Children | Above Poverty | Below Poverty |
| No Children | 28 (75.7%) | 9 (24.3%) |
| 1 or 2 Children | 14 (100.0%) | 0 (0.0%) |
| 3 or 4 Children | 3 (100.0%) | 0 (0.0%) |
| 5 or more Children | 0 (0.0%) | 0 (0.0%) |
| Total | 45 (83.3%) | 9 (16.7%) |
Income Below Poverty Among Single-Parent Households in Colton
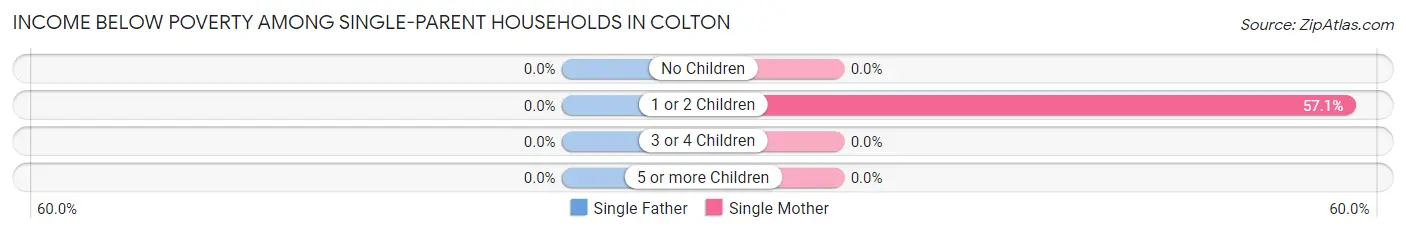
| Children | Single Father | Single Mother |
| No Children | 0 (0.0%) | 0 (0.0%) |
| 1 or 2 Children | 0 (0.0%) | 4 (57.1%) |
| 3 or 4 Children | 0 (0.0%) | 0 (0.0%) |
| 5 or more Children | 0 (0.0%) | 0 (0.0%) |
| Total | 0 (0.0%) | 4 (19.1%) |
Income Below Poverty Among Married-Couple vs Single-Parent Households in Colton
The poverty data for Colton shows that 9 of the married-couple family households (16.7%) and 4 of the single-parent households (19.1%) are living below the poverty level. Within the married-couple family households, those with no children have the highest poverty rate, with 9 households (24.3%) falling below the poverty line. Among the single-parent households, those with 1 or 2 children have the highest poverty rate, with 4 household (57.1%) living below poverty.
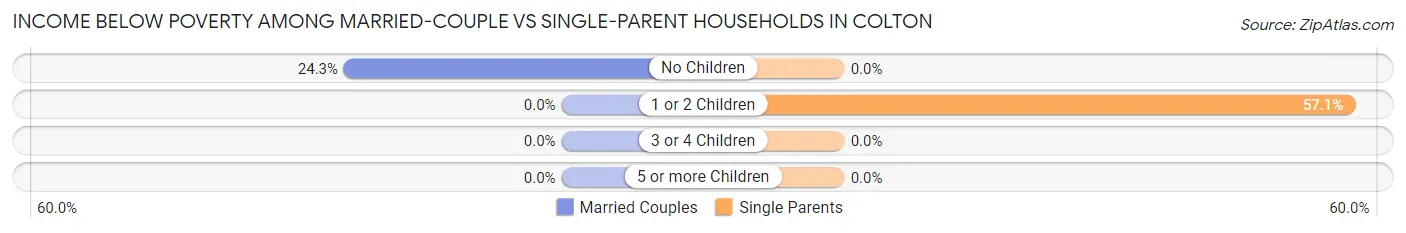
| Children | Married-Couple Families | Single-Parent Households |
| No Children | 9 (24.3%) | 0 (0.0%) |
| 1 or 2 Children | 0 (0.0%) | 4 (57.1%) |
| 3 or 4 Children | 0 (0.0%) | 0 (0.0%) |
| 5 or more Children | 0 (0.0%) | 0 (0.0%) |
| Total | 9 (16.7%) | 4 (19.1%) |
Employment Characteristics in Colton
Employment by Class of Employer in Colton
Among the 131 employed individuals in Colton, private company employees (65 | 49.6%), local government employees (26 | 19.9%), and self-employed (not incorporated) (16 | 12.2%) make up the most common classes of employment.
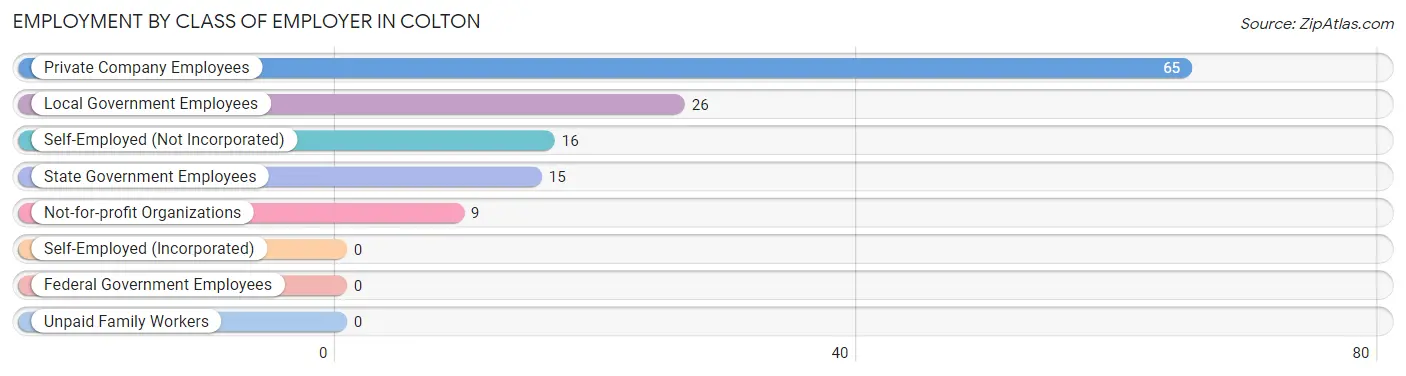
| Employer Class | # Employees | % Employees |
| Private Company Employees | 65 | 49.6% |
| Self-Employed (Incorporated) | 0 | 0.0% |
| Self-Employed (Not Incorporated) | 16 | 12.2% |
| Not-for-profit Organizations | 9 | 6.9% |
| Local Government Employees | 26 | 19.9% |
| State Government Employees | 15 | 11.5% |
| Federal Government Employees | 0 | 0.0% |
| Unpaid Family Workers | 0 | 0.0% |
| Total | 131 | 100.0% |
Employment Status by Age in Colton
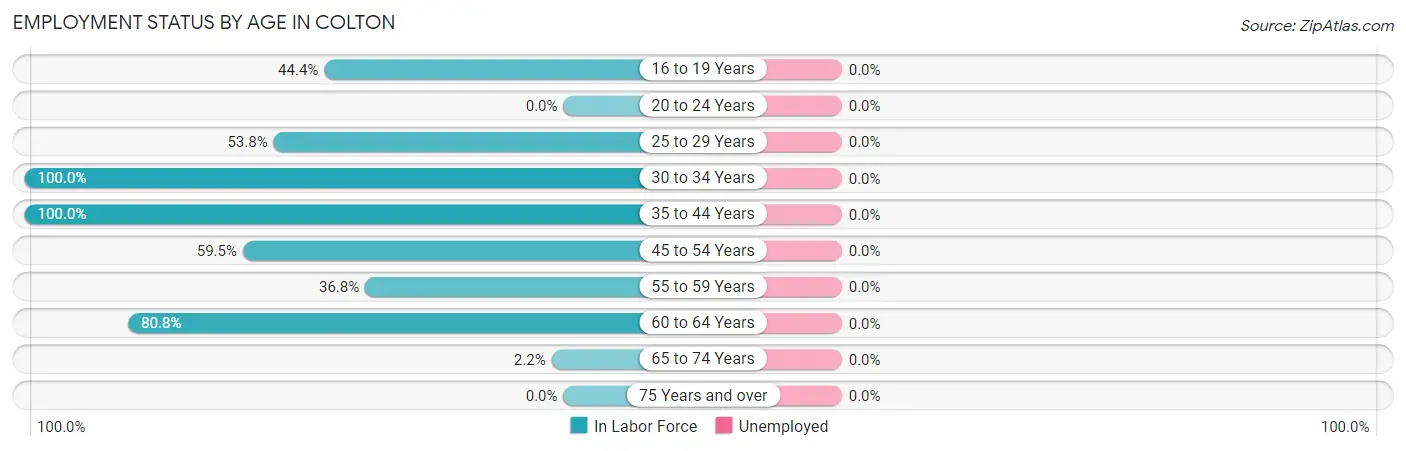
| Age Bracket | In Labor Force | Unemployed |
| 16 to 19 Years | 8 (44.4%) | 0 (0.0%) |
| 20 to 24 Years | 0 (0.0%) | 0 (0.0%) |
| 25 to 29 Years | 14 (53.8%) | 0 (0.0%) |
| 30 to 34 Years | 14 (100.0%) | 0 (0.0%) |
| 35 to 44 Years | 47 (100.0%) | 0 (0.0%) |
| 45 to 54 Years | 22 (59.5%) | 0 (0.0%) |
| 55 to 59 Years | 7 (36.8%) | 0 (0.0%) |
| 60 to 64 Years | 21 (80.8%) | 0 (0.0%) |
| 65 to 74 Years | 1 (2.2%) | 0 (0.0%) |
| 75 Years and over | 0 (0.0%) | 0 (0.0%) |
| Total | 134 (54.7%) | 0 (0.0%) |
Employment Status by Educational Attainment in Colton
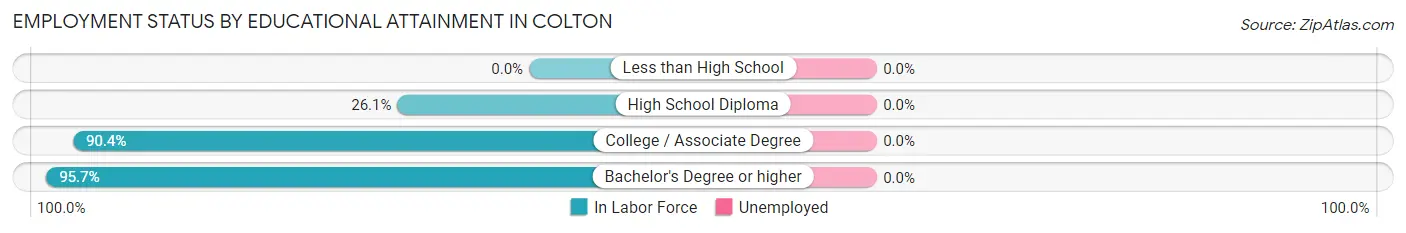
| Educational Attainment | In Labor Force | Unemployed |
| Less than High School | 0 (0.0%) | 0 (0.0%) |
| High School Diploma | 12 (26.1%) | 0 (0.0%) |
| College / Associate Degree | 47 (90.4%) | 0 (0.0%) |
| Bachelor's Degree or higher | 66 (95.7%) | 0 (0.0%) |
| Total | 125 (74.0%) | 0 (0.0%) |
Employment Occupations by Sex in Colton
Management, Business, Science and Arts Occupations
The most common Management, Business, Science and Arts occupations in Colton are Community & Social Service (33 | 24.6%), Education Instruction & Library (29 | 21.6%), Management (26 | 19.4%), Business & Financial (9 | 6.7%), and Computers, Engineering & Science (5 | 3.7%).
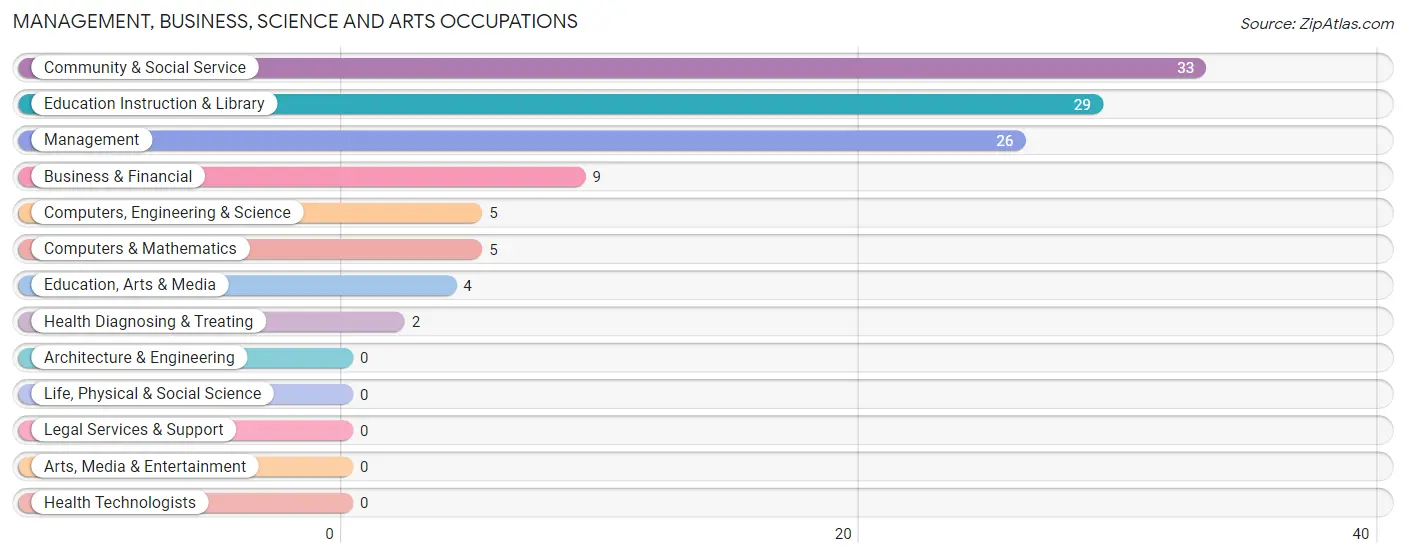
Management, Business, Science and Arts Occupations by Sex
Within the Management, Business, Science and Arts occupations in Colton, the most male-oriented occupations are Computers, Engineering & Science (100.0%), Computers & Mathematics (100.0%), and Management (38.5%), while the most female-oriented occupations are Health Diagnosing & Treating (100.0%), Education Instruction & Library (89.7%), and Community & Social Service (87.9%).
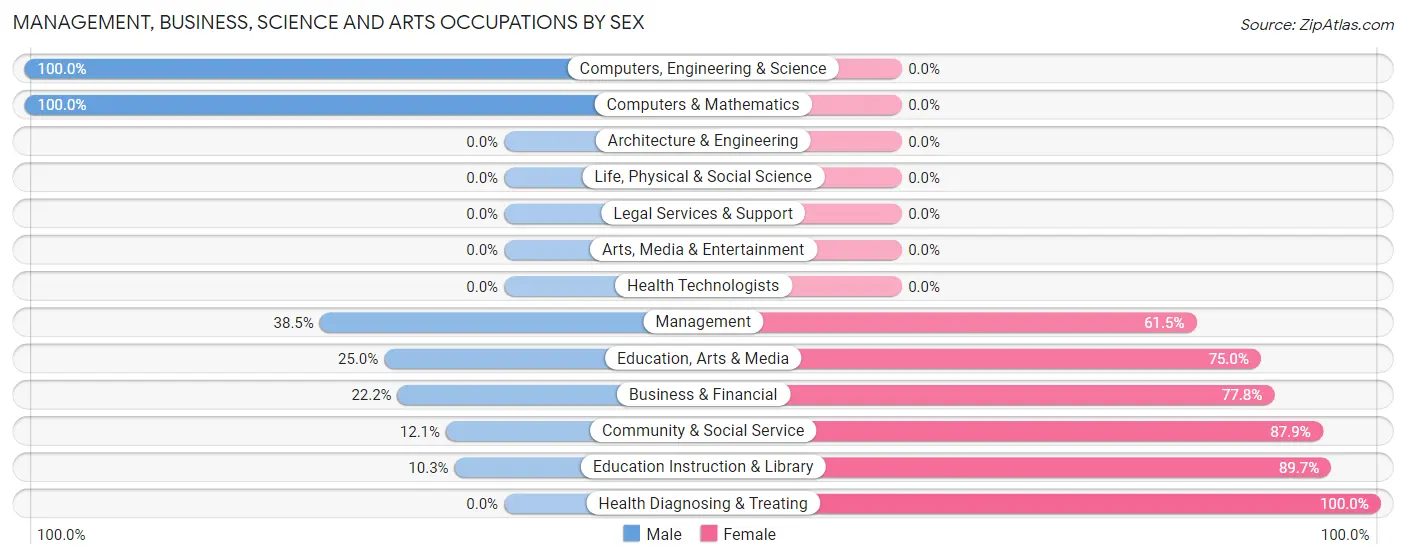
| Occupation | Male | Female |
| Management | 10 (38.5%) | 16 (61.5%) |
| Business & Financial | 2 (22.2%) | 7 (77.8%) |
| Computers, Engineering & Science | 5 (100.0%) | 0 (0.0%) |
| Computers & Mathematics | 5 (100.0%) | 0 (0.0%) |
| Architecture & Engineering | 0 (0.0%) | 0 (0.0%) |
| Life, Physical & Social Science | 0 (0.0%) | 0 (0.0%) |
| Community & Social Service | 4 (12.1%) | 29 (87.9%) |
| Education, Arts & Media | 1 (25.0%) | 3 (75.0%) |
| Legal Services & Support | 0 (0.0%) | 0 (0.0%) |
| Education Instruction & Library | 3 (10.3%) | 26 (89.7%) |
| Arts, Media & Entertainment | 0 (0.0%) | 0 (0.0%) |
| Health Diagnosing & Treating | 0 (0.0%) | 2 (100.0%) |
| Health Technologists | 0 (0.0%) | 0 (0.0%) |
| Total (Category) | 21 (28.0%) | 54 (72.0%) |
| Total (Overall) | 44 (32.8%) | 90 (67.2%) |
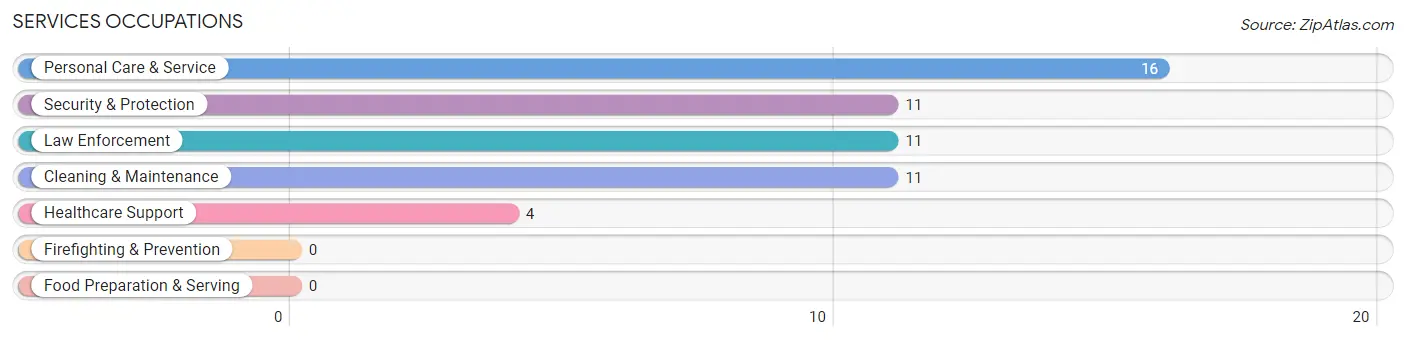
Services Occupations
The most common Services occupations in Colton are Personal Care & Service (16 | 11.9%), Security & Protection (11 | 8.2%), Law Enforcement (11 | 8.2%), Cleaning & Maintenance (11 | 8.2%), and Healthcare Support (4 | 3.0%).
Services Occupations by Sex
Within the Services occupations in Colton, the most male-oriented occupations are Security & Protection (100.0%), and Law Enforcement (100.0%), while the most female-oriented occupations are Healthcare Support (100.0%), Cleaning & Maintenance (100.0%), and Personal Care & Service (100.0%).
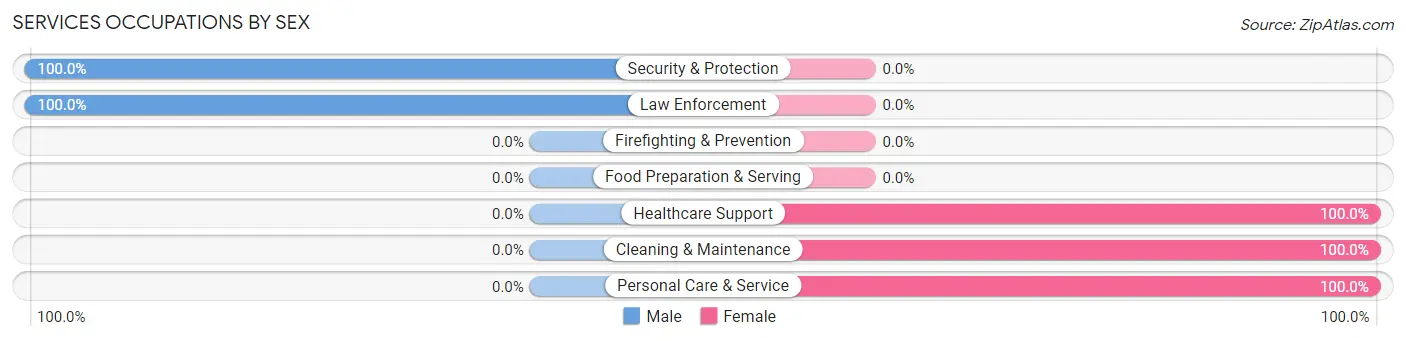
| Occupation | Male | Female |
| Healthcare Support | 0 (0.0%) | 4 (100.0%) |
| Security & Protection | 11 (100.0%) | 0 (0.0%) |
| Firefighting & Prevention | 0 (0.0%) | 0 (0.0%) |
| Law Enforcement | 11 (100.0%) | 0 (0.0%) |
| Food Preparation & Serving | 0 (0.0%) | 0 (0.0%) |
| Cleaning & Maintenance | 0 (0.0%) | 11 (100.0%) |
| Personal Care & Service | 0 (0.0%) | 16 (100.0%) |
| Total (Category) | 11 (26.2%) | 31 (73.8%) |
| Total (Overall) | 44 (32.8%) | 90 (67.2%) |
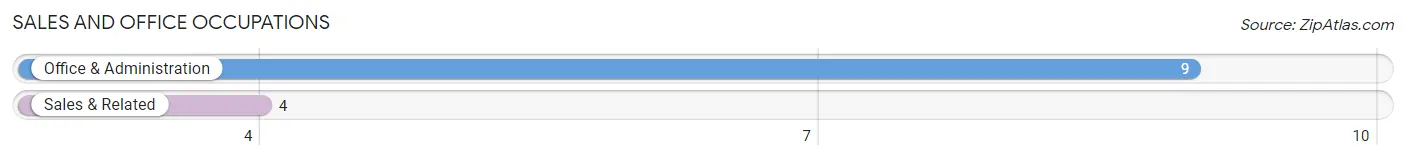
Sales and Office Occupations
The most common Sales and Office occupations in Colton are Office & Administration (9 | 6.7%), and Sales & Related (4 | 3.0%).
Sales and Office Occupations by Sex
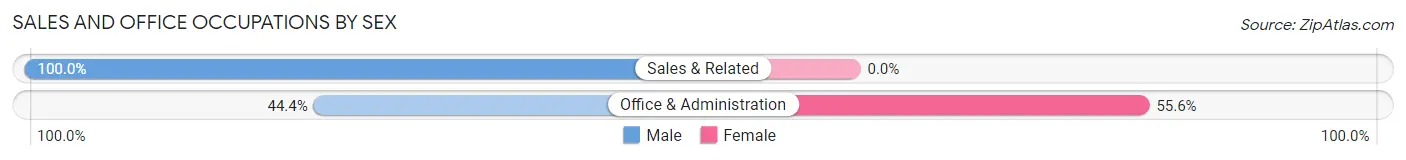
| Occupation | Male | Female |
| Sales & Related | 4 (100.0%) | 0 (0.0%) |
| Office & Administration | 4 (44.4%) | 5 (55.6%) |
| Total (Category) | 8 (61.5%) | 5 (38.5%) |
| Total (Overall) | 44 (32.8%) | 90 (67.2%) |
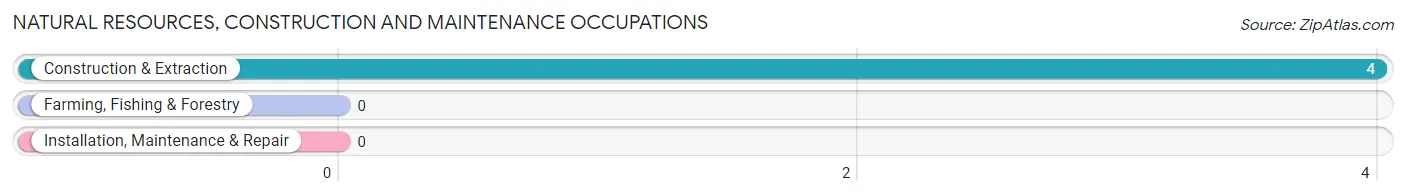
Natural Resources, Construction and Maintenance Occupations
The most common Natural Resources, Construction and Maintenance occupations in Colton are , and Construction & Extraction (4 | 3.0%).
Natural Resources, Construction and Maintenance Occupations by Sex
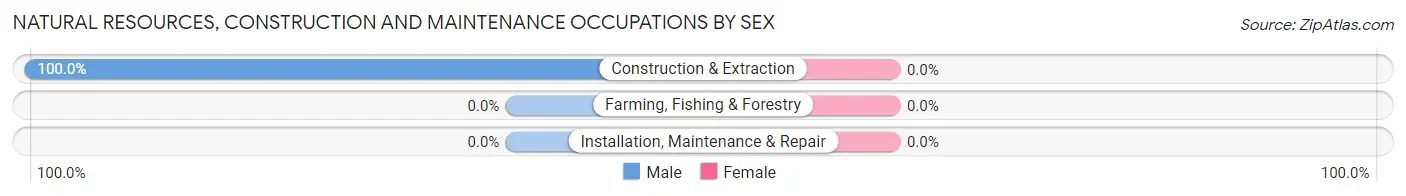
| Occupation | Male | Female |
| Farming, Fishing & Forestry | 0 (0.0%) | 0 (0.0%) |
| Construction & Extraction | 4 (100.0%) | 0 (0.0%) |
| Installation, Maintenance & Repair | 0 (0.0%) | 0 (0.0%) |
| Total (Category) | 4 (100.0%) | 0 (0.0%) |
| Total (Overall) | 44 (32.8%) | 90 (67.2%) |
Production, Transportation and Moving Occupations
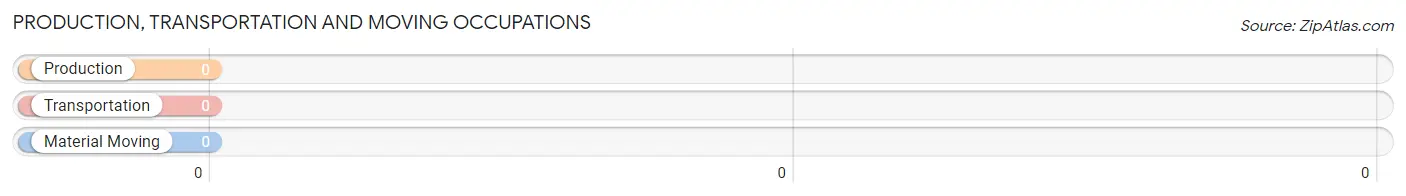
Production, Transportation and Moving Occupations by Sex
| Occupation | Male | Female |
| Production | 0 (0.0%) | 0 (0.0%) |
| Transportation | 0 (0.0%) | 0 (0.0%) |
| Material Moving | 0 (0.0%) | 0 (0.0%) |
| Total (Category) | 0 (0.0%) | 0 (0.0%) |
| Total (Overall) | 44 (32.8%) | 90 (67.2%) |
Employment Industries by Sex in Colton
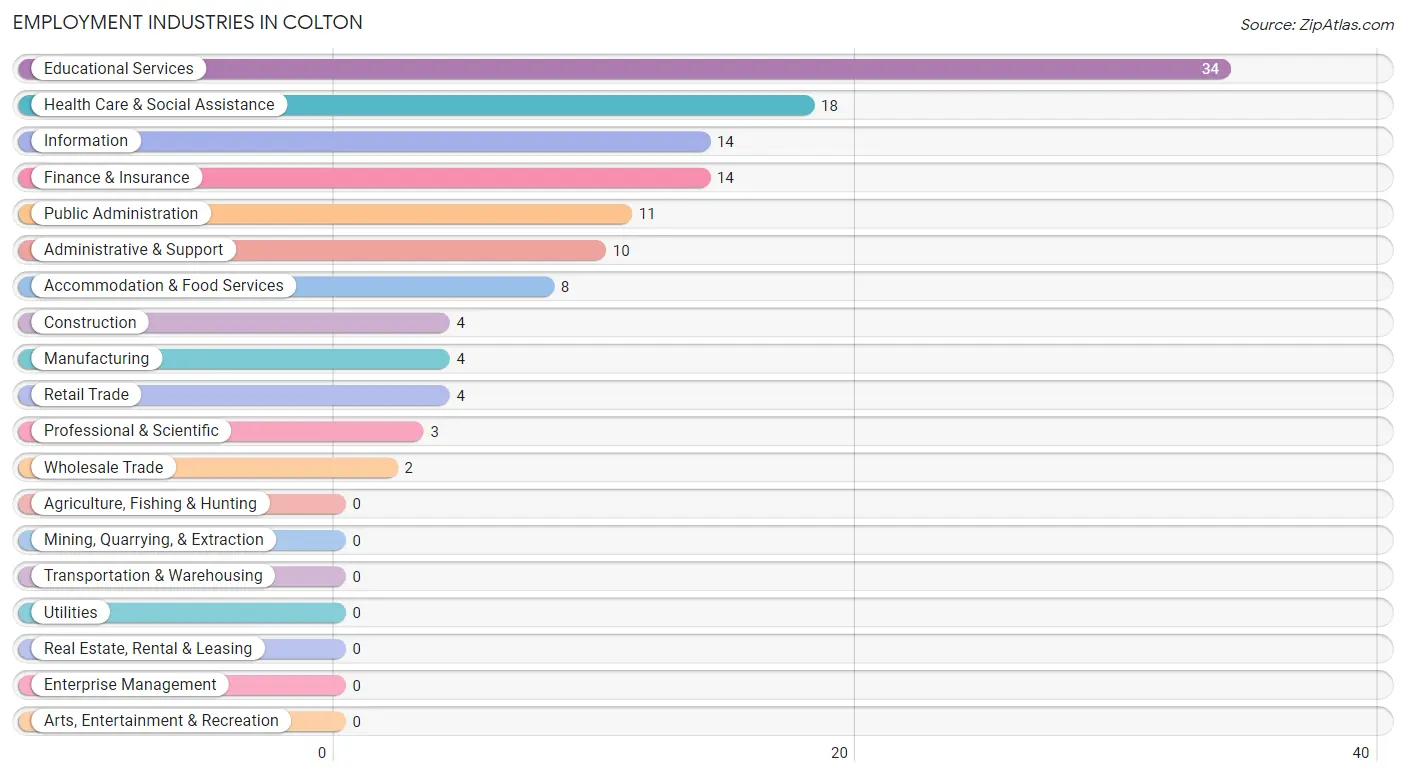
Employment Industries in Colton
The major employment industries in Colton include Educational Services (34 | 25.4%), Health Care & Social Assistance (18 | 13.4%), Information (14 | 10.4%), Finance & Insurance (14 | 10.4%), and Public Administration (11 | 8.2%).
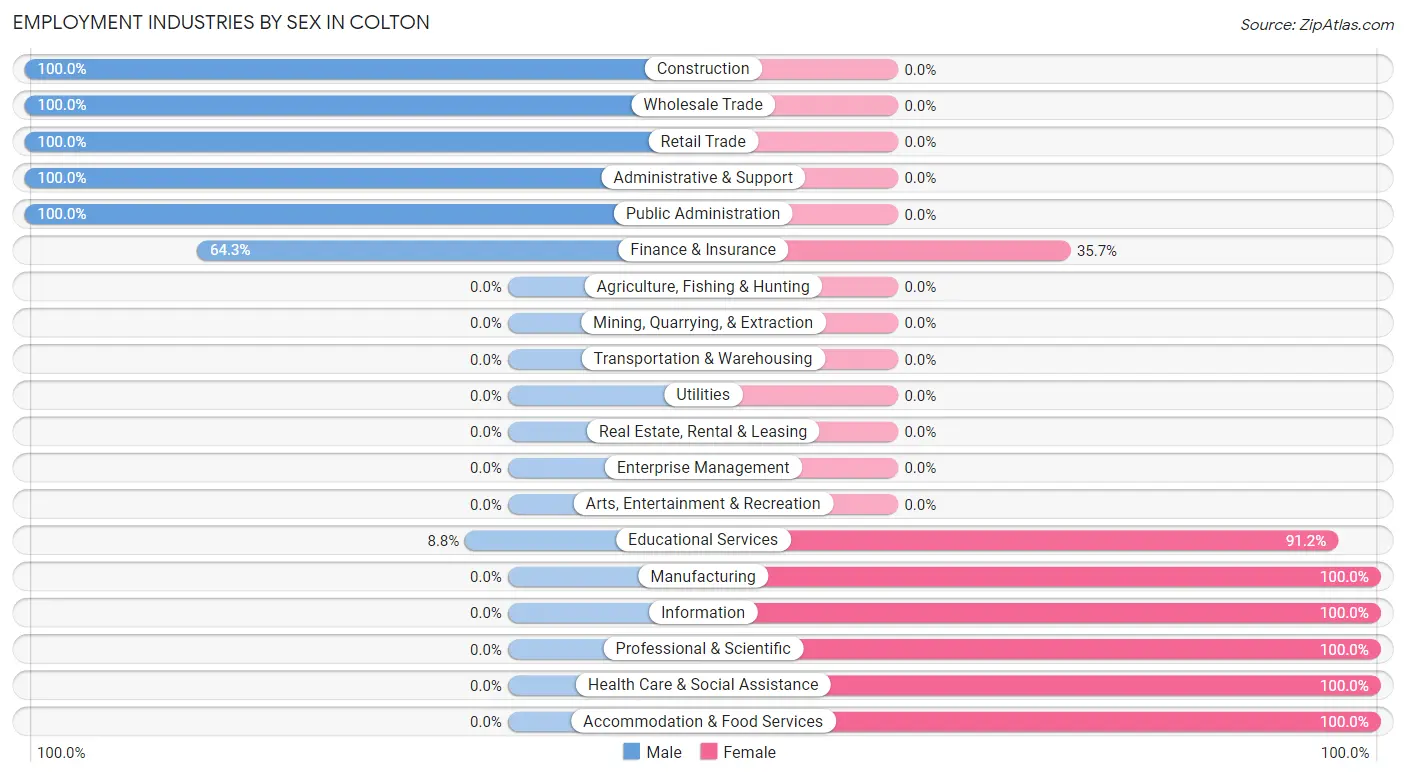
Employment Industries by Sex in Colton
The Colton industries that see more men than women are Construction (100.0%), Wholesale Trade (100.0%), and Retail Trade (100.0%), whereas the industries that tend to have a higher number of women are Manufacturing (100.0%), Information (100.0%), and Professional & Scientific (100.0%).
| Industry | Male | Female |
| Agriculture, Fishing & Hunting | 0 (0.0%) | 0 (0.0%) |
| Mining, Quarrying, & Extraction | 0 (0.0%) | 0 (0.0%) |
| Construction | 4 (100.0%) | 0 (0.0%) |
| Manufacturing | 0 (0.0%) | 4 (100.0%) |
| Wholesale Trade | 2 (100.0%) | 0 (0.0%) |
| Retail Trade | 4 (100.0%) | 0 (0.0%) |
| Transportation & Warehousing | 0 (0.0%) | 0 (0.0%) |
| Utilities | 0 (0.0%) | 0 (0.0%) |
| Information | 0 (0.0%) | 14 (100.0%) |
| Finance & Insurance | 9 (64.3%) | 5 (35.7%) |
| Real Estate, Rental & Leasing | 0 (0.0%) | 0 (0.0%) |
| Professional & Scientific | 0 (0.0%) | 3 (100.0%) |
| Enterprise Management | 0 (0.0%) | 0 (0.0%) |
| Administrative & Support | 10 (100.0%) | 0 (0.0%) |
| Educational Services | 3 (8.8%) | 31 (91.2%) |
| Health Care & Social Assistance | 0 (0.0%) | 18 (100.0%) |
| Arts, Entertainment & Recreation | 0 (0.0%) | 0 (0.0%) |
| Accommodation & Food Services | 0 (0.0%) | 8 (100.0%) |
| Public Administration | 11 (100.0%) | 0 (0.0%) |
| Total | 44 (32.8%) | 90 (67.2%) |
Education in Colton
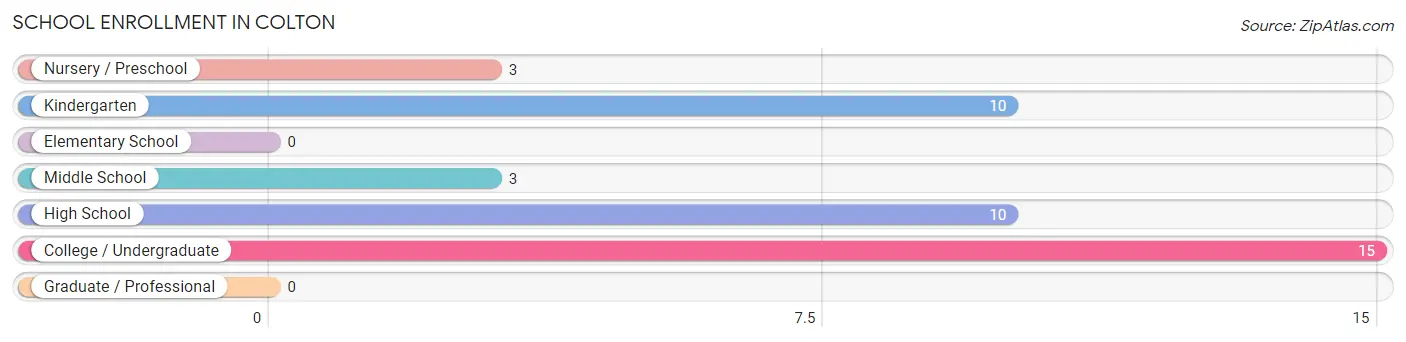
School Enrollment in Colton
The most common levels of schooling among the 41 students in Colton are college / undergraduate (15 | 36.6%), kindergarten (10 | 24.4%), and high school (10 | 24.4%).
| School Level | # Students | % Students |
| Nursery / Preschool | 3 | 7.3% |
| Kindergarten | 10 | 24.4% |
| Elementary School | 0 | 0.0% |
| Middle School | 3 | 7.3% |
| High School | 10 | 24.4% |
| College / Undergraduate | 15 | 36.6% |
| Graduate / Professional | 0 | 0.0% |
| Total | 41 | 100.0% |
School Enrollment by Age by Funding Source in Colton
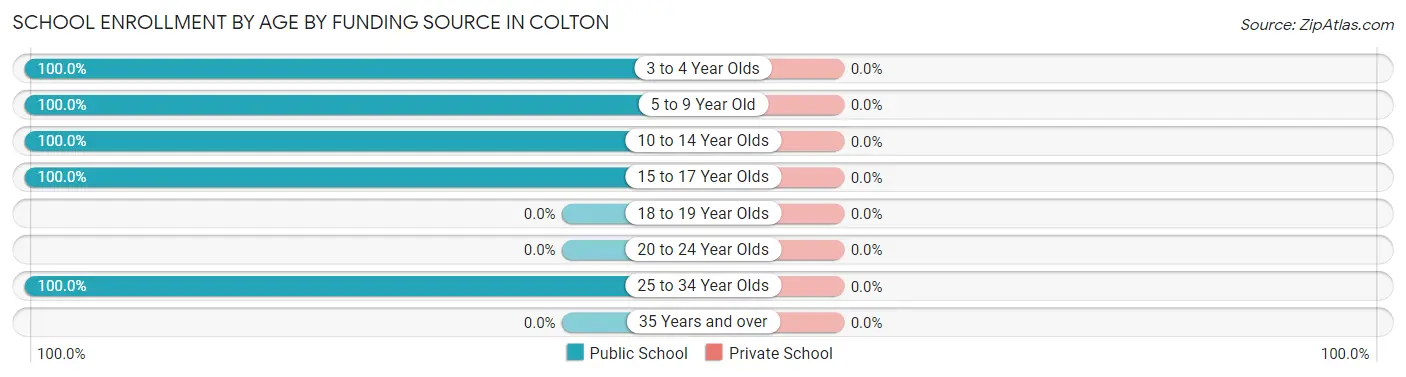
| Age Bracket | Public School | Private School |
| 3 to 4 Year Olds | 7 (100.0%) | 0 (0.0%) |
| 5 to 9 Year Old | 6 (100.0%) | 0 (0.0%) |
| 10 to 14 Year Olds | 3 (100.0%) | 0 (0.0%) |
| 15 to 17 Year Olds | 10 (100.0%) | 0 (0.0%) |
| 18 to 19 Year Olds | 0 (0.0%) | 0 (0.0%) |
| 20 to 24 Year Olds | 0 (0.0%) | 0 (0.0%) |
| 25 to 34 Year Olds | 15 (100.0%) | 0 (0.0%) |
| 35 Years and over | 0 (0.0%) | 0 (0.0%) |
| Total | 41 (100.0%) | 0 (0.0%) |
Educational Attainment by Field of Study in Colton
Education (23 | 31.5%), business (18 | 24.7%), social sciences (10 | 13.7%), arts & humanities (6 | 8.2%), and psychology (4 | 5.5%) are the most common fields of study among 73 individuals in Colton who have obtained a bachelor's degree or higher.
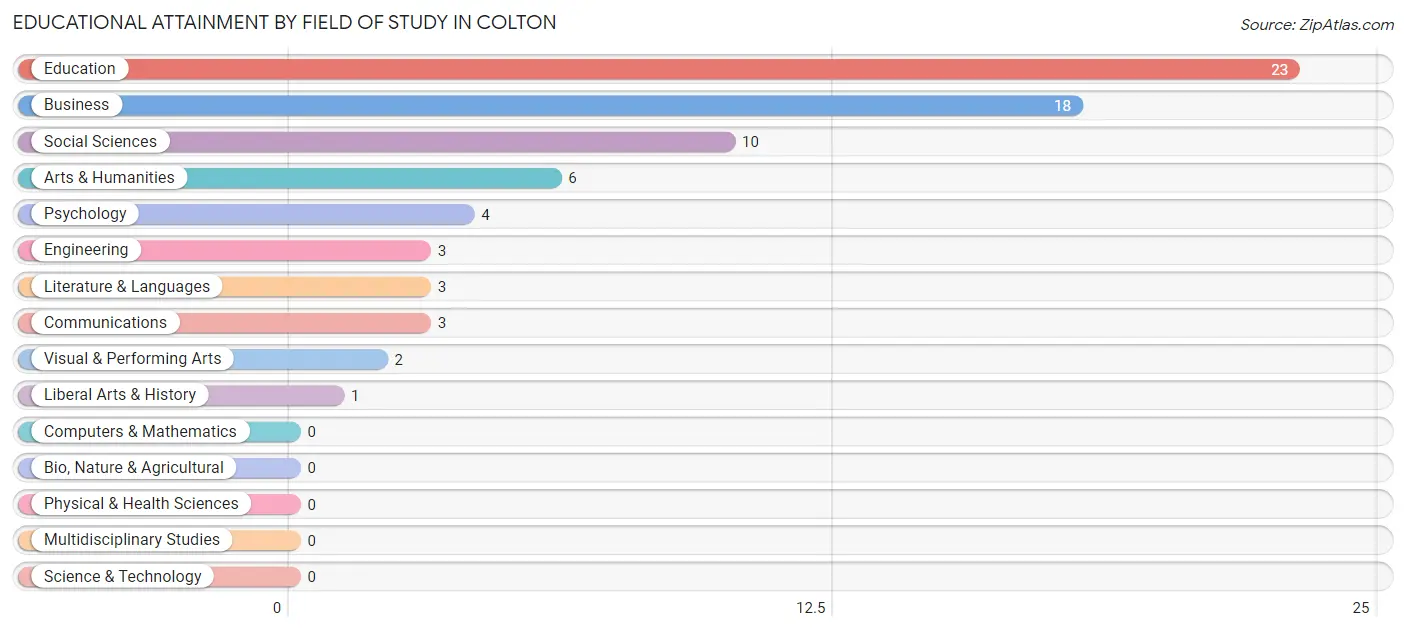
| Field of Study | # Graduates | % Graduates |
| Computers & Mathematics | 0 | 0.0% |
| Bio, Nature & Agricultural | 0 | 0.0% |
| Physical & Health Sciences | 0 | 0.0% |
| Psychology | 4 | 5.5% |
| Social Sciences | 10 | 13.7% |
| Engineering | 3 | 4.1% |
| Multidisciplinary Studies | 0 | 0.0% |
| Science & Technology | 0 | 0.0% |
| Business | 18 | 24.7% |
| Education | 23 | 31.5% |
| Literature & Languages | 3 | 4.1% |
| Liberal Arts & History | 1 | 1.4% |
| Visual & Performing Arts | 2 | 2.7% |
| Communications | 3 | 4.1% |
| Arts & Humanities | 6 | 8.2% |
| Total | 73 | 100.0% |
Transportation & Commute in Colton
Vehicle Availability by Sex in Colton
The most prevalent vehicle ownership categories in Colton are males with 3 vehicles (20, accounting for 46.5%) and females with 3 vehicles (22, making up 23.0%).
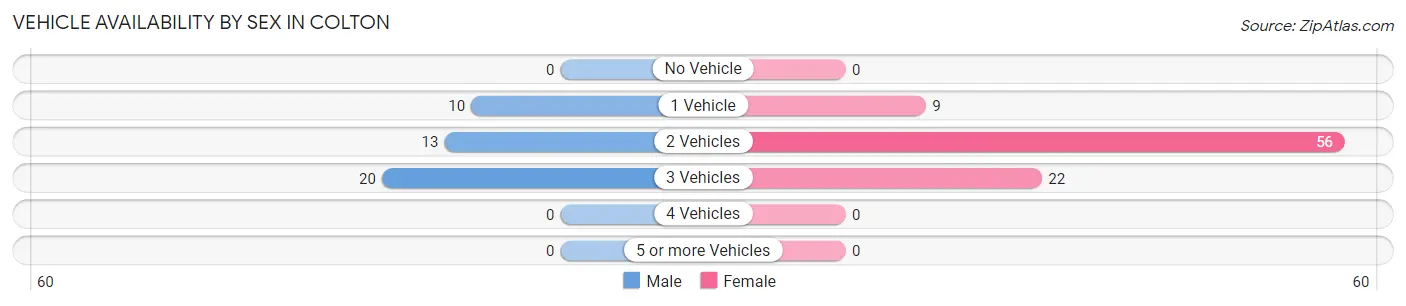
| Vehicles Available | Male | Female |
| No Vehicle | 0 (0.0%) | 0 (0.0%) |
| 1 Vehicle | 10 (23.3%) | 9 (10.3%) |
| 2 Vehicles | 13 (30.2%) | 56 (64.4%) |
| 3 Vehicles | 20 (46.5%) | 22 (25.3%) |
| 4 Vehicles | 0 (0.0%) | 0 (0.0%) |
| 5 or more Vehicles | 0 (0.0%) | 0 (0.0%) |
| Total | 43 (100.0%) | 87 (100.0%) |
Commute Time in Colton
The most frequently occuring commute durations in Colton are 25 to 29 minutes (51 commuters, 44.7%), 15 to 19 minutes (22 commuters, 19.3%), and 20 to 24 minutes (20 commuters, 17.5%).
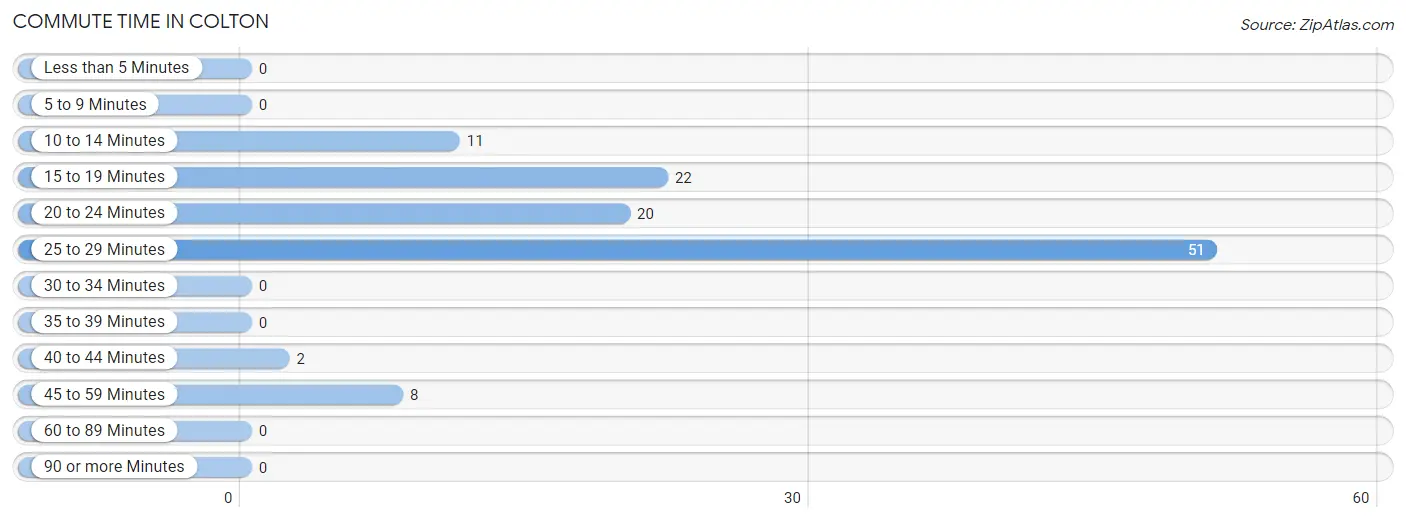
| Commute Time | # Commuters | % Commuters |
| Less than 5 Minutes | 0 | 0.0% |
| 5 to 9 Minutes | 0 | 0.0% |
| 10 to 14 Minutes | 11 | 9.7% |
| 15 to 19 Minutes | 22 | 19.3% |
| 20 to 24 Minutes | 20 | 17.5% |
| 25 to 29 Minutes | 51 | 44.7% |
| 30 to 34 Minutes | 0 | 0.0% |
| 35 to 39 Minutes | 0 | 0.0% |
| 40 to 44 Minutes | 2 | 1.8% |
| 45 to 59 Minutes | 8 | 7.0% |
| 60 to 89 Minutes | 0 | 0.0% |
| 90 or more Minutes | 0 | 0.0% |
Commute Time by Sex in Colton
The most common commute times in Colton are 15 to 19 minutes (13 commuters, 30.2%) for males and 25 to 29 minutes (42 commuters, 59.2%) for females.
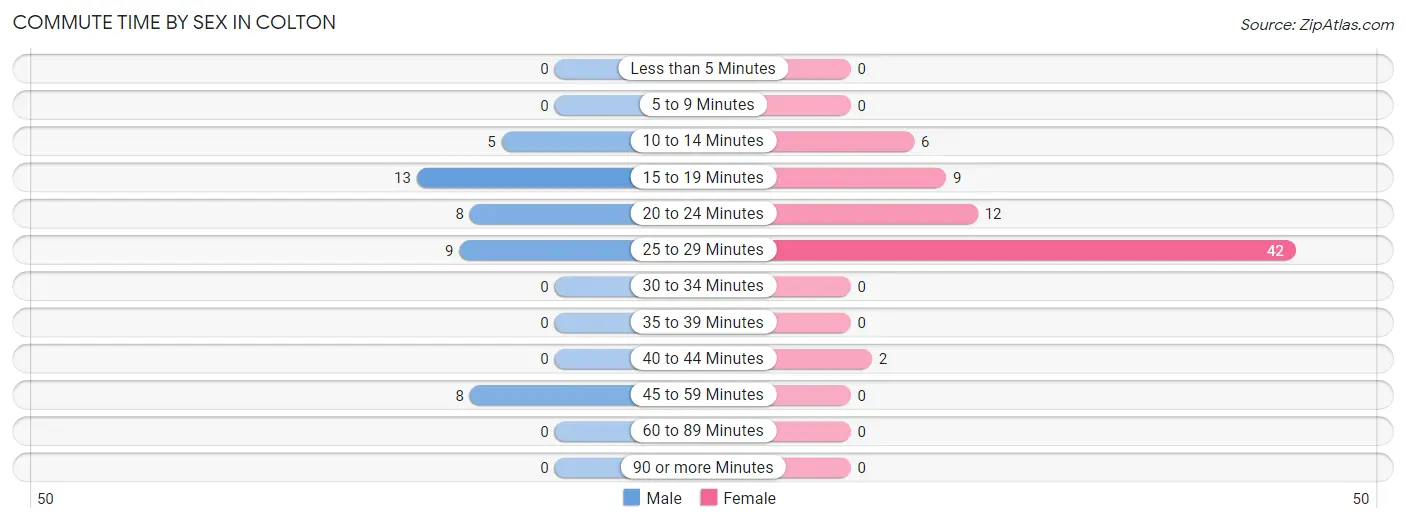
| Commute Time | Male | Female |
| Less than 5 Minutes | 0 (0.0%) | 0 (0.0%) |
| 5 to 9 Minutes | 0 (0.0%) | 0 (0.0%) |
| 10 to 14 Minutes | 5 (11.6%) | 6 (8.5%) |
| 15 to 19 Minutes | 13 (30.2%) | 9 (12.7%) |
| 20 to 24 Minutes | 8 (18.6%) | 12 (16.9%) |
| 25 to 29 Minutes | 9 (20.9%) | 42 (59.2%) |
| 30 to 34 Minutes | 0 (0.0%) | 0 (0.0%) |
| 35 to 39 Minutes | 0 (0.0%) | 0 (0.0%) |
| 40 to 44 Minutes | 0 (0.0%) | 2 (2.8%) |
| 45 to 59 Minutes | 8 (18.6%) | 0 (0.0%) |
| 60 to 89 Minutes | 0 (0.0%) | 0 (0.0%) |
| 90 or more Minutes | 0 (0.0%) | 0 (0.0%) |
Time of Departure to Work by Sex in Colton
The most frequent times of departure to work in Colton are 6:00 AM to 6:29 AM (17, 39.5%) for males and 7:00 AM to 7:29 AM (42, 59.2%) for females.
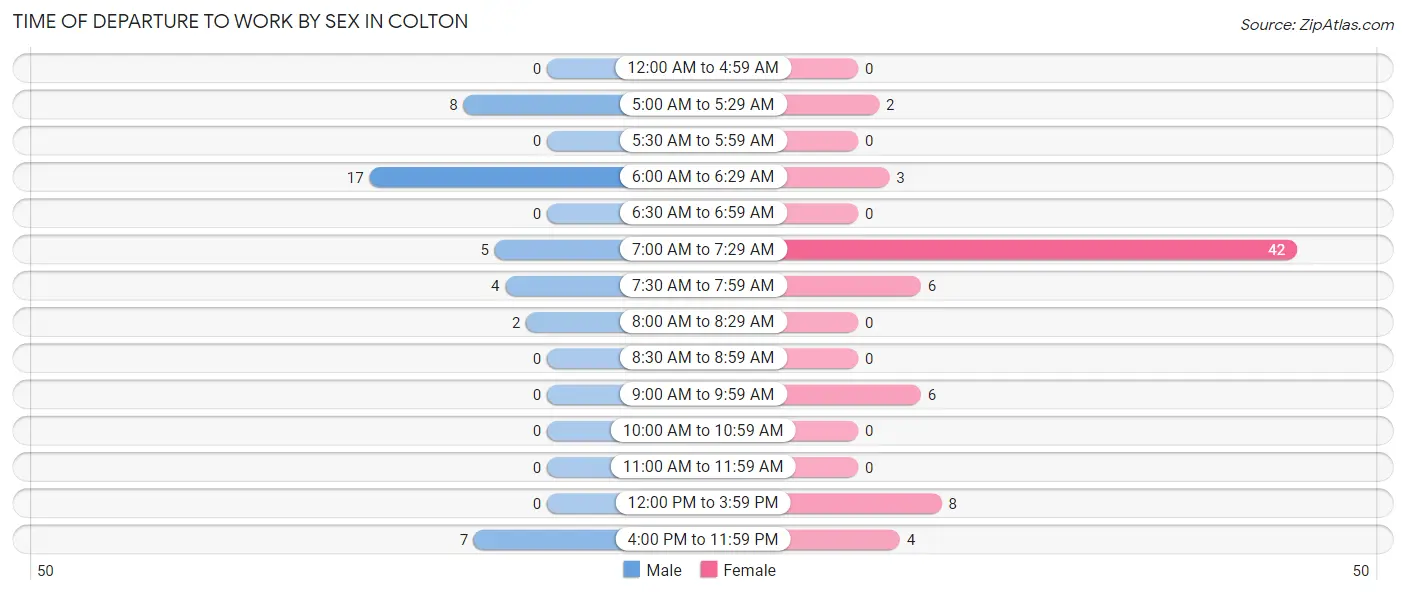
| Time of Departure | Male | Female |
| 12:00 AM to 4:59 AM | 0 (0.0%) | 0 (0.0%) |
| 5:00 AM to 5:29 AM | 8 (18.6%) | 2 (2.8%) |
| 5:30 AM to 5:59 AM | 0 (0.0%) | 0 (0.0%) |
| 6:00 AM to 6:29 AM | 17 (39.5%) | 3 (4.2%) |
| 6:30 AM to 6:59 AM | 0 (0.0%) | 0 (0.0%) |
| 7:00 AM to 7:29 AM | 5 (11.6%) | 42 (59.2%) |
| 7:30 AM to 7:59 AM | 4 (9.3%) | 6 (8.5%) |
| 8:00 AM to 8:29 AM | 2 (4.6%) | 0 (0.0%) |
| 8:30 AM to 8:59 AM | 0 (0.0%) | 0 (0.0%) |
| 9:00 AM to 9:59 AM | 0 (0.0%) | 6 (8.5%) |
| 10:00 AM to 10:59 AM | 0 (0.0%) | 0 (0.0%) |
| 11:00 AM to 11:59 AM | 0 (0.0%) | 0 (0.0%) |
| 12:00 PM to 3:59 PM | 0 (0.0%) | 8 (11.3%) |
| 4:00 PM to 11:59 PM | 7 (16.3%) | 4 (5.6%) |
| Total | 43 (100.0%) | 71 (100.0%) |
Housing Occupancy in Colton
Occupancy by Ownership in Colton
Of the total 127 dwellings in Colton, owner-occupied units account for 110 (86.6%), while renter-occupied units make up 17 (13.4%).
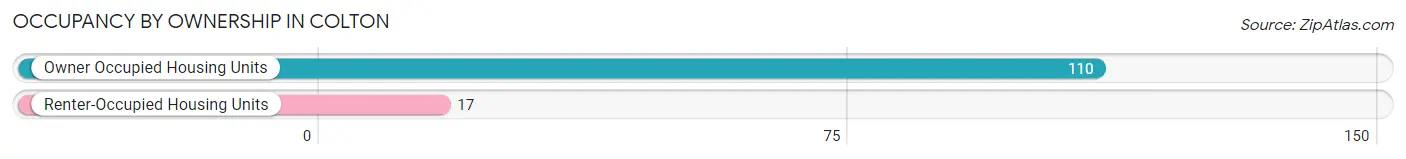
| Occupancy | # Housing Units | % Housing Units |
| Owner Occupied Housing Units | 110 | 86.6% |
| Renter-Occupied Housing Units | 17 | 13.4% |
| Total Occupied Housing Units | 127 | 100.0% |
Occupancy by Household Size in Colton
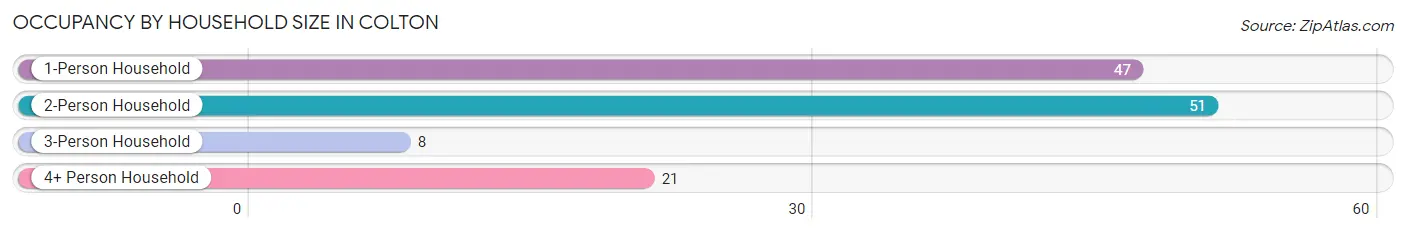
| Household Size | # Housing Units | % Housing Units |
| 1-Person Household | 47 | 37.0% |
| 2-Person Household | 51 | 40.2% |
| 3-Person Household | 8 | 6.3% |
| 4+ Person Household | 21 | 16.5% |
| Total Housing Units | 127 | 100.0% |
Occupancy by Ownership by Household Size in Colton
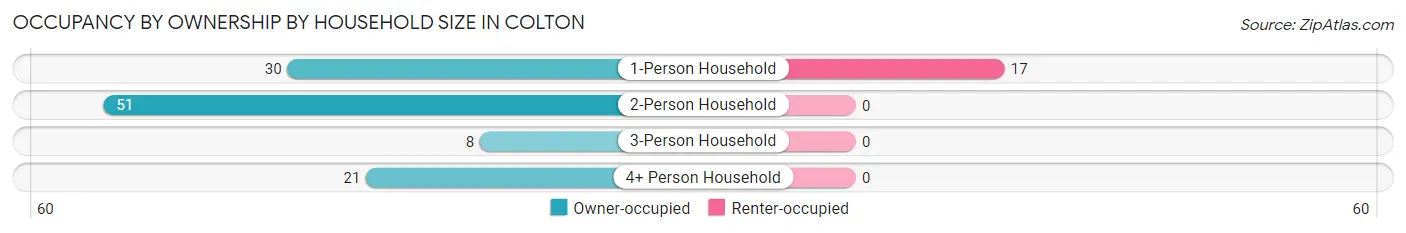
| Household Size | Owner-occupied | Renter-occupied |
| 1-Person Household | 30 (63.8%) | 17 (36.2%) |
| 2-Person Household | 51 (100.0%) | 0 (0.0%) |
| 3-Person Household | 8 (100.0%) | 0 (0.0%) |
| 4+ Person Household | 21 (100.0%) | 0 (0.0%) |
| Total Housing Units | 110 (86.6%) | 17 (13.4%) |
Occupancy by Educational Attainment in Colton
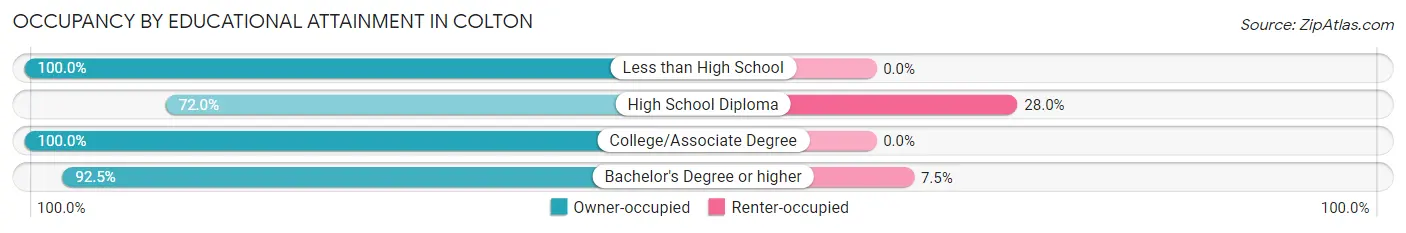
| Household Size | Owner-occupied | Renter-occupied |
| Less than High School | 11 (100.0%) | 0 (0.0%) |
| High School Diploma | 36 (72.0%) | 14 (28.0%) |
| College/Associate Degree | 26 (100.0%) | 0 (0.0%) |
| Bachelor's Degree or higher | 37 (92.5%) | 3 (7.5%) |
Occupancy by Age of Householder in Colton
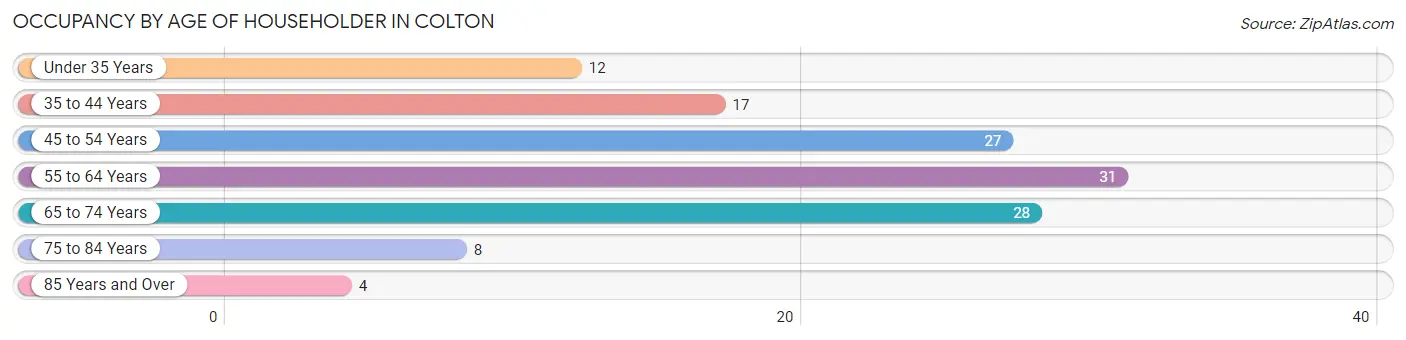
| Age Bracket | # Households | % Households |
| Under 35 Years | 12 | 9.5% |
| 35 to 44 Years | 17 | 13.4% |
| 45 to 54 Years | 27 | 21.3% |
| 55 to 64 Years | 31 | 24.4% |
| 65 to 74 Years | 28 | 22.1% |
| 75 to 84 Years | 8 | 6.3% |
| 85 Years and Over | 4 | 3.2% |
| Total | 127 | 100.0% |
Housing Finances in Colton
Median Income by Occupancy in Colton
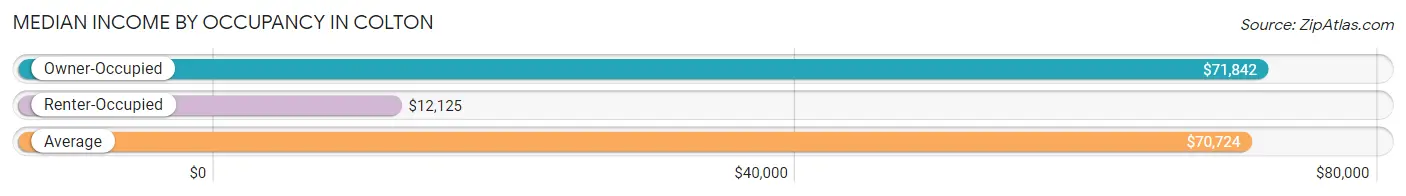
| Occupancy Type | # Households | Median Income |
| Owner-Occupied | 110 (86.6%) | $71,842 |
| Renter-Occupied | 17 (13.4%) | $12,125 |
| Average | 127 (100.0%) | $70,724 |
Occupancy by Householder Income Bracket in Colton
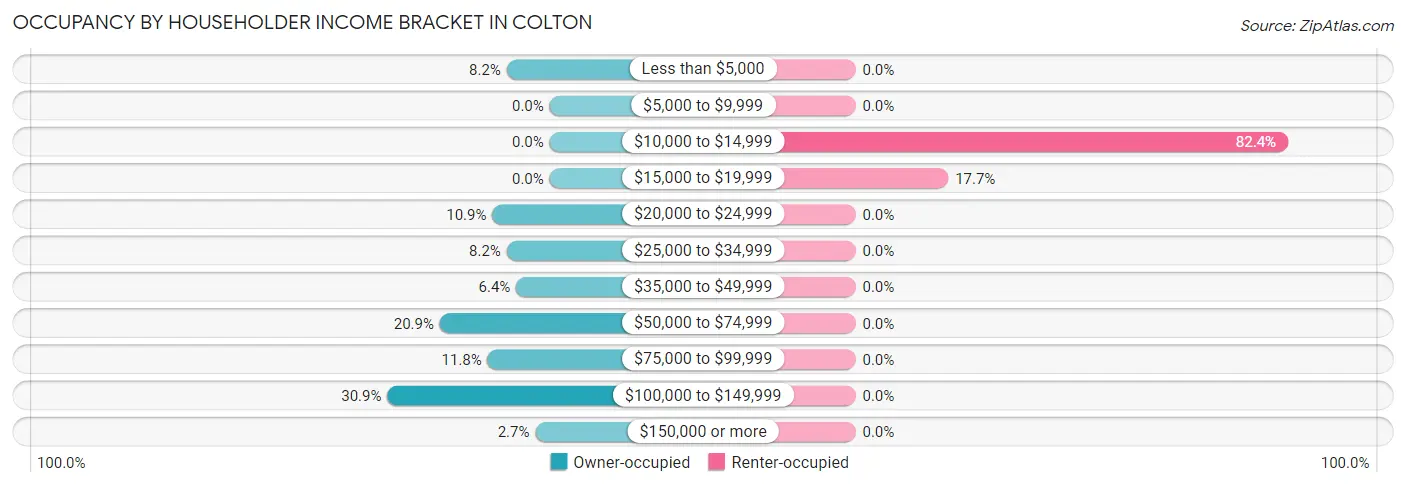
| Income Bracket | Owner-occupied | Renter-occupied |
| Less than $5,000 | 9 (8.2%) | 0 (0.0%) |
| $5,000 to $9,999 | 0 (0.0%) | 0 (0.0%) |
| $10,000 to $14,999 | 0 (0.0%) | 14 (82.4%) |
| $15,000 to $19,999 | 0 (0.0%) | 3 (17.6%) |
| $20,000 to $24,999 | 12 (10.9%) | 0 (0.0%) |
| $25,000 to $34,999 | 9 (8.2%) | 0 (0.0%) |
| $35,000 to $49,999 | 7 (6.4%) | 0 (0.0%) |
| $50,000 to $74,999 | 23 (20.9%) | 0 (0.0%) |
| $75,000 to $99,999 | 13 (11.8%) | 0 (0.0%) |
| $100,000 to $149,999 | 34 (30.9%) | 0 (0.0%) |
| $150,000 or more | 3 (2.7%) | 0 (0.0%) |
| Total | 110 (100.0%) | 17 (100.0%) |
Monthly Housing Cost Tiers in Colton
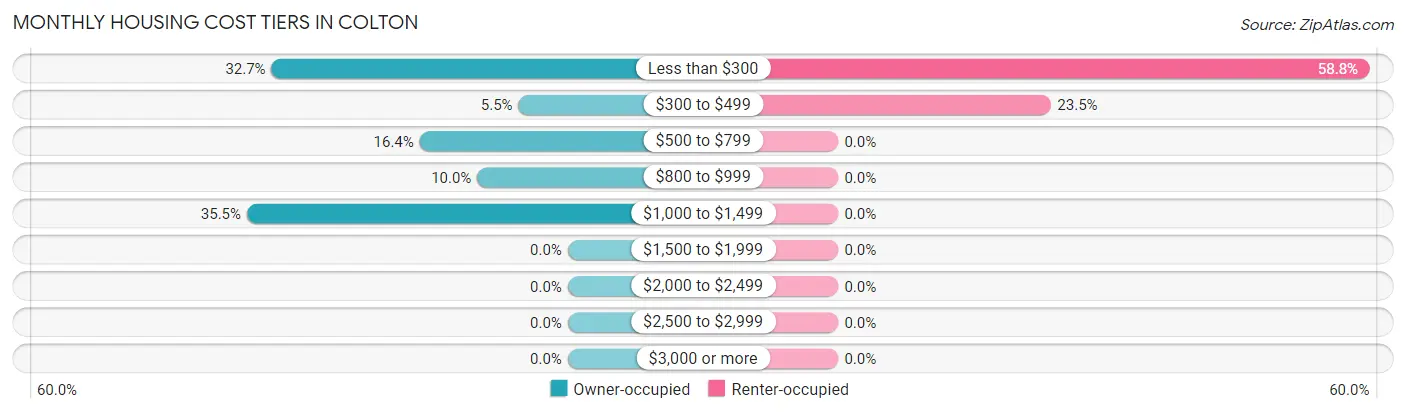
| Monthly Cost | Owner-occupied | Renter-occupied |
| Less than $300 | 36 (32.7%) | 10 (58.8%) |
| $300 to $499 | 6 (5.4%) | 4 (23.5%) |
| $500 to $799 | 18 (16.4%) | 0 (0.0%) |
| $800 to $999 | 11 (10.0%) | 0 (0.0%) |
| $1,000 to $1,499 | 39 (35.4%) | 0 (0.0%) |
| $1,500 to $1,999 | 0 (0.0%) | 0 (0.0%) |
| $2,000 to $2,499 | 0 (0.0%) | 0 (0.0%) |
| $2,500 to $2,999 | 0 (0.0%) | 0 (0.0%) |
| $3,000 or more | 0 (0.0%) | 0 (0.0%) |
| Total | 110 (100.0%) | 17 (100.0%) |
Physical Housing Characteristics in Colton
Housing Structures in Colton
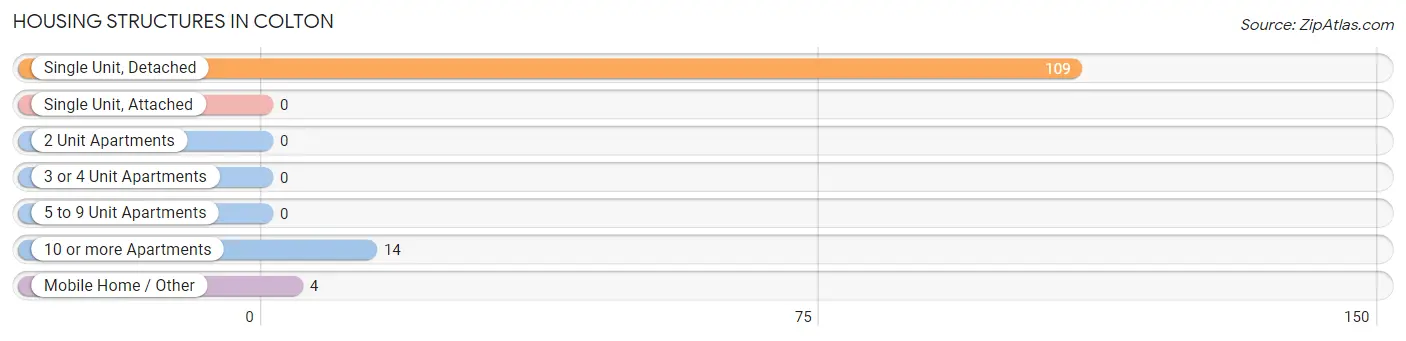
| Structure Type | # Housing Units | % Housing Units |
| Single Unit, Detached | 109 | 85.8% |
| Single Unit, Attached | 0 | 0.0% |
| 2 Unit Apartments | 0 | 0.0% |
| 3 or 4 Unit Apartments | 0 | 0.0% |
| 5 to 9 Unit Apartments | 0 | 0.0% |
| 10 or more Apartments | 14 | 11.0% |
| Mobile Home / Other | 4 | 3.2% |
| Total | 127 | 100.0% |
Housing Structures by Occupancy in Colton
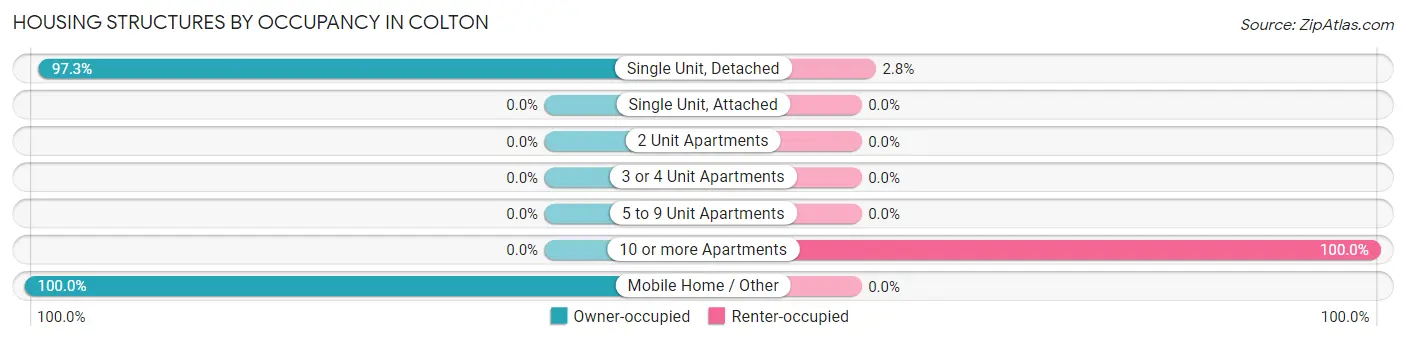
| Structure Type | Owner-occupied | Renter-occupied |
| Single Unit, Detached | 106 (97.3%) | 3 (2.8%) |
| Single Unit, Attached | 0 (0.0%) | 0 (0.0%) |
| 2 Unit Apartments | 0 (0.0%) | 0 (0.0%) |
| 3 or 4 Unit Apartments | 0 (0.0%) | 0 (0.0%) |
| 5 to 9 Unit Apartments | 0 (0.0%) | 0 (0.0%) |
| 10 or more Apartments | 0 (0.0%) | 14 (100.0%) |
| Mobile Home / Other | 4 (100.0%) | 0 (0.0%) |
| Total | 110 (86.6%) | 17 (13.4%) |
Housing Structures by Number of Rooms in Colton
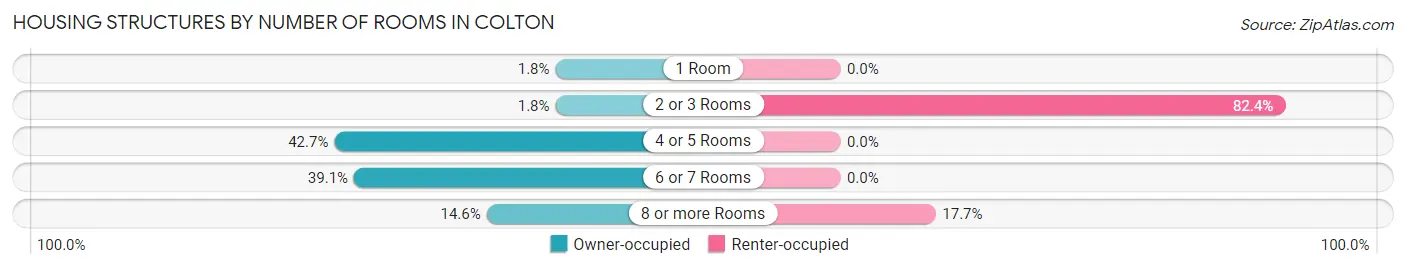
| Number of Rooms | Owner-occupied | Renter-occupied |
| 1 Room | 2 (1.8%) | 0 (0.0%) |
| 2 or 3 Rooms | 2 (1.8%) | 14 (82.4%) |
| 4 or 5 Rooms | 47 (42.7%) | 0 (0.0%) |
| 6 or 7 Rooms | 43 (39.1%) | 0 (0.0%) |
| 8 or more Rooms | 16 (14.5%) | 3 (17.6%) |
| Total | 110 (100.0%) | 17 (100.0%) |
Housing Structure by Heating Type in Colton
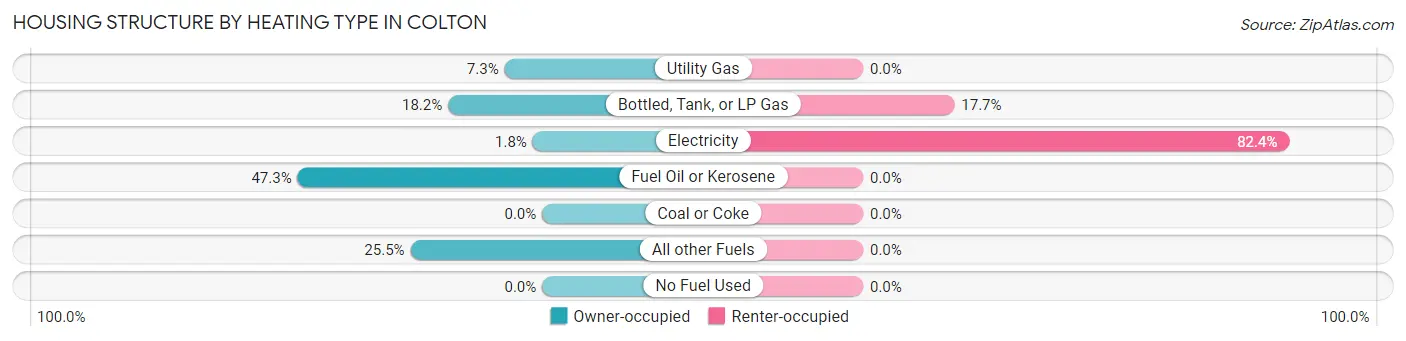
| Heating Type | Owner-occupied | Renter-occupied |
| Utility Gas | 8 (7.3%) | 0 (0.0%) |
| Bottled, Tank, or LP Gas | 20 (18.2%) | 3 (17.6%) |
| Electricity | 2 (1.8%) | 14 (82.4%) |
| Fuel Oil or Kerosene | 52 (47.3%) | 0 (0.0%) |
| Coal or Coke | 0 (0.0%) | 0 (0.0%) |
| All other Fuels | 28 (25.5%) | 0 (0.0%) |
| No Fuel Used | 0 (0.0%) | 0 (0.0%) |
| Total | 110 (100.0%) | 17 (100.0%) |
Household Vehicle Usage in Colton
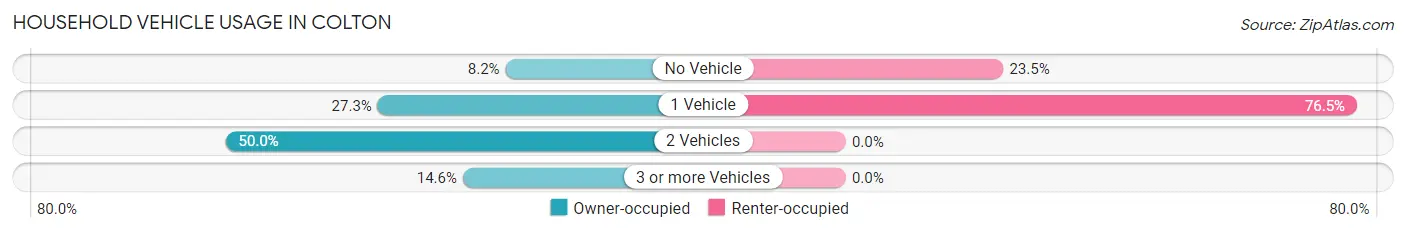
| Vehicles per Household | Owner-occupied | Renter-occupied |
| No Vehicle | 9 (8.2%) | 4 (23.5%) |
| 1 Vehicle | 30 (27.3%) | 13 (76.5%) |
| 2 Vehicles | 55 (50.0%) | 0 (0.0%) |
| 3 or more Vehicles | 16 (14.5%) | 0 (0.0%) |
| Total | 110 (100.0%) | 17 (100.0%) |
Real Estate & Mortgages in Colton
Real Estate and Mortgage Overview in Colton
| Characteristic | Without Mortgage | With Mortgage |
| Housing Units | 70 | 40 |
| Median Property Value | $88,200 | $117,300 |
| Median Household Income | - | - |
| Monthly Housing Costs | - | - |
| Real Estate Taxes | $1,183 | $0 |
Property Value by Mortgage Status in Colton
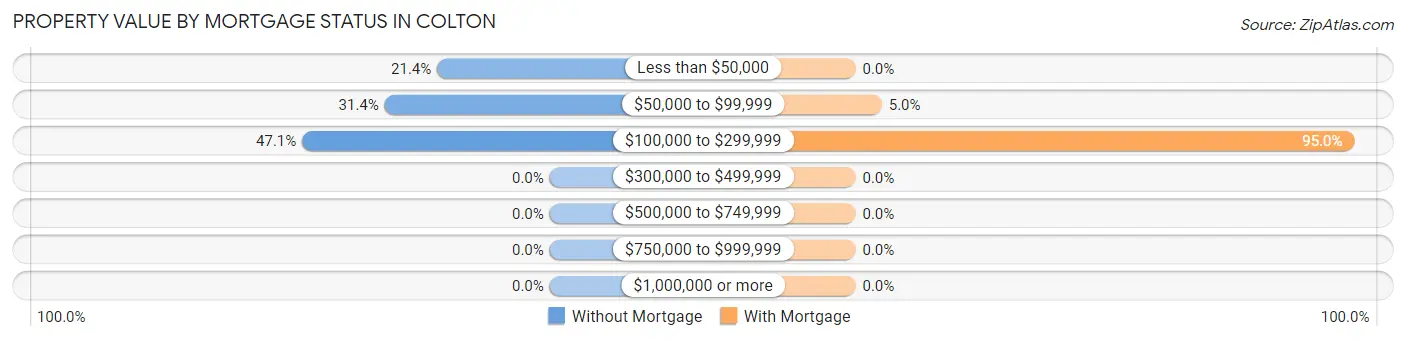
| Property Value | Without Mortgage | With Mortgage |
| Less than $50,000 | 15 (21.4%) | 0 (0.0%) |
| $50,000 to $99,999 | 22 (31.4%) | 2 (5.0%) |
| $100,000 to $299,999 | 33 (47.1%) | 38 (95.0%) |
| $300,000 to $499,999 | 0 (0.0%) | 0 (0.0%) |
| $500,000 to $749,999 | 0 (0.0%) | 0 (0.0%) |
| $750,000 to $999,999 | 0 (0.0%) | 0 (0.0%) |
| $1,000,000 or more | 0 (0.0%) | 0 (0.0%) |
| Total | 70 (100.0%) | 40 (100.0%) |
Household Income by Mortgage Status in Colton
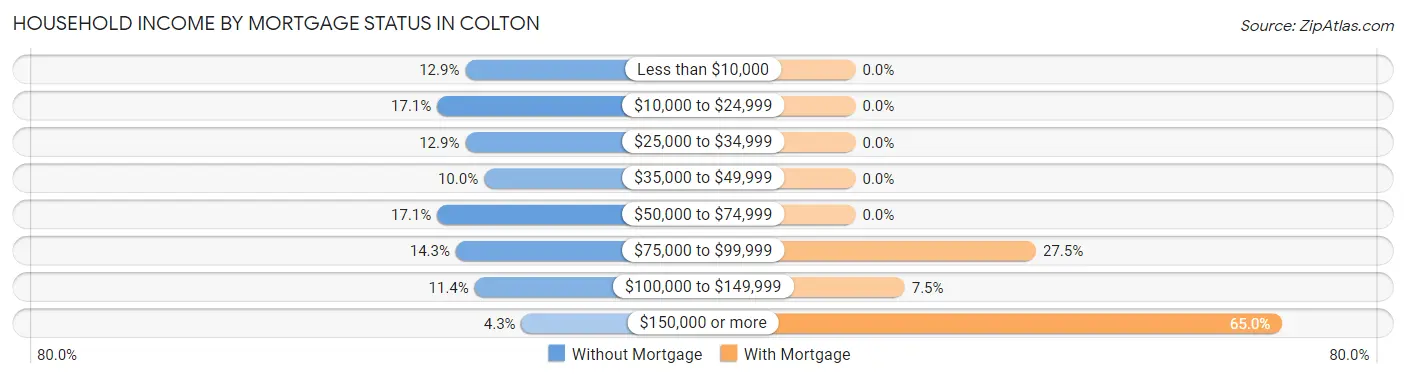
| Household Income | Without Mortgage | With Mortgage |
| Less than $10,000 | 9 (12.9%) | 0 (0.0%) |
| $10,000 to $24,999 | 12 (17.1%) | 0 (0.0%) |
| $25,000 to $34,999 | 9 (12.9%) | 0 (0.0%) |
| $35,000 to $49,999 | 7 (10.0%) | 0 (0.0%) |
| $50,000 to $74,999 | 12 (17.1%) | 0 (0.0%) |
| $75,000 to $99,999 | 10 (14.3%) | 11 (27.5%) |
| $100,000 to $149,999 | 8 (11.4%) | 3 (7.5%) |
| $150,000 or more | 3 (4.3%) | 26 (65.0%) |
| Total | 70 (100.0%) | 40 (100.0%) |
Property Value to Household Income Ratio in Colton
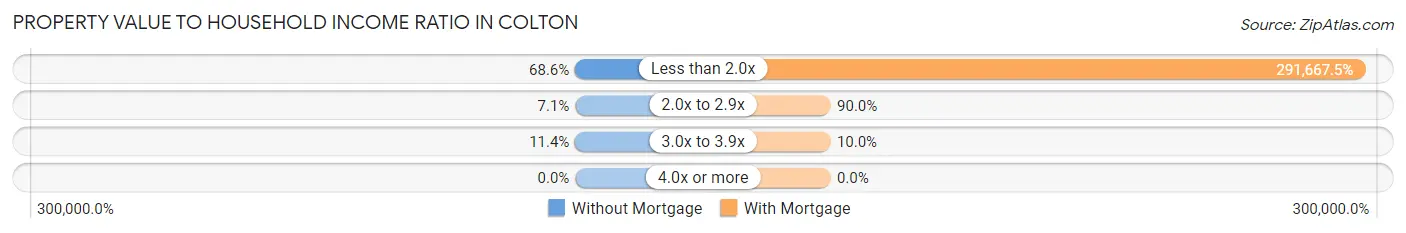
| Value-to-Income Ratio | Without Mortgage | With Mortgage |
| Less than 2.0x | 48 (68.6%) | 116,667 (291,667.5%) |
| 2.0x to 2.9x | 5 (7.1%) | 36 (90.0%) |
| 3.0x to 3.9x | 8 (11.4%) | 4 (10.0%) |
| 4.0x or more | 0 (0.0%) | 0 (0.0%) |
| Total | 70 (100.0%) | 40 (100.0%) |
Real Estate Taxes by Mortgage Status in Colton
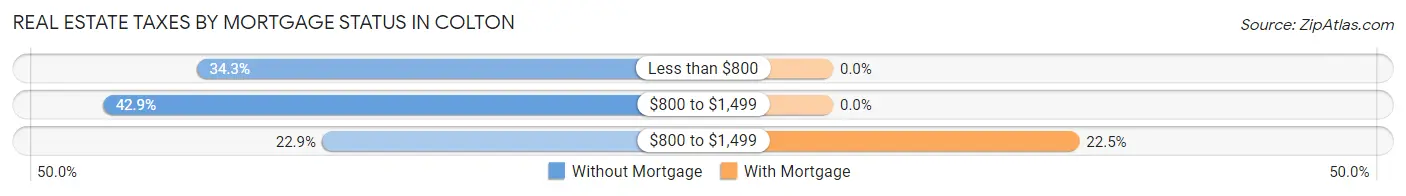
| Property Taxes | Without Mortgage | With Mortgage |
| Less than $800 | 24 (34.3%) | 0 (0.0%) |
| $800 to $1,499 | 30 (42.9%) | 0 (0.0%) |
| $800 to $1,499 | 16 (22.9%) | 9 (22.5%) |
| Total | 70 (100.0%) | 40 (100.0%) |
Health & Disability in Colton
Health Insurance Coverage by Age in Colton
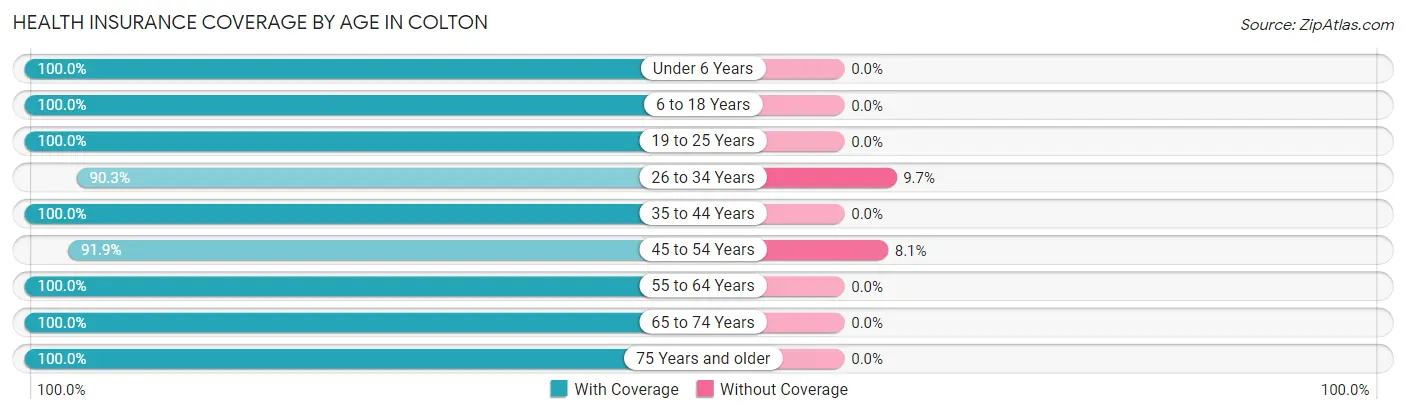
| Age Bracket | With Coverage | Without Coverage |
| Under 6 Years | 26 (100.0%) | 0 (0.0%) |
| 6 to 18 Years | 13 (100.0%) | 0 (0.0%) |
| 19 to 25 Years | 17 (100.0%) | 0 (0.0%) |
| 26 to 34 Years | 28 (90.3%) | 3 (9.7%) |
| 35 to 44 Years | 47 (100.0%) | 0 (0.0%) |
| 45 to 54 Years | 34 (91.9%) | 3 (8.1%) |
| 55 to 64 Years | 45 (100.0%) | 0 (0.0%) |
| 65 to 74 Years | 46 (100.0%) | 0 (0.0%) |
| 75 Years and older | 12 (100.0%) | 0 (0.0%) |
| Total | 268 (97.8%) | 6 (2.2%) |
Health Insurance Coverage by Citizenship Status in Colton
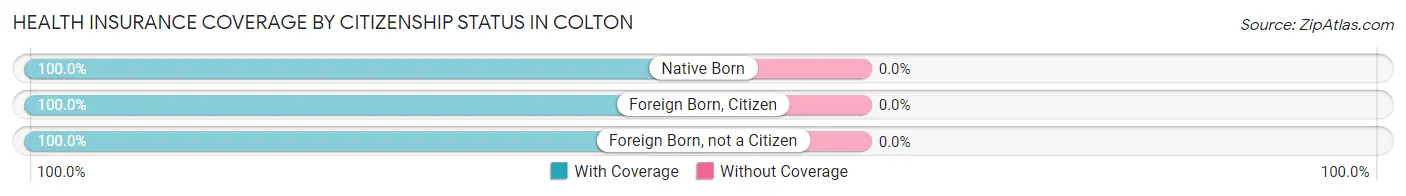
| Citizenship Status | With Coverage | Without Coverage |
| Native Born | 26 (100.0%) | 0 (0.0%) |
| Foreign Born, Citizen | 13 (100.0%) | 0 (0.0%) |
| Foreign Born, not a Citizen | 17 (100.0%) | 0 (0.0%) |
Health Insurance Coverage by Household Income in Colton
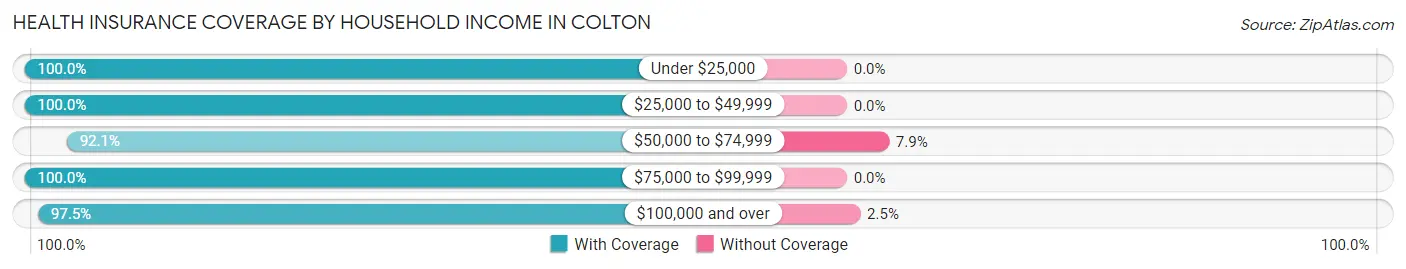
| Household Income | With Coverage | Without Coverage |
| Under $25,000 | 70 (100.0%) | 0 (0.0%) |
| $25,000 to $49,999 | 28 (100.0%) | 0 (0.0%) |
| $50,000 to $74,999 | 35 (92.1%) | 3 (7.9%) |
| $75,000 to $99,999 | 17 (100.0%) | 0 (0.0%) |
| $100,000 and over | 117 (97.5%) | 3 (2.5%) |
Public vs Private Health Insurance Coverage by Age in Colton
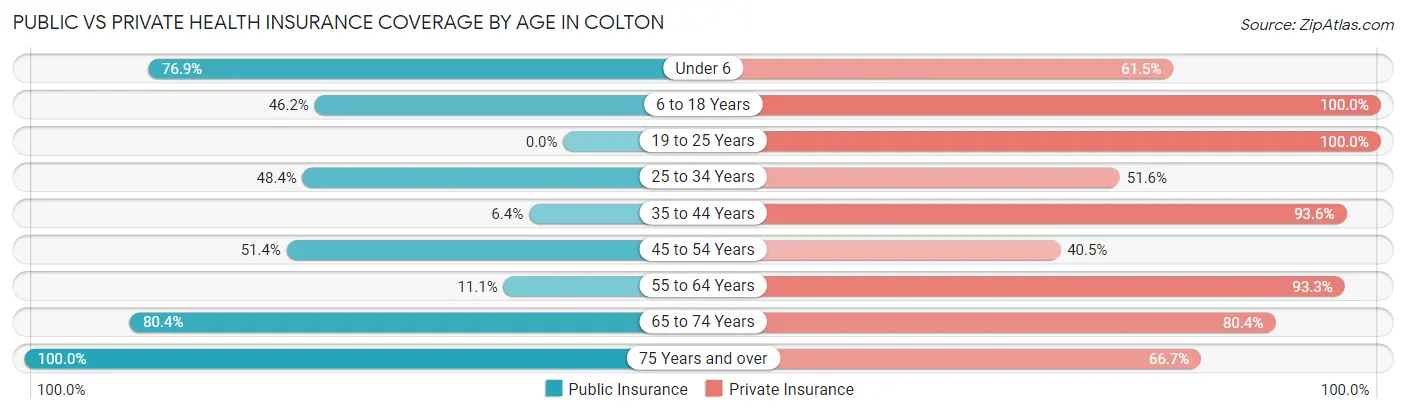
| Age Bracket | Public Insurance | Private Insurance |
| Under 6 | 20 (76.9%) | 16 (61.5%) |
| 6 to 18 Years | 6 (46.2%) | 13 (100.0%) |
| 19 to 25 Years | 0 (0.0%) | 17 (100.0%) |
| 25 to 34 Years | 15 (48.4%) | 16 (51.6%) |
| 35 to 44 Years | 3 (6.4%) | 44 (93.6%) |
| 45 to 54 Years | 19 (51.3%) | 15 (40.5%) |
| 55 to 64 Years | 5 (11.1%) | 42 (93.3%) |
| 65 to 74 Years | 37 (80.4%) | 37 (80.4%) |
| 75 Years and over | 12 (100.0%) | 8 (66.7%) |
| Total | 117 (42.7%) | 208 (75.9%) |
Disability Status by Sex by Age in Colton
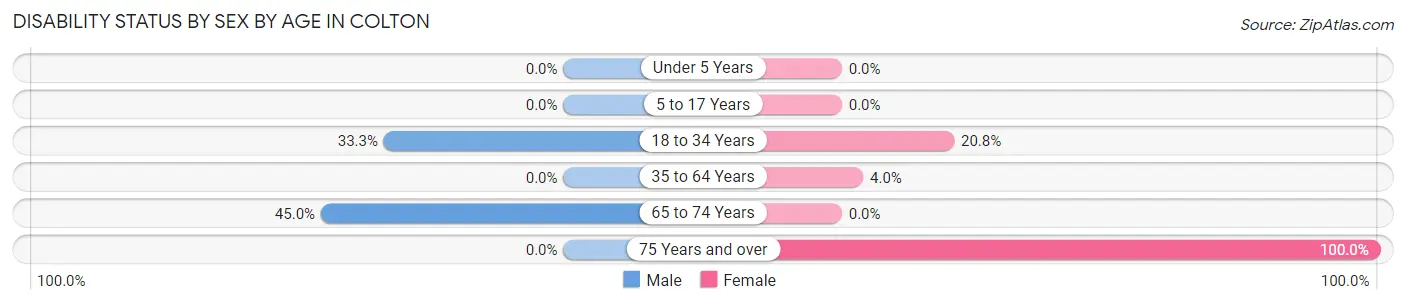
| Age Bracket | Male | Female |
| Under 5 Years | 0 (0.0%) | 0 (0.0%) |
| 5 to 17 Years | 0 (0.0%) | 0 (0.0%) |
| 18 to 34 Years | 8 (33.3%) | 5 (20.8%) |
| 35 to 64 Years | 0 (0.0%) | 3 (4.0%) |
| 65 to 74 Years | 9 (45.0%) | 0 (0.0%) |
| 75 Years and over | 0 (0.0%) | 4 (100.0%) |
Disability Class by Sex by Age in Colton
Disability Class: Hearing Difficulty
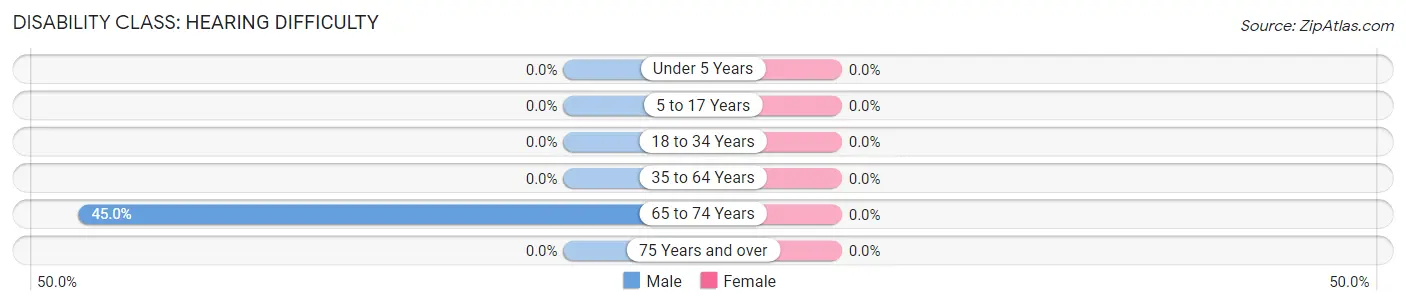
| Age Bracket | Male | Female |
| Under 5 Years | 0 (0.0%) | 0 (0.0%) |
| 5 to 17 Years | 0 (0.0%) | 0 (0.0%) |
| 18 to 34 Years | 0 (0.0%) | 0 (0.0%) |
| 35 to 64 Years | 0 (0.0%) | 0 (0.0%) |
| 65 to 74 Years | 9 (45.0%) | 0 (0.0%) |
| 75 Years and over | 0 (0.0%) | 0 (0.0%) |
Disability Class: Vision Difficulty
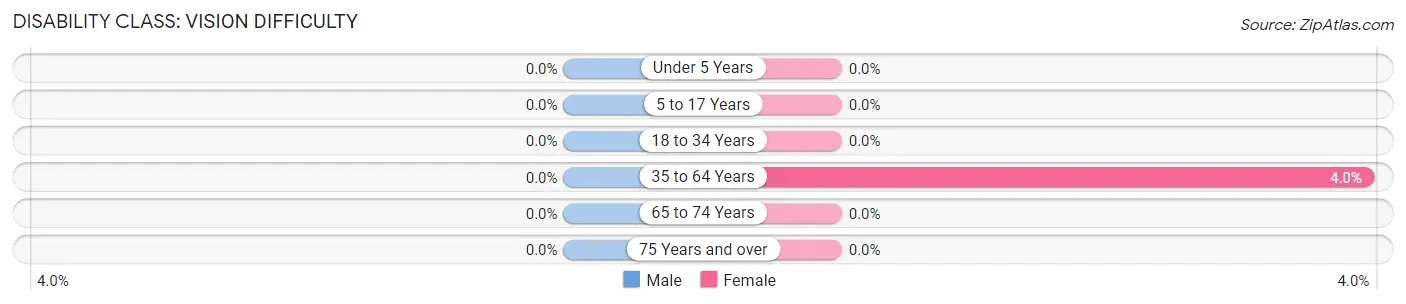
| Age Bracket | Male | Female |
| Under 5 Years | 0 (0.0%) | 0 (0.0%) |
| 5 to 17 Years | 0 (0.0%) | 0 (0.0%) |
| 18 to 34 Years | 0 (0.0%) | 0 (0.0%) |
| 35 to 64 Years | 0 (0.0%) | 3 (4.0%) |
| 65 to 74 Years | 0 (0.0%) | 0 (0.0%) |
| 75 Years and over | 0 (0.0%) | 0 (0.0%) |
Disability Class: Cognitive Difficulty
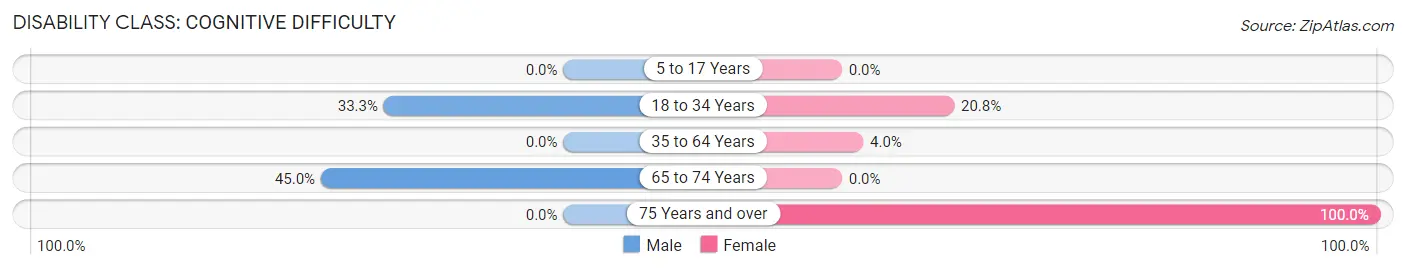
| Age Bracket | Male | Female |
| 5 to 17 Years | 0 (0.0%) | 0 (0.0%) |
| 18 to 34 Years | 8 (33.3%) | 5 (20.8%) |
| 35 to 64 Years | 0 (0.0%) | 3 (4.0%) |
| 65 to 74 Years | 9 (45.0%) | 0 (0.0%) |
| 75 Years and over | 0 (0.0%) | 4 (100.0%) |
Disability Class: Ambulatory Difficulty
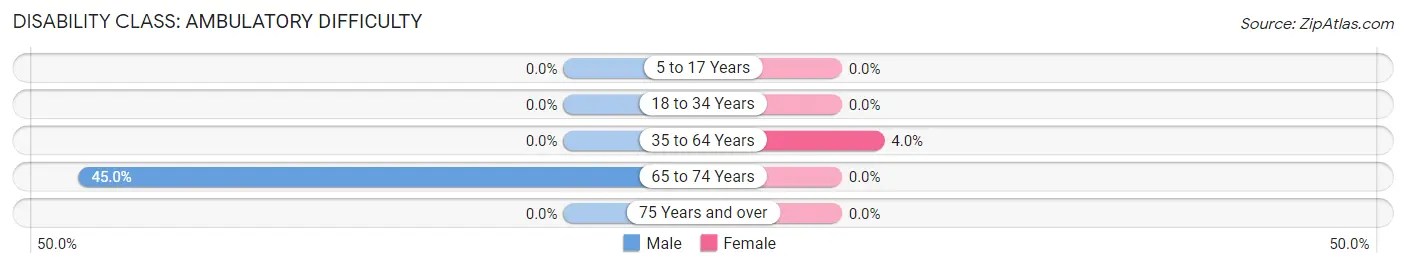
| Age Bracket | Male | Female |
| 5 to 17 Years | 0 (0.0%) | 0 (0.0%) |
| 18 to 34 Years | 0 (0.0%) | 0 (0.0%) |
| 35 to 64 Years | 0 (0.0%) | 3 (4.0%) |
| 65 to 74 Years | 9 (45.0%) | 0 (0.0%) |
| 75 Years and over | 0 (0.0%) | 0 (0.0%) |
Disability Class: Self-Care Difficulty
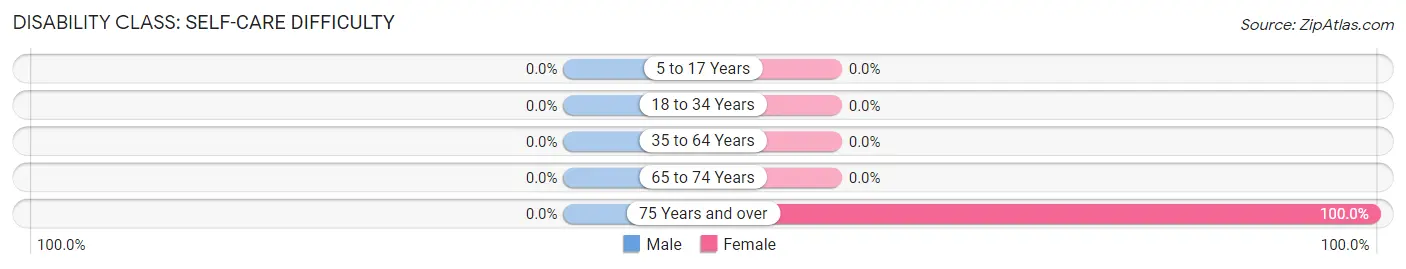
| Age Bracket | Male | Female |
| 5 to 17 Years | 0 (0.0%) | 0 (0.0%) |
| 18 to 34 Years | 0 (0.0%) | 0 (0.0%) |
| 35 to 64 Years | 0 (0.0%) | 0 (0.0%) |
| 65 to 74 Years | 0 (0.0%) | 0 (0.0%) |
| 75 Years and over | 0 (0.0%) | 4 (100.0%) |
Technology Access in Colton
Computing Device Access in Colton
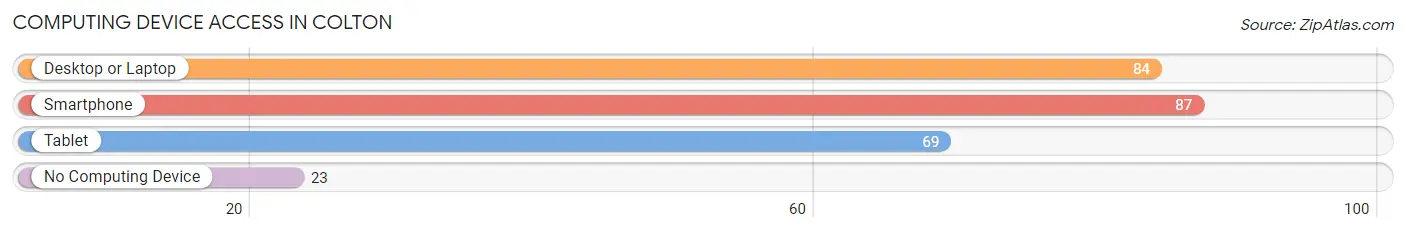
| Device Type | # Households | % Households |
| Desktop or Laptop | 84 | 66.1% |
| Smartphone | 87 | 68.5% |
| Tablet | 69 | 54.3% |
| No Computing Device | 23 | 18.1% |
| Total | 127 | 100.0% |
Internet Access in Colton
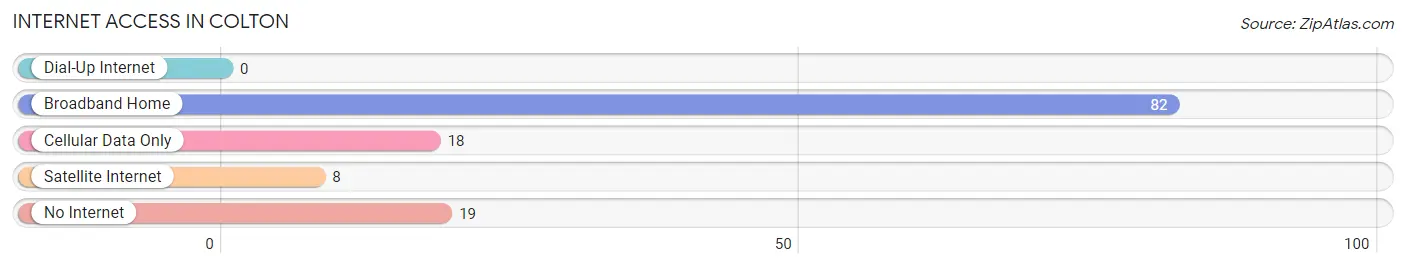
| Internet Type | # Households | % Households |
| Dial-Up Internet | 0 | 0.0% |
| Broadband Home | 82 | 64.6% |
| Cellular Data Only | 18 | 14.2% |
| Satellite Internet | 8 | 6.3% |
| No Internet | 19 | 15.0% |
| Total | 127 | 100.0% |
Colton Summary
Colton, New York is a small town located in St. Lawrence County in the northern part of the state. It is situated on the banks of the Raquette River, and is surrounded by the Adirondack Mountains. The town was first settled in 1802, and was incorporated in 1845. The population of Colton in 2000 was 1,845.
Geography
Colton is located in the northern part of St. Lawrence County, in the Adirondack Mountains. It is situated on the banks of the Raquette River, and is bordered by the towns of Hopkinton, Piercefield, and Fine. The town has a total area of 36.2 square miles, of which 35.9 square miles is land and 0.3 square miles is water. The highest point in the town is an unnamed peak in the Adirondack Mountains, which has an elevation of 2,890 feet.
Economy
The economy of Colton is largely based on tourism and forestry. The town is home to several tourist attractions, including the Colton Historical Society Museum, the Colton Arts Center, and the Colton Public Library. The town is also home to several logging and lumber companies, which provide employment for many of the town's residents.
Demographics
In 2000, the population of Colton was 1,845. The racial makeup of the town was 97.2% White, 0.3% African American, 0.3% Native American, 0.2% Asian, 0.1% Pacific Islander, 0.7% from other races, and 1.2% from two or more races. Hispanic or Latino of any race were 1.2% of the population.
The median income for a household in the town was $35,938, and the median income for a family was $41,250. Males had a median income of $30,000 versus $21,250 for females. The per capita income for the town was $17,845. About 8.2% of families and 10.2% of the population were below the poverty line, including 13.2% of those under age 18 and 8.3% of those age 65 or over.
Conclusion
Colton, New York is a small town located in St. Lawrence County in the northern part of the state. It is situated on the banks of the Raquette River, and is surrounded by the Adirondack Mountains. The town was first settled in 1802, and was incorporated in 1845. The population of Colton in 2000 was 1,845. The economy of Colton is largely based on tourism and forestry, and the town is home to several tourist attractions and logging and lumber companies. The racial makeup of the town was 97.2% White, 0.3% African American, 0.3% Native American, 0.2% Asian, 0.1% Pacific Islander, 0.7% from other races, and 1.2% from two or more races. The median income for a household in the town was $35,938, and the median income for a family was $41,250. About 8.2% of families and 10.2% of the population were below the poverty line.
Common Questions
What is the Total Population of Colton?
Total Population of Colton is 274.
What is the Total Male Population of Colton?
Total Male Population of Colton is 132.
What is the Total Female Population of Colton?
Total Female Population of Colton is 142.
What is the Ratio of Males per 100 Females in Colton?
There are 92.96 Males per 100 Females in Colton.
What is the Ratio of Females per 100 Males in Colton?
There are 107.58 Females per 100 Males in Colton.
What is the Median Population Age in Colton?
Median Population Age in Colton is 48.0 Years.
What is the Average Family Size in Colton
Average Family Size in Colton is 2.8 People.
What is the Average Household Size in Colton
Average Household Size in Colton is 2.1 People.
What is Per Capita Income in Colton?
Per Capita income in Colton is $35,922.
What is the Median Family Income in Colton?
Median Family Income in Colton is $71,875.
What is the Median Household income in Colton?
Median Household Income in Colton is $70,724.
What is Income or Wage Gap in Colton?
Income or Wage Gap in Colton is 27.3%.
Women in Colton earn 72.7 cents for every dollar earned by a man.
What is Inequality or Gini Index in Colton?
Inequality or Gini Index in Colton is 0.45.
How Large is the Labor Force in Colton?
There are 134 People in the Labor Forcein in Colton.
What is the Percentage of People in the Labor Force in Colton?
54.7% of People are in the Labor Force in Colton.