Caledonia, NY
Caledonia Map
Caledonia Overview
2,385
TOTAL POPULATION
1,271
MALE POPULATION
1,114
FEMALE POPULATION
114.09
MALES / 100 FEMALES
87.65
FEMALES / 100 MALES
38.0
MEDIAN AGE
3.1
AVG FAMILY SIZE
2.4
AVG HOUSEHOLD SIZE
$40,517
PER CAPITA INCOME
$112,303
AVG FAMILY INCOME
$85,208
AVG HOUSEHOLD INCOME
31.0%
WAGE / INCOME GAP [ % ]
69.0¢/ $1
WAGE / INCOME GAP [ $ ]
0.36
INEQUALITY / GINI INDEX
1,407
LABOR FORCE [ PEOPLE ]
70.4%
PERCENT IN LABOR FORCE
2.7%
UNEMPLOYMENT RATE
Caledonia Zip Codes
Caledonia Area Codes
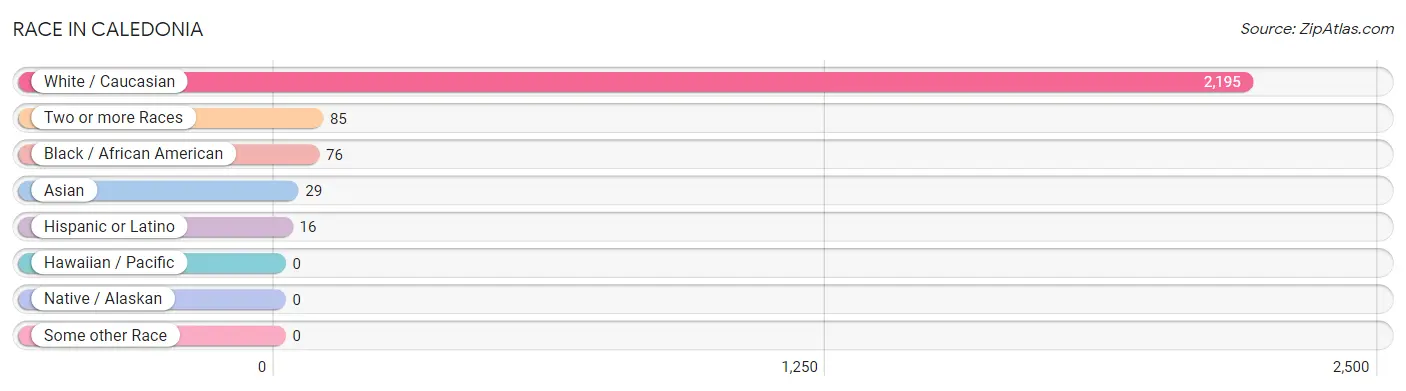
Race in Caledonia
The most populous races in Caledonia are White / Caucasian (2,195 | 92.0%), Two or more Races (85 | 3.6%), and Black / African American (76 | 3.2%).
| Race | # Population | % Population |
| Asian | 29 | 1.2% |
| Black / African American | 76 | 3.2% |
| Hawaiian / Pacific | 0 | 0.0% |
| Hispanic or Latino | 16 | 0.7% |
| Native / Alaskan | 0 | 0.0% |
| White / Caucasian | 2,195 | 92.0% |
| Two or more Races | 85 | 3.6% |
| Some other Race | 0 | 0.0% |
| Total | 2,385 | 100.0% |
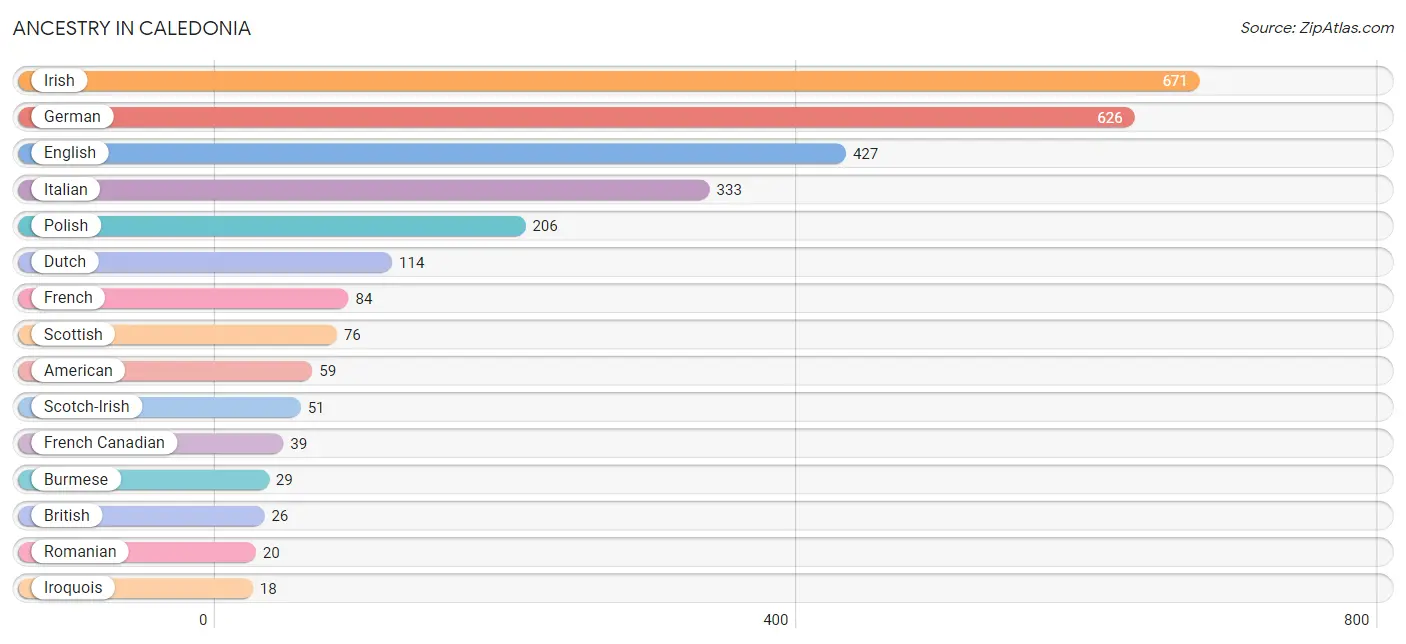
Ancestry in Caledonia
The most populous ancestries reported in Caledonia are Irish (671 | 28.1%), German (626 | 26.3%), English (427 | 17.9%), Italian (333 | 14.0%), and Polish (206 | 8.6%), together accounting for 94.9% of all Caledonia residents.
| Ancestry | # Population | % Population |
| Alsatian | 6 | 0.3% |
| American | 59 | 2.5% |
| Armenian | 10 | 0.4% |
| British | 26 | 1.1% |
| Bulgarian | 2 | 0.1% |
| Burmese | 29 | 1.2% |
| Canadian | 6 | 0.3% |
| Czech | 16 | 0.7% |
| Czechoslovakian | 4 | 0.2% |
| Danish | 6 | 0.3% |
| Dutch | 114 | 4.8% |
| Eastern European | 17 | 0.7% |
| English | 427 | 17.9% |
| European | 10 | 0.4% |
| French | 84 | 3.5% |
| French Canadian | 39 | 1.6% |
| German | 626 | 26.3% |
| Indian (Asian) | 8 | 0.3% |
| Irish | 671 | 28.1% |
| Iroquois | 18 | 0.7% |
| Italian | 333 | 14.0% |
| Lithuanian | 8 | 0.3% |
| Macedonian | 15 | 0.6% |
| Nigerian | 6 | 0.3% |
| Northern European | 16 | 0.7% |
| Norwegian | 13 | 0.5% |
| Polish | 206 | 8.6% |
| Portuguese | 8 | 0.3% |
| Puerto Rican | 10 | 0.4% |
| Romanian | 20 | 0.8% |
| Scotch-Irish | 51 | 2.1% |
| Scottish | 76 | 3.2% |
| Slovene | 7 | 0.3% |
| Spanish | 6 | 0.3% |
| Subsaharan African | 6 | 0.3% |
| Swedish | 11 | 0.5% |
| Thai | 6 | 0.3% | View All 37 Rows |
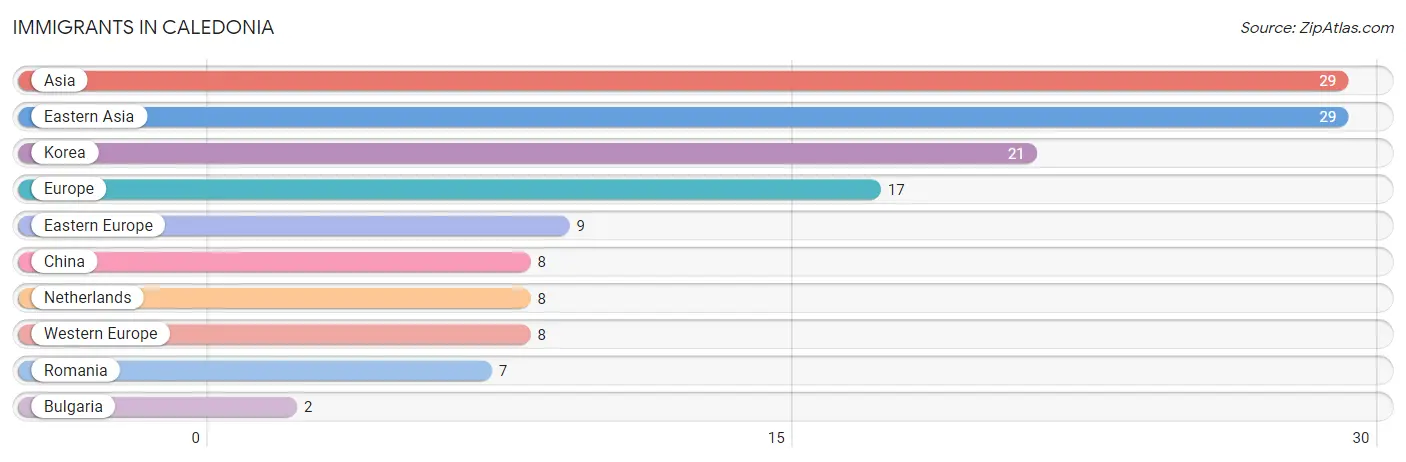
Immigrants in Caledonia
The most numerous immigrant groups reported in Caledonia came from Asia (29 | 1.2%), Eastern Asia (29 | 1.2%), Korea (21 | 0.9%), Europe (17 | 0.7%), and Eastern Europe (9 | 0.4%), together accounting for 4.4% of all Caledonia residents.
| Immigration Origin | # Population | % Population |
| Asia | 29 | 1.2% |
| Bulgaria | 2 | 0.1% |
| China | 8 | 0.3% |
| Eastern Asia | 29 | 1.2% |
| Eastern Europe | 9 | 0.4% |
| Europe | 17 | 0.7% |
| Korea | 21 | 0.9% |
| Netherlands | 8 | 0.3% |
| Romania | 7 | 0.3% |
| Western Europe | 8 | 0.3% | View All 10 Rows |
Sex and Age in Caledonia
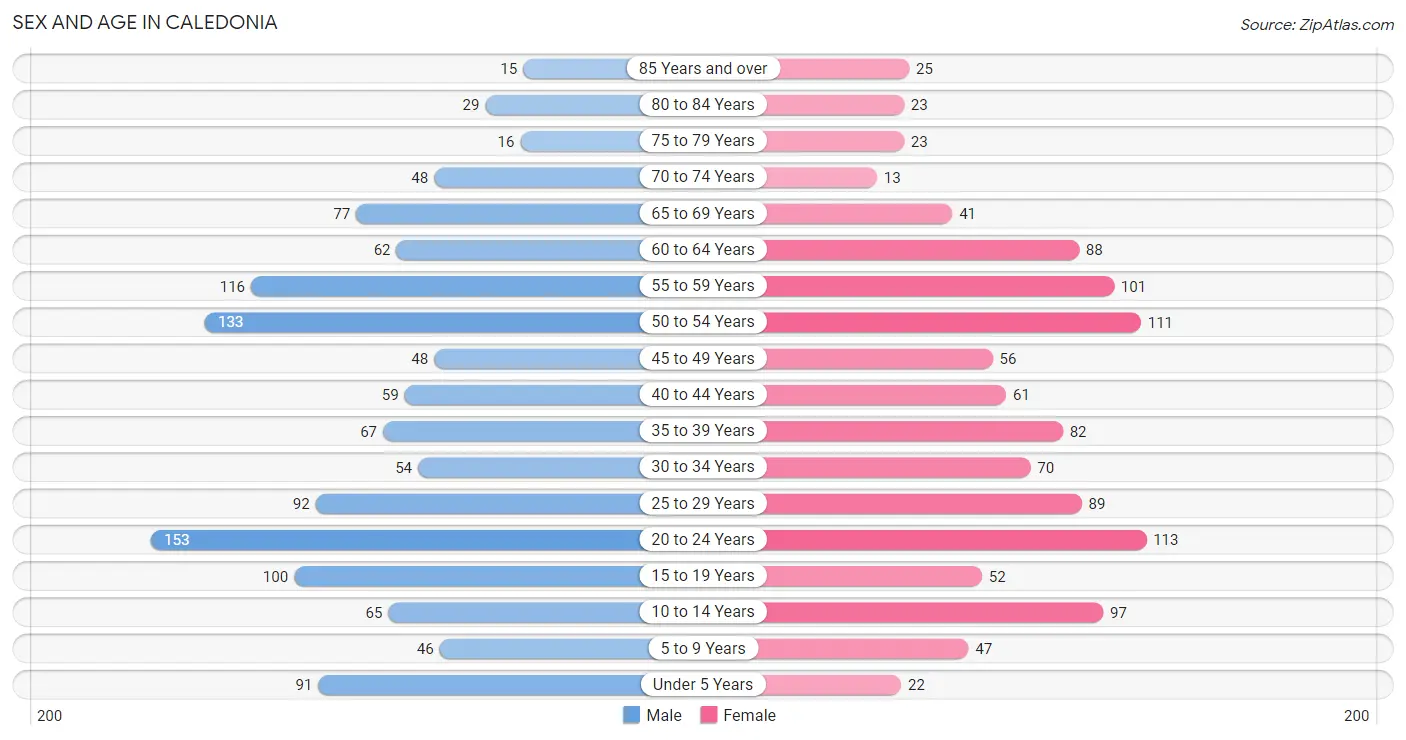
Sex and Age in Caledonia
The most populous age groups in Caledonia are 20 to 24 Years (153 | 12.0%) for men and 20 to 24 Years (113 | 10.1%) for women.
| Age Bracket | Male | Female |
| Under 5 Years | 91 (7.2%) | 22 (2.0%) |
| 5 to 9 Years | 46 (3.6%) | 47 (4.2%) |
| 10 to 14 Years | 65 (5.1%) | 97 (8.7%) |
| 15 to 19 Years | 100 (7.9%) | 52 (4.7%) |
| 20 to 24 Years | 153 (12.0%) | 113 (10.1%) |
| 25 to 29 Years | 92 (7.2%) | 89 (8.0%) |
| 30 to 34 Years | 54 (4.3%) | 70 (6.3%) |
| 35 to 39 Years | 67 (5.3%) | 82 (7.4%) |
| 40 to 44 Years | 59 (4.6%) | 61 (5.5%) |
| 45 to 49 Years | 48 (3.8%) | 56 (5.0%) |
| 50 to 54 Years | 133 (10.5%) | 111 (10.0%) |
| 55 to 59 Years | 116 (9.1%) | 101 (9.1%) |
| 60 to 64 Years | 62 (4.9%) | 88 (7.9%) |
| 65 to 69 Years | 77 (6.1%) | 41 (3.7%) |
| 70 to 74 Years | 48 (3.8%) | 13 (1.2%) |
| 75 to 79 Years | 16 (1.3%) | 23 (2.1%) |
| 80 to 84 Years | 29 (2.3%) | 23 (2.1%) |
| 85 Years and over | 15 (1.2%) | 25 (2.2%) |
| Total | 1,271 (100.0%) | 1,114 (100.0%) |
Families and Households in Caledonia
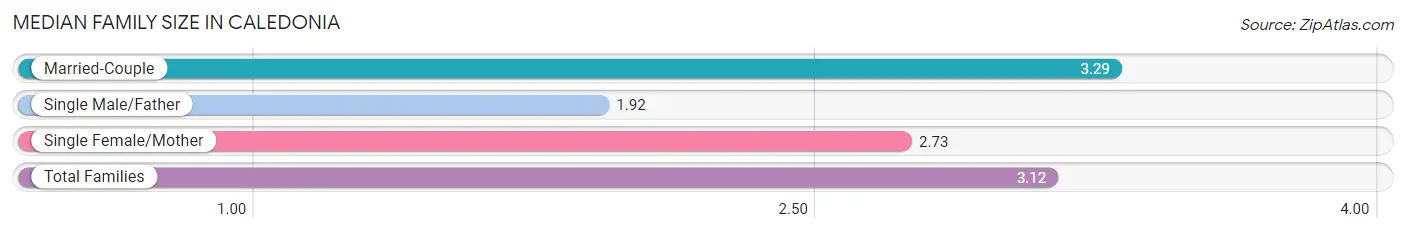
Median Family Size in Caledonia
The median family size in Caledonia is 3.12 persons per family, with married-couple families (483 | 79.3%) accounting for the largest median family size of 3.29 persons per family. On the other hand, single male/father families (38 | 6.2%) represent the smallest median family size with 1.92 persons per family.
| Family Type | # Families | Family Size |
| Married-Couple | 483 (79.3%) | 3.29 |
| Single Male/Father | 38 (6.2%) | 1.92 |
| Single Female/Mother | 88 (14.4%) | 2.73 |
| Total Families | 609 (100.0%) | 3.12 |
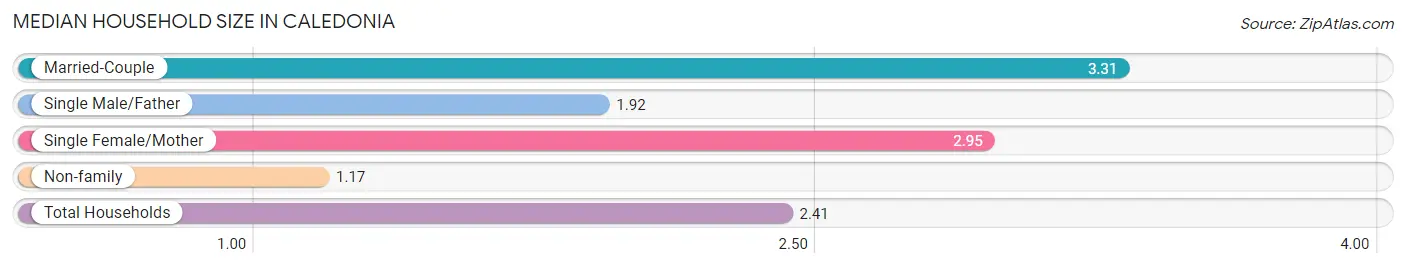
Median Household Size in Caledonia
The median household size in Caledonia is 2.41 persons per household, with married-couple households (483 | 49.0%) accounting for the largest median household size of 3.31 persons per household. non-family households (376 | 38.2%) represent the smallest median household size with 1.17 persons per household.
| Household Type | # Households | Household Size |
| Married-Couple | 483 (49.0%) | 3.31 |
| Single Male/Father | 38 (3.9%) | 1.92 |
| Single Female/Mother | 88 (8.9%) | 2.95 |
| Non-family | 376 (38.2%) | 1.17 |
| Total Households | 985 (100.0%) | 2.41 |
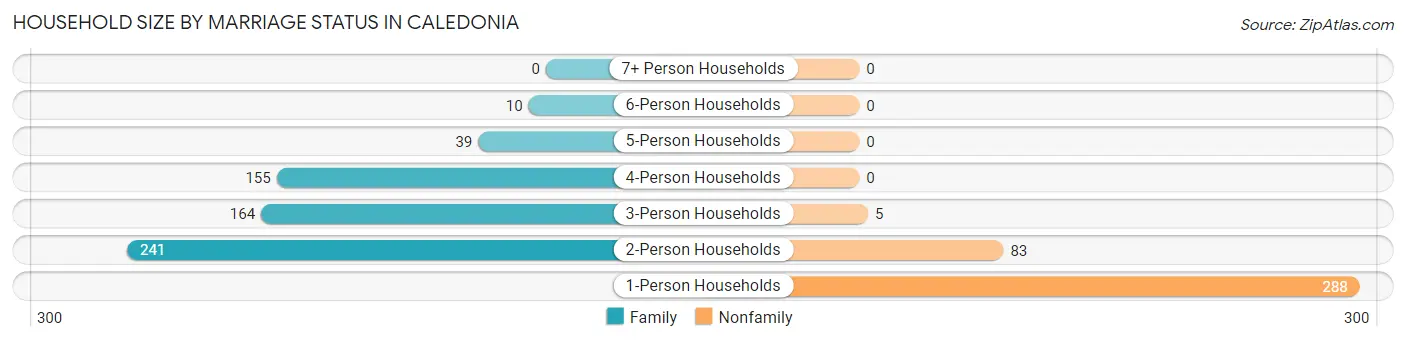
Household Size by Marriage Status in Caledonia
Out of a total of 985 households in Caledonia, 609 (61.8%) are family households, while 376 (38.2%) are nonfamily households. The most numerous type of family households are 2-person households, comprising 241, and the most common type of nonfamily households are 1-person households, comprising 288.
| Household Size | Family Households | Nonfamily Households |
| 1-Person Households | - | 288 (29.2%) |
| 2-Person Households | 241 (24.5%) | 83 (8.4%) |
| 3-Person Households | 164 (16.7%) | 5 (0.5%) |
| 4-Person Households | 155 (15.7%) | 0 (0.0%) |
| 5-Person Households | 39 (4.0%) | 0 (0.0%) |
| 6-Person Households | 10 (1.0%) | 0 (0.0%) |
| 7+ Person Households | 0 (0.0%) | 0 (0.0%) |
| Total | 609 (61.8%) | 376 (38.2%) |
Female Fertility in Caledonia
Fertility by Age in Caledonia
Average fertility rate in Caledonia is 25.0 births per 1,000 women. Women in the age bracket of 35 to 50 years have the highest fertility rate with 30.0 births per 1,000 women. Women in the age bracket of 20 to 34 years acount for 50.0% of all women with births.
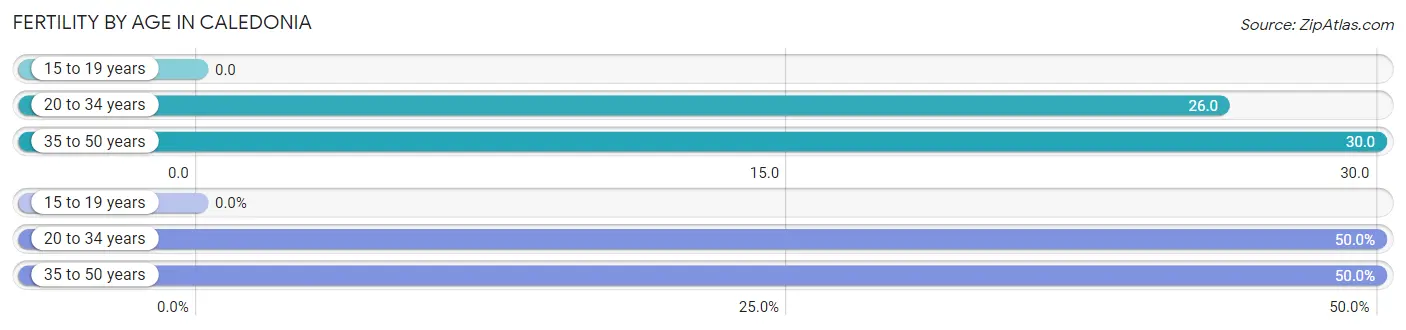
| Age Bracket | Women with Births | Births / 1,000 Women |
| 15 to 19 years | 0 (0.0%) | 0.0 |
| 20 to 34 years | 7 (50.0%) | 26.0 |
| 35 to 50 years | 7 (50.0%) | 30.0 |
| Total | 14 (100.0%) | 25.0 |
Fertility by Age by Marriage Status in Caledonia
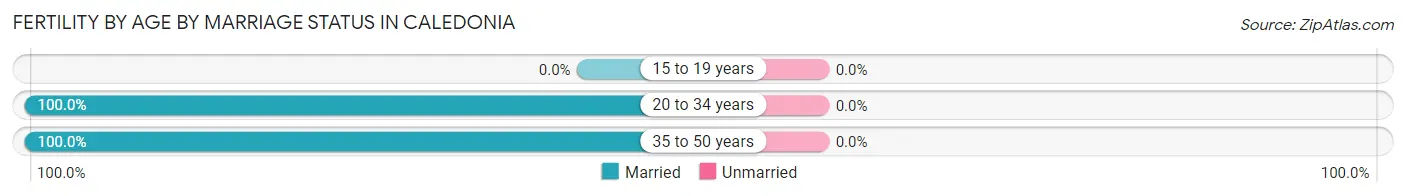
| Age Bracket | Married | Unmarried |
| 15 to 19 years | 0 (0.0%) | 0 (0.0%) |
| 20 to 34 years | 7 (100.0%) | 0 (0.0%) |
| 35 to 50 years | 7 (100.0%) | 0 (0.0%) |
| Total | 14 (100.0%) | 0 (0.0%) |
Fertility by Education in Caledonia
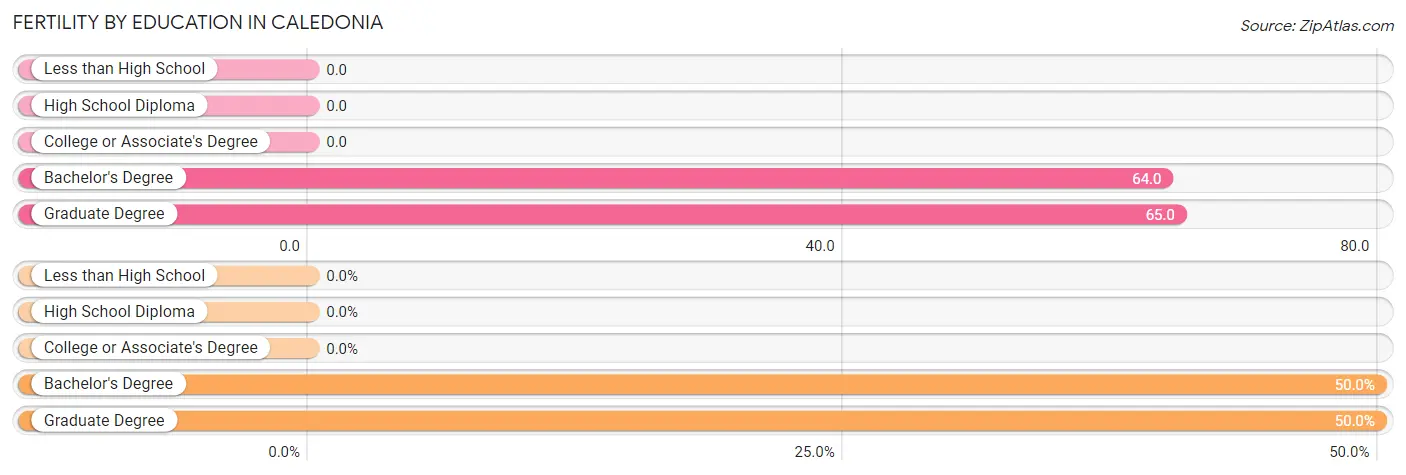
| Educational Attainment | Women with Births | Births / 1,000 Women |
| Less than High School | 0 (0.0%) | 0.0 |
| High School Diploma | 0 (0.0%) | 0.0 |
| College or Associate's Degree | 0 (0.0%) | 0.0 |
| Bachelor's Degree | 7 (50.0%) | 64.0 |
| Graduate Degree | 7 (50.0%) | 65.0 |
| Total | 14 (100.0%) | 25.0 |
Fertility by Education by Marriage Status in Caledonia
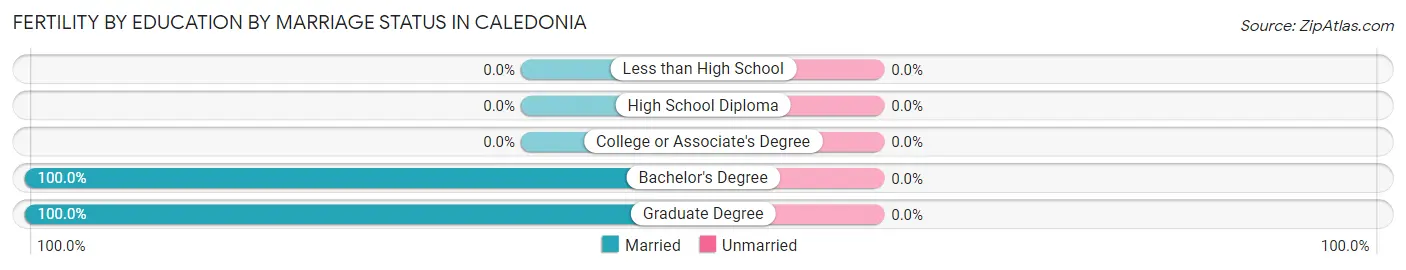
| Educational Attainment | Married | Unmarried |
| Less than High School | 0 (0.0%) | 0 (0.0%) |
| High School Diploma | 0 (0.0%) | 0 (0.0%) |
| College or Associate's Degree | 0 (0.0%) | 0 (0.0%) |
| Bachelor's Degree | 7 (100.0%) | 0 (0.0%) |
| Graduate Degree | 7 (100.0%) | 0 (0.0%) |
| Total | 14 (100.0%) | 0 (0.0%) |
Income in Caledonia
Income Overview in Caledonia
Per Capita Income in Caledonia is $40,517, while median incomes of families and households are $112,303 and $85,208 respectively.
| Characteristic | Number | Measure |
| Per Capita Income | 2,385 | $40,517 |
| Median Family Income | 609 | $112,303 |
| Mean Family Income | 609 | $116,985 |
| Median Household Income | 985 | $85,208 |
| Mean Household Income | 985 | $97,541 |
| Income Deficit | 609 | $0 |
| Wage / Income Gap (%) | 2,385 | 30.96% |
| Wage / Income Gap ($) | 2,385 | 69.04¢ per $1 |
| Gini / Inequality Index | 2,385 | 0.36 |
Earnings by Sex in Caledonia
Average Earnings in Caledonia are $46,000, $51,000 for men and $35,208 for women, a difference of 31.0%.
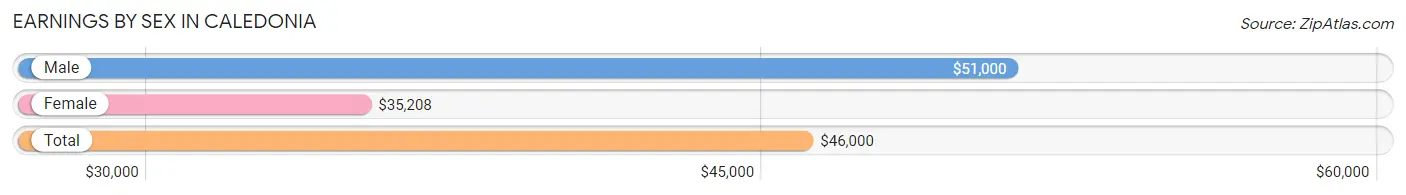
| Sex | Number | Average Earnings |
| Male | 798 (54.1%) | $51,000 |
| Female | 676 (45.9%) | $35,208 |
| Total | 1,474 (100.0%) | $46,000 |
Earnings by Sex by Income Bracket in Caledonia
The most common earnings brackets in Caledonia are $100,000+ for men (112 | 14.0%) and $55,000 to $64,999 for women (81 | 12.0%).
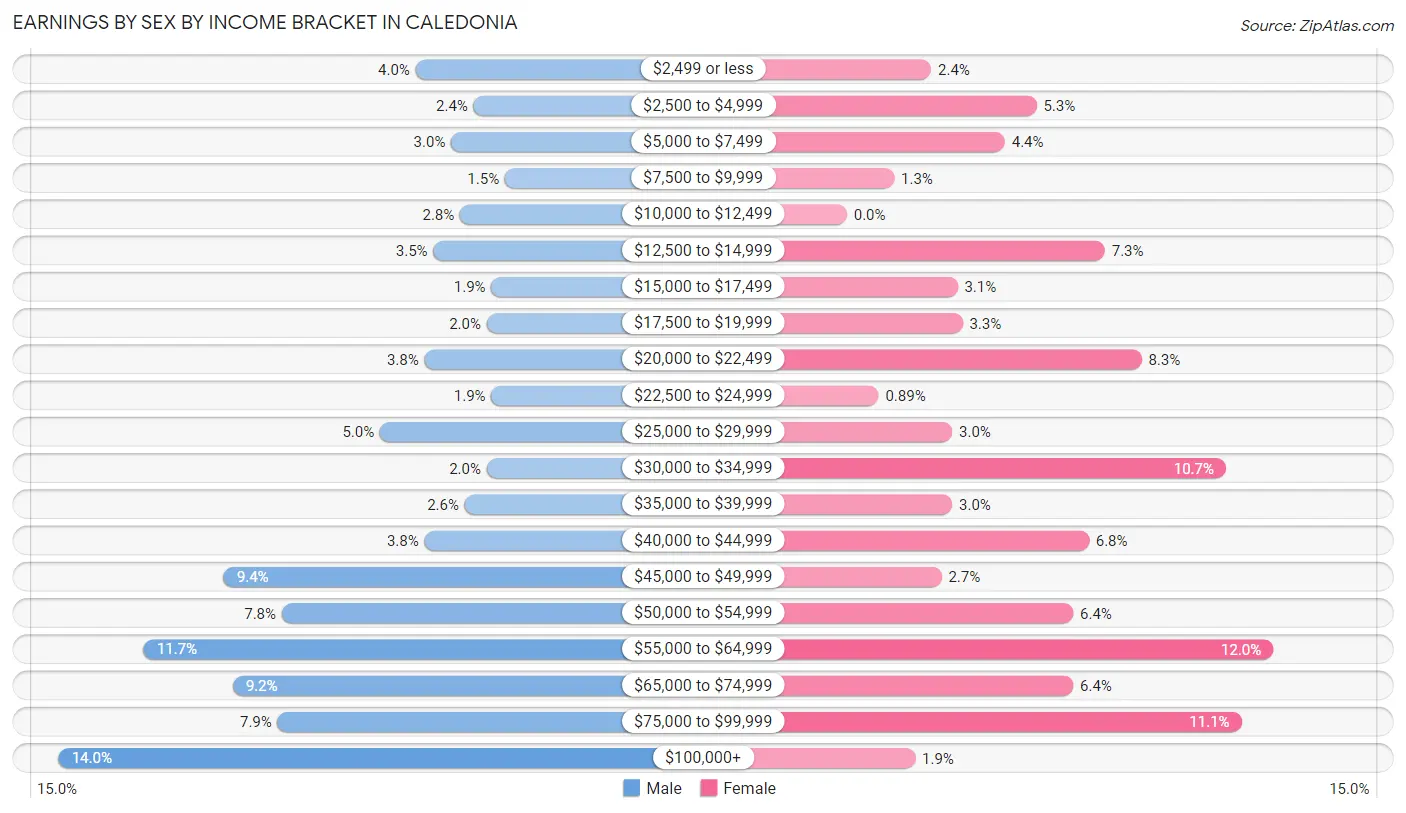
| Income | Male | Female |
| $2,499 or less | 32 (4.0%) | 16 (2.4%) |
| $2,500 to $4,999 | 19 (2.4%) | 36 (5.3%) |
| $5,000 to $7,499 | 24 (3.0%) | 30 (4.4%) |
| $7,500 to $9,999 | 12 (1.5%) | 9 (1.3%) |
| $10,000 to $12,499 | 22 (2.8%) | 0 (0.0%) |
| $12,500 to $14,999 | 28 (3.5%) | 49 (7.2%) |
| $15,000 to $17,499 | 15 (1.9%) | 21 (3.1%) |
| $17,500 to $19,999 | 16 (2.0%) | 22 (3.3%) |
| $20,000 to $22,499 | 30 (3.8%) | 56 (8.3%) |
| $22,500 to $24,999 | 15 (1.9%) | 6 (0.9%) |
| $25,000 to $29,999 | 40 (5.0%) | 20 (3.0%) |
| $30,000 to $34,999 | 16 (2.0%) | 72 (10.6%) |
| $35,000 to $39,999 | 21 (2.6%) | 20 (3.0%) |
| $40,000 to $44,999 | 30 (3.8%) | 46 (6.8%) |
| $45,000 to $49,999 | 75 (9.4%) | 18 (2.7%) |
| $50,000 to $54,999 | 62 (7.8%) | 43 (6.4%) |
| $55,000 to $64,999 | 93 (11.7%) | 81 (12.0%) |
| $65,000 to $74,999 | 73 (9.1%) | 43 (6.4%) |
| $75,000 to $99,999 | 63 (7.9%) | 75 (11.1%) |
| $100,000+ | 112 (14.0%) | 13 (1.9%) |
| Total | 798 (100.0%) | 676 (100.0%) |
Earnings by Sex by Educational Attainment in Caledonia
Average earnings in Caledonia are $58,281 for men and $42,270 for women, a difference of 27.5%. Men with an educational attainment of graduate degree enjoy the highest average annual earnings of $98,846, while those with high school diploma education earn the least with $44,808. Women with an educational attainment of bachelor's degree earn the most with the average annual earnings of $57,574, while those with college or associate's degree education have the smallest earnings of $26,094.
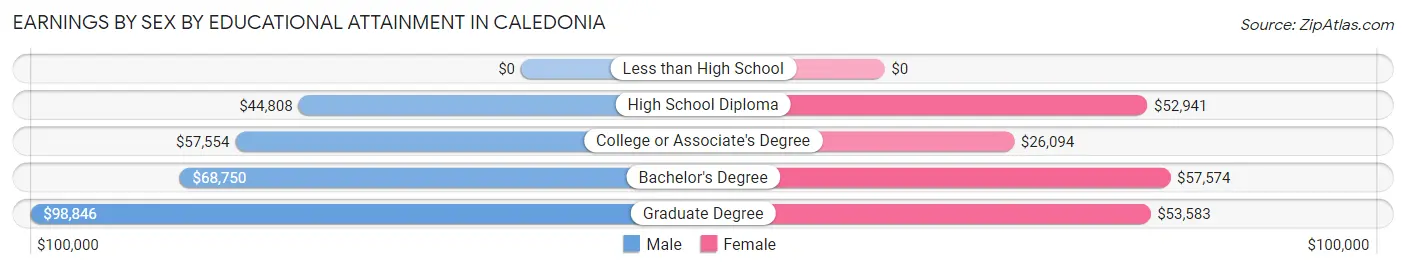
| Educational Attainment | Male Income | Female Income |
| Less than High School | - | - |
| High School Diploma | $44,808 | $52,941 |
| College or Associate's Degree | $57,554 | $26,094 |
| Bachelor's Degree | $68,750 | $57,574 |
| Graduate Degree | $98,846 | $53,583 |
| Total | $58,281 | $42,270 |
Family Income in Caledonia
Family Income Brackets in Caledonia
According to the Caledonia family income data, there are 197 families falling into the $100,000 to $149,999 income range, which is the most common income bracket and makes up 32.4% of all families.
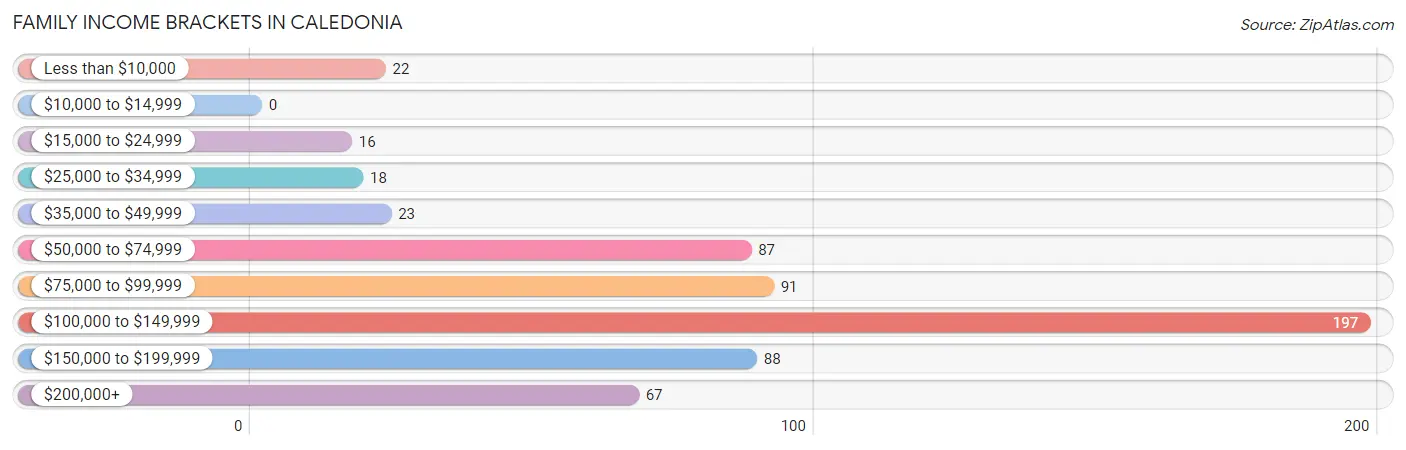
| Income Bracket | # Families | % Families |
| Less than $10,000 | 22 | 3.6% |
| $10,000 to $14,999 | 0 | 0.0% |
| $15,000 to $24,999 | 16 | 2.6% |
| $25,000 to $34,999 | 18 | 3.0% |
| $35,000 to $49,999 | 23 | 3.8% |
| $50,000 to $74,999 | 87 | 14.3% |
| $75,000 to $99,999 | 91 | 14.9% |
| $100,000 to $149,999 | 197 | 32.3% |
| $150,000 to $199,999 | 88 | 14.4% |
| $200,000+ | 67 | 11.0% |
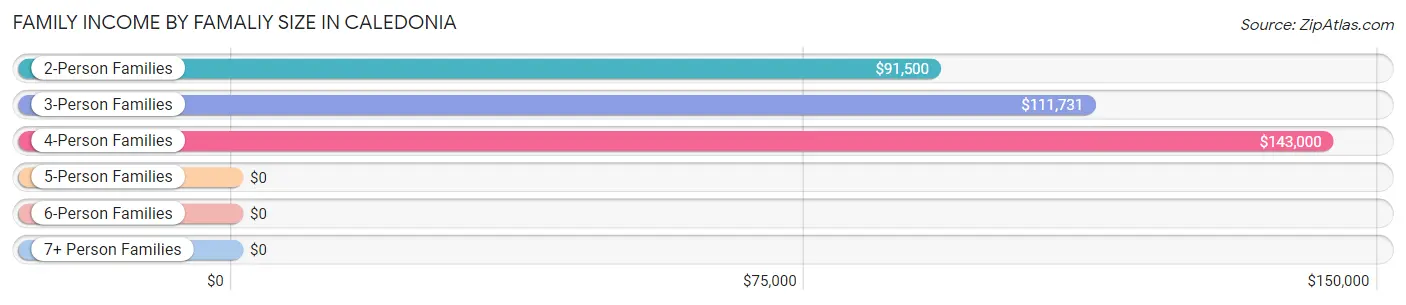
Family Income by Famaliy Size in Caledonia
4-person families (154 | 25.3%) account for the highest median family income in Caledonia with $143,000 per family, while 2-person families (246 | 40.4%) have the highest median income of $45,750 per family member.
| Income Bracket | # Families | Median Income |
| 2-Person Families | 246 (40.4%) | $91,500 |
| 3-Person Families | 172 (28.2%) | $111,731 |
| 4-Person Families | 154 (25.3%) | $143,000 |
| 5-Person Families | 27 (4.4%) | $0 |
| 6-Person Families | 10 (1.6%) | $0 |
| 7+ Person Families | 0 (0.0%) | $0 |
| Total | 609 (100.0%) | $112,303 |
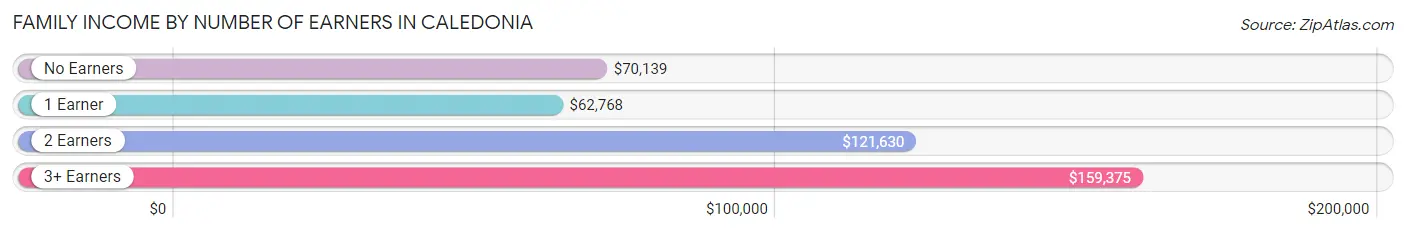
Family Income by Number of Earners in Caledonia
The median family income in Caledonia is $112,303, with families comprising 3+ earners (97) having the highest median family income of $159,375, while families with 1 earner (127) have the lowest median family income of $62,768, accounting for 15.9% and 20.8% of families, respectively.
| Number of Earners | # Families | Median Income |
| No Earners | 79 (13.0%) | $70,139 |
| 1 Earner | 127 (20.8%) | $62,768 |
| 2 Earners | 306 (50.2%) | $121,630 |
| 3+ Earners | 97 (15.9%) | $159,375 |
| Total | 609 (100.0%) | $112,303 |
Household Income in Caledonia
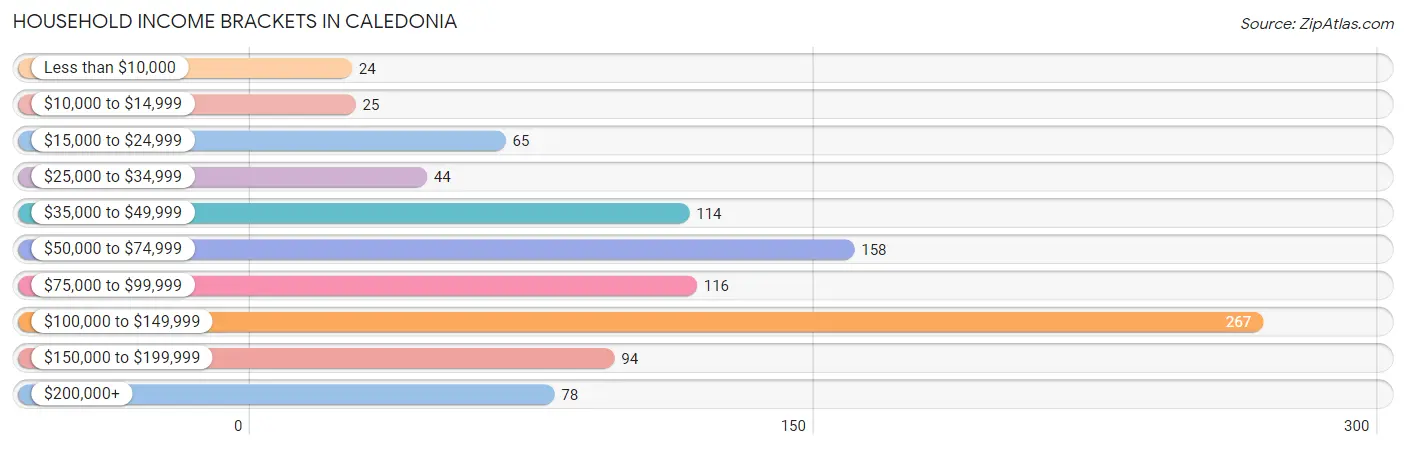
Household Income Brackets in Caledonia
With 267 households falling in the category, the $100,000 to $149,999 income range is the most frequent in Caledonia, accounting for 27.1% of all households. In contrast, only 24 households (2.4%) fall into the less than $10,000 income bracket, making it the least populous group.
| Income Bracket | # Households | % Households |
| Less than $10,000 | 24 | 2.4% |
| $10,000 to $14,999 | 25 | 2.5% |
| $15,000 to $24,999 | 65 | 6.6% |
| $25,000 to $34,999 | 44 | 4.5% |
| $35,000 to $49,999 | 114 | 11.6% |
| $50,000 to $74,999 | 158 | 16.0% |
| $75,000 to $99,999 | 116 | 11.8% |
| $100,000 to $149,999 | 267 | 27.1% |
| $150,000 to $199,999 | 94 | 9.5% |
| $200,000+ | 78 | 7.9% |
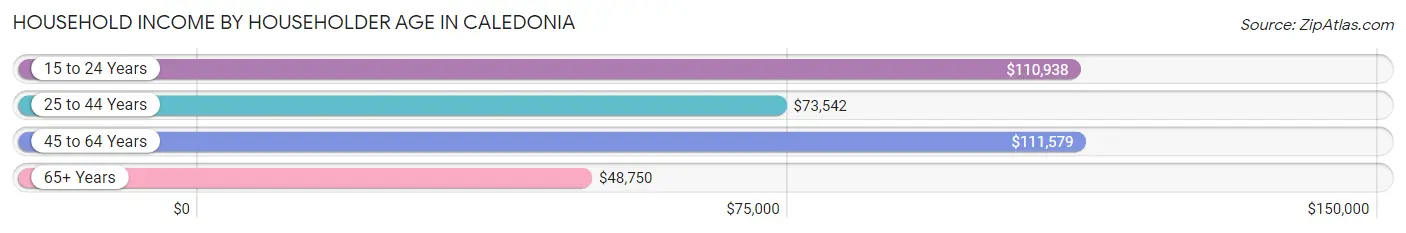
Household Income by Householder Age in Caledonia
The median household income in Caledonia is $85,208, with the highest median household income of $111,579 found in the 45 to 64 years age bracket for the primary householder. A total of 452 households (45.9%) fall into this category. Meanwhile, the 65+ years age bracket for the primary householder has the lowest median household income of $48,750, with 217 households (22.0%) in this group.
| Income Bracket | # Households | Median Income |
| 15 to 24 Years | 34 (3.5%) | $110,938 |
| 25 to 44 Years | 282 (28.6%) | $73,542 |
| 45 to 64 Years | 452 (45.9%) | $111,579 |
| 65+ Years | 217 (22.0%) | $48,750 |
| Total | 985 (100.0%) | $85,208 |
Poverty in Caledonia
Income Below Poverty by Sex and Age in Caledonia
With 5.4% poverty level for males and 6.6% for females among the residents of Caledonia, under 5 year old males and 6 to 11 year old females are the most vulnerable to poverty, with 26 males (28.6%) and 17 females (18.3%) in their respective age groups living below the poverty level.
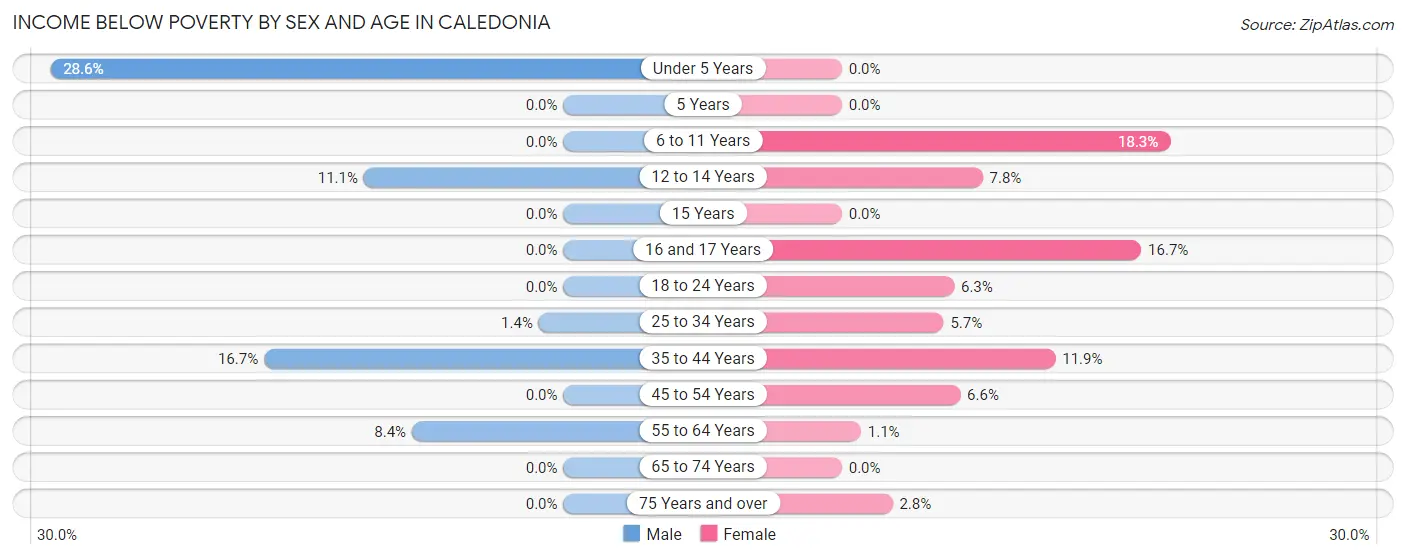
| Age Bracket | Male | Female |
| Under 5 Years | 26 (28.6%) | 0 (0.0%) |
| 5 Years | 0 (0.0%) | 0 (0.0%) |
| 6 to 11 Years | 0 (0.0%) | 17 (18.3%) |
| 12 to 14 Years | 5 (11.1%) | 4 (7.8%) |
| 15 Years | 0 (0.0%) | 0 (0.0%) |
| 16 and 17 Years | 0 (0.0%) | 4 (16.7%) |
| 18 to 24 Years | 0 (0.0%) | 8 (6.2%) |
| 25 to 34 Years | 2 (1.4%) | 9 (5.7%) |
| 35 to 44 Years | 21 (16.7%) | 17 (11.9%) |
| 45 to 54 Years | 0 (0.0%) | 11 (6.6%) |
| 55 to 64 Years | 15 (8.4%) | 2 (1.1%) |
| 65 to 74 Years | 0 (0.0%) | 0 (0.0%) |
| 75 Years and over | 0 (0.0%) | 2 (2.8%) |
| Total | 69 (5.4%) | 74 (6.6%) |
Income Above Poverty by Sex and Age in Caledonia
According to the poverty statistics in Caledonia, males aged 6 to 11 years and females aged under 5 years are the age groups that are most secure financially, with 100.0% of males and 100.0% of females in these age groups living above the poverty line.
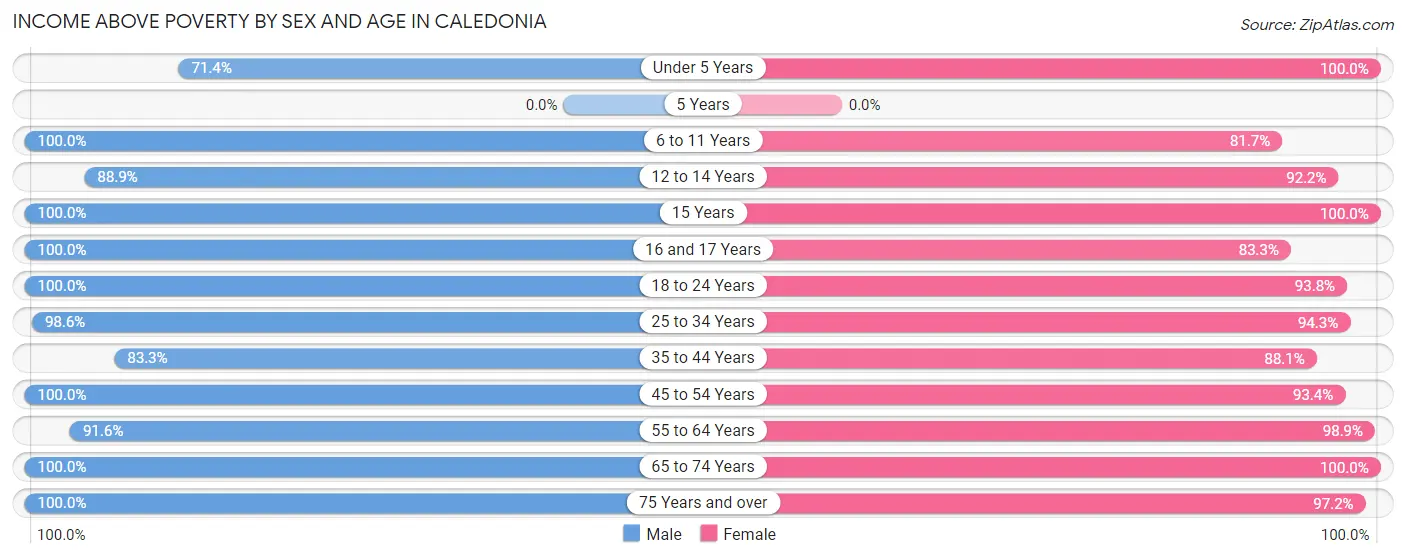
| Age Bracket | Male | Female |
| Under 5 Years | 65 (71.4%) | 22 (100.0%) |
| 5 Years | 0 (0.0%) | 0 (0.0%) |
| 6 to 11 Years | 66 (100.0%) | 76 (81.7%) |
| 12 to 14 Years | 40 (88.9%) | 47 (92.2%) |
| 15 Years | 6 (100.0%) | 13 (100.0%) |
| 16 and 17 Years | 49 (100.0%) | 20 (83.3%) |
| 18 to 24 Years | 198 (100.0%) | 120 (93.8%) |
| 25 to 34 Years | 144 (98.6%) | 150 (94.3%) |
| 35 to 44 Years | 105 (83.3%) | 126 (88.1%) |
| 45 to 54 Years | 181 (100.0%) | 156 (93.4%) |
| 55 to 64 Years | 163 (91.6%) | 187 (98.9%) |
| 65 to 74 Years | 125 (100.0%) | 54 (100.0%) |
| 75 Years and over | 60 (100.0%) | 69 (97.2%) |
| Total | 1,202 (94.6%) | 1,040 (93.4%) |
Income Below Poverty Among Married-Couple Families in Caledonia
The poverty statistics for married-couple families in Caledonia show that 0.8% or 4 of the total 483 families live below the poverty line. Families with 3 or 4 children have the highest poverty rate of 20.0%, comprising of 4 families. On the other hand, families with no children have the lowest poverty rate of 0.0%, which includes 0 families.
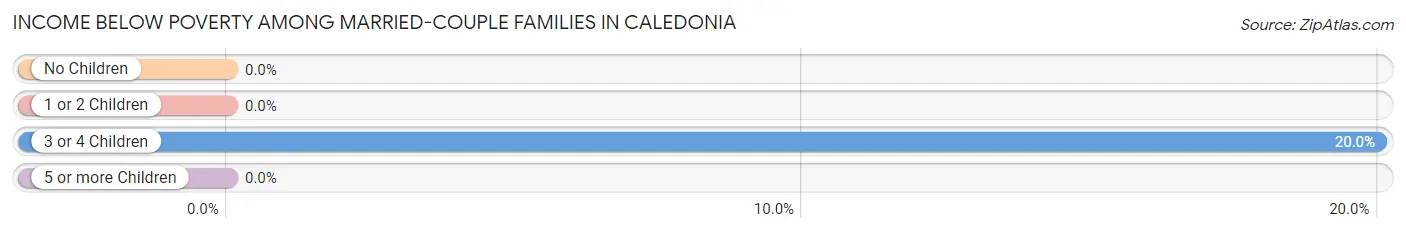
| Children | Above Poverty | Below Poverty |
| No Children | 249 (100.0%) | 0 (0.0%) |
| 1 or 2 Children | 214 (100.0%) | 0 (0.0%) |
| 3 or 4 Children | 16 (80.0%) | 4 (20.0%) |
| 5 or more Children | 0 (0.0%) | 0 (0.0%) |
| Total | 479 (99.2%) | 4 (0.8%) |
Income Below Poverty Among Single-Parent Households in Caledonia
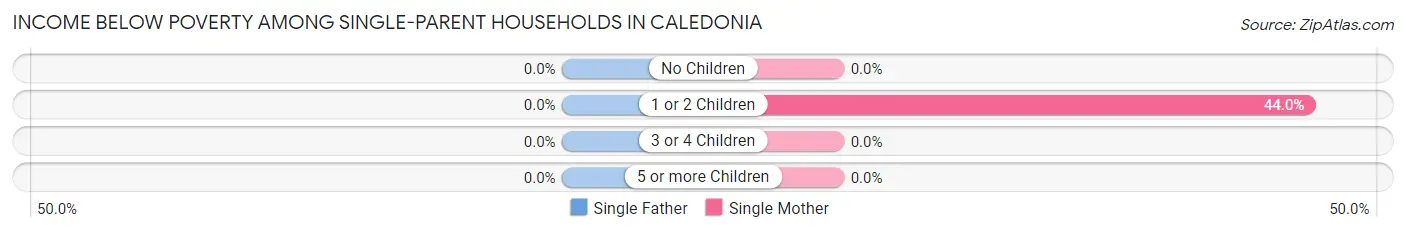
| Children | Single Father | Single Mother |
| No Children | 0 (0.0%) | 0 (0.0%) |
| 1 or 2 Children | 0 (0.0%) | 22 (44.0%) |
| 3 or 4 Children | 0 (0.0%) | 0 (0.0%) |
| 5 or more Children | 0 (0.0%) | 0 (0.0%) |
| Total | 0 (0.0%) | 22 (25.0%) |
Income Below Poverty Among Married-Couple vs Single-Parent Households in Caledonia
The poverty data for Caledonia shows that 4 of the married-couple family households (0.8%) and 22 of the single-parent households (17.5%) are living below the poverty level. Within the married-couple family households, those with 3 or 4 children have the highest poverty rate, with 4 households (20.0%) falling below the poverty line. Among the single-parent households, those with 1 or 2 children have the highest poverty rate, with 22 household (44.0%) living below poverty.
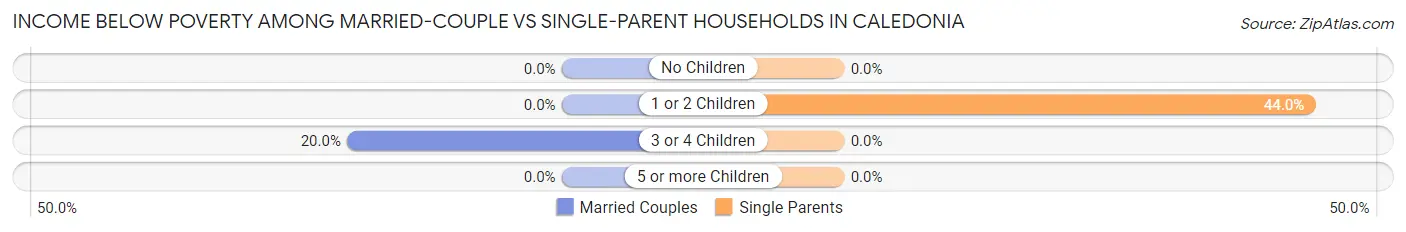
| Children | Married-Couple Families | Single-Parent Households |
| No Children | 0 (0.0%) | 0 (0.0%) |
| 1 or 2 Children | 0 (0.0%) | 22 (44.0%) |
| 3 or 4 Children | 4 (20.0%) | 0 (0.0%) |
| 5 or more Children | 0 (0.0%) | 0 (0.0%) |
| Total | 4 (0.8%) | 22 (17.5%) |
Employment Characteristics in Caledonia
Employment by Class of Employer in Caledonia
Among the 1,356 employed individuals in Caledonia, private company employees (933 | 68.8%), local government employees (179 | 13.2%), and not-for-profit organizations (94 | 6.9%) make up the most common classes of employment.
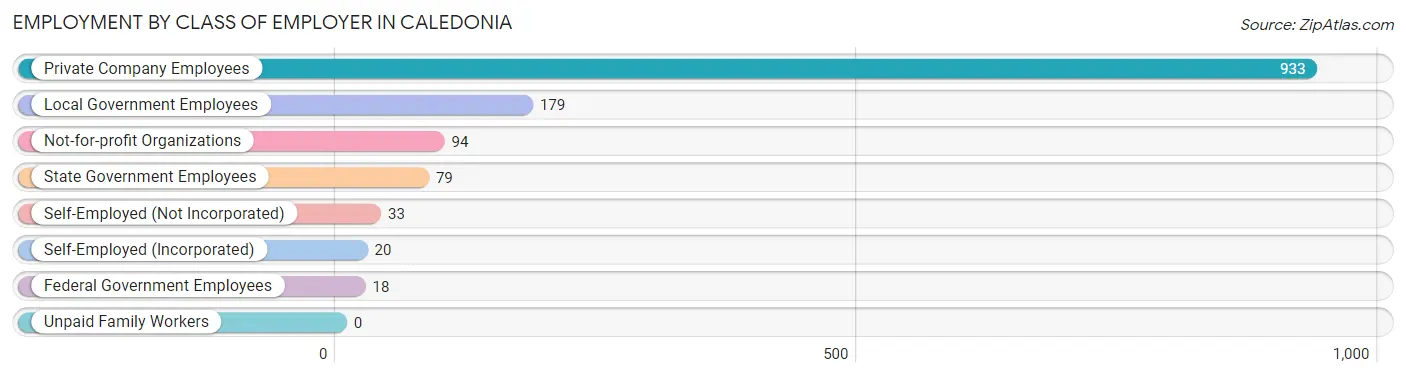
| Employer Class | # Employees | % Employees |
| Private Company Employees | 933 | 68.8% |
| Self-Employed (Incorporated) | 20 | 1.5% |
| Self-Employed (Not Incorporated) | 33 | 2.4% |
| Not-for-profit Organizations | 94 | 6.9% |
| Local Government Employees | 179 | 13.2% |
| State Government Employees | 79 | 5.8% |
| Federal Government Employees | 18 | 1.3% |
| Unpaid Family Workers | 0 | 0.0% |
| Total | 1,356 | 100.0% |
Employment Status by Age in Caledonia
According to the labor force statistics for Caledonia, out of the total population over 16 years of age (1,998), 70.4% or 1,407 individuals are in the labor force, with 2.7% or 38 of them unemployed. The age group with the highest labor force participation rate is 25 to 29 years, with 98.9% or 179 individuals in the labor force. Within the labor force, the 16 to 19 years age range has the highest percentage of unemployed individuals, with 32.7% or 18 of them being unemployed.
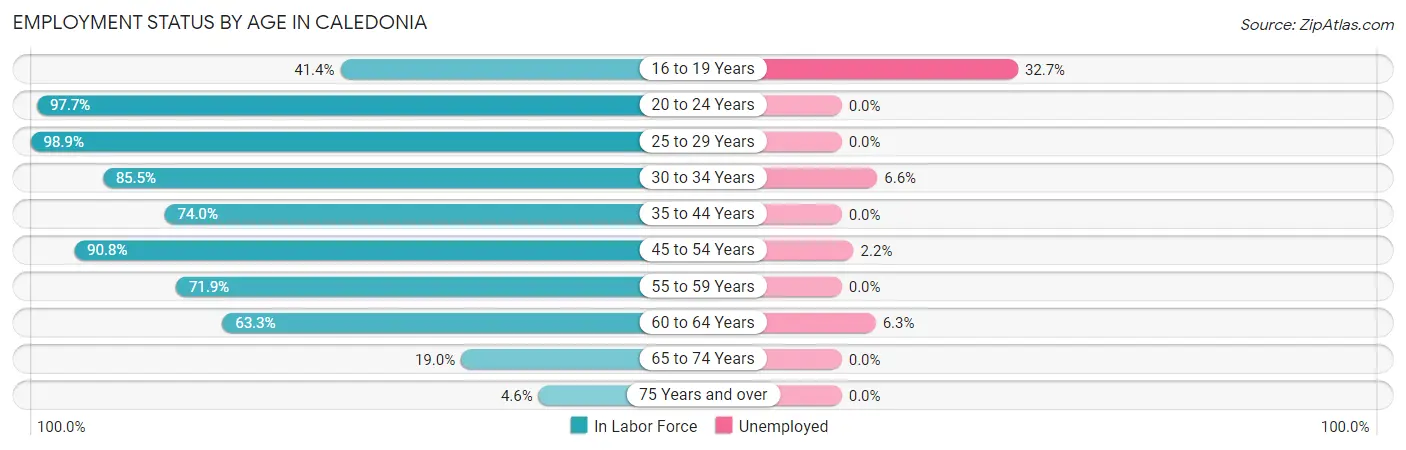
| Age Bracket | In Labor Force | Unemployed |
| 16 to 19 Years | 55 (41.4%) | 18 (32.7%) |
| 20 to 24 Years | 260 (97.7%) | 0 (0.0%) |
| 25 to 29 Years | 179 (98.9%) | 0 (0.0%) |
| 30 to 34 Years | 106 (85.5%) | 7 (6.6%) |
| 35 to 44 Years | 199 (74.0%) | 0 (0.0%) |
| 45 to 54 Years | 316 (90.8%) | 7 (2.2%) |
| 55 to 59 Years | 156 (71.9%) | 0 (0.0%) |
| 60 to 64 Years | 95 (63.3%) | 6 (6.3%) |
| 65 to 74 Years | 34 (19.0%) | 0 (0.0%) |
| 75 Years and over | 6 (4.6%) | 0 (0.0%) |
| Total | 1,407 (70.4%) | 38 (2.7%) |
Employment Status by Educational Attainment in Caledonia
According to labor force statistics for Caledonia, 81.5% of individuals (1,051) out of the total population between 25 and 64 years of age (1,289) are in the labor force, with 1.9% or 20 of them being unemployed. The group with the highest labor force participation rate are those with the educational attainment of bachelor's degree or higher, with 87.2% or 435 individuals in the labor force. Within the labor force, individuals with high school diploma education have the highest percentage of unemployment, with 3.2% or 7 of them being unemployed.
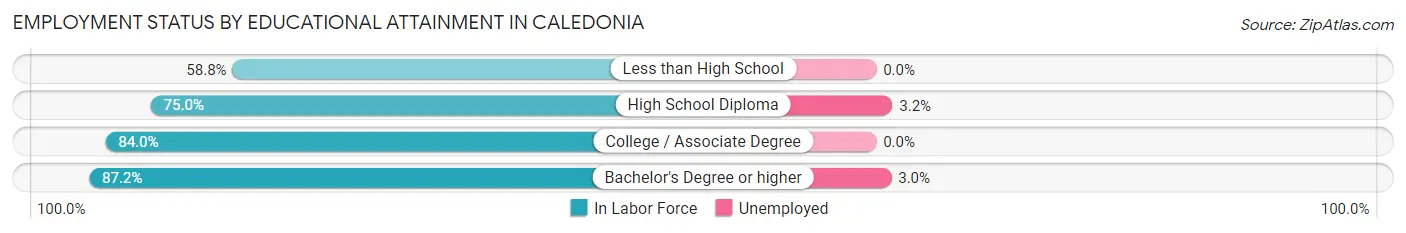
| Educational Attainment | In Labor Force | Unemployed |
| Less than High School | 50 (58.8%) | 0 (0.0%) |
| High School Diploma | 219 (75.0%) | 9 (3.2%) |
| College / Associate Degree | 347 (84.0%) | 0 (0.0%) |
| Bachelor's Degree or higher | 435 (87.2%) | 15 (3.0%) |
| Total | 1,051 (81.5%) | 24 (1.9%) |
Employment Occupations by Sex in Caledonia
Management, Business, Science and Arts Occupations
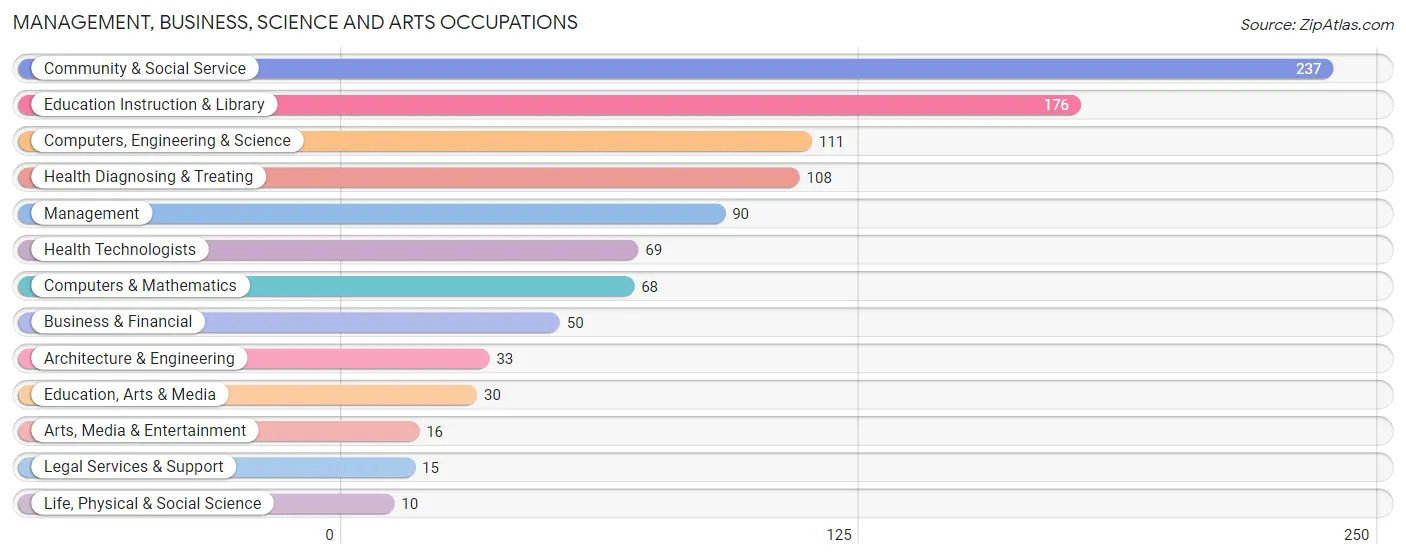
The most common Management, Business, Science and Arts occupations in Caledonia are Community & Social Service (237 | 17.3%), Education Instruction & Library (176 | 12.9%), Computers, Engineering & Science (111 | 8.1%), Health Diagnosing & Treating (108 | 7.9%), and Management (90 | 6.6%).
Management, Business, Science and Arts Occupations by Sex
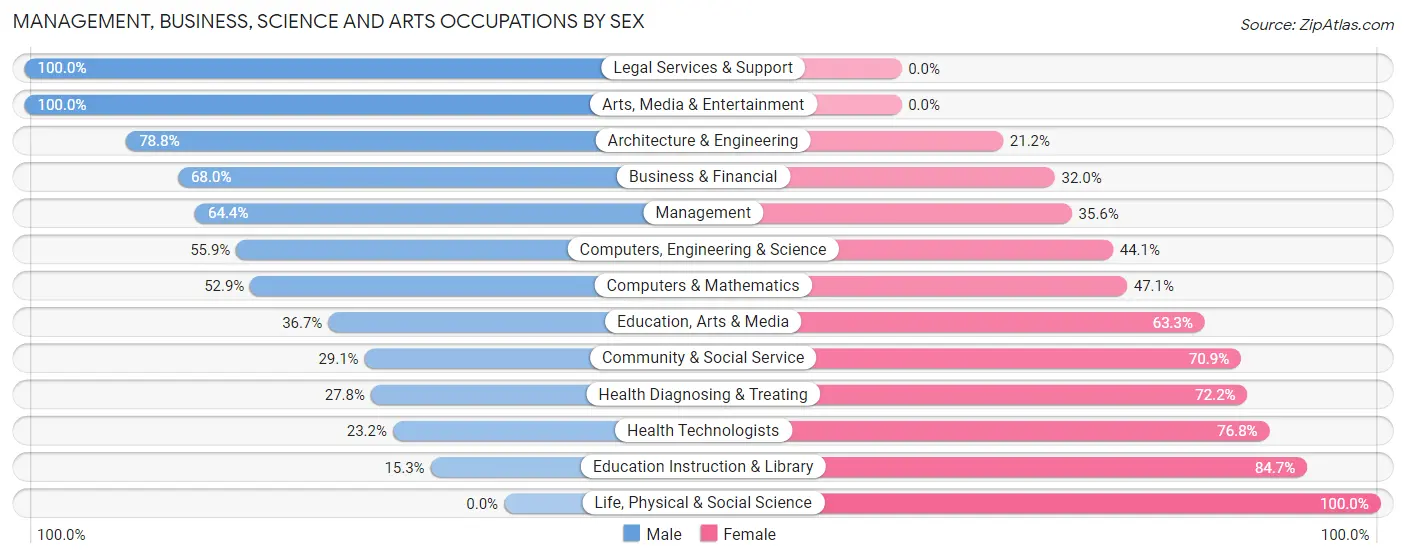
Within the Management, Business, Science and Arts occupations in Caledonia, the most male-oriented occupations are Legal Services & Support (100.0%), Arts, Media & Entertainment (100.0%), and Architecture & Engineering (78.8%), while the most female-oriented occupations are Life, Physical & Social Science (100.0%), Education Instruction & Library (84.7%), and Health Technologists (76.8%).
| Occupation | Male | Female |
| Management | 58 (64.4%) | 32 (35.6%) |
| Business & Financial | 34 (68.0%) | 16 (32.0%) |
| Computers, Engineering & Science | 62 (55.9%) | 49 (44.1%) |
| Computers & Mathematics | 36 (52.9%) | 32 (47.1%) |
| Architecture & Engineering | 26 (78.8%) | 7 (21.2%) |
| Life, Physical & Social Science | 0 (0.0%) | 10 (100.0%) |
| Community & Social Service | 69 (29.1%) | 168 (70.9%) |
| Education, Arts & Media | 11 (36.7%) | 19 (63.3%) |
| Legal Services & Support | 15 (100.0%) | 0 (0.0%) |
| Education Instruction & Library | 27 (15.3%) | 149 (84.7%) |
| Arts, Media & Entertainment | 16 (100.0%) | 0 (0.0%) |
| Health Diagnosing & Treating | 30 (27.8%) | 78 (72.2%) |
| Health Technologists | 16 (23.2%) | 53 (76.8%) |
| Total (Category) | 253 (42.4%) | 343 (57.6%) |
| Total (Overall) | 741 (54.2%) | 627 (45.8%) |
Services Occupations
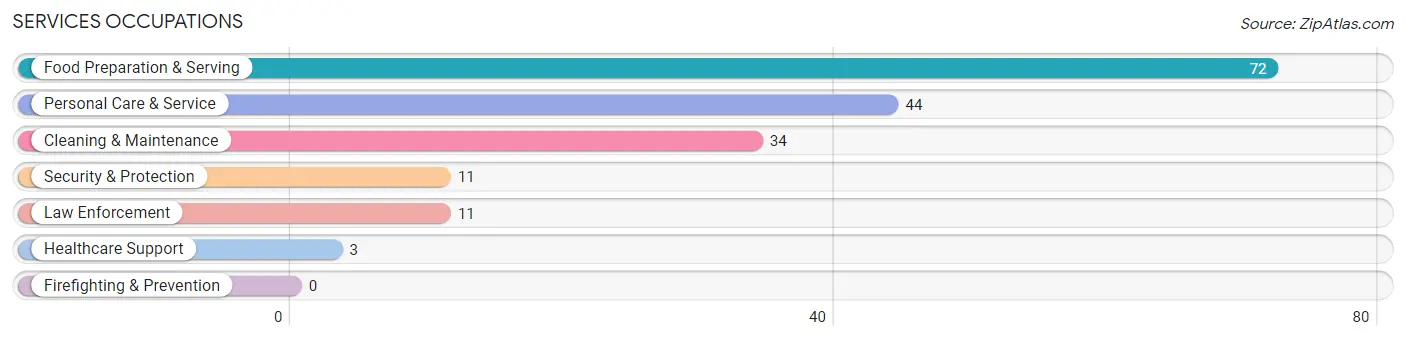
The most common Services occupations in Caledonia are Food Preparation & Serving (72 | 5.3%), Personal Care & Service (44 | 3.2%), Cleaning & Maintenance (34 | 2.5%), Security & Protection (11 | 0.8%), and Law Enforcement (11 | 0.8%).
Services Occupations by Sex
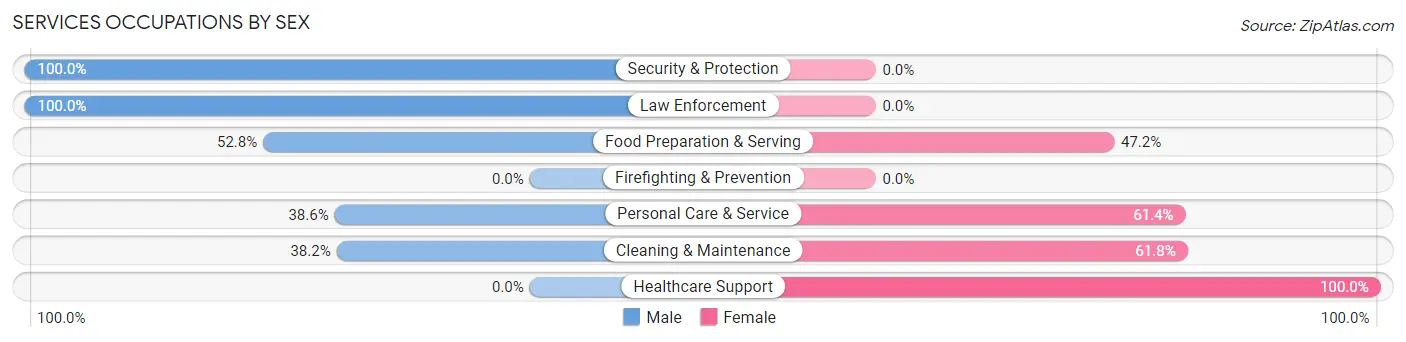
Within the Services occupations in Caledonia, the most male-oriented occupations are Security & Protection (100.0%), Law Enforcement (100.0%), and Food Preparation & Serving (52.8%), while the most female-oriented occupations are Healthcare Support (100.0%), Cleaning & Maintenance (61.8%), and Personal Care & Service (61.4%).
| Occupation | Male | Female |
| Healthcare Support | 0 (0.0%) | 3 (100.0%) |
| Security & Protection | 11 (100.0%) | 0 (0.0%) |
| Firefighting & Prevention | 0 (0.0%) | 0 (0.0%) |
| Law Enforcement | 11 (100.0%) | 0 (0.0%) |
| Food Preparation & Serving | 38 (52.8%) | 34 (47.2%) |
| Cleaning & Maintenance | 13 (38.2%) | 21 (61.8%) |
| Personal Care & Service | 17 (38.6%) | 27 (61.4%) |
| Total (Category) | 79 (48.2%) | 85 (51.8%) |
| Total (Overall) | 741 (54.2%) | 627 (45.8%) |
Sales and Office Occupations
The most common Sales and Office occupations in Caledonia are Office & Administration (151 | 11.0%), and Sales & Related (55 | 4.0%).

Sales and Office Occupations by Sex

| Occupation | Male | Female |
| Sales & Related | 17 (30.9%) | 38 (69.1%) |
| Office & Administration | 15 (9.9%) | 136 (90.1%) |
| Total (Category) | 32 (15.5%) | 174 (84.5%) |
| Total (Overall) | 741 (54.2%) | 627 (45.8%) |
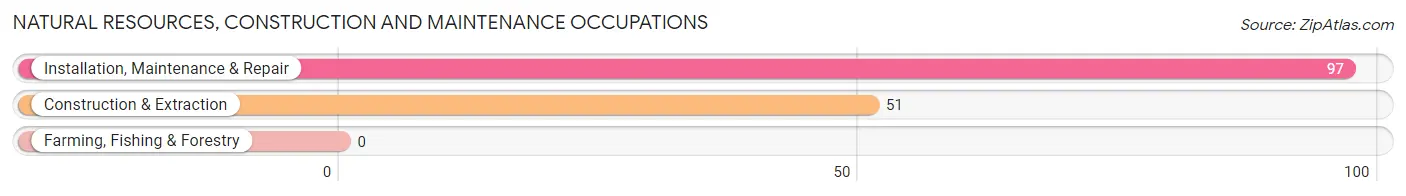
Natural Resources, Construction and Maintenance Occupations
The most common Natural Resources, Construction and Maintenance occupations in Caledonia are Installation, Maintenance & Repair (97 | 7.1%), and Construction & Extraction (51 | 3.7%).
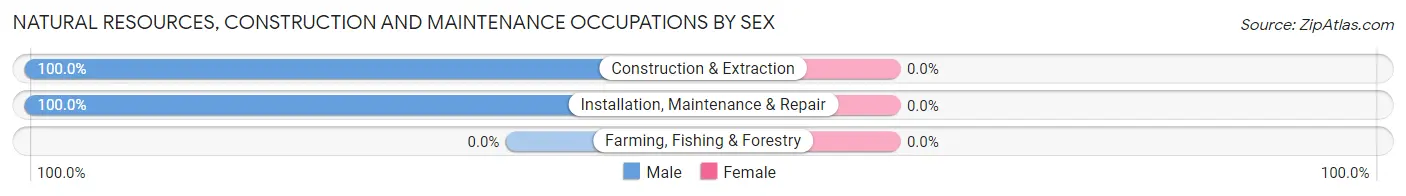
Natural Resources, Construction and Maintenance Occupations by Sex
| Occupation | Male | Female |
| Farming, Fishing & Forestry | 0 (0.0%) | 0 (0.0%) |
| Construction & Extraction | 51 (100.0%) | 0 (0.0%) |
| Installation, Maintenance & Repair | 97 (100.0%) | 0 (0.0%) |
| Total (Category) | 148 (100.0%) | 0 (0.0%) |
| Total (Overall) | 741 (54.2%) | 627 (45.8%) |
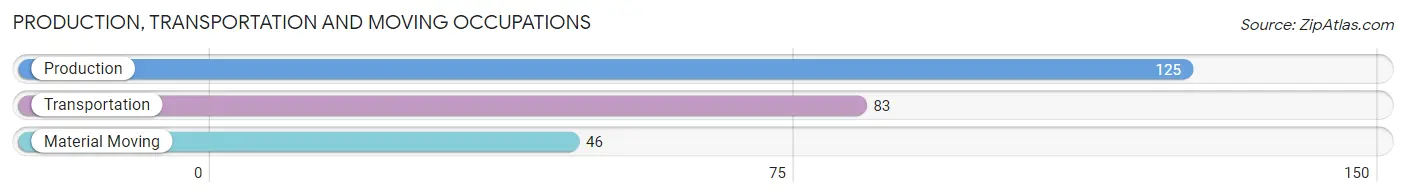
Production, Transportation and Moving Occupations
The most common Production, Transportation and Moving occupations in Caledonia are Production (125 | 9.1%), Transportation (83 | 6.1%), and Material Moving (46 | 3.4%).
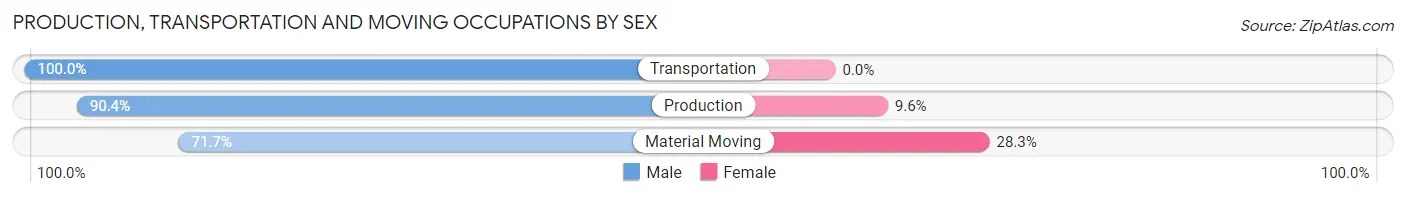
Production, Transportation and Moving Occupations by Sex
| Occupation | Male | Female |
| Production | 113 (90.4%) | 12 (9.6%) |
| Transportation | 83 (100.0%) | 0 (0.0%) |
| Material Moving | 33 (71.7%) | 13 (28.3%) |
| Total (Category) | 229 (90.2%) | 25 (9.8%) |
| Total (Overall) | 741 (54.2%) | 627 (45.8%) |
Employment Industries by Sex in Caledonia
Employment Industries in Caledonia
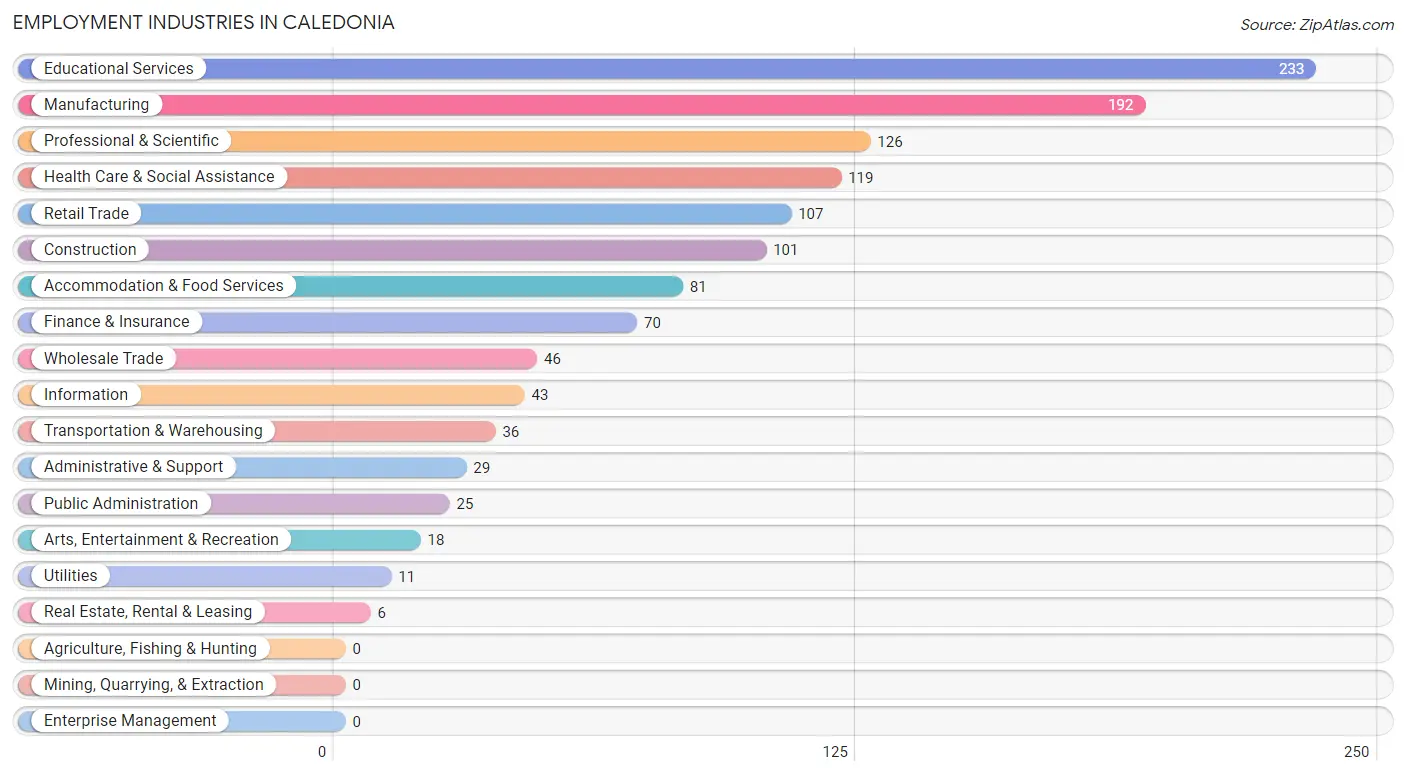
The major employment industries in Caledonia include Educational Services (233 | 17.0%), Manufacturing (192 | 14.0%), Professional & Scientific (126 | 9.2%), Health Care & Social Assistance (119 | 8.7%), and Retail Trade (107 | 7.8%).
Employment Industries by Sex in Caledonia
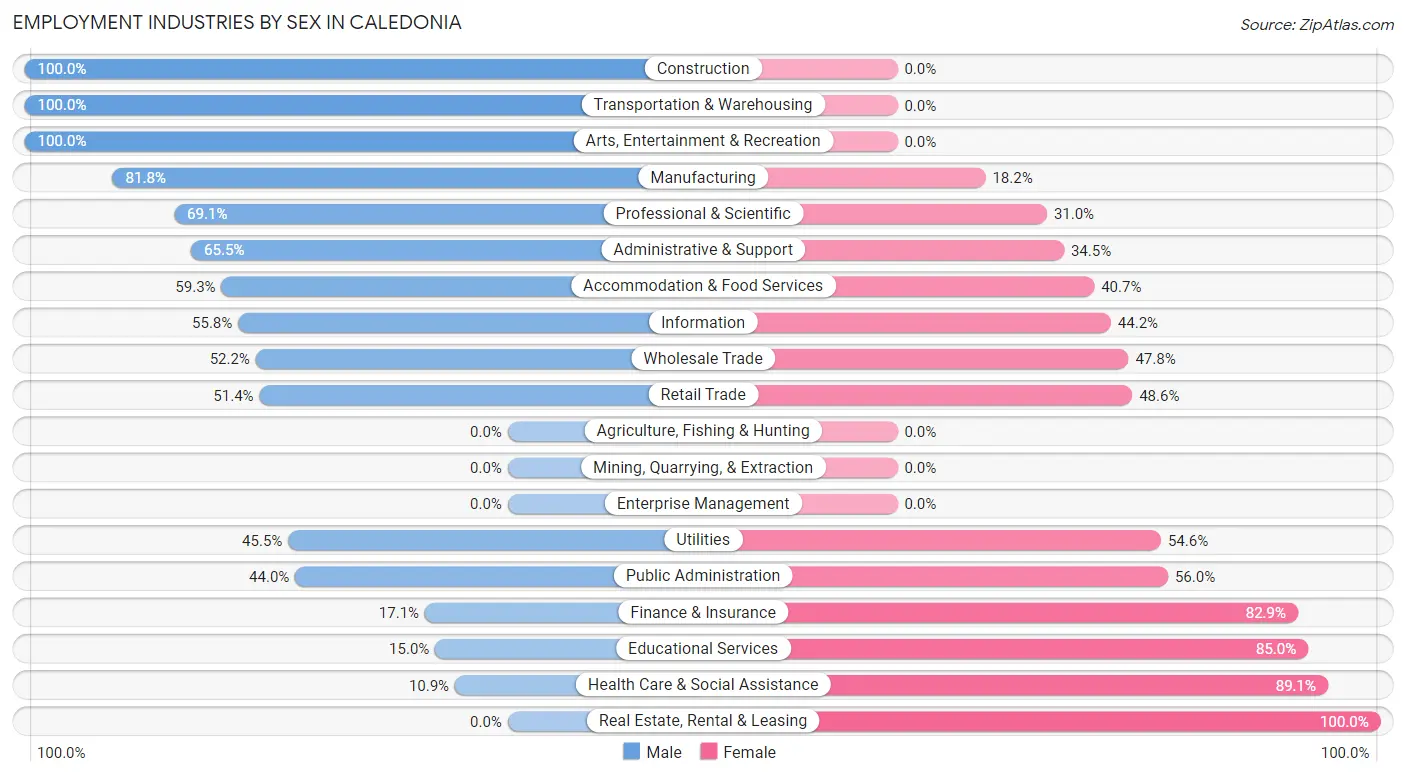
The Caledonia industries that see more men than women are Construction (100.0%), Transportation & Warehousing (100.0%), and Arts, Entertainment & Recreation (100.0%), whereas the industries that tend to have a higher number of women are Real Estate, Rental & Leasing (100.0%), Health Care & Social Assistance (89.1%), and Educational Services (85.0%).
| Industry | Male | Female |
| Agriculture, Fishing & Hunting | 0 (0.0%) | 0 (0.0%) |
| Mining, Quarrying, & Extraction | 0 (0.0%) | 0 (0.0%) |
| Construction | 101 (100.0%) | 0 (0.0%) |
| Manufacturing | 157 (81.8%) | 35 (18.2%) |
| Wholesale Trade | 24 (52.2%) | 22 (47.8%) |
| Retail Trade | 55 (51.4%) | 52 (48.6%) |
| Transportation & Warehousing | 36 (100.0%) | 0 (0.0%) |
| Utilities | 5 (45.5%) | 6 (54.5%) |
| Information | 24 (55.8%) | 19 (44.2%) |
| Finance & Insurance | 12 (17.1%) | 58 (82.9%) |
| Real Estate, Rental & Leasing | 0 (0.0%) | 6 (100.0%) |
| Professional & Scientific | 87 (69.1%) | 39 (30.9%) |
| Enterprise Management | 0 (0.0%) | 0 (0.0%) |
| Administrative & Support | 19 (65.5%) | 10 (34.5%) |
| Educational Services | 35 (15.0%) | 198 (85.0%) |
| Health Care & Social Assistance | 13 (10.9%) | 106 (89.1%) |
| Arts, Entertainment & Recreation | 18 (100.0%) | 0 (0.0%) |
| Accommodation & Food Services | 48 (59.3%) | 33 (40.7%) |
| Public Administration | 11 (44.0%) | 14 (56.0%) |
| Total | 741 (54.2%) | 627 (45.8%) |
Education in Caledonia
School Enrollment in Caledonia
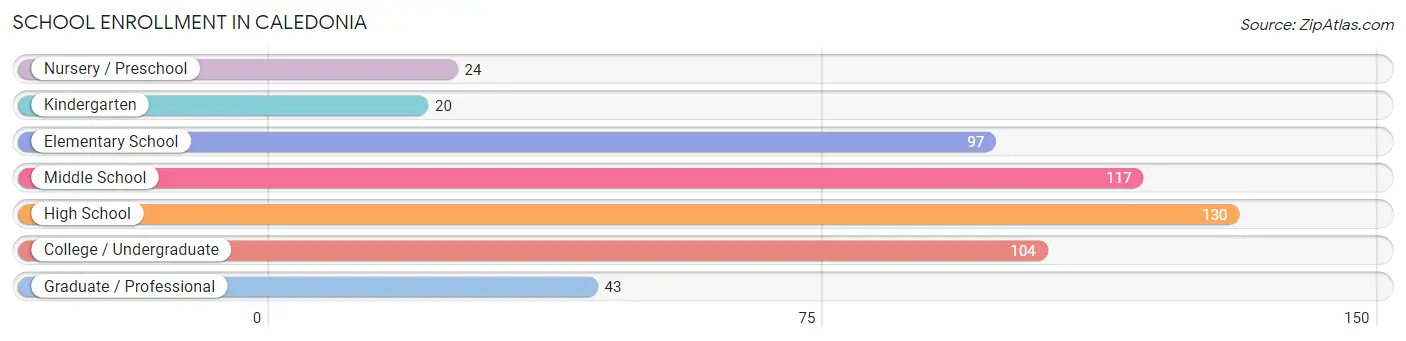
The most common levels of schooling among the 535 students in Caledonia are high school (130 | 24.3%), middle school (117 | 21.9%), and college / undergraduate (104 | 19.4%).
| School Level | # Students | % Students |
| Nursery / Preschool | 24 | 4.5% |
| Kindergarten | 20 | 3.7% |
| Elementary School | 97 | 18.1% |
| Middle School | 117 | 21.9% |
| High School | 130 | 24.3% |
| College / Undergraduate | 104 | 19.4% |
| Graduate / Professional | 43 | 8.0% |
| Total | 535 | 100.0% |
School Enrollment by Age by Funding Source in Caledonia
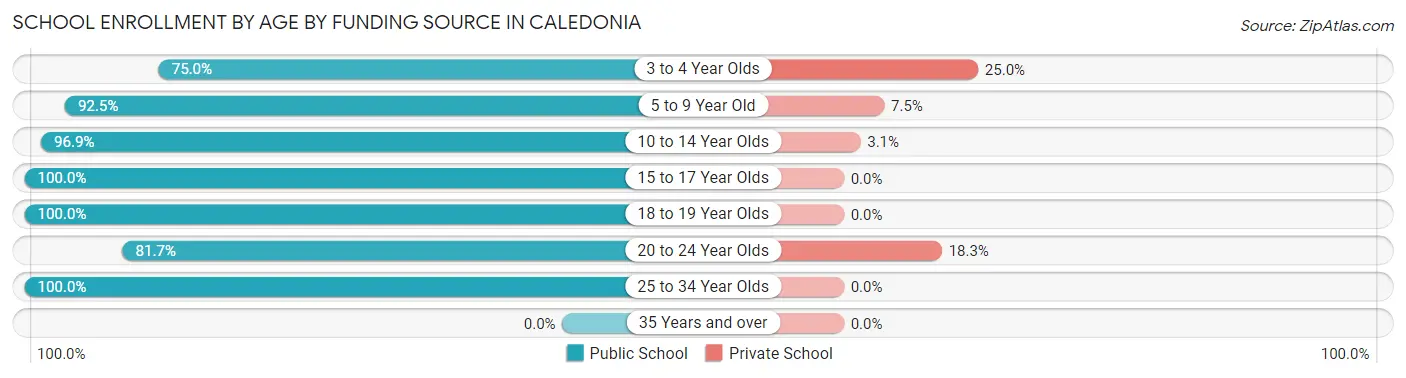
Out of a total of 535 students who are enrolled in schools in Caledonia, 39 (7.3%) attend a private institution, while the remaining 496 (92.7%) are enrolled in public schools. The age group of 3 to 4 year olds has the highest likelihood of being enrolled in private schools, with 6 (25.0% in the age bracket) enrolled. Conversely, the age group of 15 to 17 year olds has the lowest likelihood of being enrolled in a private school, with 92 (100.0% in the age bracket) attending a public institution.
| Age Bracket | Public School | Private School |
| 3 to 4 Year Olds | 18 (75.0%) | 6 (25.0%) |
| 5 to 9 Year Old | 86 (92.5%) | 7 (7.5%) |
| 10 to 14 Year Olds | 157 (96.9%) | 5 (3.1%) |
| 15 to 17 Year Olds | 92 (100.0%) | 0 (0.0%) |
| 18 to 19 Year Olds | 32 (100.0%) | 0 (0.0%) |
| 20 to 24 Year Olds | 94 (81.7%) | 21 (18.3%) |
| 25 to 34 Year Olds | 17 (100.0%) | 0 (0.0%) |
| 35 Years and over | 0 (0.0%) | 0 (0.0%) |
| Total | 496 (92.7%) | 39 (7.3%) |
Educational Attainment by Field of Study in Caledonia
Science & technology (125 | 19.5%), education (92 | 14.3%), business (84 | 13.1%), arts & humanities (76 | 11.8%), and psychology (55 | 8.6%) are the most common fields of study among 642 individuals in Caledonia who have obtained a bachelor's degree or higher.
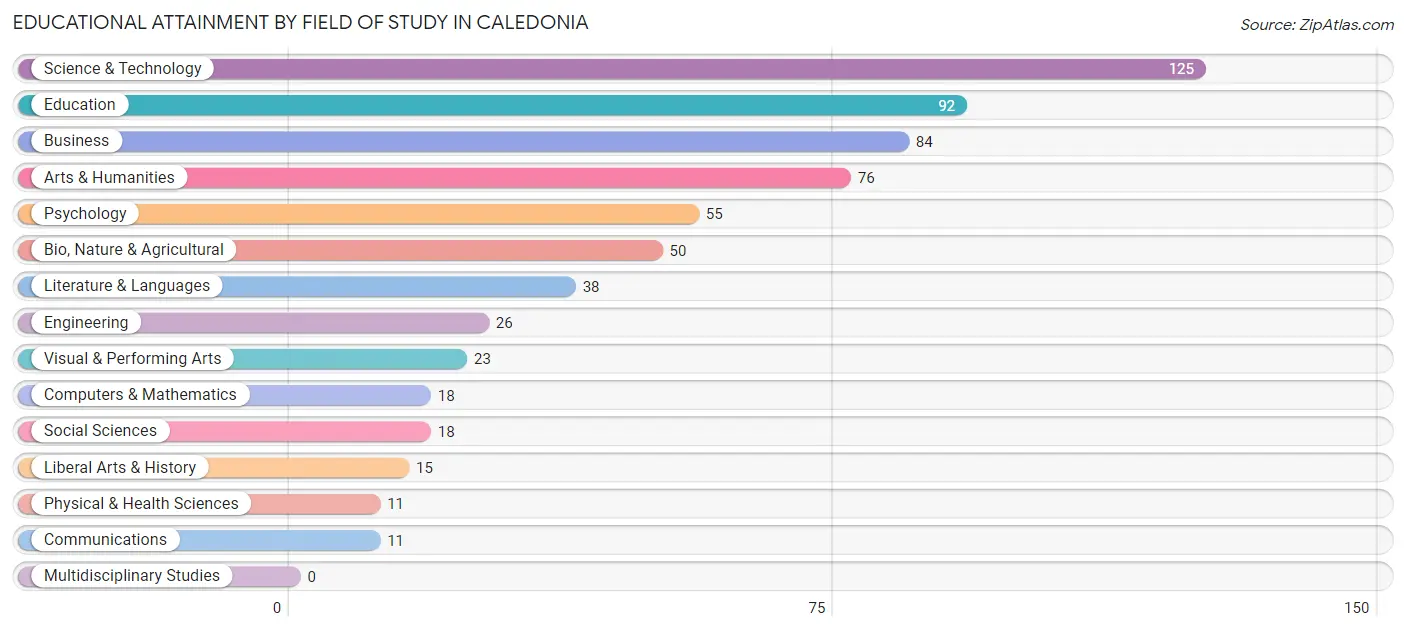
| Field of Study | # Graduates | % Graduates |
| Computers & Mathematics | 18 | 2.8% |
| Bio, Nature & Agricultural | 50 | 7.8% |
| Physical & Health Sciences | 11 | 1.7% |
| Psychology | 55 | 8.6% |
| Social Sciences | 18 | 2.8% |
| Engineering | 26 | 4.1% |
| Multidisciplinary Studies | 0 | 0.0% |
| Science & Technology | 125 | 19.5% |
| Business | 84 | 13.1% |
| Education | 92 | 14.3% |
| Literature & Languages | 38 | 5.9% |
| Liberal Arts & History | 15 | 2.3% |
| Visual & Performing Arts | 23 | 3.6% |
| Communications | 11 | 1.7% |
| Arts & Humanities | 76 | 11.8% |
| Total | 642 | 100.0% |
Transportation & Commute in Caledonia
Vehicle Availability by Sex in Caledonia
The most prevalent vehicle ownership categories in Caledonia are males with 2 vehicles (361, accounting for 48.7%) and females with 2 vehicles (274, making up 58.7%).
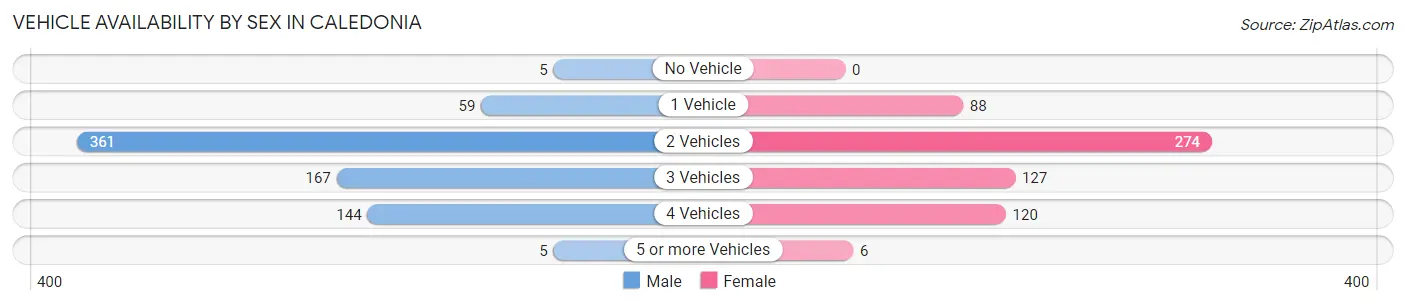
| Vehicles Available | Male | Female |
| No Vehicle | 5 (0.7%) | 0 (0.0%) |
| 1 Vehicle | 59 (8.0%) | 88 (14.3%) |
| 2 Vehicles | 361 (48.7%) | 274 (44.6%) |
| 3 Vehicles | 167 (22.5%) | 127 (20.6%) |
| 4 Vehicles | 144 (19.4%) | 120 (19.5%) |
| 5 or more Vehicles | 5 (0.7%) | 6 (1.0%) |
| Total | 741 (100.0%) | 615 (100.0%) |
Commute Time in Caledonia
The most frequently occuring commute durations in Caledonia are 30 to 34 minutes (183 commuters, 14.5%), 25 to 29 minutes (153 commuters, 12.1%), and less than 5 minutes (145 commuters, 11.5%).
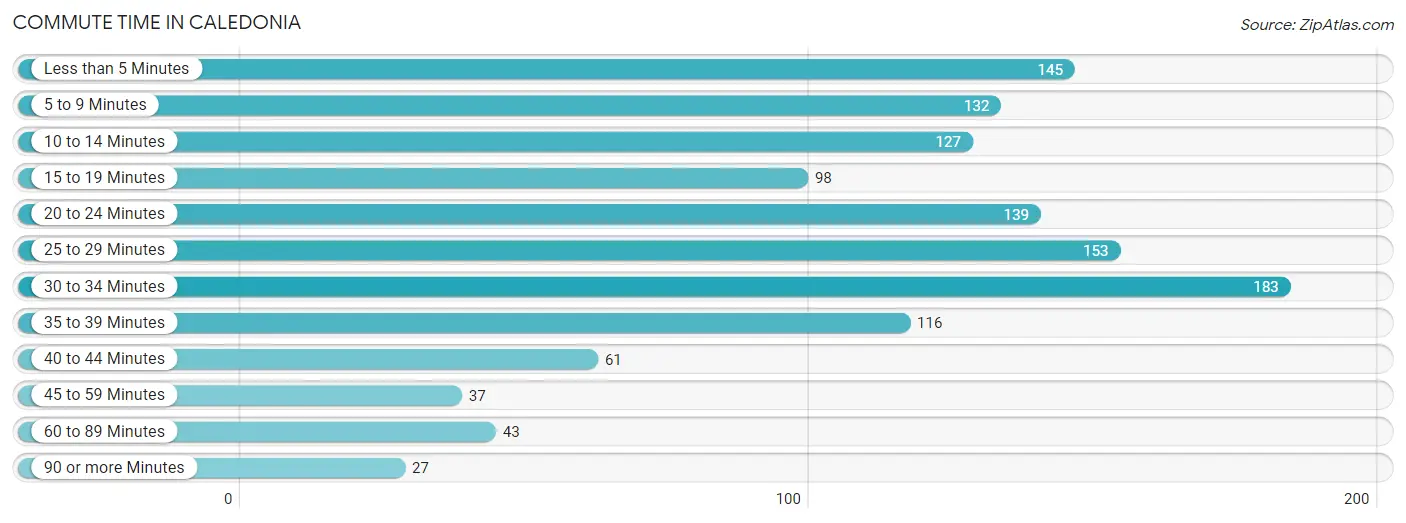
| Commute Time | # Commuters | % Commuters |
| Less than 5 Minutes | 145 | 11.5% |
| 5 to 9 Minutes | 132 | 10.5% |
| 10 to 14 Minutes | 127 | 10.1% |
| 15 to 19 Minutes | 98 | 7.8% |
| 20 to 24 Minutes | 139 | 11.0% |
| 25 to 29 Minutes | 153 | 12.1% |
| 30 to 34 Minutes | 183 | 14.5% |
| 35 to 39 Minutes | 116 | 9.2% |
| 40 to 44 Minutes | 61 | 4.8% |
| 45 to 59 Minutes | 37 | 2.9% |
| 60 to 89 Minutes | 43 | 3.4% |
| 90 or more Minutes | 27 | 2.1% |
Commute Time by Sex in Caledonia
The most common commute times in Caledonia are 10 to 14 minutes (103 commuters, 14.6%) for males and 30 to 34 minutes (95 commuters, 17.1%) for females.
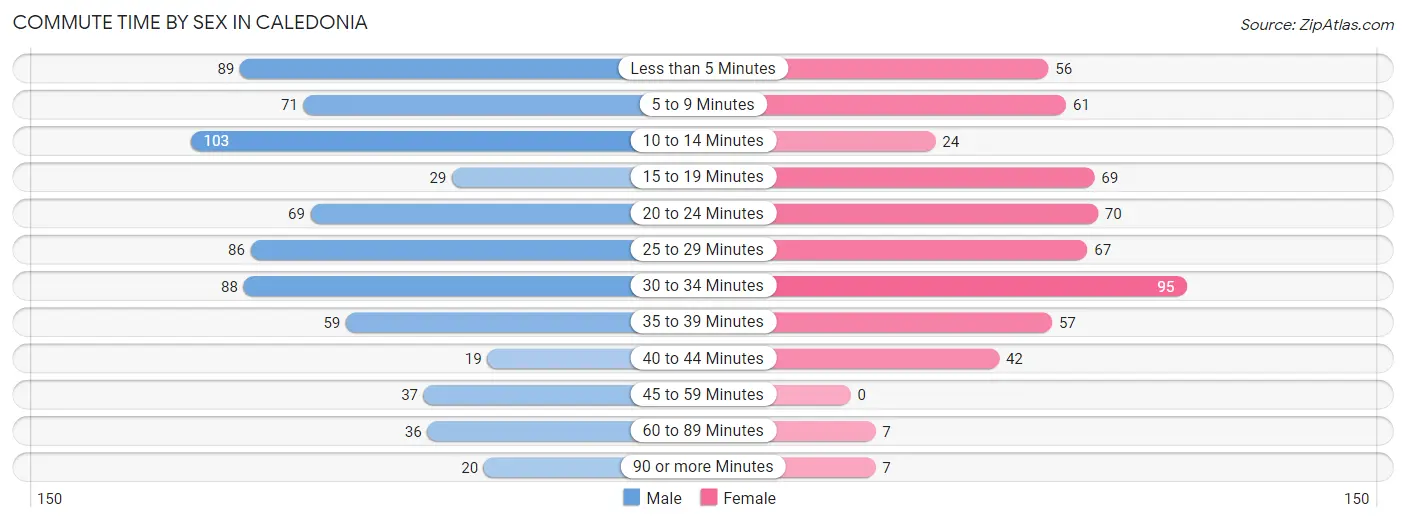
| Commute Time | Male | Female |
| Less than 5 Minutes | 89 (12.6%) | 56 (10.1%) |
| 5 to 9 Minutes | 71 (10.1%) | 61 (11.0%) |
| 10 to 14 Minutes | 103 (14.6%) | 24 (4.3%) |
| 15 to 19 Minutes | 29 (4.1%) | 69 (12.4%) |
| 20 to 24 Minutes | 69 (9.8%) | 70 (12.6%) |
| 25 to 29 Minutes | 86 (12.2%) | 67 (12.1%) |
| 30 to 34 Minutes | 88 (12.5%) | 95 (17.1%) |
| 35 to 39 Minutes | 59 (8.4%) | 57 (10.3%) |
| 40 to 44 Minutes | 19 (2.7%) | 42 (7.6%) |
| 45 to 59 Minutes | 37 (5.2%) | 0 (0.0%) |
| 60 to 89 Minutes | 36 (5.1%) | 7 (1.3%) |
| 90 or more Minutes | 20 (2.8%) | 7 (1.3%) |
Time of Departure to Work by Sex in Caledonia
The most frequent times of departure to work in Caledonia are 5:30 AM to 5:59 AM (110, 15.6%) for males and 7:30 AM to 7:59 AM (101, 18.2%) for females.
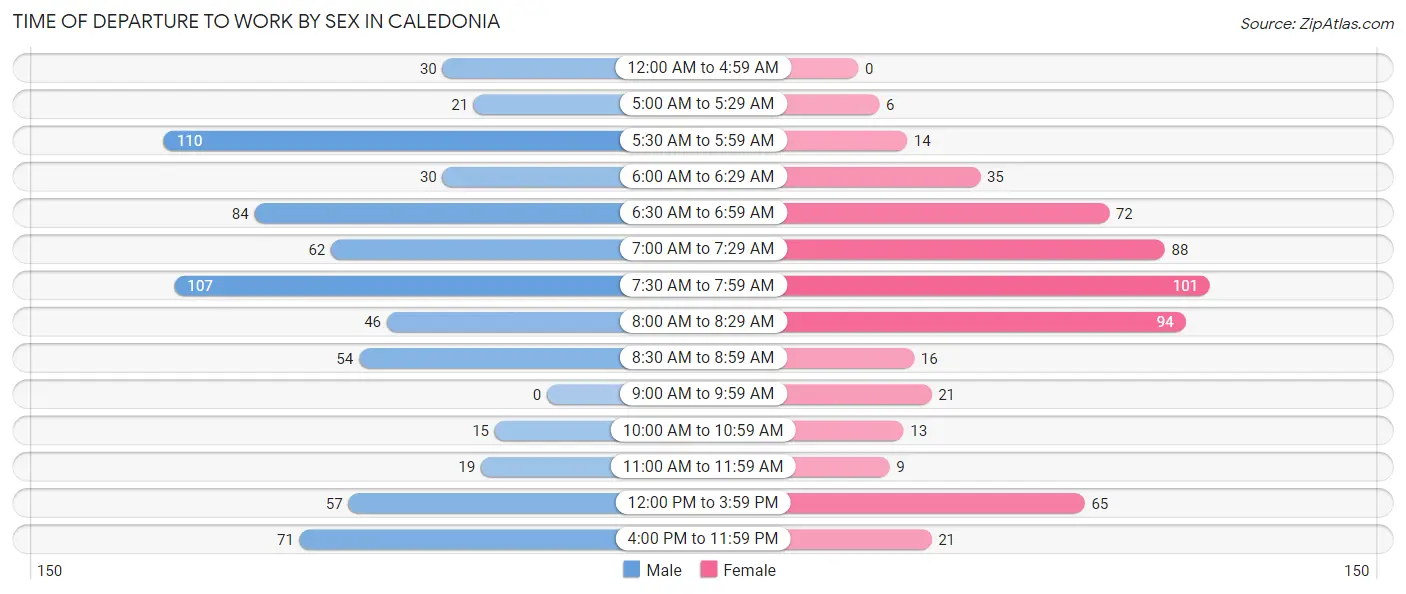
| Time of Departure | Male | Female |
| 12:00 AM to 4:59 AM | 30 (4.3%) | 0 (0.0%) |
| 5:00 AM to 5:29 AM | 21 (3.0%) | 6 (1.1%) |
| 5:30 AM to 5:59 AM | 110 (15.6%) | 14 (2.5%) |
| 6:00 AM to 6:29 AM | 30 (4.3%) | 35 (6.3%) |
| 6:30 AM to 6:59 AM | 84 (11.9%) | 72 (13.0%) |
| 7:00 AM to 7:29 AM | 62 (8.8%) | 88 (15.9%) |
| 7:30 AM to 7:59 AM | 107 (15.2%) | 101 (18.2%) |
| 8:00 AM to 8:29 AM | 46 (6.5%) | 94 (16.9%) |
| 8:30 AM to 8:59 AM | 54 (7.6%) | 16 (2.9%) |
| 9:00 AM to 9:59 AM | 0 (0.0%) | 21 (3.8%) |
| 10:00 AM to 10:59 AM | 15 (2.1%) | 13 (2.3%) |
| 11:00 AM to 11:59 AM | 19 (2.7%) | 9 (1.6%) |
| 12:00 PM to 3:59 PM | 57 (8.1%) | 65 (11.7%) |
| 4:00 PM to 11:59 PM | 71 (10.1%) | 21 (3.8%) |
| Total | 706 (100.0%) | 555 (100.0%) |
Housing Occupancy in Caledonia
Occupancy by Ownership in Caledonia
Of the total 985 dwellings in Caledonia, owner-occupied units account for 713 (72.4%), while renter-occupied units make up 272 (27.6%).
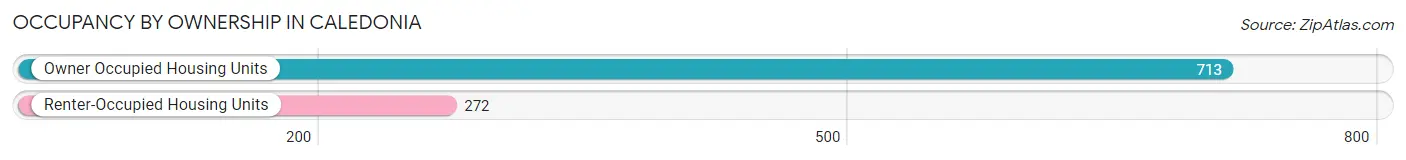
| Occupancy | # Housing Units | % Housing Units |
| Owner Occupied Housing Units | 713 | 72.4% |
| Renter-Occupied Housing Units | 272 | 27.6% |
| Total Occupied Housing Units | 985 | 100.0% |
Occupancy by Household Size in Caledonia
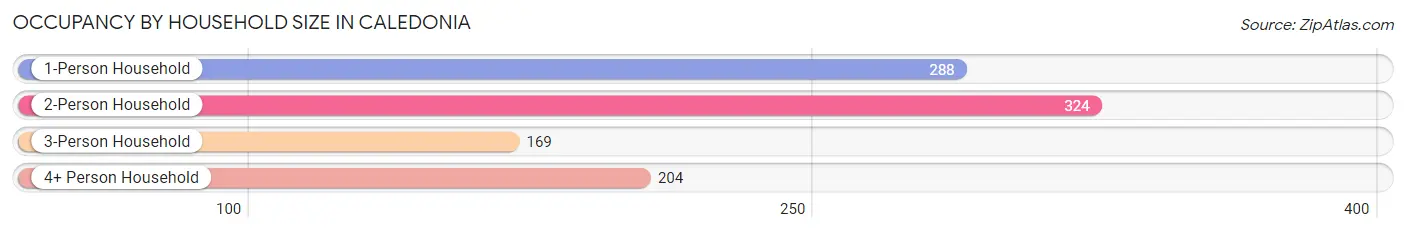
| Household Size | # Housing Units | % Housing Units |
| 1-Person Household | 288 | 29.2% |
| 2-Person Household | 324 | 32.9% |
| 3-Person Household | 169 | 17.2% |
| 4+ Person Household | 204 | 20.7% |
| Total Housing Units | 985 | 100.0% |
Occupancy by Ownership by Household Size in Caledonia
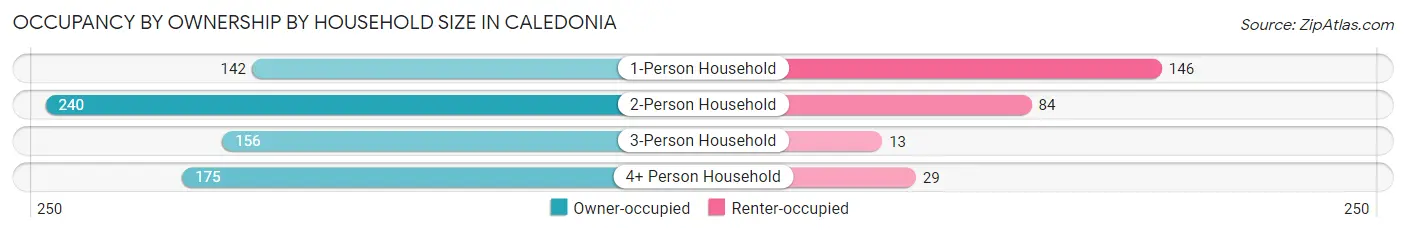
| Household Size | Owner-occupied | Renter-occupied |
| 1-Person Household | 142 (49.3%) | 146 (50.7%) |
| 2-Person Household | 240 (74.1%) | 84 (25.9%) |
| 3-Person Household | 156 (92.3%) | 13 (7.7%) |
| 4+ Person Household | 175 (85.8%) | 29 (14.2%) |
| Total Housing Units | 713 (72.4%) | 272 (27.6%) |
Occupancy by Educational Attainment in Caledonia
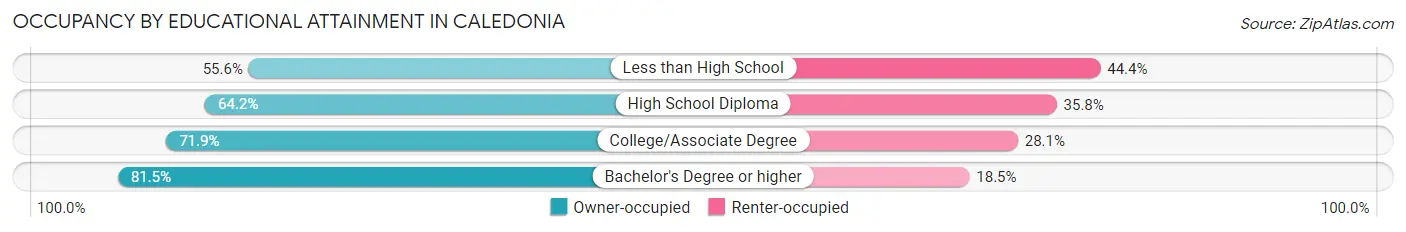
| Household Size | Owner-occupied | Renter-occupied |
| Less than High School | 35 (55.6%) | 28 (44.4%) |
| High School Diploma | 149 (64.2%) | 83 (35.8%) |
| College/Associate Degree | 251 (71.9%) | 98 (28.1%) |
| Bachelor's Degree or higher | 278 (81.5%) | 63 (18.5%) |
Occupancy by Age of Householder in Caledonia
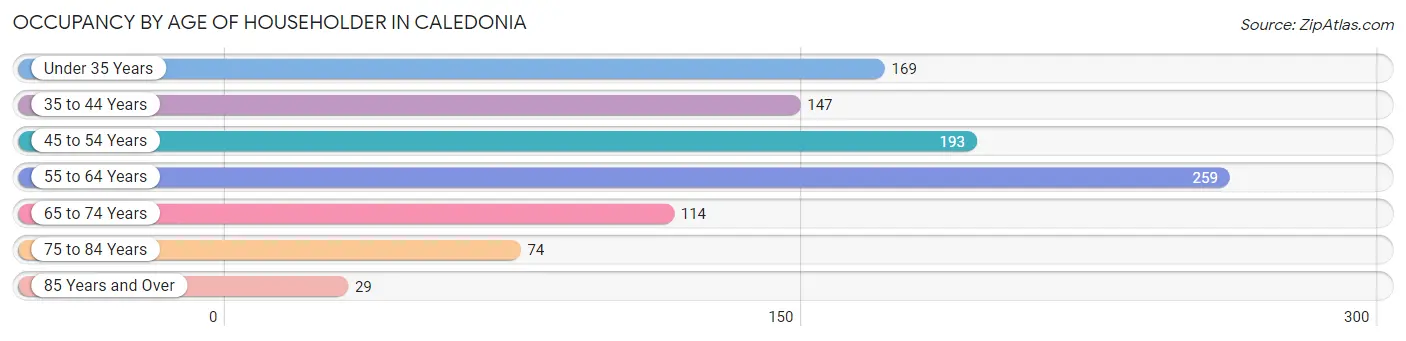
| Age Bracket | # Households | % Households |
| Under 35 Years | 169 | 17.2% |
| 35 to 44 Years | 147 | 14.9% |
| 45 to 54 Years | 193 | 19.6% |
| 55 to 64 Years | 259 | 26.3% |
| 65 to 74 Years | 114 | 11.6% |
| 75 to 84 Years | 74 | 7.5% |
| 85 Years and Over | 29 | 2.9% |
| Total | 985 | 100.0% |
Housing Finances in Caledonia
Median Income by Occupancy in Caledonia
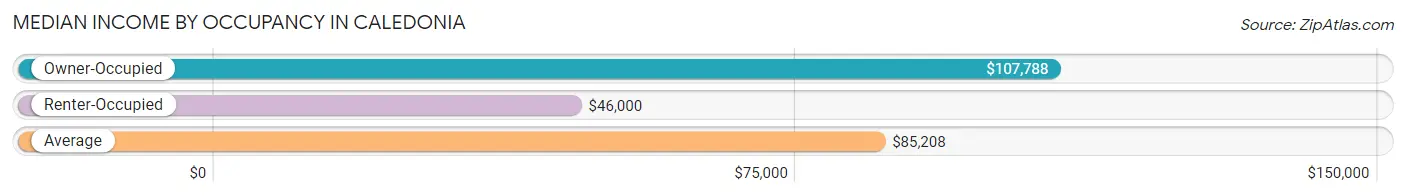
| Occupancy Type | # Households | Median Income |
| Owner-Occupied | 713 (72.4%) | $107,788 |
| Renter-Occupied | 272 (27.6%) | $46,000 |
| Average | 985 (100.0%) | $85,208 |
Occupancy by Householder Income Bracket in Caledonia
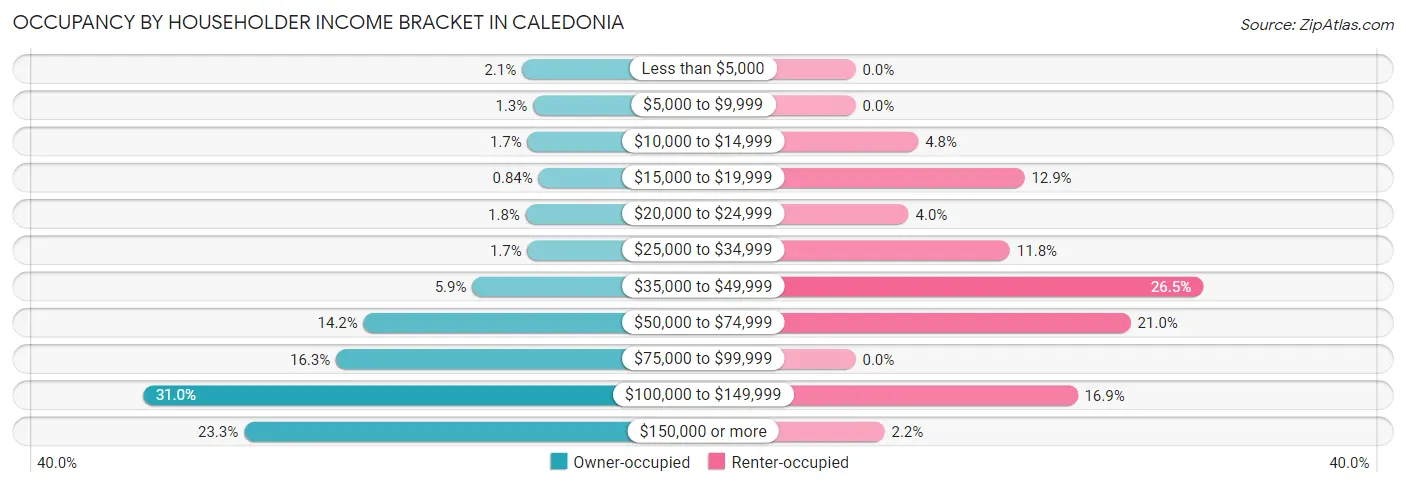
| Income Bracket | Owner-occupied | Renter-occupied |
| Less than $5,000 | 15 (2.1%) | 0 (0.0%) |
| $5,000 to $9,999 | 9 (1.3%) | 0 (0.0%) |
| $10,000 to $14,999 | 12 (1.7%) | 13 (4.8%) |
| $15,000 to $19,999 | 6 (0.8%) | 35 (12.9%) |
| $20,000 to $24,999 | 13 (1.8%) | 11 (4.0%) |
| $25,000 to $34,999 | 12 (1.7%) | 32 (11.8%) |
| $35,000 to $49,999 | 42 (5.9%) | 72 (26.5%) |
| $50,000 to $74,999 | 101 (14.2%) | 57 (21.0%) |
| $75,000 to $99,999 | 116 (16.3%) | 0 (0.0%) |
| $100,000 to $149,999 | 221 (31.0%) | 46 (16.9%) |
| $150,000 or more | 166 (23.3%) | 6 (2.2%) |
| Total | 713 (100.0%) | 272 (100.0%) |
Monthly Housing Cost Tiers in Caledonia
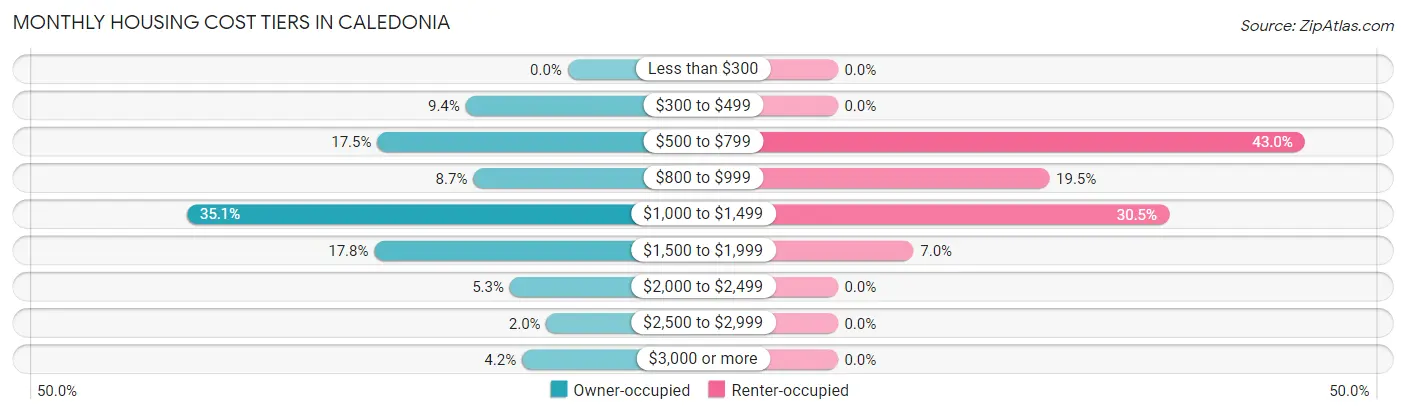
| Monthly Cost | Owner-occupied | Renter-occupied |
| Less than $300 | 0 (0.0%) | 0 (0.0%) |
| $300 to $499 | 67 (9.4%) | 0 (0.0%) |
| $500 to $799 | 125 (17.5%) | 117 (43.0%) |
| $800 to $999 | 62 (8.7%) | 53 (19.5%) |
| $1,000 to $1,499 | 250 (35.1%) | 83 (30.5%) |
| $1,500 to $1,999 | 127 (17.8%) | 19 (7.0%) |
| $2,000 to $2,499 | 38 (5.3%) | 0 (0.0%) |
| $2,500 to $2,999 | 14 (2.0%) | 0 (0.0%) |
| $3,000 or more | 30 (4.2%) | 0 (0.0%) |
| Total | 713 (100.0%) | 272 (100.0%) |
Physical Housing Characteristics in Caledonia
Housing Structures in Caledonia
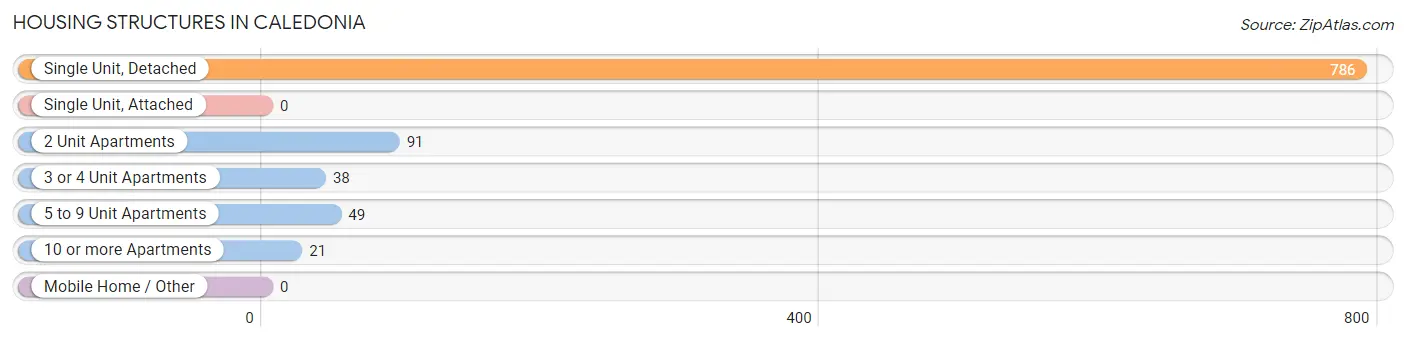
| Structure Type | # Housing Units | % Housing Units |
| Single Unit, Detached | 786 | 79.8% |
| Single Unit, Attached | 0 | 0.0% |
| 2 Unit Apartments | 91 | 9.2% |
| 3 or 4 Unit Apartments | 38 | 3.9% |
| 5 to 9 Unit Apartments | 49 | 5.0% |
| 10 or more Apartments | 21 | 2.1% |
| Mobile Home / Other | 0 | 0.0% |
| Total | 985 | 100.0% |
Housing Structures by Occupancy in Caledonia
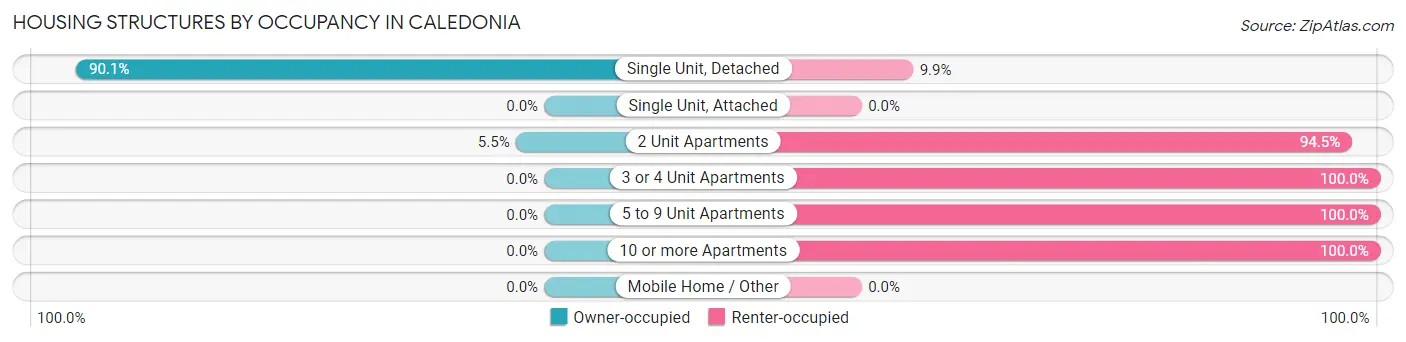
| Structure Type | Owner-occupied | Renter-occupied |
| Single Unit, Detached | 708 (90.1%) | 78 (9.9%) |
| Single Unit, Attached | 0 (0.0%) | 0 (0.0%) |
| 2 Unit Apartments | 5 (5.5%) | 86 (94.5%) |
| 3 or 4 Unit Apartments | 0 (0.0%) | 38 (100.0%) |
| 5 to 9 Unit Apartments | 0 (0.0%) | 49 (100.0%) |
| 10 or more Apartments | 0 (0.0%) | 21 (100.0%) |
| Mobile Home / Other | 0 (0.0%) | 0 (0.0%) |
| Total | 713 (72.4%) | 272 (27.6%) |
Housing Structures by Number of Rooms in Caledonia
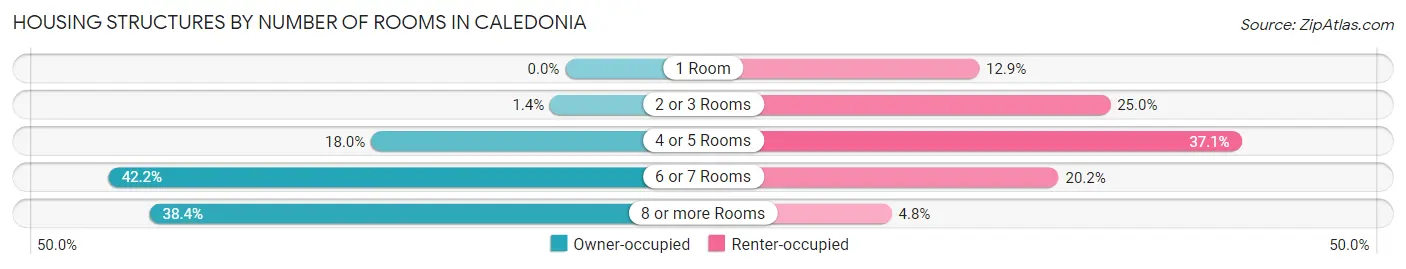
| Number of Rooms | Owner-occupied | Renter-occupied |
| 1 Room | 0 (0.0%) | 35 (12.9%) |
| 2 or 3 Rooms | 10 (1.4%) | 68 (25.0%) |
| 4 or 5 Rooms | 128 (17.9%) | 101 (37.1%) |
| 6 or 7 Rooms | 301 (42.2%) | 55 (20.2%) |
| 8 or more Rooms | 274 (38.4%) | 13 (4.8%) |
| Total | 713 (100.0%) | 272 (100.0%) |
Housing Structure by Heating Type in Caledonia
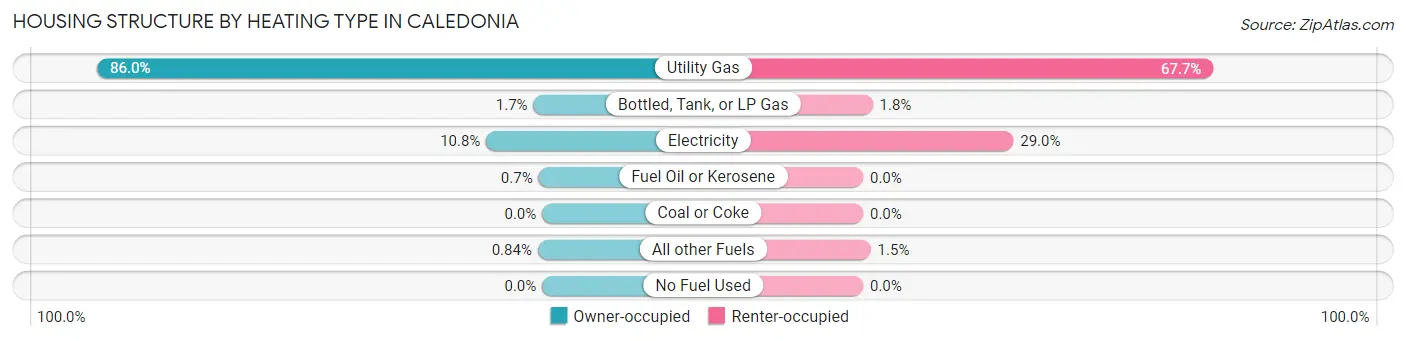
| Heating Type | Owner-occupied | Renter-occupied |
| Utility Gas | 613 (86.0%) | 184 (67.6%) |
| Bottled, Tank, or LP Gas | 12 (1.7%) | 5 (1.8%) |
| Electricity | 77 (10.8%) | 79 (29.0%) |
| Fuel Oil or Kerosene | 5 (0.7%) | 0 (0.0%) |
| Coal or Coke | 0 (0.0%) | 0 (0.0%) |
| All other Fuels | 6 (0.8%) | 4 (1.5%) |
| No Fuel Used | 0 (0.0%) | 0 (0.0%) |
| Total | 713 (100.0%) | 272 (100.0%) |
Household Vehicle Usage in Caledonia
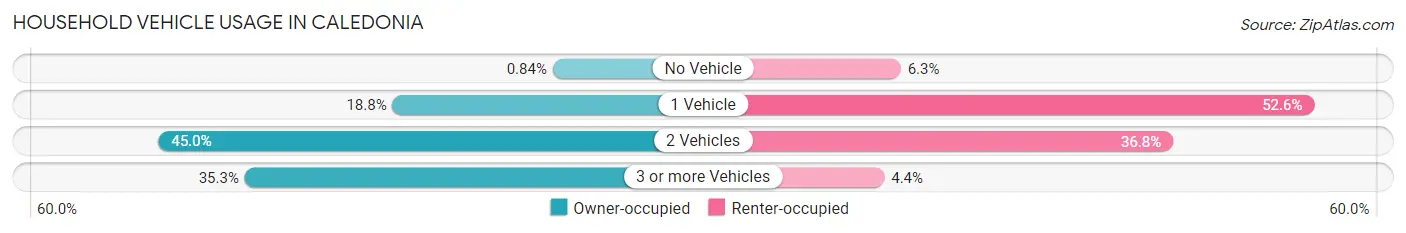
| Vehicles per Household | Owner-occupied | Renter-occupied |
| No Vehicle | 6 (0.8%) | 17 (6.2%) |
| 1 Vehicle | 134 (18.8%) | 143 (52.6%) |
| 2 Vehicles | 321 (45.0%) | 100 (36.8%) |
| 3 or more Vehicles | 252 (35.3%) | 12 (4.4%) |
| Total | 713 (100.0%) | 272 (100.0%) |
Real Estate & Mortgages in Caledonia
Real Estate and Mortgage Overview in Caledonia
| Characteristic | Without Mortgage | With Mortgage |
| Housing Units | 223 | 490 |
| Median Property Value | $154,800 | $157,300 |
| Median Household Income | $87,656 | $134 |
| Monthly Housing Costs | $713 | $30 |
| Real Estate Taxes | $4,650 | $0 |
Property Value by Mortgage Status in Caledonia
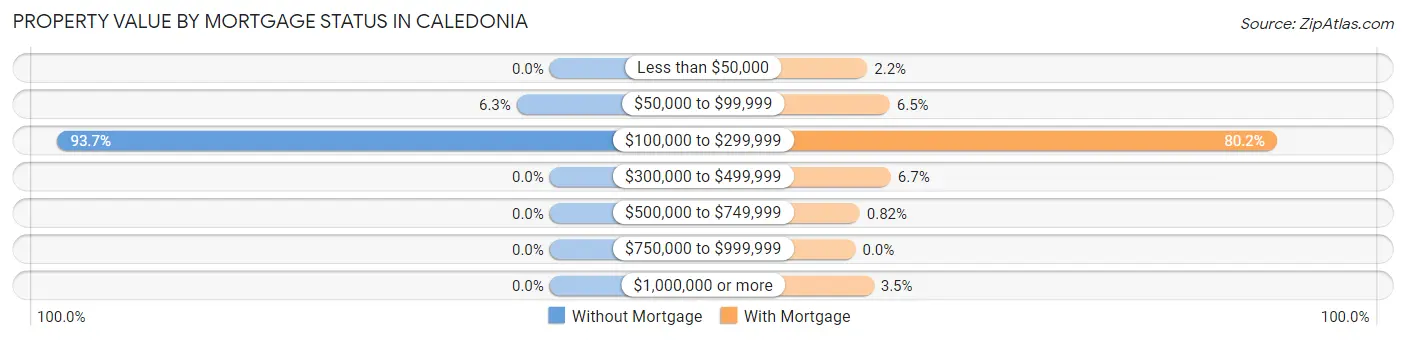
| Property Value | Without Mortgage | With Mortgage |
| Less than $50,000 | 0 (0.0%) | 11 (2.2%) |
| $50,000 to $99,999 | 14 (6.3%) | 32 (6.5%) |
| $100,000 to $299,999 | 209 (93.7%) | 393 (80.2%) |
| $300,000 to $499,999 | 0 (0.0%) | 33 (6.7%) |
| $500,000 to $749,999 | 0 (0.0%) | 4 (0.8%) |
| $750,000 to $999,999 | 0 (0.0%) | 0 (0.0%) |
| $1,000,000 or more | 0 (0.0%) | 17 (3.5%) |
| Total | 223 (100.0%) | 490 (100.0%) |
Household Income by Mortgage Status in Caledonia
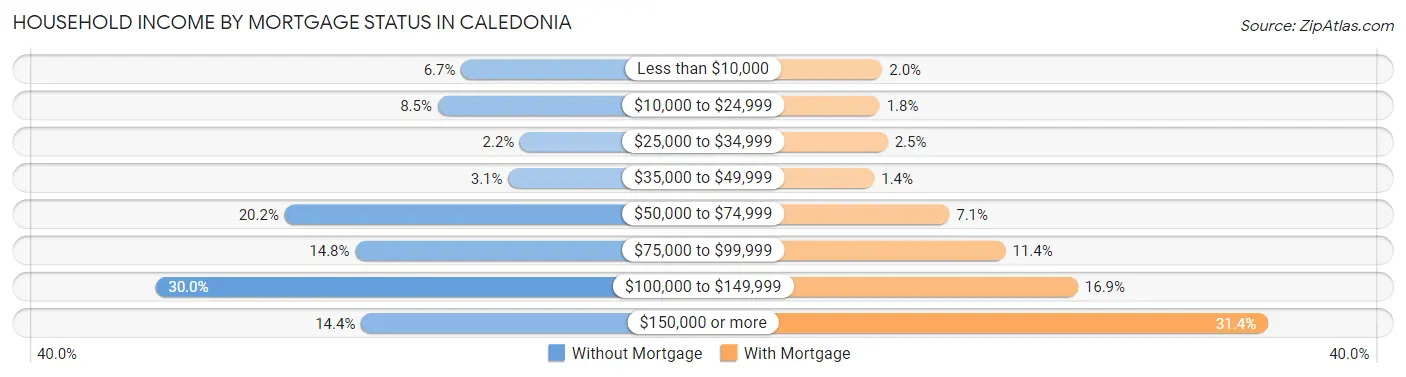
| Household Income | Without Mortgage | With Mortgage |
| Less than $10,000 | 15 (6.7%) | 10 (2.0%) |
| $10,000 to $24,999 | 19 (8.5%) | 9 (1.8%) |
| $25,000 to $34,999 | 5 (2.2%) | 12 (2.5%) |
| $35,000 to $49,999 | 7 (3.1%) | 7 (1.4%) |
| $50,000 to $74,999 | 45 (20.2%) | 35 (7.1%) |
| $75,000 to $99,999 | 33 (14.8%) | 56 (11.4%) |
| $100,000 to $149,999 | 67 (30.0%) | 83 (16.9%) |
| $150,000 or more | 32 (14.3%) | 154 (31.4%) |
| Total | 223 (100.0%) | 490 (100.0%) |
Property Value to Household Income Ratio in Caledonia
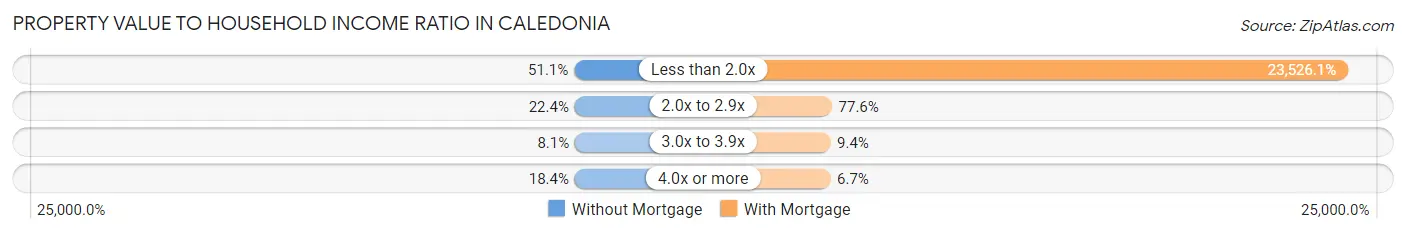
| Value-to-Income Ratio | Without Mortgage | With Mortgage |
| Less than 2.0x | 114 (51.1%) | 115,278 (23,526.1%) |
| 2.0x to 2.9x | 50 (22.4%) | 380 (77.5%) |
| 3.0x to 3.9x | 18 (8.1%) | 46 (9.4%) |
| 4.0x or more | 41 (18.4%) | 33 (6.7%) |
| Total | 223 (100.0%) | 490 (100.0%) |
Real Estate Taxes by Mortgage Status in Caledonia
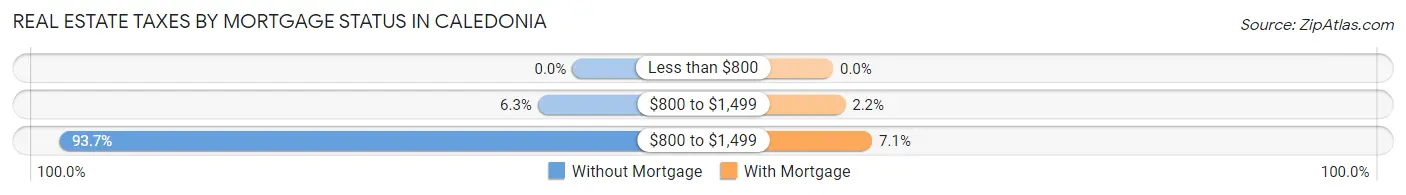
| Property Taxes | Without Mortgage | With Mortgage |
| Less than $800 | 0 (0.0%) | 0 (0.0%) |
| $800 to $1,499 | 14 (6.3%) | 11 (2.2%) |
| $800 to $1,499 | 209 (93.7%) | 35 (7.1%) |
| Total | 223 (100.0%) | 490 (100.0%) |
Health & Disability in Caledonia
Health Insurance Coverage by Age in Caledonia
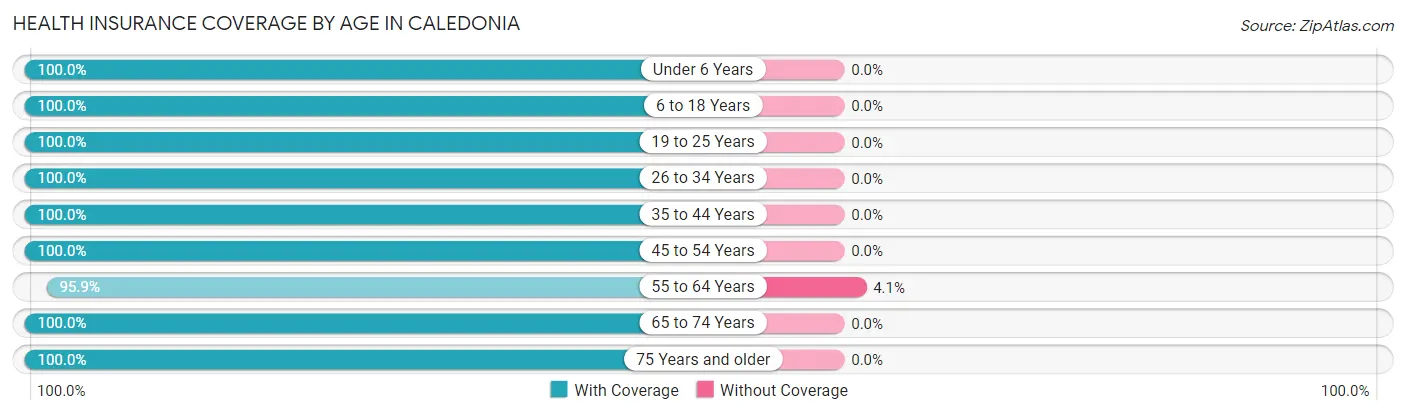
| Age Bracket | With Coverage | Without Coverage |
| Under 6 Years | 113 (100.0%) | 0 (0.0%) |
| 6 to 18 Years | 369 (100.0%) | 0 (0.0%) |
| 19 to 25 Years | 344 (100.0%) | 0 (0.0%) |
| 26 to 34 Years | 265 (100.0%) | 0 (0.0%) |
| 35 to 44 Years | 269 (100.0%) | 0 (0.0%) |
| 45 to 54 Years | 348 (100.0%) | 0 (0.0%) |
| 55 to 64 Years | 352 (95.9%) | 15 (4.1%) |
| 65 to 74 Years | 179 (100.0%) | 0 (0.0%) |
| 75 Years and older | 131 (100.0%) | 0 (0.0%) |
| Total | 2,370 (99.4%) | 15 (0.6%) |
Health Insurance Coverage by Citizenship Status in Caledonia
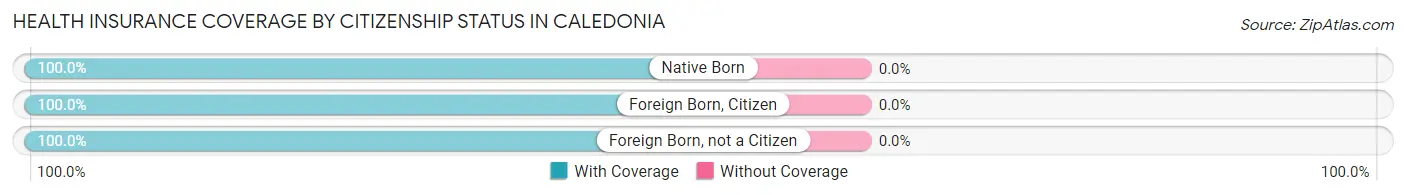
| Citizenship Status | With Coverage | Without Coverage |
| Native Born | 113 (100.0%) | 0 (0.0%) |
| Foreign Born, Citizen | 369 (100.0%) | 0 (0.0%) |
| Foreign Born, not a Citizen | 344 (100.0%) | 0 (0.0%) |
Health Insurance Coverage by Household Income in Caledonia
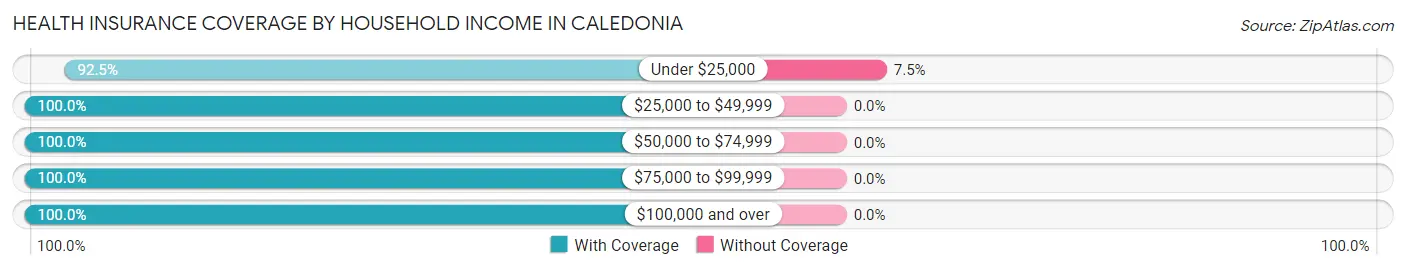
| Household Income | With Coverage | Without Coverage |
| Under $25,000 | 185 (92.5%) | 15 (7.5%) |
| $25,000 to $49,999 | 257 (100.0%) | 0 (0.0%) |
| $50,000 to $74,999 | 333 (100.0%) | 0 (0.0%) |
| $75,000 to $99,999 | 260 (100.0%) | 0 (0.0%) |
| $100,000 and over | 1,325 (100.0%) | 0 (0.0%) |
Public vs Private Health Insurance Coverage by Age in Caledonia
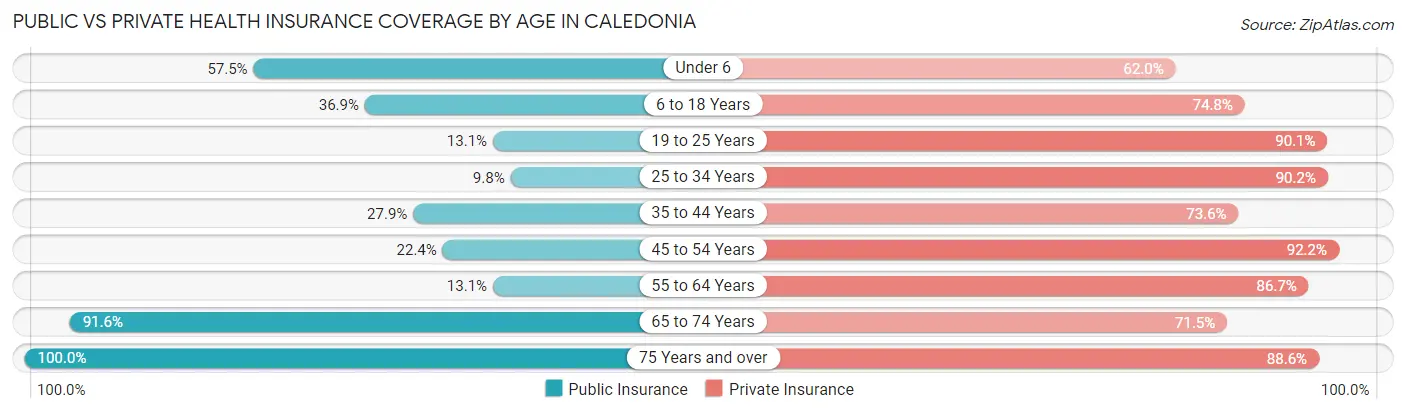
| Age Bracket | Public Insurance | Private Insurance |
| Under 6 | 65 (57.5%) | 70 (62.0%) |
| 6 to 18 Years | 136 (36.9%) | 276 (74.8%) |
| 19 to 25 Years | 45 (13.1%) | 310 (90.1%) |
| 25 to 34 Years | 26 (9.8%) | 239 (90.2%) |
| 35 to 44 Years | 75 (27.9%) | 198 (73.6%) |
| 45 to 54 Years | 78 (22.4%) | 321 (92.2%) |
| 55 to 64 Years | 48 (13.1%) | 318 (86.7%) |
| 65 to 74 Years | 164 (91.6%) | 128 (71.5%) |
| 75 Years and over | 131 (100.0%) | 116 (88.5%) |
| Total | 768 (32.2%) | 1,976 (82.9%) |
Disability Status by Sex by Age in Caledonia
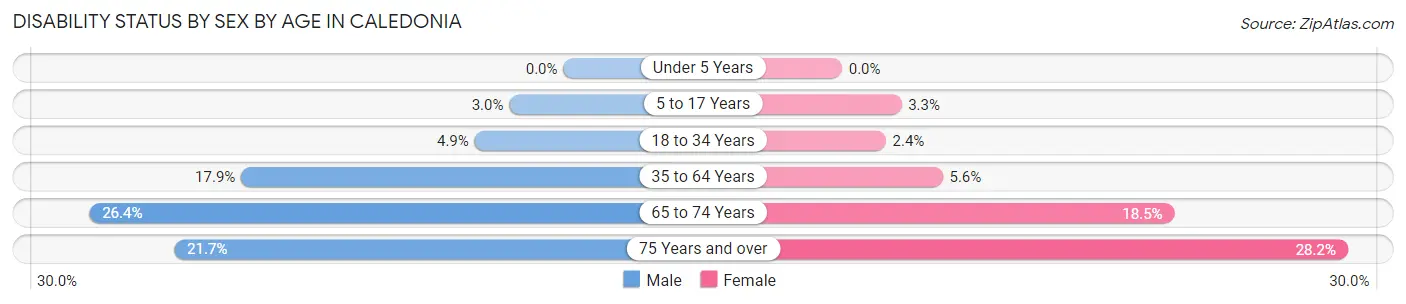
| Age Bracket | Male | Female |
| Under 5 Years | 0 (0.0%) | 0 (0.0%) |
| 5 to 17 Years | 5 (3.0%) | 6 (3.3%) |
| 18 to 34 Years | 17 (4.9%) | 7 (2.4%) |
| 35 to 64 Years | 87 (17.9%) | 28 (5.6%) |
| 65 to 74 Years | 33 (26.4%) | 10 (18.5%) |
| 75 Years and over | 13 (21.7%) | 20 (28.2%) |
Disability Class by Sex by Age in Caledonia
Disability Class: Hearing Difficulty
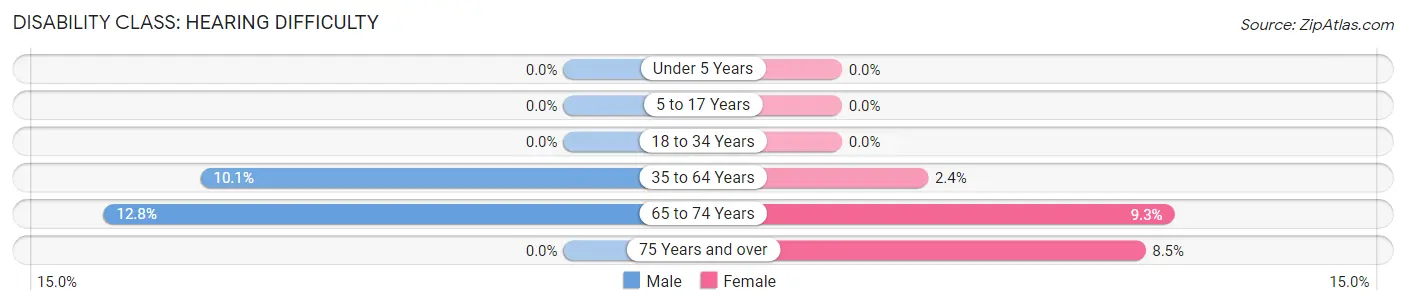
| Age Bracket | Male | Female |
| Under 5 Years | 0 (0.0%) | 0 (0.0%) |
| 5 to 17 Years | 0 (0.0%) | 0 (0.0%) |
| 18 to 34 Years | 0 (0.0%) | 0 (0.0%) |
| 35 to 64 Years | 49 (10.1%) | 12 (2.4%) |
| 65 to 74 Years | 16 (12.8%) | 5 (9.3%) |
| 75 Years and over | 0 (0.0%) | 6 (8.5%) |
Disability Class: Vision Difficulty
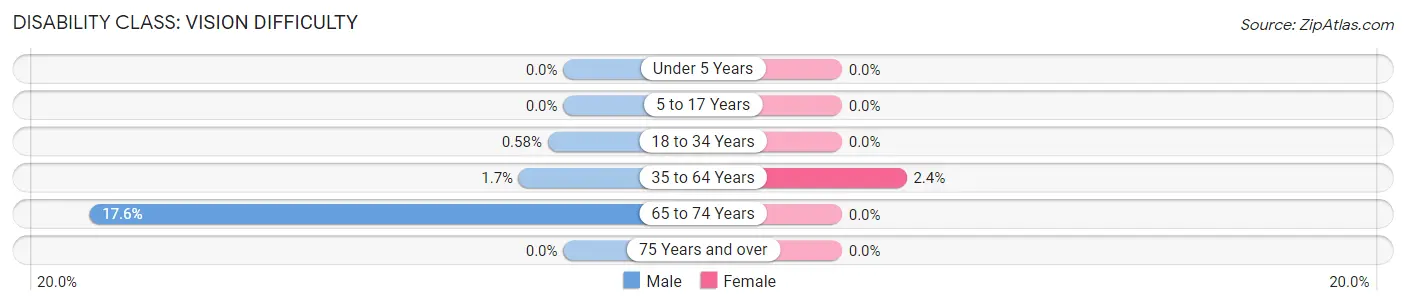
| Age Bracket | Male | Female |
| Under 5 Years | 0 (0.0%) | 0 (0.0%) |
| 5 to 17 Years | 0 (0.0%) | 0 (0.0%) |
| 18 to 34 Years | 2 (0.6%) | 0 (0.0%) |
| 35 to 64 Years | 8 (1.7%) | 12 (2.4%) |
| 65 to 74 Years | 22 (17.6%) | 0 (0.0%) |
| 75 Years and over | 0 (0.0%) | 0 (0.0%) |
Disability Class: Cognitive Difficulty
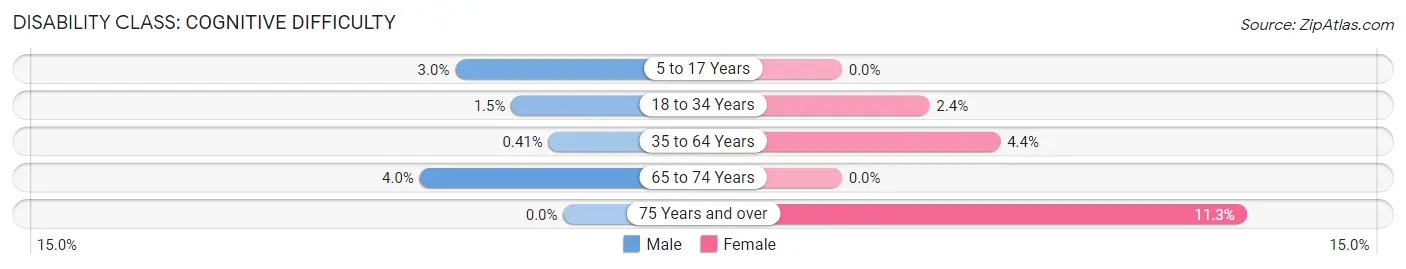
| Age Bracket | Male | Female |
| 5 to 17 Years | 5 (3.0%) | 0 (0.0%) |
| 18 to 34 Years | 5 (1.5%) | 7 (2.4%) |
| 35 to 64 Years | 2 (0.4%) | 22 (4.4%) |
| 65 to 74 Years | 5 (4.0%) | 0 (0.0%) |
| 75 Years and over | 0 (0.0%) | 8 (11.3%) |
Disability Class: Ambulatory Difficulty
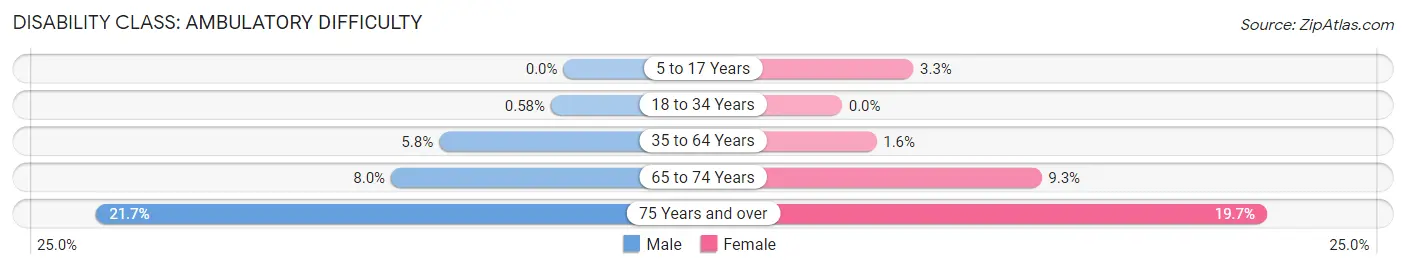
| Age Bracket | Male | Female |
| 5 to 17 Years | 0 (0.0%) | 6 (3.3%) |
| 18 to 34 Years | 2 (0.6%) | 0 (0.0%) |
| 35 to 64 Years | 28 (5.8%) | 8 (1.6%) |
| 65 to 74 Years | 10 (8.0%) | 5 (9.3%) |
| 75 Years and over | 13 (21.7%) | 14 (19.7%) |
Disability Class: Self-Care Difficulty
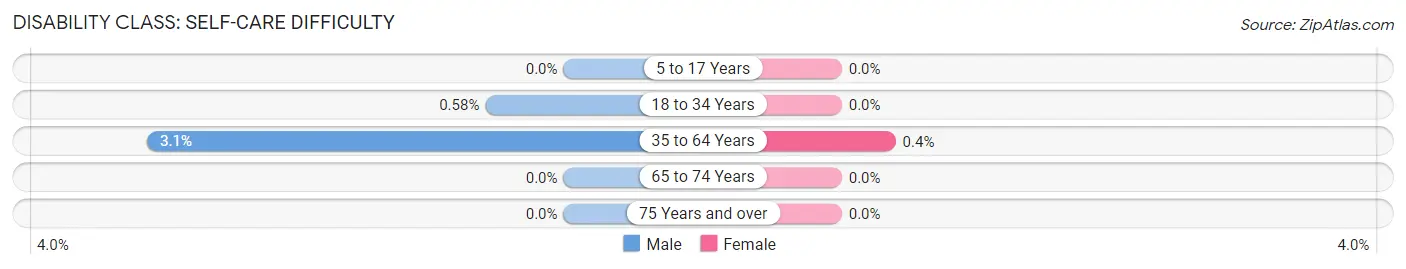
| Age Bracket | Male | Female |
| 5 to 17 Years | 0 (0.0%) | 0 (0.0%) |
| 18 to 34 Years | 2 (0.6%) | 0 (0.0%) |
| 35 to 64 Years | 15 (3.1%) | 2 (0.4%) |
| 65 to 74 Years | 0 (0.0%) | 0 (0.0%) |
| 75 Years and over | 0 (0.0%) | 0 (0.0%) |
Technology Access in Caledonia
Computing Device Access in Caledonia
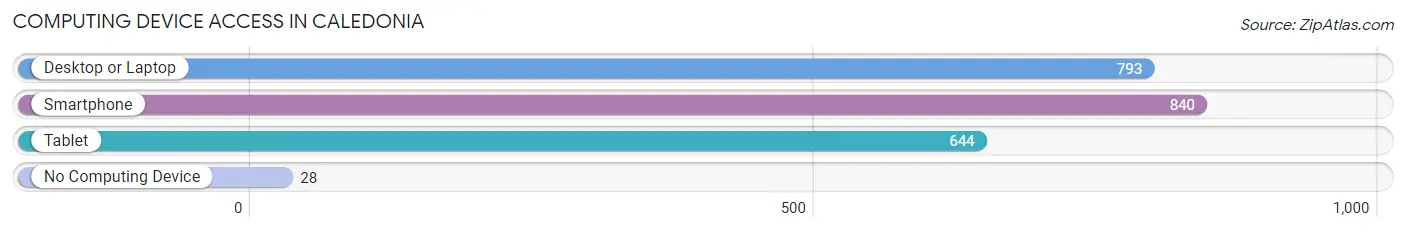
| Device Type | # Households | % Households |
| Desktop or Laptop | 793 | 80.5% |
| Smartphone | 840 | 85.3% |
| Tablet | 644 | 65.4% |
| No Computing Device | 28 | 2.8% |
| Total | 985 | 100.0% |
Internet Access in Caledonia
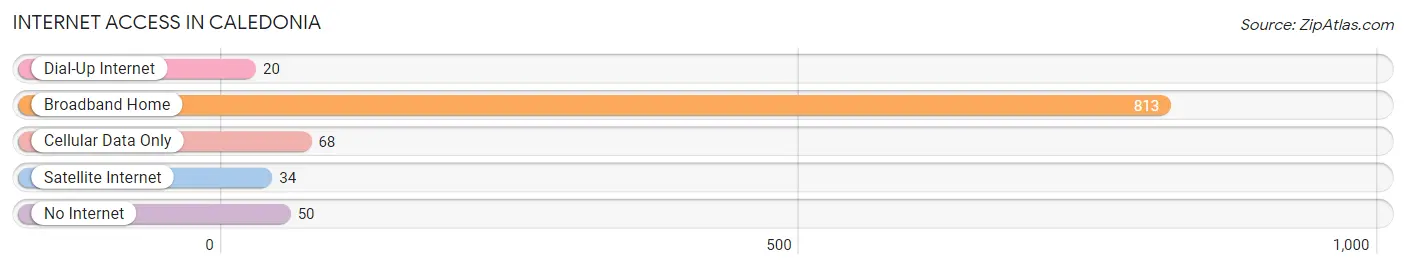
| Internet Type | # Households | % Households |
| Dial-Up Internet | 20 | 2.0% |
| Broadband Home | 813 | 82.5% |
| Cellular Data Only | 68 | 6.9% |
| Satellite Internet | 34 | 3.5% |
| No Internet | 50 | 5.1% |
| Total | 985 | 100.0% |
Caledonia Summary
Caledonia is a small town located in Livingston County, New York. It is situated on the Genesee River, about 25 miles south of Rochester. The town was first settled in 1790 and was incorporated in 1803. The town is named after the Roman province of Caledonia, which was located in modern-day Scotland.
Geography
Caledonia is located in the Finger Lakes region of New York. It is bordered by the towns of York, Leicester, and Avon. The Genesee River runs through the town, and there are several small lakes and ponds in the area. The terrain is mostly flat, with some rolling hills. The town has a total area of 24.2 square miles, of which 23.9 square miles is land and 0.3 square miles is water.
Economy
Caledonia has a small but diverse economy. The town is home to several small businesses, including a few restaurants, a grocery store, and a few retail stores. The town also has a few manufacturing companies, including a paper mill and a plastics factory. Agriculture is also an important part of the local economy, with dairy farming being the most common type of farming in the area.
Demographics
As of the 2010 census, the population of Caledonia was 4,255. The racial makeup of the town was 97.2% White, 0.7% African American, 0.2% Native American, 0.4% Asian, 0.1% Pacific Islander, 0.4% from other races, and 1.0% from two or more races. Hispanic or Latino of any race were 1.7% of the population.
The median household income in Caledonia was $50,945, and the median family income was $60,938. The per capita income for the town was $24,945. About 5.2% of families and 7.2% of the population were below the poverty line, including 8.3% of those under age 18 and 5.2% of those age 65 or over.
Education
Caledonia is served by the Caledonia-Mumford Central School District, which consists of one elementary school, one middle school, and one high school. The district also operates a preschool and a library. The town is also home to a few private schools, including a Catholic school and a Christian school.
Conclusion
Caledonia is a small town located in Livingston County, New York. It is situated on the Genesee River and is home to a small but diverse economy. The town has a population of 4,255, and the median household income is $50,945. The town is served by the Caledonia-Mumford Central School District, which consists of one elementary school, one middle school, and one high school.
Common Questions
What is the Total Population of Caledonia?
Total Population of Caledonia is 2,385.
What is the Total Male Population of Caledonia?
Total Male Population of Caledonia is 1,271.
What is the Total Female Population of Caledonia?
Total Female Population of Caledonia is 1,114.
What is the Ratio of Males per 100 Females in Caledonia?
There are 114.09 Males per 100 Females in Caledonia.
What is the Ratio of Females per 100 Males in Caledonia?
There are 87.65 Females per 100 Males in Caledonia.
What is the Median Population Age in Caledonia?
Median Population Age in Caledonia is 38.0 Years.
What is the Average Family Size in Caledonia
Average Family Size in Caledonia is 3.1 People.
What is the Average Household Size in Caledonia
Average Household Size in Caledonia is 2.4 People.
What is Per Capita Income in Caledonia?
Per Capita income in Caledonia is $40,517.
What is the Median Family Income in Caledonia?
Median Family Income in Caledonia is $112,303.
What is the Median Household income in Caledonia?
Median Household Income in Caledonia is $85,208.
What is Income or Wage Gap in Caledonia?
Income or Wage Gap in Caledonia is 31.0%.
Women in Caledonia earn 69.0 cents for every dollar earned by a man.
What is Inequality or Gini Index in Caledonia?
Inequality or Gini Index in Caledonia is 0.36.
How Large is the Labor Force in Caledonia?
There are 1,407 People in the Labor Forcein in Caledonia.
What is the Percentage of People in the Labor Force in Caledonia?
70.4% of People are in the Labor Force in Caledonia.
What is the Unemployment Rate in Caledonia?
Unemployment Rate in Caledonia is 2.7%.