Brasher Falls, NY
Brasher Falls Map
Brasher Falls Overview
510
TOTAL POPULATION
207
MALE POPULATION
303
FEMALE POPULATION
68.32
MALES / 100 FEMALES
146.38
FEMALES / 100 MALES
46.3
MEDIAN AGE
3.0
AVG FAMILY SIZE
1.9
AVG HOUSEHOLD SIZE
$24,191
PER CAPITA INCOME
$48,594
AVG FAMILY INCOME
$28,333
AVG HOUSEHOLD INCOME
0.50
INEQUALITY / GINI INDEX
185
LABOR FORCE [ PEOPLE ]
42.4%
PERCENT IN LABOR FORCE
Brasher Falls Zip Codes
Brasher Falls Area Codes
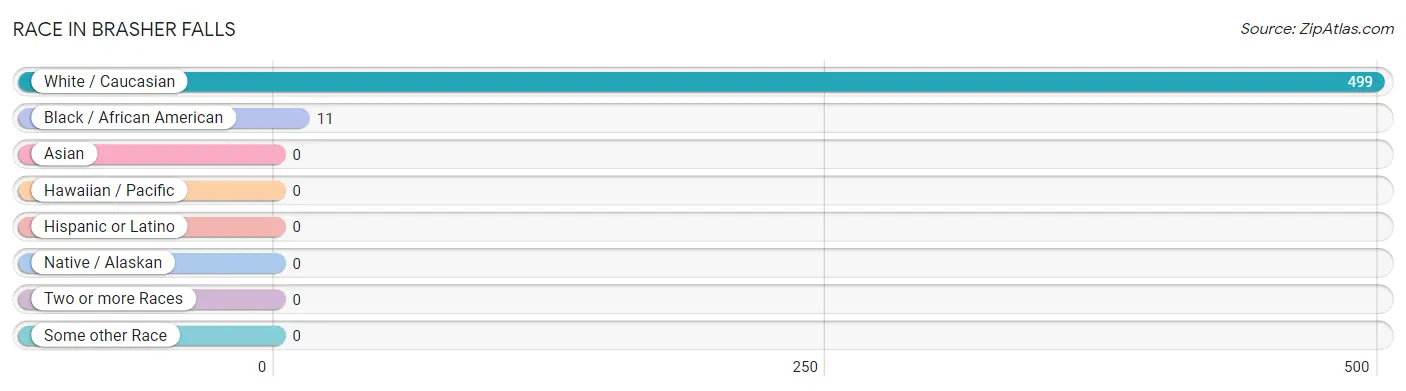
Race in Brasher Falls
The most populous races in Brasher Falls are White / Caucasian (499 | 97.8%), and Black / African American (11 | 2.2%).
| Race | # Population | % Population |
| Asian | 0 | 0.0% |
| Black / African American | 11 | 2.2% |
| Hawaiian / Pacific | 0 | 0.0% |
| Hispanic or Latino | 0 | 0.0% |
| Native / Alaskan | 0 | 0.0% |
| White / Caucasian | 499 | 97.8% |
| Two or more Races | 0 | 0.0% |
| Some other Race | 0 | 0.0% |
| Total | 510 | 100.0% |
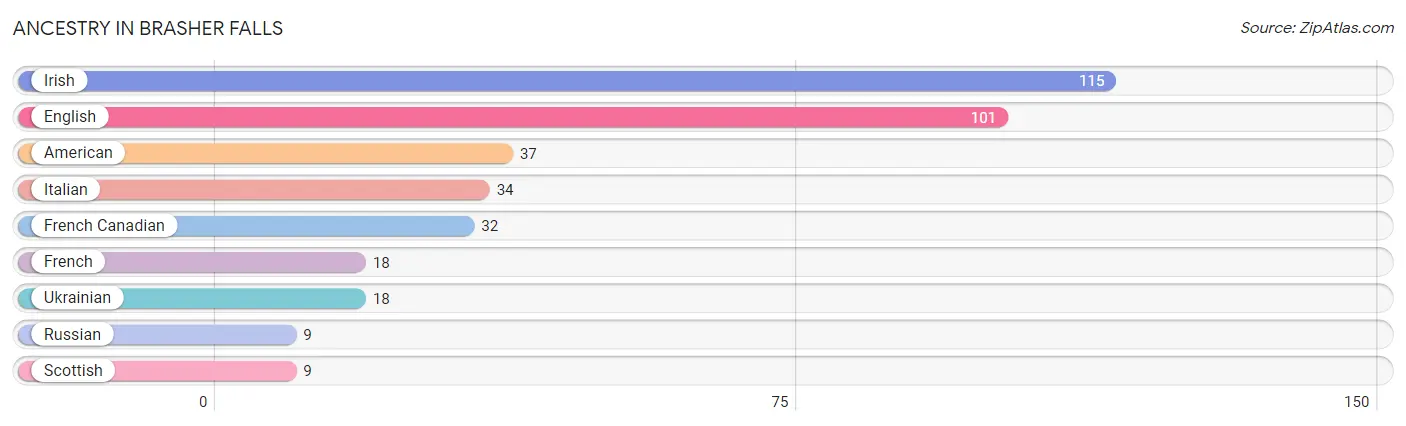
Ancestry in Brasher Falls
The most populous ancestries reported in Brasher Falls are Irish (115 | 22.6%), English (101 | 19.8%), American (37 | 7.2%), Italian (34 | 6.7%), and French Canadian (32 | 6.3%), together accounting for 62.5% of all Brasher Falls residents.
| Ancestry | # Population | % Population |
| American | 37 | 7.2% |
| English | 101 | 19.8% |
| French | 18 | 3.5% |
| French Canadian | 32 | 6.3% |
| Irish | 115 | 22.6% |
| Italian | 34 | 6.7% |
| Russian | 9 | 1.8% |
| Scottish | 9 | 1.8% |
| Ukrainian | 18 | 3.5% | View All 9 Rows |
Immigrants in Brasher Falls
The most numerous immigrant groups reported in Brasher Falls came from , and Canada (7 | 1.4%), together accounting for 1.4% of all Brasher Falls residents.

| Immigration Origin | # Population | % Population |
| Canada | 7 | 1.4% | View All 1 Rows |
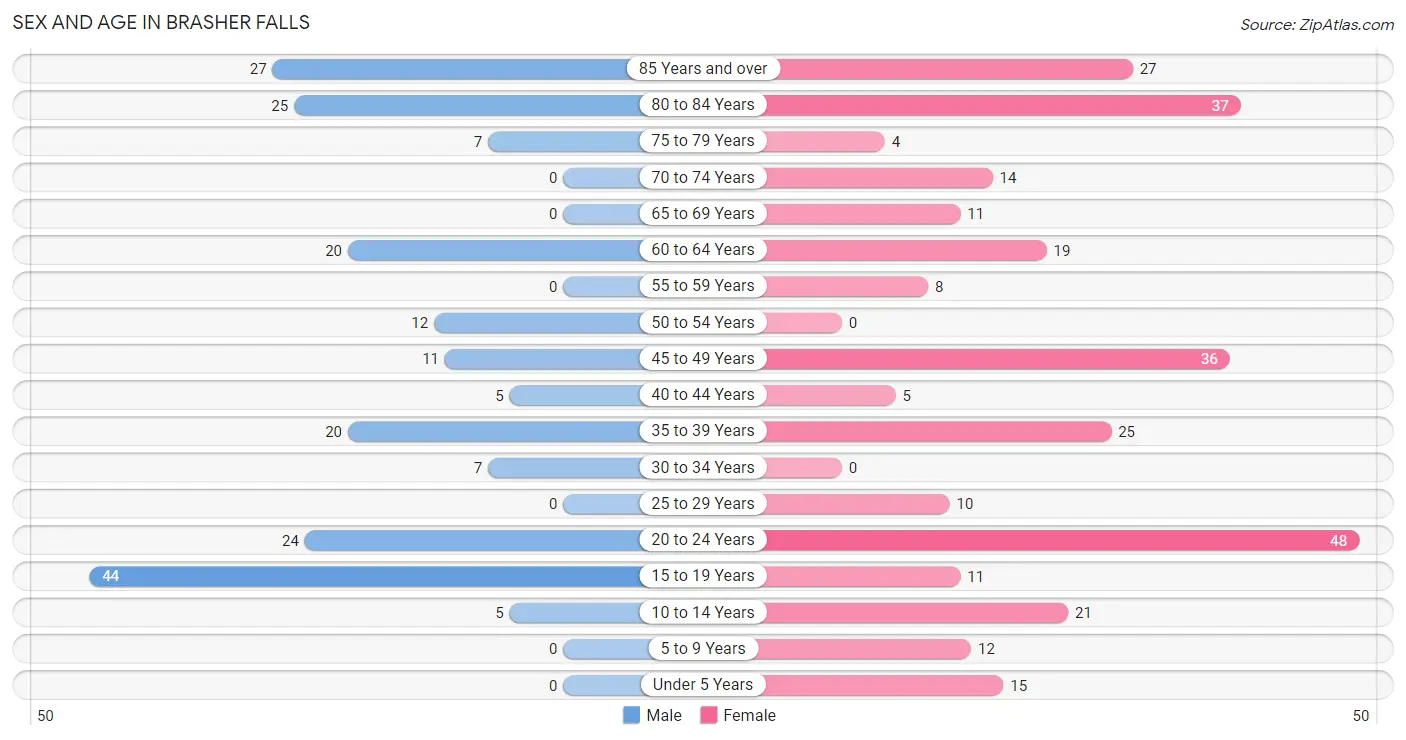
Sex and Age in Brasher Falls
Sex and Age in Brasher Falls
The most populous age groups in Brasher Falls are 15 to 19 Years (44 | 21.3%) for men and 20 to 24 Years (48 | 15.8%) for women.
| Age Bracket | Male | Female |
| Under 5 Years | 0 (0.0%) | 15 (5.0%) |
| 5 to 9 Years | 0 (0.0%) | 12 (4.0%) |
| 10 to 14 Years | 5 (2.4%) | 21 (6.9%) |
| 15 to 19 Years | 44 (21.3%) | 11 (3.6%) |
| 20 to 24 Years | 24 (11.6%) | 48 (15.8%) |
| 25 to 29 Years | 0 (0.0%) | 10 (3.3%) |
| 30 to 34 Years | 7 (3.4%) | 0 (0.0%) |
| 35 to 39 Years | 20 (9.7%) | 25 (8.3%) |
| 40 to 44 Years | 5 (2.4%) | 5 (1.7%) |
| 45 to 49 Years | 11 (5.3%) | 36 (11.9%) |
| 50 to 54 Years | 12 (5.8%) | 0 (0.0%) |
| 55 to 59 Years | 0 (0.0%) | 8 (2.6%) |
| 60 to 64 Years | 20 (9.7%) | 19 (6.3%) |
| 65 to 69 Years | 0 (0.0%) | 11 (3.6%) |
| 70 to 74 Years | 0 (0.0%) | 14 (4.6%) |
| 75 to 79 Years | 7 (3.4%) | 4 (1.3%) |
| 80 to 84 Years | 25 (12.1%) | 37 (12.2%) |
| 85 Years and over | 27 (13.0%) | 27 (8.9%) |
| Total | 207 (100.0%) | 303 (100.0%) |
Families and Households in Brasher Falls
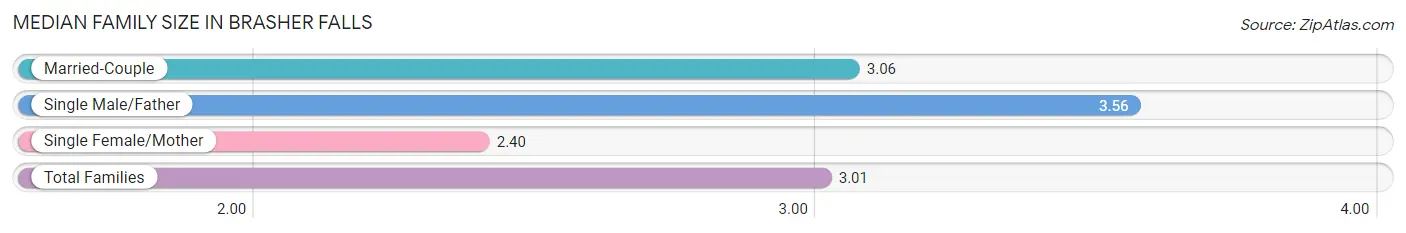
Median Family Size in Brasher Falls
The median family size in Brasher Falls is 3.01 persons per family, with single male/father families (9 | 8.0%) accounting for the largest median family size of 3.56 persons per family. On the other hand, single female/mother families (15 | 13.4%) represent the smallest median family size with 2.40 persons per family.
| Family Type | # Families | Family Size |
| Married-Couple | 88 (78.6%) | 3.06 |
| Single Male/Father | 9 (8.0%) | 3.56 |
| Single Female/Mother | 15 (13.4%) | 2.40 |
| Total Families | 112 (100.0%) | 3.01 |
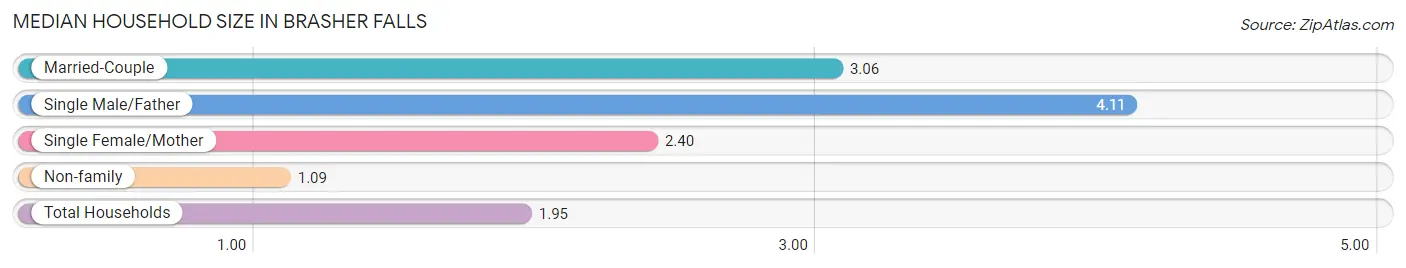
Median Household Size in Brasher Falls
The median household size in Brasher Falls is 1.95 persons per household, with single male/father households (9 | 3.5%) accounting for the largest median household size of 4.11 persons per household. non-family households (144 | 56.2%) represent the smallest median household size with 1.09 persons per household.
| Household Type | # Households | Household Size |
| Married-Couple | 88 (34.4%) | 3.06 |
| Single Male/Father | 9 (3.5%) | 4.11 |
| Single Female/Mother | 15 (5.9%) | 2.40 |
| Non-family | 144 (56.2%) | 1.09 |
| Total Households | 256 (100.0%) | 1.95 |
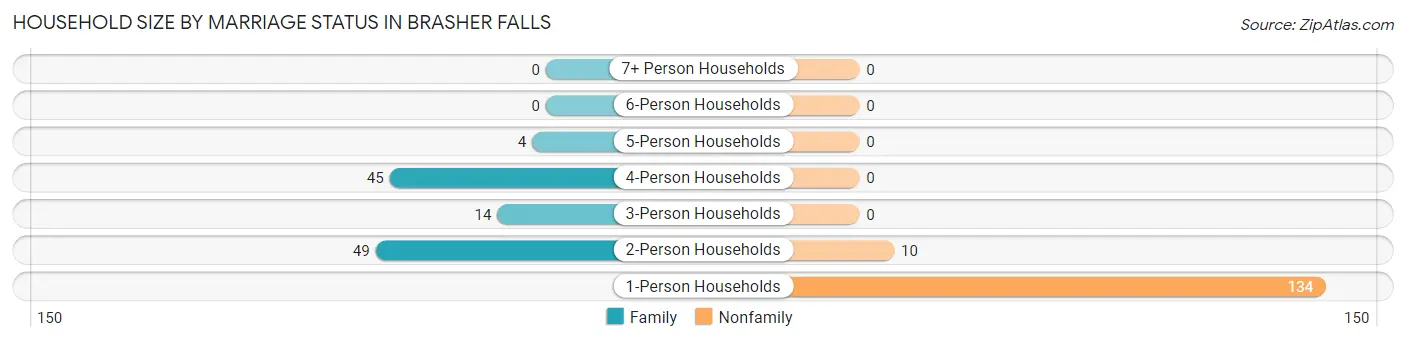
Household Size by Marriage Status in Brasher Falls
Out of a total of 256 households in Brasher Falls, 112 (43.8%) are family households, while 144 (56.2%) are nonfamily households. The most numerous type of family households are 2-person households, comprising 49, and the most common type of nonfamily households are 1-person households, comprising 134.
| Household Size | Family Households | Nonfamily Households |
| 1-Person Households | - | 134 (52.3%) |
| 2-Person Households | 49 (19.1%) | 10 (3.9%) |
| 3-Person Households | 14 (5.5%) | 0 (0.0%) |
| 4-Person Households | 45 (17.6%) | 0 (0.0%) |
| 5-Person Households | 4 (1.6%) | 0 (0.0%) |
| 6-Person Households | 0 (0.0%) | 0 (0.0%) |
| 7+ Person Households | 0 (0.0%) | 0 (0.0%) |
| Total | 112 (43.8%) | 144 (56.2%) |
Female Fertility in Brasher Falls
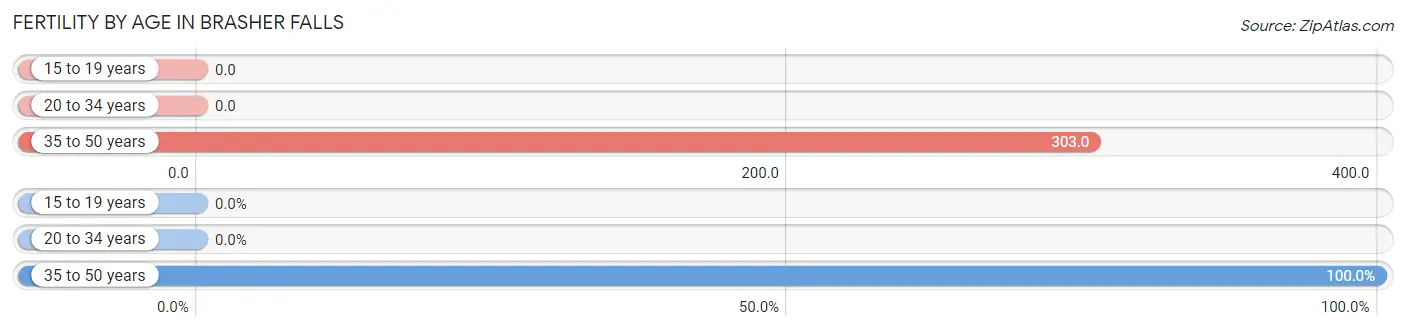
Fertility by Age in Brasher Falls
Average fertility rate in Brasher Falls is 148.0 births per 1,000 women. Women in the age bracket of 35 to 50 years have the highest fertility rate with 303.0 births per 1,000 women. Women in the age bracket of 35 to 50 years acount for 100.0% of all women with births.
| Age Bracket | Women with Births | Births / 1,000 Women |
| 15 to 19 years | 0 (0.0%) | 0.0 |
| 20 to 34 years | 0 (0.0%) | 0.0 |
| 35 to 50 years | 20 (100.0%) | 303.0 |
| Total | 20 (100.0%) | 148.0 |
Fertility by Age by Marriage Status in Brasher Falls
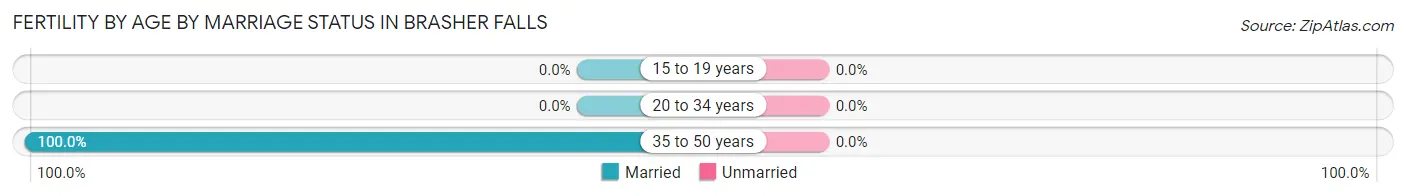
| Age Bracket | Married | Unmarried |
| 15 to 19 years | 0 (0.0%) | 0 (0.0%) |
| 20 to 34 years | 0 (0.0%) | 0 (0.0%) |
| 35 to 50 years | 20 (100.0%) | 0 (0.0%) |
| Total | 20 (100.0%) | 0 (0.0%) |
Fertility by Education in Brasher Falls
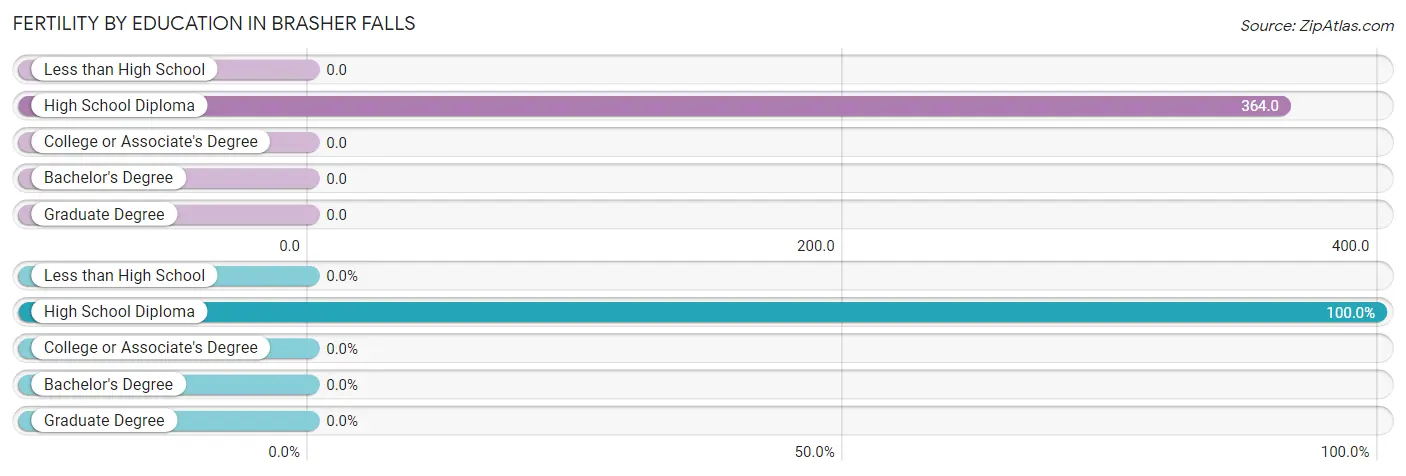
| Educational Attainment | Women with Births | Births / 1,000 Women |
| Less than High School | 0 (0.0%) | 0.0 |
| High School Diploma | 20 (100.0%) | 364.0 |
| College or Associate's Degree | 0 (0.0%) | 0.0 |
| Bachelor's Degree | 0 (0.0%) | 0.0 |
| Graduate Degree | 0 (0.0%) | 0.0 |
| Total | 20 (100.0%) | 148.0 |
Fertility by Education by Marriage Status in Brasher Falls
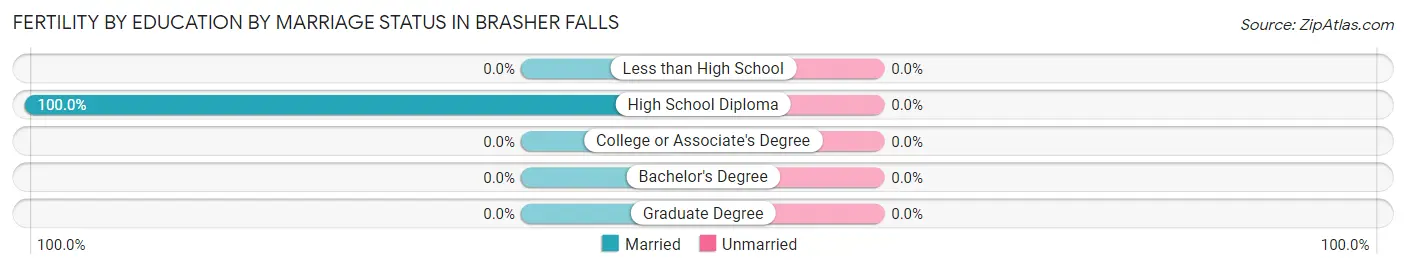
| Educational Attainment | Married | Unmarried |
| Less than High School | 0 (0.0%) | 0 (0.0%) |
| High School Diploma | 20 (100.0%) | 0 (0.0%) |
| College or Associate's Degree | 0 (0.0%) | 0 (0.0%) |
| Bachelor's Degree | 0 (0.0%) | 0 (0.0%) |
| Graduate Degree | 0 (0.0%) | 0 (0.0%) |
| Total | 20 (100.0%) | 0 (0.0%) |
Income in Brasher Falls
Income Overview in Brasher Falls
Per Capita Income in Brasher Falls is $24,191, while median incomes of families and households are $48,594 and $28,333 respectively.
| Characteristic | Number | Measure |
| Per Capita Income | 510 | $24,191 |
| Median Family Income | 112 | $48,594 |
| Mean Family Income | 112 | $74,841 |
| Median Household Income | 256 | $28,333 |
| Mean Household Income | 256 | $45,645 |
| Income Deficit | 112 | $0 |
| Wage / Income Gap (%) | 510 | 0.00% |
| Wage / Income Gap ($) | 510 | 100.00¢ per $1 |
| Gini / Inequality Index | 510 | 0.50 |
Earnings by Sex in Brasher Falls
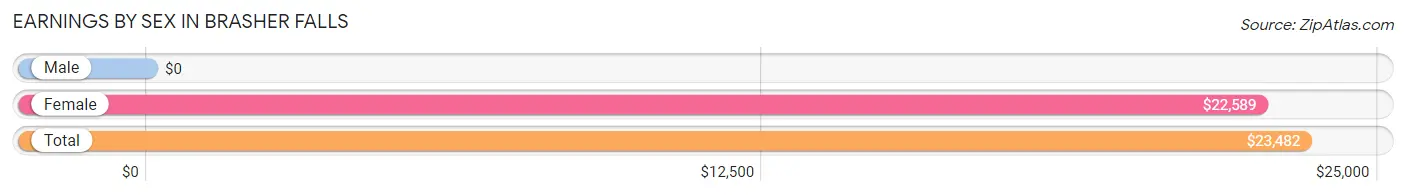
| Sex | Number | Average Earnings |
| Male | 86 (38.6%) | $0 |
| Female | 137 (61.4%) | $22,589 |
| Total | 223 (100.0%) | $23,482 |
Earnings by Sex by Income Bracket in Brasher Falls
The most common earnings brackets in Brasher Falls are $75,000 to $99,999 for men (23 | 26.7%) and $7,500 to $9,999 for women (33 | 24.1%).
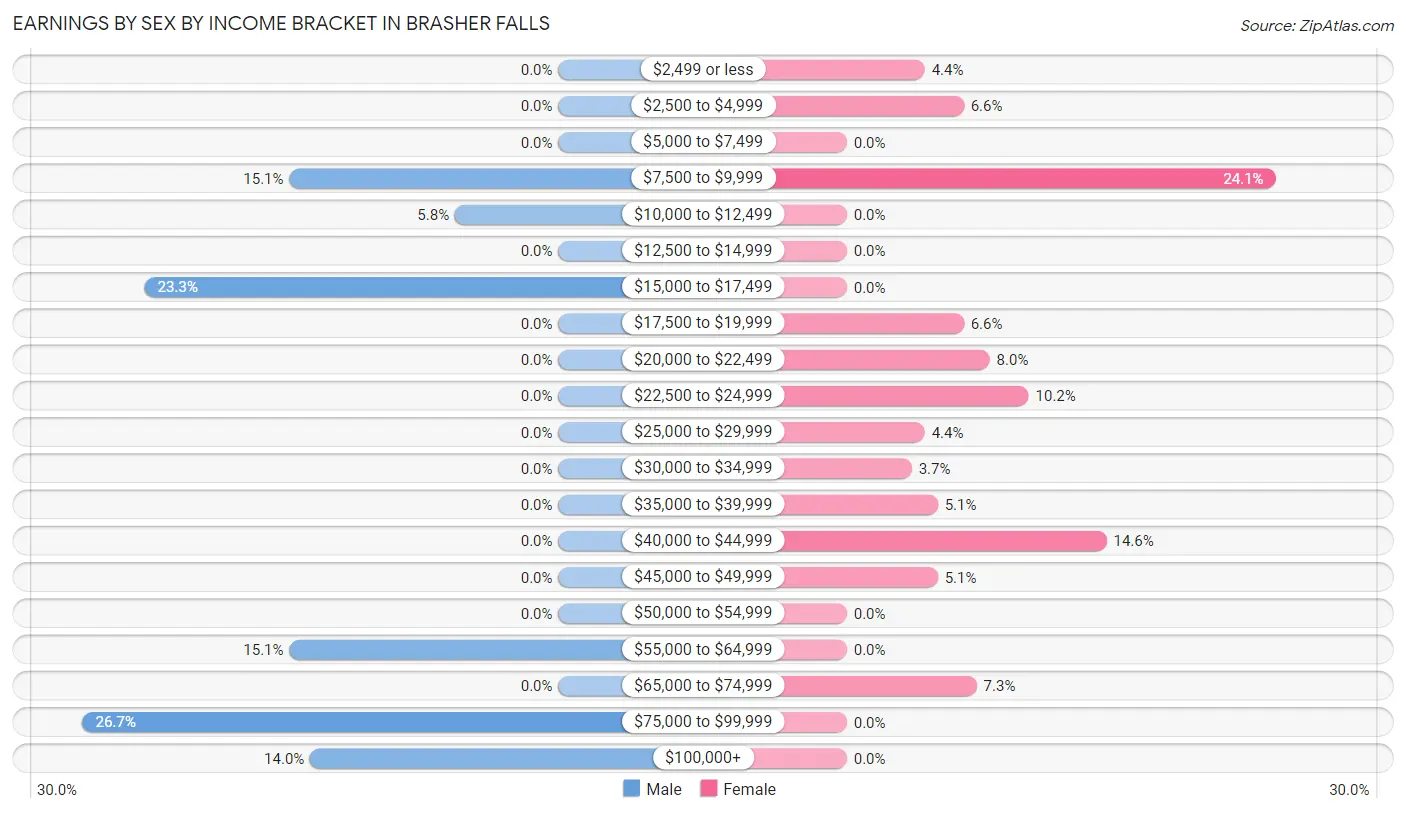
| Income | Male | Female |
| $2,499 or less | 0 (0.0%) | 6 (4.4%) |
| $2,500 to $4,999 | 0 (0.0%) | 9 (6.6%) |
| $5,000 to $7,499 | 0 (0.0%) | 0 (0.0%) |
| $7,500 to $9,999 | 13 (15.1%) | 33 (24.1%) |
| $10,000 to $12,499 | 5 (5.8%) | 0 (0.0%) |
| $12,500 to $14,999 | 0 (0.0%) | 0 (0.0%) |
| $15,000 to $17,499 | 20 (23.3%) | 0 (0.0%) |
| $17,500 to $19,999 | 0 (0.0%) | 9 (6.6%) |
| $20,000 to $22,499 | 0 (0.0%) | 11 (8.0%) |
| $22,500 to $24,999 | 0 (0.0%) | 14 (10.2%) |
| $25,000 to $29,999 | 0 (0.0%) | 6 (4.4%) |
| $30,000 to $34,999 | 0 (0.0%) | 5 (3.6%) |
| $35,000 to $39,999 | 0 (0.0%) | 7 (5.1%) |
| $40,000 to $44,999 | 0 (0.0%) | 20 (14.6%) |
| $45,000 to $49,999 | 0 (0.0%) | 7 (5.1%) |
| $50,000 to $54,999 | 0 (0.0%) | 0 (0.0%) |
| $55,000 to $64,999 | 13 (15.1%) | 0 (0.0%) |
| $65,000 to $74,999 | 0 (0.0%) | 10 (7.3%) |
| $75,000 to $99,999 | 23 (26.7%) | 0 (0.0%) |
| $100,000+ | 12 (14.0%) | 0 (0.0%) |
| Total | 86 (100.0%) | 137 (100.0%) |
Earnings by Sex by Educational Attainment in Brasher Falls
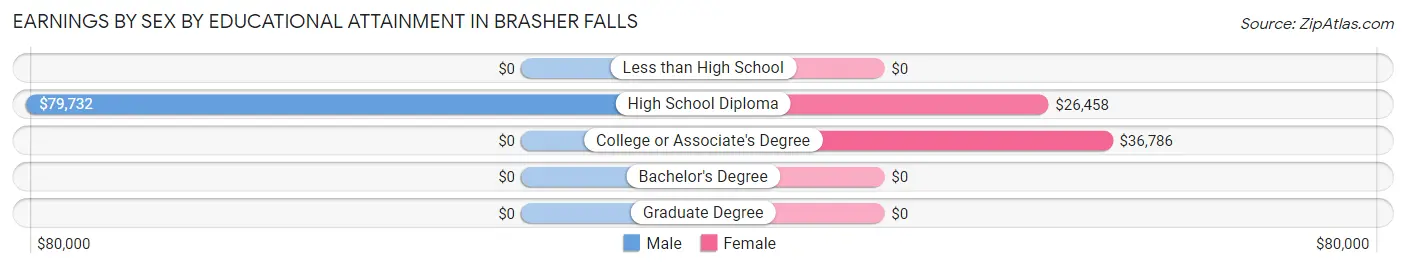
| Educational Attainment | Male Income | Female Income |
| Less than High School | - | - |
| High School Diploma | $79,732 | $26,458 |
| College or Associate's Degree | - | - |
| Bachelor's Degree | - | - |
| Graduate Degree | - | - |
| Total | - | - |
Family Income in Brasher Falls
Family Income Brackets in Brasher Falls
According to the Brasher Falls family income data, there are 45 families falling into the $35,000 to $49,999 income range, which is the most common income bracket and makes up 40.2% of all families.
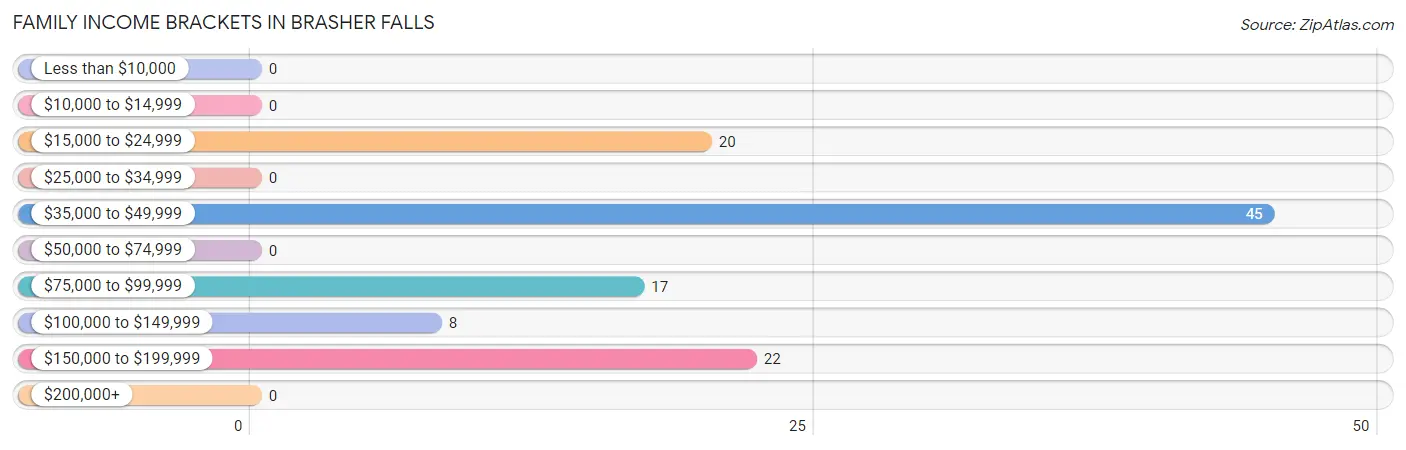
| Income Bracket | # Families | % Families |
| Less than $10,000 | 0 | 0.0% |
| $10,000 to $14,999 | 0 | 0.0% |
| $15,000 to $24,999 | 20 | 17.9% |
| $25,000 to $34,999 | 0 | 0.0% |
| $35,000 to $49,999 | 45 | 40.2% |
| $50,000 to $74,999 | 0 | 0.0% |
| $75,000 to $99,999 | 17 | 15.2% |
| $100,000 to $149,999 | 8 | 7.1% |
| $150,000 to $199,999 | 22 | 19.6% |
| $200,000+ | 0 | 0.0% |
Family Income by Famaliy Size in Brasher Falls
2-person families (49 | 43.8%) account for the highest median family income in Brasher Falls with $48,203 per family, while 2-person families (49 | 43.8%) have the highest median income of $24,102 per family member.
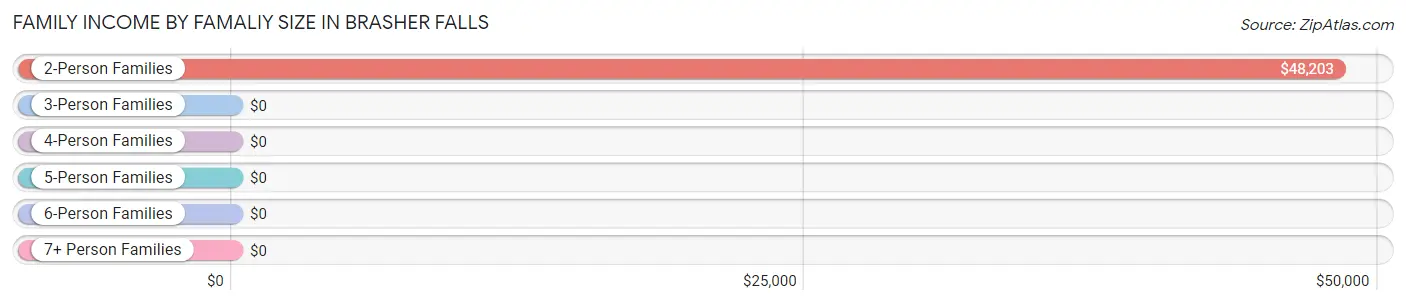
| Income Bracket | # Families | Median Income |
| 2-Person Families | 49 (43.8%) | $48,203 |
| 3-Person Families | 18 (16.1%) | $0 |
| 4-Person Families | 41 (36.6%) | $0 |
| 5-Person Families | 4 (3.6%) | $0 |
| 6-Person Families | 0 (0.0%) | $0 |
| 7+ Person Families | 0 (0.0%) | $0 |
| Total | 112 (100.0%) | $48,594 |
Family Income by Number of Earners in Brasher Falls
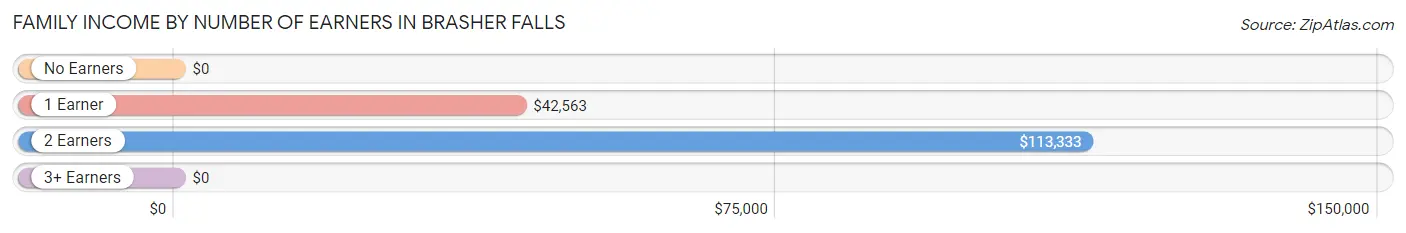
| Number of Earners | # Families | Median Income |
| No Earners | 16 (14.3%) | $0 |
| 1 Earner | 59 (52.7%) | $42,563 |
| 2 Earners | 26 (23.2%) | $113,333 |
| 3+ Earners | 11 (9.8%) | $0 |
| Total | 112 (100.0%) | $48,594 |
Household Income in Brasher Falls
Household Income Brackets in Brasher Falls
With 65 households falling in the category, the $35,000 to $49,999 income range is the most frequent in Brasher Falls, accounting for 25.4% of all households.
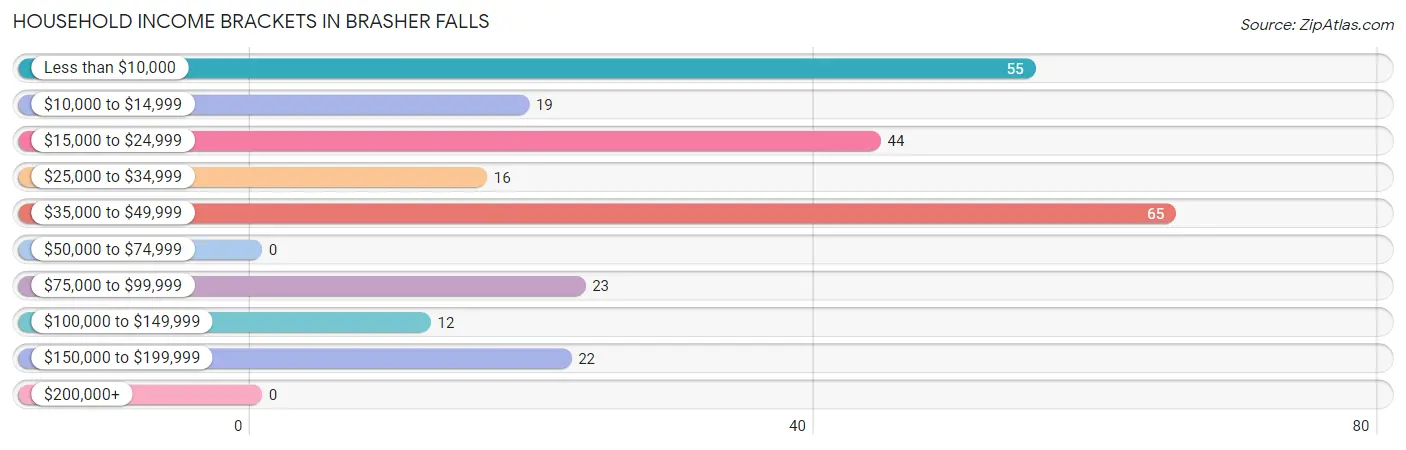
| Income Bracket | # Households | % Households |
| Less than $10,000 | 55 | 21.5% |
| $10,000 to $14,999 | 19 | 7.4% |
| $15,000 to $24,999 | 44 | 17.2% |
| $25,000 to $34,999 | 16 | 6.3% |
| $35,000 to $49,999 | 65 | 25.4% |
| $50,000 to $74,999 | 0 | 0.0% |
| $75,000 to $99,999 | 23 | 9.0% |
| $100,000 to $149,999 | 12 | 4.7% |
| $150,000 to $199,999 | 22 | 8.6% |
| $200,000+ | 0 | 0.0% |
Household Income by Householder Age in Brasher Falls
The median household income in Brasher Falls is $28,333, with the highest median household income of $25,357 found in the 65+ years age bracket for the primary householder. A total of 116 households (45.3%) fall into this category. Meanwhile, the 15 to 24 years age bracket for the primary householder has the lowest median household income of $0, with 33 households (12.9%) in this group.
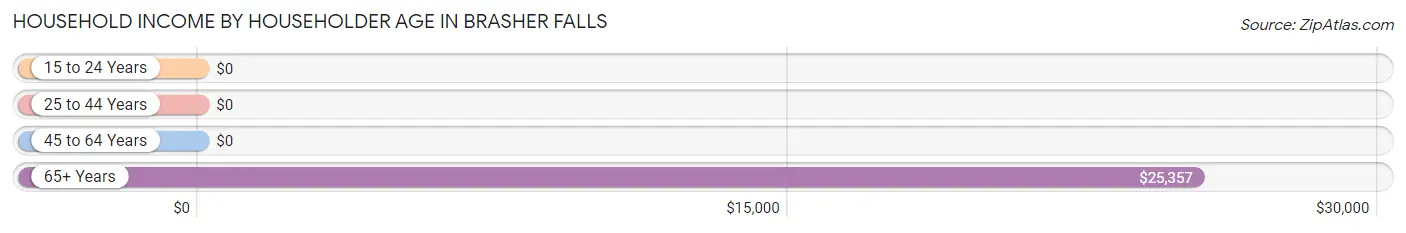
| Income Bracket | # Households | Median Income |
| 15 to 24 Years | 33 (12.9%) | $0 |
| 25 to 44 Years | 37 (14.4%) | $0 |
| 45 to 64 Years | 70 (27.3%) | $0 |
| 65+ Years | 116 (45.3%) | $25,357 |
| Total | 256 (100.0%) | $28,333 |
Poverty in Brasher Falls
Income Below Poverty by Sex and Age in Brasher Falls
With 4.3% poverty level for males and 19.5% for females among the residents of Brasher Falls, 75 year old and over males and 18 to 24 year old females are the most vulnerable to poverty, with 9 males (15.2%) and 33 females (62.3%) in their respective age groups living below the poverty level.
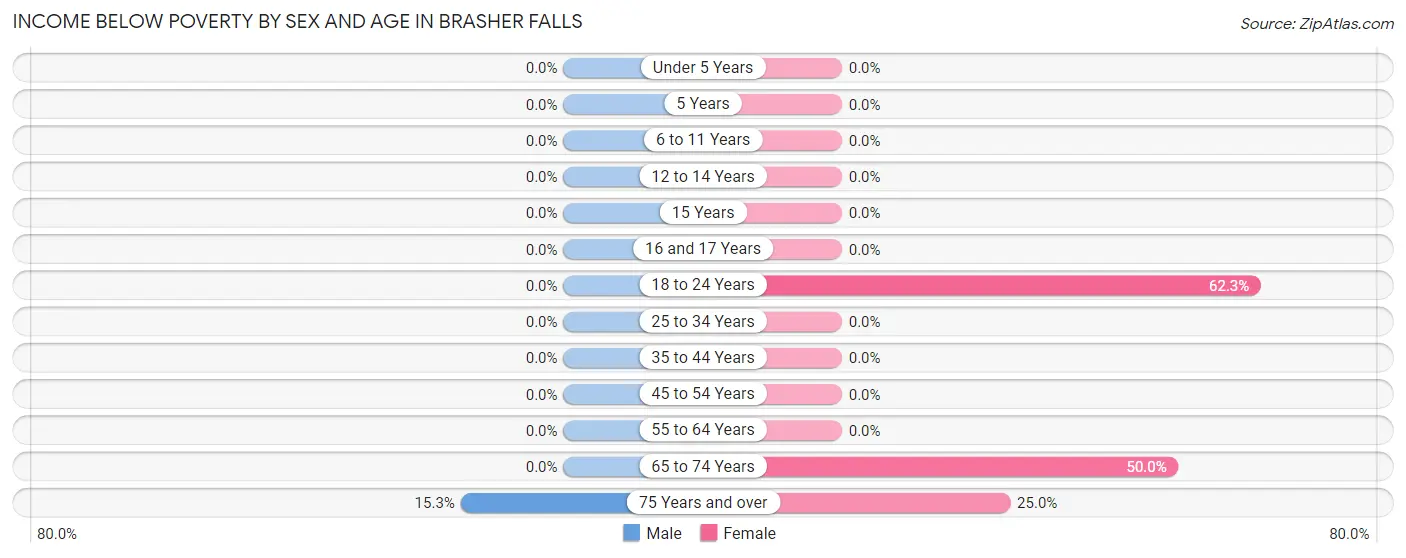
| Age Bracket | Male | Female |
| Under 5 Years | 0 (0.0%) | 0 (0.0%) |
| 5 Years | 0 (0.0%) | 0 (0.0%) |
| 6 to 11 Years | 0 (0.0%) | 0 (0.0%) |
| 12 to 14 Years | 0 (0.0%) | 0 (0.0%) |
| 15 Years | 0 (0.0%) | 0 (0.0%) |
| 16 and 17 Years | 0 (0.0%) | 0 (0.0%) |
| 18 to 24 Years | 0 (0.0%) | 33 (62.3%) |
| 25 to 34 Years | 0 (0.0%) | 0 (0.0%) |
| 35 to 44 Years | 0 (0.0%) | 0 (0.0%) |
| 45 to 54 Years | 0 (0.0%) | 0 (0.0%) |
| 55 to 64 Years | 0 (0.0%) | 0 (0.0%) |
| 65 to 74 Years | 0 (0.0%) | 7 (50.0%) |
| 75 Years and over | 9 (15.2%) | 17 (25.0%) |
| Total | 9 (4.3%) | 57 (19.5%) |
Income Above Poverty by Sex and Age in Brasher Falls
According to the poverty statistics in Brasher Falls, males aged 12 to 14 years and females aged under 5 years are the age groups that are most secure financially, with 100.0% of males and 100.0% of females in these age groups living above the poverty line.
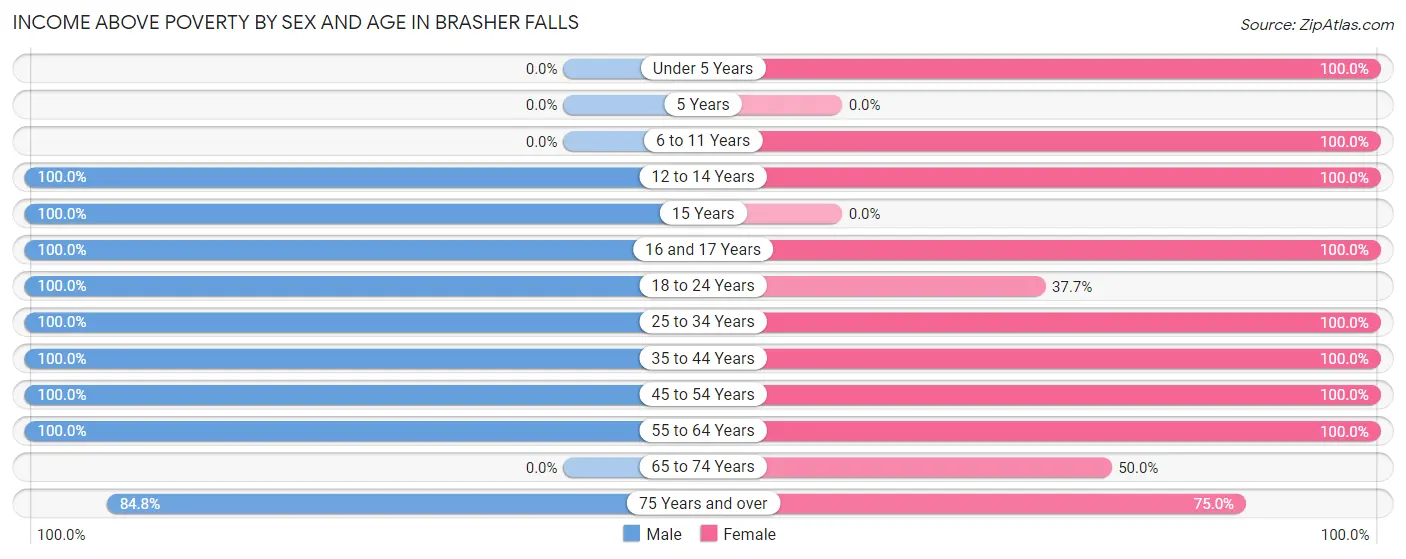
| Age Bracket | Male | Female |
| Under 5 Years | 0 (0.0%) | 15 (100.0%) |
| 5 Years | 0 (0.0%) | 0 (0.0%) |
| 6 to 11 Years | 0 (0.0%) | 12 (100.0%) |
| 12 to 14 Years | 5 (100.0%) | 21 (100.0%) |
| 15 Years | 21 (100.0%) | 0 (0.0%) |
| 16 and 17 Years | 17 (100.0%) | 6 (100.0%) |
| 18 to 24 Years | 30 (100.0%) | 20 (37.7%) |
| 25 to 34 Years | 7 (100.0%) | 10 (100.0%) |
| 35 to 44 Years | 25 (100.0%) | 30 (100.0%) |
| 45 to 54 Years | 23 (100.0%) | 36 (100.0%) |
| 55 to 64 Years | 20 (100.0%) | 27 (100.0%) |
| 65 to 74 Years | 0 (0.0%) | 7 (50.0%) |
| 75 Years and over | 50 (84.8%) | 51 (75.0%) |
| Total | 198 (95.7%) | 235 (80.5%) |
Income Below Poverty Among Married-Couple Families in Brasher Falls
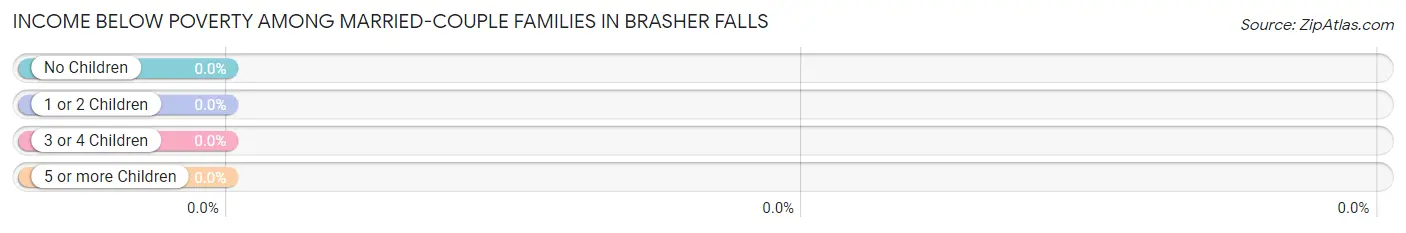
| Children | Above Poverty | Below Poverty |
| No Children | 43 (100.0%) | 0 (0.0%) |
| 1 or 2 Children | 45 (100.0%) | 0 (0.0%) |
| 3 or 4 Children | 0 (0.0%) | 0 (0.0%) |
| 5 or more Children | 0 (0.0%) | 0 (0.0%) |
| Total | 88 (100.0%) | 0 (0.0%) |
Income Below Poverty Among Single-Parent Households in Brasher Falls
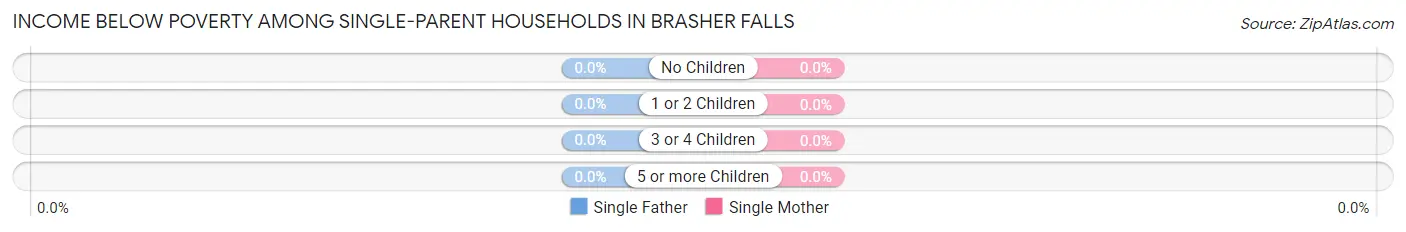
| Children | Single Father | Single Mother |
| No Children | 0 (0.0%) | 0 (0.0%) |
| 1 or 2 Children | 0 (0.0%) | 0 (0.0%) |
| 3 or 4 Children | 0 (0.0%) | 0 (0.0%) |
| 5 or more Children | 0 (0.0%) | 0 (0.0%) |
| Total | 0 (0.0%) | 0 (0.0%) |
Income Below Poverty Among Married-Couple vs Single-Parent Households in Brasher Falls
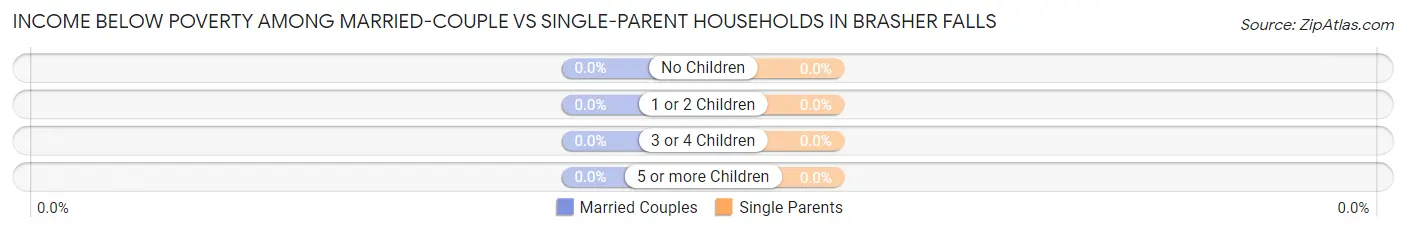
| Children | Married-Couple Families | Single-Parent Households |
| No Children | 0 (0.0%) | 0 (0.0%) |
| 1 or 2 Children | 0 (0.0%) | 0 (0.0%) |
| 3 or 4 Children | 0 (0.0%) | 0 (0.0%) |
| 5 or more Children | 0 (0.0%) | 0 (0.0%) |
| Total | 0 (0.0%) | 0 (0.0%) |
Employment Characteristics in Brasher Falls
Employment by Class of Employer in Brasher Falls
Among the 185 employed individuals in Brasher Falls, private company employees (117 | 63.2%), local government employees (26 | 14.1%), and state government employees (19 | 10.3%) make up the most common classes of employment.
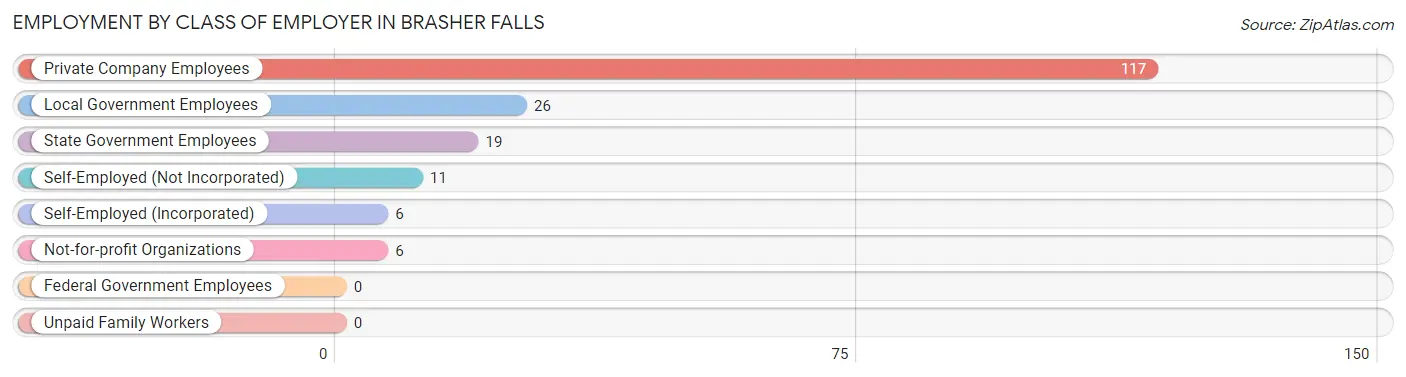
| Employer Class | # Employees | % Employees |
| Private Company Employees | 117 | 63.2% |
| Self-Employed (Incorporated) | 6 | 3.2% |
| Self-Employed (Not Incorporated) | 11 | 5.9% |
| Not-for-profit Organizations | 6 | 3.2% |
| Local Government Employees | 26 | 14.1% |
| State Government Employees | 19 | 10.3% |
| Federal Government Employees | 0 | 0.0% |
| Unpaid Family Workers | 0 | 0.0% |
| Total | 185 | 100.0% |
Employment Status by Age in Brasher Falls
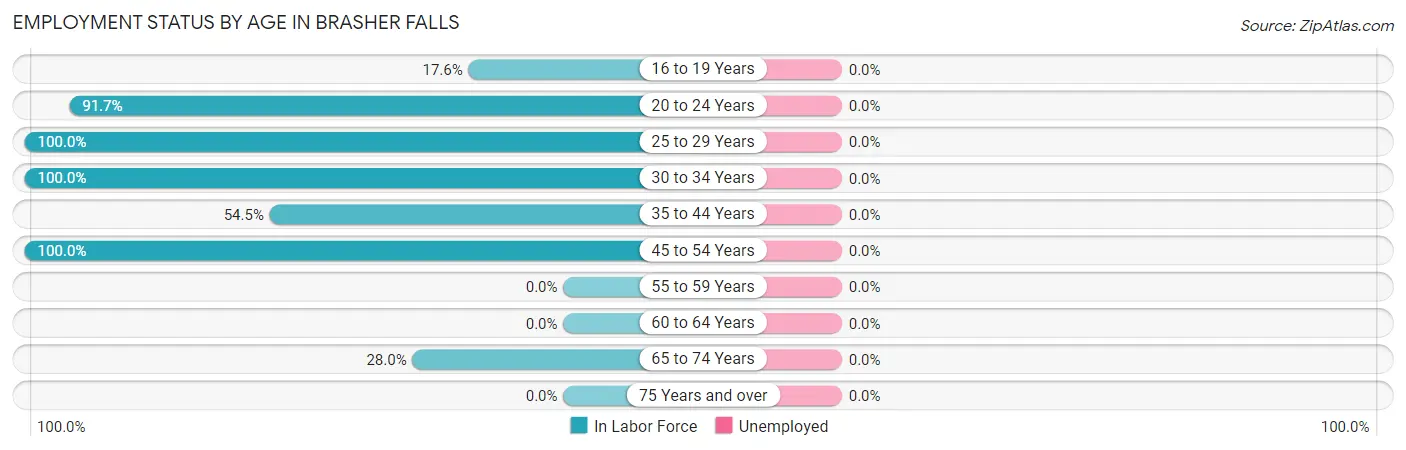
| Age Bracket | In Labor Force | Unemployed |
| 16 to 19 Years | 6 (17.6%) | 0 (0.0%) |
| 20 to 24 Years | 66 (91.7%) | 0 (0.0%) |
| 25 to 29 Years | 10 (100.0%) | 0 (0.0%) |
| 30 to 34 Years | 7 (100.0%) | 0 (0.0%) |
| 35 to 44 Years | 30 (54.5%) | 0 (0.0%) |
| 45 to 54 Years | 59 (100.0%) | 0 (0.0%) |
| 55 to 59 Years | 0 (0.0%) | 0 (0.0%) |
| 60 to 64 Years | 0 (0.0%) | 0 (0.0%) |
| 65 to 74 Years | 7 (28.0%) | 0 (0.0%) |
| 75 Years and over | 0 (0.0%) | 0 (0.0%) |
| Total | 185 (42.4%) | 0 (0.0%) |
Employment Status by Educational Attainment in Brasher Falls
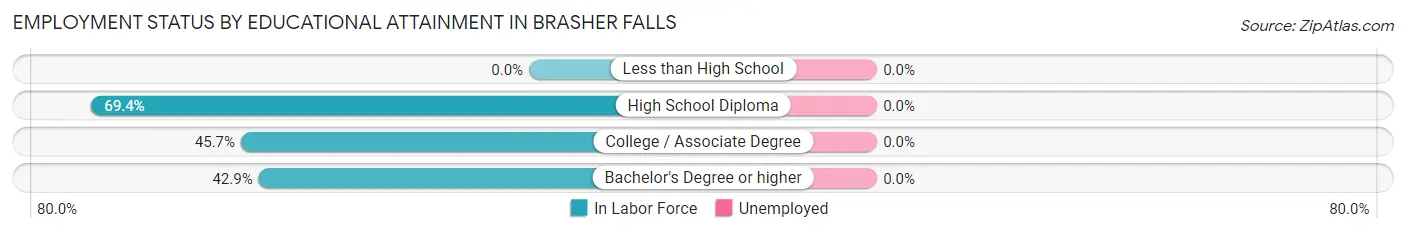
| Educational Attainment | In Labor Force | Unemployed |
| Less than High School | 0 (0.0%) | 0 (0.0%) |
| High School Diploma | 75 (69.4%) | 0 (0.0%) |
| College / Associate Degree | 16 (45.7%) | 0 (0.0%) |
| Bachelor's Degree or higher | 15 (42.9%) | 0 (0.0%) |
| Total | 106 (59.6%) | 0 (0.0%) |
Employment Occupations by Sex in Brasher Falls
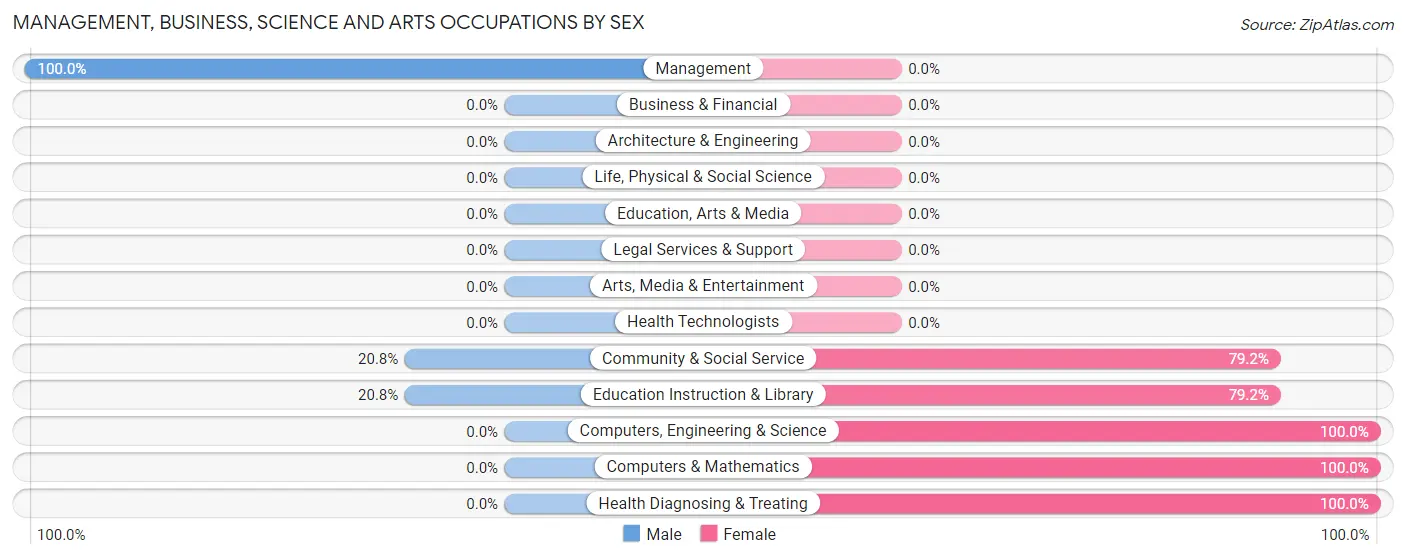
Management, Business, Science and Arts Occupations
The most common Management, Business, Science and Arts occupations in Brasher Falls are Health Diagnosing & Treating (31 | 16.8%), Community & Social Service (24 | 13.0%), Education Instruction & Library (24 | 13.0%), Computers, Engineering & Science (9 | 4.9%), and Computers & Mathematics (9 | 4.9%).
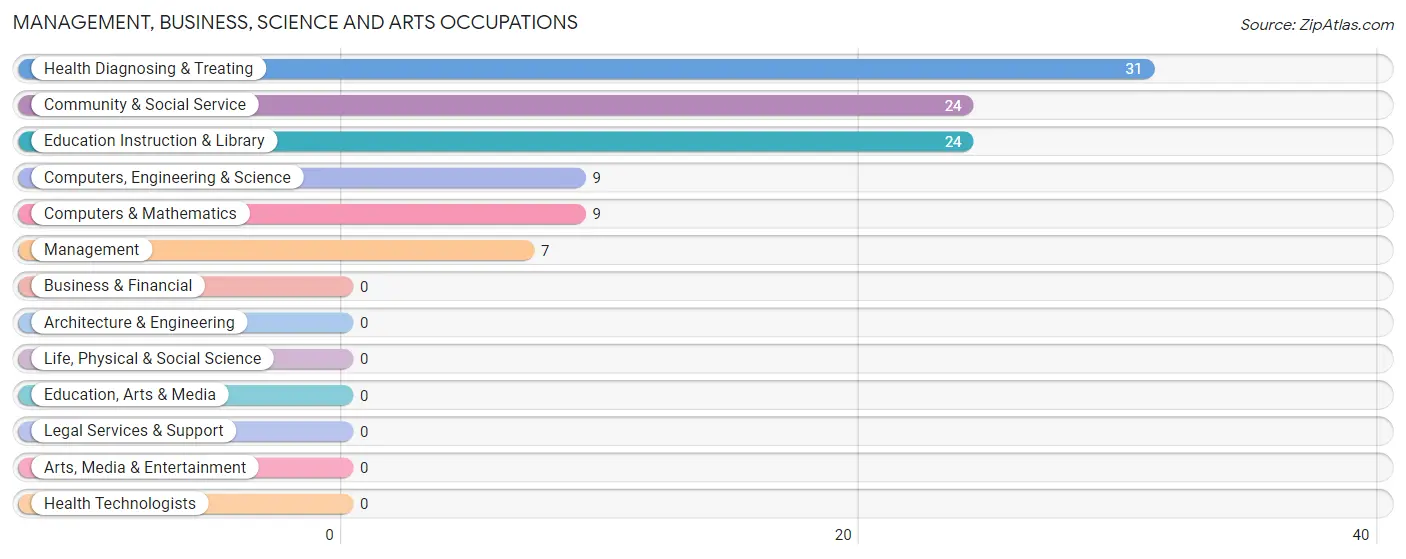
Management, Business, Science and Arts Occupations by Sex
Within the Management, Business, Science and Arts occupations in Brasher Falls, the most male-oriented occupations are Management (100.0%), Community & Social Service (20.8%), and Education Instruction & Library (20.8%), while the most female-oriented occupations are Computers, Engineering & Science (100.0%), Computers & Mathematics (100.0%), and Health Diagnosing & Treating (100.0%).
| Occupation | Male | Female |
| Management | 7 (100.0%) | 0 (0.0%) |
| Business & Financial | 0 (0.0%) | 0 (0.0%) |
| Computers, Engineering & Science | 0 (0.0%) | 9 (100.0%) |
| Computers & Mathematics | 0 (0.0%) | 9 (100.0%) |
| Architecture & Engineering | 0 (0.0%) | 0 (0.0%) |
| Life, Physical & Social Science | 0 (0.0%) | 0 (0.0%) |
| Community & Social Service | 5 (20.8%) | 19 (79.2%) |
| Education, Arts & Media | 0 (0.0%) | 0 (0.0%) |
| Legal Services & Support | 0 (0.0%) | 0 (0.0%) |
| Education Instruction & Library | 5 (20.8%) | 19 (79.2%) |
| Arts, Media & Entertainment | 0 (0.0%) | 0 (0.0%) |
| Health Diagnosing & Treating | 0 (0.0%) | 31 (100.0%) |
| Health Technologists | 0 (0.0%) | 0 (0.0%) |
| Total (Category) | 12 (16.9%) | 59 (83.1%) |
| Total (Overall) | 59 (31.9%) | 126 (68.1%) |
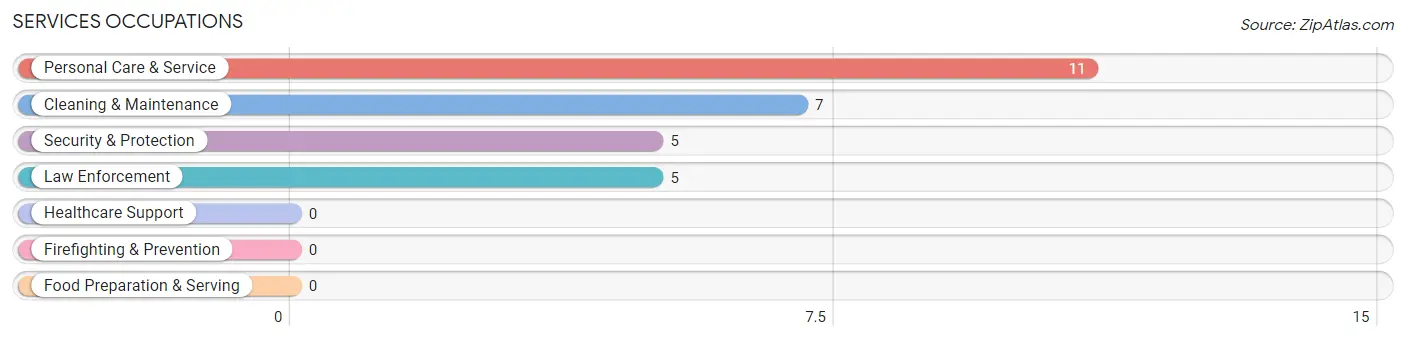
Services Occupations
The most common Services occupations in Brasher Falls are Personal Care & Service (11 | 5.9%), Cleaning & Maintenance (7 | 3.8%), Security & Protection (5 | 2.7%), and Law Enforcement (5 | 2.7%).
Services Occupations by Sex
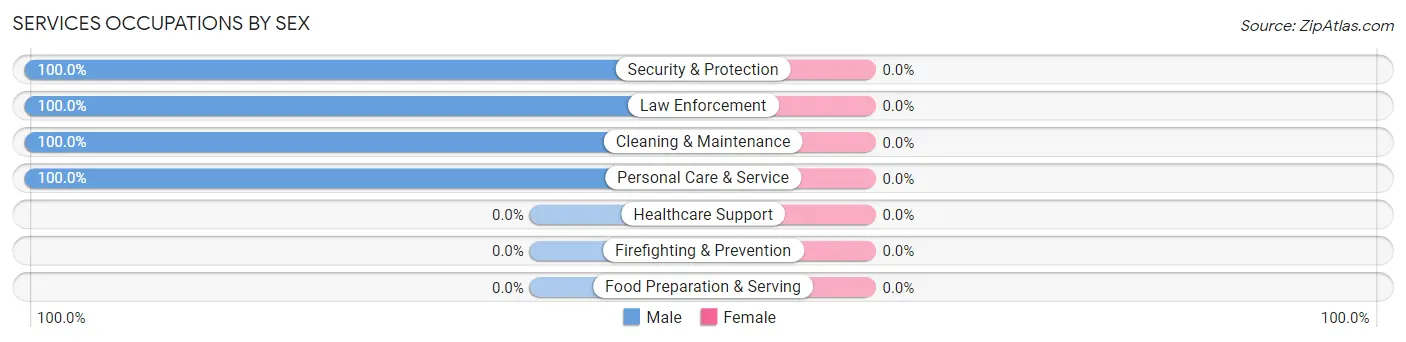
| Occupation | Male | Female |
| Healthcare Support | 0 (0.0%) | 0 (0.0%) |
| Security & Protection | 5 (100.0%) | 0 (0.0%) |
| Firefighting & Prevention | 0 (0.0%) | 0 (0.0%) |
| Law Enforcement | 5 (100.0%) | 0 (0.0%) |
| Food Preparation & Serving | 0 (0.0%) | 0 (0.0%) |
| Cleaning & Maintenance | 7 (100.0%) | 0 (0.0%) |
| Personal Care & Service | 11 (100.0%) | 0 (0.0%) |
| Total (Category) | 23 (100.0%) | 0 (0.0%) |
| Total (Overall) | 59 (31.9%) | 126 (68.1%) |
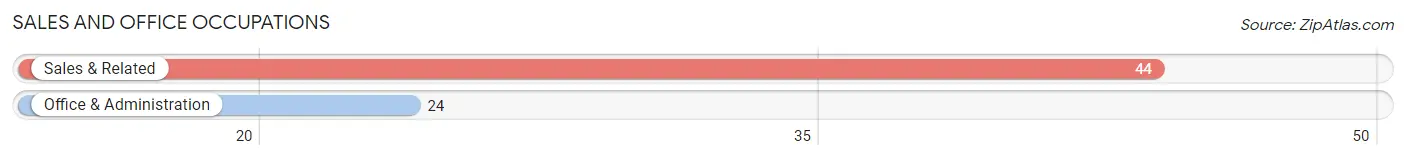
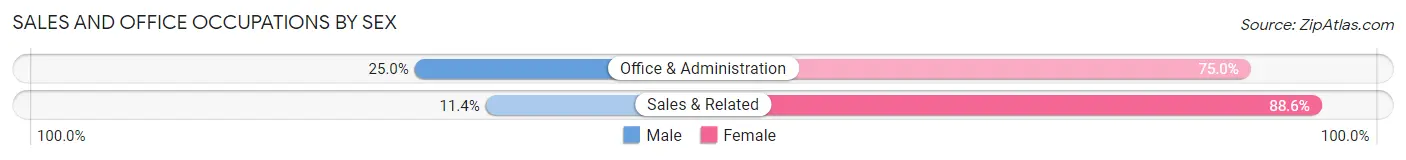
Sales and Office Occupations
The most common Sales and Office occupations in Brasher Falls are Sales & Related (44 | 23.8%), and Office & Administration (24 | 13.0%).
Sales and Office Occupations by Sex
| Occupation | Male | Female |
| Sales & Related | 5 (11.4%) | 39 (88.6%) |
| Office & Administration | 6 (25.0%) | 18 (75.0%) |
| Total (Category) | 11 (16.2%) | 57 (83.8%) |
| Total (Overall) | 59 (31.9%) | 126 (68.1%) |
Natural Resources, Construction and Maintenance Occupations
Natural Resources, Construction and Maintenance Occupations by Sex
| Occupation | Male | Female |
| Farming, Fishing & Forestry | 0 (0.0%) | 0 (0.0%) |
| Construction & Extraction | 0 (0.0%) | 0 (0.0%) |
| Installation, Maintenance & Repair | 0 (0.0%) | 0 (0.0%) |
| Total (Category) | 0 (0.0%) | 0 (0.0%) |
| Total (Overall) | 59 (31.9%) | 126 (68.1%) |
Production, Transportation and Moving Occupations
The most common Production, Transportation and Moving occupations in Brasher Falls are , and Material Moving (23 | 12.4%).
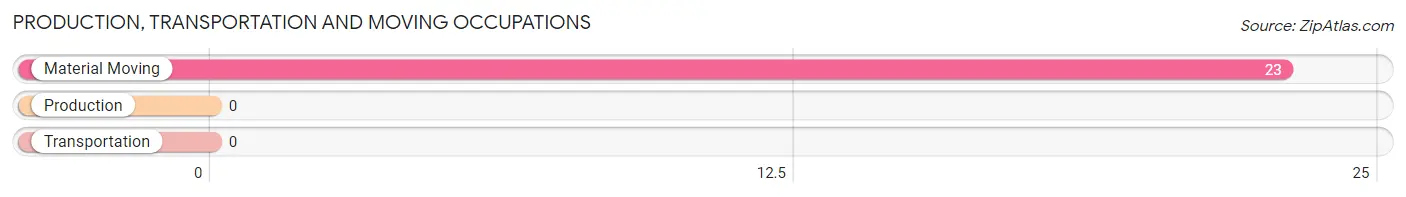
Production, Transportation and Moving Occupations by Sex
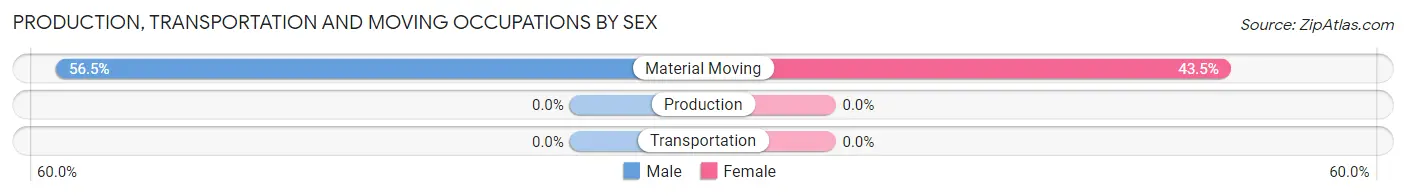
| Occupation | Male | Female |
| Production | 0 (0.0%) | 0 (0.0%) |
| Transportation | 0 (0.0%) | 0 (0.0%) |
| Material Moving | 13 (56.5%) | 10 (43.5%) |
| Total (Category) | 13 (56.5%) | 10 (43.5%) |
| Total (Overall) | 59 (31.9%) | 126 (68.1%) |
Employment Industries by Sex in Brasher Falls
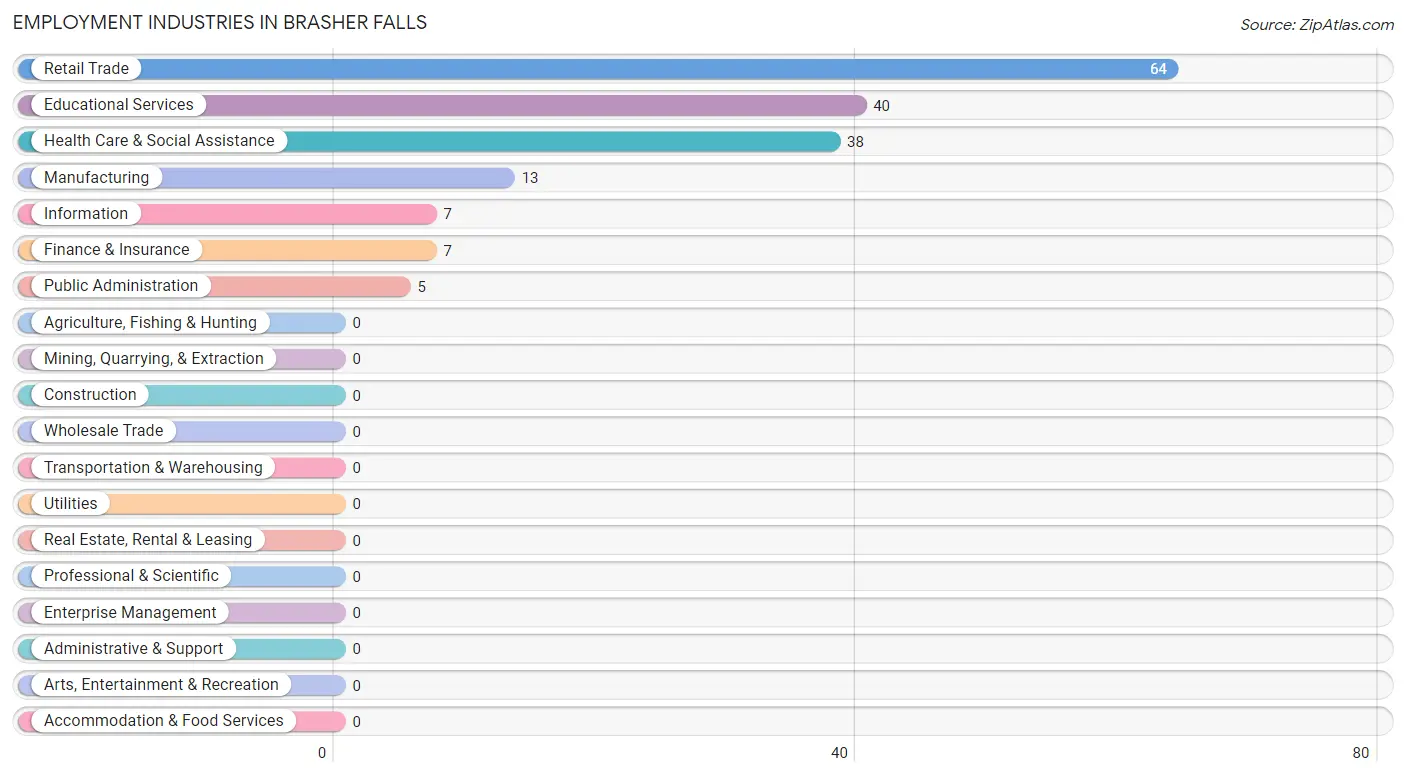
Employment Industries in Brasher Falls
The major employment industries in Brasher Falls include Retail Trade (64 | 34.6%), Educational Services (40 | 21.6%), Health Care & Social Assistance (38 | 20.5%), Manufacturing (13 | 7.0%), and Information (7 | 3.8%).
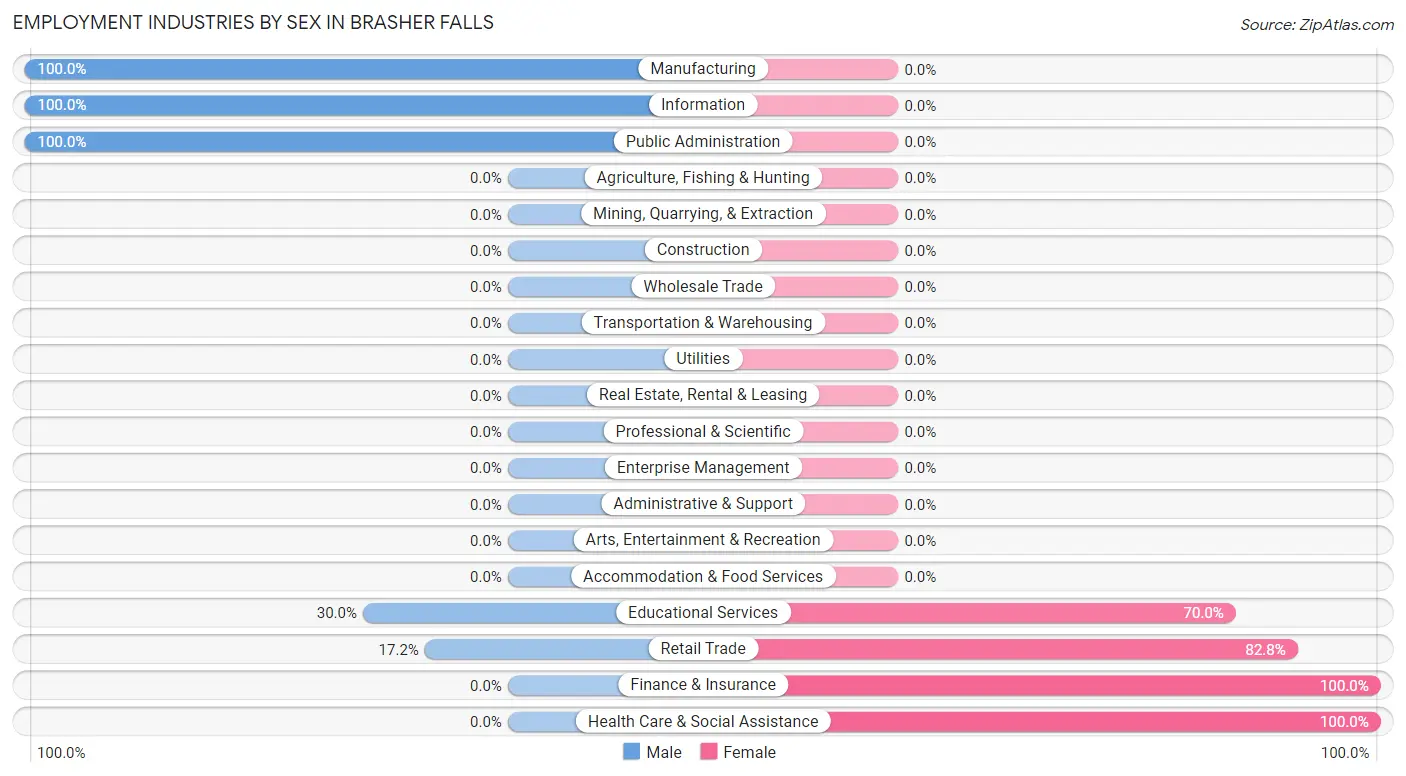
Employment Industries by Sex in Brasher Falls
The Brasher Falls industries that see more men than women are Manufacturing (100.0%), Information (100.0%), and Public Administration (100.0%), whereas the industries that tend to have a higher number of women are Finance & Insurance (100.0%), Health Care & Social Assistance (100.0%), and Retail Trade (82.8%).
| Industry | Male | Female |
| Agriculture, Fishing & Hunting | 0 (0.0%) | 0 (0.0%) |
| Mining, Quarrying, & Extraction | 0 (0.0%) | 0 (0.0%) |
| Construction | 0 (0.0%) | 0 (0.0%) |
| Manufacturing | 13 (100.0%) | 0 (0.0%) |
| Wholesale Trade | 0 (0.0%) | 0 (0.0%) |
| Retail Trade | 11 (17.2%) | 53 (82.8%) |
| Transportation & Warehousing | 0 (0.0%) | 0 (0.0%) |
| Utilities | 0 (0.0%) | 0 (0.0%) |
| Information | 7 (100.0%) | 0 (0.0%) |
| Finance & Insurance | 0 (0.0%) | 7 (100.0%) |
| Real Estate, Rental & Leasing | 0 (0.0%) | 0 (0.0%) |
| Professional & Scientific | 0 (0.0%) | 0 (0.0%) |
| Enterprise Management | 0 (0.0%) | 0 (0.0%) |
| Administrative & Support | 0 (0.0%) | 0 (0.0%) |
| Educational Services | 12 (30.0%) | 28 (70.0%) |
| Health Care & Social Assistance | 0 (0.0%) | 38 (100.0%) |
| Arts, Entertainment & Recreation | 0 (0.0%) | 0 (0.0%) |
| Accommodation & Food Services | 0 (0.0%) | 0 (0.0%) |
| Public Administration | 5 (100.0%) | 0 (0.0%) |
| Total | 59 (31.9%) | 126 (68.1%) |
Education in Brasher Falls
School Enrollment in Brasher Falls
The most common levels of schooling among the 146 students in Brasher Falls are high school (64 | 43.8%), college / undergraduate (53 | 36.3%), and middle school (17 | 11.6%).
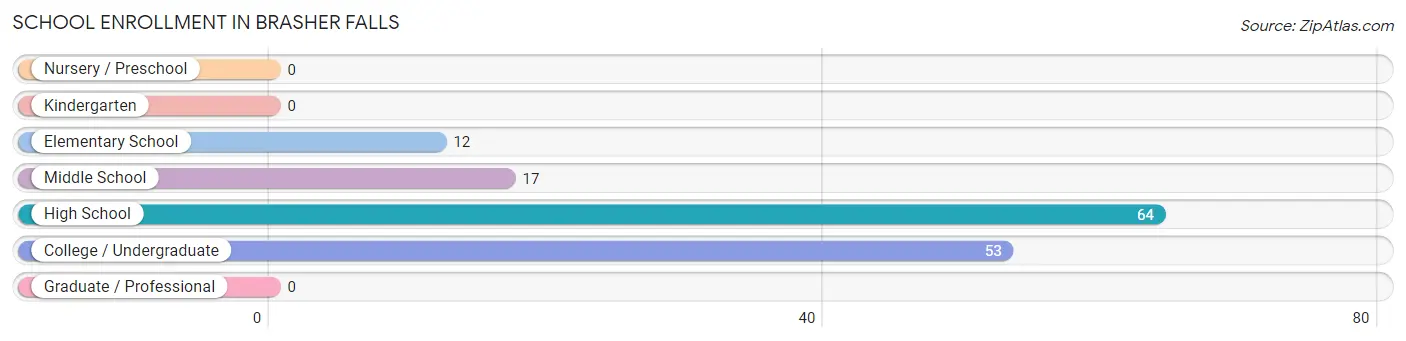
| School Level | # Students | % Students |
| Nursery / Preschool | 0 | 0.0% |
| Kindergarten | 0 | 0.0% |
| Elementary School | 12 | 8.2% |
| Middle School | 17 | 11.6% |
| High School | 64 | 43.8% |
| College / Undergraduate | 53 | 36.3% |
| Graduate / Professional | 0 | 0.0% |
| Total | 146 | 100.0% |
School Enrollment by Age by Funding Source in Brasher Falls
Out of a total of 146 students who are enrolled in schools in Brasher Falls, 42 (28.8%) attend a private institution, while the remaining 104 (71.2%) are enrolled in public schools. The age group of 20 to 24 year olds has the highest likelihood of being enrolled in private schools, with 42 (79.2% in the age bracket) enrolled. Conversely, the age group of 5 to 9 year old has the lowest likelihood of being enrolled in a private school, with 12 (100.0% in the age bracket) attending a public institution.
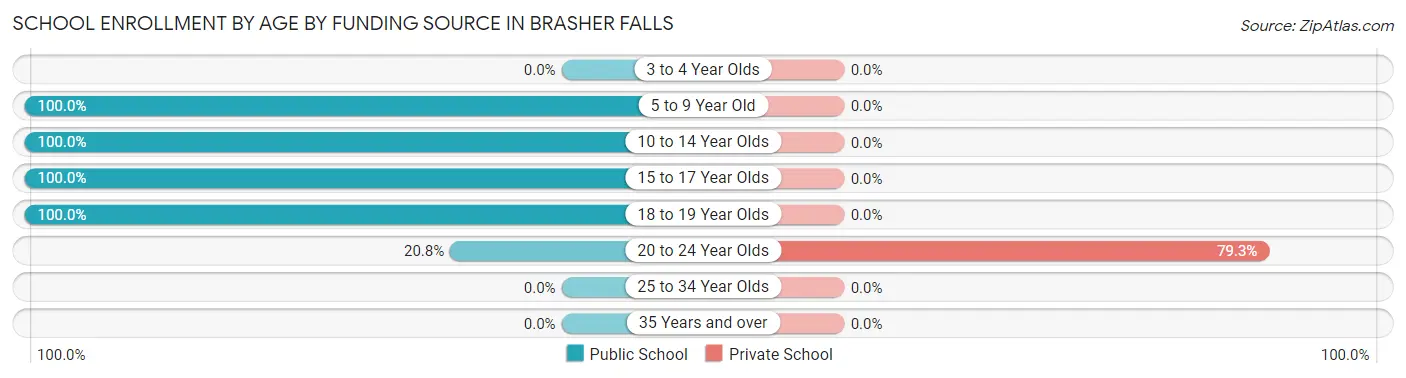
| Age Bracket | Public School | Private School |
| 3 to 4 Year Olds | 0 (0.0%) | 0 (0.0%) |
| 5 to 9 Year Old | 12 (100.0%) | 0 (0.0%) |
| 10 to 14 Year Olds | 26 (100.0%) | 0 (0.0%) |
| 15 to 17 Year Olds | 44 (100.0%) | 0 (0.0%) |
| 18 to 19 Year Olds | 11 (100.0%) | 0 (0.0%) |
| 20 to 24 Year Olds | 11 (20.7%) | 42 (79.2%) |
| 25 to 34 Year Olds | 0 (0.0%) | 0 (0.0%) |
| 35 Years and over | 0 (0.0%) | 0 (0.0%) |
| Total | 104 (71.2%) | 42 (28.8%) |
Educational Attainment by Field of Study in Brasher Falls
Education (35 | 71.4%), engineering (9 | 18.4%), and science & technology (5 | 10.2%) are the most common fields of study among 49 individuals in Brasher Falls who have obtained a bachelor's degree or higher.
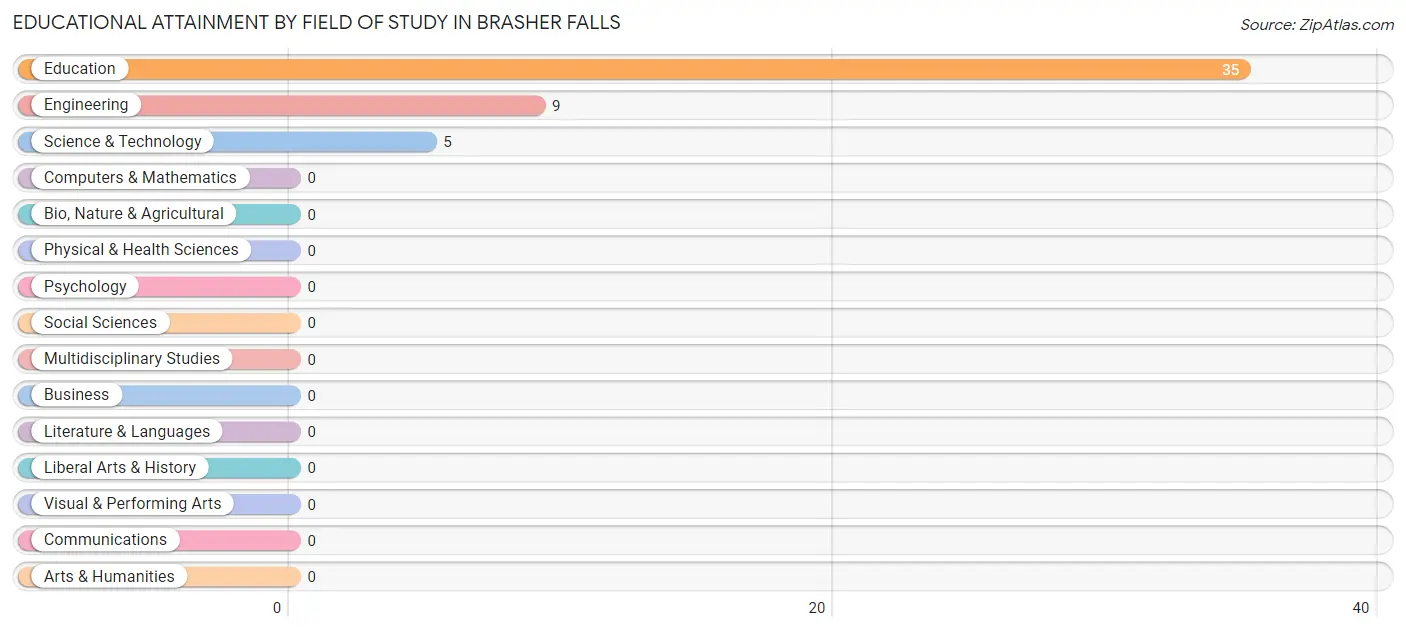
| Field of Study | # Graduates | % Graduates |
| Computers & Mathematics | 0 | 0.0% |
| Bio, Nature & Agricultural | 0 | 0.0% |
| Physical & Health Sciences | 0 | 0.0% |
| Psychology | 0 | 0.0% |
| Social Sciences | 0 | 0.0% |
| Engineering | 9 | 18.4% |
| Multidisciplinary Studies | 0 | 0.0% |
| Science & Technology | 5 | 10.2% |
| Business | 0 | 0.0% |
| Education | 35 | 71.4% |
| Literature & Languages | 0 | 0.0% |
| Liberal Arts & History | 0 | 0.0% |
| Visual & Performing Arts | 0 | 0.0% |
| Communications | 0 | 0.0% |
| Arts & Humanities | 0 | 0.0% |
| Total | 49 | 100.0% |
Transportation & Commute in Brasher Falls
Vehicle Availability by Sex in Brasher Falls
The most prevalent vehicle ownership categories in Brasher Falls are males with 2 vehicles (20, accounting for 33.9%) and females with 2 vehicles (26, making up 15.9%).
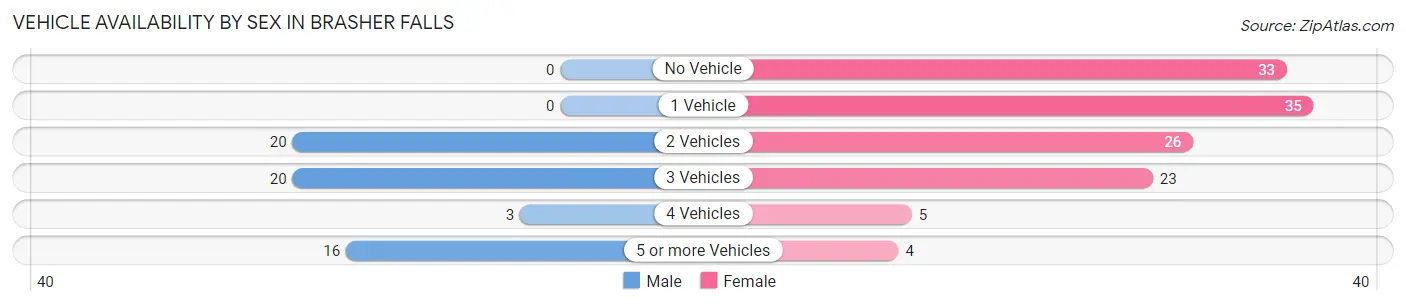
| Vehicles Available | Male | Female |
| No Vehicle | 0 (0.0%) | 33 (26.2%) |
| 1 Vehicle | 0 (0.0%) | 35 (27.8%) |
| 2 Vehicles | 20 (33.9%) | 26 (20.6%) |
| 3 Vehicles | 20 (33.9%) | 23 (18.2%) |
| 4 Vehicles | 3 (5.1%) | 5 (4.0%) |
| 5 or more Vehicles | 16 (27.1%) | 4 (3.2%) |
| Total | 59 (100.0%) | 126 (100.0%) |
Commute Time in Brasher Falls
The most frequently occuring commute durations in Brasher Falls are 20 to 24 minutes (56 commuters, 30.3%), 25 to 29 minutes (46 commuters, 24.9%), and less than 5 minutes (31 commuters, 16.8%).
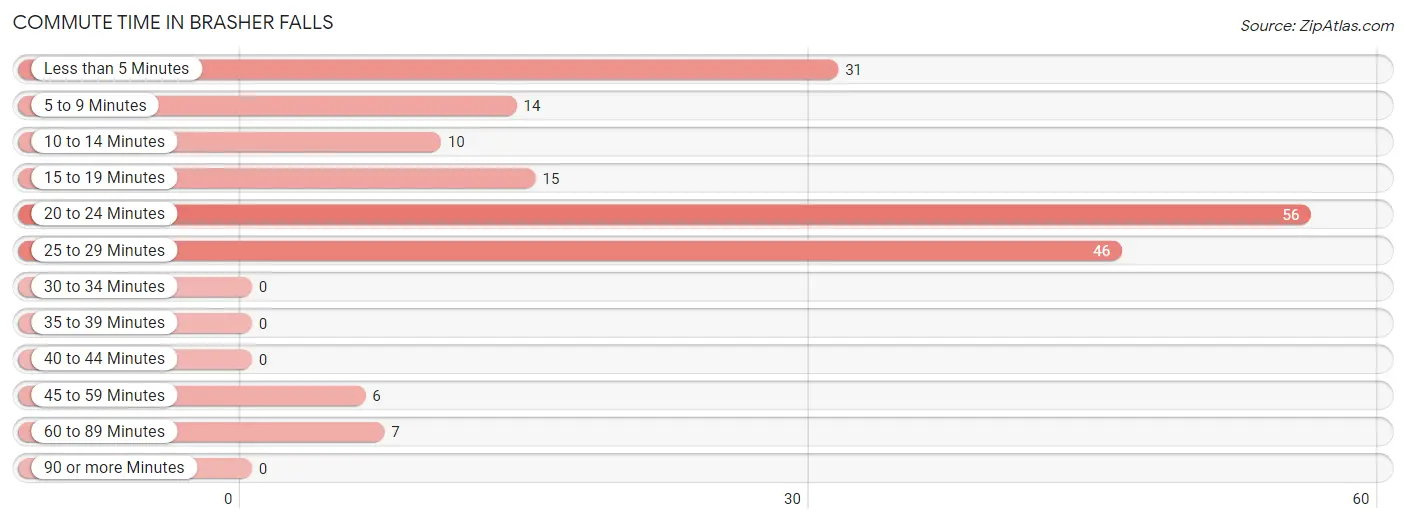
| Commute Time | # Commuters | % Commuters |
| Less than 5 Minutes | 31 | 16.8% |
| 5 to 9 Minutes | 14 | 7.6% |
| 10 to 14 Minutes | 10 | 5.4% |
| 15 to 19 Minutes | 15 | 8.1% |
| 20 to 24 Minutes | 56 | 30.3% |
| 25 to 29 Minutes | 46 | 24.9% |
| 30 to 34 Minutes | 0 | 0.0% |
| 35 to 39 Minutes | 0 | 0.0% |
| 40 to 44 Minutes | 0 | 0.0% |
| 45 to 59 Minutes | 6 | 3.2% |
| 60 to 89 Minutes | 7 | 3.8% |
| 90 or more Minutes | 0 | 0.0% |
Commute Time by Sex in Brasher Falls
The most common commute times in Brasher Falls are 20 to 24 minutes (25 commuters, 42.4%) for males and 25 to 29 minutes (33 commuters, 26.2%) for females.
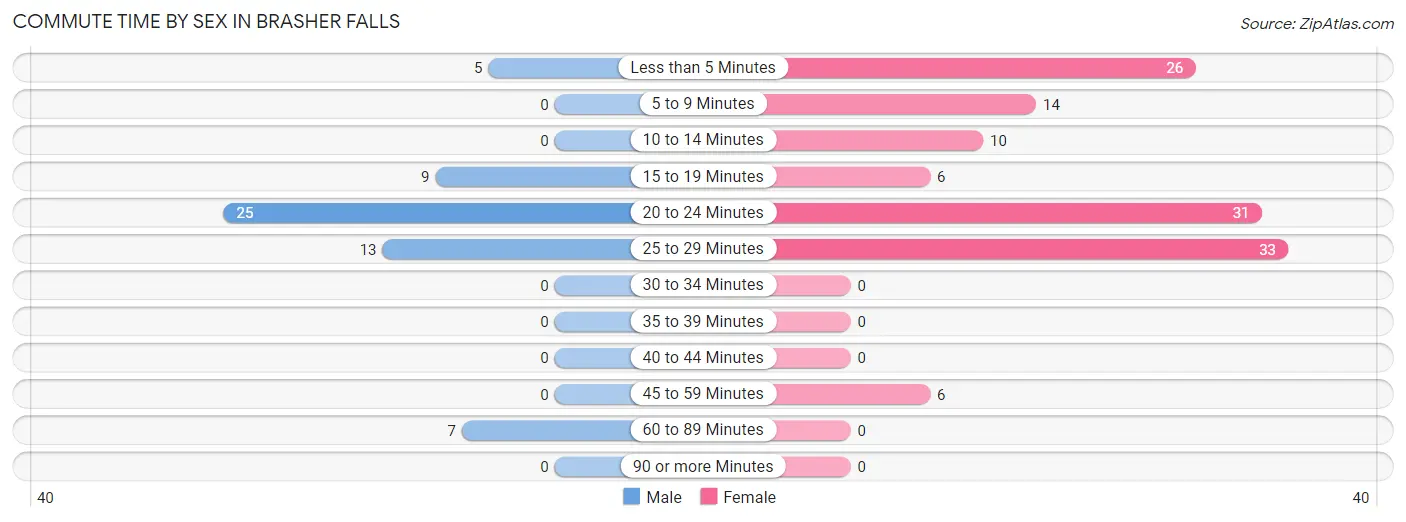
| Commute Time | Male | Female |
| Less than 5 Minutes | 5 (8.5%) | 26 (20.6%) |
| 5 to 9 Minutes | 0 (0.0%) | 14 (11.1%) |
| 10 to 14 Minutes | 0 (0.0%) | 10 (7.9%) |
| 15 to 19 Minutes | 9 (15.2%) | 6 (4.8%) |
| 20 to 24 Minutes | 25 (42.4%) | 31 (24.6%) |
| 25 to 29 Minutes | 13 (22.0%) | 33 (26.2%) |
| 30 to 34 Minutes | 0 (0.0%) | 0 (0.0%) |
| 35 to 39 Minutes | 0 (0.0%) | 0 (0.0%) |
| 40 to 44 Minutes | 0 (0.0%) | 0 (0.0%) |
| 45 to 59 Minutes | 0 (0.0%) | 6 (4.8%) |
| 60 to 89 Minutes | 7 (11.9%) | 0 (0.0%) |
| 90 or more Minutes | 0 (0.0%) | 0 (0.0%) |
Time of Departure to Work by Sex in Brasher Falls
The most frequent times of departure to work in Brasher Falls are 6:30 AM to 6:59 AM (19, 32.2%) for males and 9:00 AM to 9:59 AM (43, 34.1%) for females.
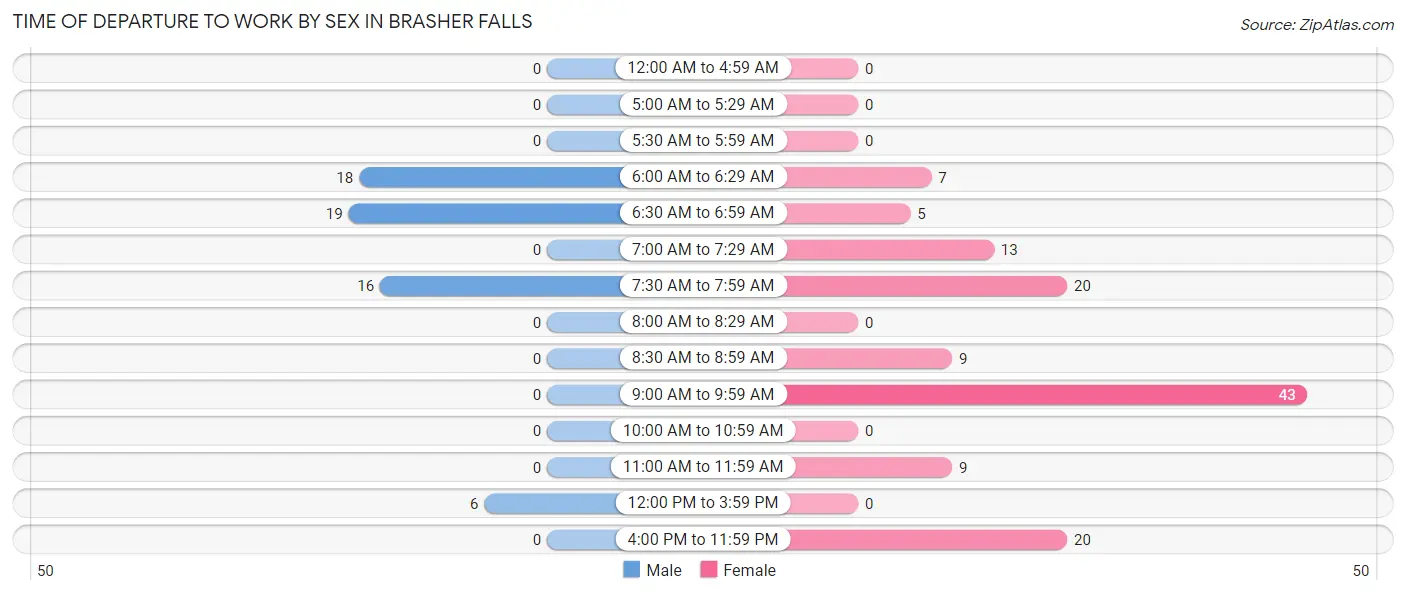
| Time of Departure | Male | Female |
| 12:00 AM to 4:59 AM | 0 (0.0%) | 0 (0.0%) |
| 5:00 AM to 5:29 AM | 0 (0.0%) | 0 (0.0%) |
| 5:30 AM to 5:59 AM | 0 (0.0%) | 0 (0.0%) |
| 6:00 AM to 6:29 AM | 18 (30.5%) | 7 (5.6%) |
| 6:30 AM to 6:59 AM | 19 (32.2%) | 5 (4.0%) |
| 7:00 AM to 7:29 AM | 0 (0.0%) | 13 (10.3%) |
| 7:30 AM to 7:59 AM | 16 (27.1%) | 20 (15.9%) |
| 8:00 AM to 8:29 AM | 0 (0.0%) | 0 (0.0%) |
| 8:30 AM to 8:59 AM | 0 (0.0%) | 9 (7.1%) |
| 9:00 AM to 9:59 AM | 0 (0.0%) | 43 (34.1%) |
| 10:00 AM to 10:59 AM | 0 (0.0%) | 0 (0.0%) |
| 11:00 AM to 11:59 AM | 0 (0.0%) | 9 (7.1%) |
| 12:00 PM to 3:59 PM | 6 (10.2%) | 0 (0.0%) |
| 4:00 PM to 11:59 PM | 0 (0.0%) | 20 (15.9%) |
| Total | 59 (100.0%) | 126 (100.0%) |
Housing Occupancy in Brasher Falls
Occupancy by Ownership in Brasher Falls
Of the total 256 dwellings in Brasher Falls, owner-occupied units account for 109 (42.6%), while renter-occupied units make up 147 (57.4%).
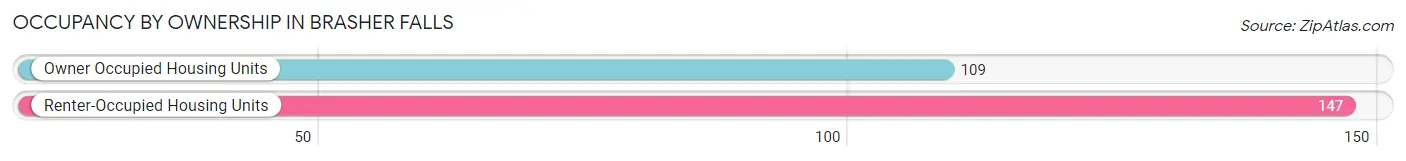
| Occupancy | # Housing Units | % Housing Units |
| Owner Occupied Housing Units | 109 | 42.6% |
| Renter-Occupied Housing Units | 147 | 57.4% |
| Total Occupied Housing Units | 256 | 100.0% |
Occupancy by Household Size in Brasher Falls
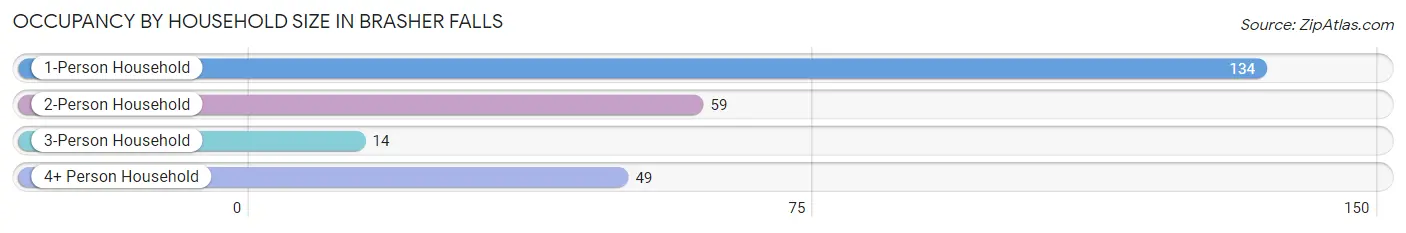
| Household Size | # Housing Units | % Housing Units |
| 1-Person Household | 134 | 52.3% |
| 2-Person Household | 59 | 23.1% |
| 3-Person Household | 14 | 5.5% |
| 4+ Person Household | 49 | 19.1% |
| Total Housing Units | 256 | 100.0% |
Occupancy by Ownership by Household Size in Brasher Falls
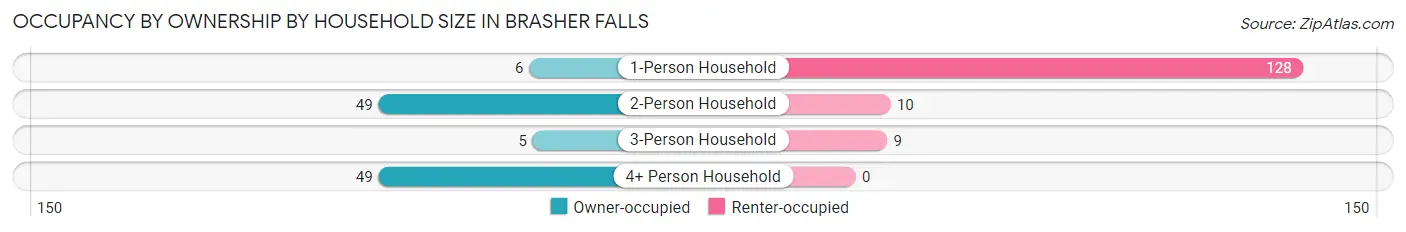
| Household Size | Owner-occupied | Renter-occupied |
| 1-Person Household | 6 (4.5%) | 128 (95.5%) |
| 2-Person Household | 49 (83.1%) | 10 (17.0%) |
| 3-Person Household | 5 (35.7%) | 9 (64.3%) |
| 4+ Person Household | 49 (100.0%) | 0 (0.0%) |
| Total Housing Units | 109 (42.6%) | 147 (57.4%) |
Occupancy by Educational Attainment in Brasher Falls
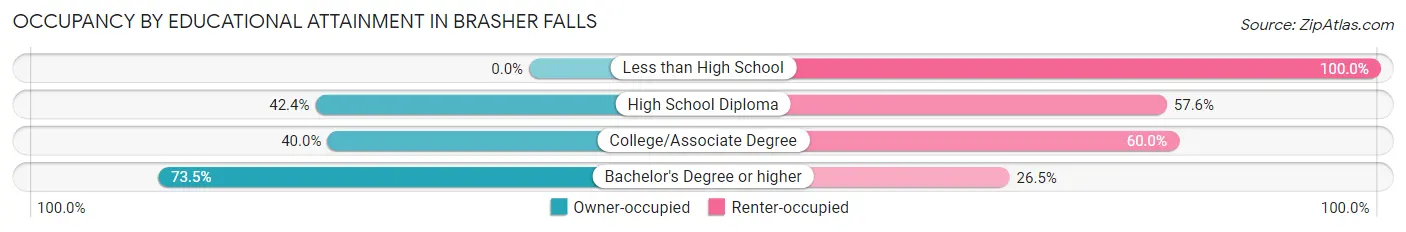
| Household Size | Owner-occupied | Renter-occupied |
| Less than High School | 0 (0.0%) | 19 (100.0%) |
| High School Diploma | 50 (42.4%) | 68 (57.6%) |
| College/Associate Degree | 34 (40.0%) | 51 (60.0%) |
| Bachelor's Degree or higher | 25 (73.5%) | 9 (26.5%) |
Occupancy by Age of Householder in Brasher Falls
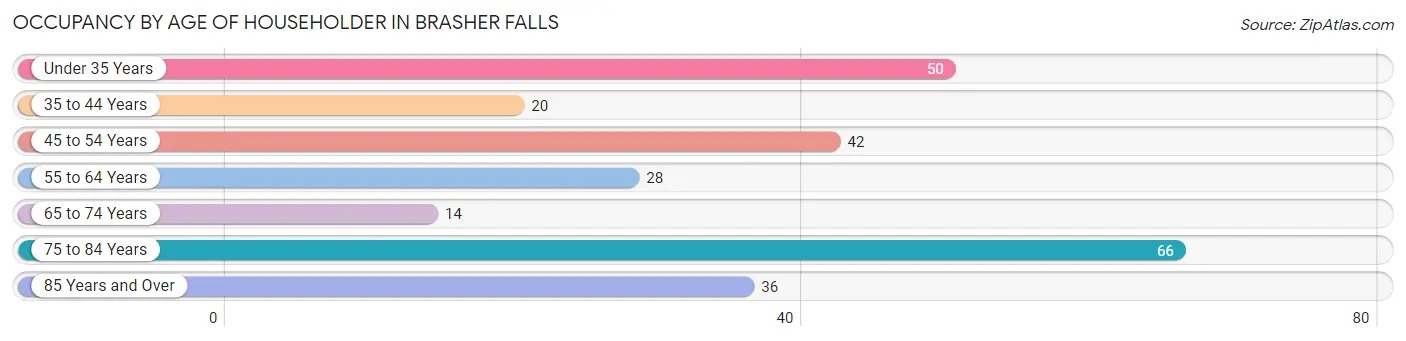
| Age Bracket | # Households | % Households |
| Under 35 Years | 50 | 19.5% |
| 35 to 44 Years | 20 | 7.8% |
| 45 to 54 Years | 42 | 16.4% |
| 55 to 64 Years | 28 | 10.9% |
| 65 to 74 Years | 14 | 5.5% |
| 75 to 84 Years | 66 | 25.8% |
| 85 Years and Over | 36 | 14.1% |
| Total | 256 | 100.0% |
Housing Finances in Brasher Falls
Median Income by Occupancy in Brasher Falls
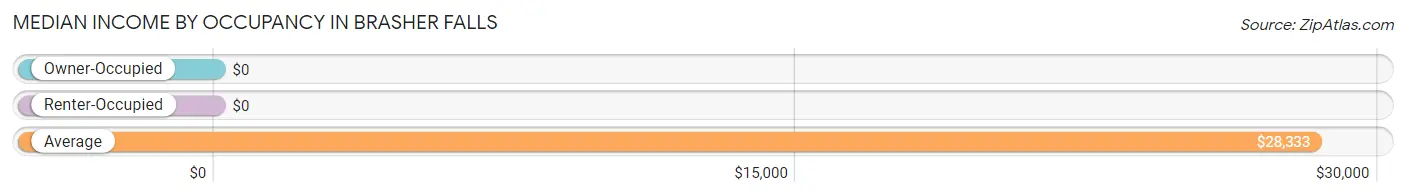
| Occupancy Type | # Households | Median Income |
| Owner-Occupied | 109 (42.6%) | $0 |
| Renter-Occupied | 147 (57.4%) | $0 |
| Average | 256 (100.0%) | $28,333 |
Occupancy by Householder Income Bracket in Brasher Falls
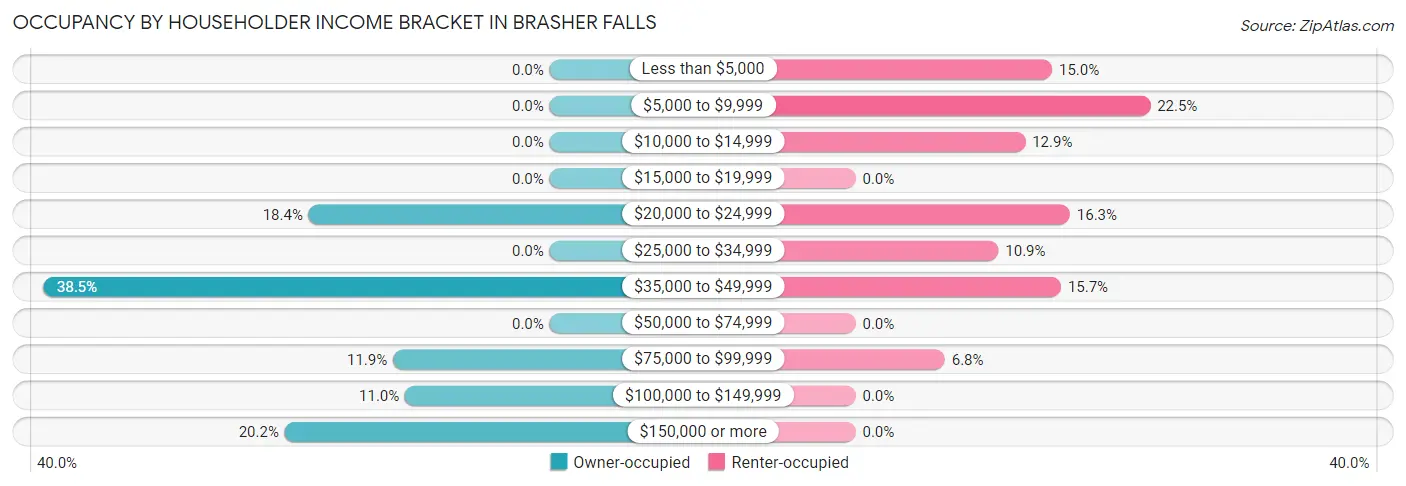
| Income Bracket | Owner-occupied | Renter-occupied |
| Less than $5,000 | 0 (0.0%) | 22 (15.0%) |
| $5,000 to $9,999 | 0 (0.0%) | 33 (22.5%) |
| $10,000 to $14,999 | 0 (0.0%) | 19 (12.9%) |
| $15,000 to $19,999 | 0 (0.0%) | 0 (0.0%) |
| $20,000 to $24,999 | 20 (18.3%) | 24 (16.3%) |
| $25,000 to $34,999 | 0 (0.0%) | 16 (10.9%) |
| $35,000 to $49,999 | 42 (38.5%) | 23 (15.7%) |
| $50,000 to $74,999 | 0 (0.0%) | 0 (0.0%) |
| $75,000 to $99,999 | 13 (11.9%) | 10 (6.8%) |
| $100,000 to $149,999 | 12 (11.0%) | 0 (0.0%) |
| $150,000 or more | 22 (20.2%) | 0 (0.0%) |
| Total | 109 (100.0%) | 147 (100.0%) |
Monthly Housing Cost Tiers in Brasher Falls
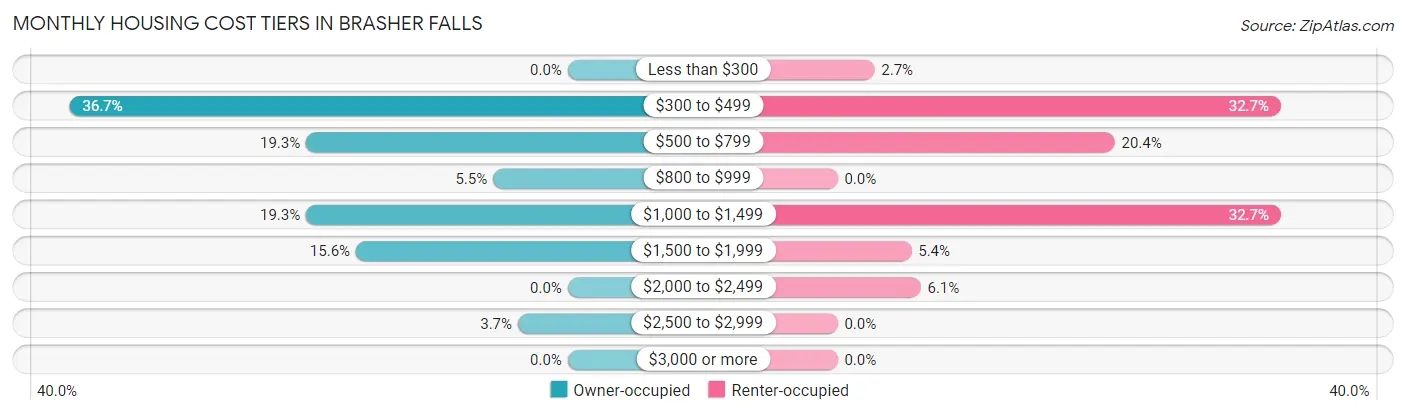
| Monthly Cost | Owner-occupied | Renter-occupied |
| Less than $300 | 0 (0.0%) | 4 (2.7%) |
| $300 to $499 | 40 (36.7%) | 48 (32.7%) |
| $500 to $799 | 21 (19.3%) | 30 (20.4%) |
| $800 to $999 | 6 (5.5%) | 0 (0.0%) |
| $1,000 to $1,499 | 21 (19.3%) | 48 (32.7%) |
| $1,500 to $1,999 | 17 (15.6%) | 8 (5.4%) |
| $2,000 to $2,499 | 0 (0.0%) | 9 (6.1%) |
| $2,500 to $2,999 | 4 (3.7%) | 0 (0.0%) |
| $3,000 or more | 0 (0.0%) | 0 (0.0%) |
| Total | 109 (100.0%) | 147 (100.0%) |
Physical Housing Characteristics in Brasher Falls
Housing Structures in Brasher Falls
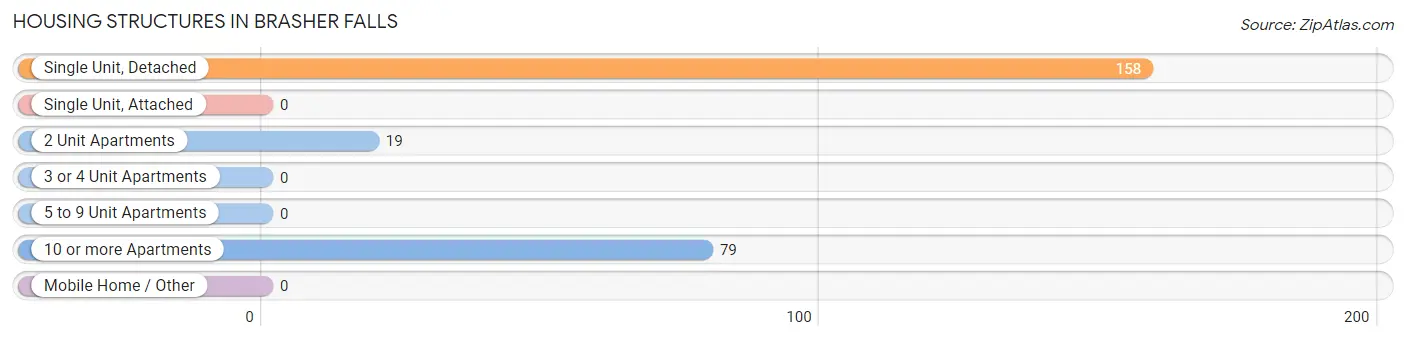
| Structure Type | # Housing Units | % Housing Units |
| Single Unit, Detached | 158 | 61.7% |
| Single Unit, Attached | 0 | 0.0% |
| 2 Unit Apartments | 19 | 7.4% |
| 3 or 4 Unit Apartments | 0 | 0.0% |
| 5 to 9 Unit Apartments | 0 | 0.0% |
| 10 or more Apartments | 79 | 30.9% |
| Mobile Home / Other | 0 | 0.0% |
| Total | 256 | 100.0% |
Housing Structures by Occupancy in Brasher Falls
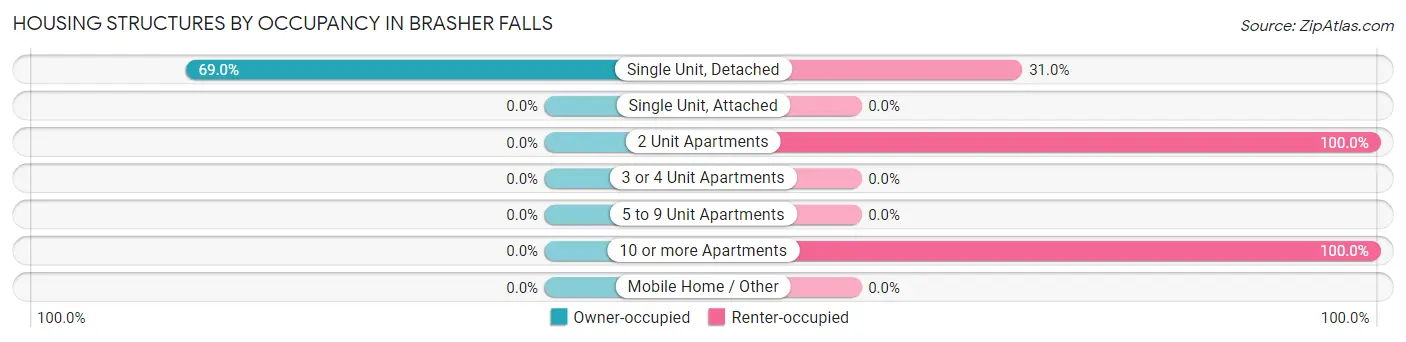
| Structure Type | Owner-occupied | Renter-occupied |
| Single Unit, Detached | 109 (69.0%) | 49 (31.0%) |
| Single Unit, Attached | 0 (0.0%) | 0 (0.0%) |
| 2 Unit Apartments | 0 (0.0%) | 19 (100.0%) |
| 3 or 4 Unit Apartments | 0 (0.0%) | 0 (0.0%) |
| 5 to 9 Unit Apartments | 0 (0.0%) | 0 (0.0%) |
| 10 or more Apartments | 0 (0.0%) | 79 (100.0%) |
| Mobile Home / Other | 0 (0.0%) | 0 (0.0%) |
| Total | 109 (42.6%) | 147 (57.4%) |
Housing Structures by Number of Rooms in Brasher Falls
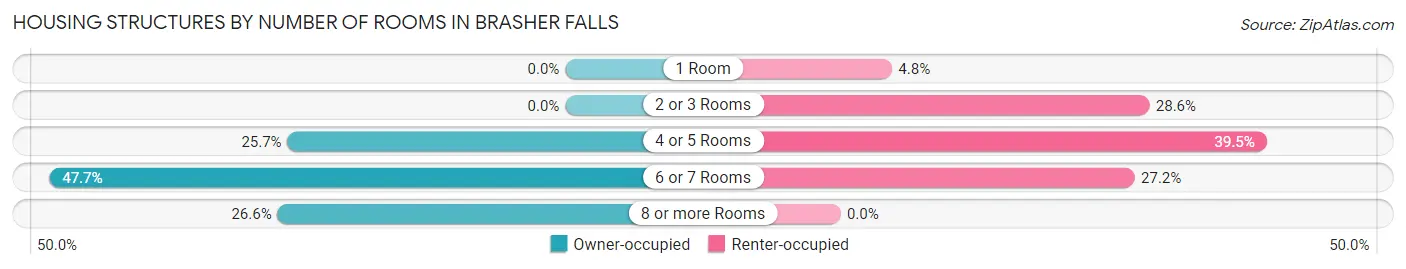
| Number of Rooms | Owner-occupied | Renter-occupied |
| 1 Room | 0 (0.0%) | 7 (4.8%) |
| 2 or 3 Rooms | 0 (0.0%) | 42 (28.6%) |
| 4 or 5 Rooms | 28 (25.7%) | 58 (39.5%) |
| 6 or 7 Rooms | 52 (47.7%) | 40 (27.2%) |
| 8 or more Rooms | 29 (26.6%) | 0 (0.0%) |
| Total | 109 (100.0%) | 147 (100.0%) |
Housing Structure by Heating Type in Brasher Falls
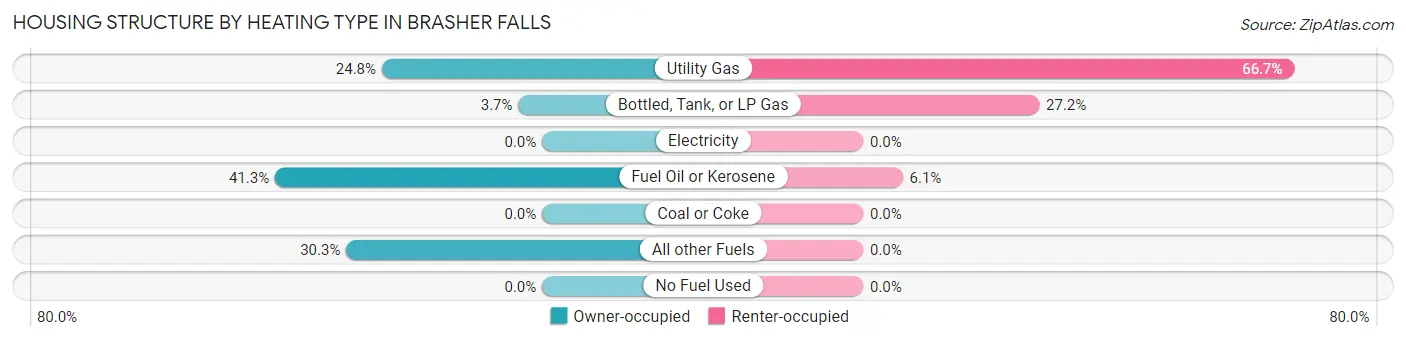
| Heating Type | Owner-occupied | Renter-occupied |
| Utility Gas | 27 (24.8%) | 98 (66.7%) |
| Bottled, Tank, or LP Gas | 4 (3.7%) | 40 (27.2%) |
| Electricity | 0 (0.0%) | 0 (0.0%) |
| Fuel Oil or Kerosene | 45 (41.3%) | 9 (6.1%) |
| Coal or Coke | 0 (0.0%) | 0 (0.0%) |
| All other Fuels | 33 (30.3%) | 0 (0.0%) |
| No Fuel Used | 0 (0.0%) | 0 (0.0%) |
| Total | 109 (100.0%) | 147 (100.0%) |
Household Vehicle Usage in Brasher Falls
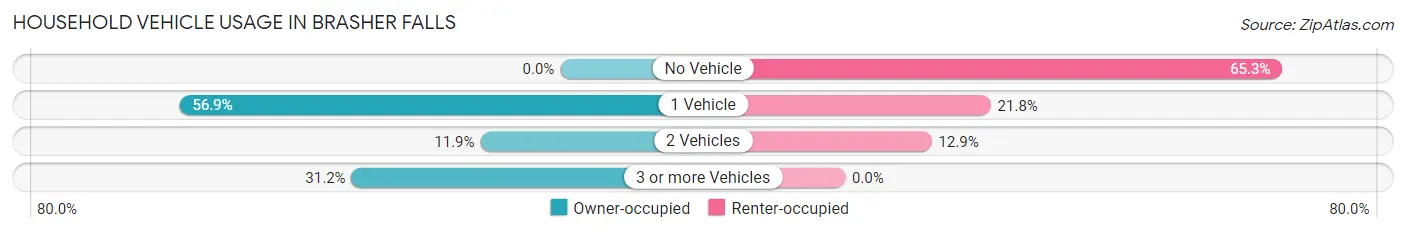
| Vehicles per Household | Owner-occupied | Renter-occupied |
| No Vehicle | 0 (0.0%) | 96 (65.3%) |
| 1 Vehicle | 62 (56.9%) | 32 (21.8%) |
| 2 Vehicles | 13 (11.9%) | 19 (12.9%) |
| 3 or more Vehicles | 34 (31.2%) | 0 (0.0%) |
| Total | 109 (100.0%) | 147 (100.0%) |
Real Estate & Mortgages in Brasher Falls
Real Estate and Mortgage Overview in Brasher Falls
| Characteristic | Without Mortgage | With Mortgage |
| Housing Units | 56 | 53 |
| Median Property Value | $82,200 | $181,300 |
| Median Household Income | $43,500 | $22 |
| Monthly Housing Costs | $440 | $0 |
| Real Estate Taxes | $1,389 | $0 |
Property Value by Mortgage Status in Brasher Falls
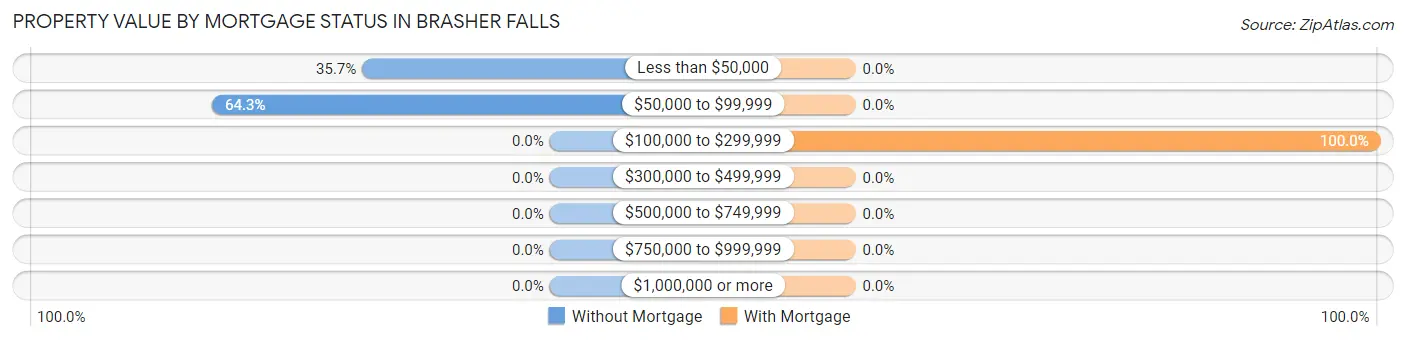
| Property Value | Without Mortgage | With Mortgage |
| Less than $50,000 | 20 (35.7%) | 0 (0.0%) |
| $50,000 to $99,999 | 36 (64.3%) | 0 (0.0%) |
| $100,000 to $299,999 | 0 (0.0%) | 53 (100.0%) |
| $300,000 to $499,999 | 0 (0.0%) | 0 (0.0%) |
| $500,000 to $749,999 | 0 (0.0%) | 0 (0.0%) |
| $750,000 to $999,999 | 0 (0.0%) | 0 (0.0%) |
| $1,000,000 or more | 0 (0.0%) | 0 (0.0%) |
| Total | 56 (100.0%) | 53 (100.0%) |
Household Income by Mortgage Status in Brasher Falls
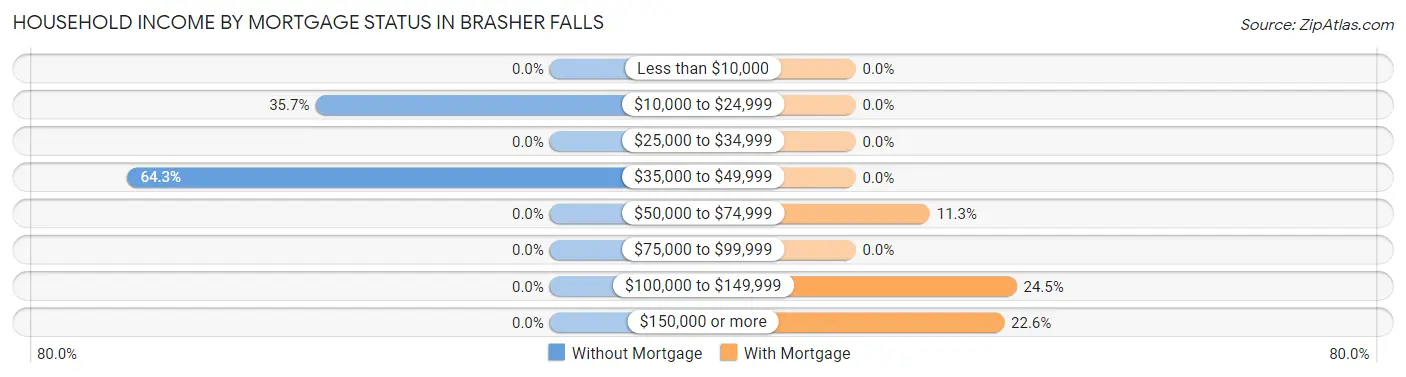
| Household Income | Without Mortgage | With Mortgage |
| Less than $10,000 | 0 (0.0%) | 0 (0.0%) |
| $10,000 to $24,999 | 20 (35.7%) | 0 (0.0%) |
| $25,000 to $34,999 | 0 (0.0%) | 0 (0.0%) |
| $35,000 to $49,999 | 36 (64.3%) | 0 (0.0%) |
| $50,000 to $74,999 | 0 (0.0%) | 6 (11.3%) |
| $75,000 to $99,999 | 0 (0.0%) | 0 (0.0%) |
| $100,000 to $149,999 | 0 (0.0%) | 13 (24.5%) |
| $150,000 or more | 0 (0.0%) | 12 (22.6%) |
| Total | 56 (100.0%) | 53 (100.0%) |
Property Value to Household Income Ratio in Brasher Falls
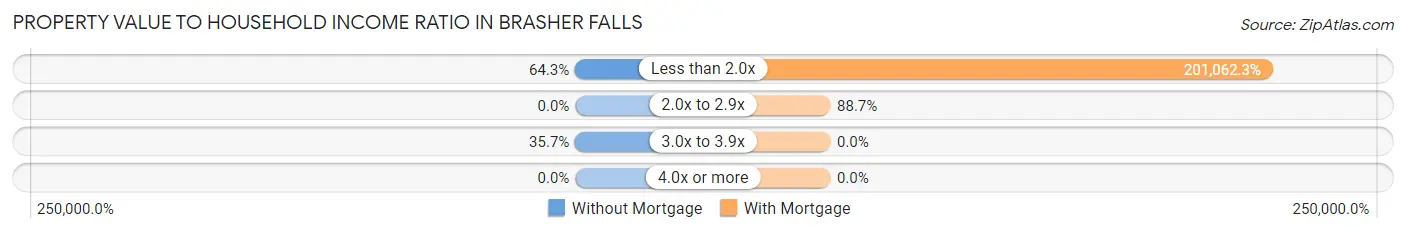
| Value-to-Income Ratio | Without Mortgage | With Mortgage |
| Less than 2.0x | 36 (64.3%) | 106,563 (201,062.3%) |
| 2.0x to 2.9x | 0 (0.0%) | 47 (88.7%) |
| 3.0x to 3.9x | 20 (35.7%) | 0 (0.0%) |
| 4.0x or more | 0 (0.0%) | 0 (0.0%) |
| Total | 56 (100.0%) | 53 (100.0%) |
Real Estate Taxes by Mortgage Status in Brasher Falls
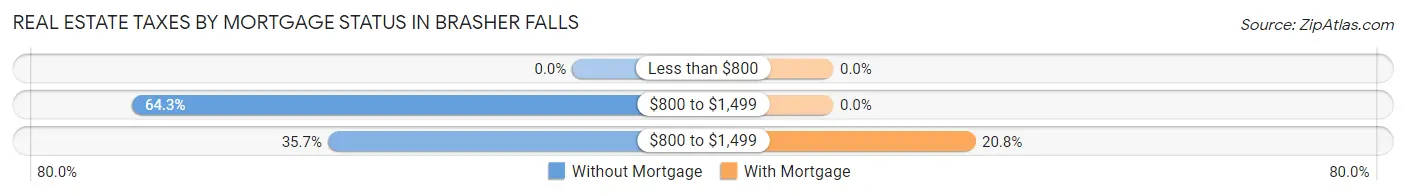
| Property Taxes | Without Mortgage | With Mortgage |
| Less than $800 | 0 (0.0%) | 0 (0.0%) |
| $800 to $1,499 | 36 (64.3%) | 0 (0.0%) |
| $800 to $1,499 | 20 (35.7%) | 11 (20.7%) |
| Total | 56 (100.0%) | 53 (100.0%) |
Health & Disability in Brasher Falls
Health Insurance Coverage by Age in Brasher Falls
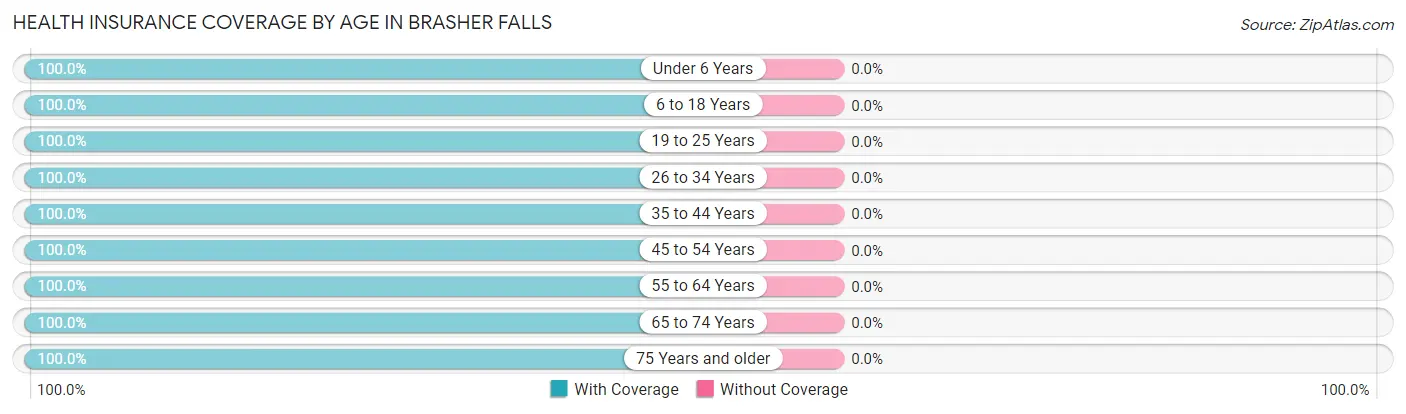
| Age Bracket | With Coverage | Without Coverage |
| Under 6 Years | 15 (100.0%) | 0 (0.0%) |
| 6 to 18 Years | 93 (100.0%) | 0 (0.0%) |
| 19 to 25 Years | 82 (100.0%) | 0 (0.0%) |
| 26 to 34 Years | 7 (100.0%) | 0 (0.0%) |
| 35 to 44 Years | 55 (100.0%) | 0 (0.0%) |
| 45 to 54 Years | 59 (100.0%) | 0 (0.0%) |
| 55 to 64 Years | 47 (100.0%) | 0 (0.0%) |
| 65 to 74 Years | 14 (100.0%) | 0 (0.0%) |
| 75 Years and older | 127 (100.0%) | 0 (0.0%) |
| Total | 499 (100.0%) | 0 (0.0%) |
Health Insurance Coverage by Citizenship Status in Brasher Falls
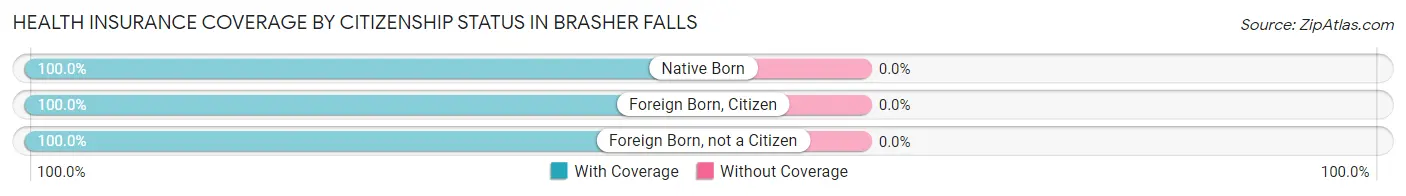
| Citizenship Status | With Coverage | Without Coverage |
| Native Born | 15 (100.0%) | 0 (0.0%) |
| Foreign Born, Citizen | 93 (100.0%) | 0 (0.0%) |
| Foreign Born, not a Citizen | 82 (100.0%) | 0 (0.0%) |
Health Insurance Coverage by Household Income in Brasher Falls
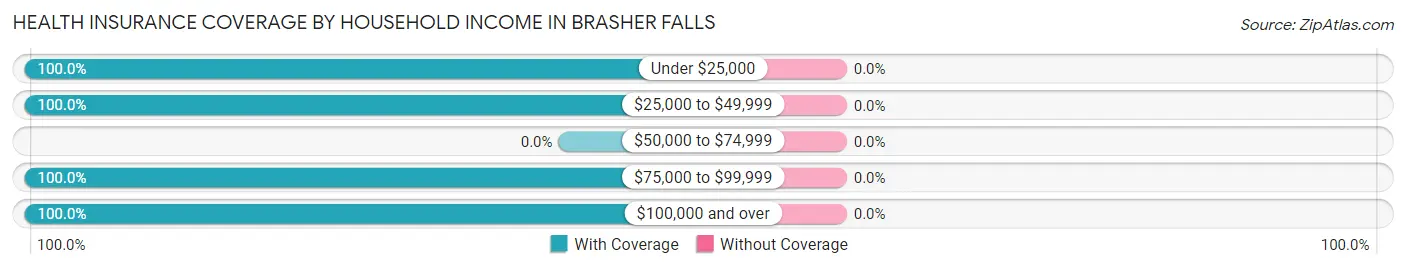
| Household Income | With Coverage | Without Coverage |
| Under $25,000 | 137 (100.0%) | 0 (0.0%) |
| $25,000 to $49,999 | 167 (100.0%) | 0 (0.0%) |
| $50,000 to $74,999 | 0 (0.0%) | 0 (0.0%) |
| $75,000 to $99,999 | 48 (100.0%) | 0 (0.0%) |
| $100,000 and over | 147 (100.0%) | 0 (0.0%) |
Public vs Private Health Insurance Coverage by Age in Brasher Falls
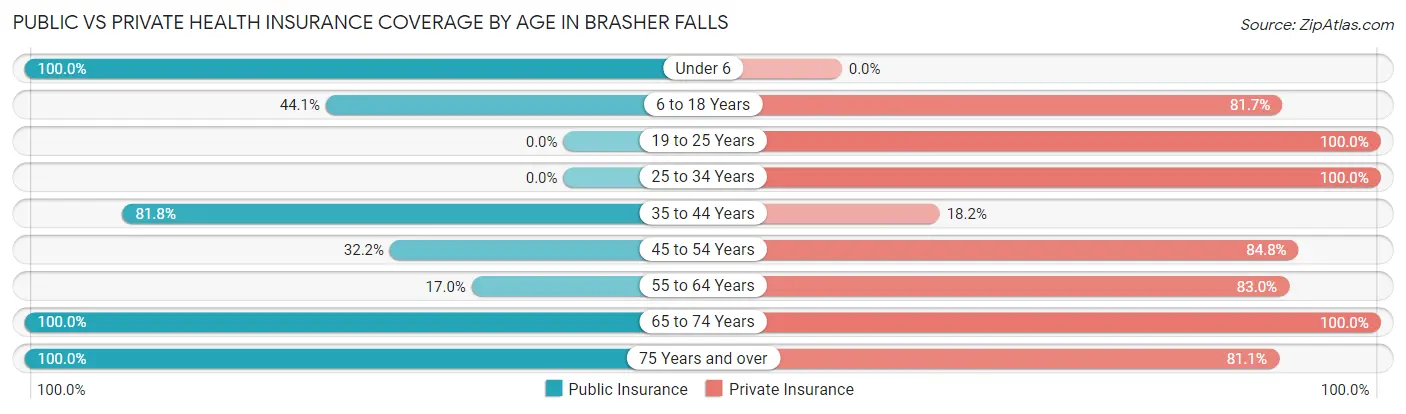
| Age Bracket | Public Insurance | Private Insurance |
| Under 6 | 15 (100.0%) | 0 (0.0%) |
| 6 to 18 Years | 41 (44.1%) | 76 (81.7%) |
| 19 to 25 Years | 0 (0.0%) | 82 (100.0%) |
| 25 to 34 Years | 0 (0.0%) | 7 (100.0%) |
| 35 to 44 Years | 45 (81.8%) | 10 (18.2%) |
| 45 to 54 Years | 19 (32.2%) | 50 (84.8%) |
| 55 to 64 Years | 8 (17.0%) | 39 (83.0%) |
| 65 to 74 Years | 14 (100.0%) | 14 (100.0%) |
| 75 Years and over | 127 (100.0%) | 103 (81.1%) |
| Total | 269 (53.9%) | 381 (76.3%) |
Disability Status by Sex by Age in Brasher Falls
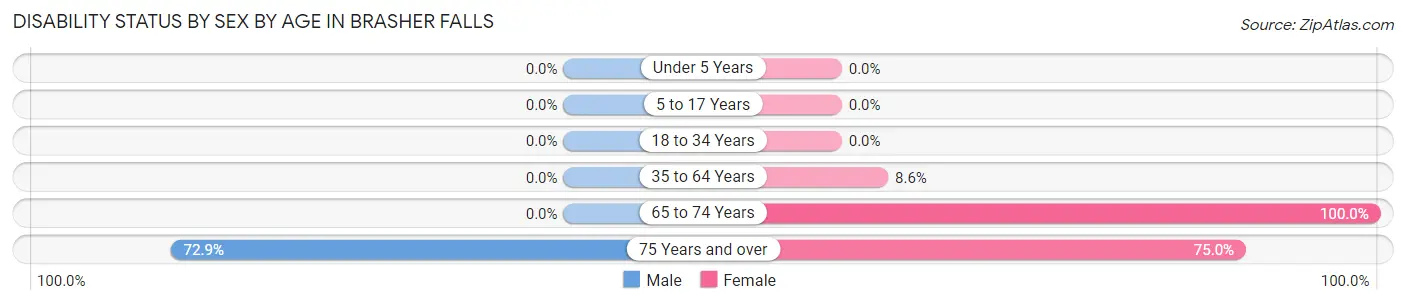
| Age Bracket | Male | Female |
| Under 5 Years | 0 (0.0%) | 0 (0.0%) |
| 5 to 17 Years | 0 (0.0%) | 0 (0.0%) |
| 18 to 34 Years | 0 (0.0%) | 0 (0.0%) |
| 35 to 64 Years | 0 (0.0%) | 8 (8.6%) |
| 65 to 74 Years | 0 (0.0%) | 14 (100.0%) |
| 75 Years and over | 43 (72.9%) | 51 (75.0%) |
Disability Class by Sex by Age in Brasher Falls
Disability Class: Hearing Difficulty
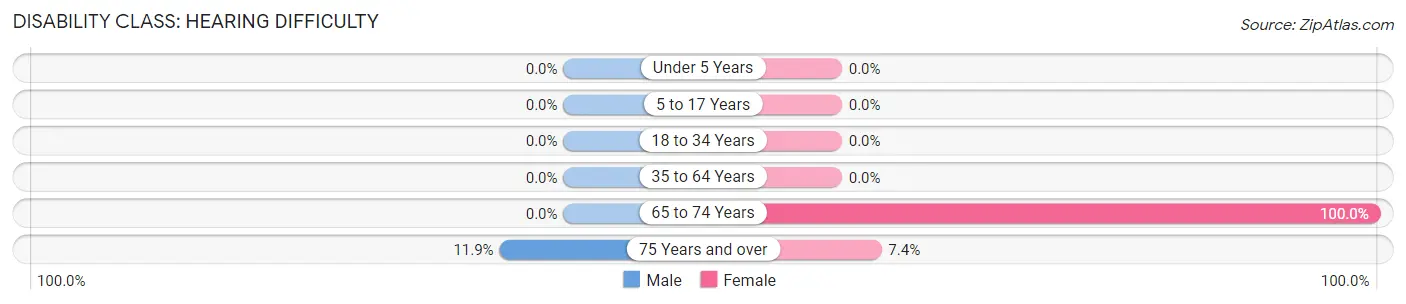
| Age Bracket | Male | Female |
| Under 5 Years | 0 (0.0%) | 0 (0.0%) |
| 5 to 17 Years | 0 (0.0%) | 0 (0.0%) |
| 18 to 34 Years | 0 (0.0%) | 0 (0.0%) |
| 35 to 64 Years | 0 (0.0%) | 0 (0.0%) |
| 65 to 74 Years | 0 (0.0%) | 14 (100.0%) |
| 75 Years and over | 7 (11.9%) | 5 (7.3%) |
Disability Class: Vision Difficulty
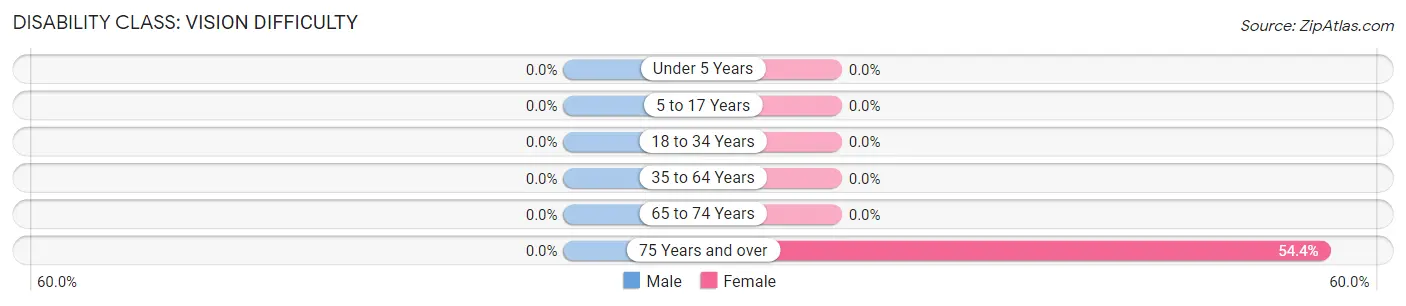
| Age Bracket | Male | Female |
| Under 5 Years | 0 (0.0%) | 0 (0.0%) |
| 5 to 17 Years | 0 (0.0%) | 0 (0.0%) |
| 18 to 34 Years | 0 (0.0%) | 0 (0.0%) |
| 35 to 64 Years | 0 (0.0%) | 0 (0.0%) |
| 65 to 74 Years | 0 (0.0%) | 0 (0.0%) |
| 75 Years and over | 0 (0.0%) | 37 (54.4%) |
Disability Class: Cognitive Difficulty
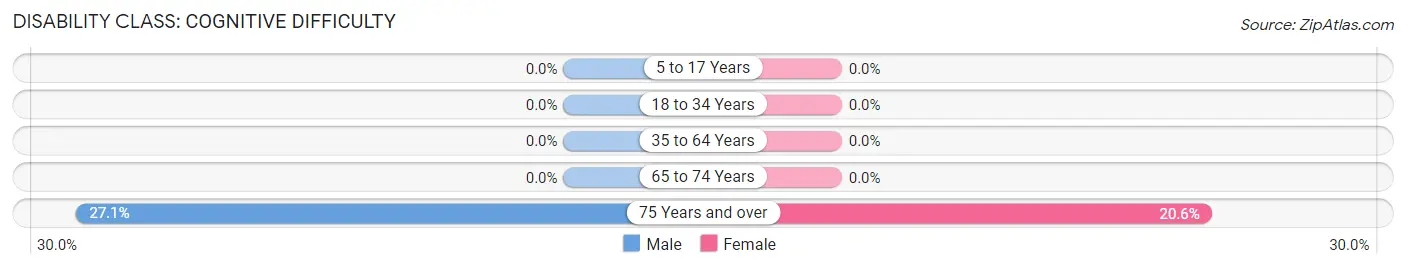
| Age Bracket | Male | Female |
| 5 to 17 Years | 0 (0.0%) | 0 (0.0%) |
| 18 to 34 Years | 0 (0.0%) | 0 (0.0%) |
| 35 to 64 Years | 0 (0.0%) | 0 (0.0%) |
| 65 to 74 Years | 0 (0.0%) | 0 (0.0%) |
| 75 Years and over | 16 (27.1%) | 14 (20.6%) |
Disability Class: Ambulatory Difficulty
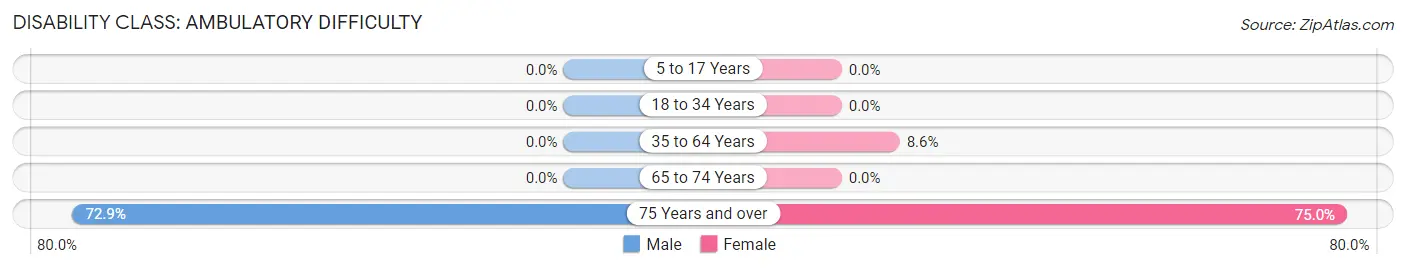
| Age Bracket | Male | Female |
| 5 to 17 Years | 0 (0.0%) | 0 (0.0%) |
| 18 to 34 Years | 0 (0.0%) | 0 (0.0%) |
| 35 to 64 Years | 0 (0.0%) | 8 (8.6%) |
| 65 to 74 Years | 0 (0.0%) | 0 (0.0%) |
| 75 Years and over | 43 (72.9%) | 51 (75.0%) |
Disability Class: Self-Care Difficulty
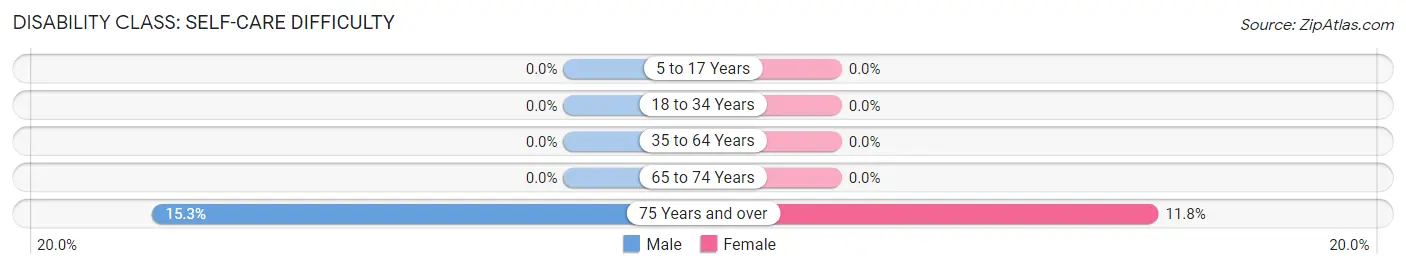
| Age Bracket | Male | Female |
| 5 to 17 Years | 0 (0.0%) | 0 (0.0%) |
| 18 to 34 Years | 0 (0.0%) | 0 (0.0%) |
| 35 to 64 Years | 0 (0.0%) | 0 (0.0%) |
| 65 to 74 Years | 0 (0.0%) | 0 (0.0%) |
| 75 Years and over | 9 (15.2%) | 8 (11.8%) |
Technology Access in Brasher Falls
Computing Device Access in Brasher Falls
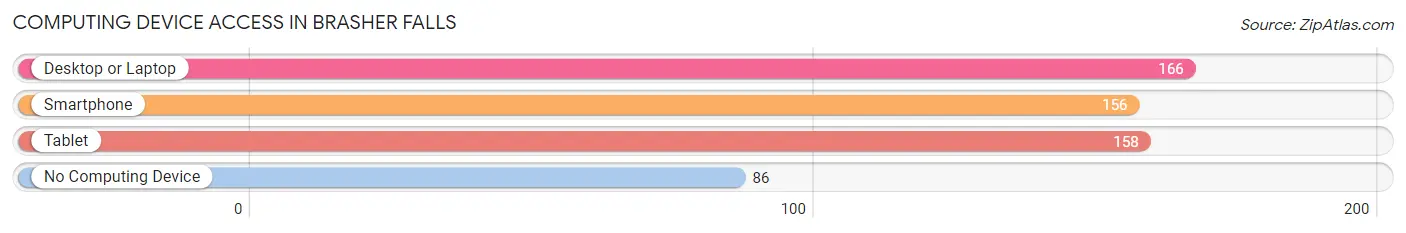
| Device Type | # Households | % Households |
| Desktop or Laptop | 166 | 64.8% |
| Smartphone | 156 | 60.9% |
| Tablet | 158 | 61.7% |
| No Computing Device | 86 | 33.6% |
| Total | 256 | 100.0% |
Internet Access in Brasher Falls
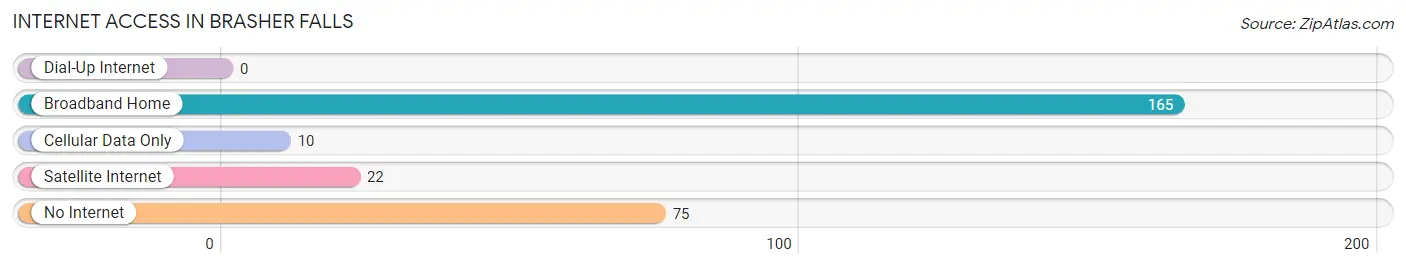
| Internet Type | # Households | % Households |
| Dial-Up Internet | 0 | 0.0% |
| Broadband Home | 165 | 64.4% |
| Cellular Data Only | 10 | 3.9% |
| Satellite Internet | 22 | 8.6% |
| No Internet | 75 | 29.3% |
| Total | 256 | 100.0% |
Brasher Falls Summary
Brasher Falls is a small village located in St. Lawrence County, New York, United States. The village is situated on the banks of the St. Lawrence River, and is part of the Town of Brasher. The population of the village was 1,093 at the 2010 census.
History
The area that is now Brasher Falls was first settled in the late 1700s by French-Canadian immigrants. The village was originally known as “Brasher’s Falls” after the first settler, John Brasher. The village was incorporated in 1848.
In the late 1800s, the village was a major lumbering center. The lumber industry was the main source of employment for the village until the early 1900s, when the industry began to decline.
In the early 1900s, the village began to develop as a tourist destination. The village was home to several resorts, including the Brasher Falls Hotel, which was built in the late 1800s and was a popular destination for tourists.
The village was also home to several factories, including a paper mill, a tannery, and a furniture factory. These factories provided employment for many of the village’s residents.
Geography
Brasher Falls is located at 44°45'25" North, 74°59'45" West (44.756944, -74.995833). The village is situated on the banks of the St. Lawrence River, and is part of the Town of Brasher.
The village has a total area of 0.7 square miles, all of which is land. The village is located near the Canadian border, and is approximately 25 miles south of the city of Ogdensburg.
Economy
The economy of Brasher Falls is largely based on tourism. The village is home to several resorts, including the Brasher Falls Hotel, which is a popular destination for tourists.
The village is also home to several factories, including a paper mill, a tannery, and a furniture factory. These factories provide employment for many of the village’s residents.
Demographics
As of the 2010 census, the population of Brasher Falls was 1,093. The racial makeup of the village was 97.2% White, 0.7% African American, 0.2% Native American, 0.2% Asian, 0.1% Pacific Islander, 0.2% from other races, and 1.6% from two or more races. Hispanic or Latino of any race were 1.2% of the population.
The median income for a household in the village was $37,500, and the median income for a family was $41,250. The per capita income for the village was $17,845. About 11.2% of families and 13.2% of the population were below the poverty line, including 16.2% of those under age 18 and 8.3% of those age 65 or over.
Common Questions
What is the Total Population of Brasher Falls?
Total Population of Brasher Falls is 510.
What is the Total Male Population of Brasher Falls?
Total Male Population of Brasher Falls is 207.
What is the Total Female Population of Brasher Falls?
Total Female Population of Brasher Falls is 303.
What is the Ratio of Males per 100 Females in Brasher Falls?
There are 68.32 Males per 100 Females in Brasher Falls.
What is the Ratio of Females per 100 Males in Brasher Falls?
There are 146.38 Females per 100 Males in Brasher Falls.
What is the Median Population Age in Brasher Falls?
Median Population Age in Brasher Falls is 46.3 Years.
What is the Average Family Size in Brasher Falls
Average Family Size in Brasher Falls is 3.0 People.
What is the Average Household Size in Brasher Falls
Average Household Size in Brasher Falls is 1.9 People.
What is Per Capita Income in Brasher Falls?
Per Capita income in Brasher Falls is $24,191.
What is the Median Family Income in Brasher Falls?
Median Family Income in Brasher Falls is $48,594.
What is the Median Household income in Brasher Falls?
Median Household Income in Brasher Falls is $28,333.
What is Inequality or Gini Index in Brasher Falls?
Inequality or Gini Index in Brasher Falls is 0.50.
How Large is the Labor Force in Brasher Falls?
There are 185 People in the Labor Forcein in Brasher Falls.
What is the Percentage of People in the Labor Force in Brasher Falls?
42.4% of People are in the Labor Force in Brasher Falls.