Ballston Spa, NY
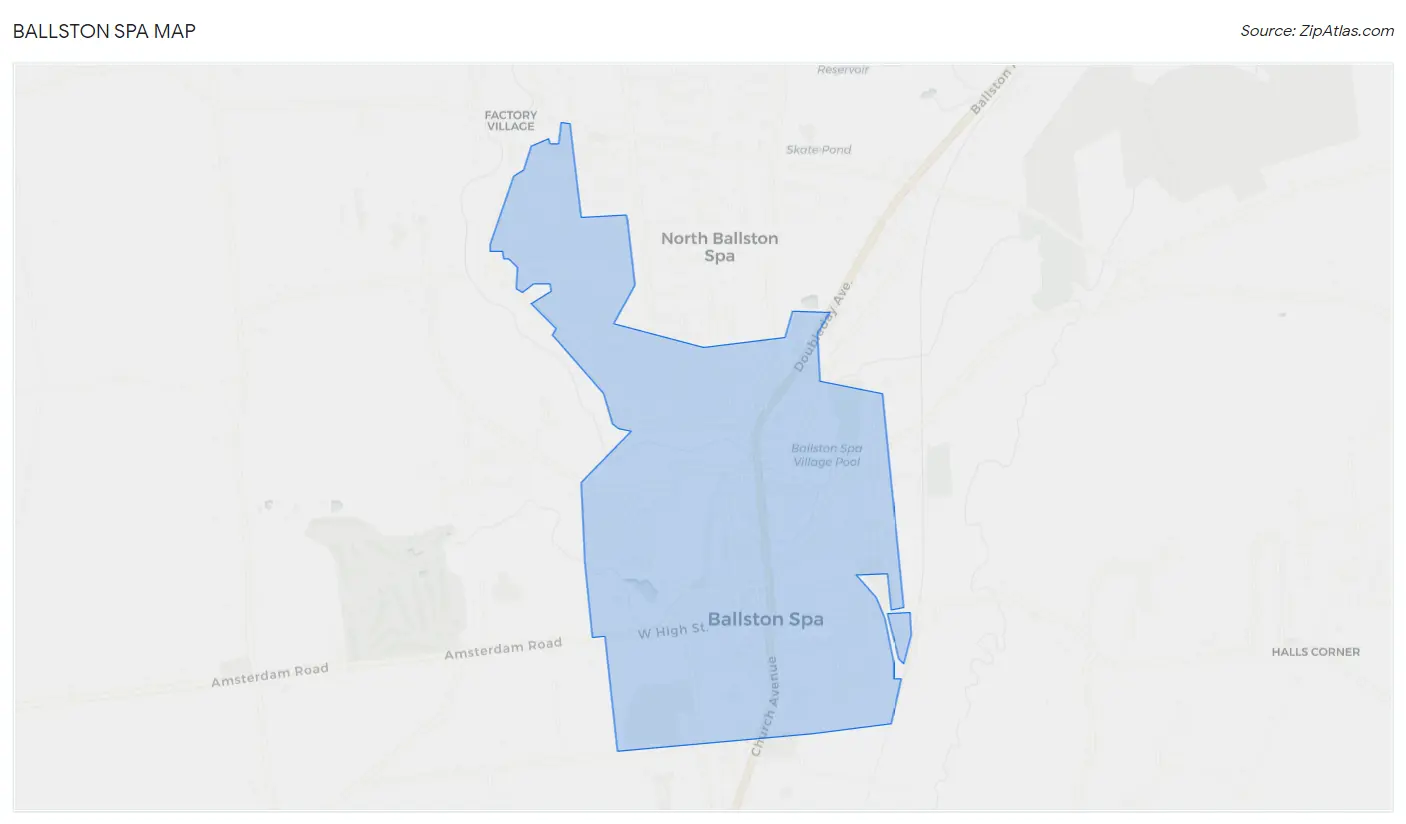
Ballston Spa Map
Ballston Spa Overview
5,288
TOTAL POPULATION
2,507
MALE POPULATION
2,781
FEMALE POPULATION
90.15
MALES / 100 FEMALES
110.93
FEMALES / 100 MALES
39.9
MEDIAN AGE
3.1
AVG FAMILY SIZE
2.3
AVG HOUSEHOLD SIZE
$43,565
PER CAPITA INCOME
$121,667
AVG FAMILY INCOME
$78,136
AVG HOUSEHOLD INCOME
25.7%
WAGE / INCOME GAP [ % ]
74.3¢/ $1
WAGE / INCOME GAP [ $ ]
0.38
INEQUALITY / GINI INDEX
3,146
LABOR FORCE [ PEOPLE ]
73.6%
PERCENT IN LABOR FORCE
2.5%
UNEMPLOYMENT RATE
Ballston Spa Zip Codes
Ballston Spa Area Codes
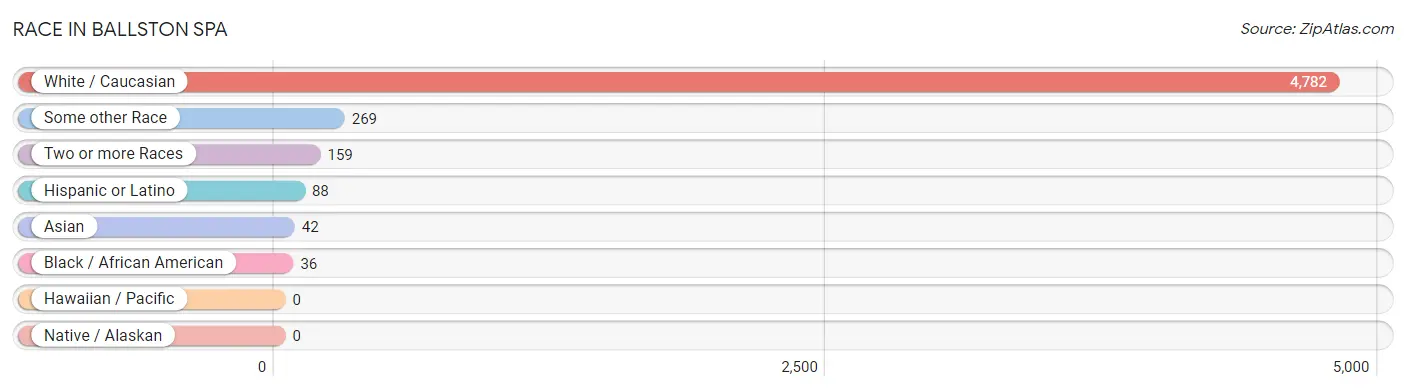
Race in Ballston Spa
The most populous races in Ballston Spa are White / Caucasian (4,782 | 90.4%), Some other Race (269 | 5.1%), and Two or more Races (159 | 3.0%).
| Race | # Population | % Population |
| Asian | 42 | 0.8% |
| Black / African American | 36 | 0.7% |
| Hawaiian / Pacific | 0 | 0.0% |
| Hispanic or Latino | 88 | 1.7% |
| Native / Alaskan | 0 | 0.0% |
| White / Caucasian | 4,782 | 90.4% |
| Two or more Races | 159 | 3.0% |
| Some other Race | 269 | 5.1% |
| Total | 5,288 | 100.0% |
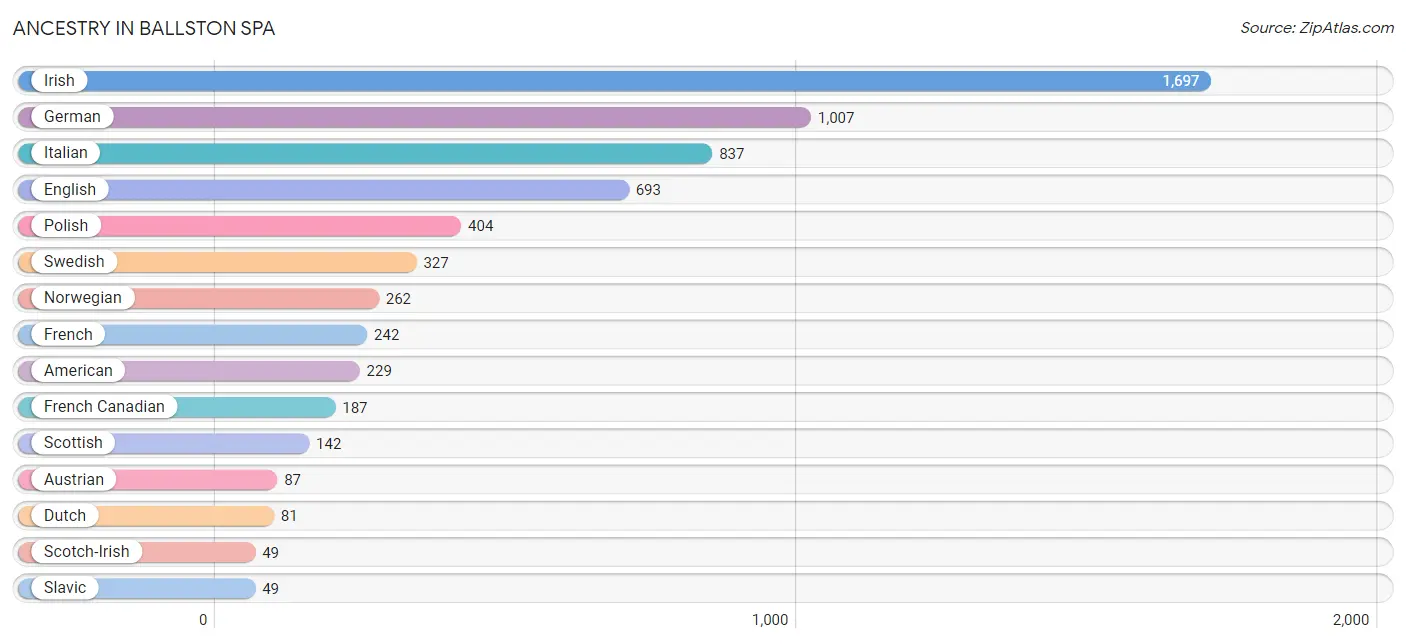
Ancestry in Ballston Spa
The most populous ancestries reported in Ballston Spa are Irish (1,697 | 32.1%), German (1,007 | 19.0%), Italian (837 | 15.8%), English (693 | 13.1%), and Polish (404 | 7.6%), together accounting for 87.7% of all Ballston Spa residents.
| Ancestry | # Population | % Population |
| American | 229 | 4.3% |
| Austrian | 87 | 1.7% |
| Bhutanese | 42 | 0.8% |
| British | 9 | 0.2% |
| Canadian | 27 | 0.5% |
| Dutch | 81 | 1.5% |
| Ecuadorian | 21 | 0.4% |
| English | 693 | 13.1% |
| European | 14 | 0.3% |
| French | 242 | 4.6% |
| French Canadian | 187 | 3.5% |
| German | 1,007 | 19.0% |
| Hungarian | 44 | 0.8% |
| Irish | 1,697 | 32.1% |
| Italian | 837 | 15.8% |
| Korean | 1 | 0.0% |
| Mexican | 1 | 0.0% |
| Norwegian | 262 | 5.0% |
| Pennsylvania German | 19 | 0.4% |
| Polish | 404 | 7.6% |
| Puerto Rican | 25 | 0.5% |
| Russian | 37 | 0.7% |
| Scandinavian | 24 | 0.4% |
| Scotch-Irish | 49 | 0.9% |
| Scottish | 142 | 2.7% |
| Slavic | 49 | 0.9% |
| Slovak | 12 | 0.2% |
| South American | 21 | 0.4% |
| Spaniard | 2 | 0.0% |
| Spanish | 39 | 0.7% |
| Swedish | 327 | 6.2% |
| Swiss | 12 | 0.2% |
| Ukrainian | 15 | 0.3% |
| Welsh | 36 | 0.7% |
| West Indian | 46 | 0.9% |
| Yugoslavian | 12 | 0.2% | View All 36 Rows |
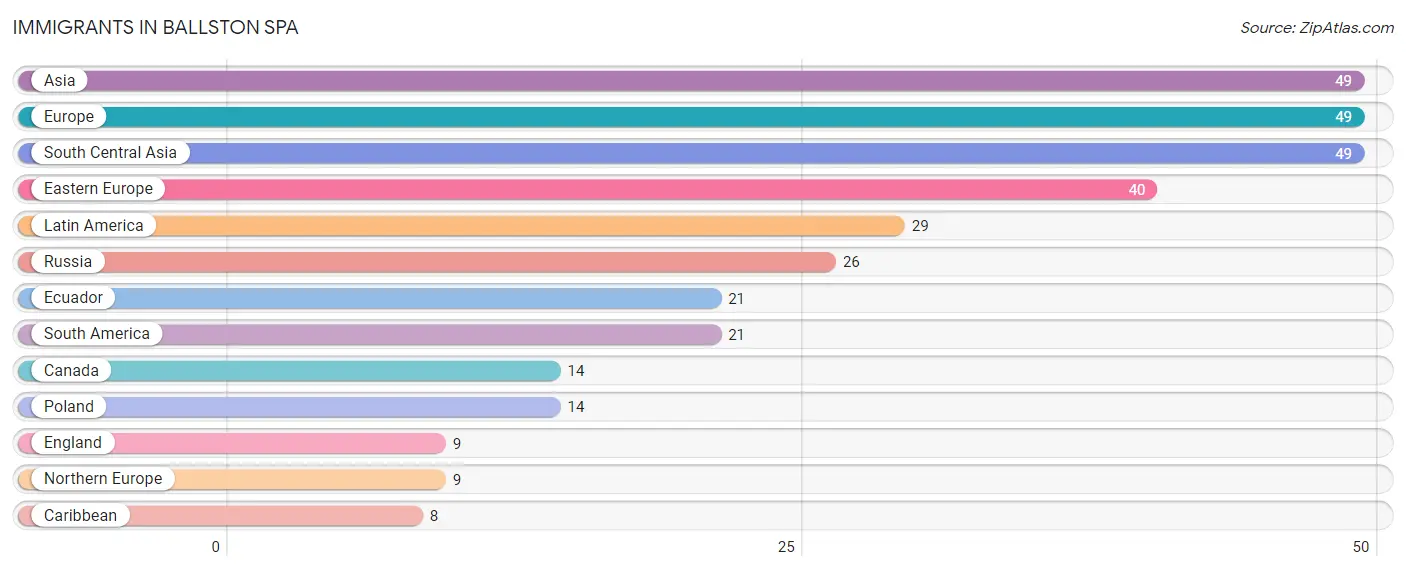
Immigrants in Ballston Spa
The most numerous immigrant groups reported in Ballston Spa came from Asia (49 | 0.9%), Europe (49 | 0.9%), South Central Asia (49 | 0.9%), Eastern Europe (40 | 0.8%), and Latin America (29 | 0.5%), together accounting for 4.1% of all Ballston Spa residents.
| Immigration Origin | # Population | % Population |
| Asia | 49 | 0.9% |
| Canada | 14 | 0.3% |
| Caribbean | 8 | 0.2% |
| Eastern Europe | 40 | 0.8% |
| Ecuador | 21 | 0.4% |
| England | 9 | 0.2% |
| Europe | 49 | 0.9% |
| Latin America | 29 | 0.5% |
| Northern Europe | 9 | 0.2% |
| Poland | 14 | 0.3% |
| Russia | 26 | 0.5% |
| South America | 21 | 0.4% |
| South Central Asia | 49 | 0.9% | View All 13 Rows |
Sex and Age in Ballston Spa
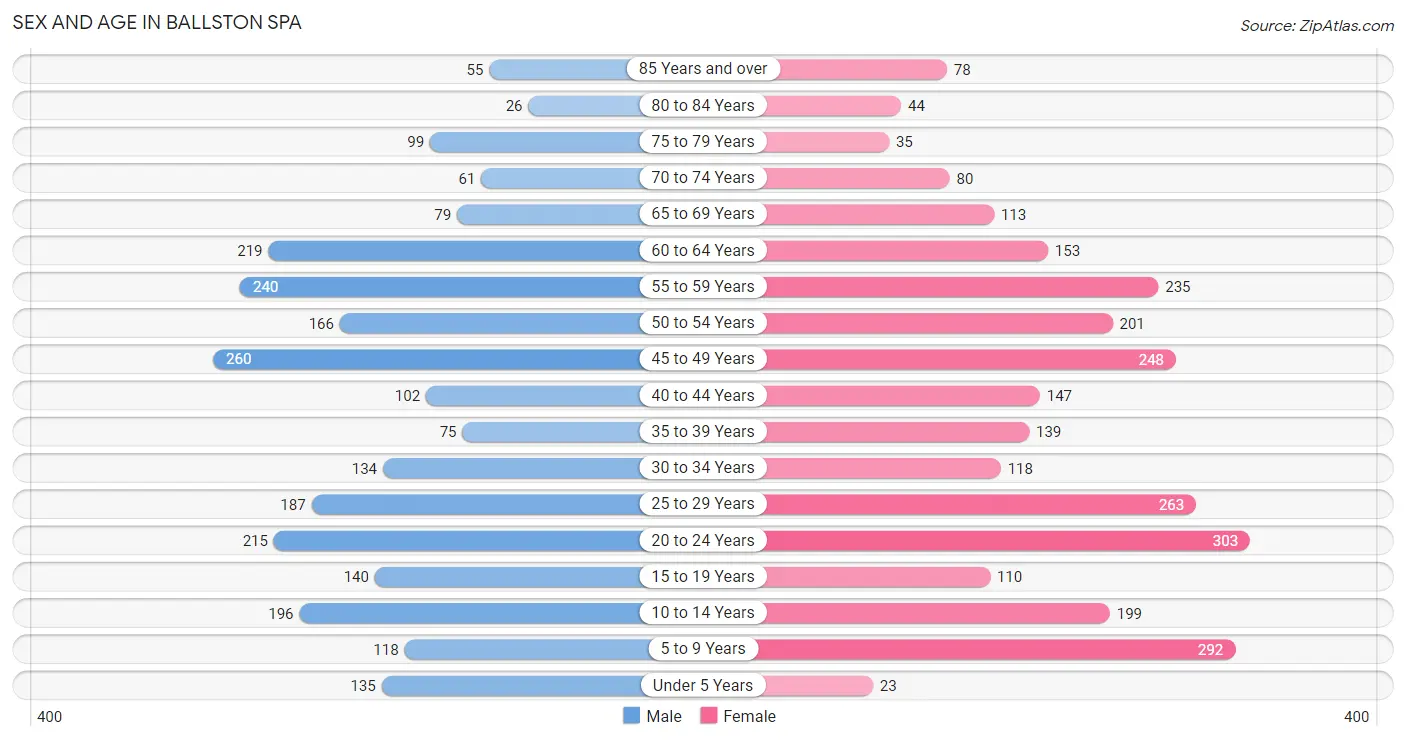
Sex and Age in Ballston Spa
The most populous age groups in Ballston Spa are 45 to 49 Years (260 | 10.4%) for men and 20 to 24 Years (303 | 10.9%) for women.
| Age Bracket | Male | Female |
| Under 5 Years | 135 (5.4%) | 23 (0.8%) |
| 5 to 9 Years | 118 (4.7%) | 292 (10.5%) |
| 10 to 14 Years | 196 (7.8%) | 199 (7.2%) |
| 15 to 19 Years | 140 (5.6%) | 110 (4.0%) |
| 20 to 24 Years | 215 (8.6%) | 303 (10.9%) |
| 25 to 29 Years | 187 (7.5%) | 263 (9.5%) |
| 30 to 34 Years | 134 (5.3%) | 118 (4.2%) |
| 35 to 39 Years | 75 (3.0%) | 139 (5.0%) |
| 40 to 44 Years | 102 (4.1%) | 147 (5.3%) |
| 45 to 49 Years | 260 (10.4%) | 248 (8.9%) |
| 50 to 54 Years | 166 (6.6%) | 201 (7.2%) |
| 55 to 59 Years | 240 (9.6%) | 235 (8.5%) |
| 60 to 64 Years | 219 (8.7%) | 153 (5.5%) |
| 65 to 69 Years | 79 (3.2%) | 113 (4.1%) |
| 70 to 74 Years | 61 (2.4%) | 80 (2.9%) |
| 75 to 79 Years | 99 (4.0%) | 35 (1.3%) |
| 80 to 84 Years | 26 (1.0%) | 44 (1.6%) |
| 85 Years and over | 55 (2.2%) | 78 (2.8%) |
| Total | 2,507 (100.0%) | 2,781 (100.0%) |
Families and Households in Ballston Spa
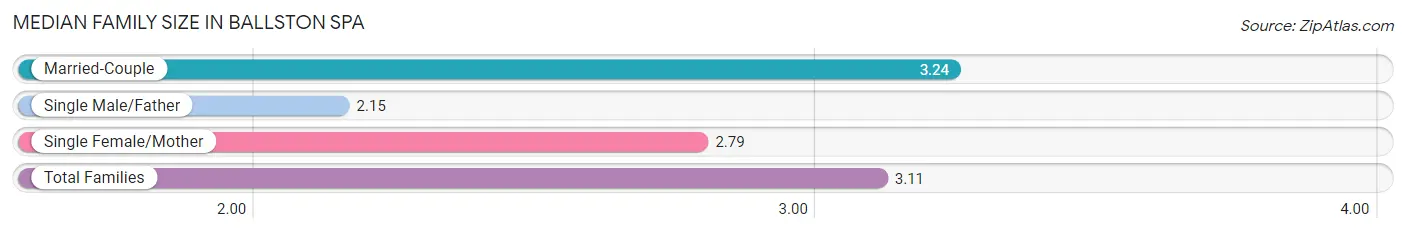
Median Family Size in Ballston Spa
The median family size in Ballston Spa is 3.11 persons per family, with married-couple families (945 | 77.6%) accounting for the largest median family size of 3.24 persons per family. On the other hand, single male/father families (47 | 3.9%) represent the smallest median family size with 2.15 persons per family.
| Family Type | # Families | Family Size |
| Married-Couple | 945 (77.6%) | 3.24 |
| Single Male/Father | 47 (3.9%) | 2.15 |
| Single Female/Mother | 226 (18.6%) | 2.79 |
| Total Families | 1,218 (100.0%) | 3.11 |
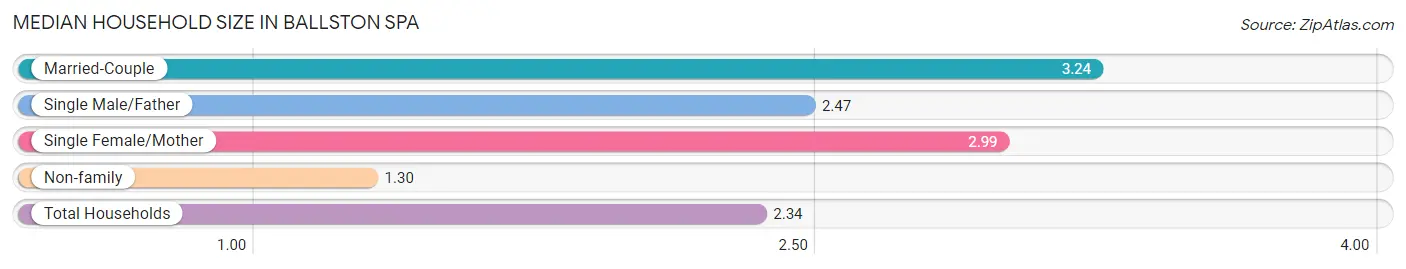
Median Household Size in Ballston Spa
The median household size in Ballston Spa is 2.34 persons per household, with married-couple households (945 | 43.3%) accounting for the largest median household size of 3.24 persons per household. non-family households (966 | 44.2%) represent the smallest median household size with 1.30 persons per household.
| Household Type | # Households | Household Size |
| Married-Couple | 945 (43.3%) | 3.24 |
| Single Male/Father | 47 (2.1%) | 2.47 |
| Single Female/Mother | 226 (10.3%) | 2.99 |
| Non-family | 966 (44.2%) | 1.30 |
| Total Households | 2,184 (100.0%) | 2.34 |
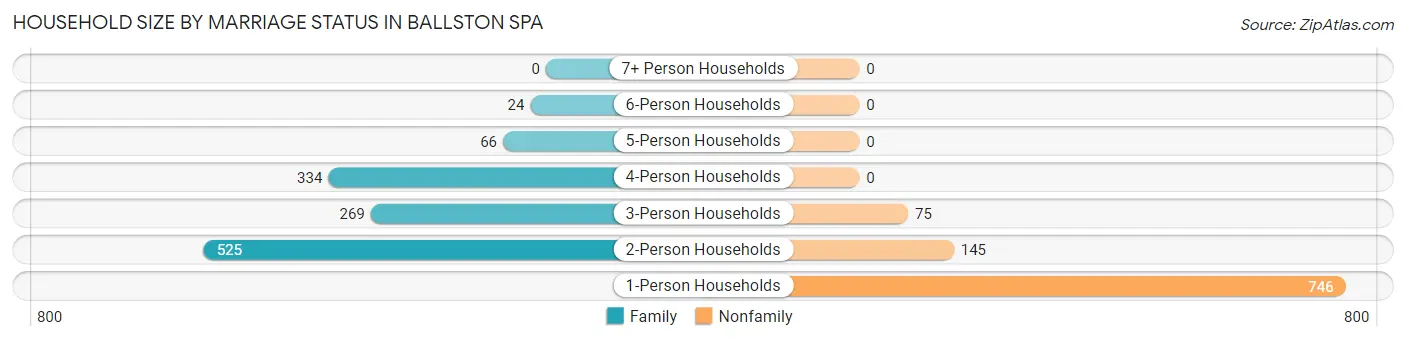
Household Size by Marriage Status in Ballston Spa
Out of a total of 2,184 households in Ballston Spa, 1,218 (55.8%) are family households, while 966 (44.2%) are nonfamily households. The most numerous type of family households are 2-person households, comprising 525, and the most common type of nonfamily households are 1-person households, comprising 746.
| Household Size | Family Households | Nonfamily Households |
| 1-Person Households | - | 746 (34.2%) |
| 2-Person Households | 525 (24.0%) | 145 (6.6%) |
| 3-Person Households | 269 (12.3%) | 75 (3.4%) |
| 4-Person Households | 334 (15.3%) | 0 (0.0%) |
| 5-Person Households | 66 (3.0%) | 0 (0.0%) |
| 6-Person Households | 24 (1.1%) | 0 (0.0%) |
| 7+ Person Households | 0 (0.0%) | 0 (0.0%) |
| Total | 1,218 (55.8%) | 966 (44.2%) |
Female Fertility in Ballston Spa
Fertility by Age in Ballston Spa
| Age Bracket | Women with Births | Births / 1,000 Women |
| 15 to 19 years | 0 (0.0%) | 0.0 |
| 20 to 34 years | 0 (0.0%) | 0.0 |
| 35 to 50 years | 0 (0.0%) | 0.0 |
| Total | 0 (0.0%) | 0.0 |
Fertility by Age by Marriage Status in Ballston Spa
| Age Bracket | Married | Unmarried |
| 15 to 19 years | 0 (0.0%) | 0 (0.0%) |
| 20 to 34 years | 0 (0.0%) | 0 (0.0%) |
| 35 to 50 years | 0 (0.0%) | 0 (0.0%) |
| Total | 0 (0.0%) | 0 (0.0%) |
Fertility by Education in Ballston Spa

| Educational Attainment | Women with Births | Births / 1,000 Women |
| Less than High School | 0 (0.0%) | 0.0 |
| High School Diploma | 0 (0.0%) | 0.0 |
| College or Associate's Degree | 0 (0.0%) | 0.0 |
| Bachelor's Degree | 0 (0.0%) | 0.0 |
| Graduate Degree | 0 (0.0%) | 0.0 |
| Total | 0 (0.0%) | 0.0 |
Fertility by Education by Marriage Status in Ballston Spa
| Educational Attainment | Married | Unmarried |
| Less than High School | 0 (0.0%) | 0 (0.0%) |
| High School Diploma | 0 (0.0%) | 0 (0.0%) |
| College or Associate's Degree | 0 (0.0%) | 0 (0.0%) |
| Bachelor's Degree | 0 (0.0%) | 0 (0.0%) |
| Graduate Degree | 0 (0.0%) | 0 (0.0%) |
| Total | 0 (0.0%) | 0 (0.0%) |
Income in Ballston Spa
Income Overview in Ballston Spa
Per Capita Income in Ballston Spa is $43,565, while median incomes of families and households are $121,667 and $78,136 respectively.
| Characteristic | Number | Measure |
| Per Capita Income | 5,288 | $43,565 |
| Median Family Income | 1,218 | $121,667 |
| Mean Family Income | 1,218 | $131,994 |
| Median Household Income | 2,184 | $78,136 |
| Mean Household Income | 2,184 | $101,132 |
| Income Deficit | 1,218 | $0 |
| Wage / Income Gap (%) | 5,288 | 25.71% |
| Wage / Income Gap ($) | 5,288 | 74.29¢ per $1 |
| Gini / Inequality Index | 5,288 | 0.38 |
Earnings by Sex in Ballston Spa
Average Earnings in Ballston Spa are $49,052, $56,522 for men and $41,993 for women, a difference of 25.7%.
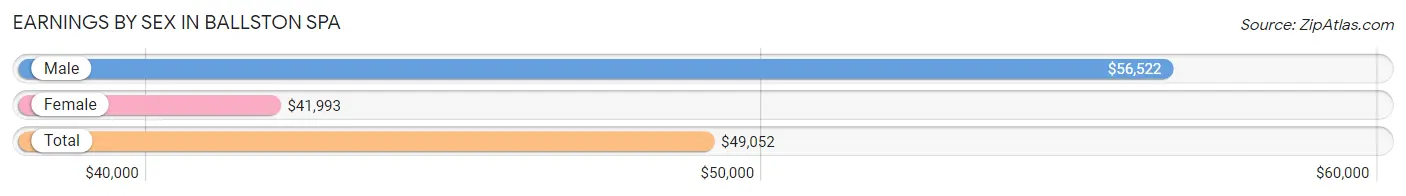
| Sex | Number | Average Earnings |
| Male | 1,559 (46.3%) | $56,522 |
| Female | 1,807 (53.7%) | $41,993 |
| Total | 3,366 (100.0%) | $49,052 |
Earnings by Sex by Income Bracket in Ballston Spa
The most common earnings brackets in Ballston Spa are $75,000 to $99,999 for men (267 | 17.1%) and $55,000 to $64,999 for women (249 | 13.8%).
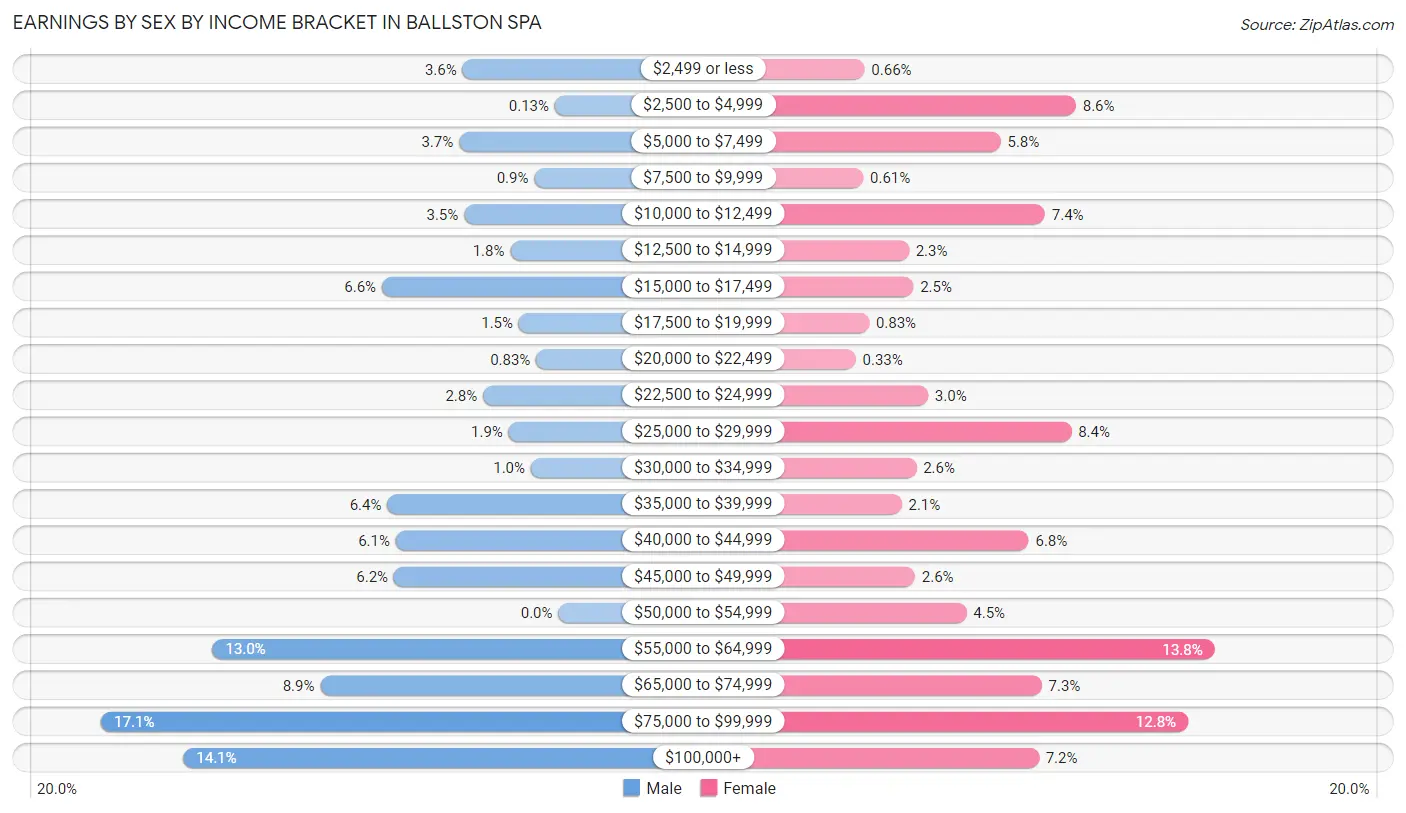
| Income | Male | Female |
| $2,499 or less | 56 (3.6%) | 12 (0.7%) |
| $2,500 to $4,999 | 2 (0.1%) | 155 (8.6%) |
| $5,000 to $7,499 | 58 (3.7%) | 104 (5.8%) |
| $7,500 to $9,999 | 14 (0.9%) | 11 (0.6%) |
| $10,000 to $12,499 | 55 (3.5%) | 134 (7.4%) |
| $12,500 to $14,999 | 28 (1.8%) | 42 (2.3%) |
| $15,000 to $17,499 | 103 (6.6%) | 45 (2.5%) |
| $17,500 to $19,999 | 23 (1.5%) | 15 (0.8%) |
| $20,000 to $22,499 | 13 (0.8%) | 6 (0.3%) |
| $22,500 to $24,999 | 44 (2.8%) | 55 (3.0%) |
| $25,000 to $29,999 | 29 (1.9%) | 152 (8.4%) |
| $30,000 to $34,999 | 16 (1.0%) | 47 (2.6%) |
| $35,000 to $39,999 | 100 (6.4%) | 37 (2.1%) |
| $40,000 to $44,999 | 95 (6.1%) | 123 (6.8%) |
| $45,000 to $49,999 | 96 (6.2%) | 46 (2.5%) |
| $50,000 to $54,999 | 0 (0.0%) | 81 (4.5%) |
| $55,000 to $64,999 | 202 (13.0%) | 249 (13.8%) |
| $65,000 to $74,999 | 139 (8.9%) | 132 (7.3%) |
| $75,000 to $99,999 | 267 (17.1%) | 231 (12.8%) |
| $100,000+ | 219 (14.1%) | 130 (7.2%) |
| Total | 1,559 (100.0%) | 1,807 (100.0%) |
Earnings by Sex by Educational Attainment in Ballston Spa
Average earnings in Ballston Spa are $63,039 for men and $55,118 for women, a difference of 12.6%. Men with an educational attainment of graduate degree enjoy the highest average annual earnings of $95,895, while those with less than high school education earn the least with $38,929. Women with an educational attainment of graduate degree earn the most with the average annual earnings of $79,471, while those with high school diploma education have the smallest earnings of $40,049.
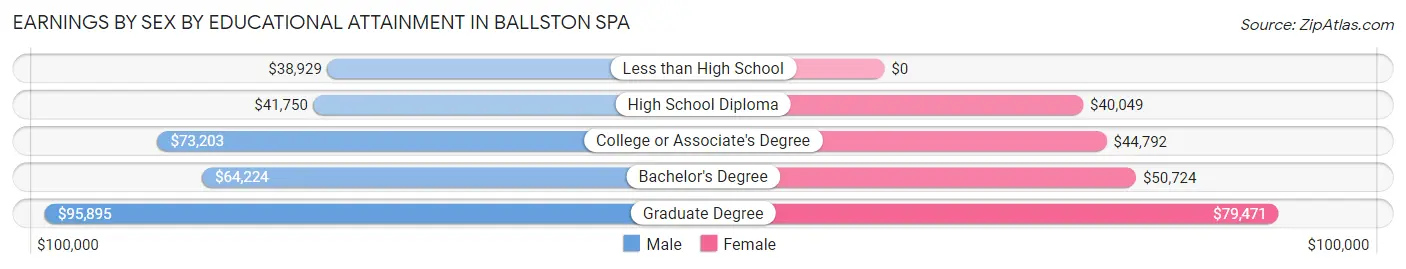
| Educational Attainment | Male Income | Female Income |
| Less than High School | $38,929 | $0 |
| High School Diploma | $41,750 | $40,049 |
| College or Associate's Degree | $73,203 | $44,792 |
| Bachelor's Degree | $64,224 | $50,724 |
| Graduate Degree | $95,895 | $79,471 |
| Total | $63,039 | $55,118 |
Family Income in Ballston Spa
Family Income Brackets in Ballston Spa
According to the Ballston Spa family income data, there are 331 families falling into the $150,000 to $199,999 income range, which is the most common income bracket and makes up 27.2% of all families.
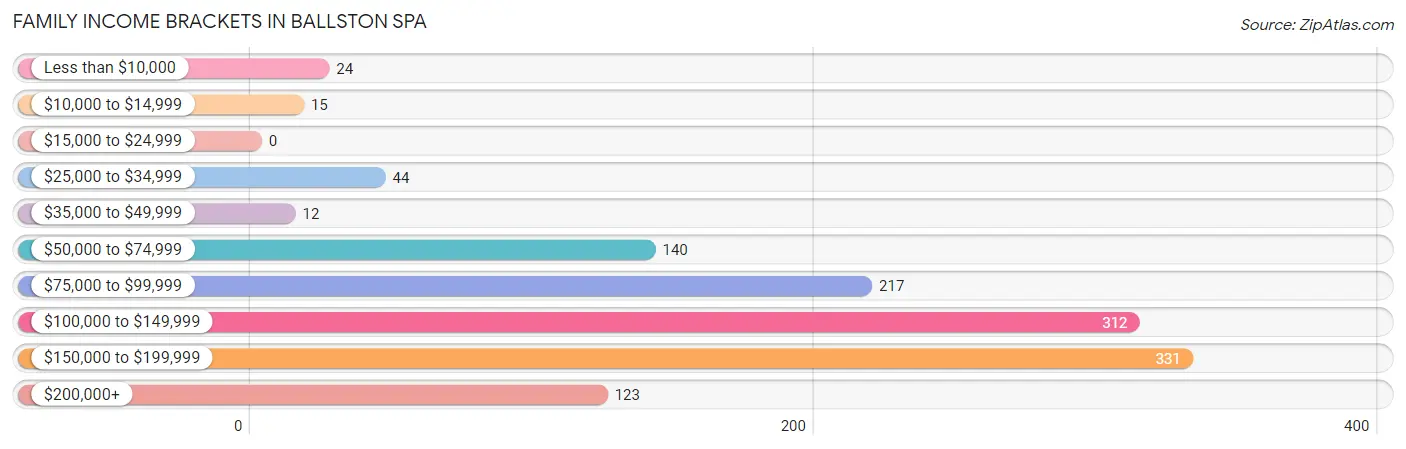
| Income Bracket | # Families | % Families |
| Less than $10,000 | 24 | 2.0% |
| $10,000 to $14,999 | 15 | 1.2% |
| $15,000 to $24,999 | 0 | 0.0% |
| $25,000 to $34,999 | 44 | 3.6% |
| $35,000 to $49,999 | 12 | 1.0% |
| $50,000 to $74,999 | 140 | 11.5% |
| $75,000 to $99,999 | 217 | 17.8% |
| $100,000 to $149,999 | 312 | 25.6% |
| $150,000 to $199,999 | 331 | 27.2% |
| $200,000+ | 123 | 10.1% |
Family Income by Famaliy Size in Ballston Spa
4-person families (310 | 25.5%) account for the highest median family income in Ballston Spa with $169,235 per family, while 2-person families (570 | 46.8%) have the highest median income of $51,932 per family member.
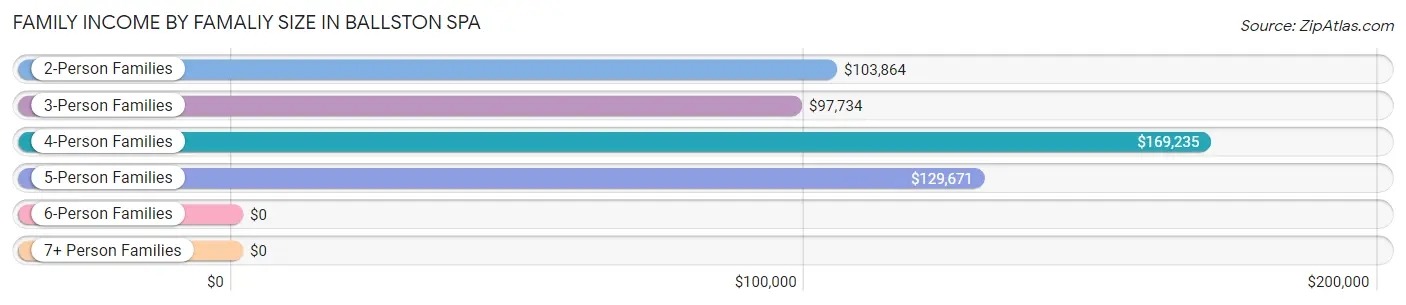
| Income Bracket | # Families | Median Income |
| 2-Person Families | 570 (46.8%) | $103,864 |
| 3-Person Families | 248 (20.4%) | $97,734 |
| 4-Person Families | 310 (25.5%) | $169,235 |
| 5-Person Families | 66 (5.4%) | $129,671 |
| 6-Person Families | 24 (2.0%) | $0 |
| 7+ Person Families | 0 (0.0%) | $0 |
| Total | 1,218 (100.0%) | $121,667 |
Family Income by Number of Earners in Ballston Spa
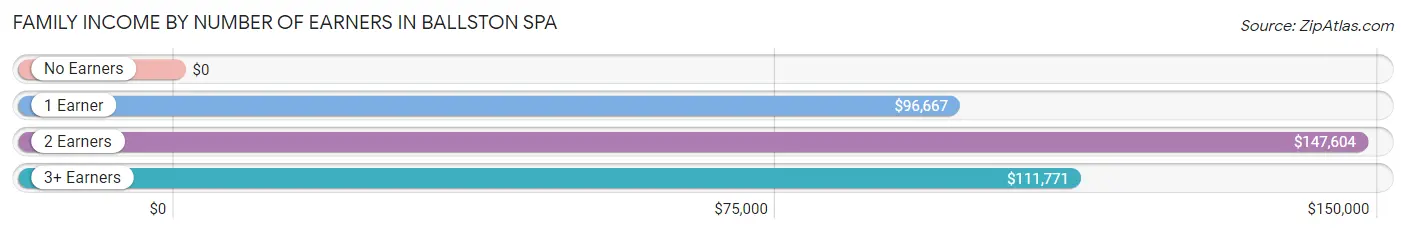
| Number of Earners | # Families | Median Income |
| No Earners | 77 (6.3%) | $0 |
| 1 Earner | 328 (26.9%) | $96,667 |
| 2 Earners | 636 (52.2%) | $147,604 |
| 3+ Earners | 177 (14.5%) | $111,771 |
| Total | 1,218 (100.0%) | $121,667 |
Household Income in Ballston Spa
Household Income Brackets in Ballston Spa
With 404 households falling in the category, the $50,000 to $74,999 income range is the most frequent in Ballston Spa, accounting for 18.5% of all households. In contrast, only 17 households (0.8%) fall into the less than $10,000 income bracket, making it the least populous group.
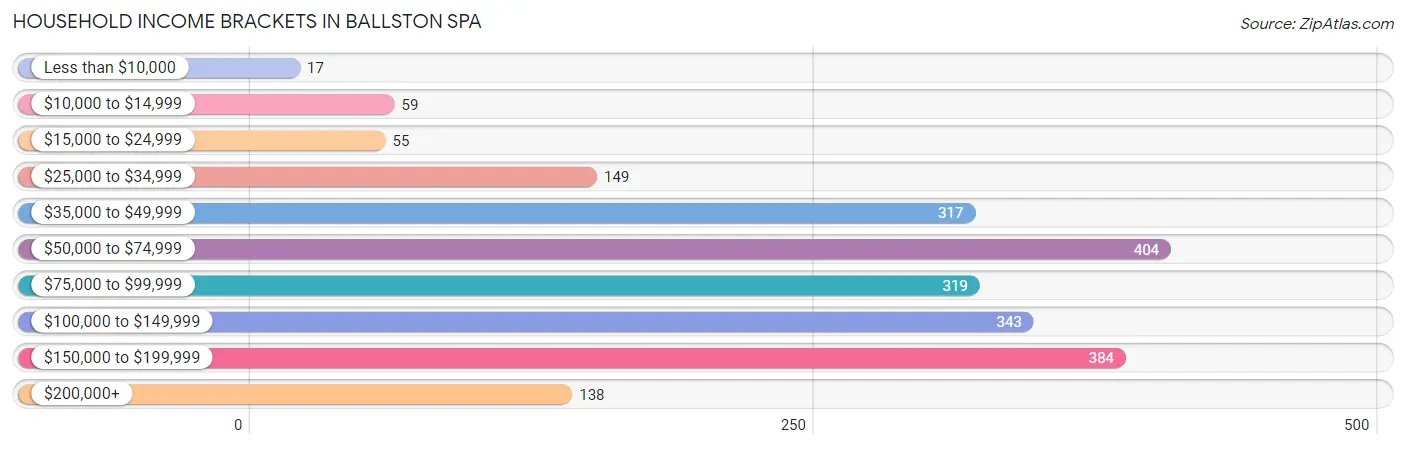
| Income Bracket | # Households | % Households |
| Less than $10,000 | 17 | 0.8% |
| $10,000 to $14,999 | 59 | 2.7% |
| $15,000 to $24,999 | 55 | 2.5% |
| $25,000 to $34,999 | 149 | 6.8% |
| $35,000 to $49,999 | 317 | 14.5% |
| $50,000 to $74,999 | 404 | 18.5% |
| $75,000 to $99,999 | 319 | 14.6% |
| $100,000 to $149,999 | 343 | 15.7% |
| $150,000 to $199,999 | 384 | 17.6% |
| $200,000+ | 138 | 6.3% |
Household Income by Householder Age in Ballston Spa
The median household income in Ballston Spa is $78,136, with the highest median household income of $115,254 found in the 25 to 44 years age bracket for the primary householder. A total of 602 households (27.6%) fall into this category. Meanwhile, the 15 to 24 years age bracket for the primary householder has the lowest median household income of $53,136, with 128 households (5.9%) in this group.
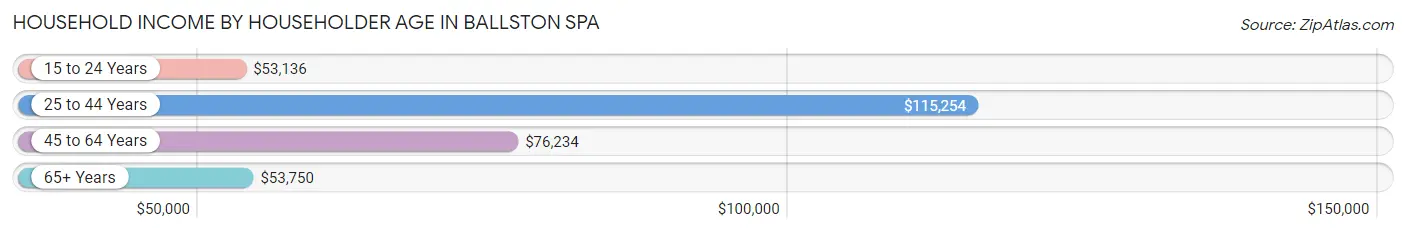
| Income Bracket | # Households | Median Income |
| 15 to 24 Years | 128 (5.9%) | $53,136 |
| 25 to 44 Years | 602 (27.6%) | $115,254 |
| 45 to 64 Years | 1,121 (51.3%) | $76,234 |
| 65+ Years | 333 (15.2%) | $53,750 |
| Total | 2,184 (100.0%) | $78,136 |
Poverty in Ballston Spa
Income Below Poverty by Sex and Age in Ballston Spa
With 6.1% poverty level for males and 6.6% for females among the residents of Ballston Spa, 18 to 24 year old males and 12 to 14 year old females are the most vulnerable to poverty, with 67 males (31.2%) and 19 females (36.5%) in their respective age groups living below the poverty level.
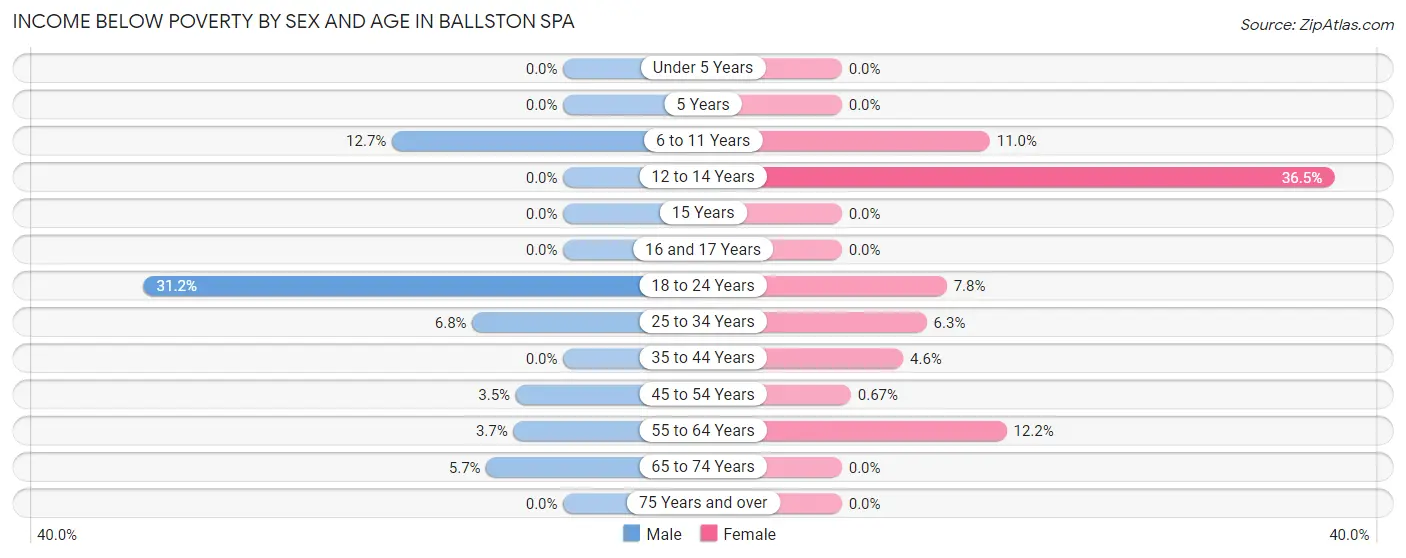
| Age Bracket | Male | Female |
| Under 5 Years | 0 (0.0%) | 0 (0.0%) |
| 5 Years | 0 (0.0%) | 0 (0.0%) |
| 6 to 11 Years | 23 (12.7%) | 42 (11.0%) |
| 12 to 14 Years | 0 (0.0%) | 19 (36.5%) |
| 15 Years | 0 (0.0%) | 0 (0.0%) |
| 16 and 17 Years | 0 (0.0%) | 0 (0.0%) |
| 18 to 24 Years | 67 (31.2%) | 31 (7.8%) |
| 25 to 34 Years | 21 (6.8%) | 24 (6.3%) |
| 35 to 44 Years | 0 (0.0%) | 13 (4.5%) |
| 45 to 54 Years | 15 (3.5%) | 3 (0.7%) |
| 55 to 64 Years | 17 (3.7%) | 45 (12.2%) |
| 65 to 74 Years | 8 (5.7%) | 0 (0.0%) |
| 75 Years and over | 0 (0.0%) | 0 (0.0%) |
| Total | 151 (6.1%) | 177 (6.6%) |
Income Above Poverty by Sex and Age in Ballston Spa
According to the poverty statistics in Ballston Spa, males aged under 5 years and females aged under 5 years are the age groups that are most secure financially, with 100.0% of males and 100.0% of females in these age groups living above the poverty line.
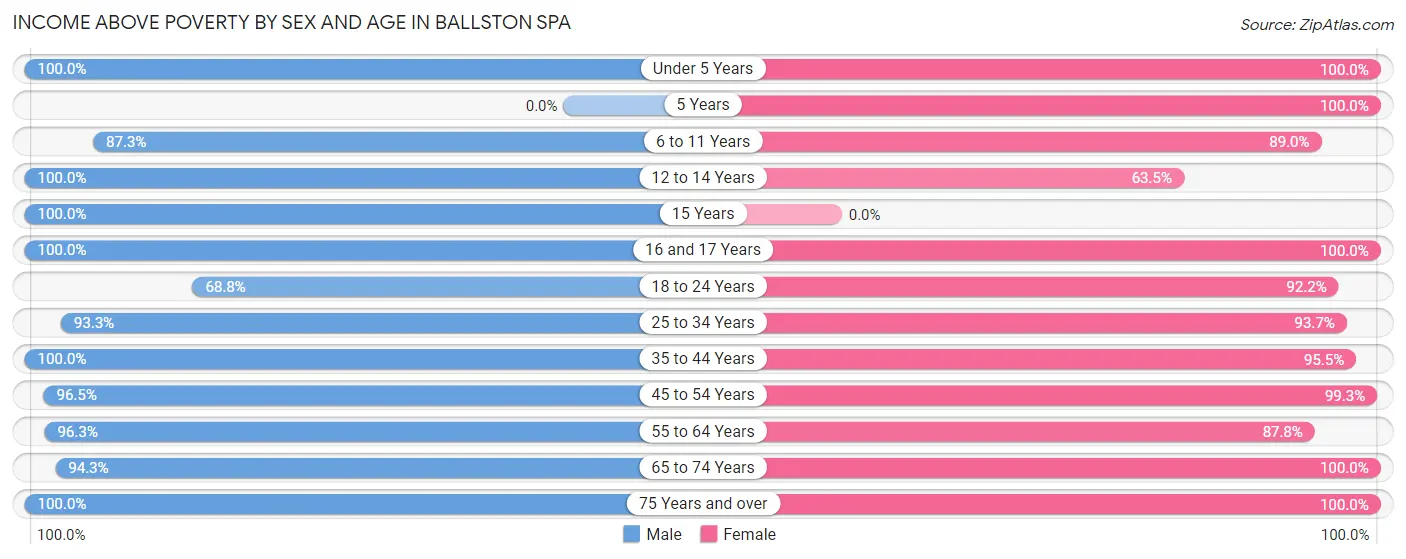
| Age Bracket | Male | Female |
| Under 5 Years | 135 (100.0%) | 23 (100.0%) |
| 5 Years | 0 (0.0%) | 57 (100.0%) |
| 6 to 11 Years | 158 (87.3%) | 340 (89.0%) |
| 12 to 14 Years | 131 (100.0%) | 33 (63.5%) |
| 15 Years | 51 (100.0%) | 0 (0.0%) |
| 16 and 17 Years | 87 (100.0%) | 15 (100.0%) |
| 18 to 24 Years | 148 (68.8%) | 367 (92.2%) |
| 25 to 34 Years | 290 (93.2%) | 357 (93.7%) |
| 35 to 44 Years | 177 (100.0%) | 273 (95.5%) |
| 45 to 54 Years | 411 (96.5%) | 446 (99.3%) |
| 55 to 64 Years | 442 (96.3%) | 323 (87.8%) |
| 65 to 74 Years | 132 (94.3%) | 193 (100.0%) |
| 75 Years and over | 143 (100.0%) | 68 (100.0%) |
| Total | 2,305 (93.9%) | 2,495 (93.4%) |
Income Below Poverty Among Married-Couple Families in Ballston Spa
The poverty statistics for married-couple families in Ballston Spa show that 1.6% or 15 of the total 945 families live below the poverty line. Families with 1 or 2 children have the highest poverty rate of 4.5%, comprising of 15 families. On the other hand, families with no children have the lowest poverty rate of 0.0%, which includes 0 families.
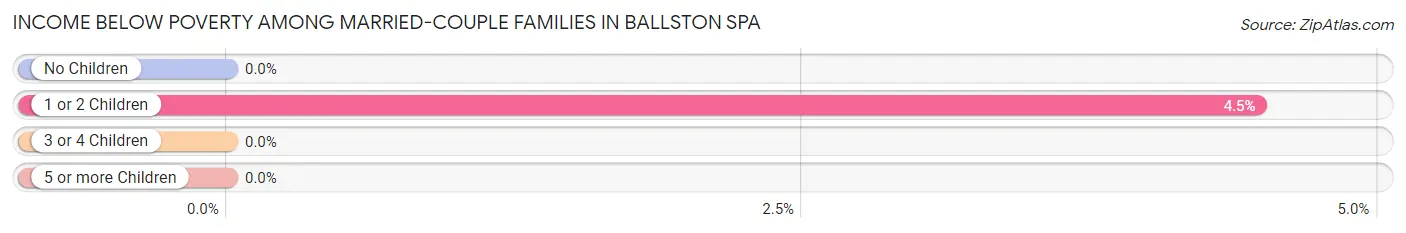
| Children | Above Poverty | Below Poverty |
| No Children | 526 (100.0%) | 0 (0.0%) |
| 1 or 2 Children | 320 (95.5%) | 15 (4.5%) |
| 3 or 4 Children | 84 (100.0%) | 0 (0.0%) |
| 5 or more Children | 0 (0.0%) | 0 (0.0%) |
| Total | 930 (98.4%) | 15 (1.6%) |
Income Below Poverty Among Single-Parent Households in Ballston Spa
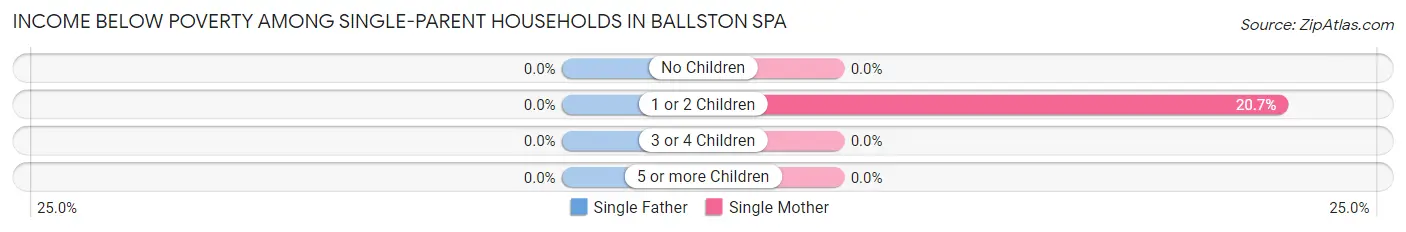
| Children | Single Father | Single Mother |
| No Children | 0 (0.0%) | 0 (0.0%) |
| 1 or 2 Children | 0 (0.0%) | 24 (20.7%) |
| 3 or 4 Children | 0 (0.0%) | 0 (0.0%) |
| 5 or more Children | 0 (0.0%) | 0 (0.0%) |
| Total | 0 (0.0%) | 24 (10.6%) |
Income Below Poverty Among Married-Couple vs Single-Parent Households in Ballston Spa
The poverty data for Ballston Spa shows that 15 of the married-couple family households (1.6%) and 24 of the single-parent households (8.8%) are living below the poverty level. Within the married-couple family households, those with 1 or 2 children have the highest poverty rate, with 15 households (4.5%) falling below the poverty line. Among the single-parent households, those with 1 or 2 children have the highest poverty rate, with 24 household (18.2%) living below poverty.
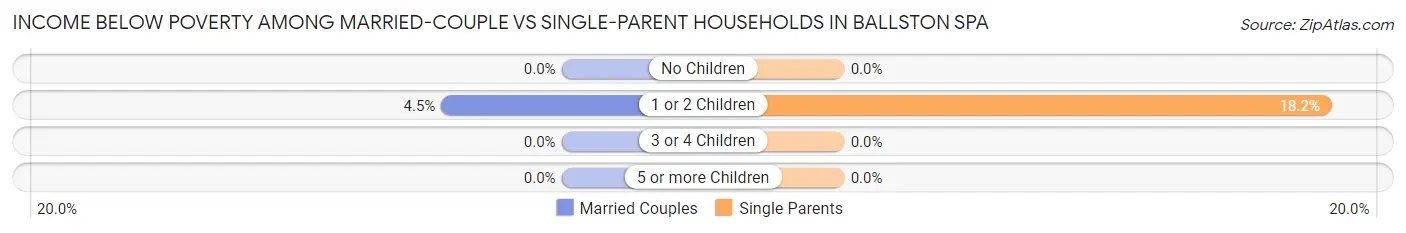
| Children | Married-Couple Families | Single-Parent Households |
| No Children | 0 (0.0%) | 0 (0.0%) |
| 1 or 2 Children | 15 (4.5%) | 24 (18.2%) |
| 3 or 4 Children | 0 (0.0%) | 0 (0.0%) |
| 5 or more Children | 0 (0.0%) | 0 (0.0%) |
| Total | 15 (1.6%) | 24 (8.8%) |
Employment Characteristics in Ballston Spa
Employment by Class of Employer in Ballston Spa
Among the 3,025 employed individuals in Ballston Spa, private company employees (1,637 | 54.1%), not-for-profit organizations (498 | 16.5%), and local government employees (459 | 15.2%) make up the most common classes of employment.
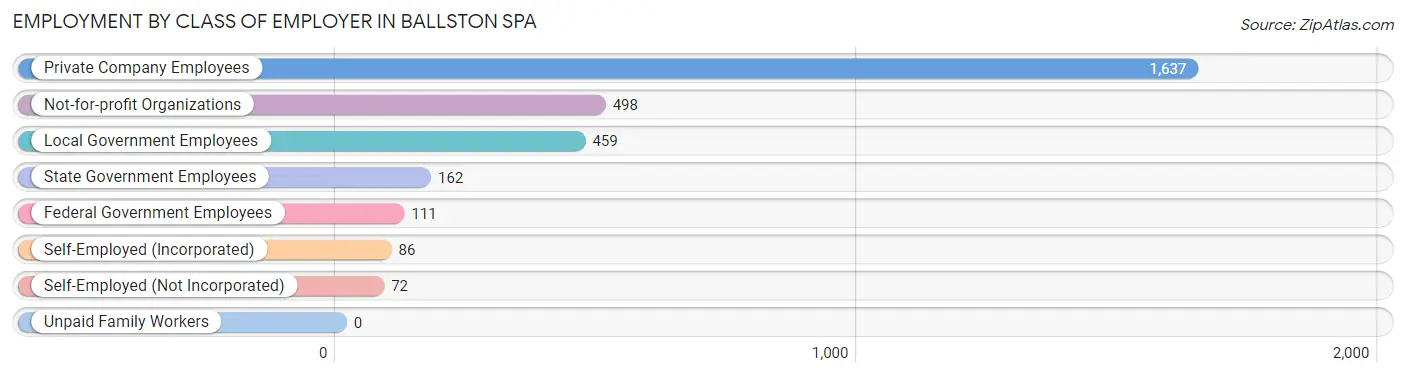
| Employer Class | # Employees | % Employees |
| Private Company Employees | 1,637 | 54.1% |
| Self-Employed (Incorporated) | 86 | 2.8% |
| Self-Employed (Not Incorporated) | 72 | 2.4% |
| Not-for-profit Organizations | 498 | 16.5% |
| Local Government Employees | 459 | 15.2% |
| State Government Employees | 162 | 5.4% |
| Federal Government Employees | 111 | 3.7% |
| Unpaid Family Workers | 0 | 0.0% |
| Total | 3,025 | 100.0% |
Employment Status by Age in Ballston Spa
According to the labor force statistics for Ballston Spa, out of the total population over 16 years of age (4,274), 73.6% or 3,146 individuals are in the labor force, with 2.5% or 79 of them unemployed. The age group with the highest labor force participation rate is 30 to 34 years, with 100.0% or 252 individuals in the labor force. Within the labor force, the 30 to 34 years age range has the highest percentage of unemployed individuals, with 10.4% or 26 of them being unemployed.
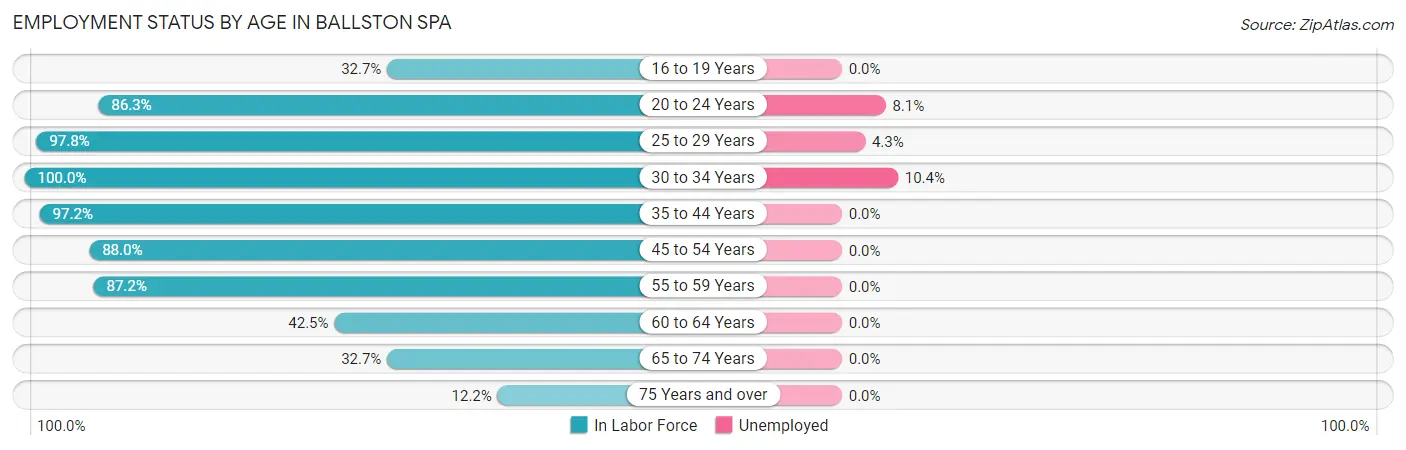
| Age Bracket | In Labor Force | Unemployed |
| 16 to 19 Years | 65 (32.7%) | 0 (0.0%) |
| 20 to 24 Years | 447 (86.3%) | 36 (8.1%) |
| 25 to 29 Years | 440 (97.8%) | 19 (4.3%) |
| 30 to 34 Years | 252 (100.0%) | 26 (10.4%) |
| 35 to 44 Years | 450 (97.2%) | 0 (0.0%) |
| 45 to 54 Years | 770 (88.0%) | 0 (0.0%) |
| 55 to 59 Years | 414 (87.2%) | 0 (0.0%) |
| 60 to 64 Years | 158 (42.5%) | 0 (0.0%) |
| 65 to 74 Years | 109 (32.7%) | 0 (0.0%) |
| 75 Years and over | 41 (12.2%) | 0 (0.0%) |
| Total | 3,146 (73.6%) | 79 (2.5%) |
Employment Status by Educational Attainment in Ballston Spa
According to labor force statistics for Ballston Spa, 86.0% of individuals (2,483) out of the total population between 25 and 64 years of age (2,887) are in the labor force, with 1.7% or 42 of them being unemployed. The group with the highest labor force participation rate are those with the educational attainment of bachelor's degree or higher, with 92.9% or 1,230 individuals in the labor force. Within the labor force, individuals with high school diploma education have the highest percentage of unemployment, with 3.4% or 19 of them being unemployed.
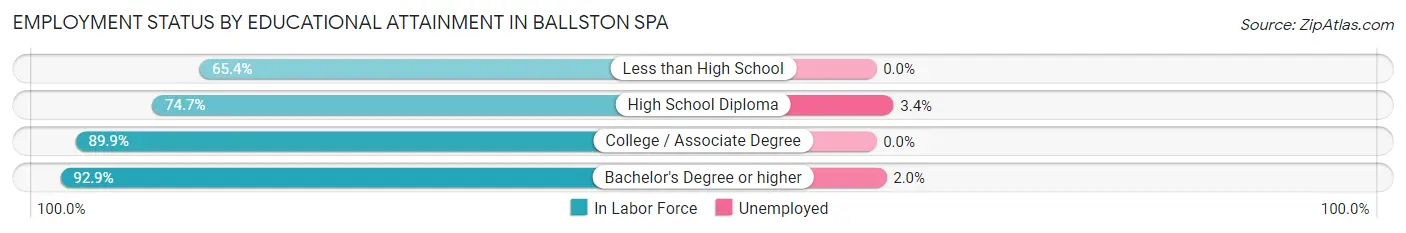
| Educational Attainment | In Labor Force | Unemployed |
| Less than High School | 104 (65.4%) | 0 (0.0%) |
| High School Diploma | 552 (74.7%) | 25 (3.4%) |
| College / Associate Degree | 598 (89.9%) | 0 (0.0%) |
| Bachelor's Degree or higher | 1,230 (92.9%) | 26 (2.0%) |
| Total | 2,483 (86.0%) | 49 (1.7%) |
Employment Occupations by Sex in Ballston Spa
Management, Business, Science and Arts Occupations
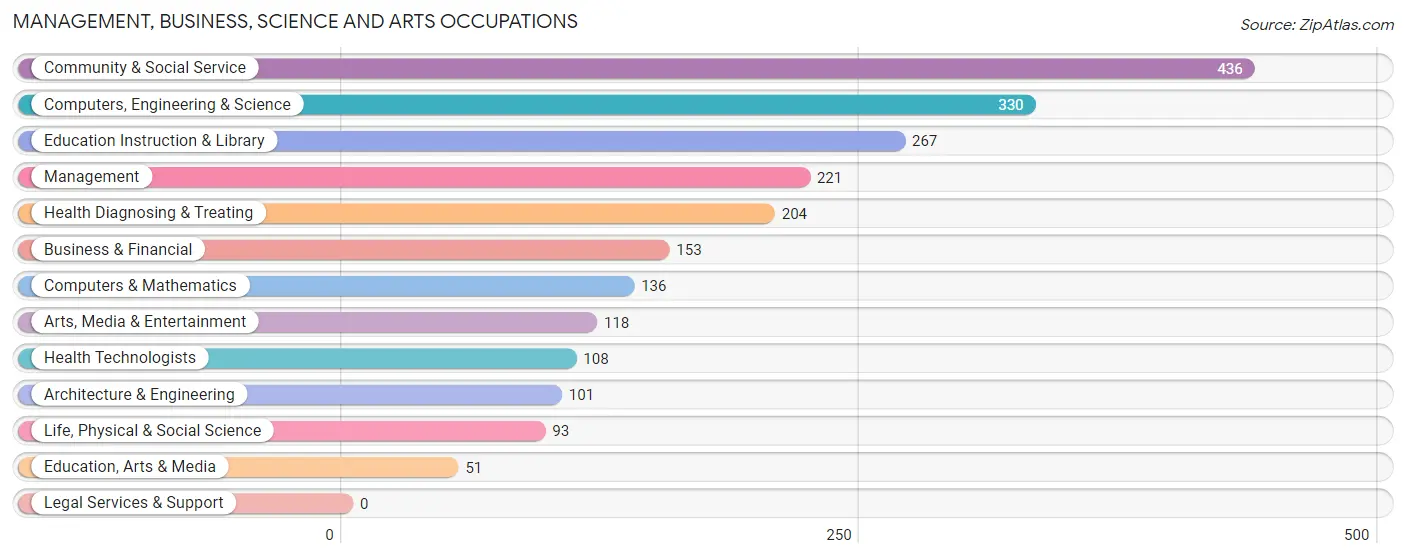
The most common Management, Business, Science and Arts occupations in Ballston Spa are Community & Social Service (436 | 14.3%), Computers, Engineering & Science (330 | 10.8%), Education Instruction & Library (267 | 8.8%), Management (221 | 7.3%), and Health Diagnosing & Treating (204 | 6.7%).
Management, Business, Science and Arts Occupations by Sex
Within the Management, Business, Science and Arts occupations in Ballston Spa, the most male-oriented occupations are Computers & Mathematics (100.0%), Architecture & Engineering (79.2%), and Business & Financial (77.1%), while the most female-oriented occupations are Arts, Media & Entertainment (100.0%), Life, Physical & Social Science (92.5%), and Community & Social Service (75.0%).

| Occupation | Male | Female |
| Management | 102 (46.2%) | 119 (53.8%) |
| Business & Financial | 118 (77.1%) | 35 (22.9%) |
| Computers, Engineering & Science | 223 (67.6%) | 107 (32.4%) |
| Computers & Mathematics | 136 (100.0%) | 0 (0.0%) |
| Architecture & Engineering | 80 (79.2%) | 21 (20.8%) |
| Life, Physical & Social Science | 7 (7.5%) | 86 (92.5%) |
| Community & Social Service | 109 (25.0%) | 327 (75.0%) |
| Education, Arts & Media | 14 (27.5%) | 37 (72.6%) |
| Legal Services & Support | 0 (0.0%) | 0 (0.0%) |
| Education Instruction & Library | 95 (35.6%) | 172 (64.4%) |
| Arts, Media & Entertainment | 0 (0.0%) | 118 (100.0%) |
| Health Diagnosing & Treating | 94 (46.1%) | 110 (53.9%) |
| Health Technologists | 56 (51.8%) | 52 (48.1%) |
| Total (Category) | 646 (48.1%) | 698 (51.9%) |
| Total (Overall) | 1,479 (48.6%) | 1,566 (51.4%) |
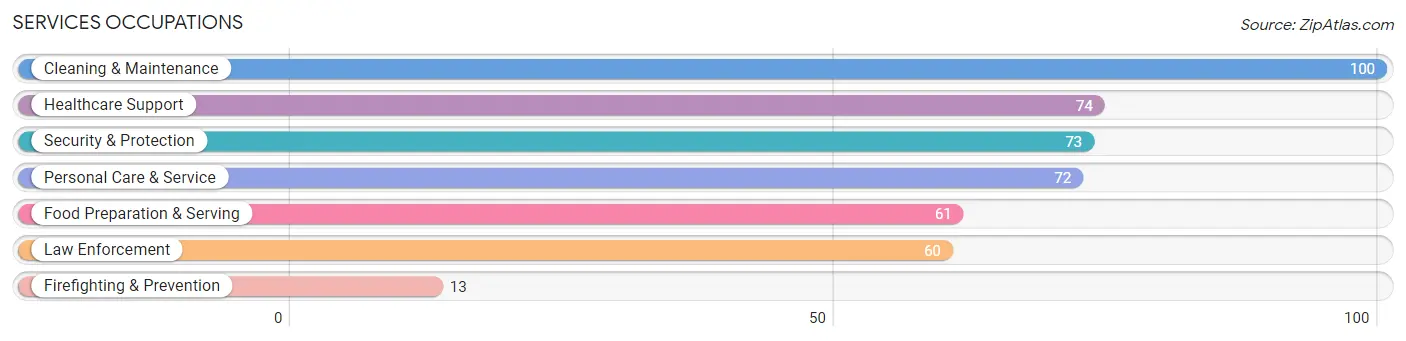
Services Occupations
The most common Services occupations in Ballston Spa are Cleaning & Maintenance (100 | 3.3%), Healthcare Support (74 | 2.4%), Security & Protection (73 | 2.4%), Personal Care & Service (72 | 2.4%), and Food Preparation & Serving (61 | 2.0%).
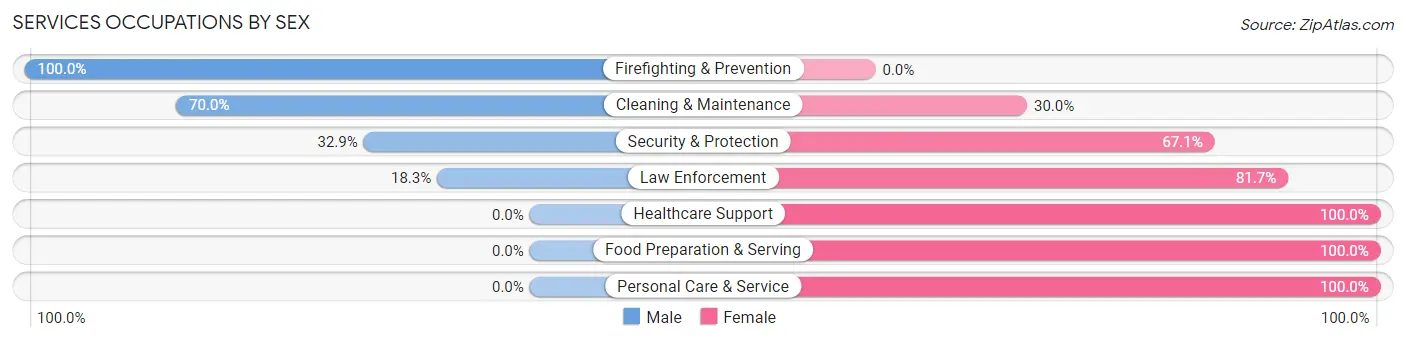
Services Occupations by Sex
Within the Services occupations in Ballston Spa, the most male-oriented occupations are Firefighting & Prevention (100.0%), Cleaning & Maintenance (70.0%), and Security & Protection (32.9%), while the most female-oriented occupations are Healthcare Support (100.0%), Food Preparation & Serving (100.0%), and Personal Care & Service (100.0%).
| Occupation | Male | Female |
| Healthcare Support | 0 (0.0%) | 74 (100.0%) |
| Security & Protection | 24 (32.9%) | 49 (67.1%) |
| Firefighting & Prevention | 13 (100.0%) | 0 (0.0%) |
| Law Enforcement | 11 (18.3%) | 49 (81.7%) |
| Food Preparation & Serving | 0 (0.0%) | 61 (100.0%) |
| Cleaning & Maintenance | 70 (70.0%) | 30 (30.0%) |
| Personal Care & Service | 0 (0.0%) | 72 (100.0%) |
| Total (Category) | 94 (24.7%) | 286 (75.3%) |
| Total (Overall) | 1,479 (48.6%) | 1,566 (51.4%) |
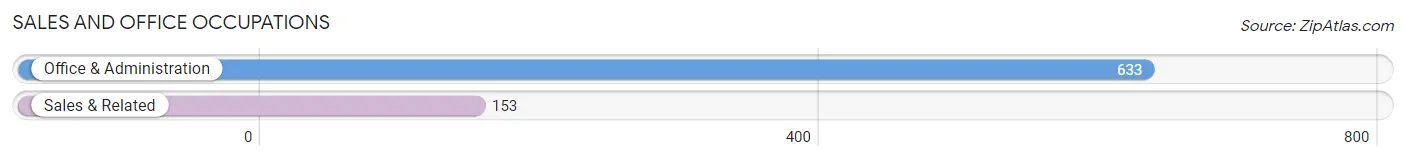
Sales and Office Occupations
The most common Sales and Office occupations in Ballston Spa are Office & Administration (633 | 20.8%), and Sales & Related (153 | 5.0%).
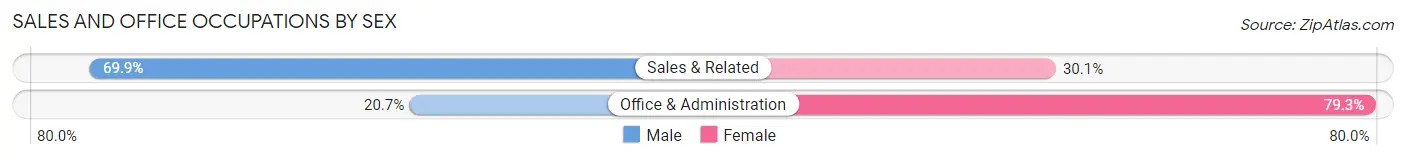
Sales and Office Occupations by Sex
| Occupation | Male | Female |
| Sales & Related | 107 (69.9%) | 46 (30.1%) |
| Office & Administration | 131 (20.7%) | 502 (79.3%) |
| Total (Category) | 238 (30.3%) | 548 (69.7%) |
| Total (Overall) | 1,479 (48.6%) | 1,566 (51.4%) |
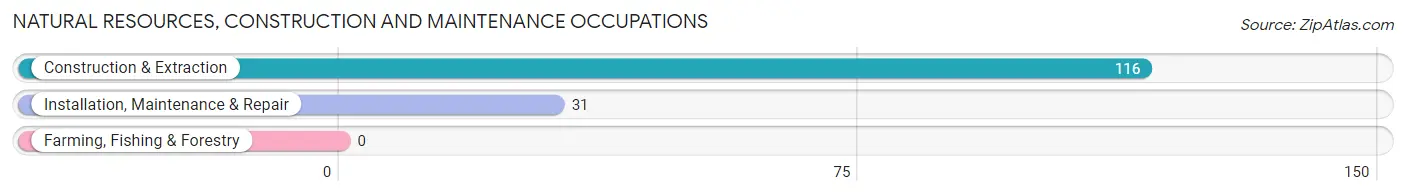
Natural Resources, Construction and Maintenance Occupations
The most common Natural Resources, Construction and Maintenance occupations in Ballston Spa are Construction & Extraction (116 | 3.8%), and Installation, Maintenance & Repair (31 | 1.0%).
Natural Resources, Construction and Maintenance Occupations by Sex
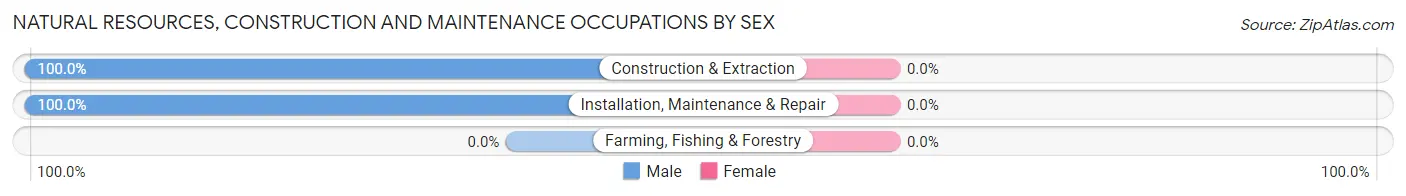
| Occupation | Male | Female |
| Farming, Fishing & Forestry | 0 (0.0%) | 0 (0.0%) |
| Construction & Extraction | 116 (100.0%) | 0 (0.0%) |
| Installation, Maintenance & Repair | 31 (100.0%) | 0 (0.0%) |
| Total (Category) | 147 (100.0%) | 0 (0.0%) |
| Total (Overall) | 1,479 (48.6%) | 1,566 (51.4%) |
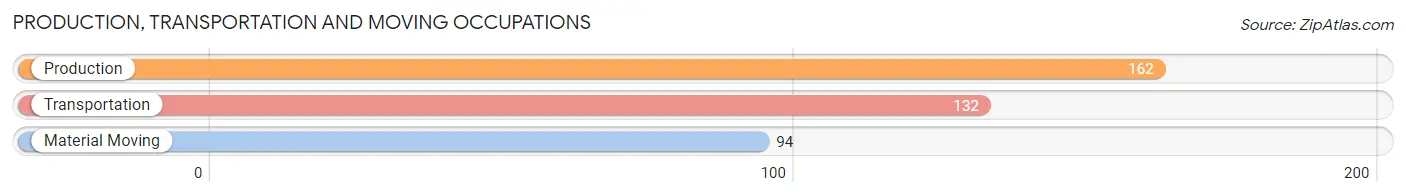
Production, Transportation and Moving Occupations
The most common Production, Transportation and Moving occupations in Ballston Spa are Production (162 | 5.3%), Transportation (132 | 4.3%), and Material Moving (94 | 3.1%).
Production, Transportation and Moving Occupations by Sex
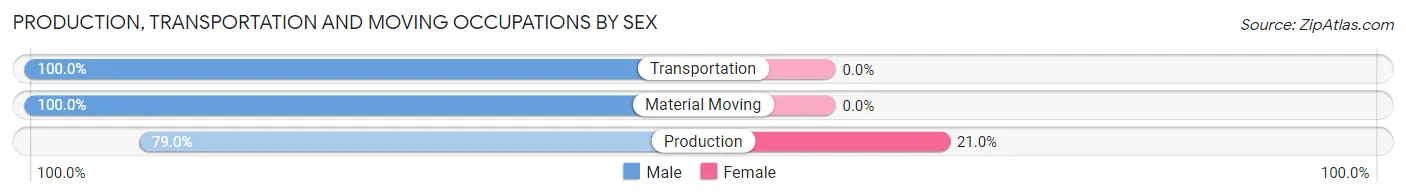
| Occupation | Male | Female |
| Production | 128 (79.0%) | 34 (21.0%) |
| Transportation | 132 (100.0%) | 0 (0.0%) |
| Material Moving | 94 (100.0%) | 0 (0.0%) |
| Total (Category) | 354 (91.2%) | 34 (8.8%) |
| Total (Overall) | 1,479 (48.6%) | 1,566 (51.4%) |
Employment Industries by Sex in Ballston Spa
Employment Industries in Ballston Spa
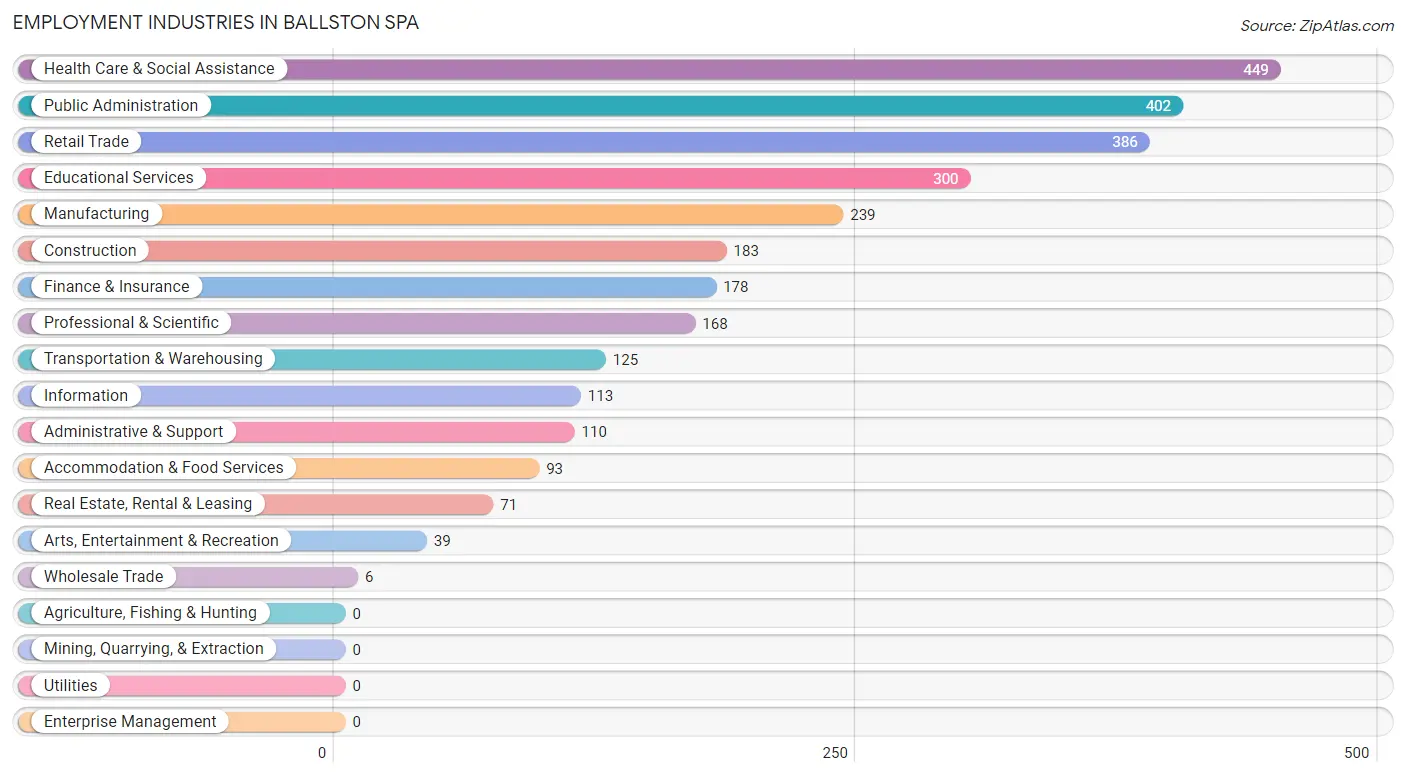
The major employment industries in Ballston Spa include Health Care & Social Assistance (449 | 14.7%), Public Administration (402 | 13.2%), Retail Trade (386 | 12.7%), Educational Services (300 | 9.9%), and Manufacturing (239 | 7.9%).
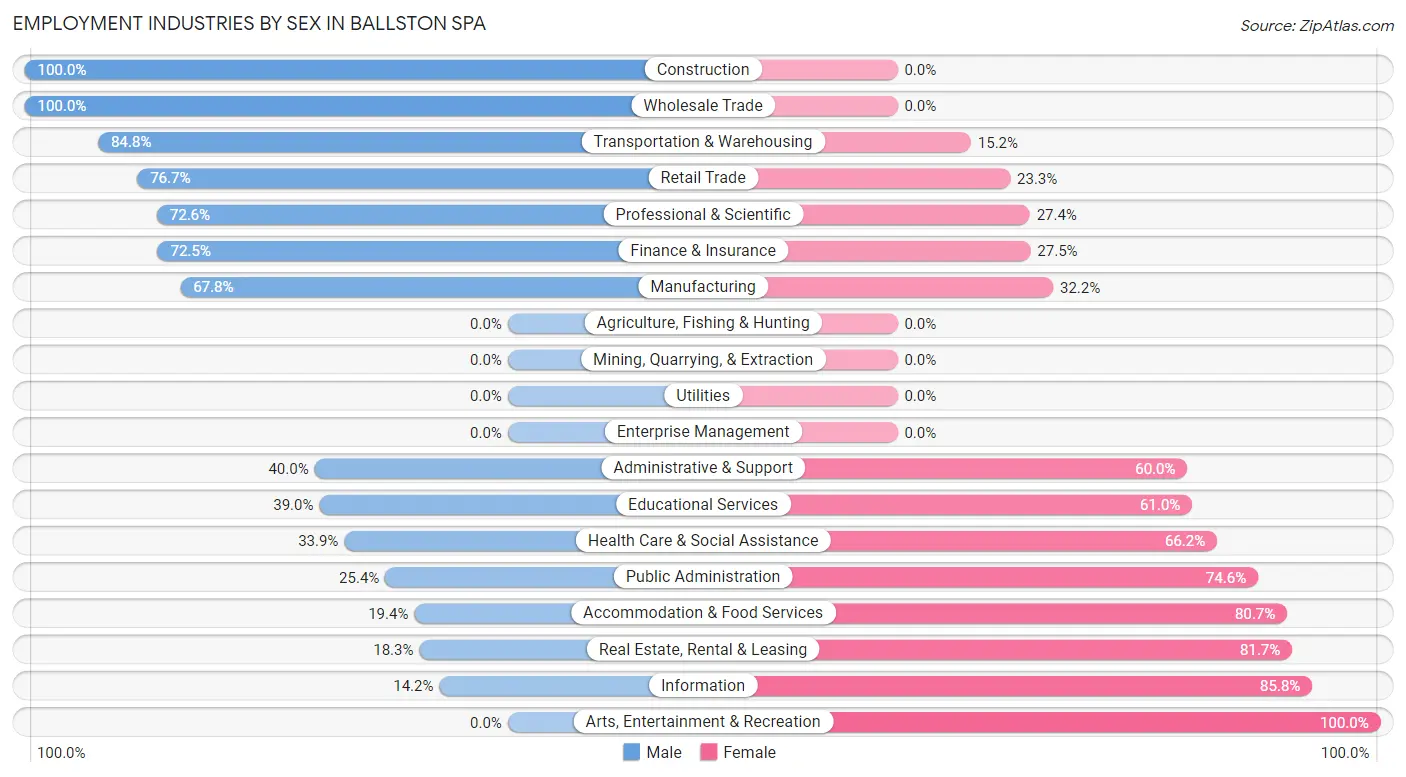
Employment Industries by Sex in Ballston Spa
The Ballston Spa industries that see more men than women are Construction (100.0%), Wholesale Trade (100.0%), and Transportation & Warehousing (84.8%), whereas the industries that tend to have a higher number of women are Arts, Entertainment & Recreation (100.0%), Information (85.8%), and Real Estate, Rental & Leasing (81.7%).
| Industry | Male | Female |
| Agriculture, Fishing & Hunting | 0 (0.0%) | 0 (0.0%) |
| Mining, Quarrying, & Extraction | 0 (0.0%) | 0 (0.0%) |
| Construction | 183 (100.0%) | 0 (0.0%) |
| Manufacturing | 162 (67.8%) | 77 (32.2%) |
| Wholesale Trade | 6 (100.0%) | 0 (0.0%) |
| Retail Trade | 296 (76.7%) | 90 (23.3%) |
| Transportation & Warehousing | 106 (84.8%) | 19 (15.2%) |
| Utilities | 0 (0.0%) | 0 (0.0%) |
| Information | 16 (14.2%) | 97 (85.8%) |
| Finance & Insurance | 129 (72.5%) | 49 (27.5%) |
| Real Estate, Rental & Leasing | 13 (18.3%) | 58 (81.7%) |
| Professional & Scientific | 122 (72.6%) | 46 (27.4%) |
| Enterprise Management | 0 (0.0%) | 0 (0.0%) |
| Administrative & Support | 44 (40.0%) | 66 (60.0%) |
| Educational Services | 117 (39.0%) | 183 (61.0%) |
| Health Care & Social Assistance | 152 (33.9%) | 297 (66.1%) |
| Arts, Entertainment & Recreation | 0 (0.0%) | 39 (100.0%) |
| Accommodation & Food Services | 18 (19.4%) | 75 (80.6%) |
| Public Administration | 102 (25.4%) | 300 (74.6%) |
| Total | 1,479 (48.6%) | 1,566 (51.4%) |
Education in Ballston Spa
School Enrollment in Ballston Spa
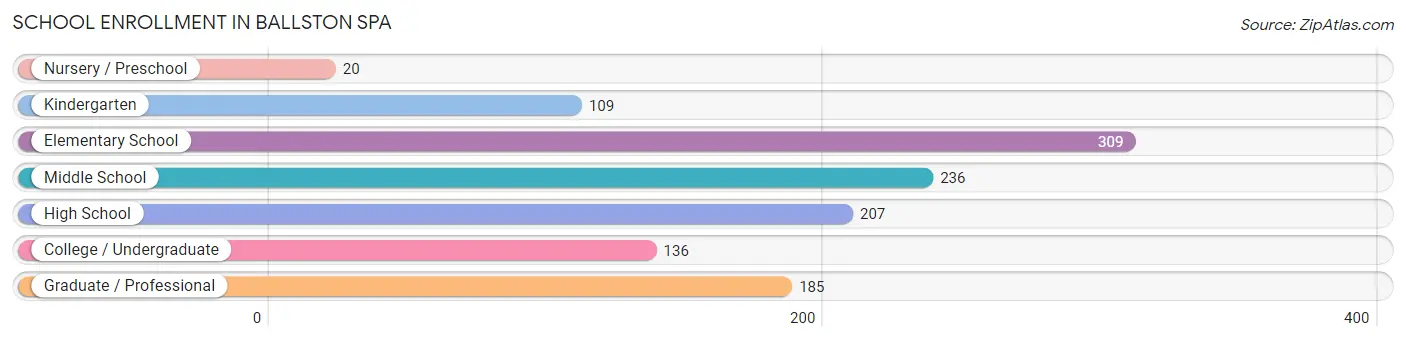
The most common levels of schooling among the 1,202 students in Ballston Spa are elementary school (309 | 25.7%), middle school (236 | 19.6%), and high school (207 | 17.2%).
| School Level | # Students | % Students |
| Nursery / Preschool | 20 | 1.7% |
| Kindergarten | 109 | 9.1% |
| Elementary School | 309 | 25.7% |
| Middle School | 236 | 19.6% |
| High School | 207 | 17.2% |
| College / Undergraduate | 136 | 11.3% |
| Graduate / Professional | 185 | 15.4% |
| Total | 1,202 | 100.0% |
School Enrollment by Age by Funding Source in Ballston Spa
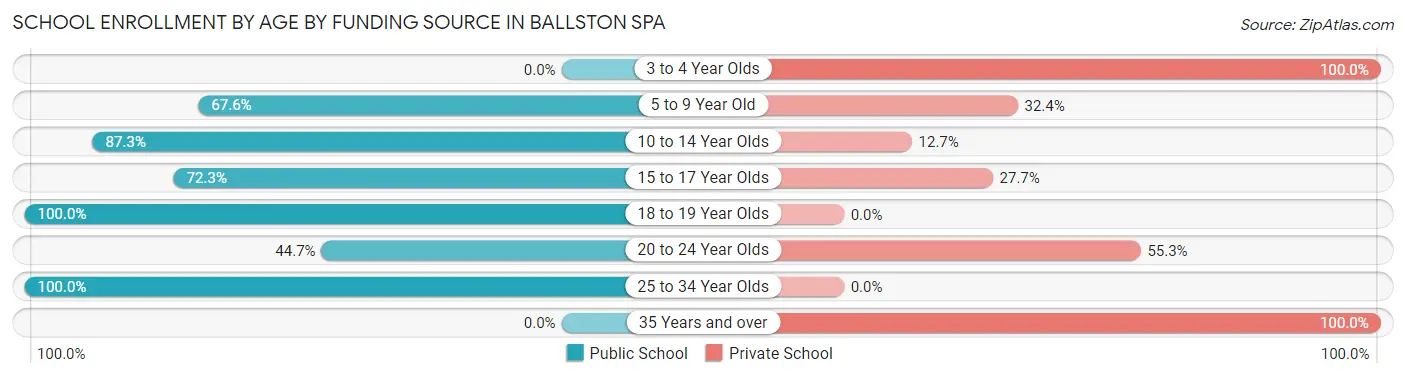
Out of a total of 1,202 students who are enrolled in schools in Ballston Spa, 347 (28.9%) attend a private institution, while the remaining 855 (71.1%) are enrolled in public schools. The age group of 3 to 4 year olds has the highest likelihood of being enrolled in private schools, with 50 (100.0% in the age bracket) enrolled. Conversely, the age group of 18 to 19 year olds has the lowest likelihood of being enrolled in a private school, with 95 (100.0% in the age bracket) attending a public institution.
| Age Bracket | Public School | Private School |
| 3 to 4 Year Olds | 0 (0.0%) | 50 (100.0%) |
| 5 to 9 Year Old | 190 (67.6%) | 91 (32.4%) |
| 10 to 14 Year Olds | 345 (87.3%) | 50 (12.7%) |
| 15 to 17 Year Olds | 112 (72.3%) | 43 (27.7%) |
| 18 to 19 Year Olds | 95 (100.0%) | 0 (0.0%) |
| 20 to 24 Year Olds | 72 (44.7%) | 89 (55.3%) |
| 25 to 34 Year Olds | 41 (100.0%) | 0 (0.0%) |
| 35 Years and over | 0 (0.0%) | 24 (100.0%) |
| Total | 855 (71.1%) | 347 (28.9%) |
Educational Attainment by Field of Study in Ballston Spa
Bio, nature & agricultural (318 | 21.0%), business (310 | 20.5%), education (160 | 10.6%), psychology (111 | 7.3%), and communications (109 | 7.2%) are the most common fields of study among 1,511 individuals in Ballston Spa who have obtained a bachelor's degree or higher.
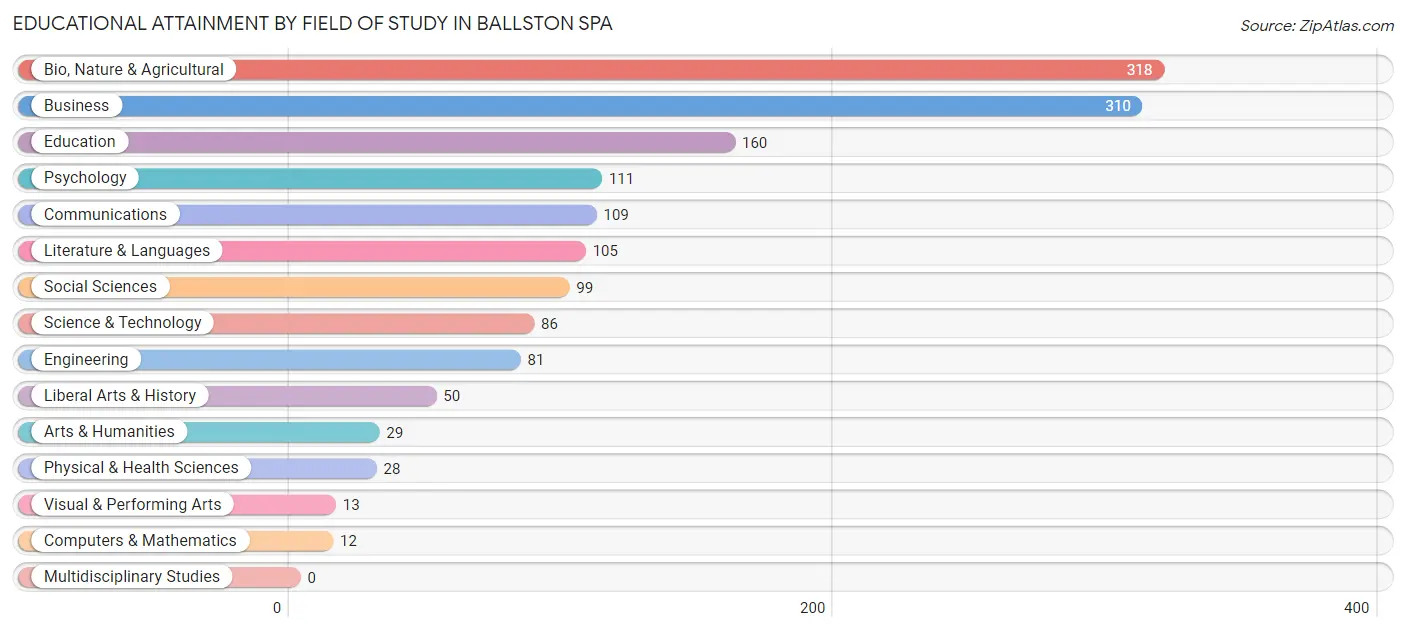
| Field of Study | # Graduates | % Graduates |
| Computers & Mathematics | 12 | 0.8% |
| Bio, Nature & Agricultural | 318 | 21.0% |
| Physical & Health Sciences | 28 | 1.8% |
| Psychology | 111 | 7.3% |
| Social Sciences | 99 | 6.6% |
| Engineering | 81 | 5.4% |
| Multidisciplinary Studies | 0 | 0.0% |
| Science & Technology | 86 | 5.7% |
| Business | 310 | 20.5% |
| Education | 160 | 10.6% |
| Literature & Languages | 105 | 7.0% |
| Liberal Arts & History | 50 | 3.3% |
| Visual & Performing Arts | 13 | 0.9% |
| Communications | 109 | 7.2% |
| Arts & Humanities | 29 | 1.9% |
| Total | 1,511 | 100.0% |
Transportation & Commute in Ballston Spa
Vehicle Availability by Sex in Ballston Spa
The most prevalent vehicle ownership categories in Ballston Spa are males with 2 vehicles (758, accounting for 50.8%) and females with 2 vehicles (657, making up 49.4%).
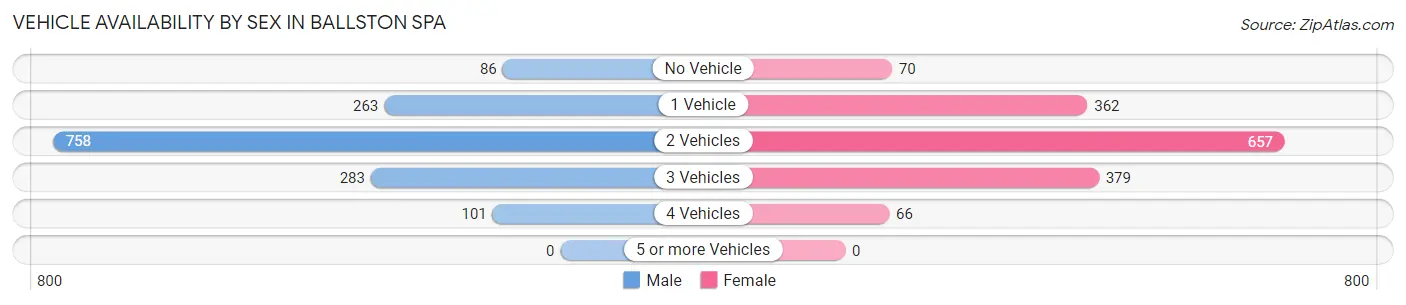
| Vehicles Available | Male | Female |
| No Vehicle | 86 (5.8%) | 70 (4.6%) |
| 1 Vehicle | 263 (17.6%) | 362 (23.6%) |
| 2 Vehicles | 758 (50.8%) | 657 (42.8%) |
| 3 Vehicles | 283 (19.0%) | 379 (24.7%) |
| 4 Vehicles | 101 (6.8%) | 66 (4.3%) |
| 5 or more Vehicles | 0 (0.0%) | 0 (0.0%) |
| Total | 1,491 (100.0%) | 1,534 (100.0%) |
Commute Time in Ballston Spa
The most frequently occuring commute durations in Ballston Spa are 30 to 34 minutes (428 commuters, 16.5%), 10 to 14 minutes (336 commuters, 13.0%), and 15 to 19 minutes (318 commuters, 12.3%).
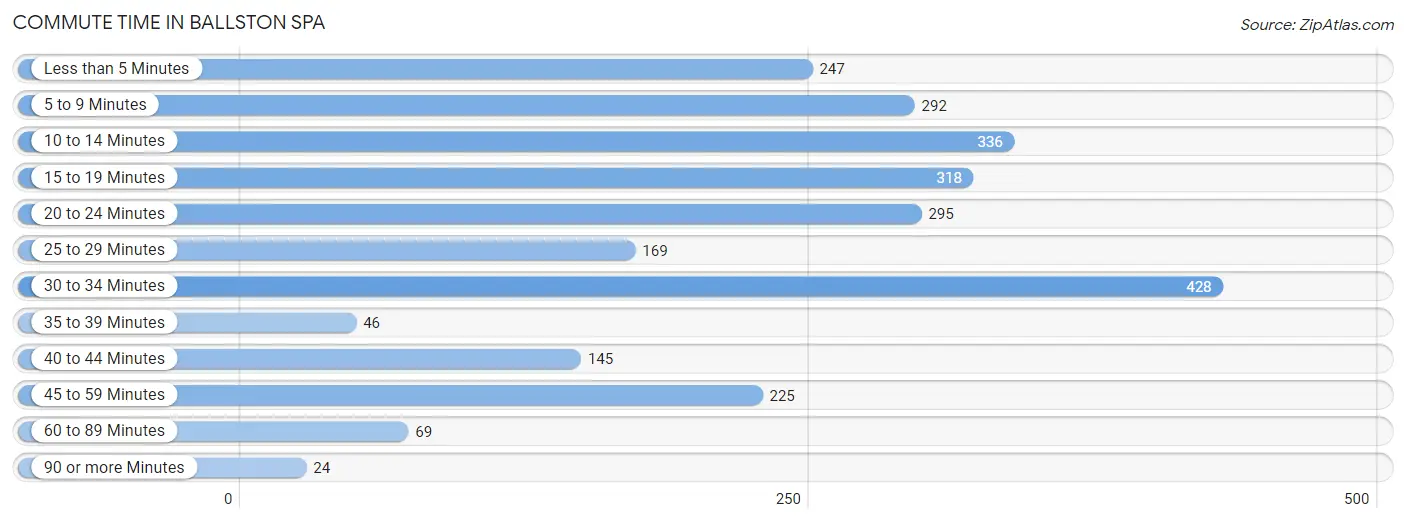
| Commute Time | # Commuters | % Commuters |
| Less than 5 Minutes | 247 | 9.5% |
| 5 to 9 Minutes | 292 | 11.3% |
| 10 to 14 Minutes | 336 | 13.0% |
| 15 to 19 Minutes | 318 | 12.3% |
| 20 to 24 Minutes | 295 | 11.4% |
| 25 to 29 Minutes | 169 | 6.5% |
| 30 to 34 Minutes | 428 | 16.5% |
| 35 to 39 Minutes | 46 | 1.8% |
| 40 to 44 Minutes | 145 | 5.6% |
| 45 to 59 Minutes | 225 | 8.7% |
| 60 to 89 Minutes | 69 | 2.7% |
| 90 or more Minutes | 24 | 0.9% |
Commute Time by Sex in Ballston Spa
The most common commute times in Ballston Spa are 30 to 34 minutes (210 commuters, 16.3%) for males and 30 to 34 minutes (218 commuters, 16.7%) for females.
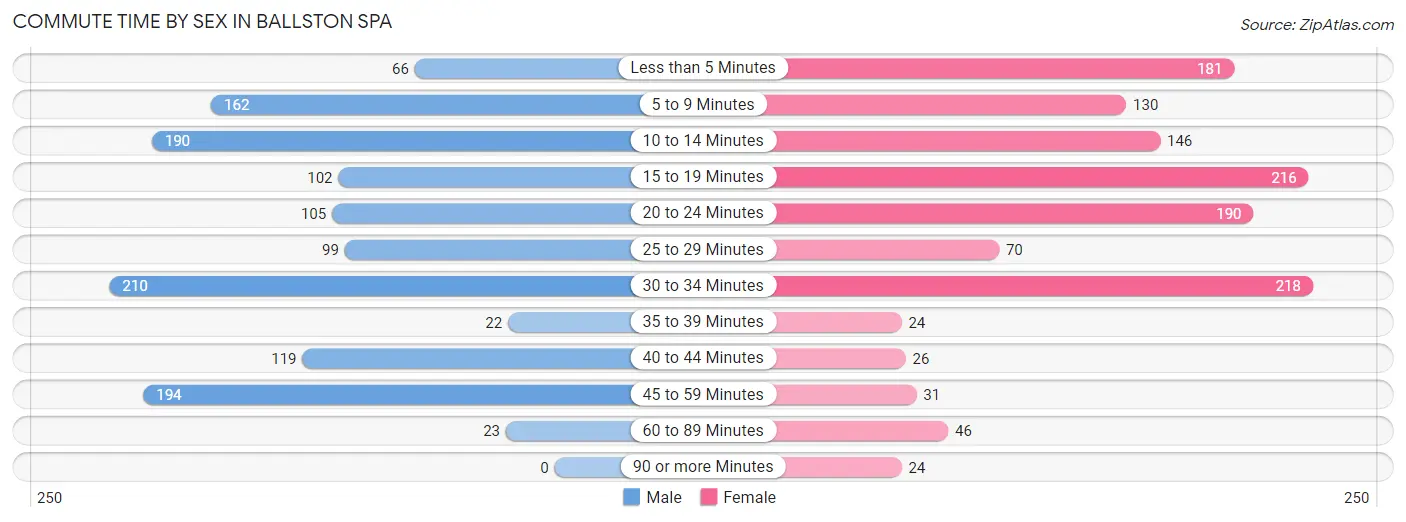
| Commute Time | Male | Female |
| Less than 5 Minutes | 66 (5.1%) | 181 (13.9%) |
| 5 to 9 Minutes | 162 (12.5%) | 130 (10.0%) |
| 10 to 14 Minutes | 190 (14.7%) | 146 (11.2%) |
| 15 to 19 Minutes | 102 (7.9%) | 216 (16.6%) |
| 20 to 24 Minutes | 105 (8.1%) | 190 (14.6%) |
| 25 to 29 Minutes | 99 (7.7%) | 70 (5.4%) |
| 30 to 34 Minutes | 210 (16.3%) | 218 (16.7%) |
| 35 to 39 Minutes | 22 (1.7%) | 24 (1.8%) |
| 40 to 44 Minutes | 119 (9.2%) | 26 (2.0%) |
| 45 to 59 Minutes | 194 (15.0%) | 31 (2.4%) |
| 60 to 89 Minutes | 23 (1.8%) | 46 (3.5%) |
| 90 or more Minutes | 0 (0.0%) | 24 (1.8%) |
Time of Departure to Work by Sex in Ballston Spa
The most frequent times of departure to work in Ballston Spa are 7:30 AM to 7:59 AM (169, 13.1%) for males and 8:30 AM to 8:59 AM (289, 22.2%) for females.
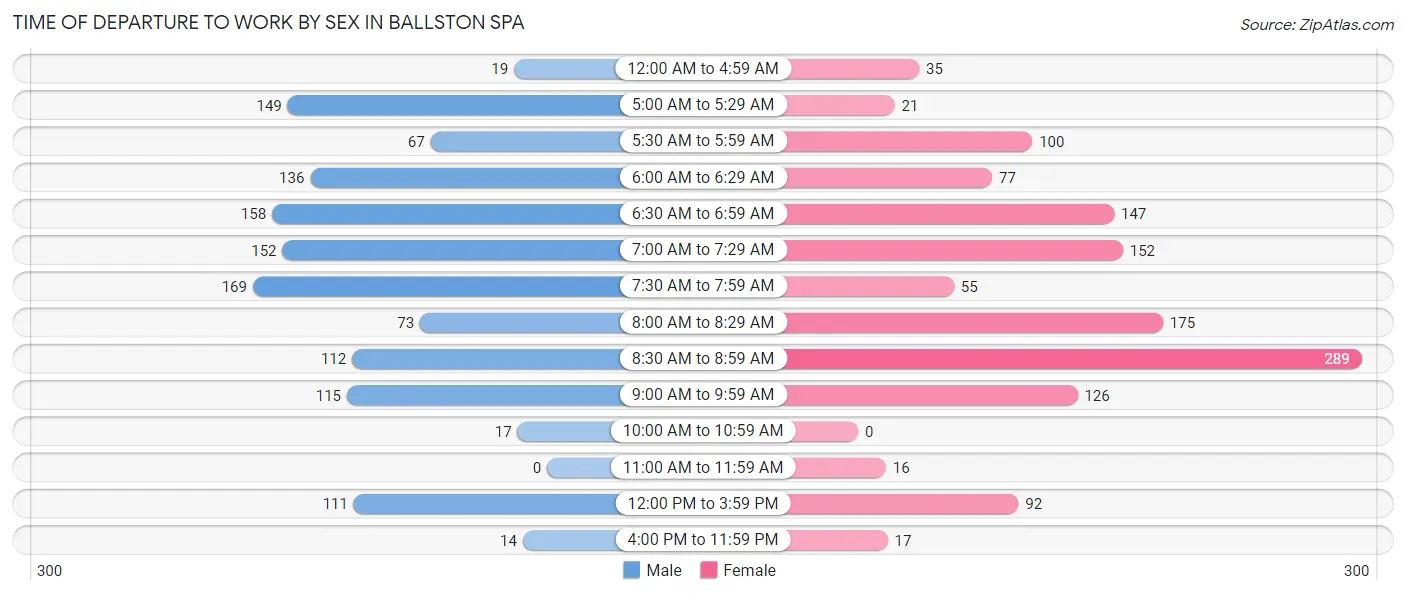
| Time of Departure | Male | Female |
| 12:00 AM to 4:59 AM | 19 (1.5%) | 35 (2.7%) |
| 5:00 AM to 5:29 AM | 149 (11.5%) | 21 (1.6%) |
| 5:30 AM to 5:59 AM | 67 (5.2%) | 100 (7.7%) |
| 6:00 AM to 6:29 AM | 136 (10.5%) | 77 (5.9%) |
| 6:30 AM to 6:59 AM | 158 (12.2%) | 147 (11.3%) |
| 7:00 AM to 7:29 AM | 152 (11.8%) | 152 (11.7%) |
| 7:30 AM to 7:59 AM | 169 (13.1%) | 55 (4.2%) |
| 8:00 AM to 8:29 AM | 73 (5.7%) | 175 (13.4%) |
| 8:30 AM to 8:59 AM | 112 (8.7%) | 289 (22.2%) |
| 9:00 AM to 9:59 AM | 115 (8.9%) | 126 (9.7%) |
| 10:00 AM to 10:59 AM | 17 (1.3%) | 0 (0.0%) |
| 11:00 AM to 11:59 AM | 0 (0.0%) | 16 (1.2%) |
| 12:00 PM to 3:59 PM | 111 (8.6%) | 92 (7.1%) |
| 4:00 PM to 11:59 PM | 14 (1.1%) | 17 (1.3%) |
| Total | 1,292 (100.0%) | 1,302 (100.0%) |
Housing Occupancy in Ballston Spa
Occupancy by Ownership in Ballston Spa
Of the total 2,184 dwellings in Ballston Spa, owner-occupied units account for 1,431 (65.5%), while renter-occupied units make up 753 (34.5%).
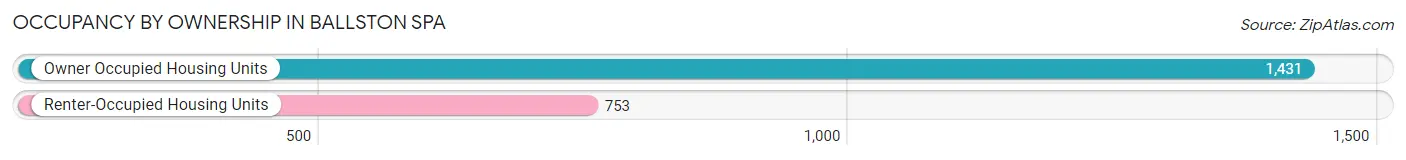
| Occupancy | # Housing Units | % Housing Units |
| Owner Occupied Housing Units | 1,431 | 65.5% |
| Renter-Occupied Housing Units | 753 | 34.5% |
| Total Occupied Housing Units | 2,184 | 100.0% |
Occupancy by Household Size in Ballston Spa
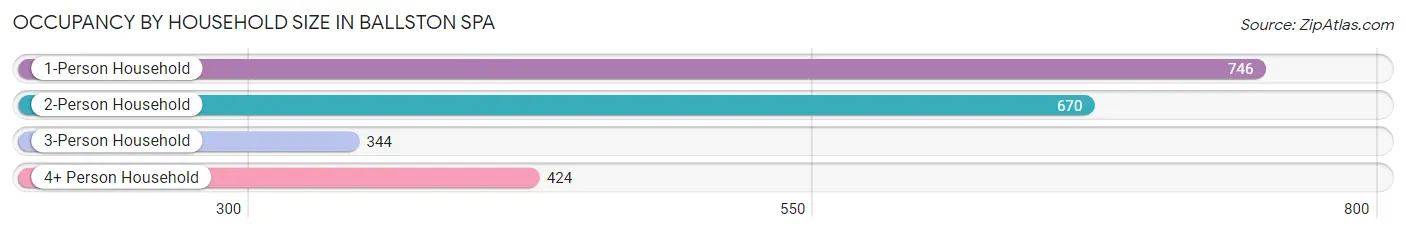
| Household Size | # Housing Units | % Housing Units |
| 1-Person Household | 746 | 34.2% |
| 2-Person Household | 670 | 30.7% |
| 3-Person Household | 344 | 15.8% |
| 4+ Person Household | 424 | 19.4% |
| Total Housing Units | 2,184 | 100.0% |
Occupancy by Ownership by Household Size in Ballston Spa
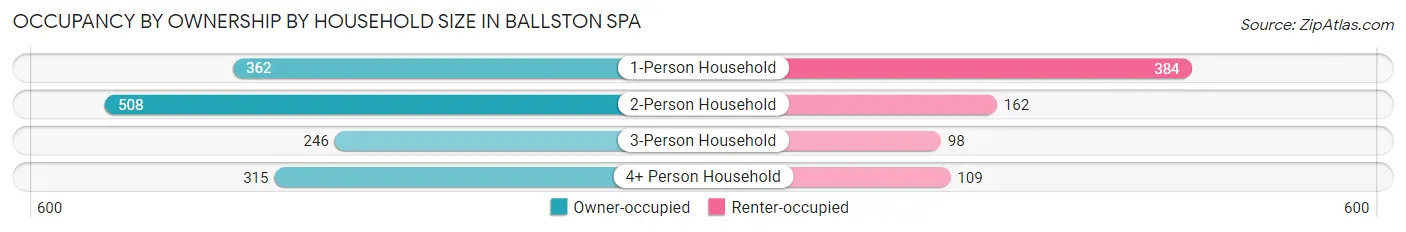
| Household Size | Owner-occupied | Renter-occupied |
| 1-Person Household | 362 (48.5%) | 384 (51.5%) |
| 2-Person Household | 508 (75.8%) | 162 (24.2%) |
| 3-Person Household | 246 (71.5%) | 98 (28.5%) |
| 4+ Person Household | 315 (74.3%) | 109 (25.7%) |
| Total Housing Units | 1,431 (65.5%) | 753 (34.5%) |
Occupancy by Educational Attainment in Ballston Spa
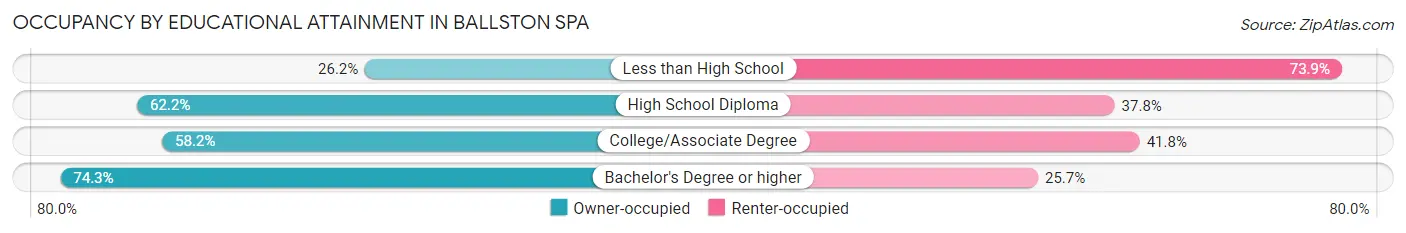
| Household Size | Owner-occupied | Renter-occupied |
| Less than High School | 17 (26.2%) | 48 (73.9%) |
| High School Diploma | 401 (62.2%) | 244 (37.8%) |
| College/Associate Degree | 298 (58.2%) | 214 (41.8%) |
| Bachelor's Degree or higher | 715 (74.3%) | 247 (25.7%) |
Occupancy by Age of Householder in Ballston Spa
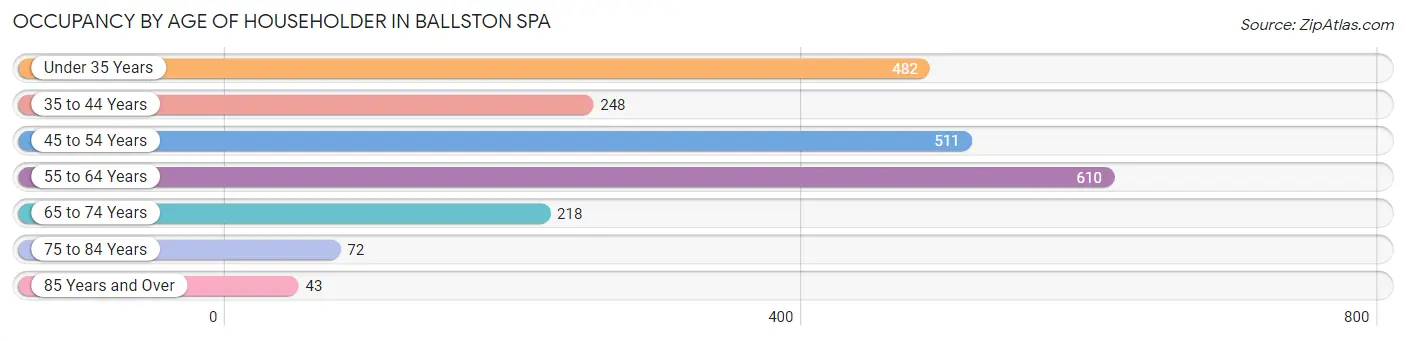
| Age Bracket | # Households | % Households |
| Under 35 Years | 482 | 22.1% |
| 35 to 44 Years | 248 | 11.4% |
| 45 to 54 Years | 511 | 23.4% |
| 55 to 64 Years | 610 | 27.9% |
| 65 to 74 Years | 218 | 10.0% |
| 75 to 84 Years | 72 | 3.3% |
| 85 Years and Over | 43 | 2.0% |
| Total | 2,184 | 100.0% |
Housing Finances in Ballston Spa
Median Income by Occupancy in Ballston Spa
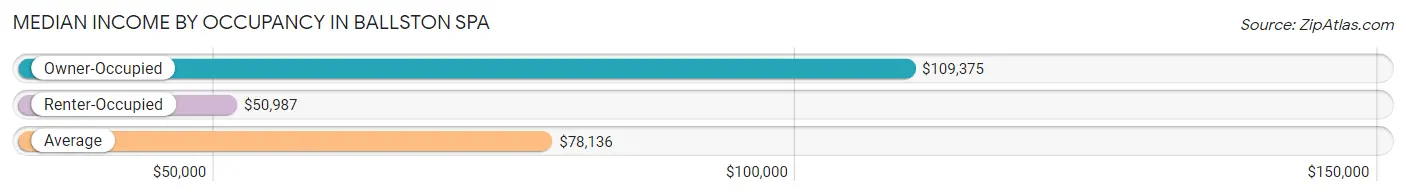
| Occupancy Type | # Households | Median Income |
| Owner-Occupied | 1,431 (65.5%) | $109,375 |
| Renter-Occupied | 753 (34.5%) | $50,987 |
| Average | 2,184 (100.0%) | $78,136 |
Occupancy by Householder Income Bracket in Ballston Spa
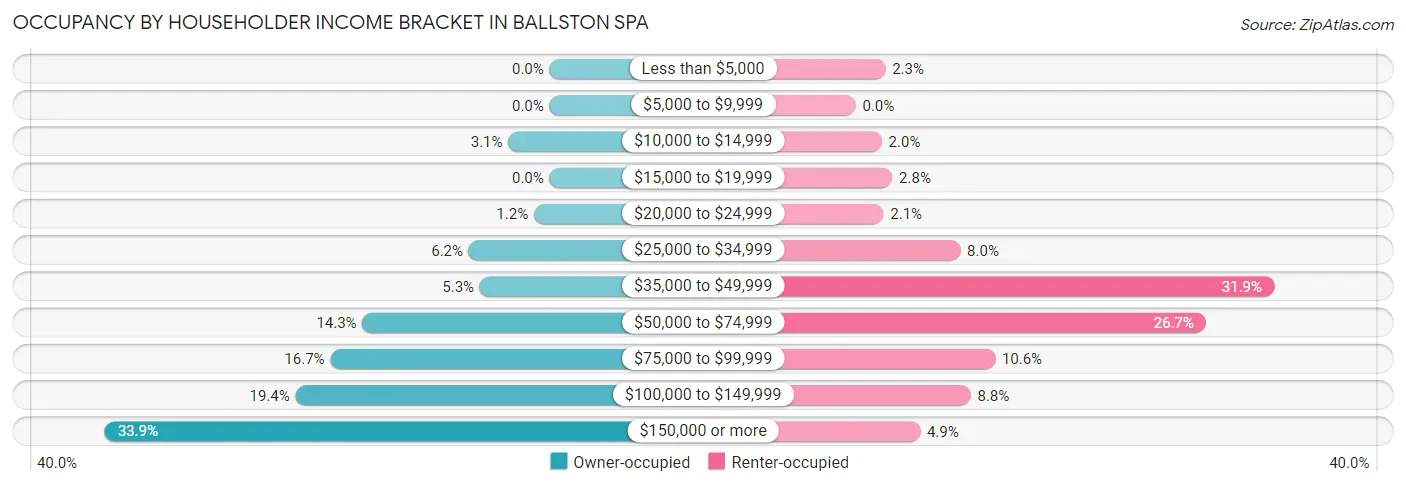
| Income Bracket | Owner-occupied | Renter-occupied |
| Less than $5,000 | 0 (0.0%) | 17 (2.3%) |
| $5,000 to $9,999 | 0 (0.0%) | 0 (0.0%) |
| $10,000 to $14,999 | 45 (3.1%) | 15 (2.0%) |
| $15,000 to $19,999 | 0 (0.0%) | 21 (2.8%) |
| $20,000 to $24,999 | 17 (1.2%) | 16 (2.1%) |
| $25,000 to $34,999 | 88 (6.1%) | 60 (8.0%) |
| $35,000 to $49,999 | 76 (5.3%) | 240 (31.9%) |
| $50,000 to $74,999 | 204 (14.3%) | 201 (26.7%) |
| $75,000 to $99,999 | 239 (16.7%) | 80 (10.6%) |
| $100,000 to $149,999 | 277 (19.4%) | 66 (8.8%) |
| $150,000 or more | 485 (33.9%) | 37 (4.9%) |
| Total | 1,431 (100.0%) | 753 (100.0%) |
Monthly Housing Cost Tiers in Ballston Spa
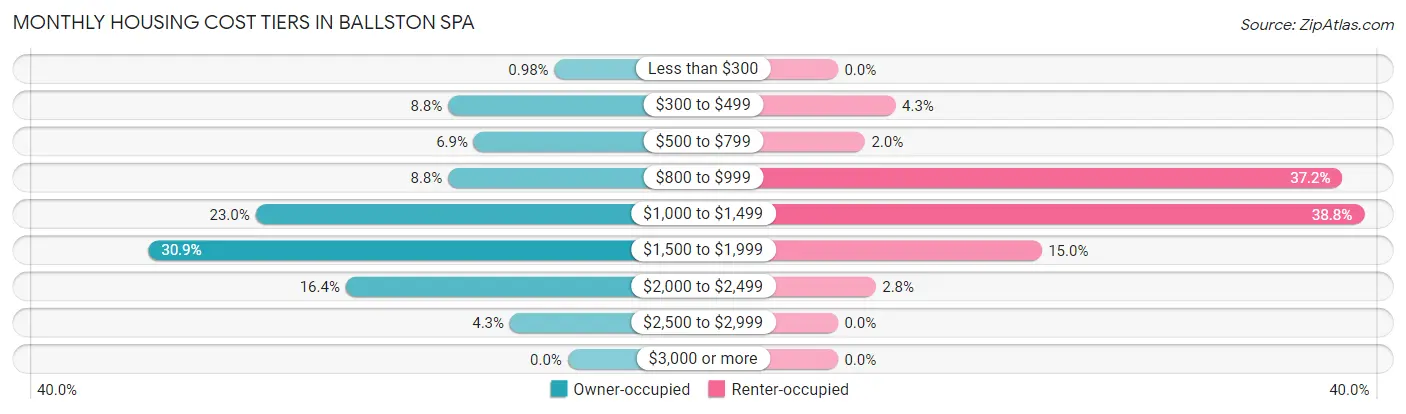
| Monthly Cost | Owner-occupied | Renter-occupied |
| Less than $300 | 14 (1.0%) | 0 (0.0%) |
| $300 to $499 | 126 (8.8%) | 32 (4.3%) |
| $500 to $799 | 99 (6.9%) | 15 (2.0%) |
| $800 to $999 | 126 (8.8%) | 280 (37.2%) |
| $1,000 to $1,499 | 329 (23.0%) | 292 (38.8%) |
| $1,500 to $1,999 | 442 (30.9%) | 113 (15.0%) |
| $2,000 to $2,499 | 234 (16.4%) | 21 (2.8%) |
| $2,500 to $2,999 | 61 (4.3%) | 0 (0.0%) |
| $3,000 or more | 0 (0.0%) | 0 (0.0%) |
| Total | 1,431 (100.0%) | 753 (100.0%) |
Physical Housing Characteristics in Ballston Spa
Housing Structures in Ballston Spa
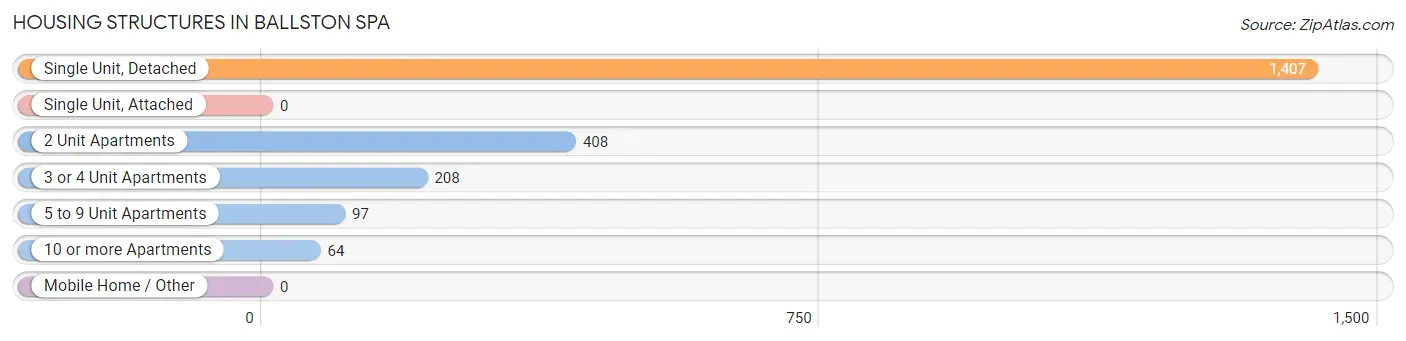
| Structure Type | # Housing Units | % Housing Units |
| Single Unit, Detached | 1,407 | 64.4% |
| Single Unit, Attached | 0 | 0.0% |
| 2 Unit Apartments | 408 | 18.7% |
| 3 or 4 Unit Apartments | 208 | 9.5% |
| 5 to 9 Unit Apartments | 97 | 4.4% |
| 10 or more Apartments | 64 | 2.9% |
| Mobile Home / Other | 0 | 0.0% |
| Total | 2,184 | 100.0% |
Housing Structures by Occupancy in Ballston Spa
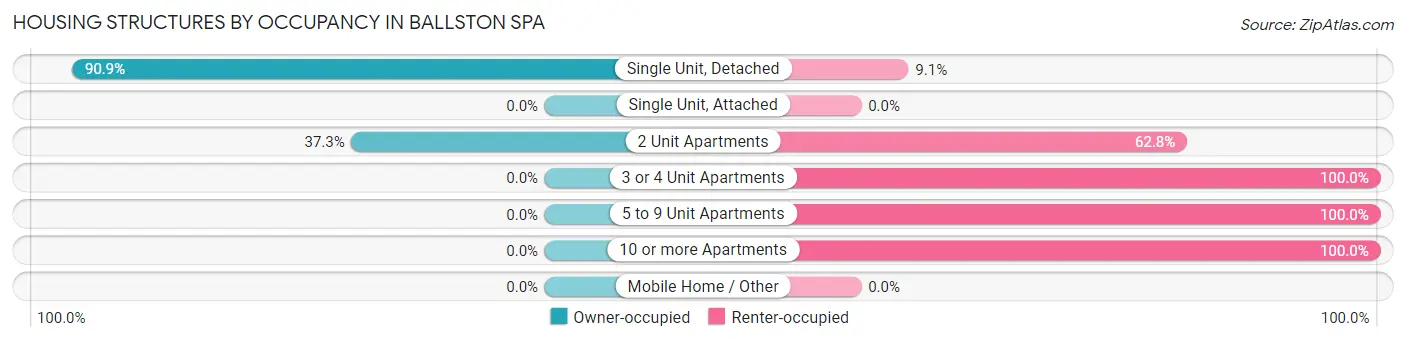
| Structure Type | Owner-occupied | Renter-occupied |
| Single Unit, Detached | 1,279 (90.9%) | 128 (9.1%) |
| Single Unit, Attached | 0 (0.0%) | 0 (0.0%) |
| 2 Unit Apartments | 152 (37.2%) | 256 (62.7%) |
| 3 or 4 Unit Apartments | 0 (0.0%) | 208 (100.0%) |
| 5 to 9 Unit Apartments | 0 (0.0%) | 97 (100.0%) |
| 10 or more Apartments | 0 (0.0%) | 64 (100.0%) |
| Mobile Home / Other | 0 (0.0%) | 0 (0.0%) |
| Total | 1,431 (65.5%) | 753 (34.5%) |
Housing Structures by Number of Rooms in Ballston Spa
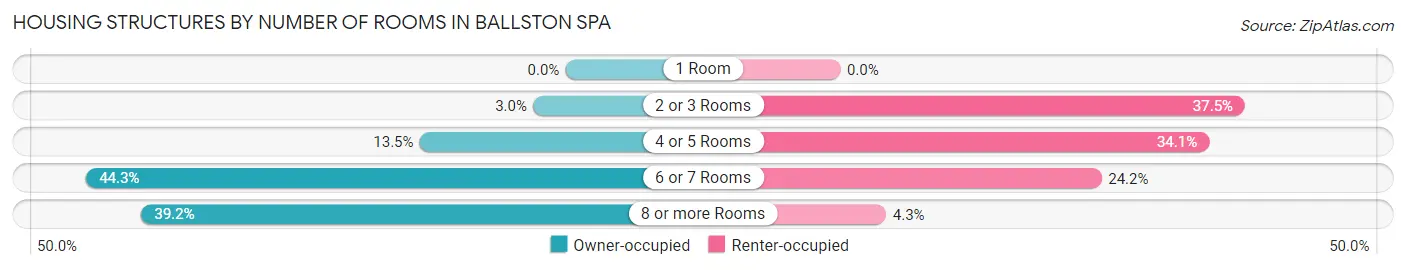
| Number of Rooms | Owner-occupied | Renter-occupied |
| 1 Room | 0 (0.0%) | 0 (0.0%) |
| 2 or 3 Rooms | 43 (3.0%) | 282 (37.4%) |
| 4 or 5 Rooms | 193 (13.5%) | 257 (34.1%) |
| 6 or 7 Rooms | 634 (44.3%) | 182 (24.2%) |
| 8 or more Rooms | 561 (39.2%) | 32 (4.3%) |
| Total | 1,431 (100.0%) | 753 (100.0%) |
Housing Structure by Heating Type in Ballston Spa
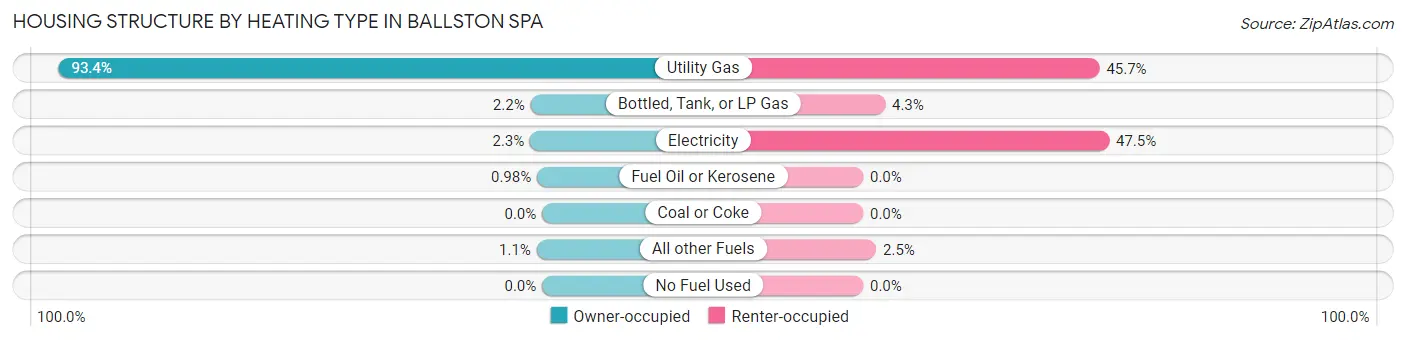
| Heating Type | Owner-occupied | Renter-occupied |
| Utility Gas | 1,337 (93.4%) | 344 (45.7%) |
| Bottled, Tank, or LP Gas | 32 (2.2%) | 32 (4.3%) |
| Electricity | 33 (2.3%) | 358 (47.5%) |
| Fuel Oil or Kerosene | 14 (1.0%) | 0 (0.0%) |
| Coal or Coke | 0 (0.0%) | 0 (0.0%) |
| All other Fuels | 15 (1.1%) | 19 (2.5%) |
| No Fuel Used | 0 (0.0%) | 0 (0.0%) |
| Total | 1,431 (100.0%) | 753 (100.0%) |
Household Vehicle Usage in Ballston Spa
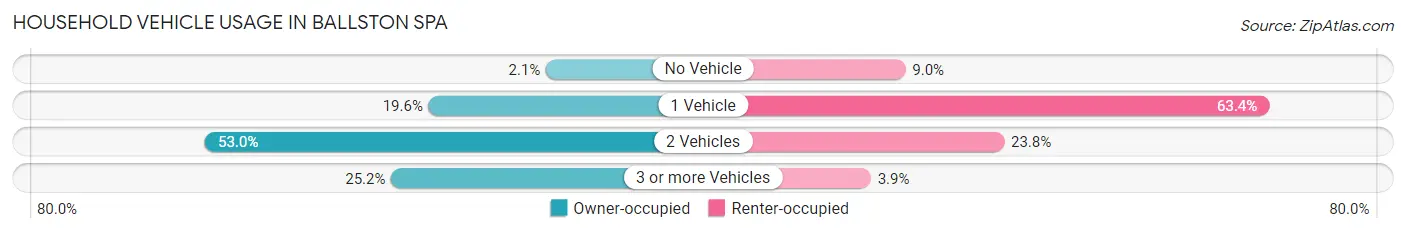
| Vehicles per Household | Owner-occupied | Renter-occupied |
| No Vehicle | 30 (2.1%) | 68 (9.0%) |
| 1 Vehicle | 281 (19.6%) | 477 (63.3%) |
| 2 Vehicles | 759 (53.0%) | 179 (23.8%) |
| 3 or more Vehicles | 361 (25.2%) | 29 (3.8%) |
| Total | 1,431 (100.0%) | 753 (100.0%) |
Real Estate & Mortgages in Ballston Spa
Real Estate and Mortgage Overview in Ballston Spa
| Characteristic | Without Mortgage | With Mortgage |
| Housing Units | 308 | 1,123 |
| Median Property Value | $245,500 | $264,400 |
| Median Household Income | $92,857 | $383 |
| Monthly Housing Costs | $718 | $0 |
| Real Estate Taxes | $5,245 | $119 |
Property Value by Mortgage Status in Ballston Spa
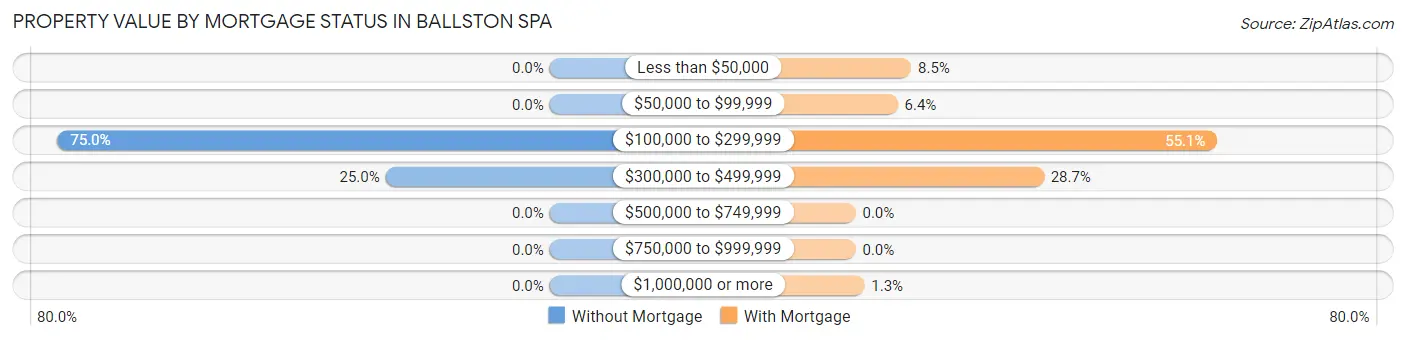
| Property Value | Without Mortgage | With Mortgage |
| Less than $50,000 | 0 (0.0%) | 95 (8.5%) |
| $50,000 to $99,999 | 0 (0.0%) | 72 (6.4%) |
| $100,000 to $299,999 | 231 (75.0%) | 619 (55.1%) |
| $300,000 to $499,999 | 77 (25.0%) | 322 (28.7%) |
| $500,000 to $749,999 | 0 (0.0%) | 0 (0.0%) |
| $750,000 to $999,999 | 0 (0.0%) | 0 (0.0%) |
| $1,000,000 or more | 0 (0.0%) | 15 (1.3%) |
| Total | 308 (100.0%) | 1,123 (100.0%) |
Household Income by Mortgage Status in Ballston Spa
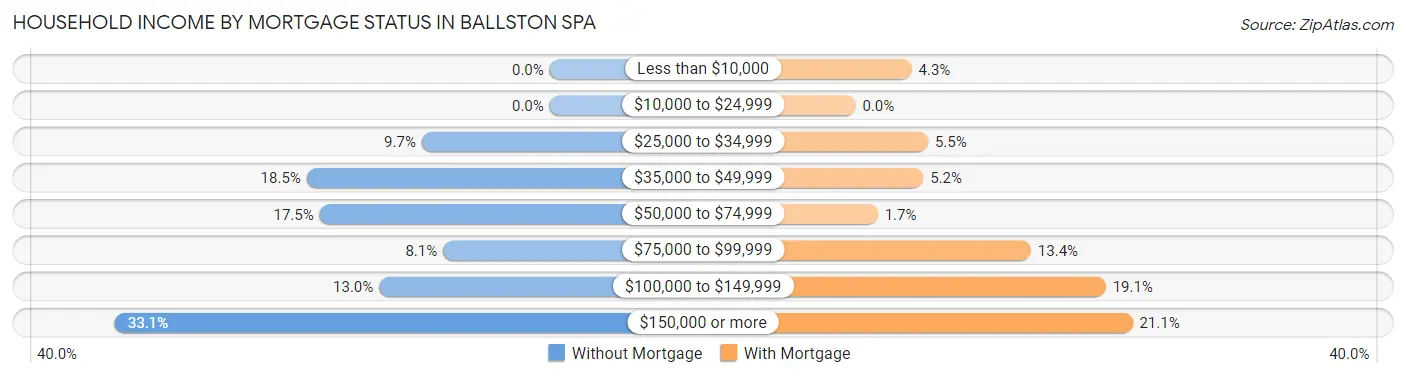
| Household Income | Without Mortgage | With Mortgage |
| Less than $10,000 | 0 (0.0%) | 48 (4.3%) |
| $10,000 to $24,999 | 0 (0.0%) | 0 (0.0%) |
| $25,000 to $34,999 | 30 (9.7%) | 62 (5.5%) |
| $35,000 to $49,999 | 57 (18.5%) | 58 (5.2%) |
| $50,000 to $74,999 | 54 (17.5%) | 19 (1.7%) |
| $75,000 to $99,999 | 25 (8.1%) | 150 (13.4%) |
| $100,000 to $149,999 | 40 (13.0%) | 214 (19.1%) |
| $150,000 or more | 102 (33.1%) | 237 (21.1%) |
| Total | 308 (100.0%) | 1,123 (100.0%) |
Property Value to Household Income Ratio in Ballston Spa
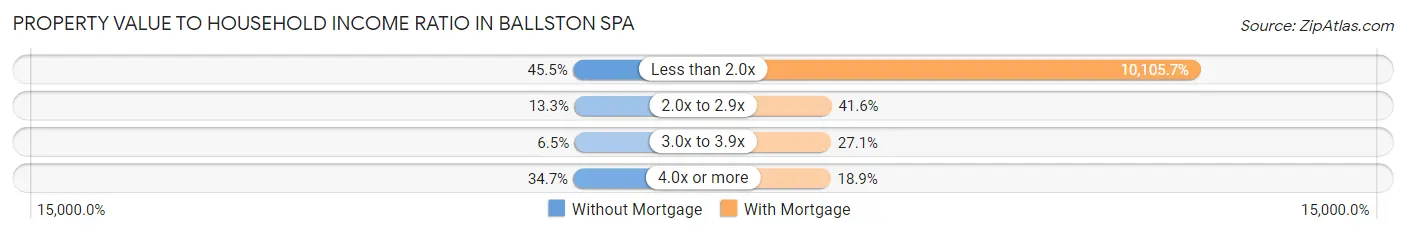
| Value-to-Income Ratio | Without Mortgage | With Mortgage |
| Less than 2.0x | 140 (45.5%) | 113,487 (10,105.7%) |
| 2.0x to 2.9x | 41 (13.3%) | 467 (41.6%) |
| 3.0x to 3.9x | 20 (6.5%) | 304 (27.1%) |
| 4.0x or more | 107 (34.7%) | 212 (18.9%) |
| Total | 308 (100.0%) | 1,123 (100.0%) |
Real Estate Taxes by Mortgage Status in Ballston Spa
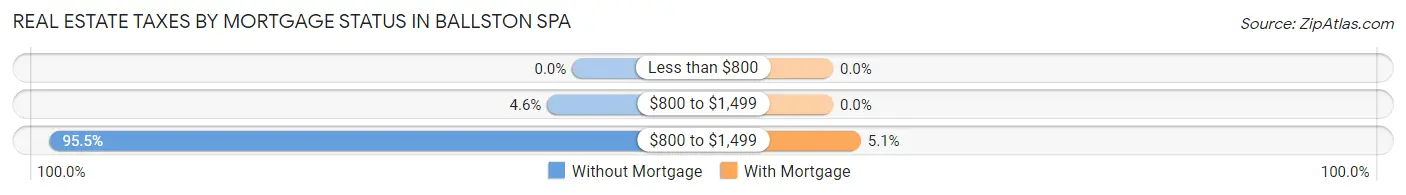
| Property Taxes | Without Mortgage | With Mortgage |
| Less than $800 | 0 (0.0%) | 0 (0.0%) |
| $800 to $1,499 | 14 (4.5%) | 0 (0.0%) |
| $800 to $1,499 | 294 (95.5%) | 57 (5.1%) |
| Total | 308 (100.0%) | 1,123 (100.0%) |
Health & Disability in Ballston Spa
Health Insurance Coverage by Age in Ballston Spa
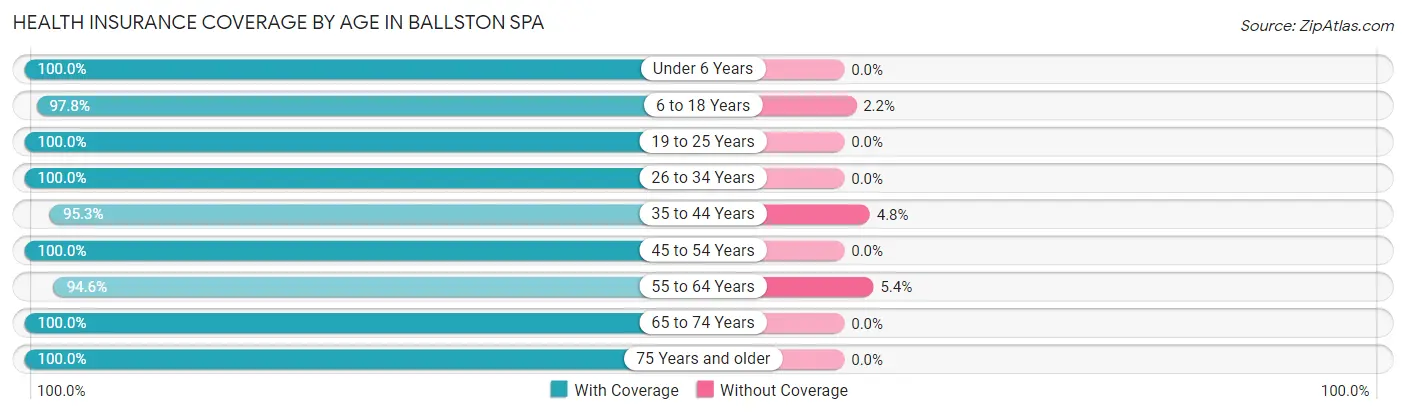
| Age Bracket | With Coverage | Without Coverage |
| Under 6 Years | 215 (100.0%) | 0 (0.0%) |
| 6 to 18 Years | 879 (97.8%) | 20 (2.2%) |
| 19 to 25 Years | 698 (100.0%) | 0 (0.0%) |
| 26 to 34 Years | 585 (100.0%) | 0 (0.0%) |
| 35 to 44 Years | 441 (95.3%) | 22 (4.8%) |
| 45 to 54 Years | 875 (100.0%) | 0 (0.0%) |
| 55 to 64 Years | 782 (94.6%) | 45 (5.4%) |
| 65 to 74 Years | 333 (100.0%) | 0 (0.0%) |
| 75 Years and older | 211 (100.0%) | 0 (0.0%) |
| Total | 5,019 (98.3%) | 87 (1.7%) |
Health Insurance Coverage by Citizenship Status in Ballston Spa
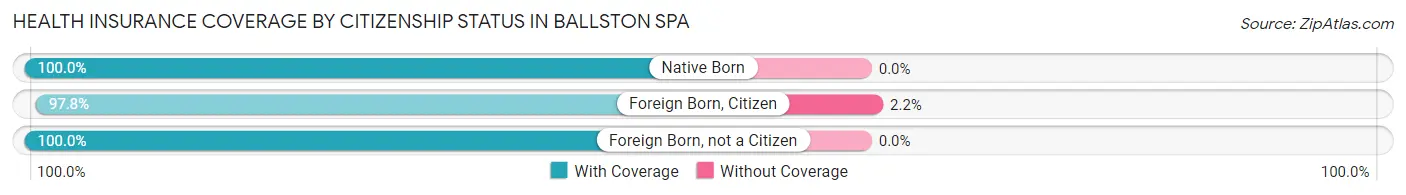
| Citizenship Status | With Coverage | Without Coverage |
| Native Born | 215 (100.0%) | 0 (0.0%) |
| Foreign Born, Citizen | 879 (97.8%) | 20 (2.2%) |
| Foreign Born, not a Citizen | 698 (100.0%) | 0 (0.0%) |
Health Insurance Coverage by Household Income in Ballston Spa
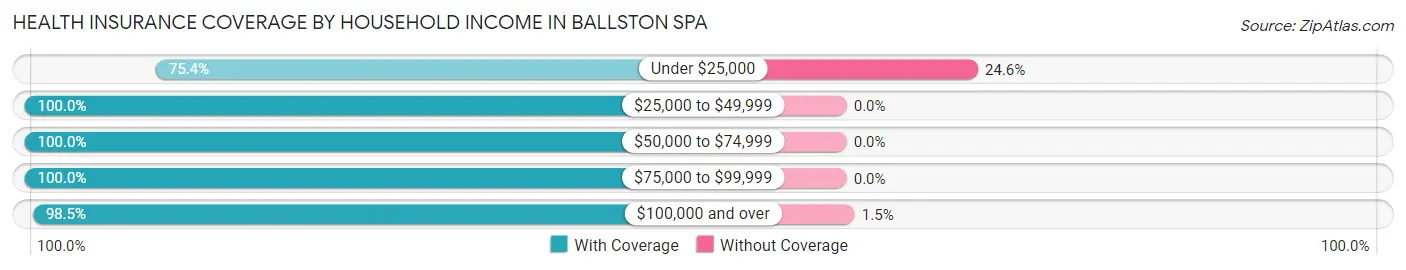
| Household Income | With Coverage | Without Coverage |
| Under $25,000 | 138 (75.4%) | 45 (24.6%) |
| $25,000 to $49,999 | 571 (100.0%) | 0 (0.0%) |
| $50,000 to $74,999 | 767 (100.0%) | 0 (0.0%) |
| $75,000 to $99,999 | 792 (100.0%) | 0 (0.0%) |
| $100,000 and over | 2,724 (98.5%) | 42 (1.5%) |
Public vs Private Health Insurance Coverage by Age in Ballston Spa
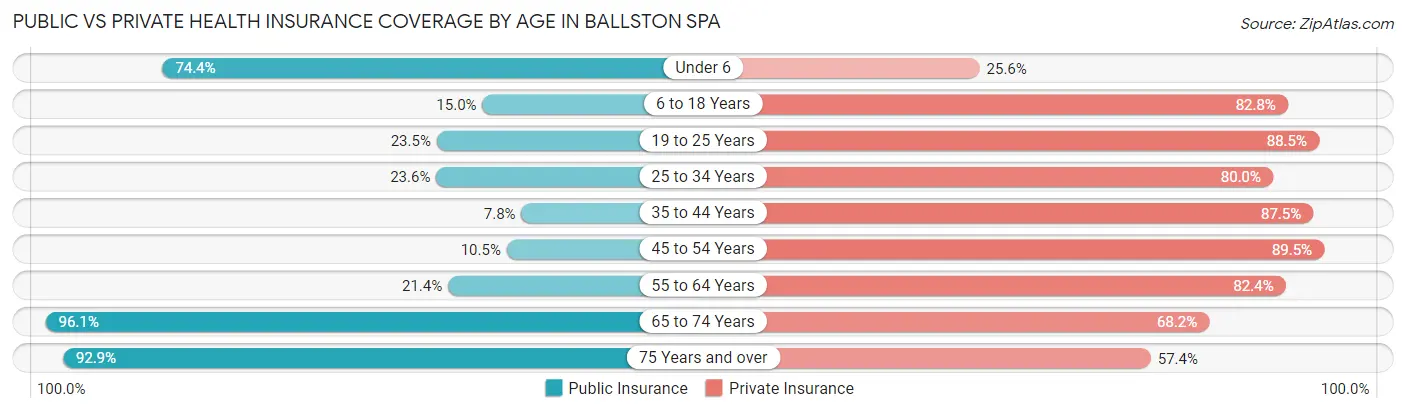
| Age Bracket | Public Insurance | Private Insurance |
| Under 6 | 160 (74.4%) | 55 (25.6%) |
| 6 to 18 Years | 135 (15.0%) | 744 (82.8%) |
| 19 to 25 Years | 164 (23.5%) | 618 (88.5%) |
| 25 to 34 Years | 138 (23.6%) | 468 (80.0%) |
| 35 to 44 Years | 36 (7.8%) | 405 (87.5%) |
| 45 to 54 Years | 92 (10.5%) | 783 (89.5%) |
| 55 to 64 Years | 177 (21.4%) | 681 (82.4%) |
| 65 to 74 Years | 320 (96.1%) | 227 (68.2%) |
| 75 Years and over | 196 (92.9%) | 121 (57.4%) |
| Total | 1,418 (27.8%) | 4,102 (80.3%) |
Disability Status by Sex by Age in Ballston Spa
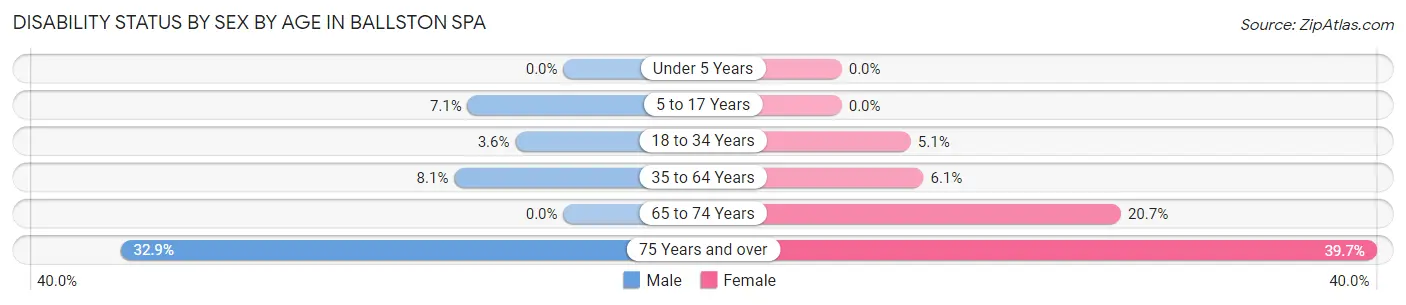
| Age Bracket | Male | Female |
| Under 5 Years | 0 (0.0%) | 0 (0.0%) |
| 5 to 17 Years | 32 (7.1%) | 0 (0.0%) |
| 18 to 34 Years | 18 (3.6%) | 40 (5.1%) |
| 35 to 64 Years | 86 (8.1%) | 67 (6.1%) |
| 65 to 74 Years | 0 (0.0%) | 40 (20.7%) |
| 75 Years and over | 47 (32.9%) | 27 (39.7%) |
Disability Class by Sex by Age in Ballston Spa
Disability Class: Hearing Difficulty
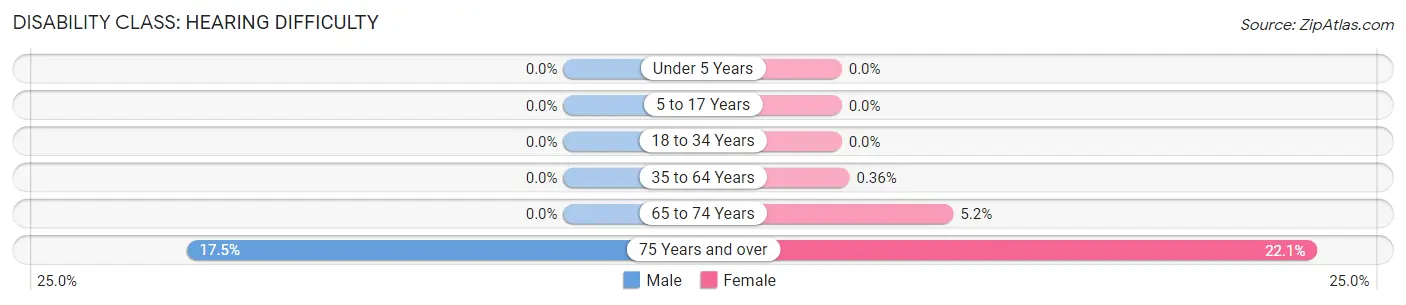
| Age Bracket | Male | Female |
| Under 5 Years | 0 (0.0%) | 0 (0.0%) |
| 5 to 17 Years | 0 (0.0%) | 0 (0.0%) |
| 18 to 34 Years | 0 (0.0%) | 0 (0.0%) |
| 35 to 64 Years | 0 (0.0%) | 4 (0.4%) |
| 65 to 74 Years | 0 (0.0%) | 10 (5.2%) |
| 75 Years and over | 25 (17.5%) | 15 (22.1%) |
Disability Class: Vision Difficulty
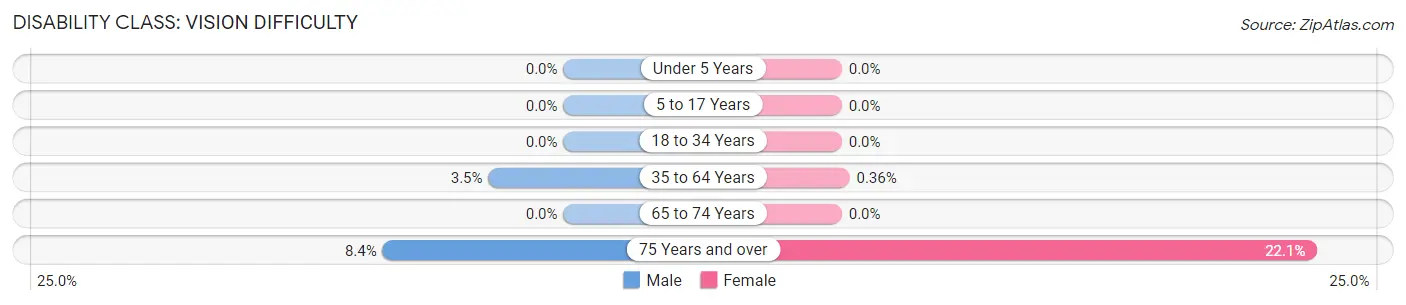
| Age Bracket | Male | Female |
| Under 5 Years | 0 (0.0%) | 0 (0.0%) |
| 5 to 17 Years | 0 (0.0%) | 0 (0.0%) |
| 18 to 34 Years | 0 (0.0%) | 0 (0.0%) |
| 35 to 64 Years | 37 (3.5%) | 4 (0.4%) |
| 65 to 74 Years | 0 (0.0%) | 0 (0.0%) |
| 75 Years and over | 12 (8.4%) | 15 (22.1%) |
Disability Class: Cognitive Difficulty
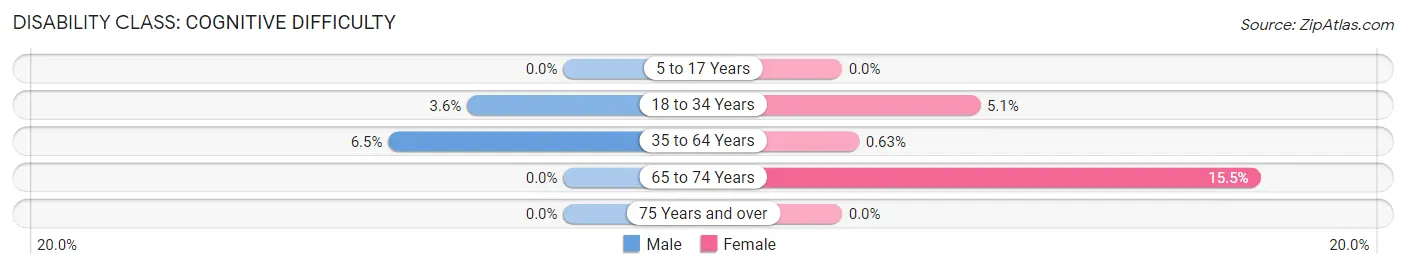
| Age Bracket | Male | Female |
| 5 to 17 Years | 0 (0.0%) | 0 (0.0%) |
| 18 to 34 Years | 18 (3.6%) | 40 (5.1%) |
| 35 to 64 Years | 69 (6.5%) | 7 (0.6%) |
| 65 to 74 Years | 0 (0.0%) | 30 (15.5%) |
| 75 Years and over | 0 (0.0%) | 0 (0.0%) |
Disability Class: Ambulatory Difficulty
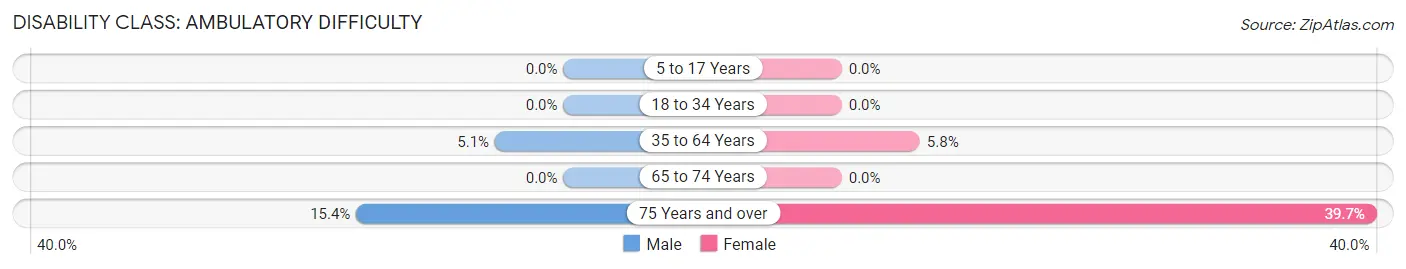
| Age Bracket | Male | Female |
| 5 to 17 Years | 0 (0.0%) | 0 (0.0%) |
| 18 to 34 Years | 0 (0.0%) | 0 (0.0%) |
| 35 to 64 Years | 54 (5.1%) | 64 (5.8%) |
| 65 to 74 Years | 0 (0.0%) | 0 (0.0%) |
| 75 Years and over | 22 (15.4%) | 27 (39.7%) |
Disability Class: Self-Care Difficulty
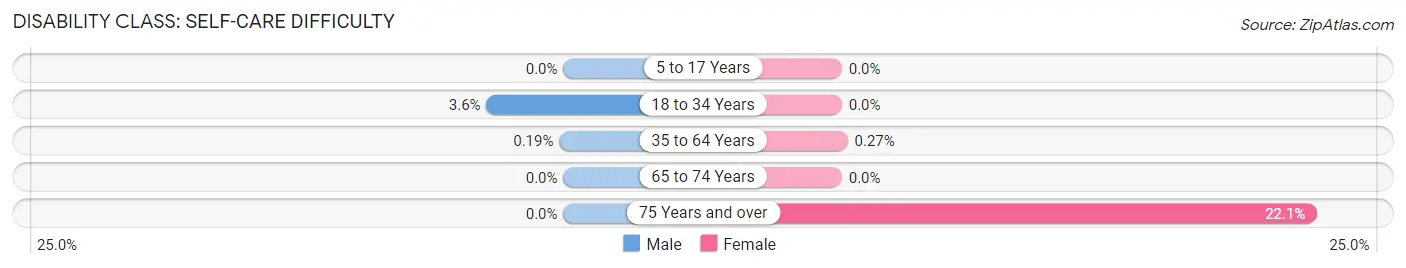
| Age Bracket | Male | Female |
| 5 to 17 Years | 0 (0.0%) | 0 (0.0%) |
| 18 to 34 Years | 18 (3.6%) | 0 (0.0%) |
| 35 to 64 Years | 2 (0.2%) | 3 (0.3%) |
| 65 to 74 Years | 0 (0.0%) | 0 (0.0%) |
| 75 Years and over | 0 (0.0%) | 15 (22.1%) |
Technology Access in Ballston Spa
Computing Device Access in Ballston Spa
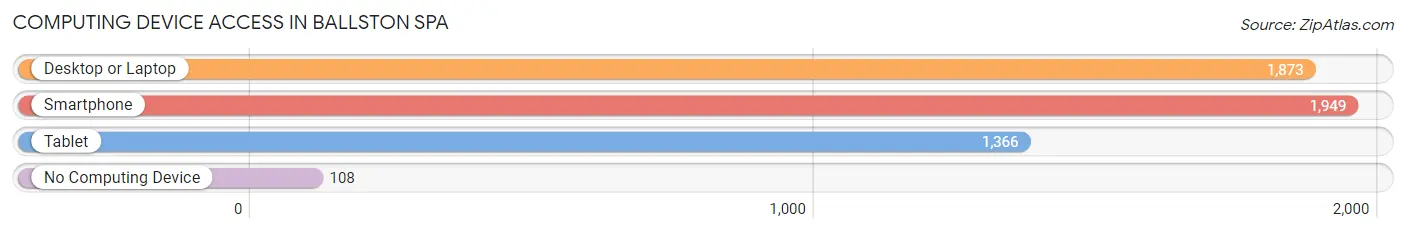
| Device Type | # Households | % Households |
| Desktop or Laptop | 1,873 | 85.8% |
| Smartphone | 1,949 | 89.2% |
| Tablet | 1,366 | 62.5% |
| No Computing Device | 108 | 5.0% |
| Total | 2,184 | 100.0% |
Internet Access in Ballston Spa
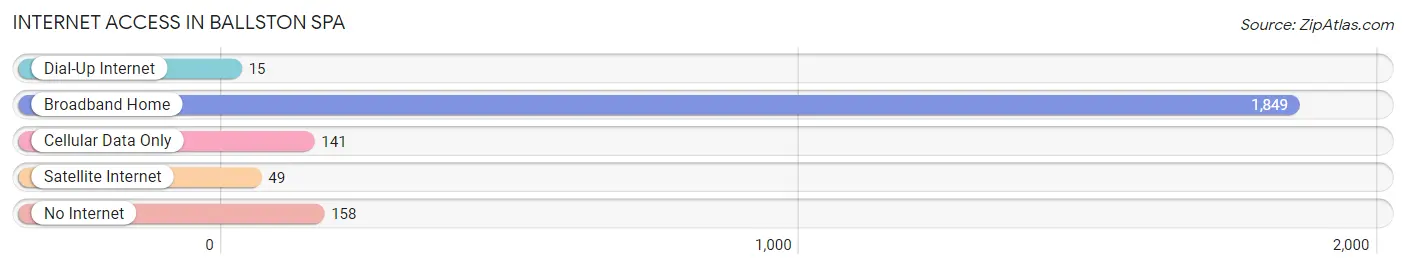
| Internet Type | # Households | % Households |
| Dial-Up Internet | 15 | 0.7% |
| Broadband Home | 1,849 | 84.7% |
| Cellular Data Only | 141 | 6.5% |
| Satellite Internet | 49 | 2.2% |
| No Internet | 158 | 7.2% |
| Total | 2,184 | 100.0% |
Ballston Spa Summary
Ballston Spa is a village located in Saratoga County, New York, United States. It is part of the town of Ballston and is located approximately 30 miles north of Albany, the state capital. The village is named after Rev. Eliphalet Ball, an early settler. The population was 5,556 at the 2010 census.
History
The area that is now Ballston Spa was originally inhabited by the Mohawk people. The first European settlers arrived in the area in 1771. The village was founded in 1771 by Rev. Eliphalet Ball, a Congregational minister from Connecticut. He purchased a large tract of land from the Mohawk people and established a settlement. The village was originally known as Ball's Town.
In 1787, the village was incorporated as the Village of Ballston. The village was an important stop on the stagecoach route between Albany and Saratoga Springs. In 1802, the village was renamed Ballston Spa.
The village was an important center of industry in the 19th century. It was home to several mills, including a paper mill, a grist mill, and a saw mill. The village was also home to several mineral springs, which were believed to have healing properties. The mineral springs attracted visitors from all over the country, and the village became a popular resort destination.
Geography
Ballston Spa is located at 42°58'N 73°53'W (42.967, -73.883). According to the United States Census Bureau, the village has a total area of 2.2 square miles (5.7 km2), all of it land.
The village is located in the town of Ballston, which is located in the eastern part of Saratoga County. The village is located approximately 30 miles north of Albany, the state capital.
Economy
The economy of Ballston Spa is largely based on tourism and retail. The village is home to several restaurants, shops, and other businesses. The village is also home to several historic sites, including the Saratoga County Historical Society and the National Bottle Museum.
The village is also home to several manufacturing companies, including Ballston Spa Manufacturing, which produces plastic products, and Ballston Spa Industries, which produces metal products.
Demographics
As of the census of 2010, there were 5,556 people, 2,093 households, and 1,372 families residing in the village. The population density was 2,521.2 people per square mile (973.2/km2). There were 2,231 housing units at an average density of 1,006.2 per square mile (388.7/km2). The racial makeup of the village was 94.2% White, 1.7% African American, 0.2% Native American, 1.2% Asian, 0.1% Pacific Islander, 0.9% from other races, and 1.7% from two or more races. Hispanic or Latino of any race were 3.2% of the population.
There were 2,093 households, out of which 33.2% had children under the age of 18 living with them, 48.2% were married couples living together, 11.7% had a female householder with no husband present, and 35.2% were non-families. 29.2% of all households were made up of individuals, and 11.7% had someone living alone who was 65 years of age or older. The average household size was 2.50 and the average family size was 3.09.
In the village, the population was spread out, with 25.2% under the age of 18, 6.7% from 18 to 24, 28.2% from 25 to 44, 24.2% from 45 to 64, and 15.7% who were 65 years of age or older. The median age was 38 years. For every 100 females, there were 91.2 males. For every 100 females age 18 and over, there were 87.2 males.
The median income for a household in the village was $50,972, and the median income for a family was $60,917. Males had a median income of $41,919 versus $30,917 for females. The per capita income for the village was $24,945. About 4.2% of families and 6.2% of the population were below the poverty line, including 8.2% of those under age 18 and 4.2% of those age 65 or over.
Common Questions
What is the Total Population of Ballston Spa?
Total Population of Ballston Spa is 5,288.
What is the Total Male Population of Ballston Spa?
Total Male Population of Ballston Spa is 2,507.
What is the Total Female Population of Ballston Spa?
Total Female Population of Ballston Spa is 2,781.
What is the Ratio of Males per 100 Females in Ballston Spa?
There are 90.15 Males per 100 Females in Ballston Spa.
What is the Ratio of Females per 100 Males in Ballston Spa?
There are 110.93 Females per 100 Males in Ballston Spa.
What is the Median Population Age in Ballston Spa?
Median Population Age in Ballston Spa is 39.9 Years.
What is the Average Family Size in Ballston Spa
Average Family Size in Ballston Spa is 3.1 People.
What is the Average Household Size in Ballston Spa
Average Household Size in Ballston Spa is 2.3 People.
What is Per Capita Income in Ballston Spa?
Per Capita income in Ballston Spa is $43,565.
What is the Median Family Income in Ballston Spa?
Median Family Income in Ballston Spa is $121,667.
What is the Median Household income in Ballston Spa?
Median Household Income in Ballston Spa is $78,136.
What is Income or Wage Gap in Ballston Spa?
Income or Wage Gap in Ballston Spa is 25.7%.
Women in Ballston Spa earn 74.3 cents for every dollar earned by a man.
What is Inequality or Gini Index in Ballston Spa?
Inequality or Gini Index in Ballston Spa is 0.38.
How Large is the Labor Force in Ballston Spa?
There are 3,146 People in the Labor Forcein in Ballston Spa.
What is the Percentage of People in the Labor Force in Ballston Spa?
73.6% of People are in the Labor Force in Ballston Spa.
What is the Unemployment Rate in Ballston Spa?
Unemployment Rate in Ballston Spa is 2.5%.