Bainbridge, NY
Bainbridge Map
Bainbridge Overview
1,125
TOTAL POPULATION
580
MALE POPULATION
545
FEMALE POPULATION
106.42
MALES / 100 FEMALES
93.97
FEMALES / 100 MALES
37.0
MEDIAN AGE
3.0
AVG FAMILY SIZE
2.2
AVG HOUSEHOLD SIZE
$29,624
PER CAPITA INCOME
$80,000
AVG FAMILY INCOME
$47,368
AVG HOUSEHOLD INCOME
18.9%
WAGE / INCOME GAP [ % ]
81.1¢/ $1
WAGE / INCOME GAP [ $ ]
0.43
INEQUALITY / GINI INDEX
555
LABOR FORCE [ PEOPLE ]
62.2%
PERCENT IN LABOR FORCE
7.4%
UNEMPLOYMENT RATE
Bainbridge Zip Codes
Bainbridge Area Codes
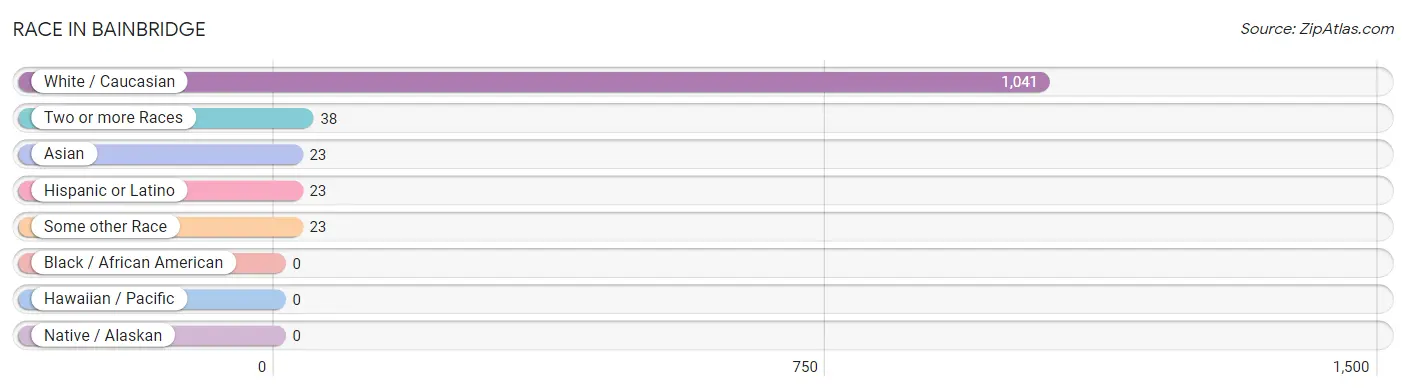
Race in Bainbridge
The most populous races in Bainbridge are White / Caucasian (1,041 | 92.5%), Two or more Races (38 | 3.4%), and Asian (23 | 2.0%).
| Race | # Population | % Population |
| Asian | 23 | 2.0% |
| Black / African American | 0 | 0.0% |
| Hawaiian / Pacific | 0 | 0.0% |
| Hispanic or Latino | 23 | 2.0% |
| Native / Alaskan | 0 | 0.0% |
| White / Caucasian | 1,041 | 92.5% |
| Two or more Races | 38 | 3.4% |
| Some other Race | 23 | 2.0% |
| Total | 1,125 | 100.0% |
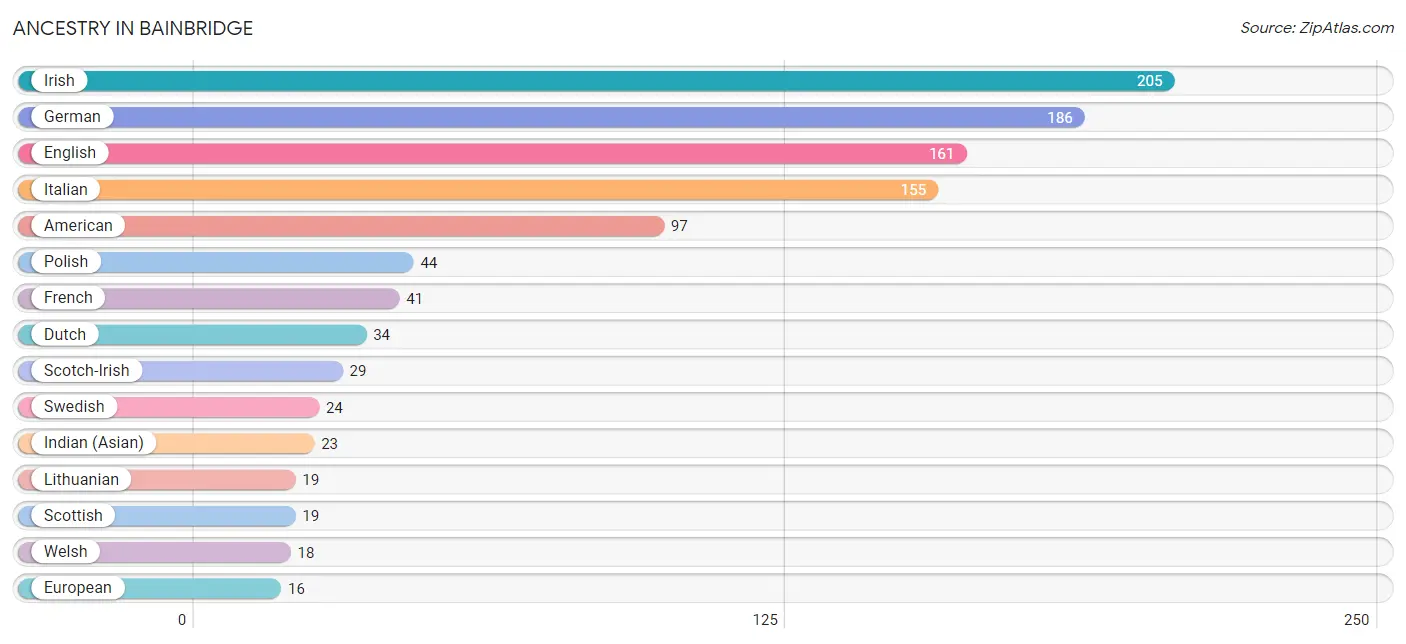
Ancestry in Bainbridge
The most populous ancestries reported in Bainbridge are Irish (205 | 18.2%), German (186 | 16.5%), English (161 | 14.3%), Italian (155 | 13.8%), and American (97 | 8.6%), together accounting for 71.5% of all Bainbridge residents.
| Ancestry | # Population | % Population |
| Albanian | 2 | 0.2% |
| American | 97 | 8.6% |
| Austrian | 2 | 0.2% |
| Blackfeet | 8 | 0.7% |
| British | 5 | 0.4% |
| Cherokee | 8 | 0.7% |
| Dominican | 9 | 0.8% |
| Dutch | 34 | 3.0% |
| English | 161 | 14.3% |
| European | 16 | 1.4% |
| French | 41 | 3.6% |
| German | 186 | 16.5% |
| Indian (Asian) | 23 | 2.0% |
| Irish | 205 | 18.2% |
| Iroquois | 2 | 0.2% |
| Italian | 155 | 13.8% |
| Lithuanian | 19 | 1.7% |
| Maltese | 3 | 0.3% |
| Mexican | 8 | 0.7% |
| Northern European | 4 | 0.4% |
| Norwegian | 3 | 0.3% |
| Polish | 44 | 3.9% |
| Puerto Rican | 6 | 0.5% |
| Russian | 3 | 0.3% |
| Scotch-Irish | 29 | 2.6% |
| Scottish | 19 | 1.7% |
| Slavic | 7 | 0.6% |
| Slovak | 3 | 0.3% |
| Swedish | 24 | 2.1% |
| Swiss | 4 | 0.4% |
| Ukrainian | 3 | 0.3% |
| Welsh | 18 | 1.6% | View All 32 Rows |
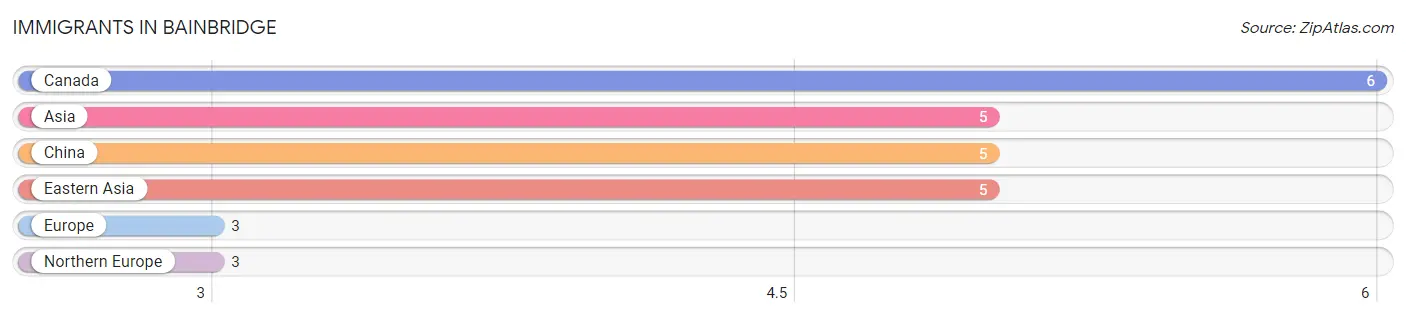
Immigrants in Bainbridge
The most numerous immigrant groups reported in Bainbridge came from Canada (6 | 0.5%), Asia (5 | 0.4%), China (5 | 0.4%), Eastern Asia (5 | 0.4%), and Europe (3 | 0.3%), together accounting for 2.1% of all Bainbridge residents.
| Immigration Origin | # Population | % Population |
| Asia | 5 | 0.4% |
| Canada | 6 | 0.5% |
| China | 5 | 0.4% |
| Eastern Asia | 5 | 0.4% |
| Europe | 3 | 0.3% |
| Northern Europe | 3 | 0.3% | View All 6 Rows |
Sex and Age in Bainbridge
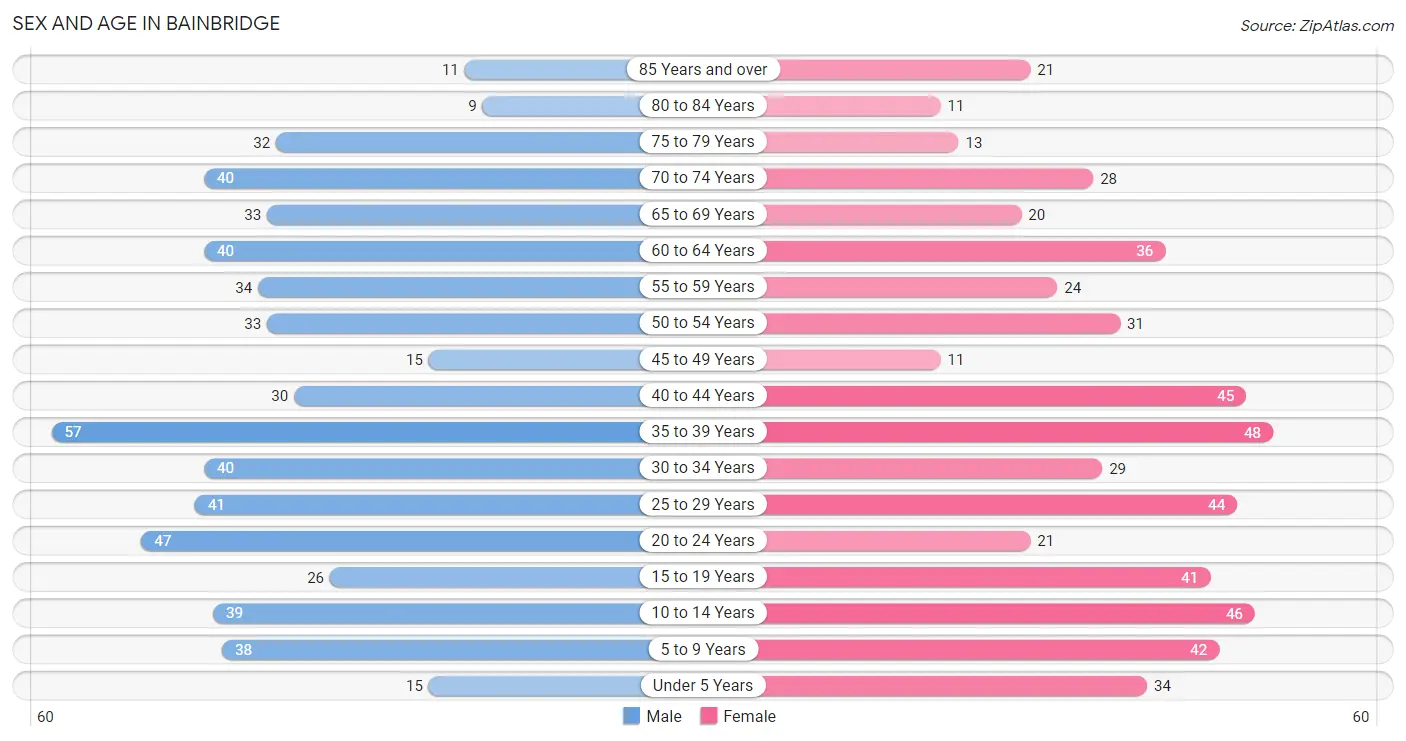
Sex and Age in Bainbridge
The most populous age groups in Bainbridge are 35 to 39 Years (57 | 9.8%) for men and 35 to 39 Years (48 | 8.8%) for women.
| Age Bracket | Male | Female |
| Under 5 Years | 15 (2.6%) | 34 (6.2%) |
| 5 to 9 Years | 38 (6.6%) | 42 (7.7%) |
| 10 to 14 Years | 39 (6.7%) | 46 (8.4%) |
| 15 to 19 Years | 26 (4.5%) | 41 (7.5%) |
| 20 to 24 Years | 47 (8.1%) | 21 (3.8%) |
| 25 to 29 Years | 41 (7.1%) | 44 (8.1%) |
| 30 to 34 Years | 40 (6.9%) | 29 (5.3%) |
| 35 to 39 Years | 57 (9.8%) | 48 (8.8%) |
| 40 to 44 Years | 30 (5.2%) | 45 (8.3%) |
| 45 to 49 Years | 15 (2.6%) | 11 (2.0%) |
| 50 to 54 Years | 33 (5.7%) | 31 (5.7%) |
| 55 to 59 Years | 34 (5.9%) | 24 (4.4%) |
| 60 to 64 Years | 40 (6.9%) | 36 (6.6%) |
| 65 to 69 Years | 33 (5.7%) | 20 (3.7%) |
| 70 to 74 Years | 40 (6.9%) | 28 (5.1%) |
| 75 to 79 Years | 32 (5.5%) | 13 (2.4%) |
| 80 to 84 Years | 9 (1.5%) | 11 (2.0%) |
| 85 Years and over | 11 (1.9%) | 21 (3.8%) |
| Total | 580 (100.0%) | 545 (100.0%) |
Families and Households in Bainbridge
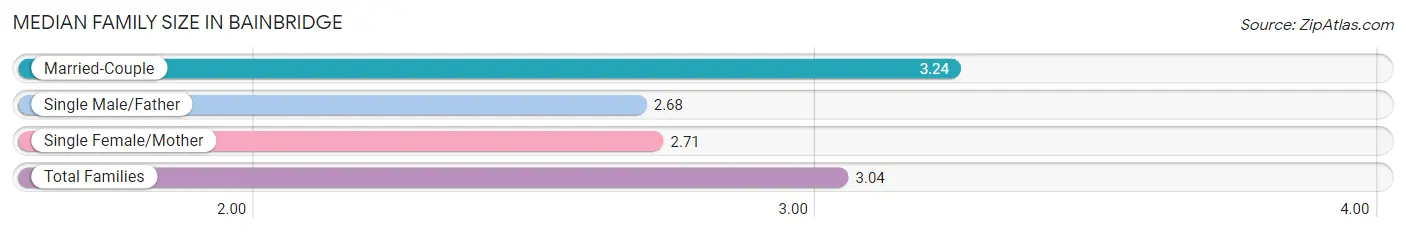
Median Family Size in Bainbridge
The median family size in Bainbridge is 3.04 persons per family, with married-couple families (157 | 61.8%) accounting for the largest median family size of 3.24 persons per family. On the other hand, single male/father families (25 | 9.8%) represent the smallest median family size with 2.68 persons per family.
| Family Type | # Families | Family Size |
| Married-Couple | 157 (61.8%) | 3.24 |
| Single Male/Father | 25 (9.8%) | 2.68 |
| Single Female/Mother | 72 (28.3%) | 2.71 |
| Total Families | 254 (100.0%) | 3.04 |
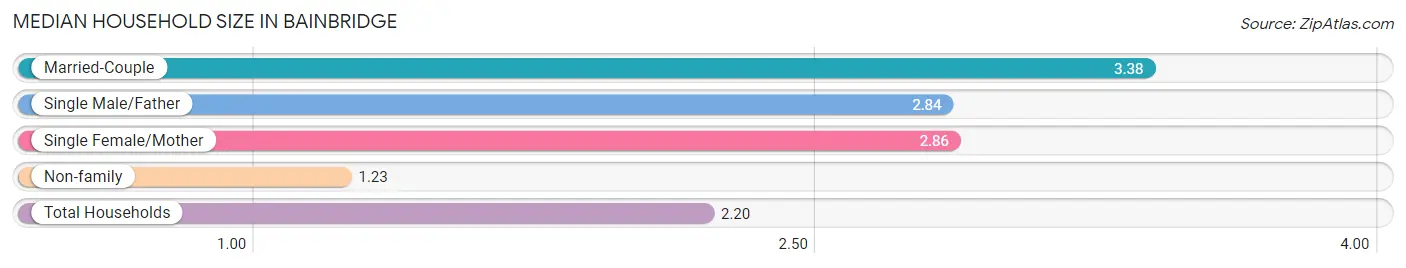
Median Household Size in Bainbridge
The median household size in Bainbridge is 2.20 persons per household, with married-couple households (157 | 30.7%) accounting for the largest median household size of 3.38 persons per household. non-family households (258 | 50.4%) represent the smallest median household size with 1.23 persons per household.
| Household Type | # Households | Household Size |
| Married-Couple | 157 (30.7%) | 3.38 |
| Single Male/Father | 25 (4.9%) | 2.84 |
| Single Female/Mother | 72 (14.1%) | 2.86 |
| Non-family | 258 (50.4%) | 1.23 |
| Total Households | 512 (100.0%) | 2.20 |
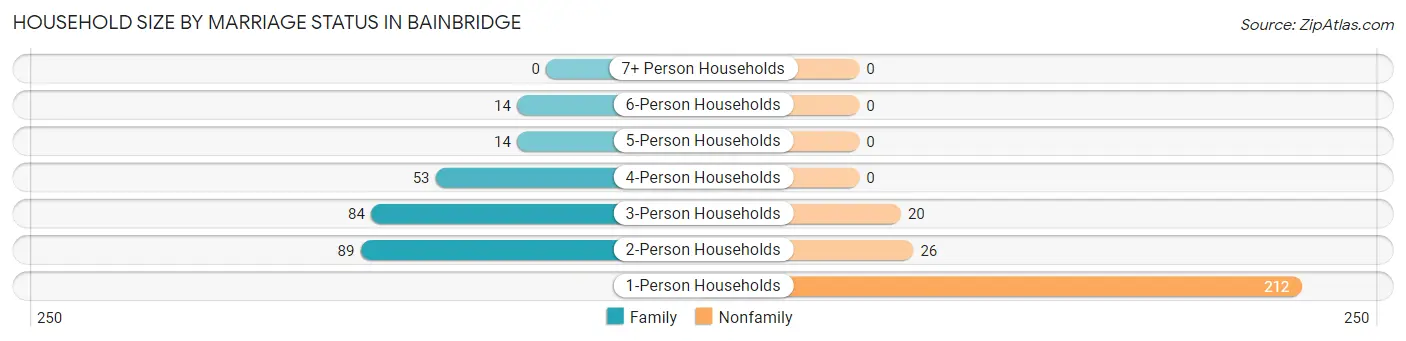
Household Size by Marriage Status in Bainbridge
Out of a total of 512 households in Bainbridge, 254 (49.6%) are family households, while 258 (50.4%) are nonfamily households. The most numerous type of family households are 2-person households, comprising 89, and the most common type of nonfamily households are 1-person households, comprising 212.
| Household Size | Family Households | Nonfamily Households |
| 1-Person Households | - | 212 (41.4%) |
| 2-Person Households | 89 (17.4%) | 26 (5.1%) |
| 3-Person Households | 84 (16.4%) | 20 (3.9%) |
| 4-Person Households | 53 (10.3%) | 0 (0.0%) |
| 5-Person Households | 14 (2.7%) | 0 (0.0%) |
| 6-Person Households | 14 (2.7%) | 0 (0.0%) |
| 7+ Person Households | 0 (0.0%) | 0 (0.0%) |
| Total | 254 (49.6%) | 258 (50.4%) |
Female Fertility in Bainbridge
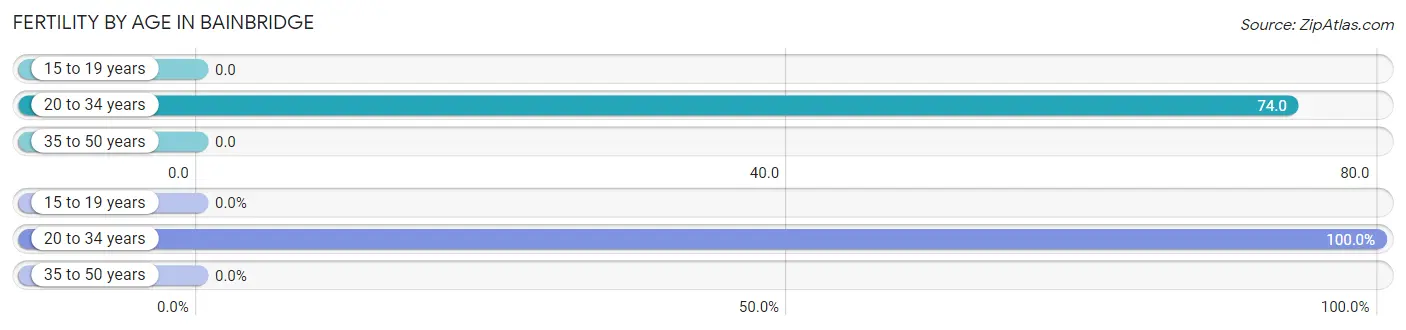
Fertility by Age in Bainbridge
Average fertility rate in Bainbridge is 29.0 births per 1,000 women. Women in the age bracket of 20 to 34 years have the highest fertility rate with 74.0 births per 1,000 women. Women in the age bracket of 20 to 34 years acount for 100.0% of all women with births.
| Age Bracket | Women with Births | Births / 1,000 Women |
| 15 to 19 years | 0 (0.0%) | 0.0 |
| 20 to 34 years | 7 (100.0%) | 74.0 |
| 35 to 50 years | 0 (0.0%) | 0.0 |
| Total | 7 (100.0%) | 29.0 |
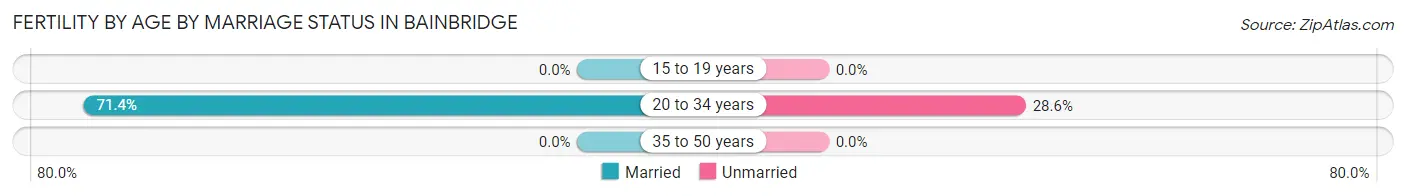
Fertility by Age by Marriage Status in Bainbridge
71.4% of women with births (7) in Bainbridge are married. The highest percentage of unmarried women with births falls into 20 to 34 years age bracket with 28.6% of them unmarried at the time of birth, while the lowest percentage of unmarried women with births belong to 20 to 34 years age bracket with 28.6% of them unmarried.
| Age Bracket | Married | Unmarried |
| 15 to 19 years | 0 (0.0%) | 0 (0.0%) |
| 20 to 34 years | 5 (71.4%) | 2 (28.6%) |
| 35 to 50 years | 0 (0.0%) | 0 (0.0%) |
| Total | 5 (71.4%) | 2 (28.6%) |
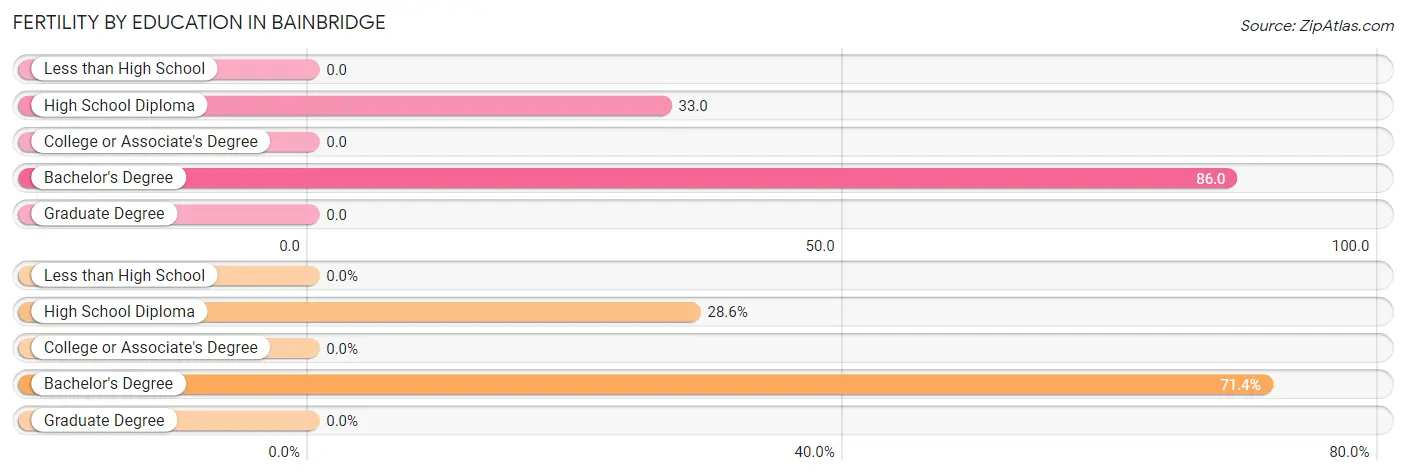
Fertility by Education in Bainbridge
| Educational Attainment | Women with Births | Births / 1,000 Women |
| Less than High School | 0 (0.0%) | 0.0 |
| High School Diploma | 2 (28.6%) | 33.0 |
| College or Associate's Degree | 0 (0.0%) | 0.0 |
| Bachelor's Degree | 5 (71.4%) | 86.0 |
| Graduate Degree | 0 (0.0%) | 0.0 |
| Total | 7 (100.0%) | 29.0 |
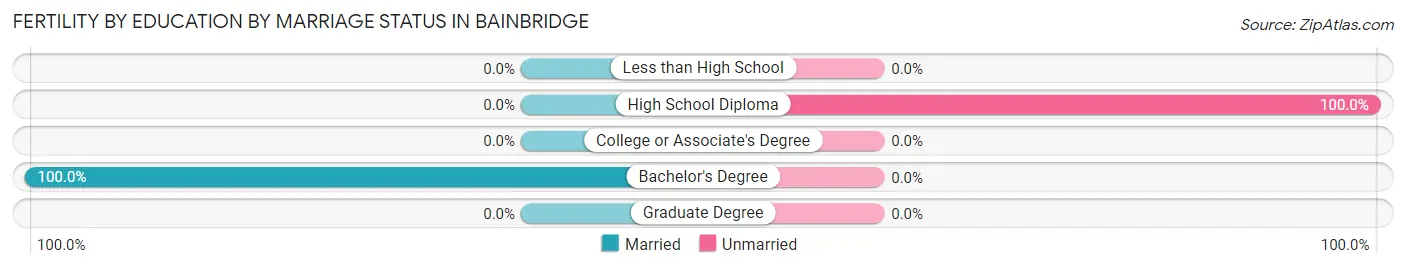
Fertility by Education by Marriage Status in Bainbridge
28.6% of women with births in Bainbridge are unmarried. Women with the educational attainment of bachelor's degree are most likely to be married with 100.0% of them married at childbirth, while women with the educational attainment of high school diploma are least likely to be married with 100.0% of them unmarried at childbirth.
| Educational Attainment | Married | Unmarried |
| Less than High School | 0 (0.0%) | 0 (0.0%) |
| High School Diploma | 0 (0.0%) | 2 (100.0%) |
| College or Associate's Degree | 0 (0.0%) | 0 (0.0%) |
| Bachelor's Degree | 5 (100.0%) | 0 (0.0%) |
| Graduate Degree | 0 (0.0%) | 0 (0.0%) |
| Total | 5 (71.4%) | 2 (28.6%) |
Income in Bainbridge
Income Overview in Bainbridge
Per Capita Income in Bainbridge is $29,624, while median incomes of families and households are $80,000 and $47,368 respectively.
| Characteristic | Number | Measure |
| Per Capita Income | 1,125 | $29,624 |
| Median Family Income | 254 | $80,000 |
| Mean Family Income | 254 | $85,684 |
| Median Household Income | 512 | $47,368 |
| Mean Household Income | 512 | $63,376 |
| Income Deficit | 254 | $0 |
| Wage / Income Gap (%) | 1,125 | 18.86% |
| Wage / Income Gap ($) | 1,125 | 81.14¢ per $1 |
| Gini / Inequality Index | 1,125 | 0.43 |
Earnings by Sex in Bainbridge
Average Earnings in Bainbridge are $41,193, $42,500 for men and $34,485 for women, a difference of 18.9%.
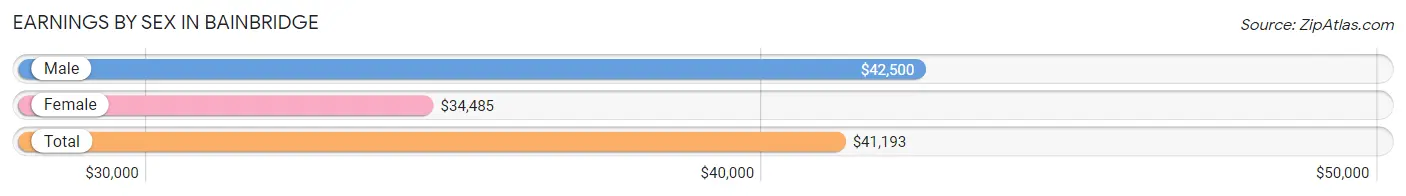
| Sex | Number | Average Earnings |
| Male | 304 (52.7%) | $42,500 |
| Female | 273 (47.3%) | $34,485 |
| Total | 577 (100.0%) | $41,193 |
Earnings by Sex by Income Bracket in Bainbridge
The most common earnings brackets in Bainbridge are $50,000 to $54,999 for men (40 | 13.2%) and $45,000 to $49,999 for women (37 | 13.6%).
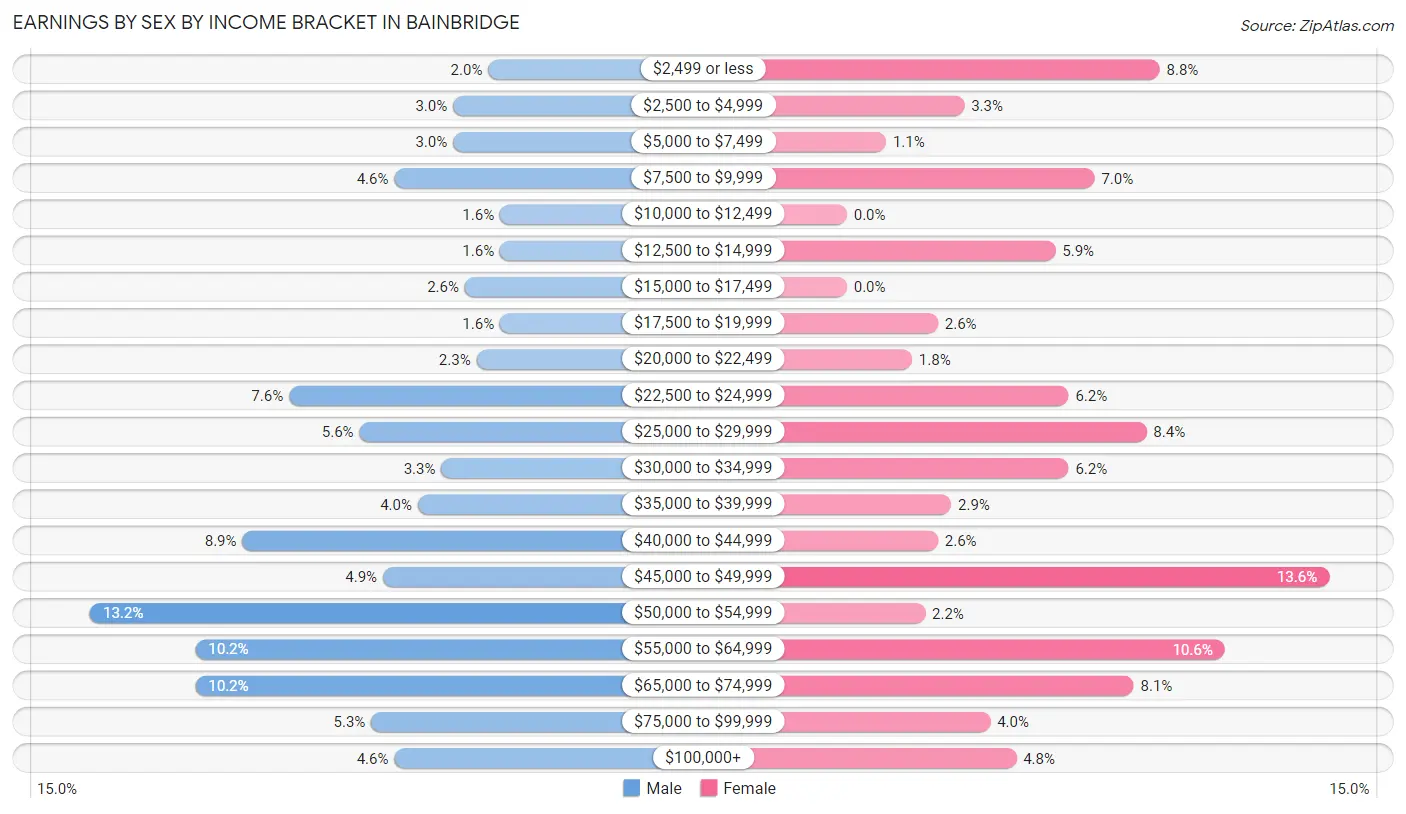
| Income | Male | Female |
| $2,499 or less | 6 (2.0%) | 24 (8.8%) |
| $2,500 to $4,999 | 9 (3.0%) | 9 (3.3%) |
| $5,000 to $7,499 | 9 (3.0%) | 3 (1.1%) |
| $7,500 to $9,999 | 14 (4.6%) | 19 (7.0%) |
| $10,000 to $12,499 | 5 (1.6%) | 0 (0.0%) |
| $12,500 to $14,999 | 5 (1.6%) | 16 (5.9%) |
| $15,000 to $17,499 | 8 (2.6%) | 0 (0.0%) |
| $17,500 to $19,999 | 5 (1.6%) | 7 (2.6%) |
| $20,000 to $22,499 | 7 (2.3%) | 5 (1.8%) |
| $22,500 to $24,999 | 23 (7.6%) | 17 (6.2%) |
| $25,000 to $29,999 | 17 (5.6%) | 23 (8.4%) |
| $30,000 to $34,999 | 10 (3.3%) | 17 (6.2%) |
| $35,000 to $39,999 | 12 (4.0%) | 8 (2.9%) |
| $40,000 to $44,999 | 27 (8.9%) | 7 (2.6%) |
| $45,000 to $49,999 | 15 (4.9%) | 37 (13.6%) |
| $50,000 to $54,999 | 40 (13.2%) | 6 (2.2%) |
| $55,000 to $64,999 | 31 (10.2%) | 29 (10.6%) |
| $65,000 to $74,999 | 31 (10.2%) | 22 (8.1%) |
| $75,000 to $99,999 | 16 (5.3%) | 11 (4.0%) |
| $100,000+ | 14 (4.6%) | 13 (4.8%) |
| Total | 304 (100.0%) | 273 (100.0%) |
Earnings by Sex by Educational Attainment in Bainbridge
Average earnings in Bainbridge are $41,648 for men and $44,821 for women, a difference of 7.1%. Men with an educational attainment of bachelor's degree enjoy the highest average annual earnings of $65,268, while those with less than high school education earn the least with $22,885. Women with an educational attainment of graduate degree earn the most with the average annual earnings of $61,750, while those with high school diploma education have the smallest earnings of $28,523.
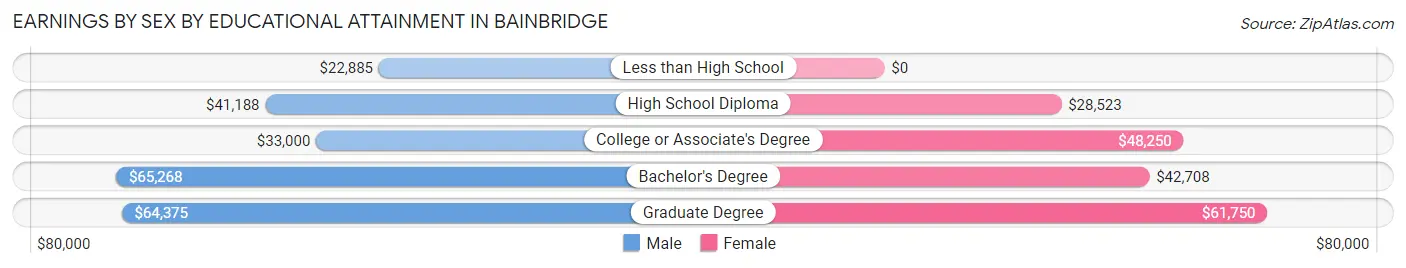
| Educational Attainment | Male Income | Female Income |
| Less than High School | $22,885 | $0 |
| High School Diploma | $41,188 | $28,523 |
| College or Associate's Degree | $33,000 | $48,250 |
| Bachelor's Degree | $65,268 | $42,708 |
| Graduate Degree | $64,375 | $61,750 |
| Total | $41,648 | $44,821 |
Family Income in Bainbridge
Family Income Brackets in Bainbridge
According to the Bainbridge family income data, there are 75 families falling into the $100,000 to $149,999 income range, which is the most common income bracket and makes up 29.5% of all families.
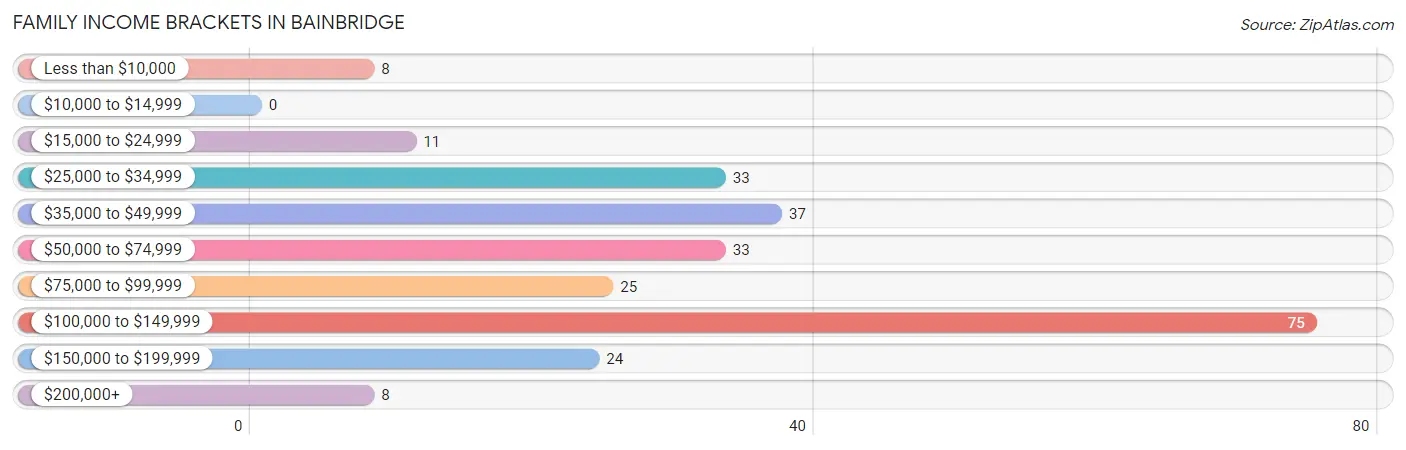
| Income Bracket | # Families | % Families |
| Less than $10,000 | 8 | 3.1% |
| $10,000 to $14,999 | 0 | 0.0% |
| $15,000 to $24,999 | 11 | 4.3% |
| $25,000 to $34,999 | 33 | 13.0% |
| $35,000 to $49,999 | 37 | 14.6% |
| $50,000 to $74,999 | 33 | 13.0% |
| $75,000 to $99,999 | 25 | 9.8% |
| $100,000 to $149,999 | 75 | 29.5% |
| $150,000 to $199,999 | 24 | 9.4% |
| $200,000+ | 8 | 3.1% |
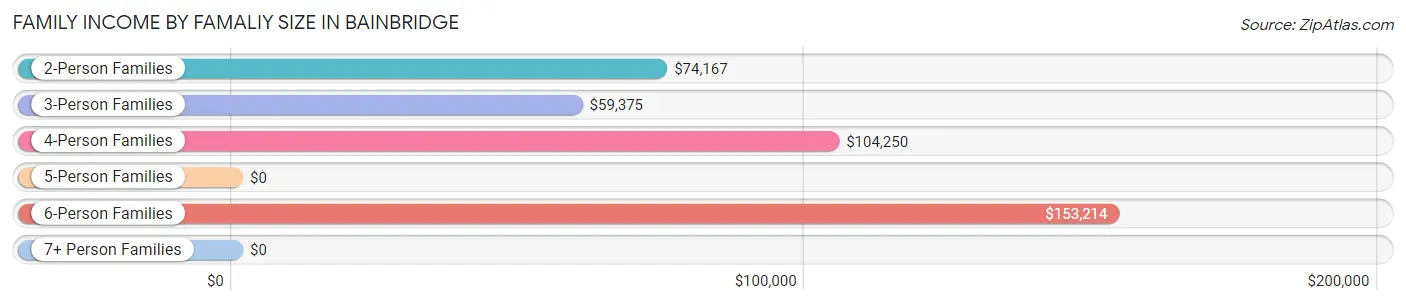
Family Income by Famaliy Size in Bainbridge
6-person families (14 | 5.5%) account for the highest median family income in Bainbridge with $153,214 per family, while 2-person families (104 | 40.9%) have the highest median income of $37,084 per family member.
| Income Bracket | # Families | Median Income |
| 2-Person Families | 104 (40.9%) | $74,167 |
| 3-Person Families | 75 (29.5%) | $59,375 |
| 4-Person Families | 59 (23.2%) | $104,250 |
| 5-Person Families | 2 (0.8%) | $0 |
| 6-Person Families | 14 (5.5%) | $153,214 |
| 7+ Person Families | 0 (0.0%) | $0 |
| Total | 254 (100.0%) | $80,000 |
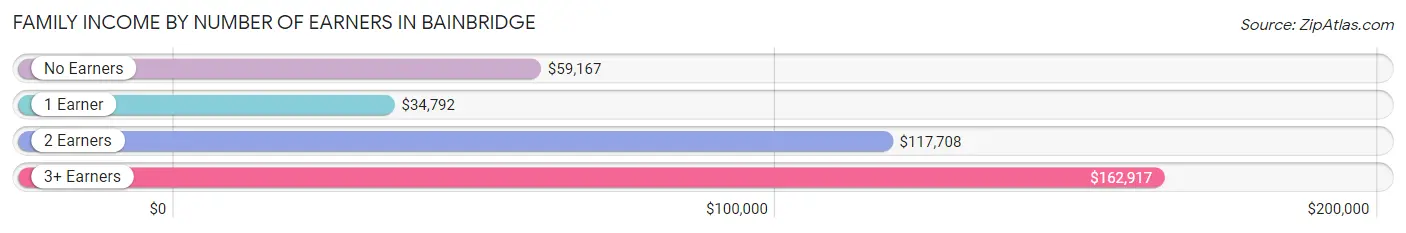
Family Income by Number of Earners in Bainbridge
The median family income in Bainbridge is $80,000, with families comprising 3+ earners (22) having the highest median family income of $162,917, while families with 1 earner (83) have the lowest median family income of $34,792, accounting for 8.7% and 32.7% of families, respectively.
| Number of Earners | # Families | Median Income |
| No Earners | 48 (18.9%) | $59,167 |
| 1 Earner | 83 (32.7%) | $34,792 |
| 2 Earners | 101 (39.8%) | $117,708 |
| 3+ Earners | 22 (8.7%) | $162,917 |
| Total | 254 (100.0%) | $80,000 |
Household Income in Bainbridge
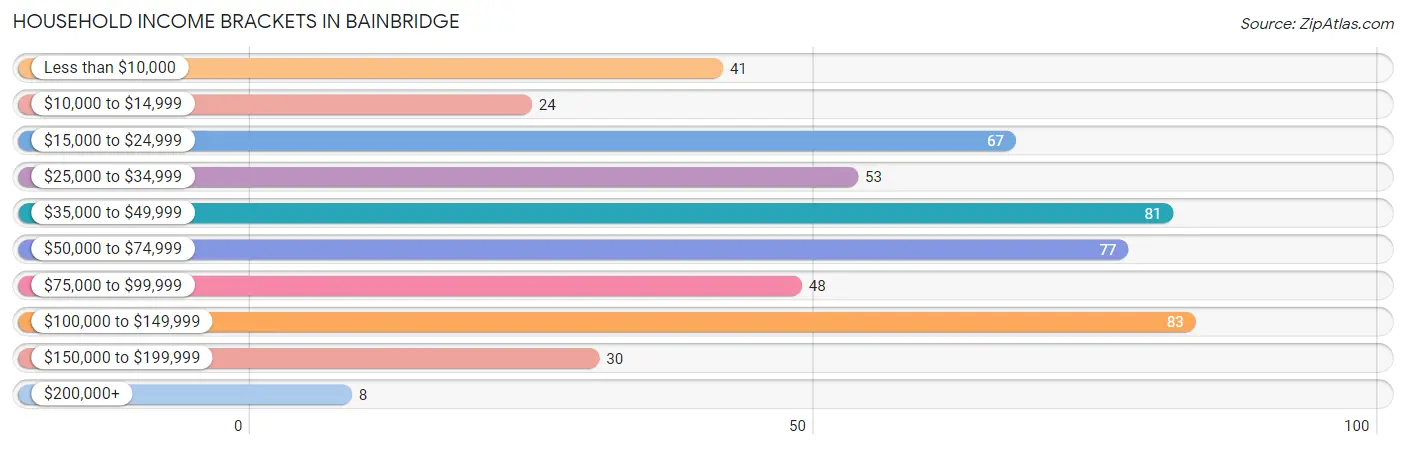
Household Income Brackets in Bainbridge
With 83 households falling in the category, the $100,000 to $149,999 income range is the most frequent in Bainbridge, accounting for 16.2% of all households. In contrast, only 8 households (1.6%) fall into the $200,000+ income bracket, making it the least populous group.
| Income Bracket | # Households | % Households |
| Less than $10,000 | 41 | 8.0% |
| $10,000 to $14,999 | 24 | 4.7% |
| $15,000 to $24,999 | 67 | 13.1% |
| $25,000 to $34,999 | 53 | 10.4% |
| $35,000 to $49,999 | 81 | 15.8% |
| $50,000 to $74,999 | 77 | 15.0% |
| $75,000 to $99,999 | 48 | 9.4% |
| $100,000 to $149,999 | 83 | 16.2% |
| $150,000 to $199,999 | 30 | 5.9% |
| $200,000+ | 8 | 1.6% |
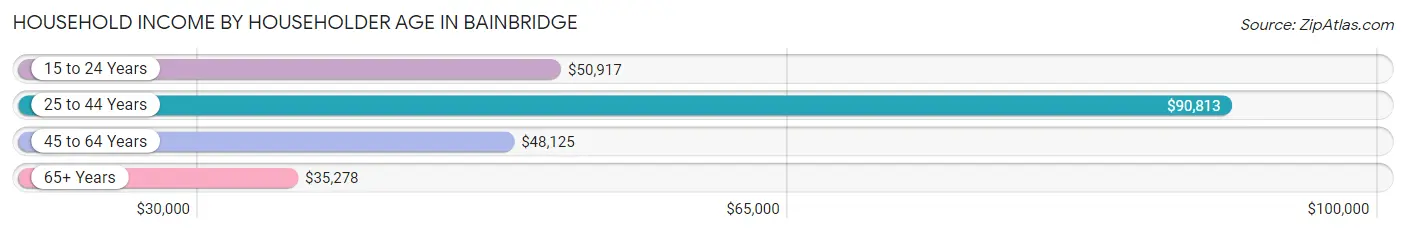
Household Income by Householder Age in Bainbridge
The median household income in Bainbridge is $47,368, with the highest median household income of $90,813 found in the 25 to 44 years age bracket for the primary householder. A total of 161 households (31.5%) fall into this category. Meanwhile, the 65+ years age bracket for the primary householder has the lowest median household income of $35,278, with 158 households (30.9%) in this group.
| Income Bracket | # Households | Median Income |
| 15 to 24 Years | 38 (7.4%) | $50,917 |
| 25 to 44 Years | 161 (31.5%) | $90,813 |
| 45 to 64 Years | 155 (30.3%) | $48,125 |
| 65+ Years | 158 (30.9%) | $35,278 |
| Total | 512 (100.0%) | $47,368 |
Poverty in Bainbridge
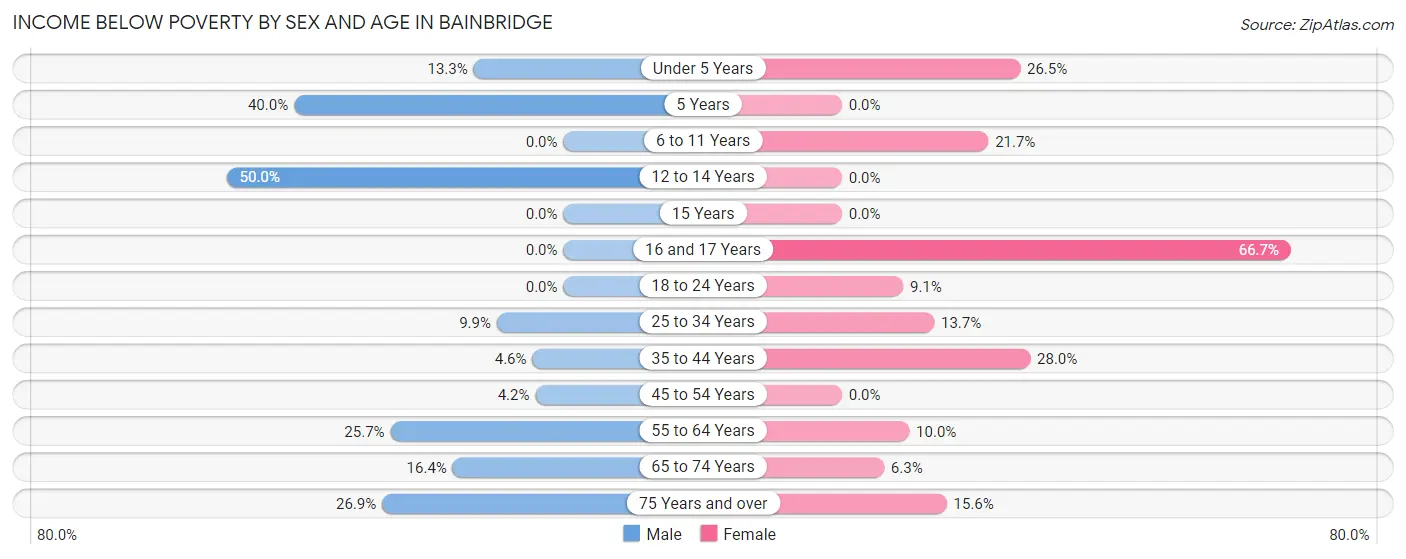
Income Below Poverty by Sex and Age in Bainbridge
With 13.0% poverty level for males and 16.6% for females among the residents of Bainbridge, 12 to 14 year old males and 16 and 17 year old females are the most vulnerable to poverty, with 12 males (50.0%) and 16 females (66.7%) in their respective age groups living below the poverty level.
| Age Bracket | Male | Female |
| Under 5 Years | 2 (13.3%) | 9 (26.5%) |
| 5 Years | 2 (40.0%) | 0 (0.0%) |
| 6 to 11 Years | 0 (0.0%) | 10 (21.7%) |
| 12 to 14 Years | 12 (50.0%) | 0 (0.0%) |
| 15 Years | 0 (0.0%) | 0 (0.0%) |
| 16 and 17 Years | 0 (0.0%) | 16 (66.7%) |
| 18 to 24 Years | 0 (0.0%) | 2 (9.1%) |
| 25 to 34 Years | 8 (9.9%) | 10 (13.7%) |
| 35 to 44 Years | 4 (4.6%) | 26 (28.0%) |
| 45 to 54 Years | 2 (4.2%) | 0 (0.0%) |
| 55 to 64 Years | 19 (25.7%) | 6 (10.0%) |
| 65 to 74 Years | 12 (16.4%) | 3 (6.2%) |
| 75 Years and over | 14 (26.9%) | 7 (15.6%) |
| Total | 75 (13.0%) | 89 (16.6%) |
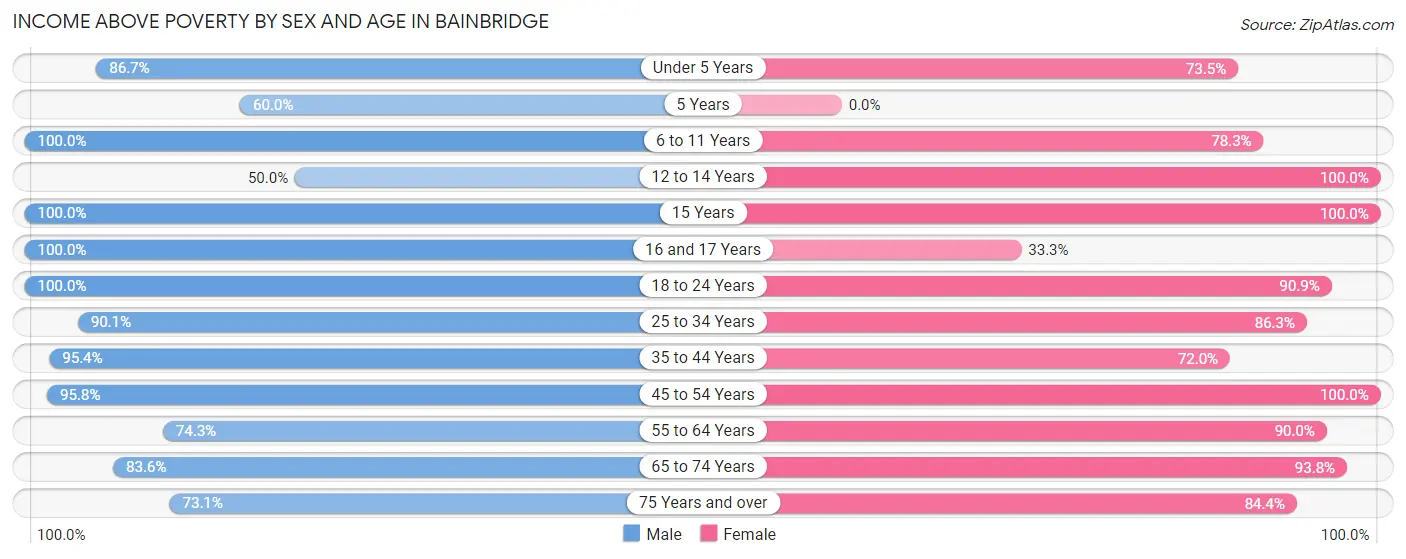
Income Above Poverty by Sex and Age in Bainbridge
According to the poverty statistics in Bainbridge, males aged 6 to 11 years and females aged 12 to 14 years are the age groups that are most secure financially, with 100.0% of males and 100.0% of females in these age groups living above the poverty line.
| Age Bracket | Male | Female |
| Under 5 Years | 13 (86.7%) | 25 (73.5%) |
| 5 Years | 3 (60.0%) | 0 (0.0%) |
| 6 to 11 Years | 44 (100.0%) | 36 (78.3%) |
| 12 to 14 Years | 12 (50.0%) | 34 (100.0%) |
| 15 Years | 3 (100.0%) | 16 (100.0%) |
| 16 and 17 Years | 19 (100.0%) | 8 (33.3%) |
| 18 to 24 Years | 51 (100.0%) | 20 (90.9%) |
| 25 to 34 Years | 73 (90.1%) | 63 (86.3%) |
| 35 to 44 Years | 83 (95.4%) | 67 (72.0%) |
| 45 to 54 Years | 46 (95.8%) | 42 (100.0%) |
| 55 to 64 Years | 55 (74.3%) | 54 (90.0%) |
| 65 to 74 Years | 61 (83.6%) | 45 (93.8%) |
| 75 Years and over | 38 (73.1%) | 38 (84.4%) |
| Total | 501 (87.0%) | 448 (83.4%) |
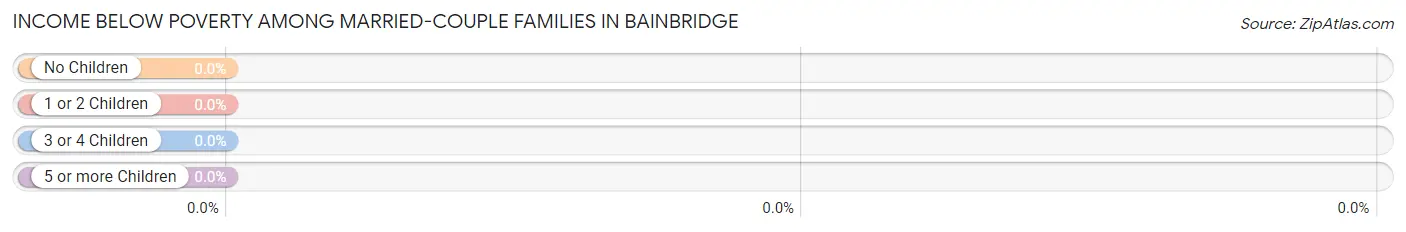
Income Below Poverty Among Married-Couple Families in Bainbridge
| Children | Above Poverty | Below Poverty |
| No Children | 101 (100.0%) | 0 (0.0%) |
| 1 or 2 Children | 49 (100.0%) | 0 (0.0%) |
| 3 or 4 Children | 7 (100.0%) | 0 (0.0%) |
| 5 or more Children | 0 (0.0%) | 0 (0.0%) |
| Total | 157 (100.0%) | 0 (0.0%) |
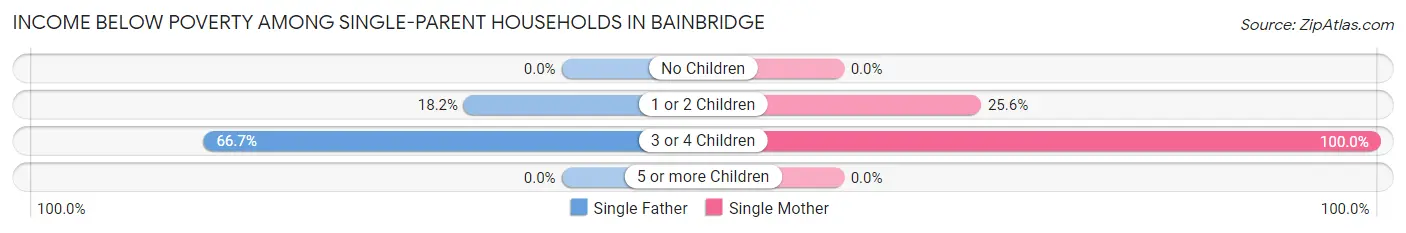
Income Below Poverty Among Single-Parent Households in Bainbridge
According to the poverty data in Bainbridge, 24.0% or 6 single-father households and 20.8% or 15 single-mother households are living below the poverty line. Among single-father households, those with 3 or 4 children have the highest poverty rate, with 2 households (66.7%) experiencing poverty. Likewise, among single-mother households, those with 3 or 4 children have the highest poverty rate, with 4 households (100.0%) falling below the poverty line.
| Children | Single Father | Single Mother |
| No Children | 0 (0.0%) | 0 (0.0%) |
| 1 or 2 Children | 4 (18.2%) | 11 (25.6%) |
| 3 or 4 Children | 2 (66.7%) | 4 (100.0%) |
| 5 or more Children | 0 (0.0%) | 0 (0.0%) |
| Total | 6 (24.0%) | 15 (20.8%) |
Income Below Poverty Among Married-Couple vs Single-Parent Households in Bainbridge
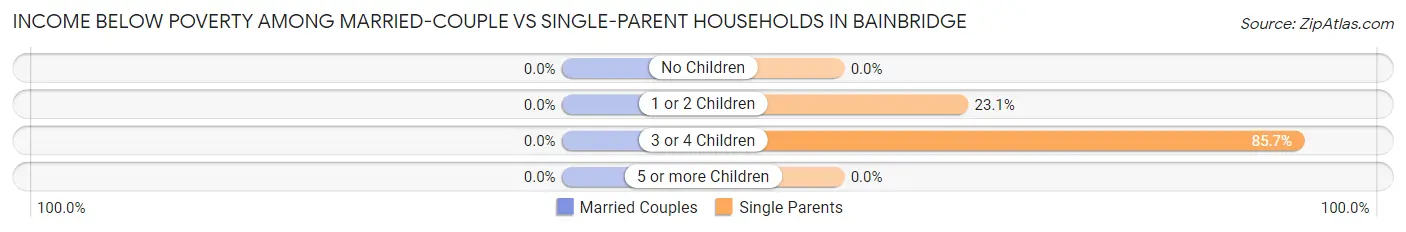
| Children | Married-Couple Families | Single-Parent Households |
| No Children | 0 (0.0%) | 0 (0.0%) |
| 1 or 2 Children | 0 (0.0%) | 15 (23.1%) |
| 3 or 4 Children | 0 (0.0%) | 6 (85.7%) |
| 5 or more Children | 0 (0.0%) | 0 (0.0%) |
| Total | 0 (0.0%) | 21 (21.6%) |
Employment Characteristics in Bainbridge
Employment by Class of Employer in Bainbridge
Among the 474 employed individuals in Bainbridge, private company employees (255 | 53.8%), local government employees (103 | 21.7%), and not-for-profit organizations (51 | 10.8%) make up the most common classes of employment.
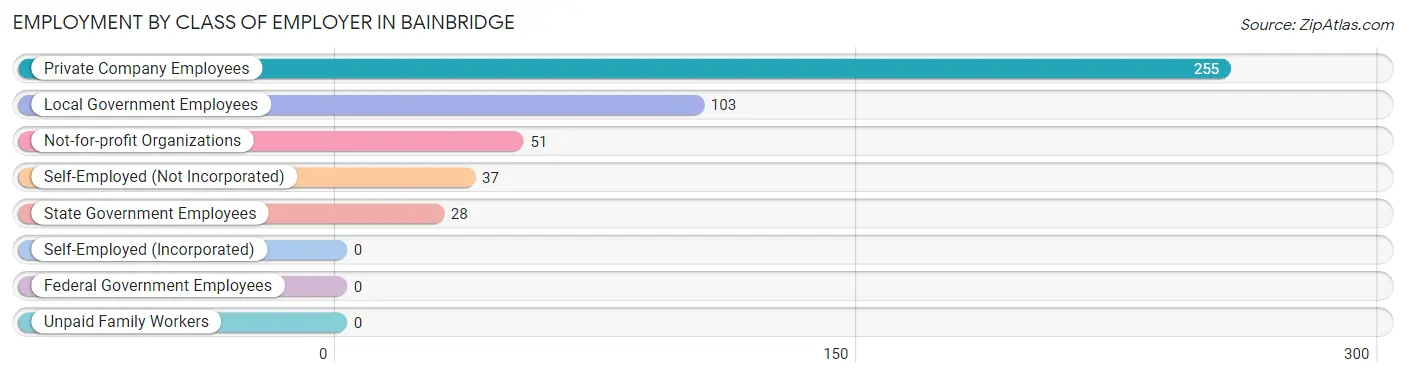
| Employer Class | # Employees | % Employees |
| Private Company Employees | 255 | 53.8% |
| Self-Employed (Incorporated) | 0 | 0.0% |
| Self-Employed (Not Incorporated) | 37 | 7.8% |
| Not-for-profit Organizations | 51 | 10.8% |
| Local Government Employees | 103 | 21.7% |
| State Government Employees | 28 | 5.9% |
| Federal Government Employees | 0 | 0.0% |
| Unpaid Family Workers | 0 | 0.0% |
| Total | 474 | 100.0% |
Employment Status by Age in Bainbridge
According to the labor force statistics for Bainbridge, out of the total population over 16 years of age (892), 62.2% or 555 individuals are in the labor force, with 7.4% or 41 of them unemployed. The age group with the highest labor force participation rate is 35 to 44 years, with 93.3% or 168 individuals in the labor force. Within the labor force, the 75 years and over age range has the highest percentage of unemployed individuals, with 33.3% or 2 of them being unemployed.
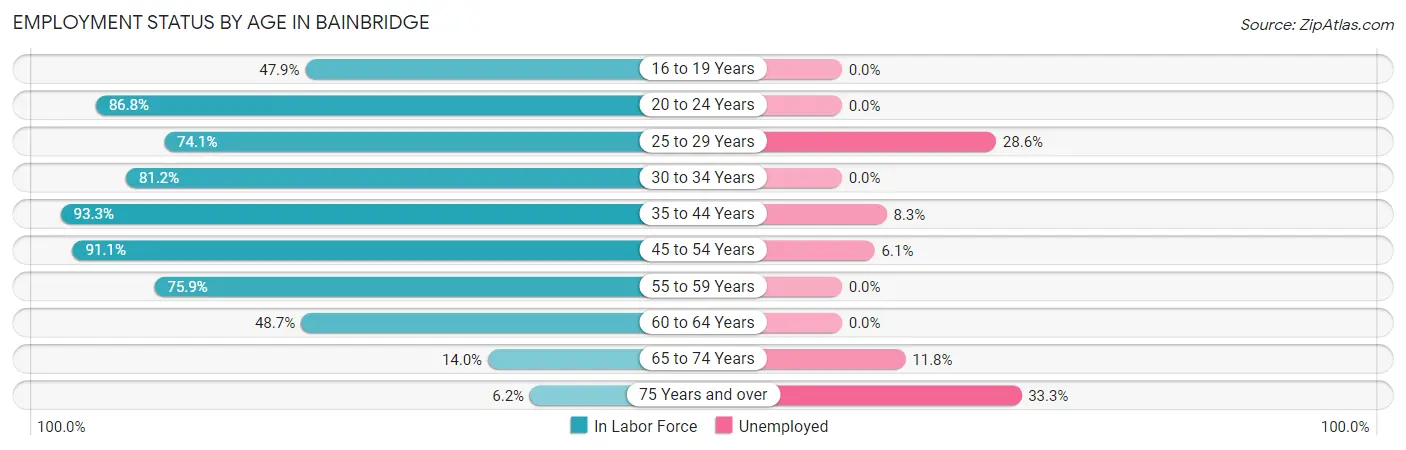
| Age Bracket | In Labor Force | Unemployed |
| 16 to 19 Years | 23 (47.9%) | 0 (0.0%) |
| 20 to 24 Years | 59 (86.8%) | 0 (0.0%) |
| 25 to 29 Years | 63 (74.1%) | 18 (28.6%) |
| 30 to 34 Years | 56 (81.2%) | 0 (0.0%) |
| 35 to 44 Years | 168 (93.3%) | 14 (8.3%) |
| 45 to 54 Years | 82 (91.1%) | 5 (6.1%) |
| 55 to 59 Years | 44 (75.9%) | 0 (0.0%) |
| 60 to 64 Years | 37 (48.7%) | 0 (0.0%) |
| 65 to 74 Years | 17 (14.0%) | 2 (11.8%) |
| 75 Years and over | 6 (6.2%) | 2 (33.3%) |
| Total | 555 (62.2%) | 41 (7.4%) |
Employment Status by Educational Attainment in Bainbridge
According to labor force statistics for Bainbridge, 80.6% of individuals (450) out of the total population between 25 and 64 years of age (558) are in the labor force, with 8.2% or 37 of them being unemployed. The group with the highest labor force participation rate are those with the educational attainment of bachelor's degree or higher, with 86.7% or 156 individuals in the labor force. Within the labor force, individuals with high school diploma education have the highest percentage of unemployment, with 21.2% or 32 of them being unemployed.
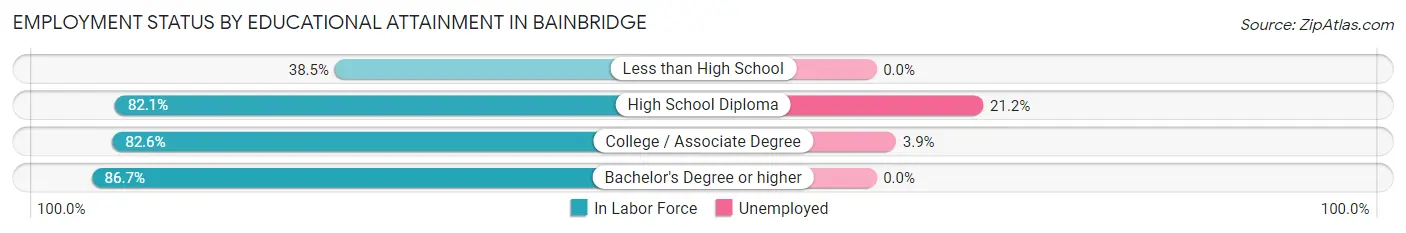
| Educational Attainment | In Labor Force | Unemployed |
| Less than High School | 15 (38.5%) | 0 (0.0%) |
| High School Diploma | 151 (82.1%) | 39 (21.2%) |
| College / Associate Degree | 128 (82.6%) | 6 (3.9%) |
| Bachelor's Degree or higher | 156 (86.7%) | 0 (0.0%) |
| Total | 450 (80.6%) | 46 (8.2%) |
Employment Occupations by Sex in Bainbridge
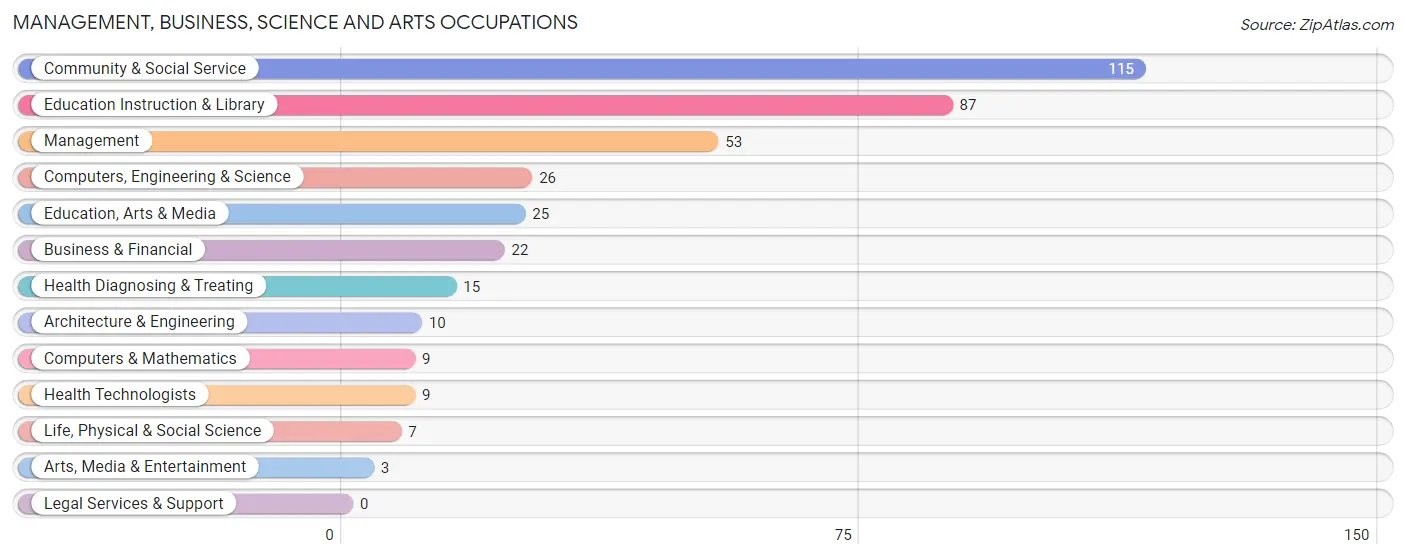
Management, Business, Science and Arts Occupations
The most common Management, Business, Science and Arts occupations in Bainbridge are Community & Social Service (115 | 22.4%), Education Instruction & Library (87 | 16.9%), Management (53 | 10.3%), Computers, Engineering & Science (26 | 5.1%), and Education, Arts & Media (25 | 4.9%).
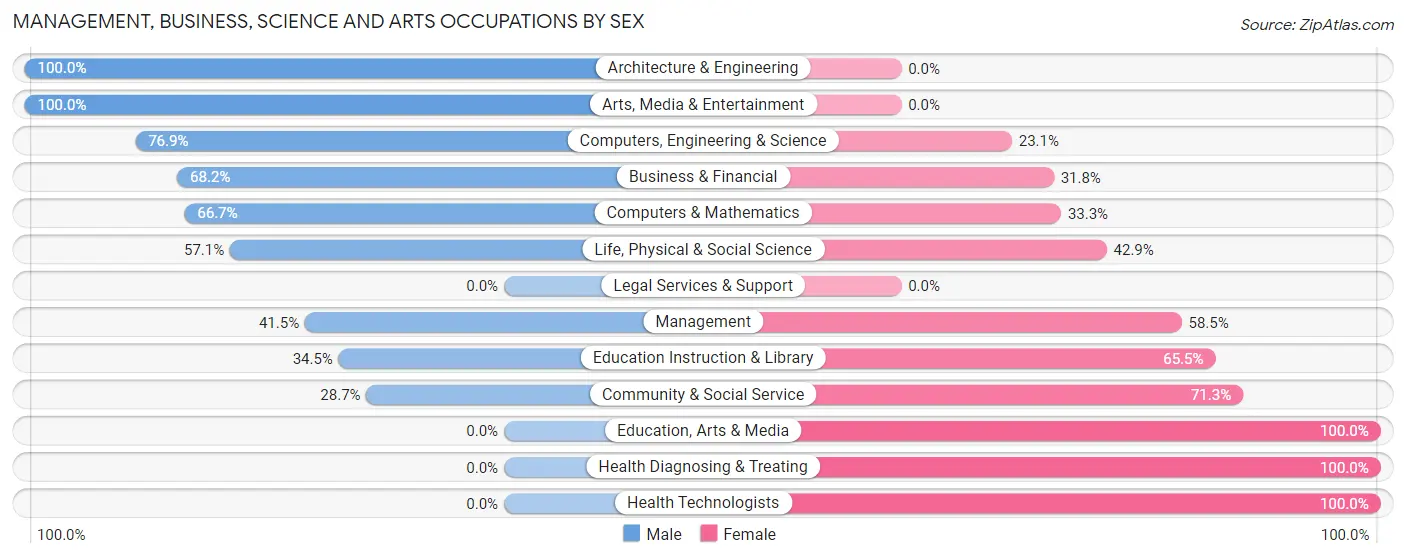
Management, Business, Science and Arts Occupations by Sex
Within the Management, Business, Science and Arts occupations in Bainbridge, the most male-oriented occupations are Architecture & Engineering (100.0%), Arts, Media & Entertainment (100.0%), and Computers, Engineering & Science (76.9%), while the most female-oriented occupations are Education, Arts & Media (100.0%), Health Diagnosing & Treating (100.0%), and Health Technologists (100.0%).
| Occupation | Male | Female |
| Management | 22 (41.5%) | 31 (58.5%) |
| Business & Financial | 15 (68.2%) | 7 (31.8%) |
| Computers, Engineering & Science | 20 (76.9%) | 6 (23.1%) |
| Computers & Mathematics | 6 (66.7%) | 3 (33.3%) |
| Architecture & Engineering | 10 (100.0%) | 0 (0.0%) |
| Life, Physical & Social Science | 4 (57.1%) | 3 (42.9%) |
| Community & Social Service | 33 (28.7%) | 82 (71.3%) |
| Education, Arts & Media | 0 (0.0%) | 25 (100.0%) |
| Legal Services & Support | 0 (0.0%) | 0 (0.0%) |
| Education Instruction & Library | 30 (34.5%) | 57 (65.5%) |
| Arts, Media & Entertainment | 3 (100.0%) | 0 (0.0%) |
| Health Diagnosing & Treating | 0 (0.0%) | 15 (100.0%) |
| Health Technologists | 0 (0.0%) | 9 (100.0%) |
| Total (Category) | 90 (39.0%) | 141 (61.0%) |
| Total (Overall) | 267 (51.9%) | 247 (48.0%) |
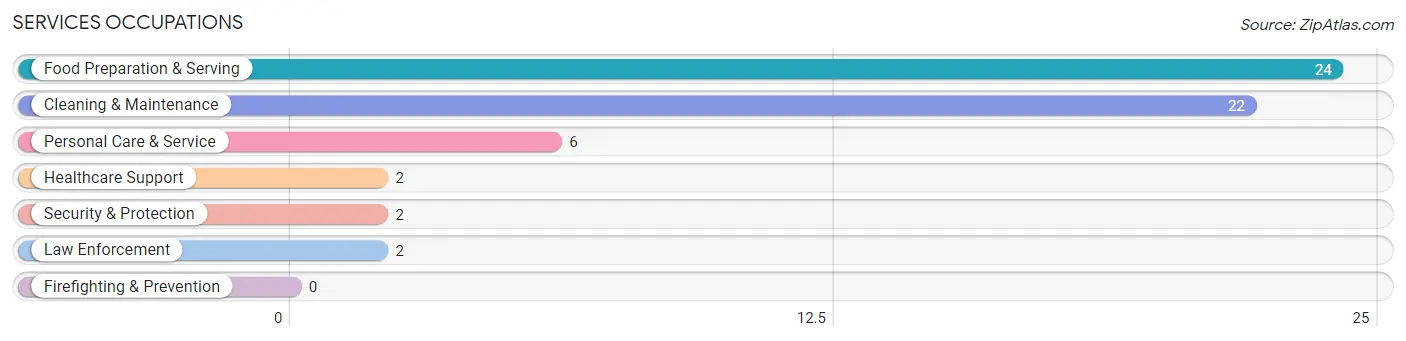
Services Occupations
The most common Services occupations in Bainbridge are Food Preparation & Serving (24 | 4.7%), Cleaning & Maintenance (22 | 4.3%), Personal Care & Service (6 | 1.2%), Healthcare Support (2 | 0.4%), and Security & Protection (2 | 0.4%).
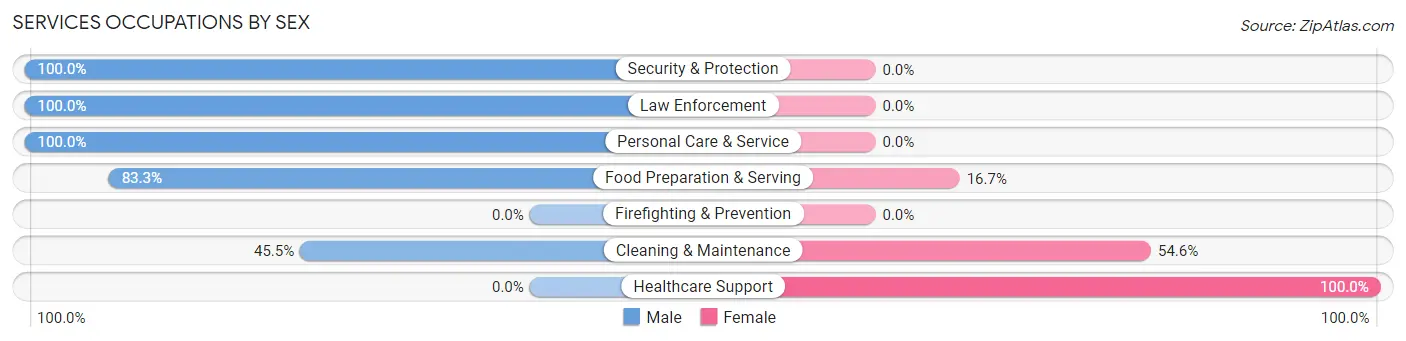
Services Occupations by Sex
Within the Services occupations in Bainbridge, the most male-oriented occupations are Security & Protection (100.0%), Law Enforcement (100.0%), and Personal Care & Service (100.0%), while the most female-oriented occupations are Healthcare Support (100.0%), Cleaning & Maintenance (54.5%), and Food Preparation & Serving (16.7%).
| Occupation | Male | Female |
| Healthcare Support | 0 (0.0%) | 2 (100.0%) |
| Security & Protection | 2 (100.0%) | 0 (0.0%) |
| Firefighting & Prevention | 0 (0.0%) | 0 (0.0%) |
| Law Enforcement | 2 (100.0%) | 0 (0.0%) |
| Food Preparation & Serving | 20 (83.3%) | 4 (16.7%) |
| Cleaning & Maintenance | 10 (45.5%) | 12 (54.5%) |
| Personal Care & Service | 6 (100.0%) | 0 (0.0%) |
| Total (Category) | 38 (67.9%) | 18 (32.1%) |
| Total (Overall) | 267 (51.9%) | 247 (48.0%) |
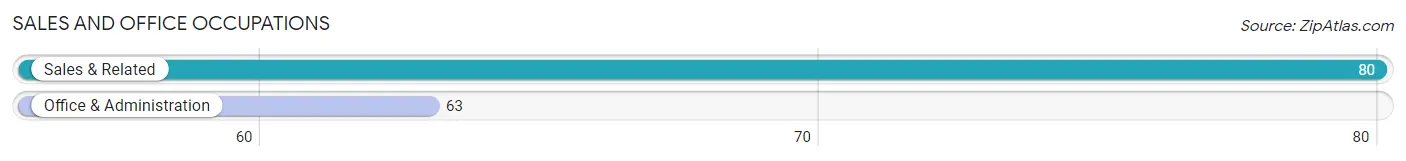
Sales and Office Occupations
The most common Sales and Office occupations in Bainbridge are Sales & Related (80 | 15.6%), and Office & Administration (63 | 12.3%).
Sales and Office Occupations by Sex
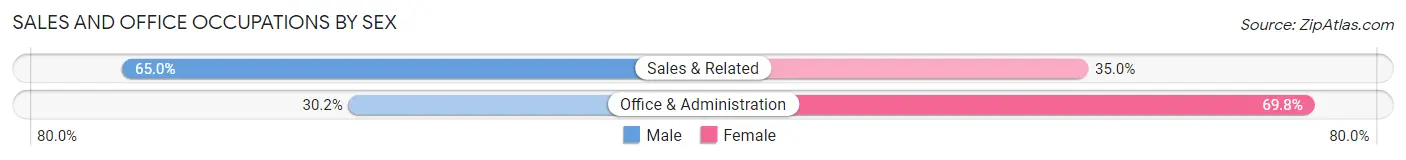
| Occupation | Male | Female |
| Sales & Related | 52 (65.0%) | 28 (35.0%) |
| Office & Administration | 19 (30.2%) | 44 (69.8%) |
| Total (Category) | 71 (49.6%) | 72 (50.3%) |
| Total (Overall) | 267 (51.9%) | 247 (48.0%) |
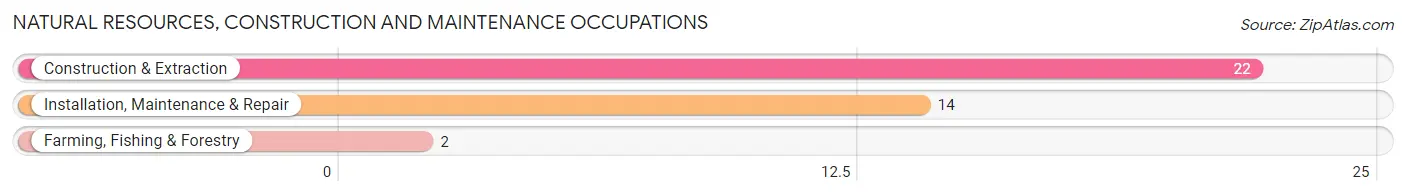
Natural Resources, Construction and Maintenance Occupations
The most common Natural Resources, Construction and Maintenance occupations in Bainbridge are Construction & Extraction (22 | 4.3%), Installation, Maintenance & Repair (14 | 2.7%), and Farming, Fishing & Forestry (2 | 0.4%).
Natural Resources, Construction and Maintenance Occupations by Sex
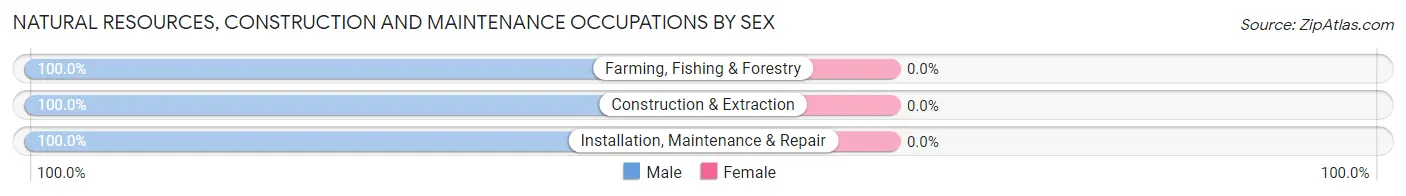
| Occupation | Male | Female |
| Farming, Fishing & Forestry | 2 (100.0%) | 0 (0.0%) |
| Construction & Extraction | 22 (100.0%) | 0 (0.0%) |
| Installation, Maintenance & Repair | 14 (100.0%) | 0 (0.0%) |
| Total (Category) | 38 (100.0%) | 0 (0.0%) |
| Total (Overall) | 267 (51.9%) | 247 (48.0%) |
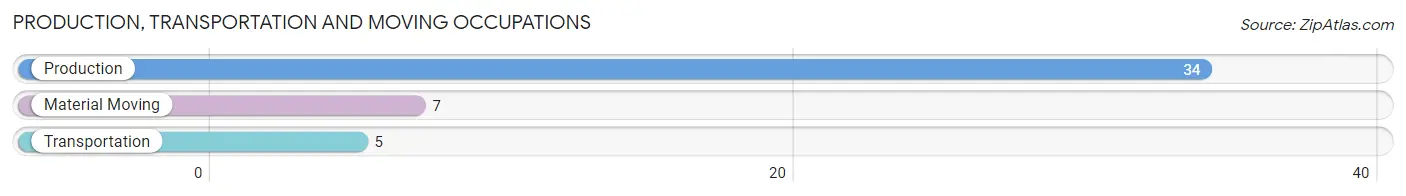
Production, Transportation and Moving Occupations
The most common Production, Transportation and Moving occupations in Bainbridge are Production (34 | 6.6%), Material Moving (7 | 1.4%), and Transportation (5 | 1.0%).
Production, Transportation and Moving Occupations by Sex
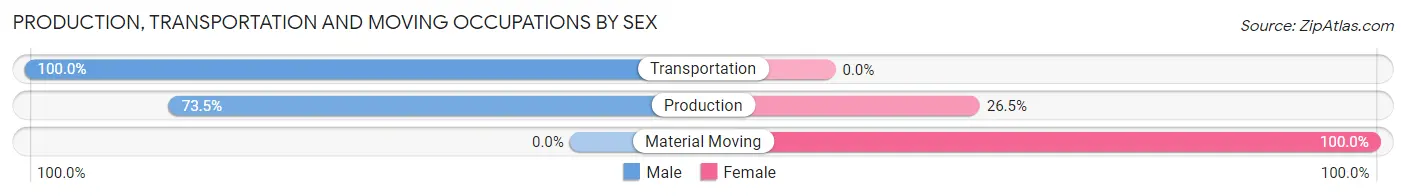
| Occupation | Male | Female |
| Production | 25 (73.5%) | 9 (26.5%) |
| Transportation | 5 (100.0%) | 0 (0.0%) |
| Material Moving | 0 (0.0%) | 7 (100.0%) |
| Total (Category) | 30 (65.2%) | 16 (34.8%) |
| Total (Overall) | 267 (51.9%) | 247 (48.0%) |
Employment Industries by Sex in Bainbridge
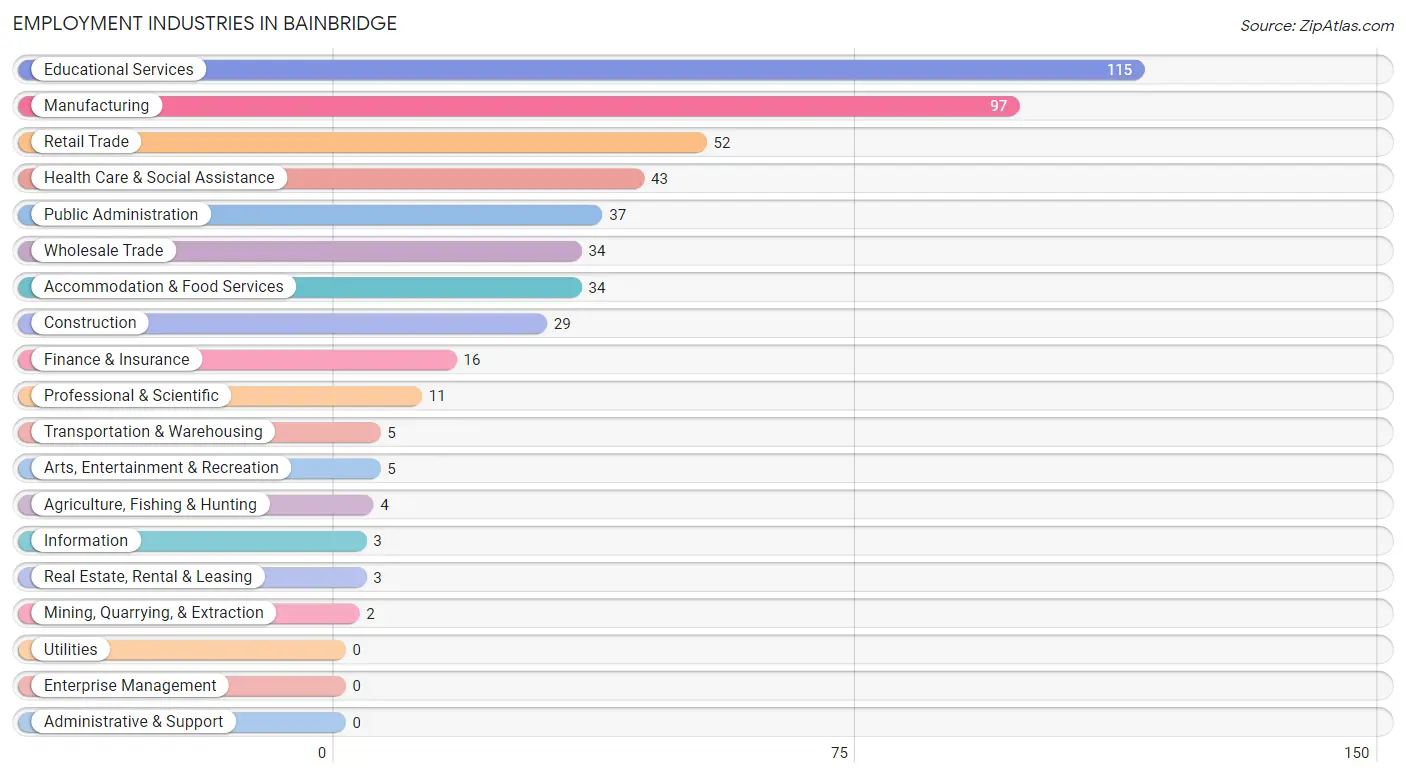
Employment Industries in Bainbridge
The major employment industries in Bainbridge include Educational Services (115 | 22.4%), Manufacturing (97 | 18.9%), Retail Trade (52 | 10.1%), Health Care & Social Assistance (43 | 8.4%), and Public Administration (37 | 7.2%).
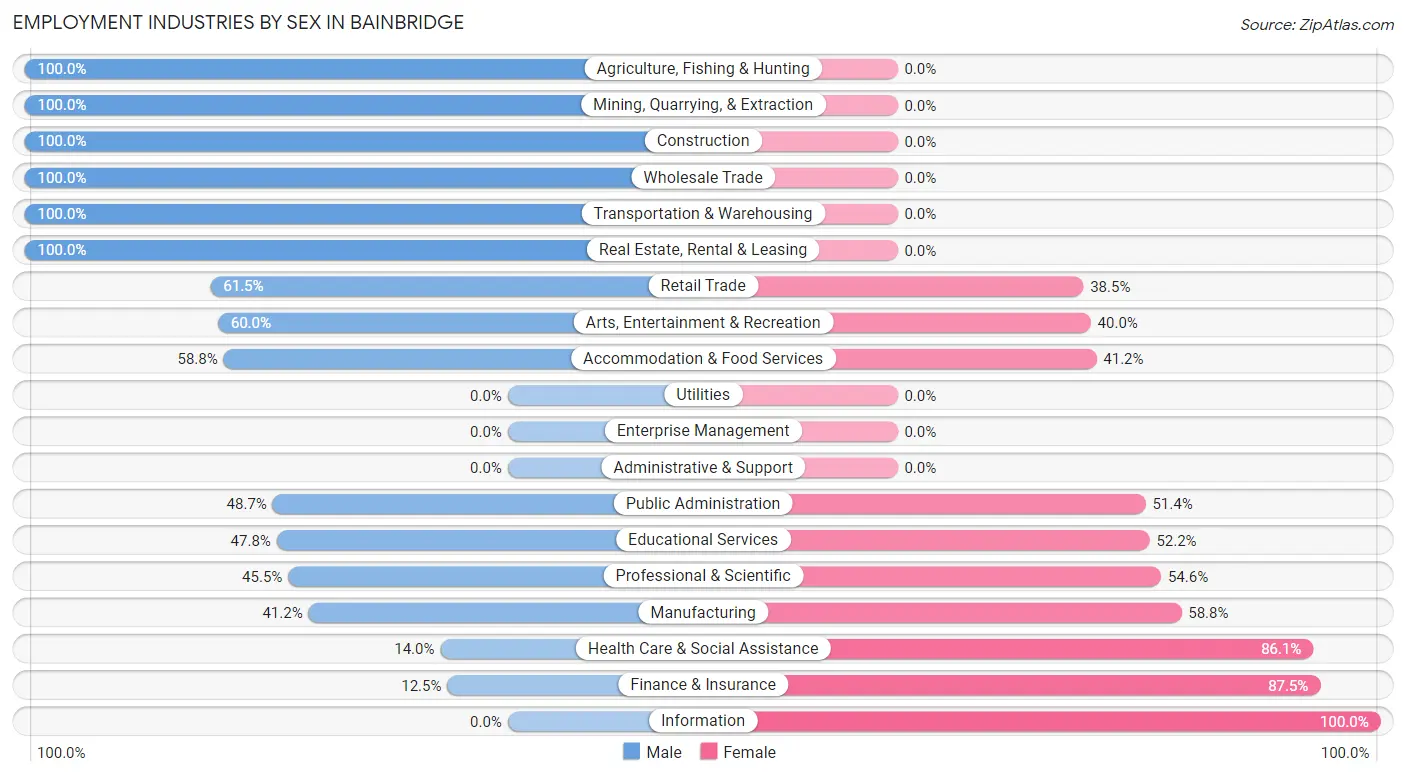
Employment Industries by Sex in Bainbridge
The Bainbridge industries that see more men than women are Agriculture, Fishing & Hunting (100.0%), Mining, Quarrying, & Extraction (100.0%), and Construction (100.0%), whereas the industries that tend to have a higher number of women are Information (100.0%), Finance & Insurance (87.5%), and Health Care & Social Assistance (86.1%).
| Industry | Male | Female |
| Agriculture, Fishing & Hunting | 4 (100.0%) | 0 (0.0%) |
| Mining, Quarrying, & Extraction | 2 (100.0%) | 0 (0.0%) |
| Construction | 29 (100.0%) | 0 (0.0%) |
| Manufacturing | 40 (41.2%) | 57 (58.8%) |
| Wholesale Trade | 34 (100.0%) | 0 (0.0%) |
| Retail Trade | 32 (61.5%) | 20 (38.5%) |
| Transportation & Warehousing | 5 (100.0%) | 0 (0.0%) |
| Utilities | 0 (0.0%) | 0 (0.0%) |
| Information | 0 (0.0%) | 3 (100.0%) |
| Finance & Insurance | 2 (12.5%) | 14 (87.5%) |
| Real Estate, Rental & Leasing | 3 (100.0%) | 0 (0.0%) |
| Professional & Scientific | 5 (45.5%) | 6 (54.5%) |
| Enterprise Management | 0 (0.0%) | 0 (0.0%) |
| Administrative & Support | 0 (0.0%) | 0 (0.0%) |
| Educational Services | 55 (47.8%) | 60 (52.2%) |
| Health Care & Social Assistance | 6 (14.0%) | 37 (86.1%) |
| Arts, Entertainment & Recreation | 3 (60.0%) | 2 (40.0%) |
| Accommodation & Food Services | 20 (58.8%) | 14 (41.2%) |
| Public Administration | 18 (48.6%) | 19 (51.3%) |
| Total | 267 (51.9%) | 247 (48.0%) |
Education in Bainbridge
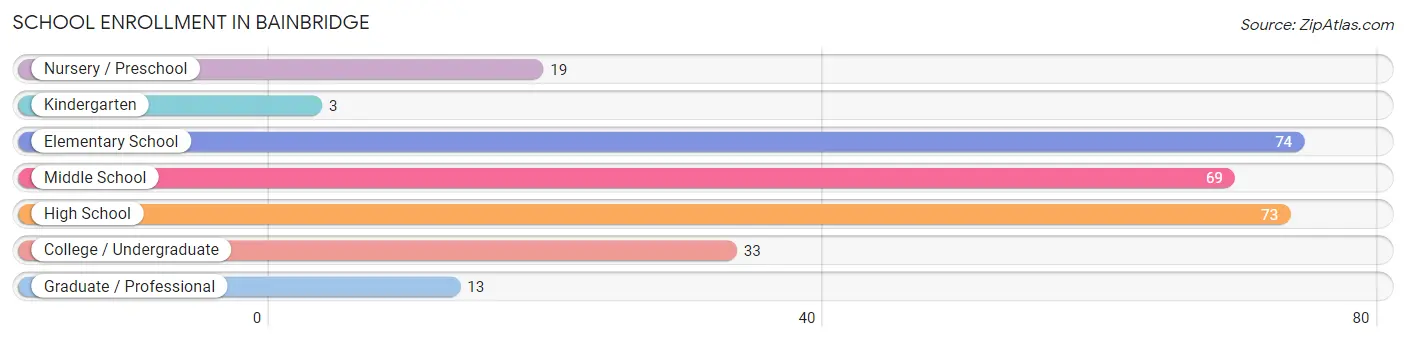
School Enrollment in Bainbridge
The most common levels of schooling among the 284 students in Bainbridge are elementary school (74 | 26.1%), high school (73 | 25.7%), and middle school (69 | 24.3%).
| School Level | # Students | % Students |
| Nursery / Preschool | 19 | 6.7% |
| Kindergarten | 3 | 1.1% |
| Elementary School | 74 | 26.1% |
| Middle School | 69 | 24.3% |
| High School | 73 | 25.7% |
| College / Undergraduate | 33 | 11.6% |
| Graduate / Professional | 13 | 4.6% |
| Total | 284 | 100.0% |
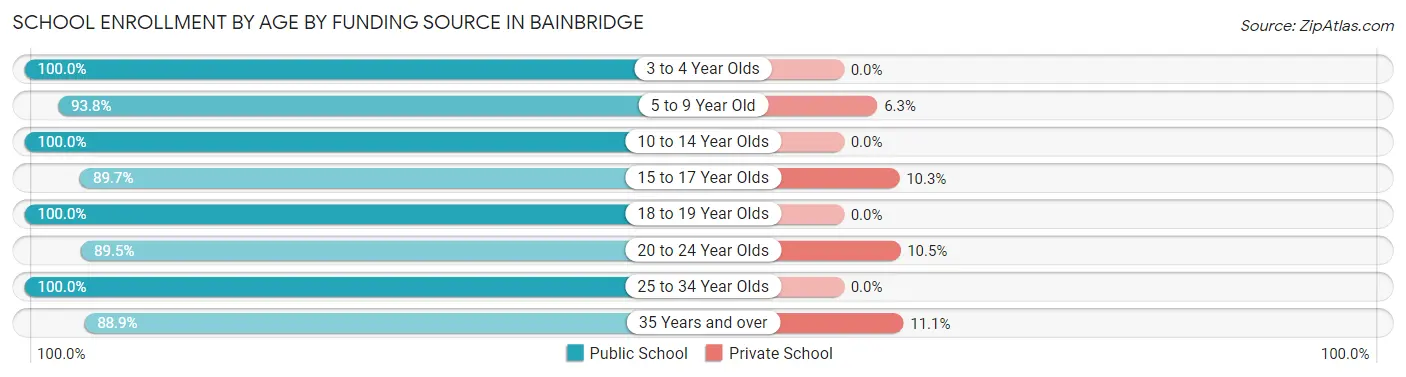
School Enrollment by Age by Funding Source in Bainbridge
Out of a total of 284 students who are enrolled in schools in Bainbridge, 15 (5.3%) attend a private institution, while the remaining 269 (94.7%) are enrolled in public schools. The age group of 35 years and over has the highest likelihood of being enrolled in private schools, with 2 (11.1% in the age bracket) enrolled. Conversely, the age group of 3 to 4 year olds has the lowest likelihood of being enrolled in a private school, with 15 (100.0% in the age bracket) attending a public institution.
| Age Bracket | Public School | Private School |
| 3 to 4 Year Olds | 15 (100.0%) | 0 (0.0%) |
| 5 to 9 Year Old | 75 (93.8%) | 5 (6.2%) |
| 10 to 14 Year Olds | 85 (100.0%) | 0 (0.0%) |
| 15 to 17 Year Olds | 52 (89.7%) | 6 (10.3%) |
| 18 to 19 Year Olds | 4 (100.0%) | 0 (0.0%) |
| 20 to 24 Year Olds | 17 (89.5%) | 2 (10.5%) |
| 25 to 34 Year Olds | 5 (100.0%) | 0 (0.0%) |
| 35 Years and over | 16 (88.9%) | 2 (11.1%) |
| Total | 269 (94.7%) | 15 (5.3%) |
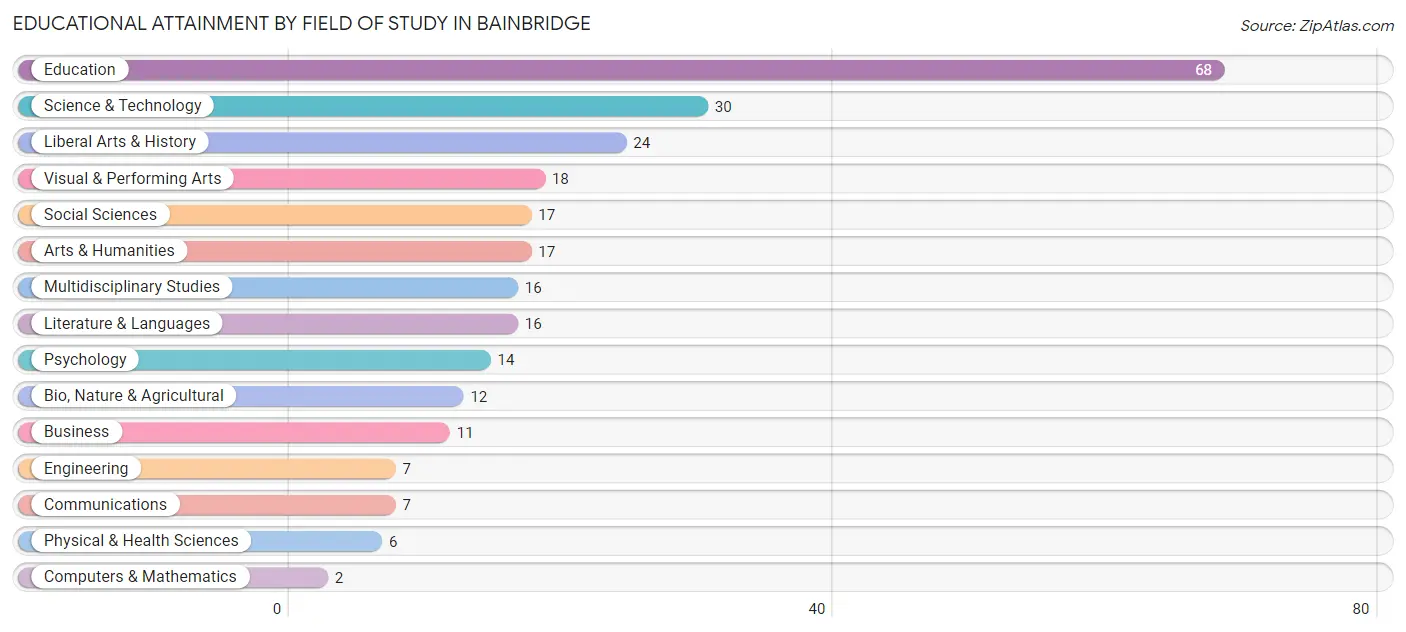
Educational Attainment by Field of Study in Bainbridge
Education (68 | 25.7%), science & technology (30 | 11.3%), liberal arts & history (24 | 9.1%), visual & performing arts (18 | 6.8%), and social sciences (17 | 6.4%) are the most common fields of study among 265 individuals in Bainbridge who have obtained a bachelor's degree or higher.
| Field of Study | # Graduates | % Graduates |
| Computers & Mathematics | 2 | 0.7% |
| Bio, Nature & Agricultural | 12 | 4.5% |
| Physical & Health Sciences | 6 | 2.3% |
| Psychology | 14 | 5.3% |
| Social Sciences | 17 | 6.4% |
| Engineering | 7 | 2.6% |
| Multidisciplinary Studies | 16 | 6.0% |
| Science & Technology | 30 | 11.3% |
| Business | 11 | 4.2% |
| Education | 68 | 25.7% |
| Literature & Languages | 16 | 6.0% |
| Liberal Arts & History | 24 | 9.1% |
| Visual & Performing Arts | 18 | 6.8% |
| Communications | 7 | 2.6% |
| Arts & Humanities | 17 | 6.4% |
| Total | 265 | 100.0% |
Transportation & Commute in Bainbridge
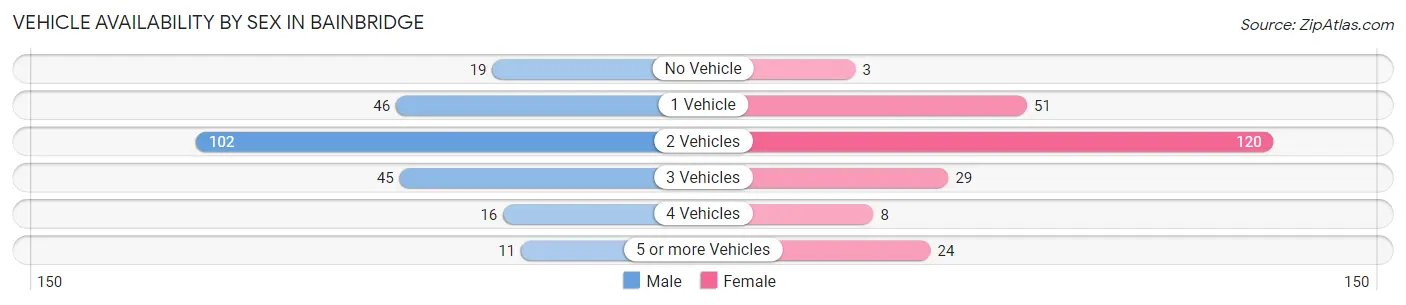
Vehicle Availability by Sex in Bainbridge
The most prevalent vehicle ownership categories in Bainbridge are males with 2 vehicles (102, accounting for 42.7%) and females with 2 vehicles (120, making up 43.4%).
| Vehicles Available | Male | Female |
| No Vehicle | 19 (8.0%) | 3 (1.3%) |
| 1 Vehicle | 46 (19.3%) | 51 (21.7%) |
| 2 Vehicles | 102 (42.7%) | 120 (51.1%) |
| 3 Vehicles | 45 (18.8%) | 29 (12.3%) |
| 4 Vehicles | 16 (6.7%) | 8 (3.4%) |
| 5 or more Vehicles | 11 (4.6%) | 24 (10.2%) |
| Total | 239 (100.0%) | 235 (100.0%) |
Commute Time in Bainbridge
The most frequently occuring commute durations in Bainbridge are 5 to 9 minutes (87 commuters, 19.9%), 30 to 34 minutes (74 commuters, 16.9%), and 25 to 29 minutes (60 commuters, 13.7%).
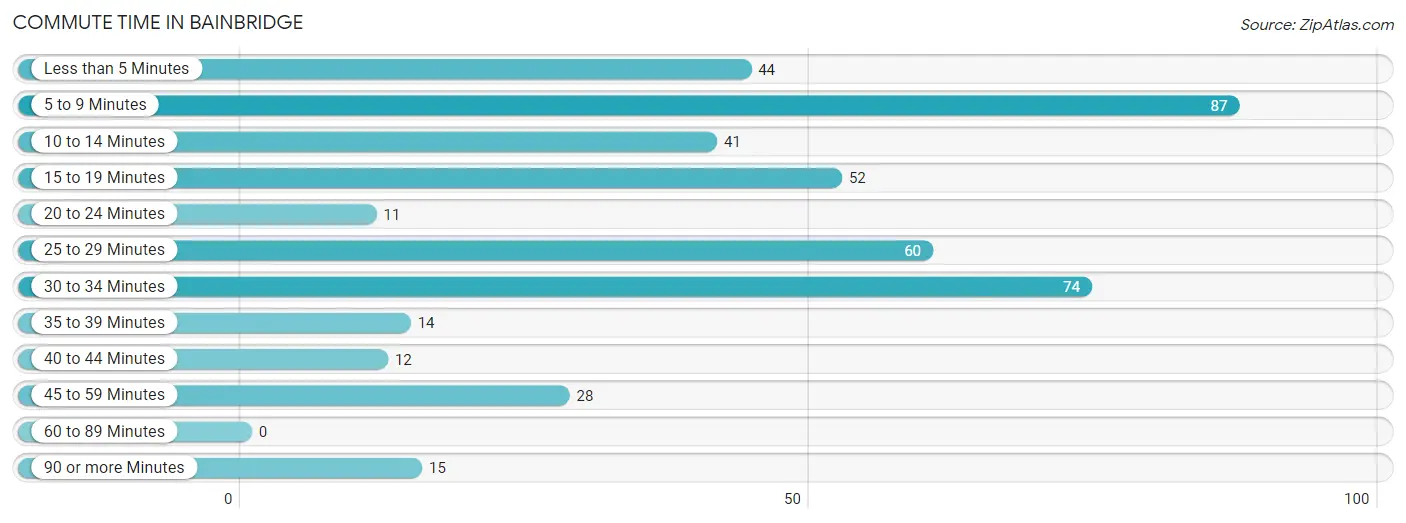
| Commute Time | # Commuters | % Commuters |
| Less than 5 Minutes | 44 | 10.1% |
| 5 to 9 Minutes | 87 | 19.9% |
| 10 to 14 Minutes | 41 | 9.4% |
| 15 to 19 Minutes | 52 | 11.9% |
| 20 to 24 Minutes | 11 | 2.5% |
| 25 to 29 Minutes | 60 | 13.7% |
| 30 to 34 Minutes | 74 | 16.9% |
| 35 to 39 Minutes | 14 | 3.2% |
| 40 to 44 Minutes | 12 | 2.7% |
| 45 to 59 Minutes | 28 | 6.4% |
| 60 to 89 Minutes | 0 | 0.0% |
| 90 or more Minutes | 15 | 3.4% |
Commute Time by Sex in Bainbridge
The most common commute times in Bainbridge are 25 to 29 minutes (37 commuters, 16.0%) for males and 5 to 9 minutes (54 commuters, 26.1%) for females.
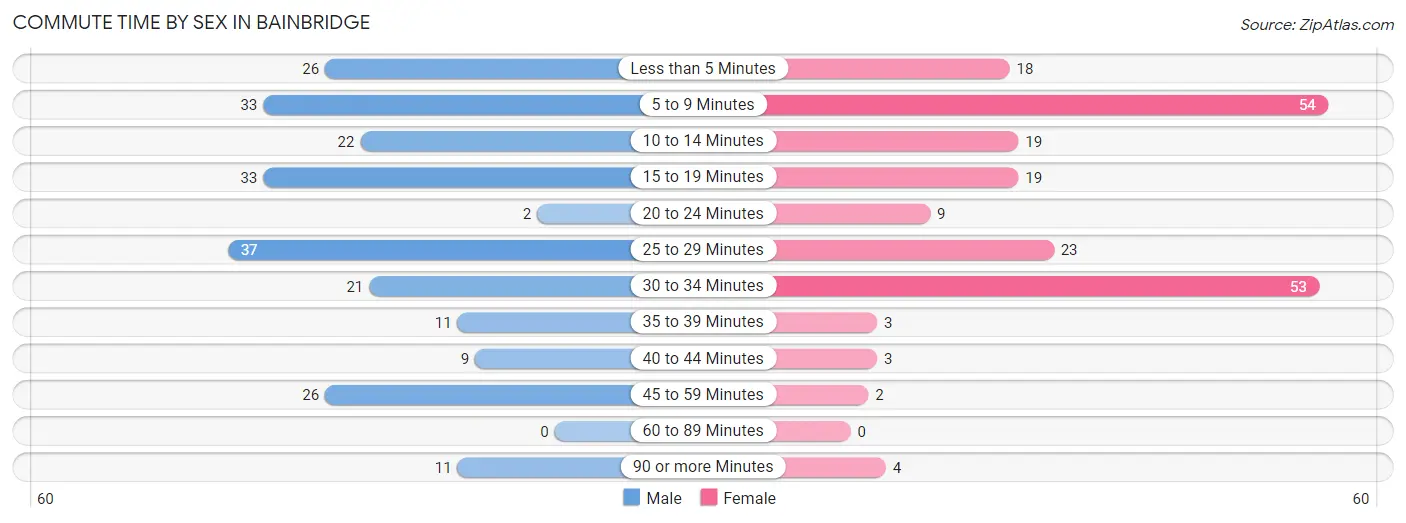
| Commute Time | Male | Female |
| Less than 5 Minutes | 26 (11.3%) | 18 (8.7%) |
| 5 to 9 Minutes | 33 (14.3%) | 54 (26.1%) |
| 10 to 14 Minutes | 22 (9.5%) | 19 (9.2%) |
| 15 to 19 Minutes | 33 (14.3%) | 19 (9.2%) |
| 20 to 24 Minutes | 2 (0.9%) | 9 (4.3%) |
| 25 to 29 Minutes | 37 (16.0%) | 23 (11.1%) |
| 30 to 34 Minutes | 21 (9.1%) | 53 (25.6%) |
| 35 to 39 Minutes | 11 (4.8%) | 3 (1.5%) |
| 40 to 44 Minutes | 9 (3.9%) | 3 (1.5%) |
| 45 to 59 Minutes | 26 (11.3%) | 2 (1.0%) |
| 60 to 89 Minutes | 0 (0.0%) | 0 (0.0%) |
| 90 or more Minutes | 11 (4.8%) | 4 (1.9%) |
Time of Departure to Work by Sex in Bainbridge
The most frequent times of departure to work in Bainbridge are 7:00 AM to 7:29 AM (95, 41.1%) for males and 8:00 AM to 8:29 AM (52, 25.1%) for females.
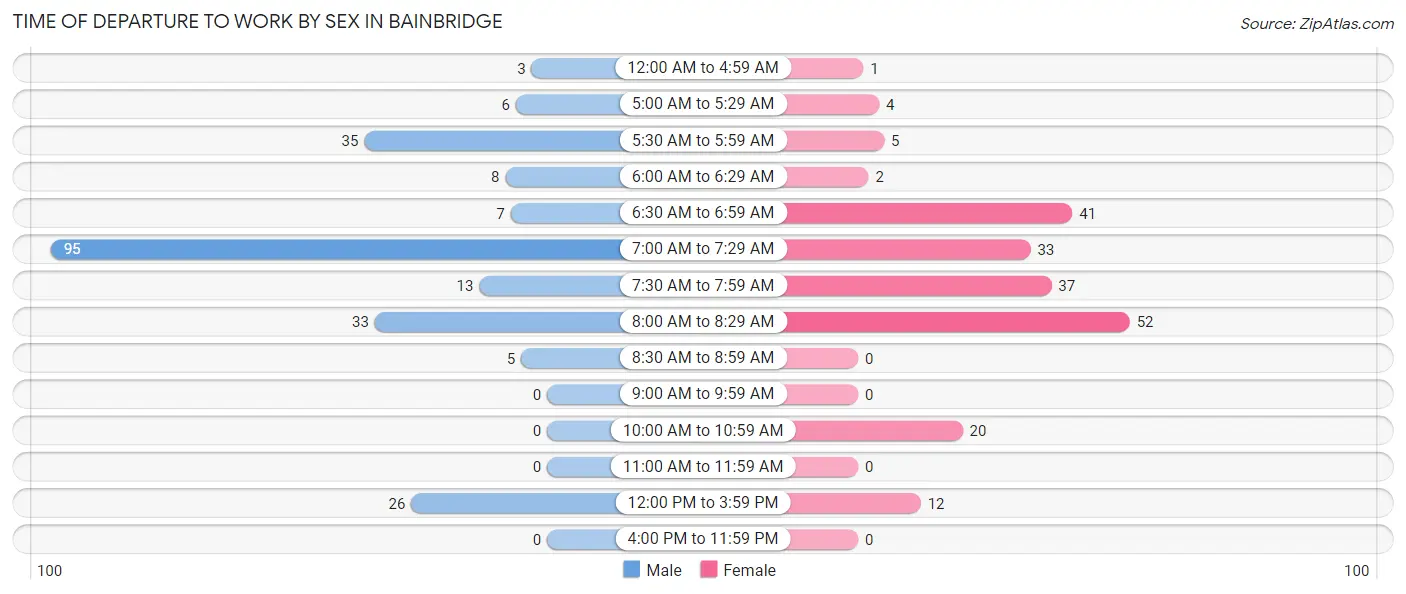
| Time of Departure | Male | Female |
| 12:00 AM to 4:59 AM | 3 (1.3%) | 1 (0.5%) |
| 5:00 AM to 5:29 AM | 6 (2.6%) | 4 (1.9%) |
| 5:30 AM to 5:59 AM | 35 (15.1%) | 5 (2.4%) |
| 6:00 AM to 6:29 AM | 8 (3.5%) | 2 (1.0%) |
| 6:30 AM to 6:59 AM | 7 (3.0%) | 41 (19.8%) |
| 7:00 AM to 7:29 AM | 95 (41.1%) | 33 (15.9%) |
| 7:30 AM to 7:59 AM | 13 (5.6%) | 37 (17.9%) |
| 8:00 AM to 8:29 AM | 33 (14.3%) | 52 (25.1%) |
| 8:30 AM to 8:59 AM | 5 (2.2%) | 0 (0.0%) |
| 9:00 AM to 9:59 AM | 0 (0.0%) | 0 (0.0%) |
| 10:00 AM to 10:59 AM | 0 (0.0%) | 20 (9.7%) |
| 11:00 AM to 11:59 AM | 0 (0.0%) | 0 (0.0%) |
| 12:00 PM to 3:59 PM | 26 (11.3%) | 12 (5.8%) |
| 4:00 PM to 11:59 PM | 0 (0.0%) | 0 (0.0%) |
| Total | 231 (100.0%) | 207 (100.0%) |
Housing Occupancy in Bainbridge
Occupancy by Ownership in Bainbridge
Of the total 512 dwellings in Bainbridge, owner-occupied units account for 326 (63.7%), while renter-occupied units make up 186 (36.3%).
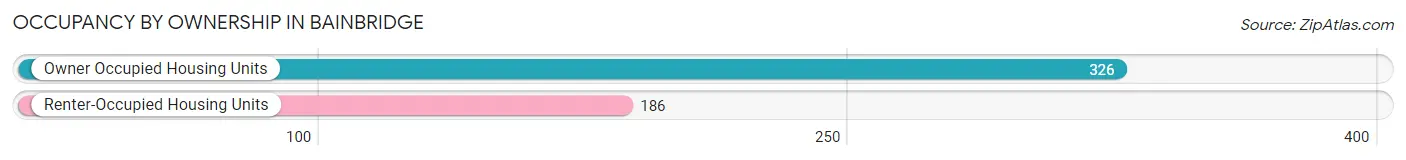
| Occupancy | # Housing Units | % Housing Units |
| Owner Occupied Housing Units | 326 | 63.7% |
| Renter-Occupied Housing Units | 186 | 36.3% |
| Total Occupied Housing Units | 512 | 100.0% |
Occupancy by Household Size in Bainbridge
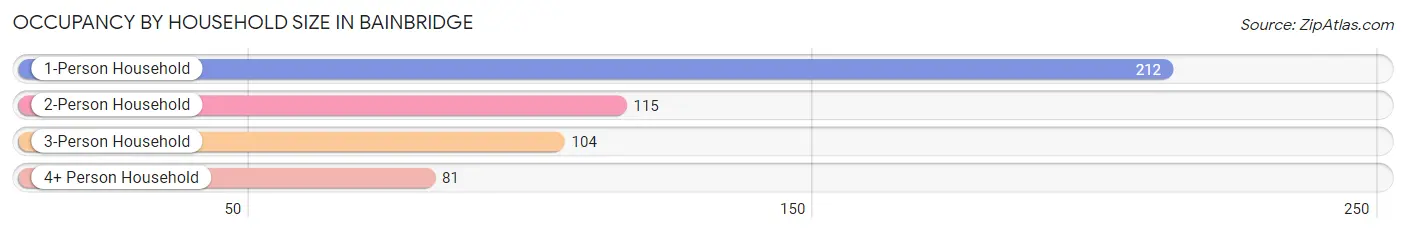
| Household Size | # Housing Units | % Housing Units |
| 1-Person Household | 212 | 41.4% |
| 2-Person Household | 115 | 22.5% |
| 3-Person Household | 104 | 20.3% |
| 4+ Person Household | 81 | 15.8% |
| Total Housing Units | 512 | 100.0% |
Occupancy by Ownership by Household Size in Bainbridge
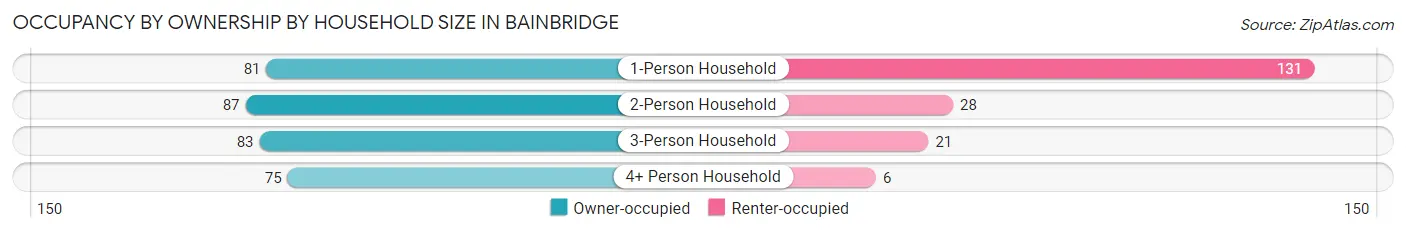
| Household Size | Owner-occupied | Renter-occupied |
| 1-Person Household | 81 (38.2%) | 131 (61.8%) |
| 2-Person Household | 87 (75.6%) | 28 (24.3%) |
| 3-Person Household | 83 (79.8%) | 21 (20.2%) |
| 4+ Person Household | 75 (92.6%) | 6 (7.4%) |
| Total Housing Units | 326 (63.7%) | 186 (36.3%) |
Occupancy by Educational Attainment in Bainbridge
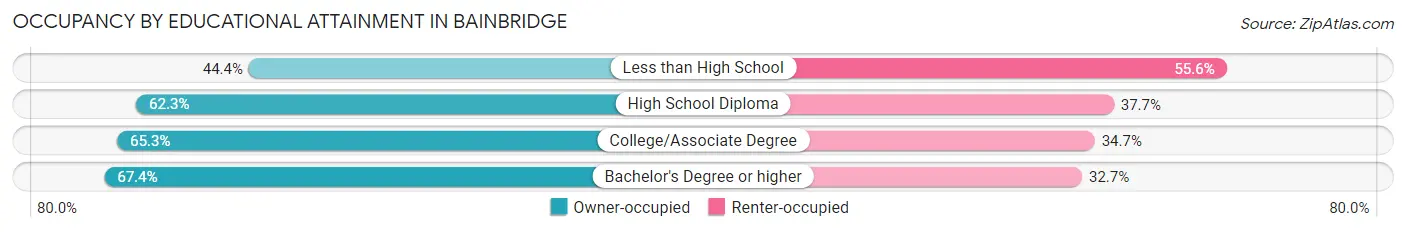
| Household Size | Owner-occupied | Renter-occupied |
| Less than High School | 16 (44.4%) | 20 (55.6%) |
| High School Diploma | 81 (62.3%) | 49 (37.7%) |
| College/Associate Degree | 130 (65.3%) | 69 (34.7%) |
| Bachelor's Degree or higher | 99 (67.3%) | 48 (32.7%) |
Occupancy by Age of Householder in Bainbridge
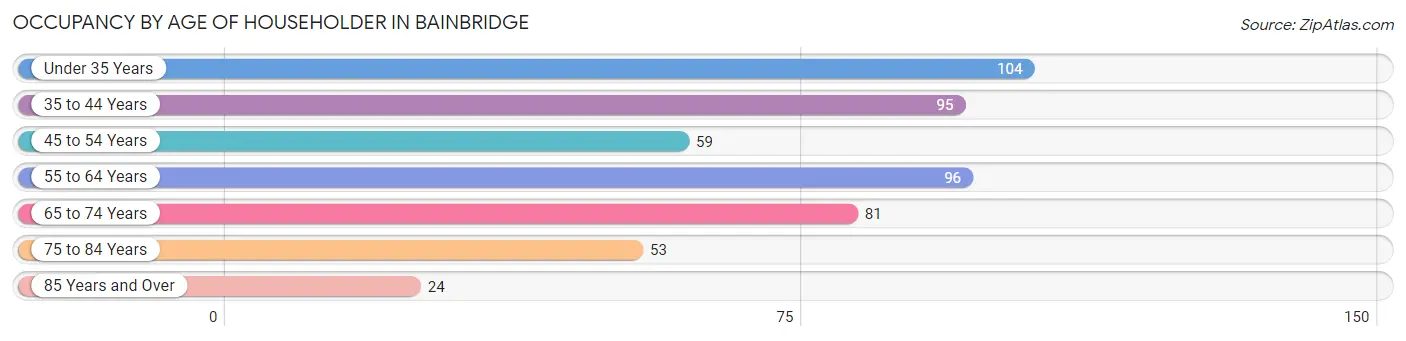
| Age Bracket | # Households | % Households |
| Under 35 Years | 104 | 20.3% |
| 35 to 44 Years | 95 | 18.5% |
| 45 to 54 Years | 59 | 11.5% |
| 55 to 64 Years | 96 | 18.8% |
| 65 to 74 Years | 81 | 15.8% |
| 75 to 84 Years | 53 | 10.3% |
| 85 Years and Over | 24 | 4.7% |
| Total | 512 | 100.0% |
Housing Finances in Bainbridge
Median Income by Occupancy in Bainbridge
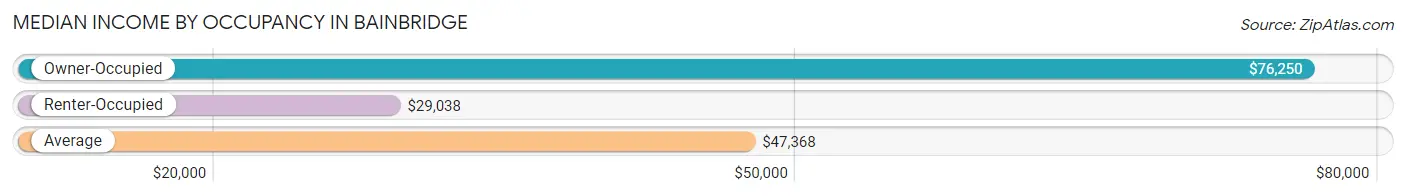
| Occupancy Type | # Households | Median Income |
| Owner-Occupied | 326 (63.7%) | $76,250 |
| Renter-Occupied | 186 (36.3%) | $29,038 |
| Average | 512 (100.0%) | $47,368 |
Occupancy by Householder Income Bracket in Bainbridge
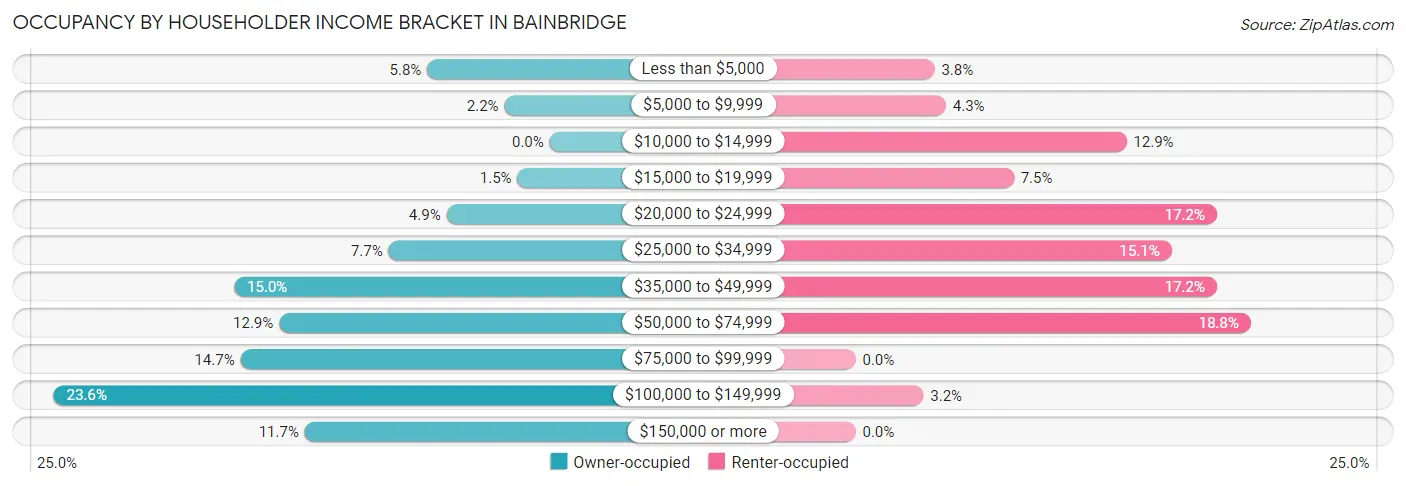
| Income Bracket | Owner-occupied | Renter-occupied |
| Less than $5,000 | 19 (5.8%) | 7 (3.8%) |
| $5,000 to $9,999 | 7 (2.1%) | 8 (4.3%) |
| $10,000 to $14,999 | 0 (0.0%) | 24 (12.9%) |
| $15,000 to $19,999 | 5 (1.5%) | 14 (7.5%) |
| $20,000 to $24,999 | 16 (4.9%) | 32 (17.2%) |
| $25,000 to $34,999 | 25 (7.7%) | 28 (15.0%) |
| $35,000 to $49,999 | 49 (15.0%) | 32 (17.2%) |
| $50,000 to $74,999 | 42 (12.9%) | 35 (18.8%) |
| $75,000 to $99,999 | 48 (14.7%) | 0 (0.0%) |
| $100,000 to $149,999 | 77 (23.6%) | 6 (3.2%) |
| $150,000 or more | 38 (11.7%) | 0 (0.0%) |
| Total | 326 (100.0%) | 186 (100.0%) |
Monthly Housing Cost Tiers in Bainbridge
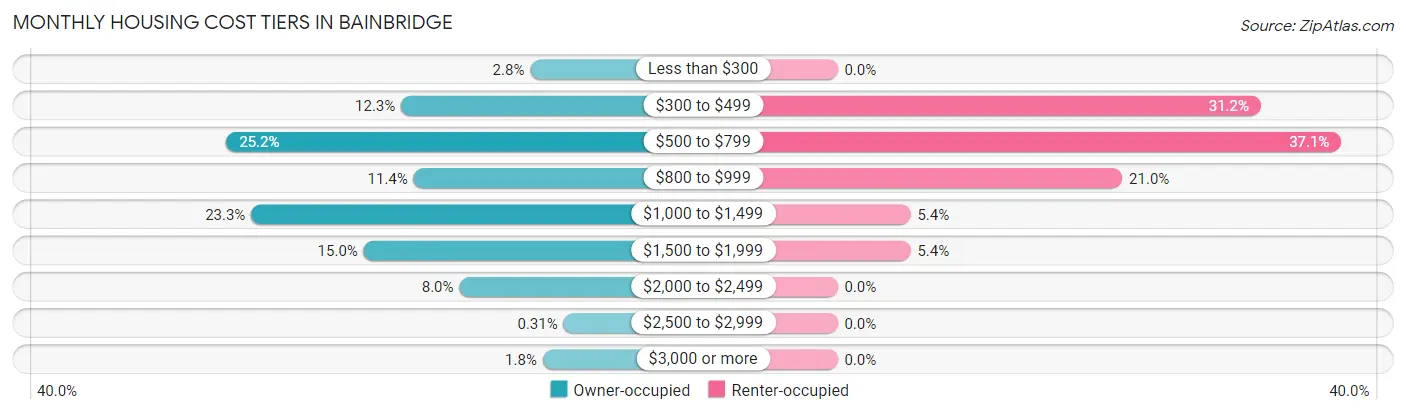
| Monthly Cost | Owner-occupied | Renter-occupied |
| Less than $300 | 9 (2.8%) | 0 (0.0%) |
| $300 to $499 | 40 (12.3%) | 58 (31.2%) |
| $500 to $799 | 82 (25.2%) | 69 (37.1%) |
| $800 to $999 | 37 (11.4%) | 39 (21.0%) |
| $1,000 to $1,499 | 76 (23.3%) | 10 (5.4%) |
| $1,500 to $1,999 | 49 (15.0%) | 10 (5.4%) |
| $2,000 to $2,499 | 26 (8.0%) | 0 (0.0%) |
| $2,500 to $2,999 | 1 (0.3%) | 0 (0.0%) |
| $3,000 or more | 6 (1.8%) | 0 (0.0%) |
| Total | 326 (100.0%) | 186 (100.0%) |
Physical Housing Characteristics in Bainbridge
Housing Structures in Bainbridge
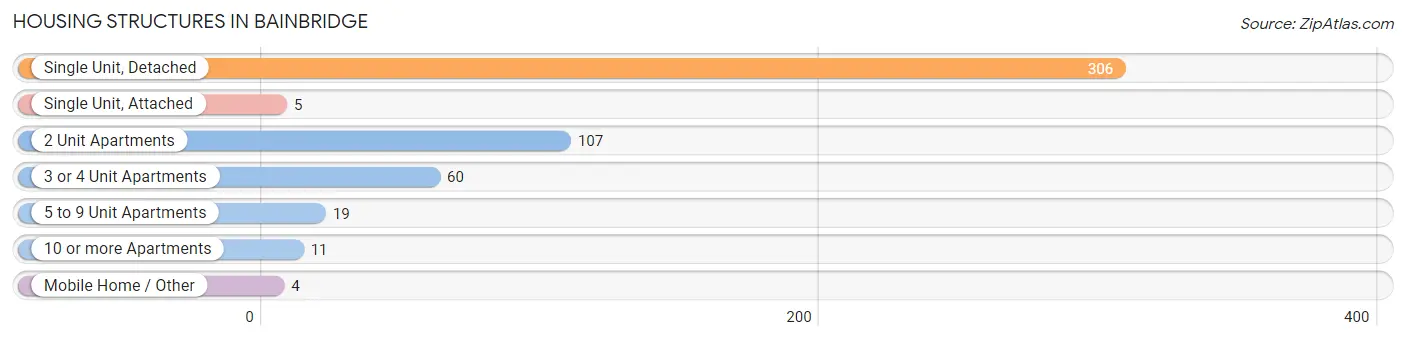
| Structure Type | # Housing Units | % Housing Units |
| Single Unit, Detached | 306 | 59.8% |
| Single Unit, Attached | 5 | 1.0% |
| 2 Unit Apartments | 107 | 20.9% |
| 3 or 4 Unit Apartments | 60 | 11.7% |
| 5 to 9 Unit Apartments | 19 | 3.7% |
| 10 or more Apartments | 11 | 2.1% |
| Mobile Home / Other | 4 | 0.8% |
| Total | 512 | 100.0% |
Housing Structures by Occupancy in Bainbridge
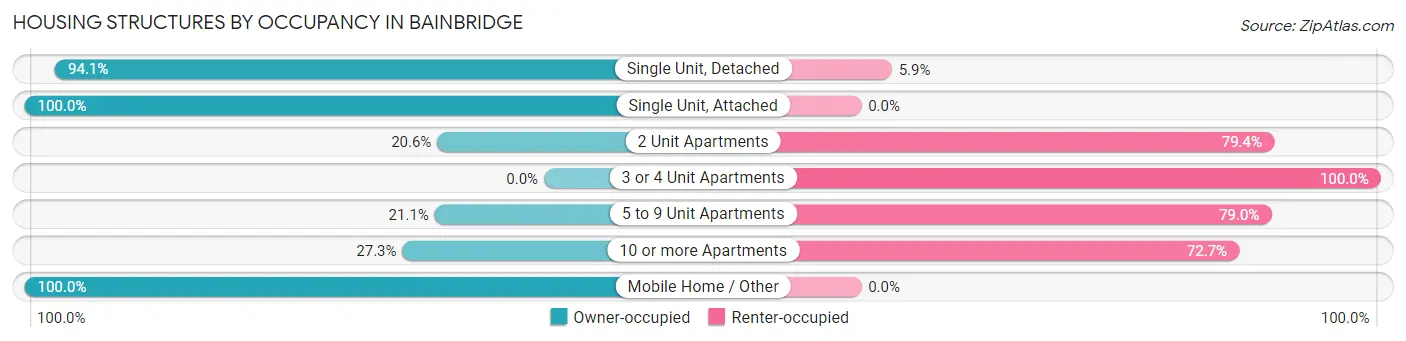
| Structure Type | Owner-occupied | Renter-occupied |
| Single Unit, Detached | 288 (94.1%) | 18 (5.9%) |
| Single Unit, Attached | 5 (100.0%) | 0 (0.0%) |
| 2 Unit Apartments | 22 (20.6%) | 85 (79.4%) |
| 3 or 4 Unit Apartments | 0 (0.0%) | 60 (100.0%) |
| 5 to 9 Unit Apartments | 4 (21.0%) | 15 (78.9%) |
| 10 or more Apartments | 3 (27.3%) | 8 (72.7%) |
| Mobile Home / Other | 4 (100.0%) | 0 (0.0%) |
| Total | 326 (63.7%) | 186 (36.3%) |
Housing Structures by Number of Rooms in Bainbridge
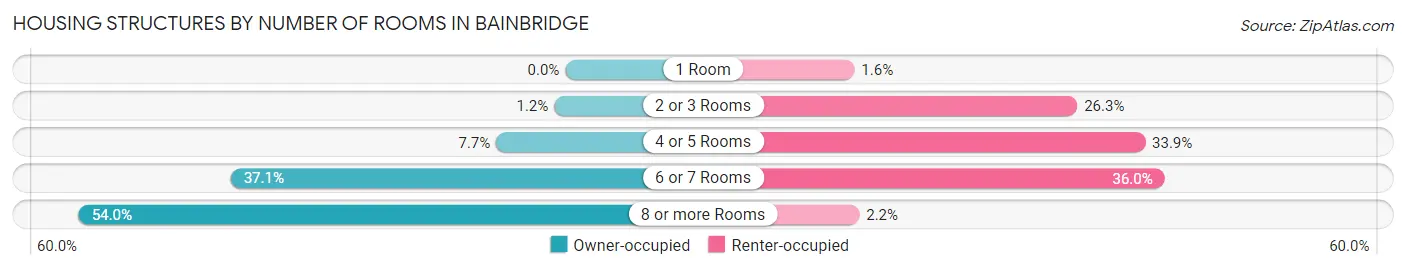
| Number of Rooms | Owner-occupied | Renter-occupied |
| 1 Room | 0 (0.0%) | 3 (1.6%) |
| 2 or 3 Rooms | 4 (1.2%) | 49 (26.3%) |
| 4 or 5 Rooms | 25 (7.7%) | 63 (33.9%) |
| 6 or 7 Rooms | 121 (37.1%) | 67 (36.0%) |
| 8 or more Rooms | 176 (54.0%) | 4 (2.1%) |
| Total | 326 (100.0%) | 186 (100.0%) |
Housing Structure by Heating Type in Bainbridge
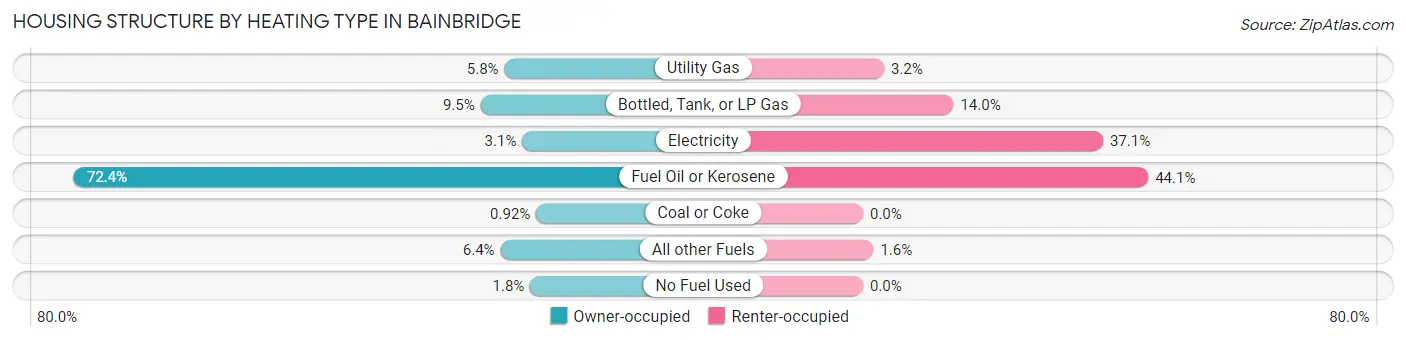
| Heating Type | Owner-occupied | Renter-occupied |
| Utility Gas | 19 (5.8%) | 6 (3.2%) |
| Bottled, Tank, or LP Gas | 31 (9.5%) | 26 (14.0%) |
| Electricity | 10 (3.1%) | 69 (37.1%) |
| Fuel Oil or Kerosene | 236 (72.4%) | 82 (44.1%) |
| Coal or Coke | 3 (0.9%) | 0 (0.0%) |
| All other Fuels | 21 (6.4%) | 3 (1.6%) |
| No Fuel Used | 6 (1.8%) | 0 (0.0%) |
| Total | 326 (100.0%) | 186 (100.0%) |
Household Vehicle Usage in Bainbridge
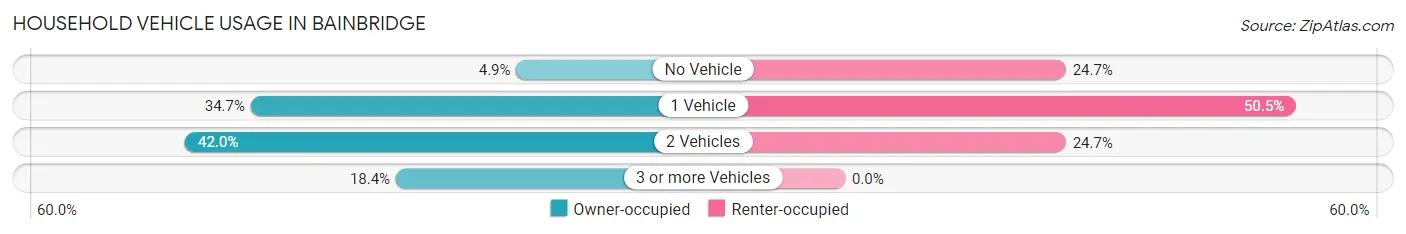
| Vehicles per Household | Owner-occupied | Renter-occupied |
| No Vehicle | 16 (4.9%) | 46 (24.7%) |
| 1 Vehicle | 113 (34.7%) | 94 (50.5%) |
| 2 Vehicles | 137 (42.0%) | 46 (24.7%) |
| 3 or more Vehicles | 60 (18.4%) | 0 (0.0%) |
| Total | 326 (100.0%) | 186 (100.0%) |
Real Estate & Mortgages in Bainbridge
Real Estate and Mortgage Overview in Bainbridge
| Characteristic | Without Mortgage | With Mortgage |
| Housing Units | 157 | 169 |
| Median Property Value | $124,700 | $113,800 |
| Median Household Income | $62,083 | $29 |
| Monthly Housing Costs | $627 | $6 |
| Real Estate Taxes | $3,188 | $7 |
Property Value by Mortgage Status in Bainbridge
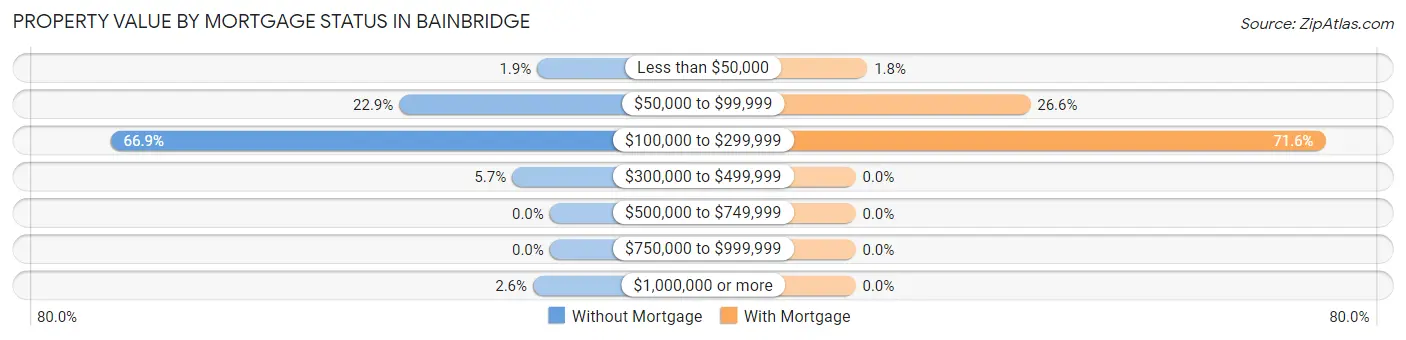
| Property Value | Without Mortgage | With Mortgage |
| Less than $50,000 | 3 (1.9%) | 3 (1.8%) |
| $50,000 to $99,999 | 36 (22.9%) | 45 (26.6%) |
| $100,000 to $299,999 | 105 (66.9%) | 121 (71.6%) |
| $300,000 to $499,999 | 9 (5.7%) | 0 (0.0%) |
| $500,000 to $749,999 | 0 (0.0%) | 0 (0.0%) |
| $750,000 to $999,999 | 0 (0.0%) | 0 (0.0%) |
| $1,000,000 or more | 4 (2.5%) | 0 (0.0%) |
| Total | 157 (100.0%) | 169 (100.0%) |
Household Income by Mortgage Status in Bainbridge
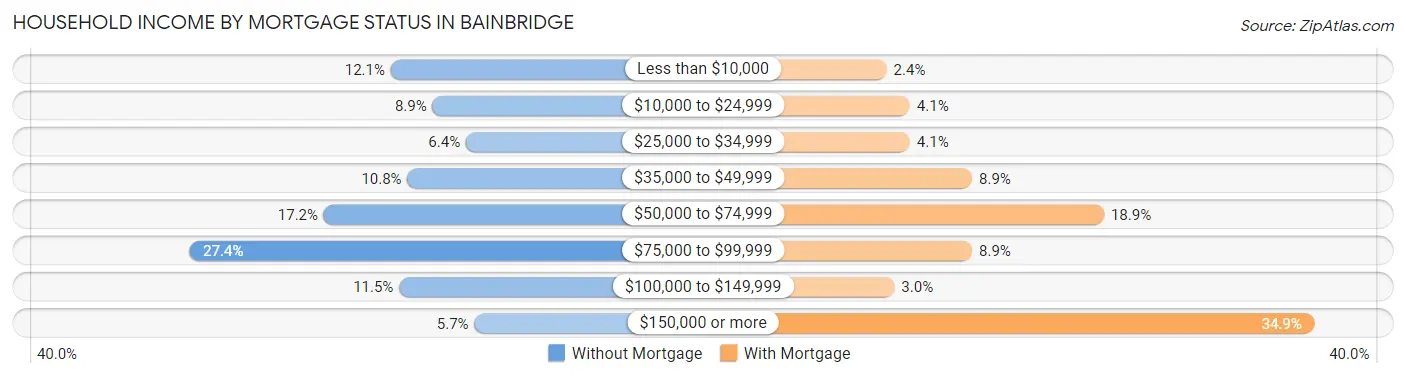
| Household Income | Without Mortgage | With Mortgage |
| Less than $10,000 | 19 (12.1%) | 4 (2.4%) |
| $10,000 to $24,999 | 14 (8.9%) | 7 (4.1%) |
| $25,000 to $34,999 | 10 (6.4%) | 7 (4.1%) |
| $35,000 to $49,999 | 17 (10.8%) | 15 (8.9%) |
| $50,000 to $74,999 | 27 (17.2%) | 32 (18.9%) |
| $75,000 to $99,999 | 43 (27.4%) | 15 (8.9%) |
| $100,000 to $149,999 | 18 (11.5%) | 5 (3.0%) |
| $150,000 or more | 9 (5.7%) | 59 (34.9%) |
| Total | 157 (100.0%) | 169 (100.0%) |
Property Value to Household Income Ratio in Bainbridge
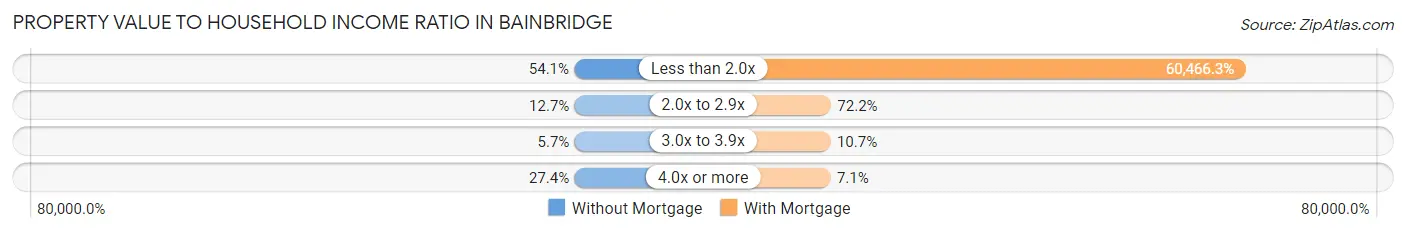
| Value-to-Income Ratio | Without Mortgage | With Mortgage |
| Less than 2.0x | 85 (54.1%) | 102,188 (60,466.3%) |
| 2.0x to 2.9x | 20 (12.7%) | 122 (72.2%) |
| 3.0x to 3.9x | 9 (5.7%) | 18 (10.6%) |
| 4.0x or more | 43 (27.4%) | 12 (7.1%) |
| Total | 157 (100.0%) | 169 (100.0%) |
Real Estate Taxes by Mortgage Status in Bainbridge
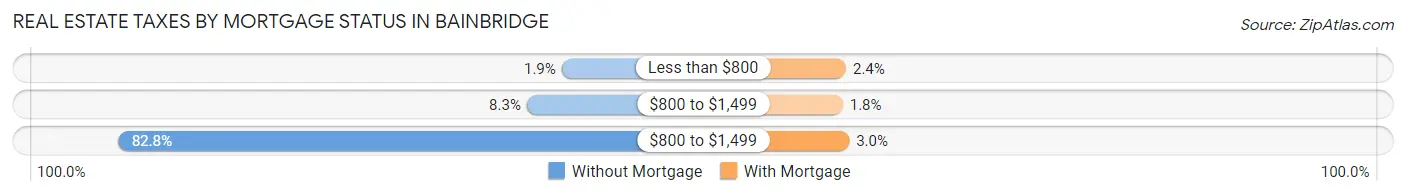
| Property Taxes | Without Mortgage | With Mortgage |
| Less than $800 | 3 (1.9%) | 4 (2.4%) |
| $800 to $1,499 | 13 (8.3%) | 3 (1.8%) |
| $800 to $1,499 | 130 (82.8%) | 5 (3.0%) |
| Total | 157 (100.0%) | 169 (100.0%) |
Health & Disability in Bainbridge
Health Insurance Coverage by Age in Bainbridge
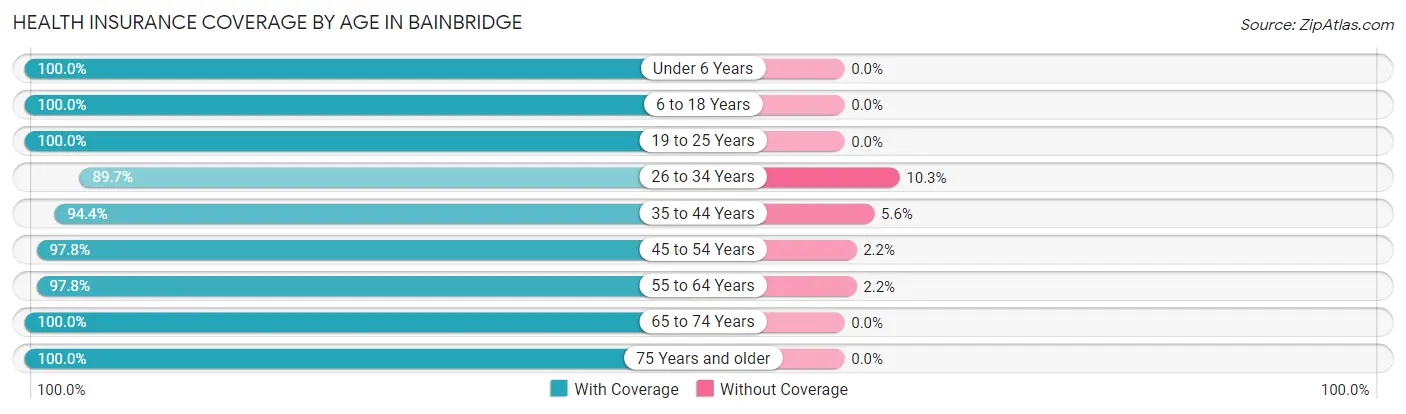
| Age Bracket | With Coverage | Without Coverage |
| Under 6 Years | 54 (100.0%) | 0 (0.0%) |
| 6 to 18 Years | 223 (100.0%) | 0 (0.0%) |
| 19 to 25 Years | 80 (100.0%) | 0 (0.0%) |
| 26 to 34 Years | 131 (89.7%) | 15 (10.3%) |
| 35 to 44 Years | 170 (94.4%) | 10 (5.6%) |
| 45 to 54 Years | 88 (97.8%) | 2 (2.2%) |
| 55 to 64 Years | 131 (97.8%) | 3 (2.2%) |
| 65 to 74 Years | 121 (100.0%) | 0 (0.0%) |
| 75 Years and older | 97 (100.0%) | 0 (0.0%) |
| Total | 1,095 (97.3%) | 30 (2.7%) |
Health Insurance Coverage by Citizenship Status in Bainbridge
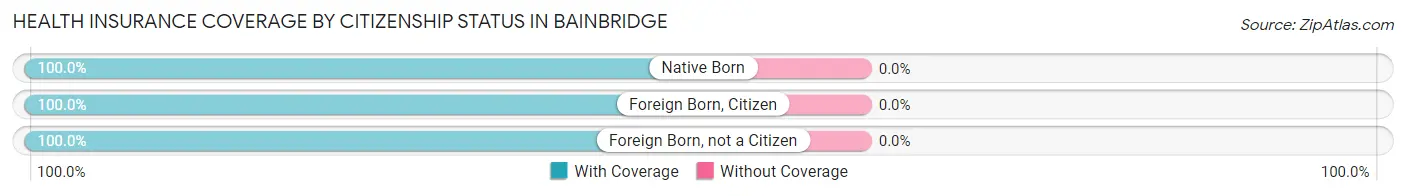
| Citizenship Status | With Coverage | Without Coverage |
| Native Born | 54 (100.0%) | 0 (0.0%) |
| Foreign Born, Citizen | 223 (100.0%) | 0 (0.0%) |
| Foreign Born, not a Citizen | 80 (100.0%) | 0 (0.0%) |
Health Insurance Coverage by Household Income in Bainbridge
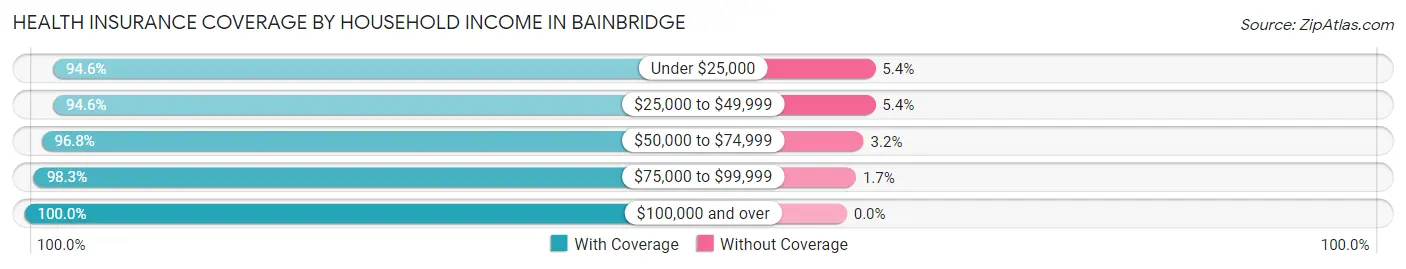
| Household Income | With Coverage | Without Coverage |
| Under $25,000 | 159 (94.6%) | 9 (5.4%) |
| $25,000 to $49,999 | 247 (94.6%) | 14 (5.4%) |
| $50,000 to $74,999 | 153 (96.8%) | 5 (3.2%) |
| $75,000 to $99,999 | 114 (98.3%) | 2 (1.7%) |
| $100,000 and over | 422 (100.0%) | 0 (0.0%) |
Public vs Private Health Insurance Coverage by Age in Bainbridge
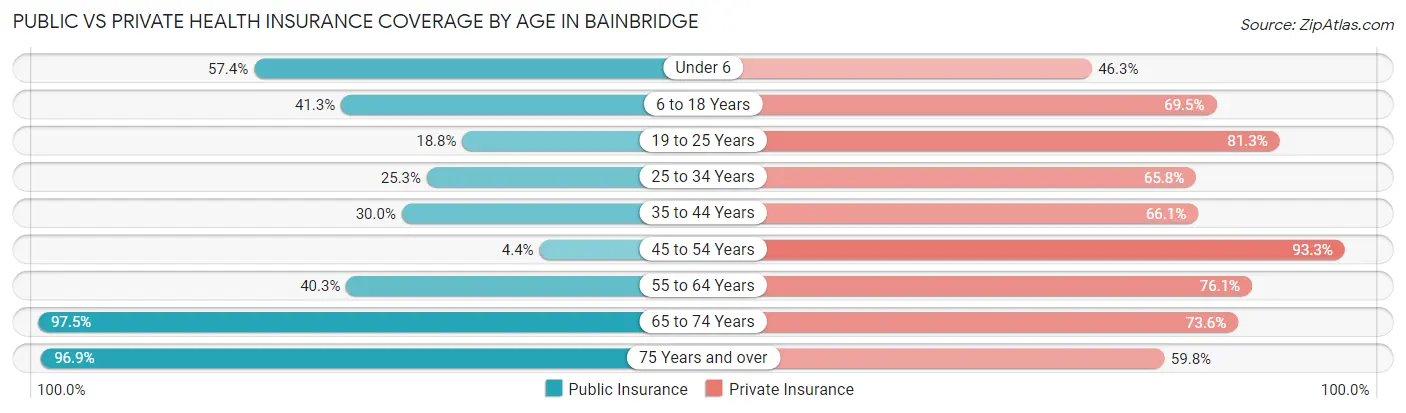
| Age Bracket | Public Insurance | Private Insurance |
| Under 6 | 31 (57.4%) | 25 (46.3%) |
| 6 to 18 Years | 92 (41.3%) | 155 (69.5%) |
| 19 to 25 Years | 15 (18.8%) | 65 (81.2%) |
| 25 to 34 Years | 37 (25.3%) | 96 (65.7%) |
| 35 to 44 Years | 54 (30.0%) | 119 (66.1%) |
| 45 to 54 Years | 4 (4.4%) | 84 (93.3%) |
| 55 to 64 Years | 54 (40.3%) | 102 (76.1%) |
| 65 to 74 Years | 118 (97.5%) | 89 (73.6%) |
| 75 Years and over | 94 (96.9%) | 58 (59.8%) |
| Total | 499 (44.4%) | 793 (70.5%) |
Disability Status by Sex by Age in Bainbridge
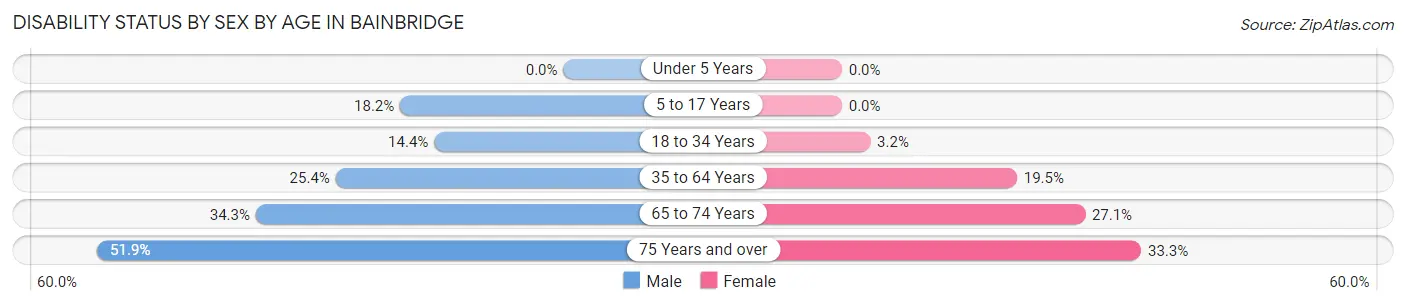
| Age Bracket | Male | Female |
| Under 5 Years | 0 (0.0%) | 0 (0.0%) |
| 5 to 17 Years | 18 (18.2%) | 0 (0.0%) |
| 18 to 34 Years | 19 (14.4%) | 3 (3.2%) |
| 35 to 64 Years | 53 (25.4%) | 38 (19.5%) |
| 65 to 74 Years | 25 (34.3%) | 13 (27.1%) |
| 75 Years and over | 27 (51.9%) | 15 (33.3%) |
Disability Class by Sex by Age in Bainbridge
Disability Class: Hearing Difficulty
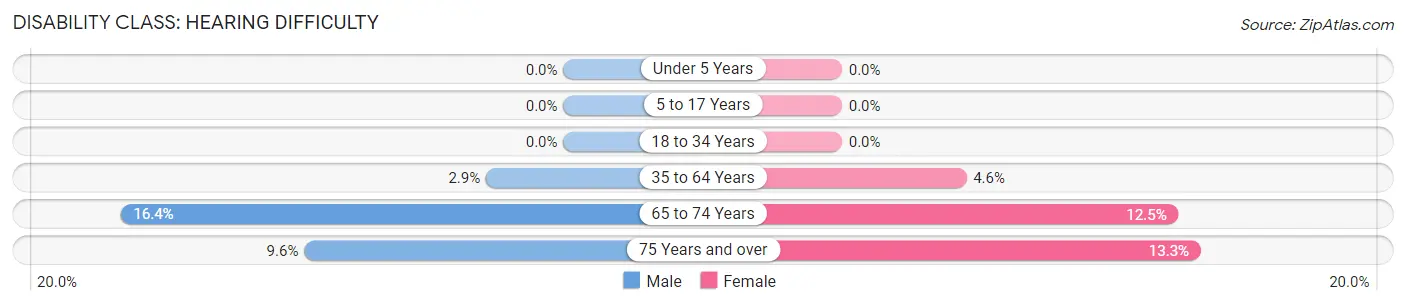
| Age Bracket | Male | Female |
| Under 5 Years | 0 (0.0%) | 0 (0.0%) |
| 5 to 17 Years | 0 (0.0%) | 0 (0.0%) |
| 18 to 34 Years | 0 (0.0%) | 0 (0.0%) |
| 35 to 64 Years | 6 (2.9%) | 9 (4.6%) |
| 65 to 74 Years | 12 (16.4%) | 6 (12.5%) |
| 75 Years and over | 5 (9.6%) | 6 (13.3%) |
Disability Class: Vision Difficulty
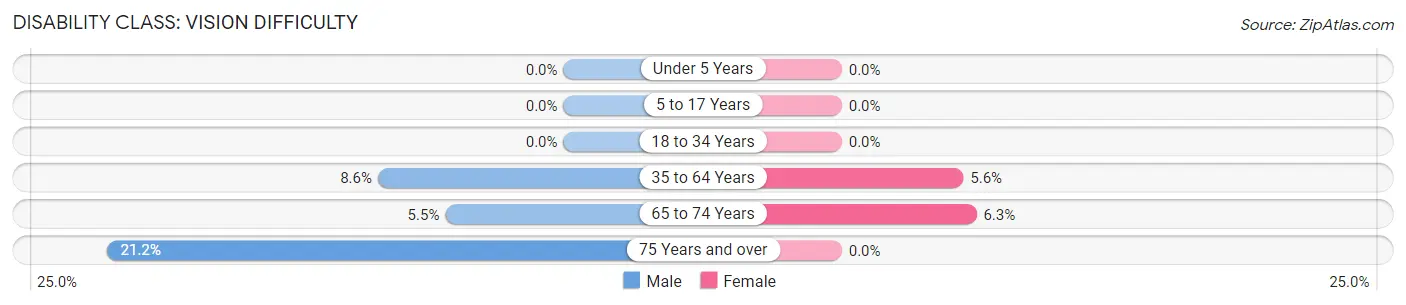
| Age Bracket | Male | Female |
| Under 5 Years | 0 (0.0%) | 0 (0.0%) |
| 5 to 17 Years | 0 (0.0%) | 0 (0.0%) |
| 18 to 34 Years | 0 (0.0%) | 0 (0.0%) |
| 35 to 64 Years | 18 (8.6%) | 11 (5.6%) |
| 65 to 74 Years | 4 (5.5%) | 3 (6.2%) |
| 75 Years and over | 11 (21.1%) | 0 (0.0%) |
Disability Class: Cognitive Difficulty
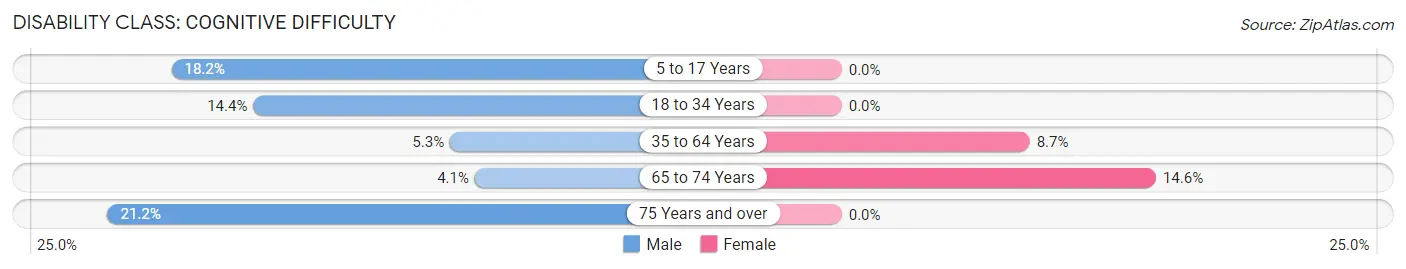
| Age Bracket | Male | Female |
| 5 to 17 Years | 18 (18.2%) | 0 (0.0%) |
| 18 to 34 Years | 19 (14.4%) | 0 (0.0%) |
| 35 to 64 Years | 11 (5.3%) | 17 (8.7%) |
| 65 to 74 Years | 3 (4.1%) | 7 (14.6%) |
| 75 Years and over | 11 (21.1%) | 0 (0.0%) |
Disability Class: Ambulatory Difficulty
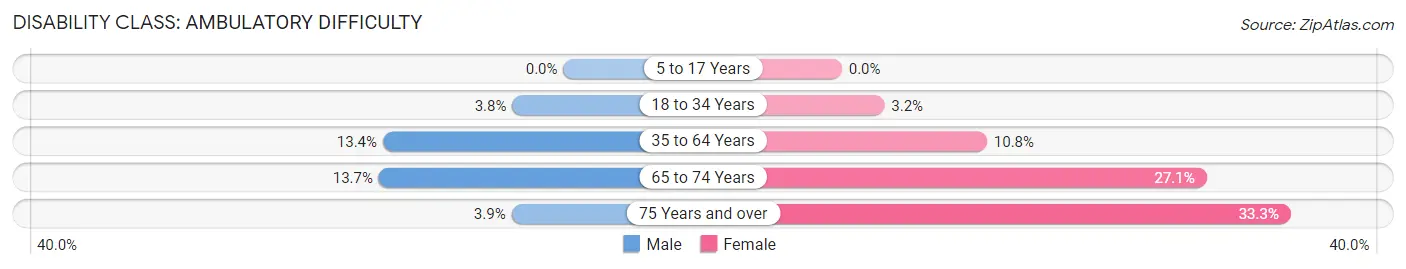
| Age Bracket | Male | Female |
| 5 to 17 Years | 0 (0.0%) | 0 (0.0%) |
| 18 to 34 Years | 5 (3.8%) | 3 (3.2%) |
| 35 to 64 Years | 28 (13.4%) | 21 (10.8%) |
| 65 to 74 Years | 10 (13.7%) | 13 (27.1%) |
| 75 Years and over | 2 (3.8%) | 15 (33.3%) |
Disability Class: Self-Care Difficulty
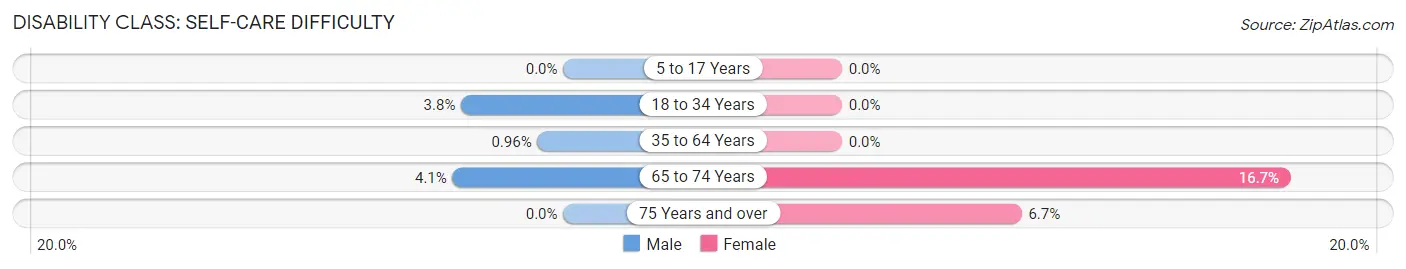
| Age Bracket | Male | Female |
| 5 to 17 Years | 0 (0.0%) | 0 (0.0%) |
| 18 to 34 Years | 5 (3.8%) | 0 (0.0%) |
| 35 to 64 Years | 2 (1.0%) | 0 (0.0%) |
| 65 to 74 Years | 3 (4.1%) | 8 (16.7%) |
| 75 Years and over | 0 (0.0%) | 3 (6.7%) |
Technology Access in Bainbridge
Computing Device Access in Bainbridge
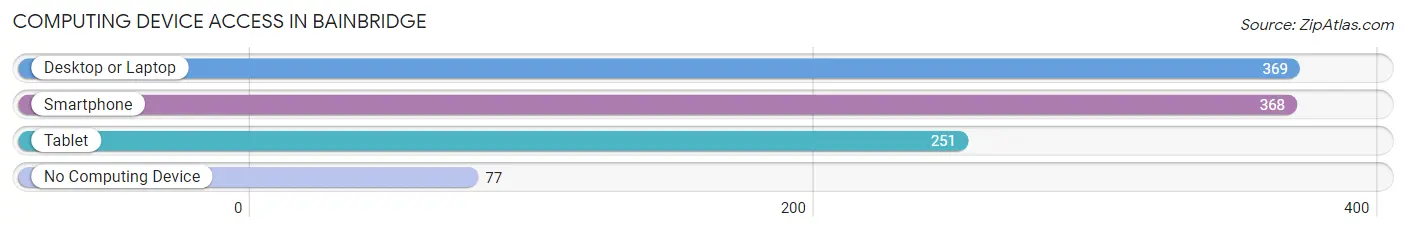
| Device Type | # Households | % Households |
| Desktop or Laptop | 369 | 72.1% |
| Smartphone | 368 | 71.9% |
| Tablet | 251 | 49.0% |
| No Computing Device | 77 | 15.0% |
| Total | 512 | 100.0% |
Internet Access in Bainbridge
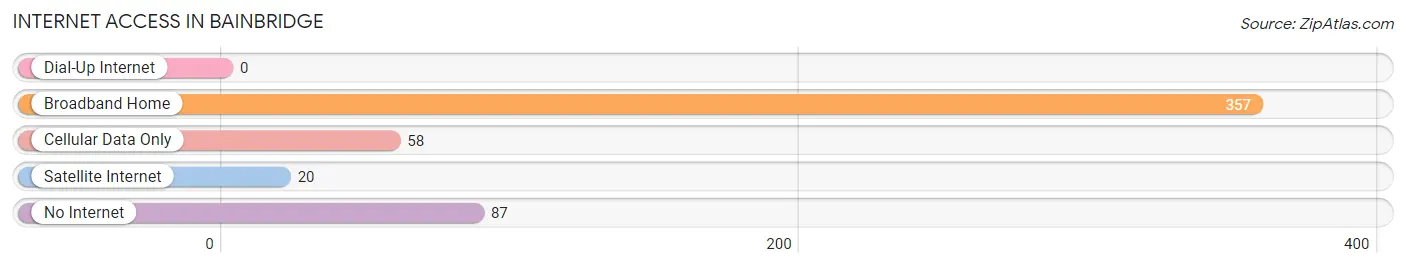
| Internet Type | # Households | % Households |
| Dial-Up Internet | 0 | 0.0% |
| Broadband Home | 357 | 69.7% |
| Cellular Data Only | 58 | 11.3% |
| Satellite Internet | 20 | 3.9% |
| No Internet | 87 | 17.0% |
| Total | 512 | 100.0% |
Bainbridge Summary
Bainbridge is a small town located in Chenango County, New York, United States. The town is situated in the south-central part of the county, and is bordered by the towns of Coventry to the north, Afton to the east, and Colesville to the south. The population of Bainbridge was 2,845 at the 2010 census.
History
The area that is now Bainbridge was first settled in 1791 by a group of settlers from Connecticut. The town was originally known as "New Concord" and was part of the Town of Coventry. In 1807, the town was renamed "Bainbridge" after Commodore William Bainbridge, a hero of the War of 1812.
The town of Bainbridge was officially established in 1819. The first town meeting was held in 1820, and the first town officers were elected. The town grew slowly over the next few decades, and by the mid-1800s, it had become a thriving agricultural community.
Geography
Bainbridge is located in the south-central part of Chenango County, and is bordered by the towns of Coventry to the north, Afton to the east, and Colesville to the south. The town is situated on the western edge of the Finger Lakes region, and is home to several small lakes, including Lake Oquaga, Lake Como, and Lake Wawaka.
The town of Bainbridge is located in the Chenango Valley, and is surrounded by rolling hills and farmland. The town is home to several small villages, including Bainbridge, East Bainbridge, and West Bainbridge.
Economy
The economy of Bainbridge is largely based on agriculture. The town is home to several small farms, and the surrounding area is known for its dairy and livestock production. The town is also home to several small businesses, including a few restaurants, a grocery store, and a few retail stores.
The town is also home to several small manufacturing companies, including a furniture factory, a plastics factory, and a metal fabrication plant. The town is also home to a few small technology companies, including a software development firm and a web design firm.
Demographics
As of the 2010 census, the population of Bainbridge was 2,845. The racial makeup of the town was 97.3% White, 0.7% African American, 0.3% Native American, 0.3% Asian, 0.1% Pacific Islander, 0.3% from other races, and 1.0% from two or more races. Hispanic or Latino of any race were 1.3% of the population.
The median household income in Bainbridge was $45,938, and the median family income was $51,938. The per capita income for the town was $20,938. About 8.3% of families and 10.3% of the population were below the poverty line, including 14.3% of those under age 18 and 5.3% of those age 65 or over.
Common Questions
What is the Total Population of Bainbridge?
Total Population of Bainbridge is 1,125.
What is the Total Male Population of Bainbridge?
Total Male Population of Bainbridge is 580.
What is the Total Female Population of Bainbridge?
Total Female Population of Bainbridge is 545.
What is the Ratio of Males per 100 Females in Bainbridge?
There are 106.42 Males per 100 Females in Bainbridge.
What is the Ratio of Females per 100 Males in Bainbridge?
There are 93.97 Females per 100 Males in Bainbridge.
What is the Median Population Age in Bainbridge?
Median Population Age in Bainbridge is 37.0 Years.
What is the Average Family Size in Bainbridge
Average Family Size in Bainbridge is 3.0 People.
What is the Average Household Size in Bainbridge
Average Household Size in Bainbridge is 2.2 People.
What is Per Capita Income in Bainbridge?
Per Capita income in Bainbridge is $29,624.
What is the Median Family Income in Bainbridge?
Median Family Income in Bainbridge is $80,000.
What is the Median Household income in Bainbridge?
Median Household Income in Bainbridge is $47,368.
What is Income or Wage Gap in Bainbridge?
Income or Wage Gap in Bainbridge is 18.9%.
Women in Bainbridge earn 81.1 cents for every dollar earned by a man.
What is Inequality or Gini Index in Bainbridge?
Inequality or Gini Index in Bainbridge is 0.43.
How Large is the Labor Force in Bainbridge?
There are 555 People in the Labor Forcein in Bainbridge.
What is the Percentage of People in the Labor Force in Bainbridge?
62.2% of People are in the Labor Force in Bainbridge.
What is the Unemployment Rate in Bainbridge?
Unemployment Rate in Bainbridge is 7.4%.