Arcade, NY
Arcade Map
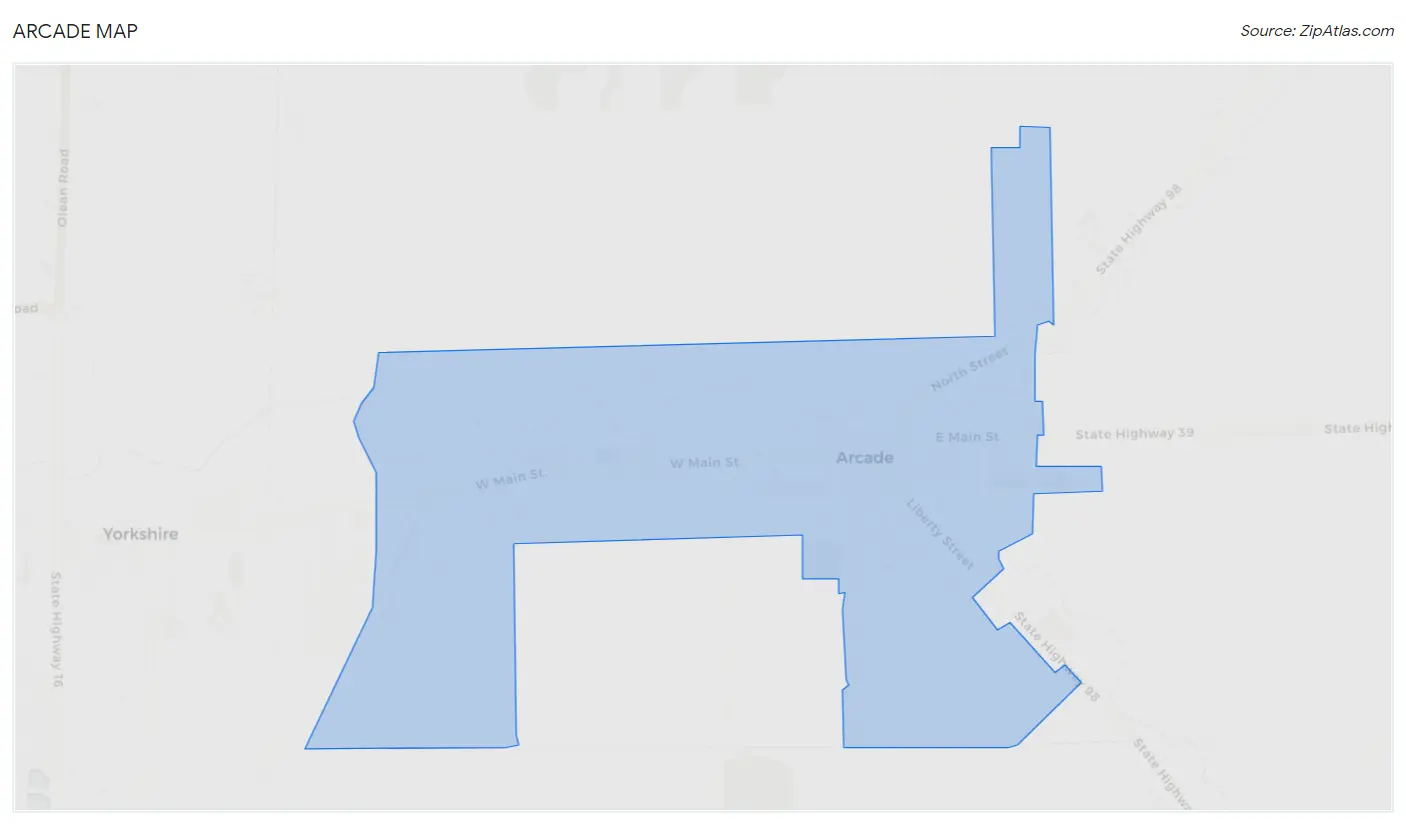
Arcade Overview
2,095
TOTAL POPULATION
1,029
MALE POPULATION
1,066
FEMALE POPULATION
96.53
MALES / 100 FEMALES
103.60
FEMALES / 100 MALES
39.4
MEDIAN AGE
2.7
AVG FAMILY SIZE
2.0
AVG HOUSEHOLD SIZE
$38,065
PER CAPITA INCOME
$94,338
AVG FAMILY INCOME
$58,900
AVG HOUSEHOLD INCOME
35.5%
WAGE / INCOME GAP [ % ]
64.5¢/ $1
WAGE / INCOME GAP [ $ ]
$13,000
FAMILY INCOME DEFICIT
0.44
INEQUALITY / GINI INDEX
1,191
LABOR FORCE [ PEOPLE ]
69.1%
PERCENT IN LABOR FORCE
5.5%
UNEMPLOYMENT RATE
Arcade Zip Codes
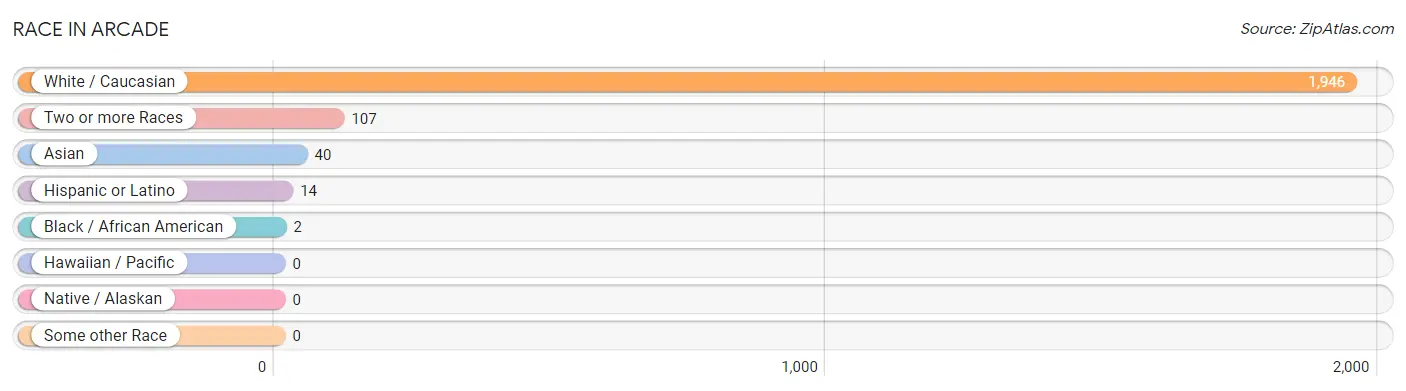
Race in Arcade
The most populous races in Arcade are White / Caucasian (1,946 | 92.9%), Two or more Races (107 | 5.1%), and Asian (40 | 1.9%).
| Race | # Population | % Population |
| Asian | 40 | 1.9% |
| Black / African American | 2 | 0.1% |
| Hawaiian / Pacific | 0 | 0.0% |
| Hispanic or Latino | 14 | 0.7% |
| Native / Alaskan | 0 | 0.0% |
| White / Caucasian | 1,946 | 92.9% |
| Two or more Races | 107 | 5.1% |
| Some other Race | 0 | 0.0% |
| Total | 2,095 | 100.0% |
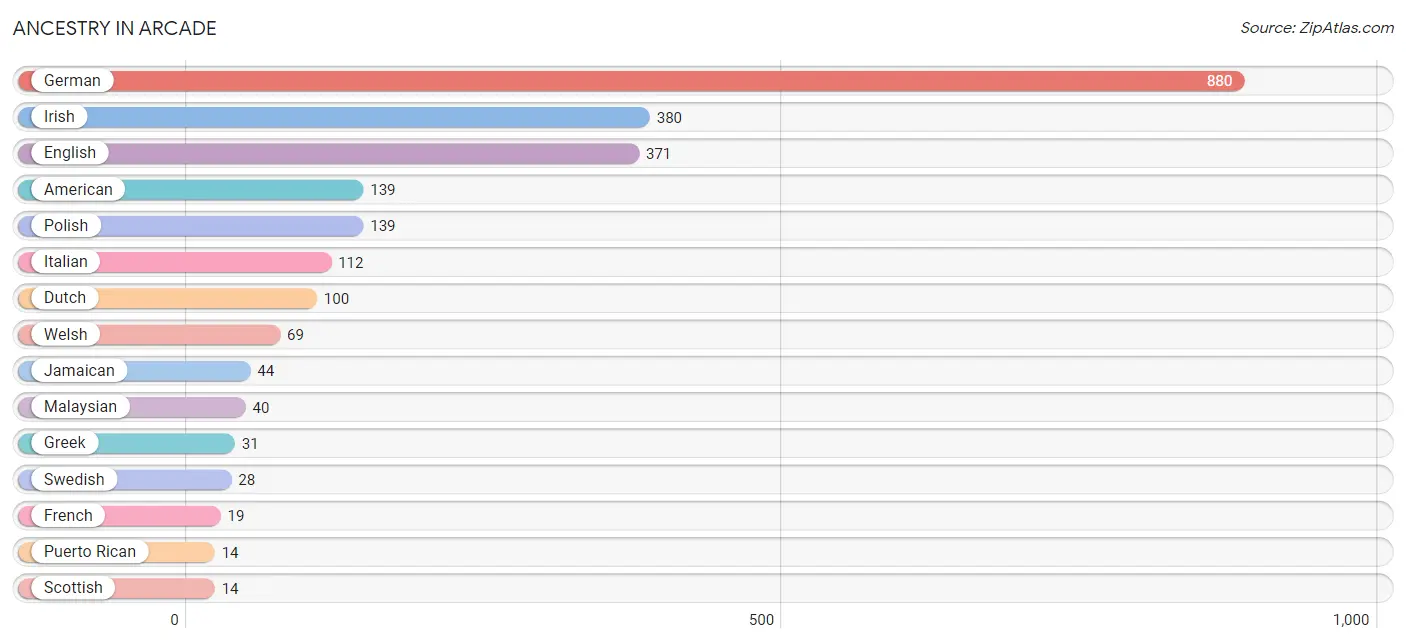
Ancestry in Arcade
The most populous ancestries reported in Arcade are German (880 | 42.0%), Irish (380 | 18.1%), English (371 | 17.7%), American (139 | 6.6%), and Polish (139 | 6.6%), together accounting for 91.1% of all Arcade residents.
| Ancestry | # Population | % Population |
| American | 139 | 6.6% |
| Belgian | 4 | 0.2% |
| Canadian | 4 | 0.2% |
| Danish | 6 | 0.3% |
| Dutch | 100 | 4.8% |
| Eastern European | 5 | 0.2% |
| English | 371 | 17.7% |
| French | 19 | 0.9% |
| French Canadian | 5 | 0.2% |
| German | 880 | 42.0% |
| Greek | 31 | 1.5% |
| Hungarian | 9 | 0.4% |
| Irish | 380 | 18.1% |
| Italian | 112 | 5.3% |
| Jamaican | 44 | 2.1% |
| Malaysian | 40 | 1.9% |
| Norwegian | 5 | 0.2% |
| Polish | 139 | 6.6% |
| Puerto Rican | 14 | 0.7% |
| Scandinavian | 13 | 0.6% |
| Scotch-Irish | 11 | 0.5% |
| Scottish | 14 | 0.7% |
| Serbian | 4 | 0.2% |
| Slavic | 4 | 0.2% |
| Slovene | 13 | 0.6% |
| Swedish | 28 | 1.3% |
| Swiss | 10 | 0.5% |
| Ukrainian | 9 | 0.4% |
| Welsh | 69 | 3.3% | View All 29 Rows |
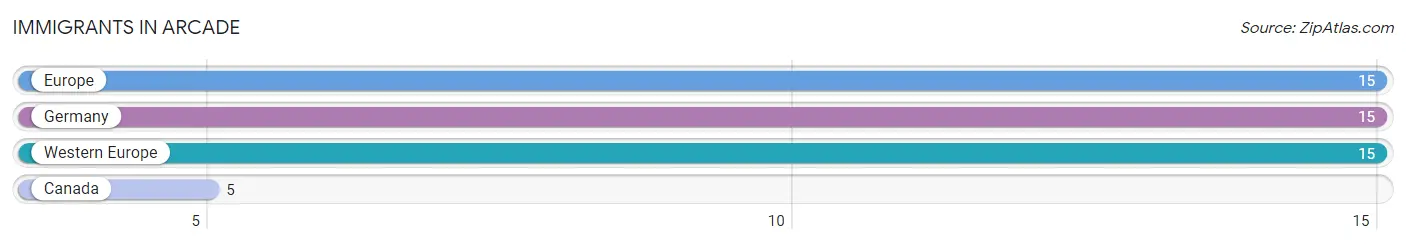
Immigrants in Arcade
The most numerous immigrant groups reported in Arcade came from Europe (15 | 0.7%), Germany (15 | 0.7%), Western Europe (15 | 0.7%), and Canada (5 | 0.2%), together accounting for 2.4% of all Arcade residents.
| Immigration Origin | # Population | % Population |
| Canada | 5 | 0.2% |
| Europe | 15 | 0.7% |
| Germany | 15 | 0.7% |
| Western Europe | 15 | 0.7% | View All 4 Rows |
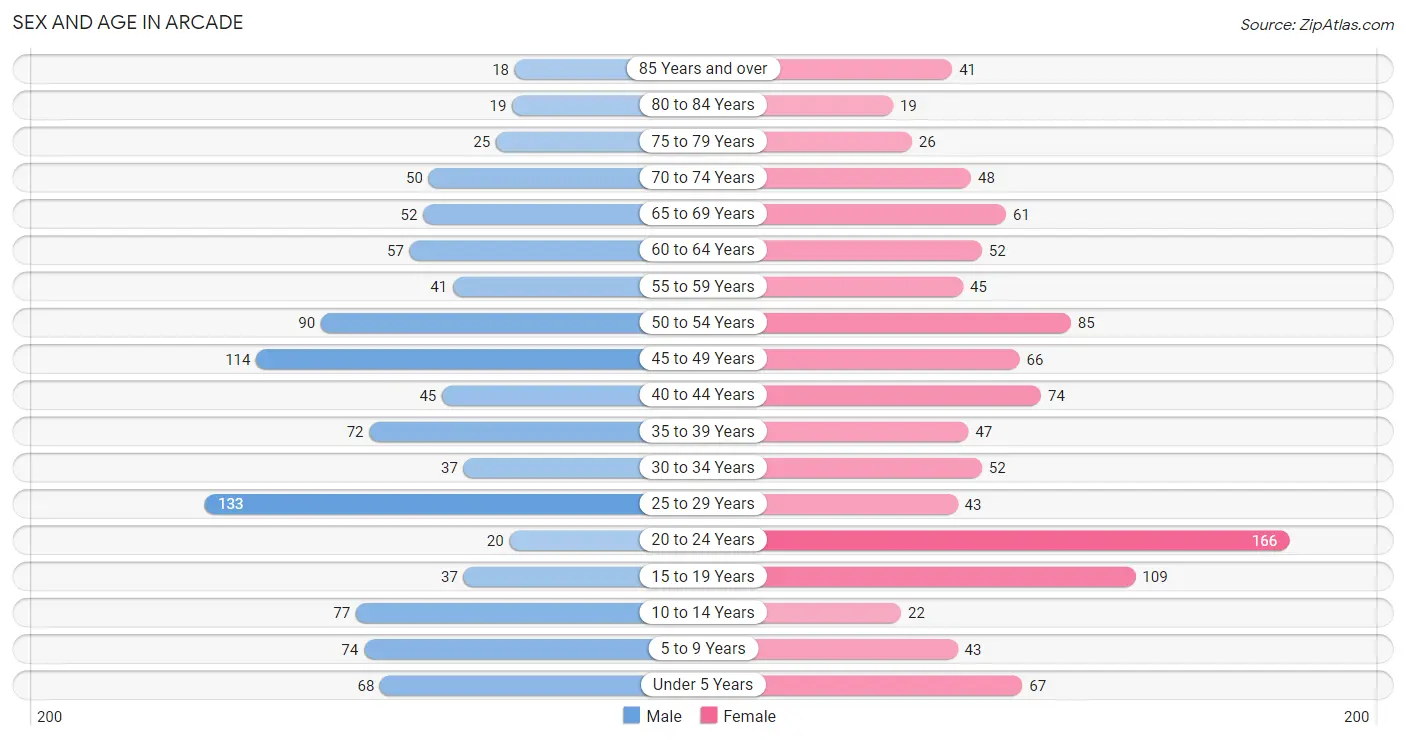
Sex and Age in Arcade
Sex and Age in Arcade
The most populous age groups in Arcade are 25 to 29 Years (133 | 12.9%) for men and 20 to 24 Years (166 | 15.6%) for women.
| Age Bracket | Male | Female |
| Under 5 Years | 68 (6.6%) | 67 (6.3%) |
| 5 to 9 Years | 74 (7.2%) | 43 (4.0%) |
| 10 to 14 Years | 77 (7.5%) | 22 (2.1%) |
| 15 to 19 Years | 37 (3.6%) | 109 (10.2%) |
| 20 to 24 Years | 20 (1.9%) | 166 (15.6%) |
| 25 to 29 Years | 133 (12.9%) | 43 (4.0%) |
| 30 to 34 Years | 37 (3.6%) | 52 (4.9%) |
| 35 to 39 Years | 72 (7.0%) | 47 (4.4%) |
| 40 to 44 Years | 45 (4.4%) | 74 (6.9%) |
| 45 to 49 Years | 114 (11.1%) | 66 (6.2%) |
| 50 to 54 Years | 90 (8.7%) | 85 (8.0%) |
| 55 to 59 Years | 41 (4.0%) | 45 (4.2%) |
| 60 to 64 Years | 57 (5.5%) | 52 (4.9%) |
| 65 to 69 Years | 52 (5.1%) | 61 (5.7%) |
| 70 to 74 Years | 50 (4.9%) | 48 (4.5%) |
| 75 to 79 Years | 25 (2.4%) | 26 (2.4%) |
| 80 to 84 Years | 19 (1.8%) | 19 (1.8%) |
| 85 Years and over | 18 (1.8%) | 41 (3.8%) |
| Total | 1,029 (100.0%) | 1,066 (100.0%) |
Families and Households in Arcade
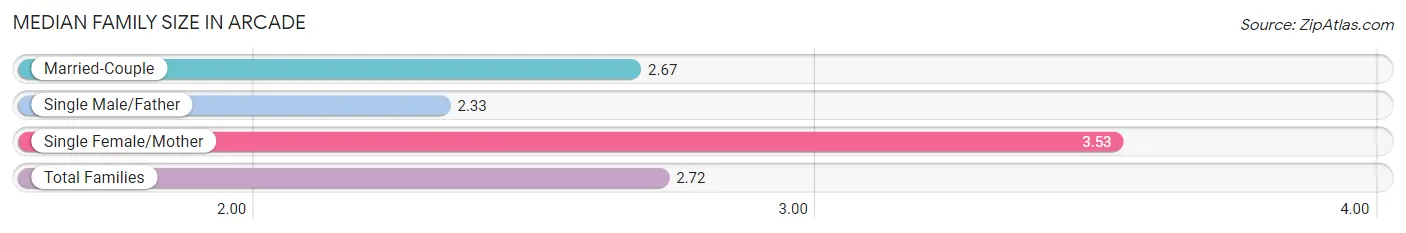
Median Family Size in Arcade
The median family size in Arcade is 2.72 persons per family, with single female/mother families (64 | 11.8%) accounting for the largest median family size of 3.53 persons per family. On the other hand, single male/father families (84 | 15.5%) represent the smallest median family size with 2.33 persons per family.
| Family Type | # Families | Family Size |
| Married-Couple | 393 (72.6%) | 2.67 |
| Single Male/Father | 84 (15.5%) | 2.33 |
| Single Female/Mother | 64 (11.8%) | 3.53 |
| Total Families | 541 (100.0%) | 2.72 |
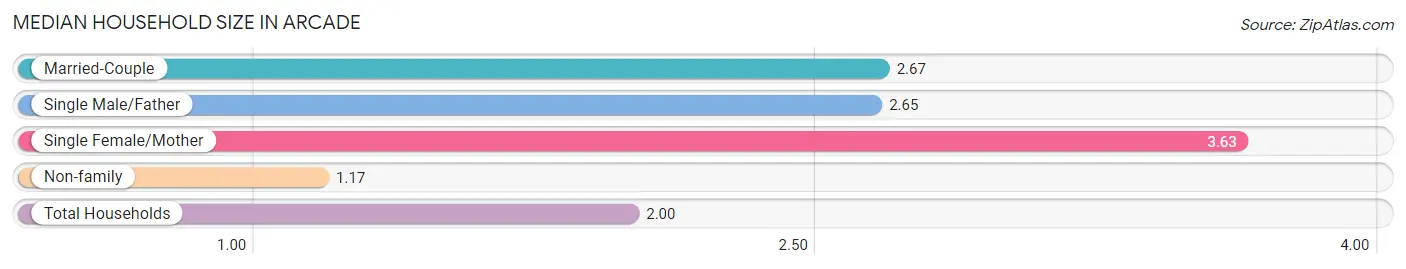
Median Household Size in Arcade
The median household size in Arcade is 2.00 persons per household, with single female/mother households (64 | 6.1%) accounting for the largest median household size of 3.63 persons per household. non-family households (501 | 48.1%) represent the smallest median household size with 1.17 persons per household.
| Household Type | # Households | Household Size |
| Married-Couple | 393 (37.7%) | 2.67 |
| Single Male/Father | 84 (8.1%) | 2.65 |
| Single Female/Mother | 64 (6.1%) | 3.63 |
| Non-family | 501 (48.1%) | 1.17 |
| Total Households | 1,042 (100.0%) | 2.00 |
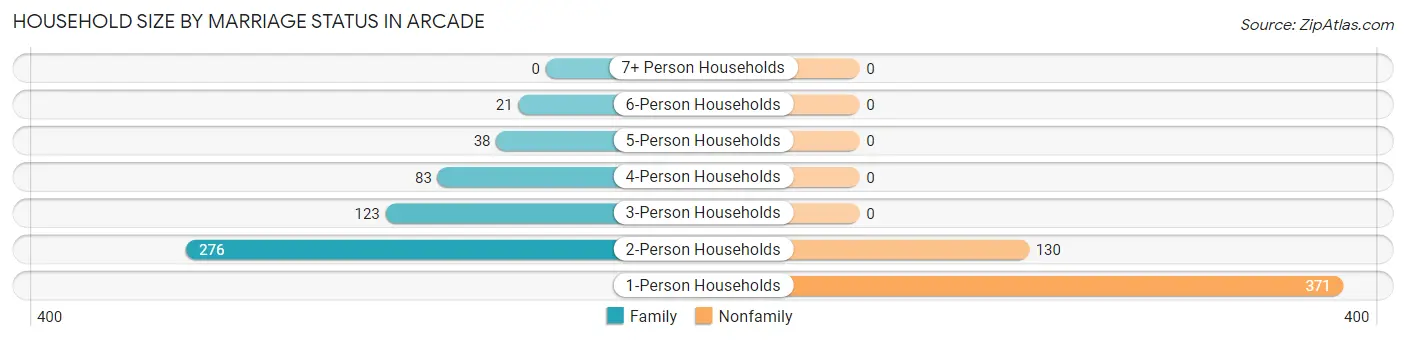
Household Size by Marriage Status in Arcade
Out of a total of 1,042 households in Arcade, 541 (51.9%) are family households, while 501 (48.1%) are nonfamily households. The most numerous type of family households are 2-person households, comprising 276, and the most common type of nonfamily households are 1-person households, comprising 371.
| Household Size | Family Households | Nonfamily Households |
| 1-Person Households | - | 371 (35.6%) |
| 2-Person Households | 276 (26.5%) | 130 (12.5%) |
| 3-Person Households | 123 (11.8%) | 0 (0.0%) |
| 4-Person Households | 83 (8.0%) | 0 (0.0%) |
| 5-Person Households | 38 (3.6%) | 0 (0.0%) |
| 6-Person Households | 21 (2.0%) | 0 (0.0%) |
| 7+ Person Households | 0 (0.0%) | 0 (0.0%) |
| Total | 541 (51.9%) | 501 (48.1%) |
Female Fertility in Arcade
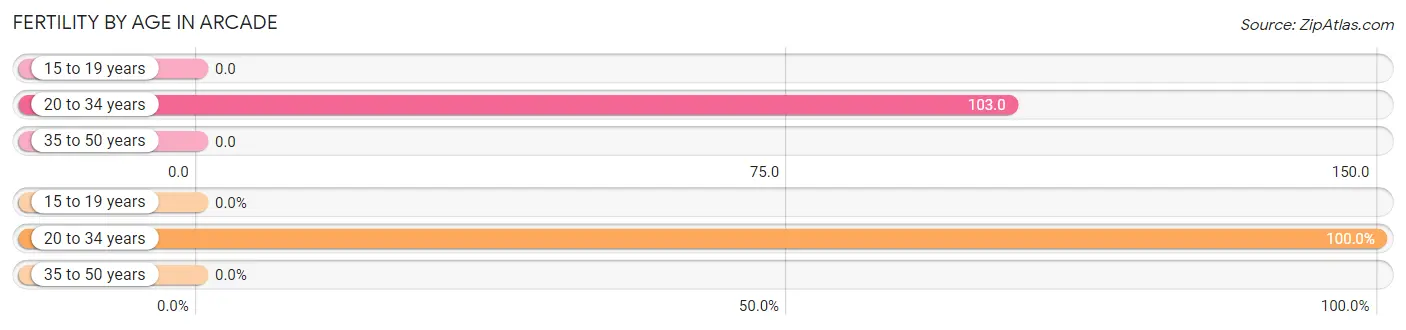
Fertility by Age in Arcade
Average fertility rate in Arcade is 45.0 births per 1,000 women. Women in the age bracket of 20 to 34 years have the highest fertility rate with 103.0 births per 1,000 women. Women in the age bracket of 20 to 34 years acount for 100.0% of all women with births.
| Age Bracket | Women with Births | Births / 1,000 Women |
| 15 to 19 years | 0 (0.0%) | 0.0 |
| 20 to 34 years | 27 (100.0%) | 103.0 |
| 35 to 50 years | 0 (0.0%) | 0.0 |
| Total | 27 (100.0%) | 45.0 |
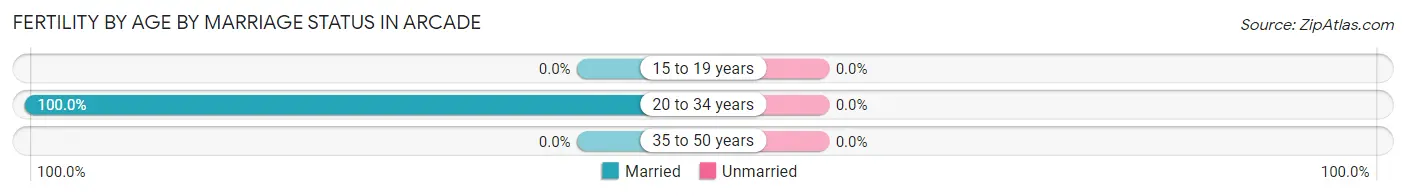
Fertility by Age by Marriage Status in Arcade
| Age Bracket | Married | Unmarried |
| 15 to 19 years | 0 (0.0%) | 0 (0.0%) |
| 20 to 34 years | 27 (100.0%) | 0 (0.0%) |
| 35 to 50 years | 0 (0.0%) | 0 (0.0%) |
| Total | 27 (100.0%) | 0 (0.0%) |
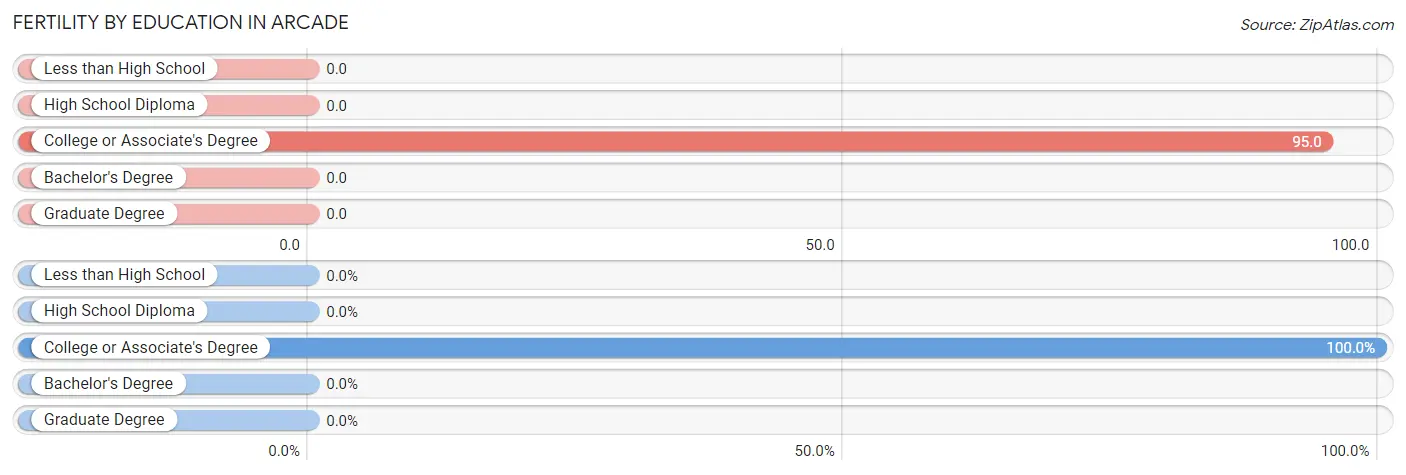
Fertility by Education in Arcade
| Educational Attainment | Women with Births | Births / 1,000 Women |
| Less than High School | 0 (0.0%) | 0.0 |
| High School Diploma | 0 (0.0%) | 0.0 |
| College or Associate's Degree | 27 (100.0%) | 95.0 |
| Bachelor's Degree | 0 (0.0%) | 0.0 |
| Graduate Degree | 0 (0.0%) | 0.0 |
| Total | 27 (100.0%) | 45.0 |
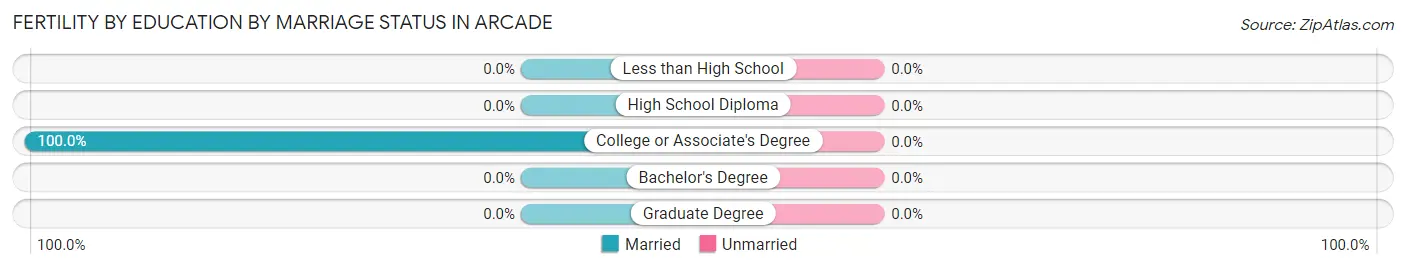
Fertility by Education by Marriage Status in Arcade
| Educational Attainment | Married | Unmarried |
| Less than High School | 0 (0.0%) | 0 (0.0%) |
| High School Diploma | 0 (0.0%) | 0 (0.0%) |
| College or Associate's Degree | 27 (100.0%) | 0 (0.0%) |
| Bachelor's Degree | 0 (0.0%) | 0 (0.0%) |
| Graduate Degree | 0 (0.0%) | 0 (0.0%) |
| Total | 27 (100.0%) | 0 (0.0%) |
Income in Arcade
Income Overview in Arcade
Per Capita Income in Arcade is $38,065, while median incomes of families and households are $94,338 and $58,900 respectively.
| Characteristic | Number | Measure |
| Per Capita Income | 2,095 | $38,065 |
| Median Family Income | 541 | $94,338 |
| Mean Family Income | 541 | $113,385 |
| Median Household Income | 1,042 | $58,900 |
| Mean Household Income | 1,042 | $80,013 |
| Income Deficit | 541 | $13,000 |
| Wage / Income Gap (%) | 2,095 | 35.52% |
| Wage / Income Gap ($) | 2,095 | 64.48¢ per $1 |
| Gini / Inequality Index | 2,095 | 0.44 |
Earnings by Sex in Arcade
Average Earnings in Arcade are $40,302, $51,708 for men and $33,341 for women, a difference of 35.5%.
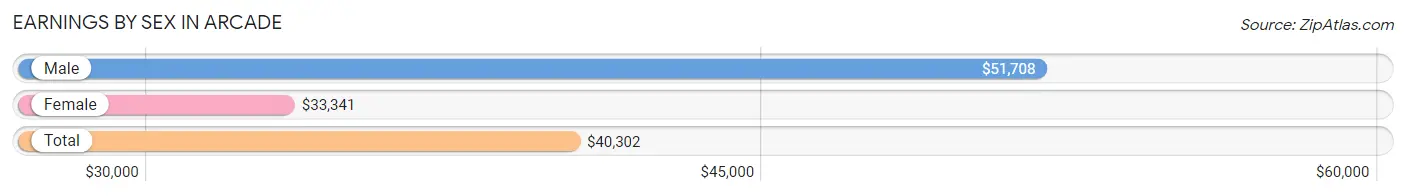
| Sex | Number | Average Earnings |
| Male | 625 (48.2%) | $51,708 |
| Female | 672 (51.8%) | $33,341 |
| Total | 1,297 (100.0%) | $40,302 |
Earnings by Sex by Income Bracket in Arcade
The most common earnings brackets in Arcade are $75,000 to $99,999 for men (101 | 16.2%) and $30,000 to $34,999 for women (113 | 16.8%).
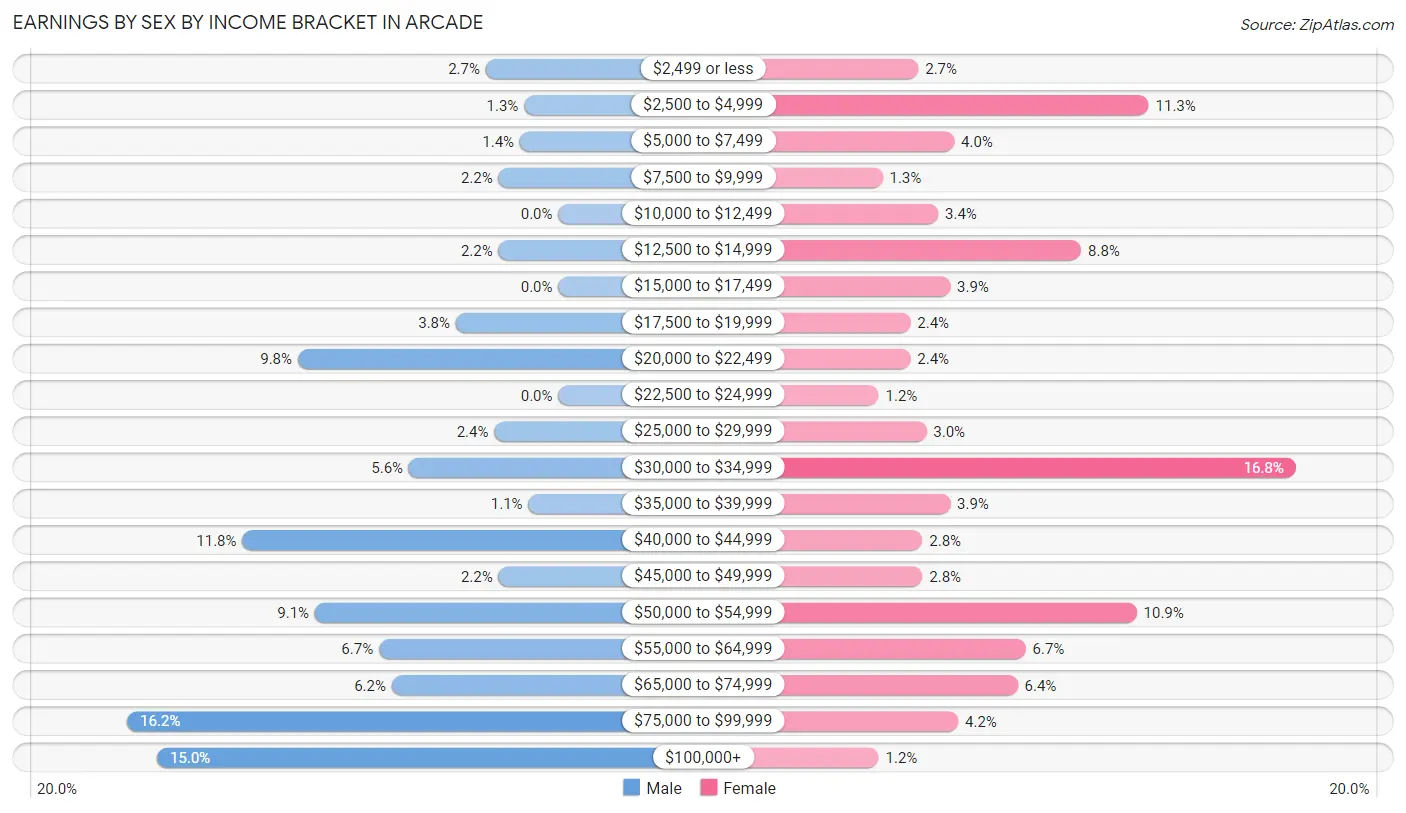
| Income | Male | Female |
| $2,499 or less | 17 (2.7%) | 18 (2.7%) |
| $2,500 to $4,999 | 8 (1.3%) | 76 (11.3%) |
| $5,000 to $7,499 | 9 (1.4%) | 27 (4.0%) |
| $7,500 to $9,999 | 14 (2.2%) | 9 (1.3%) |
| $10,000 to $12,499 | 0 (0.0%) | 23 (3.4%) |
| $12,500 to $14,999 | 14 (2.2%) | 59 (8.8%) |
| $15,000 to $17,499 | 0 (0.0%) | 26 (3.9%) |
| $17,500 to $19,999 | 24 (3.8%) | 16 (2.4%) |
| $20,000 to $22,499 | 61 (9.8%) | 16 (2.4%) |
| $22,500 to $24,999 | 0 (0.0%) | 8 (1.2%) |
| $25,000 to $29,999 | 15 (2.4%) | 20 (3.0%) |
| $30,000 to $34,999 | 35 (5.6%) | 113 (16.8%) |
| $35,000 to $39,999 | 7 (1.1%) | 26 (3.9%) |
| $40,000 to $44,999 | 74 (11.8%) | 19 (2.8%) |
| $45,000 to $49,999 | 14 (2.2%) | 19 (2.8%) |
| $50,000 to $54,999 | 57 (9.1%) | 73 (10.9%) |
| $55,000 to $64,999 | 42 (6.7%) | 45 (6.7%) |
| $65,000 to $74,999 | 39 (6.2%) | 43 (6.4%) |
| $75,000 to $99,999 | 101 (16.2%) | 28 (4.2%) |
| $100,000+ | 94 (15.0%) | 8 (1.2%) |
| Total | 625 (100.0%) | 672 (100.0%) |
Earnings by Sex by Educational Attainment in Arcade
Average earnings in Arcade are $53,935 for men and $36,875 for women, a difference of 31.6%. Men with an educational attainment of graduate degree enjoy the highest average annual earnings of $206,046, while those with college or associate's degree education earn the least with $42,318. Women with an educational attainment of graduate degree earn the most with the average annual earnings of $69,327, while those with less than high school education have the smallest earnings of $13,875.
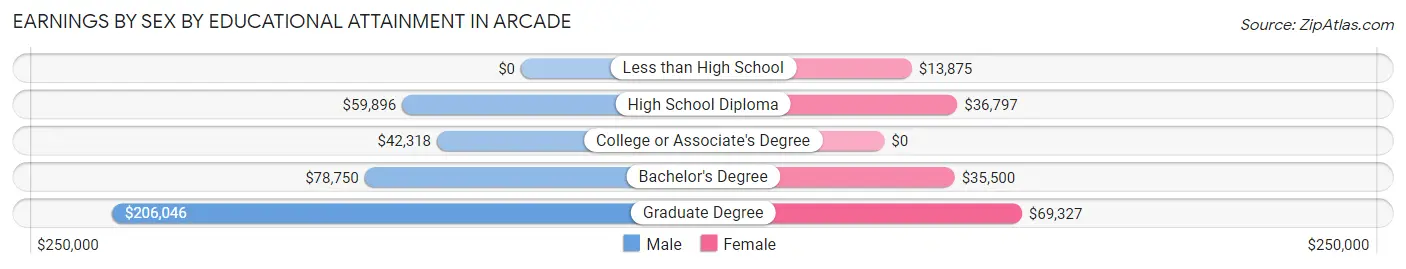
| Educational Attainment | Male Income | Female Income |
| Less than High School | - | - |
| High School Diploma | $59,896 | $36,797 |
| College or Associate's Degree | $42,318 | $0 |
| Bachelor's Degree | $78,750 | $35,500 |
| Graduate Degree | $206,046 | $69,327 |
| Total | $53,935 | $36,875 |
Family Income in Arcade
Family Income Brackets in Arcade
According to the Arcade family income data, there are 127 families falling into the $100,000 to $149,999 income range, which is the most common income bracket and makes up 23.5% of all families. Conversely, the less than $10,000 income bracket is the least frequent group with only 6 families (1.1%) belonging to this category.
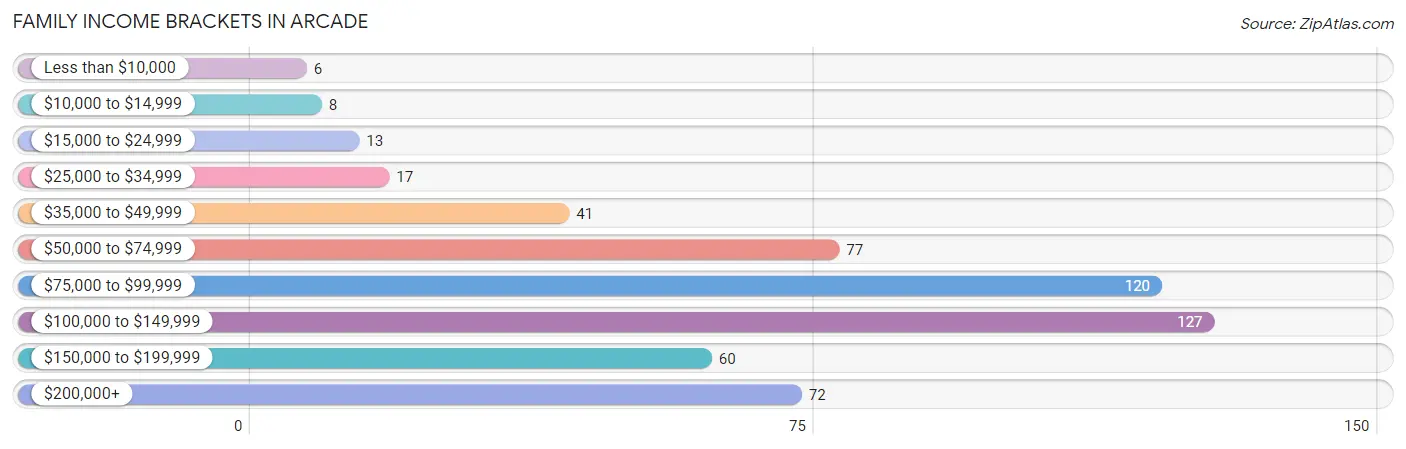
| Income Bracket | # Families | % Families |
| Less than $10,000 | 6 | 1.1% |
| $10,000 to $14,999 | 8 | 1.5% |
| $15,000 to $24,999 | 13 | 2.4% |
| $25,000 to $34,999 | 17 | 3.1% |
| $35,000 to $49,999 | 41 | 7.6% |
| $50,000 to $74,999 | 77 | 14.2% |
| $75,000 to $99,999 | 120 | 22.2% |
| $100,000 to $149,999 | 127 | 23.5% |
| $150,000 to $199,999 | 60 | 11.1% |
| $200,000+ | 72 | 13.3% |
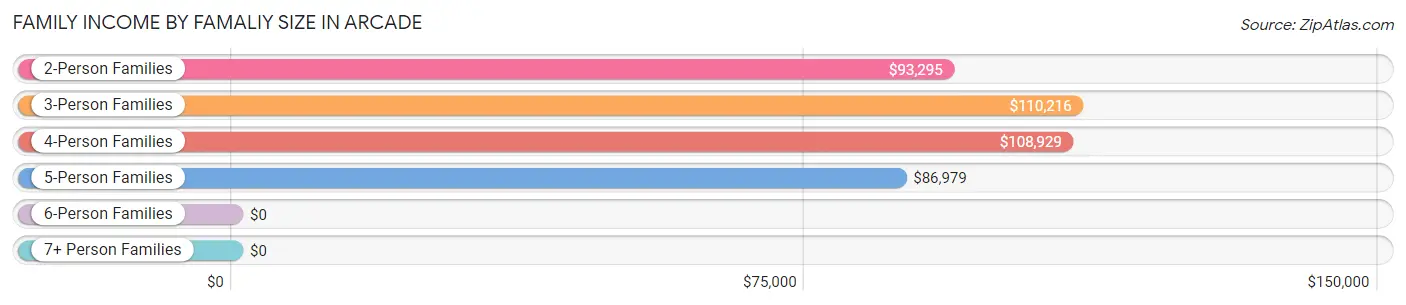
Family Income by Famaliy Size in Arcade
3-person families (103 | 19.0%) account for the highest median family income in Arcade with $110,216 per family, while 2-person families (301 | 55.6%) have the highest median income of $46,648 per family member.
| Income Bracket | # Families | Median Income |
| 2-Person Families | 301 (55.6%) | $93,295 |
| 3-Person Families | 103 (19.0%) | $110,216 |
| 4-Person Families | 78 (14.4%) | $108,929 |
| 5-Person Families | 38 (7.0%) | $86,979 |
| 6-Person Families | 21 (3.9%) | $0 |
| 7+ Person Families | 0 (0.0%) | $0 |
| Total | 541 (100.0%) | $94,338 |
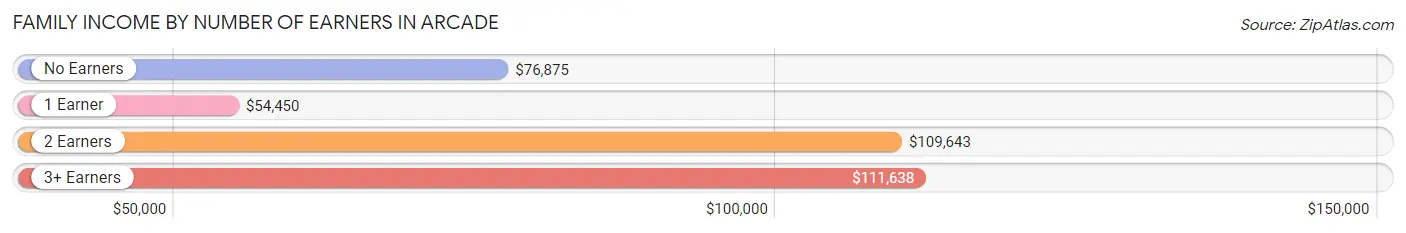
Family Income by Number of Earners in Arcade
The median family income in Arcade is $94,338, with families comprising 3+ earners (80) having the highest median family income of $111,638, while families with 1 earner (135) have the lowest median family income of $54,450, accounting for 14.8% and 24.9% of families, respectively.
| Number of Earners | # Families | Median Income |
| No Earners | 40 (7.4%) | $76,875 |
| 1 Earner | 135 (24.9%) | $54,450 |
| 2 Earners | 286 (52.9%) | $109,643 |
| 3+ Earners | 80 (14.8%) | $111,638 |
| Total | 541 (100.0%) | $94,338 |
Household Income in Arcade
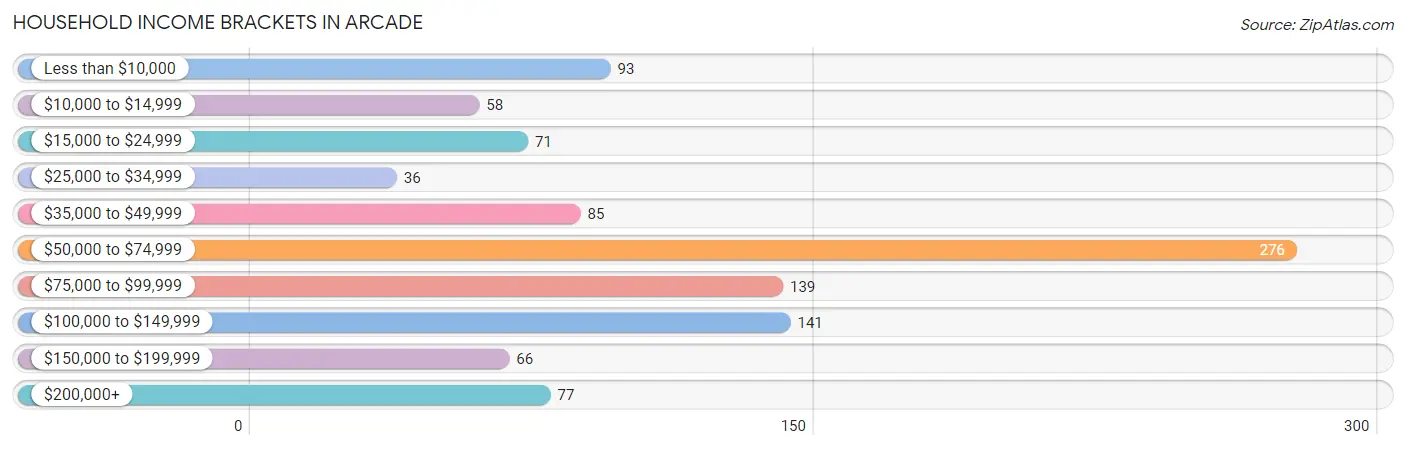
Household Income Brackets in Arcade
With 276 households falling in the category, the $50,000 to $74,999 income range is the most frequent in Arcade, accounting for 26.5% of all households. In contrast, only 36 households (3.5%) fall into the $25,000 to $34,999 income bracket, making it the least populous group.
| Income Bracket | # Households | % Households |
| Less than $10,000 | 93 | 8.9% |
| $10,000 to $14,999 | 58 | 5.6% |
| $15,000 to $24,999 | 71 | 6.8% |
| $25,000 to $34,999 | 36 | 3.5% |
| $35,000 to $49,999 | 85 | 8.2% |
| $50,000 to $74,999 | 276 | 26.5% |
| $75,000 to $99,999 | 139 | 13.3% |
| $100,000 to $149,999 | 141 | 13.5% |
| $150,000 to $199,999 | 66 | 6.3% |
| $200,000+ | 77 | 7.4% |
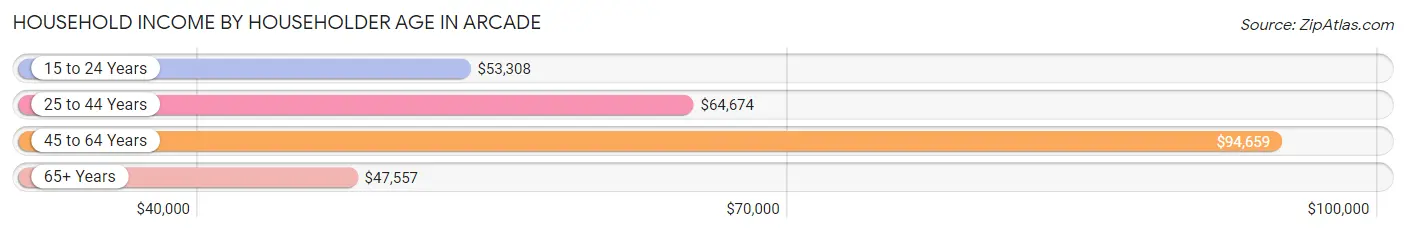
Household Income by Householder Age in Arcade
The median household income in Arcade is $58,900, with the highest median household income of $94,659 found in the 45 to 64 years age bracket for the primary householder. A total of 367 households (35.2%) fall into this category. Meanwhile, the 65+ years age bracket for the primary householder has the lowest median household income of $47,557, with 275 households (26.4%) in this group.
| Income Bracket | # Households | Median Income |
| 15 to 24 Years | 134 (12.9%) | $53,308 |
| 25 to 44 Years | 266 (25.5%) | $64,674 |
| 45 to 64 Years | 367 (35.2%) | $94,659 |
| 65+ Years | 275 (26.4%) | $47,557 |
| Total | 1,042 (100.0%) | $58,900 |
Poverty in Arcade
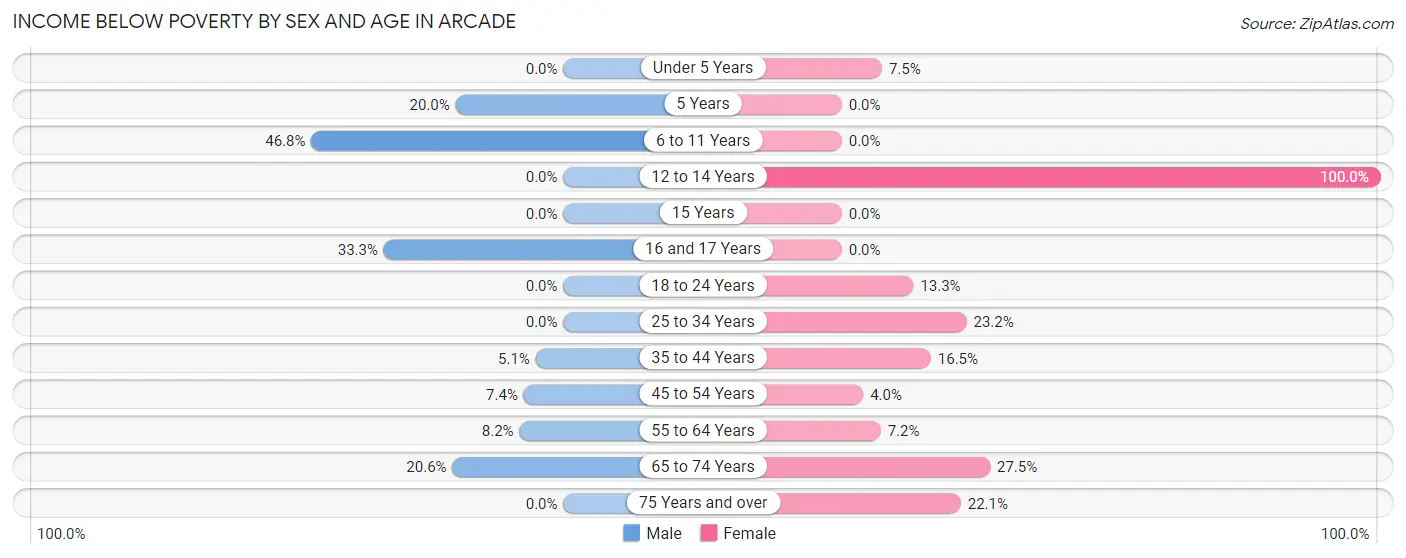
Income Below Poverty by Sex and Age in Arcade
With 8.8% poverty level for males and 13.0% for females among the residents of Arcade, 6 to 11 year old males and 12 to 14 year old females are the most vulnerable to poverty, with 29 males (46.8%) and 5 females (100.0%) in their respective age groups living below the poverty level.
| Age Bracket | Male | Female |
| Under 5 Years | 0 (0.0%) | 5 (7.5%) |
| 5 Years | 5 (20.0%) | 0 (0.0%) |
| 6 to 11 Years | 29 (46.8%) | 0 (0.0%) |
| 12 to 14 Years | 0 (0.0%) | 5 (100.0%) |
| 15 Years | 0 (0.0%) | 0 (0.0%) |
| 16 and 17 Years | 7 (33.3%) | 0 (0.0%) |
| 18 to 24 Years | 0 (0.0%) | 25 (13.3%) |
| 25 to 34 Years | 0 (0.0%) | 22 (23.2%) |
| 35 to 44 Years | 6 (5.1%) | 20 (16.5%) |
| 45 to 54 Years | 15 (7.3%) | 6 (4.0%) |
| 55 to 64 Years | 8 (8.2%) | 7 (7.2%) |
| 65 to 74 Years | 21 (20.6%) | 30 (27.5%) |
| 75 Years and over | 0 (0.0%) | 19 (22.1%) |
| Total | 91 (8.8%) | 139 (13.0%) |
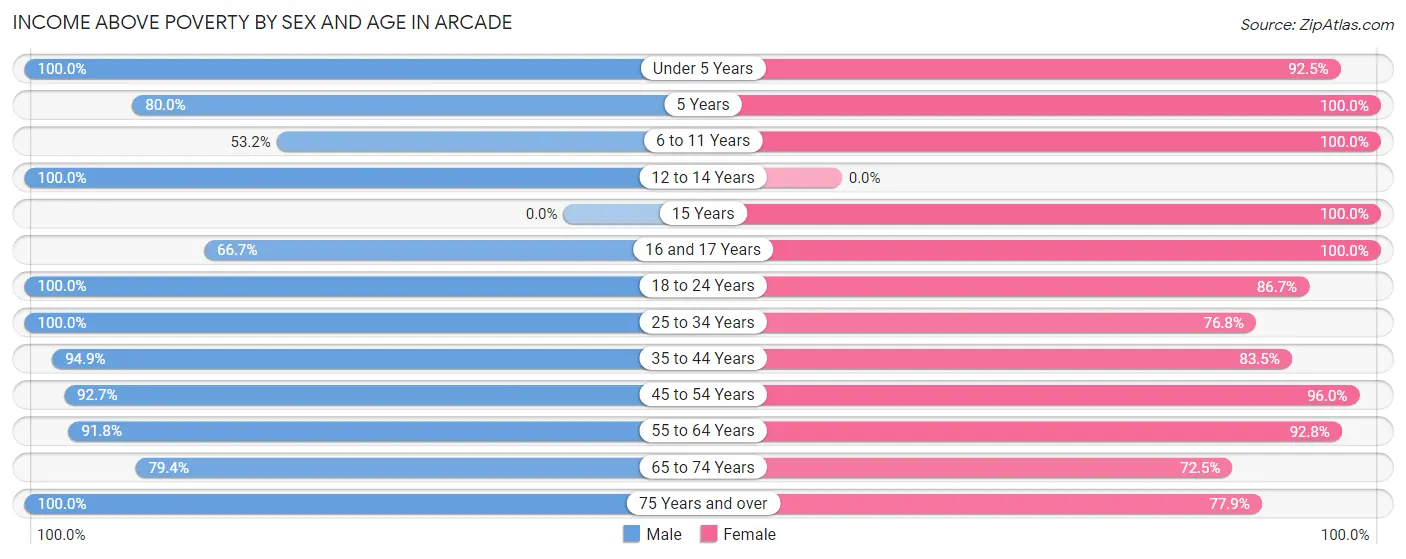
Income Above Poverty by Sex and Age in Arcade
According to the poverty statistics in Arcade, males aged under 5 years and females aged 5 years are the age groups that are most secure financially, with 100.0% of males and 100.0% of females in these age groups living above the poverty line.
| Age Bracket | Male | Female |
| Under 5 Years | 68 (100.0%) | 62 (92.5%) |
| 5 Years | 20 (80.0%) | 5 (100.0%) |
| 6 to 11 Years | 33 (53.2%) | 55 (100.0%) |
| 12 to 14 Years | 64 (100.0%) | 0 (0.0%) |
| 15 Years | 0 (0.0%) | 21 (100.0%) |
| 16 and 17 Years | 14 (66.7%) | 66 (100.0%) |
| 18 to 24 Years | 36 (100.0%) | 163 (86.7%) |
| 25 to 34 Years | 170 (100.0%) | 73 (76.8%) |
| 35 to 44 Years | 111 (94.9%) | 101 (83.5%) |
| 45 to 54 Years | 189 (92.6%) | 145 (96.0%) |
| 55 to 64 Years | 90 (91.8%) | 90 (92.8%) |
| 65 to 74 Years | 81 (79.4%) | 79 (72.5%) |
| 75 Years and over | 62 (100.0%) | 67 (77.9%) |
| Total | 938 (91.2%) | 927 (87.0%) |
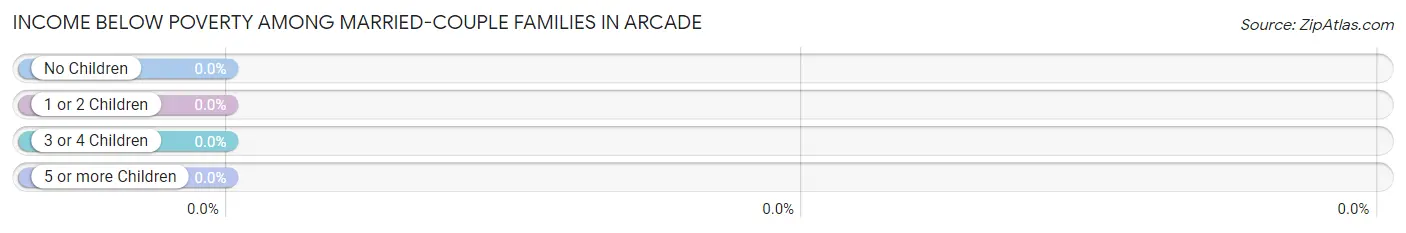
Income Below Poverty Among Married-Couple Families in Arcade
| Children | Above Poverty | Below Poverty |
| No Children | 265 (100.0%) | 0 (0.0%) |
| 1 or 2 Children | 89 (100.0%) | 0 (0.0%) |
| 3 or 4 Children | 39 (100.0%) | 0 (0.0%) |
| 5 or more Children | 0 (0.0%) | 0 (0.0%) |
| Total | 393 (100.0%) | 0 (0.0%) |
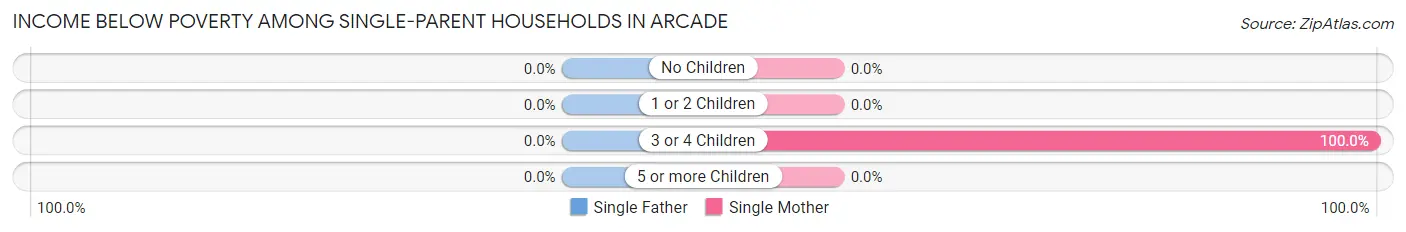
Income Below Poverty Among Single-Parent Households in Arcade
| Children | Single Father | Single Mother |
| No Children | 0 (0.0%) | 0 (0.0%) |
| 1 or 2 Children | 0 (0.0%) | 0 (0.0%) |
| 3 or 4 Children | 0 (0.0%) | 22 (100.0%) |
| 5 or more Children | 0 (0.0%) | 0 (0.0%) |
| Total | 0 (0.0%) | 22 (34.4%) |
Income Below Poverty Among Married-Couple vs Single-Parent Households in Arcade
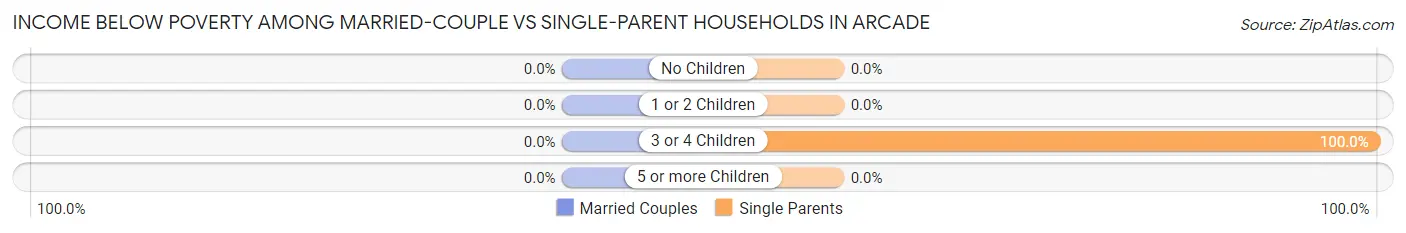
| Children | Married-Couple Families | Single-Parent Households |
| No Children | 0 (0.0%) | 0 (0.0%) |
| 1 or 2 Children | 0 (0.0%) | 0 (0.0%) |
| 3 or 4 Children | 0 (0.0%) | 22 (100.0%) |
| 5 or more Children | 0 (0.0%) | 0 (0.0%) |
| Total | 0 (0.0%) | 22 (14.9%) |
Employment Characteristics in Arcade
Employment by Class of Employer in Arcade
Among the 1,120 employed individuals in Arcade, private company employees (555 | 49.5%), not-for-profit organizations (245 | 21.9%), and local government employees (119 | 10.6%) make up the most common classes of employment.
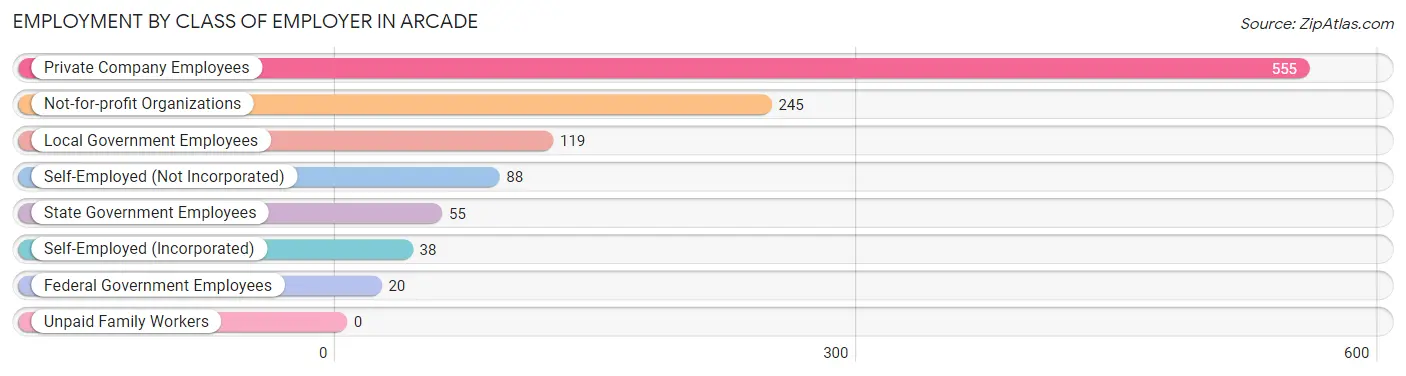
| Employer Class | # Employees | % Employees |
| Private Company Employees | 555 | 49.5% |
| Self-Employed (Incorporated) | 38 | 3.4% |
| Self-Employed (Not Incorporated) | 88 | 7.9% |
| Not-for-profit Organizations | 245 | 21.9% |
| Local Government Employees | 119 | 10.6% |
| State Government Employees | 55 | 4.9% |
| Federal Government Employees | 20 | 1.8% |
| Unpaid Family Workers | 0 | 0.0% |
| Total | 1,120 | 100.0% |
Employment Status by Age in Arcade
According to the labor force statistics for Arcade, out of the total population over 16 years of age (1,723), 69.1% or 1,191 individuals are in the labor force, with 5.5% or 66 of them unemployed. The age group with the highest labor force participation rate is 30 to 34 years, with 95.5% or 85 individuals in the labor force. Within the labor force, the 45 to 54 years age range has the highest percentage of unemployed individuals, with 15.0% or 49 of them being unemployed.
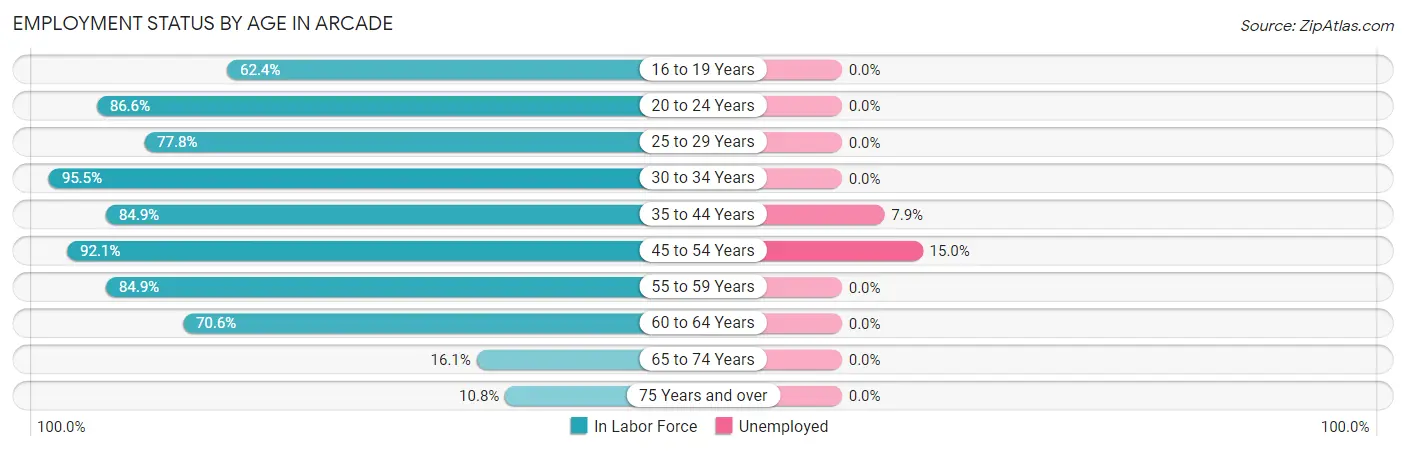
| Age Bracket | In Labor Force | Unemployed |
| 16 to 19 Years | 78 (62.4%) | 0 (0.0%) |
| 20 to 24 Years | 161 (86.6%) | 0 (0.0%) |
| 25 to 29 Years | 137 (77.8%) | 0 (0.0%) |
| 30 to 34 Years | 85 (95.5%) | 0 (0.0%) |
| 35 to 44 Years | 202 (84.9%) | 16 (7.9%) |
| 45 to 54 Years | 327 (92.1%) | 49 (15.0%) |
| 55 to 59 Years | 73 (84.9%) | 0 (0.0%) |
| 60 to 64 Years | 77 (70.6%) | 0 (0.0%) |
| 65 to 74 Years | 34 (16.1%) | 0 (0.0%) |
| 75 Years and over | 16 (10.8%) | 0 (0.0%) |
| Total | 1,191 (69.1%) | 66 (5.5%) |
Employment Status by Educational Attainment in Arcade
According to labor force statistics for Arcade, 85.6% of individuals (901) out of the total population between 25 and 64 years of age (1,053) are in the labor force, with 7.3% or 66 of them being unemployed. The group with the highest labor force participation rate are those with the educational attainment of bachelor's degree or higher, with 97.4% or 224 individuals in the labor force. Within the labor force, individuals with bachelor's degree or higher education have the highest percentage of unemployment, with 21.9% or 49 of them being unemployed.
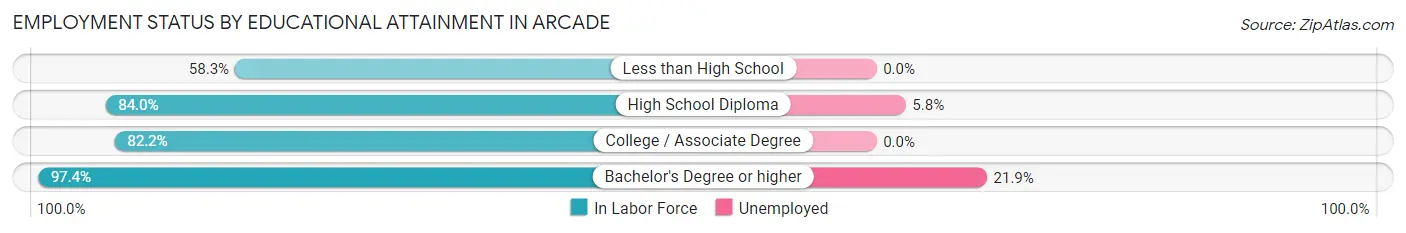
| Educational Attainment | In Labor Force | Unemployed |
| Less than High School | 14 (58.3%) | 0 (0.0%) |
| High School Diploma | 274 (84.0%) | 19 (5.8%) |
| College / Associate Degree | 389 (82.2%) | 0 (0.0%) |
| Bachelor's Degree or higher | 224 (97.4%) | 50 (21.9%) |
| Total | 901 (85.6%) | 77 (7.3%) |
Employment Occupations by Sex in Arcade
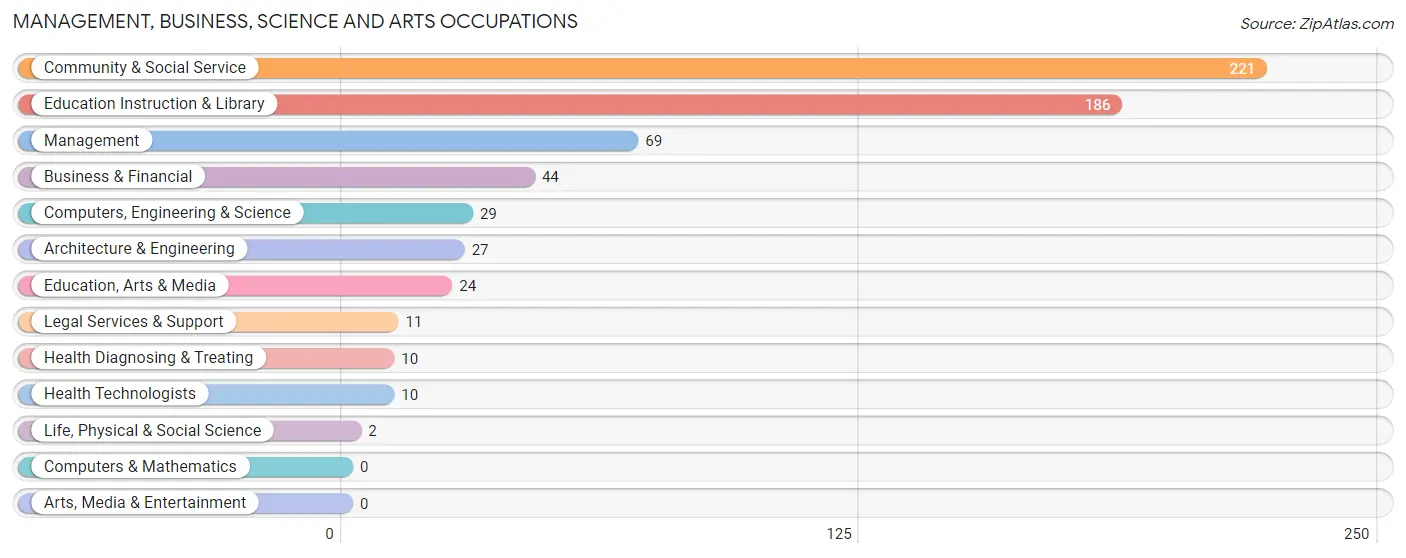
Management, Business, Science and Arts Occupations
The most common Management, Business, Science and Arts occupations in Arcade are Community & Social Service (221 | 19.8%), Education Instruction & Library (186 | 16.6%), Management (69 | 6.2%), Business & Financial (44 | 3.9%), and Computers, Engineering & Science (29 | 2.6%).
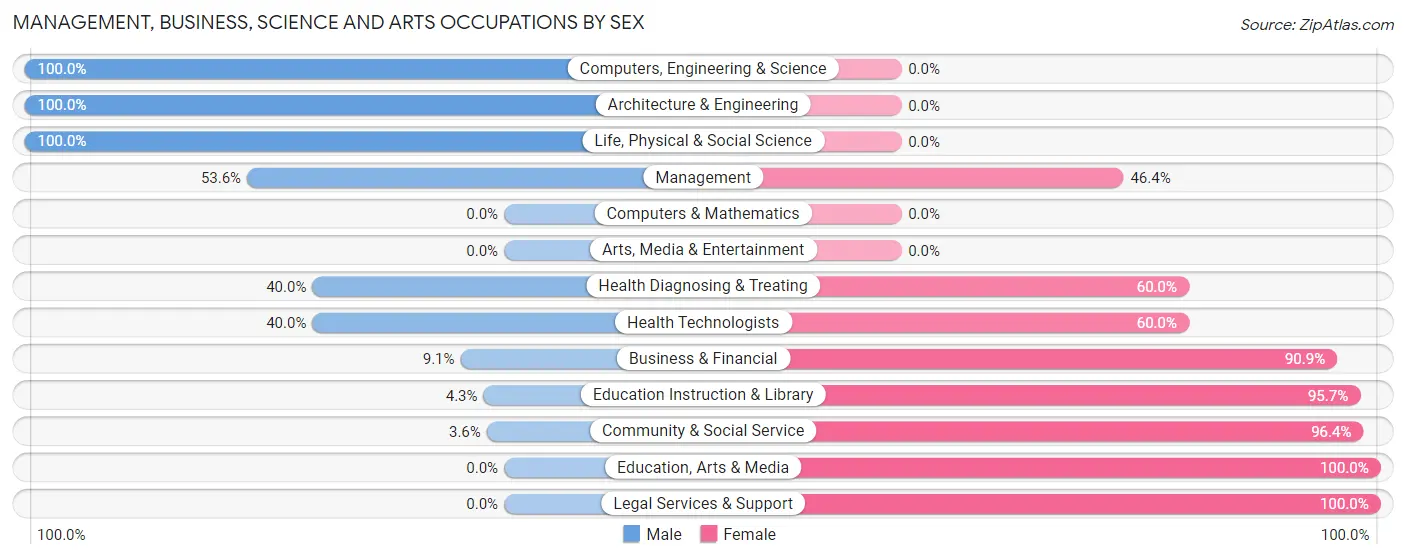
Management, Business, Science and Arts Occupations by Sex
Within the Management, Business, Science and Arts occupations in Arcade, the most male-oriented occupations are Computers, Engineering & Science (100.0%), Architecture & Engineering (100.0%), and Life, Physical & Social Science (100.0%), while the most female-oriented occupations are Education, Arts & Media (100.0%), Legal Services & Support (100.0%), and Community & Social Service (96.4%).
| Occupation | Male | Female |
| Management | 37 (53.6%) | 32 (46.4%) |
| Business & Financial | 4 (9.1%) | 40 (90.9%) |
| Computers, Engineering & Science | 29 (100.0%) | 0 (0.0%) |
| Computers & Mathematics | 0 (0.0%) | 0 (0.0%) |
| Architecture & Engineering | 27 (100.0%) | 0 (0.0%) |
| Life, Physical & Social Science | 2 (100.0%) | 0 (0.0%) |
| Community & Social Service | 8 (3.6%) | 213 (96.4%) |
| Education, Arts & Media | 0 (0.0%) | 24 (100.0%) |
| Legal Services & Support | 0 (0.0%) | 11 (100.0%) |
| Education Instruction & Library | 8 (4.3%) | 178 (95.7%) |
| Arts, Media & Entertainment | 0 (0.0%) | 0 (0.0%) |
| Health Diagnosing & Treating | 4 (40.0%) | 6 (60.0%) |
| Health Technologists | 4 (40.0%) | 6 (60.0%) |
| Total (Category) | 82 (22.0%) | 291 (78.0%) |
| Total (Overall) | 512 (45.8%) | 606 (54.2%) |
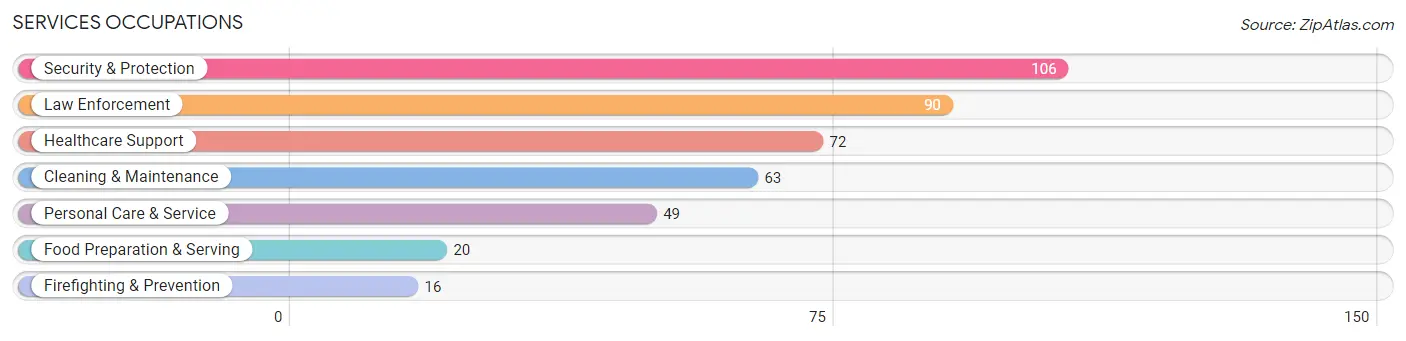
Services Occupations
The most common Services occupations in Arcade are Security & Protection (106 | 9.5%), Law Enforcement (90 | 8.1%), Healthcare Support (72 | 6.4%), Cleaning & Maintenance (63 | 5.6%), and Personal Care & Service (49 | 4.4%).
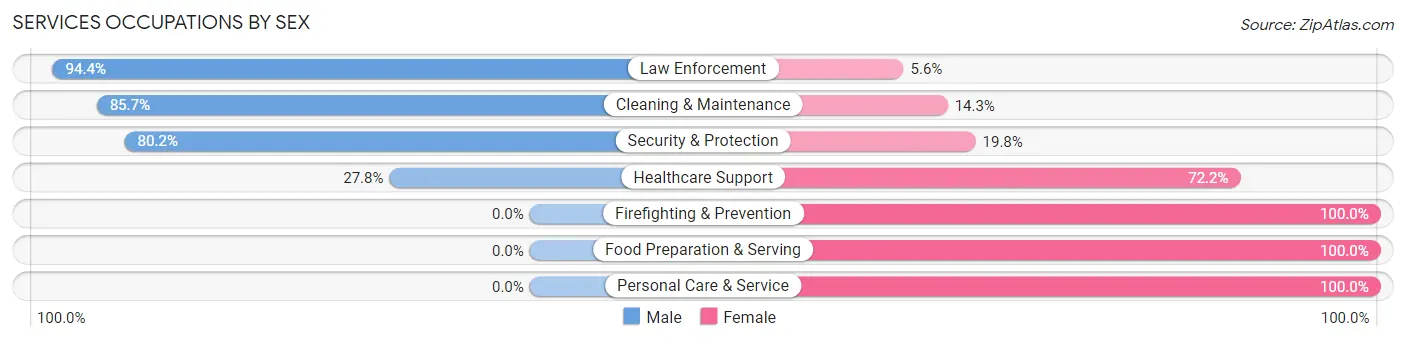
Services Occupations by Sex
Within the Services occupations in Arcade, the most male-oriented occupations are Law Enforcement (94.4%), Cleaning & Maintenance (85.7%), and Security & Protection (80.2%), while the most female-oriented occupations are Firefighting & Prevention (100.0%), Food Preparation & Serving (100.0%), and Personal Care & Service (100.0%).
| Occupation | Male | Female |
| Healthcare Support | 20 (27.8%) | 52 (72.2%) |
| Security & Protection | 85 (80.2%) | 21 (19.8%) |
| Firefighting & Prevention | 0 (0.0%) | 16 (100.0%) |
| Law Enforcement | 85 (94.4%) | 5 (5.6%) |
| Food Preparation & Serving | 0 (0.0%) | 20 (100.0%) |
| Cleaning & Maintenance | 54 (85.7%) | 9 (14.3%) |
| Personal Care & Service | 0 (0.0%) | 49 (100.0%) |
| Total (Category) | 159 (51.3%) | 151 (48.7%) |
| Total (Overall) | 512 (45.8%) | 606 (54.2%) |
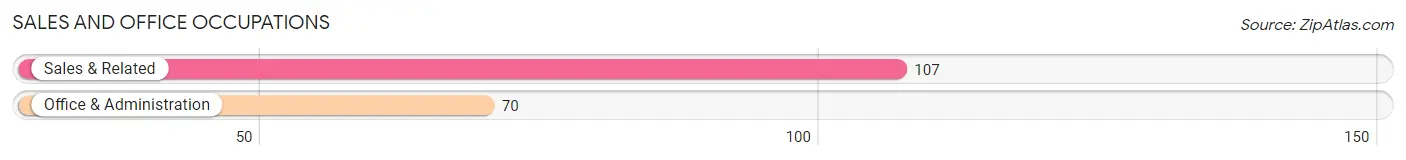
Sales and Office Occupations
The most common Sales and Office occupations in Arcade are Sales & Related (107 | 9.6%), and Office & Administration (70 | 6.3%).
Sales and Office Occupations by Sex
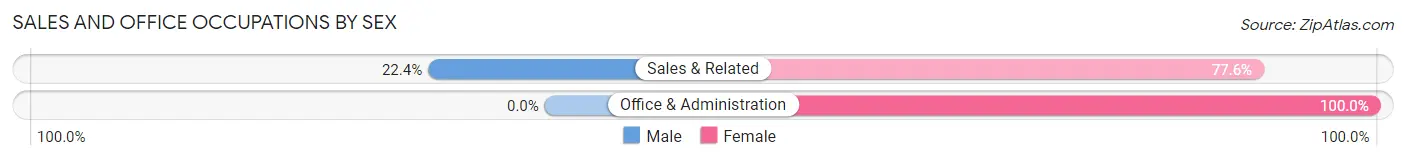
| Occupation | Male | Female |
| Sales & Related | 24 (22.4%) | 83 (77.6%) |
| Office & Administration | 0 (0.0%) | 70 (100.0%) |
| Total (Category) | 24 (13.6%) | 153 (86.4%) |
| Total (Overall) | 512 (45.8%) | 606 (54.2%) |
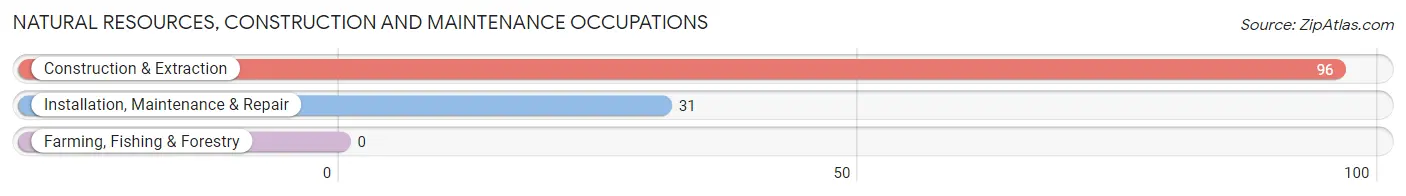
Natural Resources, Construction and Maintenance Occupations
The most common Natural Resources, Construction and Maintenance occupations in Arcade are Construction & Extraction (96 | 8.6%), and Installation, Maintenance & Repair (31 | 2.8%).
Natural Resources, Construction and Maintenance Occupations by Sex

| Occupation | Male | Female |
| Farming, Fishing & Forestry | 0 (0.0%) | 0 (0.0%) |
| Construction & Extraction | 96 (100.0%) | 0 (0.0%) |
| Installation, Maintenance & Repair | 31 (100.0%) | 0 (0.0%) |
| Total (Category) | 127 (100.0%) | 0 (0.0%) |
| Total (Overall) | 512 (45.8%) | 606 (54.2%) |
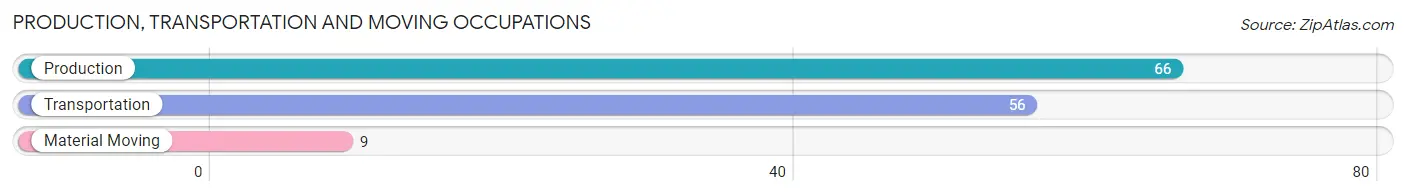
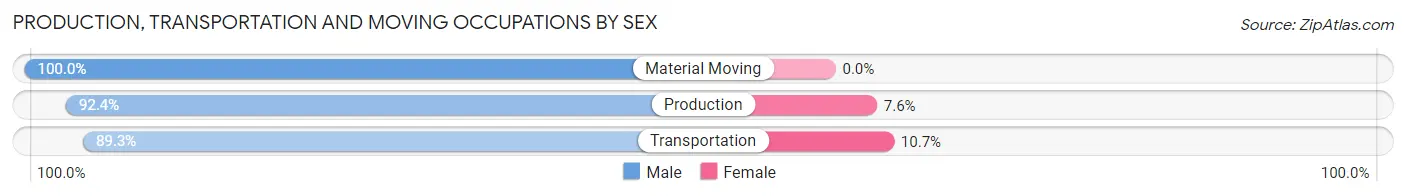
Production, Transportation and Moving Occupations
The most common Production, Transportation and Moving occupations in Arcade are Production (66 | 5.9%), Transportation (56 | 5.0%), and Material Moving (9 | 0.8%).
Production, Transportation and Moving Occupations by Sex
| Occupation | Male | Female |
| Production | 61 (92.4%) | 5 (7.6%) |
| Transportation | 50 (89.3%) | 6 (10.7%) |
| Material Moving | 9 (100.0%) | 0 (0.0%) |
| Total (Category) | 120 (91.6%) | 11 (8.4%) |
| Total (Overall) | 512 (45.8%) | 606 (54.2%) |
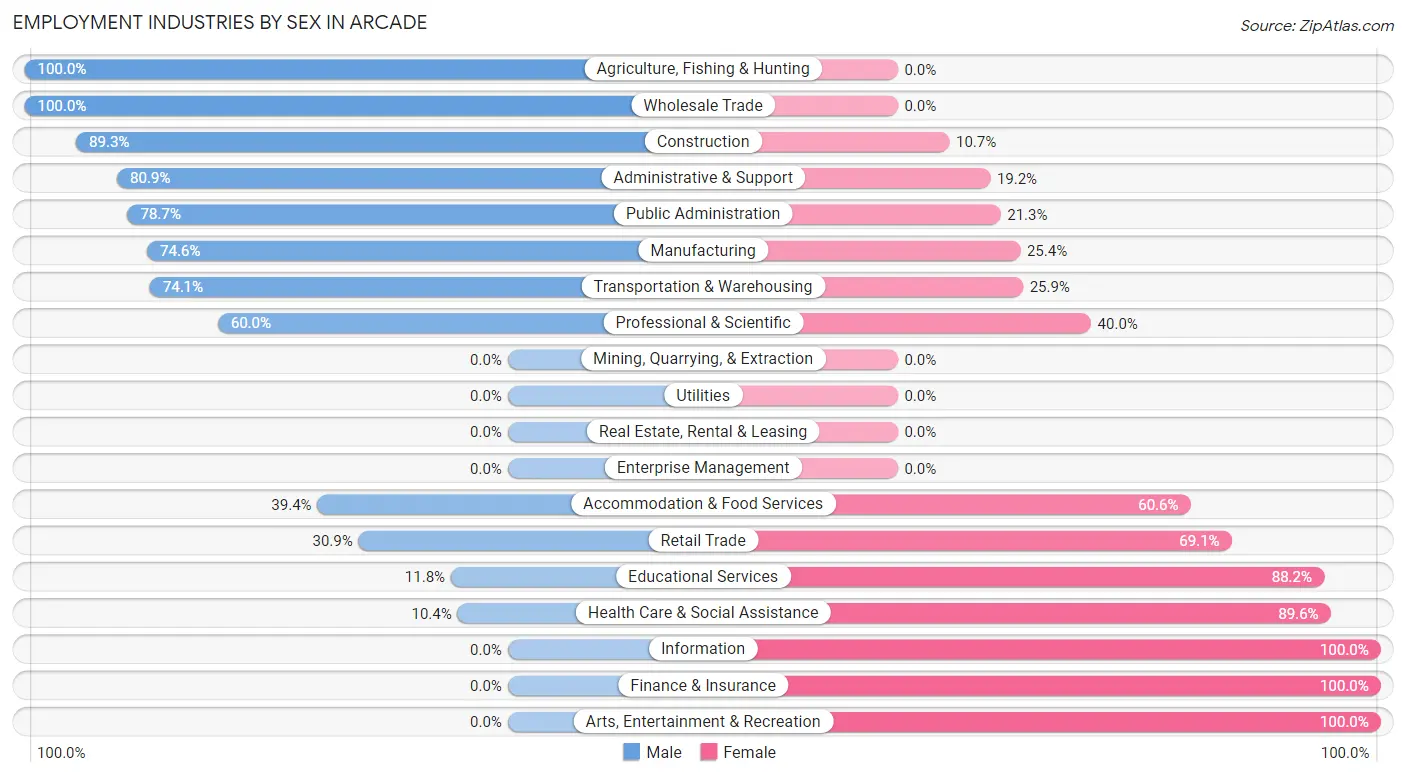
Employment Industries by Sex in Arcade
Employment Industries in Arcade
The major employment industries in Arcade include Health Care & Social Assistance (289 | 25.9%), Retail Trade (136 | 12.2%), Manufacturing (134 | 12.0%), Public Administration (108 | 9.7%), and Construction (103 | 9.2%).
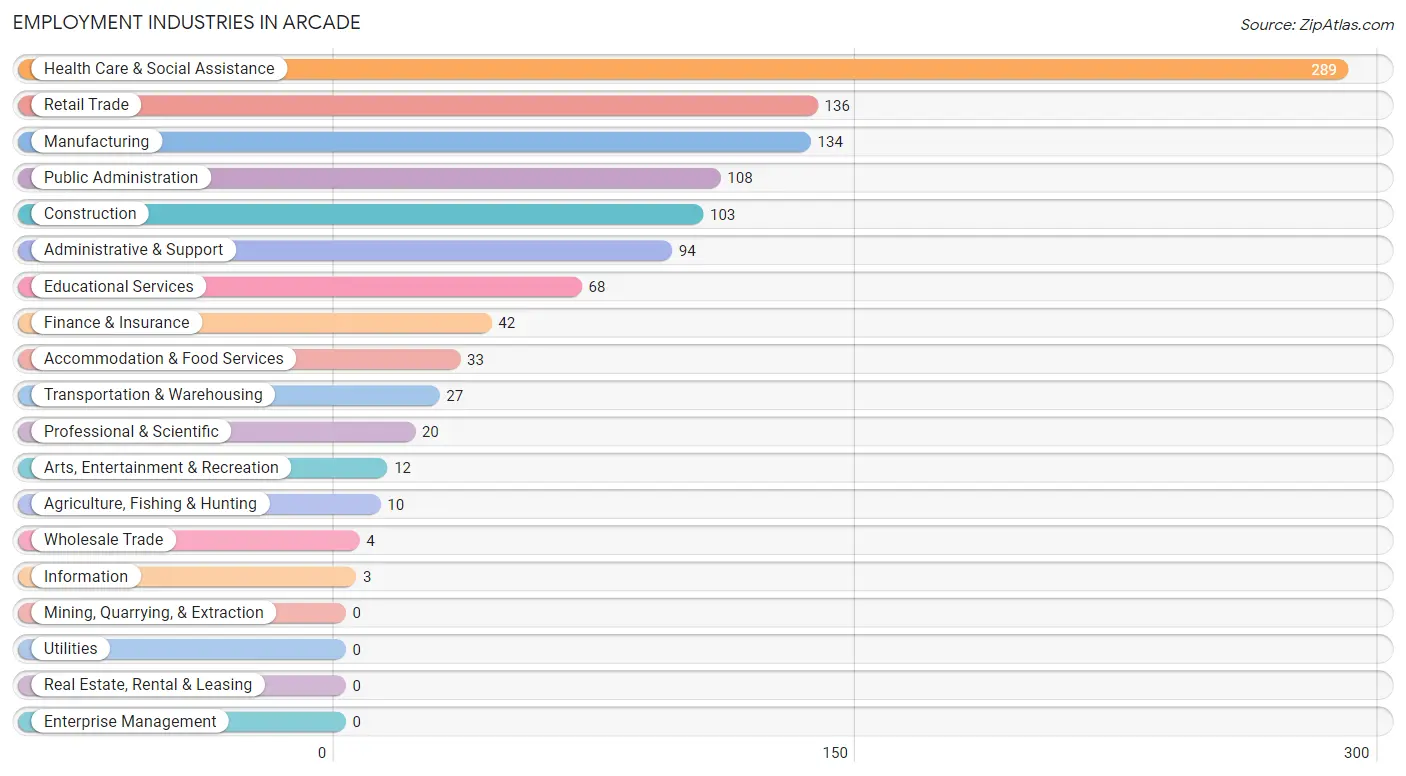
Employment Industries by Sex in Arcade
The Arcade industries that see more men than women are Agriculture, Fishing & Hunting (100.0%), Wholesale Trade (100.0%), and Construction (89.3%), whereas the industries that tend to have a higher number of women are Information (100.0%), Finance & Insurance (100.0%), and Arts, Entertainment & Recreation (100.0%).
| Industry | Male | Female |
| Agriculture, Fishing & Hunting | 10 (100.0%) | 0 (0.0%) |
| Mining, Quarrying, & Extraction | 0 (0.0%) | 0 (0.0%) |
| Construction | 92 (89.3%) | 11 (10.7%) |
| Manufacturing | 100 (74.6%) | 34 (25.4%) |
| Wholesale Trade | 4 (100.0%) | 0 (0.0%) |
| Retail Trade | 42 (30.9%) | 94 (69.1%) |
| Transportation & Warehousing | 20 (74.1%) | 7 (25.9%) |
| Utilities | 0 (0.0%) | 0 (0.0%) |
| Information | 0 (0.0%) | 3 (100.0%) |
| Finance & Insurance | 0 (0.0%) | 42 (100.0%) |
| Real Estate, Rental & Leasing | 0 (0.0%) | 0 (0.0%) |
| Professional & Scientific | 12 (60.0%) | 8 (40.0%) |
| Enterprise Management | 0 (0.0%) | 0 (0.0%) |
| Administrative & Support | 76 (80.8%) | 18 (19.2%) |
| Educational Services | 8 (11.8%) | 60 (88.2%) |
| Health Care & Social Assistance | 30 (10.4%) | 259 (89.6%) |
| Arts, Entertainment & Recreation | 0 (0.0%) | 12 (100.0%) |
| Accommodation & Food Services | 13 (39.4%) | 20 (60.6%) |
| Public Administration | 85 (78.7%) | 23 (21.3%) |
| Total | 512 (45.8%) | 606 (54.2%) |
Education in Arcade
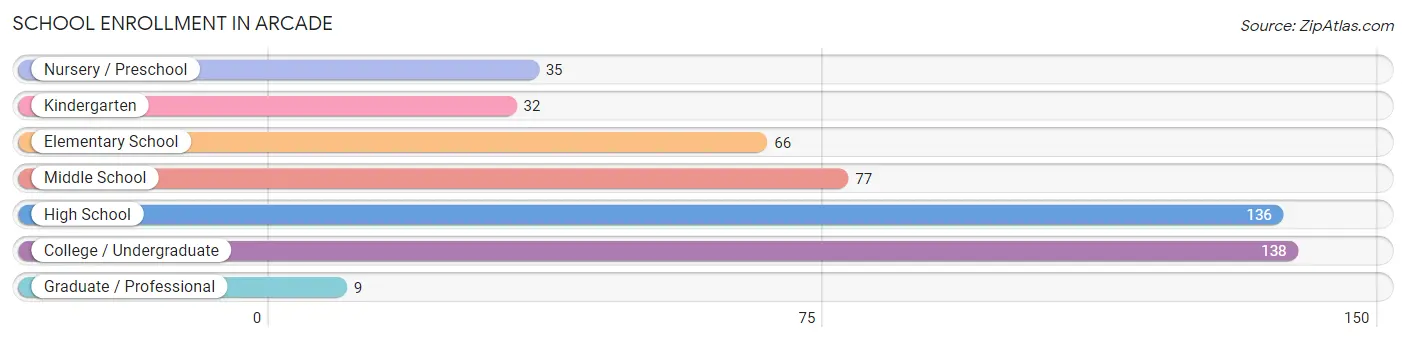
School Enrollment in Arcade
The most common levels of schooling among the 493 students in Arcade are college / undergraduate (138 | 28.0%), high school (136 | 27.6%), and middle school (77 | 15.6%).
| School Level | # Students | % Students |
| Nursery / Preschool | 35 | 7.1% |
| Kindergarten | 32 | 6.5% |
| Elementary School | 66 | 13.4% |
| Middle School | 77 | 15.6% |
| High School | 136 | 27.6% |
| College / Undergraduate | 138 | 28.0% |
| Graduate / Professional | 9 | 1.8% |
| Total | 493 | 100.0% |
School Enrollment by Age by Funding Source in Arcade
Out of a total of 493 students who are enrolled in schools in Arcade, 167 (33.9%) attend a private institution, while the remaining 326 (66.1%) are enrolled in public schools. The age group of 20 to 24 year olds has the highest likelihood of being enrolled in private schools, with 108 (94.7% in the age bracket) enrolled. Conversely, the age group of 3 to 4 year olds has the lowest likelihood of being enrolled in a private school, with 15 (100.0% in the age bracket) attending a public institution.
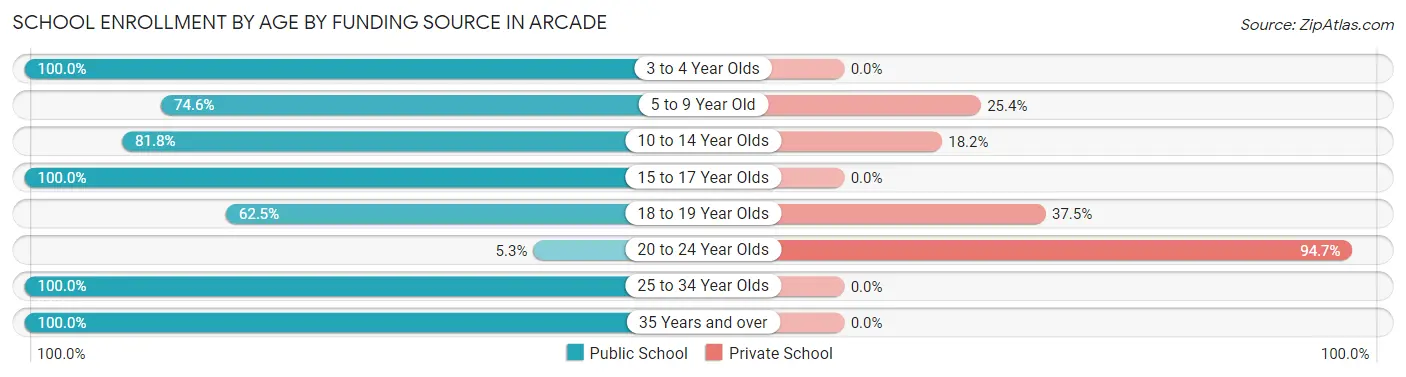
| Age Bracket | Public School | Private School |
| 3 to 4 Year Olds | 15 (100.0%) | 0 (0.0%) |
| 5 to 9 Year Old | 85 (74.6%) | 29 (25.4%) |
| 10 to 14 Year Olds | 81 (81.8%) | 18 (18.2%) |
| 15 to 17 Year Olds | 108 (100.0%) | 0 (0.0%) |
| 18 to 19 Year Olds | 20 (62.5%) | 12 (37.5%) |
| 20 to 24 Year Olds | 6 (5.3%) | 108 (94.7%) |
| 25 to 34 Year Olds | 8 (100.0%) | 0 (0.0%) |
| 35 Years and over | 3 (100.0%) | 0 (0.0%) |
| Total | 326 (66.1%) | 167 (33.9%) |
Educational Attainment by Field of Study in Arcade
Business (125 | 40.2%), education (46 | 14.8%), engineering (33 | 10.6%), psychology (31 | 10.0%), and arts & humanities (28 | 9.0%) are the most common fields of study among 311 individuals in Arcade who have obtained a bachelor's degree or higher.
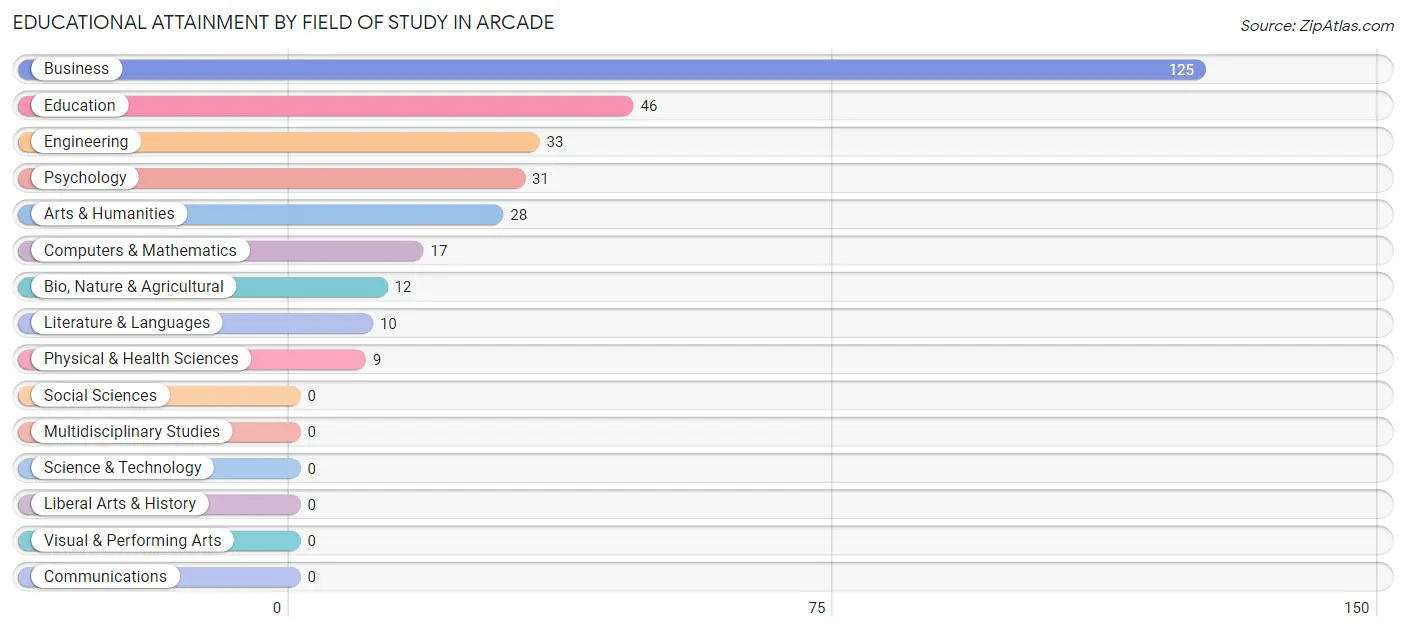
| Field of Study | # Graduates | % Graduates |
| Computers & Mathematics | 17 | 5.5% |
| Bio, Nature & Agricultural | 12 | 3.9% |
| Physical & Health Sciences | 9 | 2.9% |
| Psychology | 31 | 10.0% |
| Social Sciences | 0 | 0.0% |
| Engineering | 33 | 10.6% |
| Multidisciplinary Studies | 0 | 0.0% |
| Science & Technology | 0 | 0.0% |
| Business | 125 | 40.2% |
| Education | 46 | 14.8% |
| Literature & Languages | 10 | 3.2% |
| Liberal Arts & History | 0 | 0.0% |
| Visual & Performing Arts | 0 | 0.0% |
| Communications | 0 | 0.0% |
| Arts & Humanities | 28 | 9.0% |
| Total | 311 | 100.0% |
Transportation & Commute in Arcade
Vehicle Availability by Sex in Arcade
The most prevalent vehicle ownership categories in Arcade are males with 2 vehicles (231, accounting for 44.5%) and females with 2 vehicles (167, making up 38.4%).
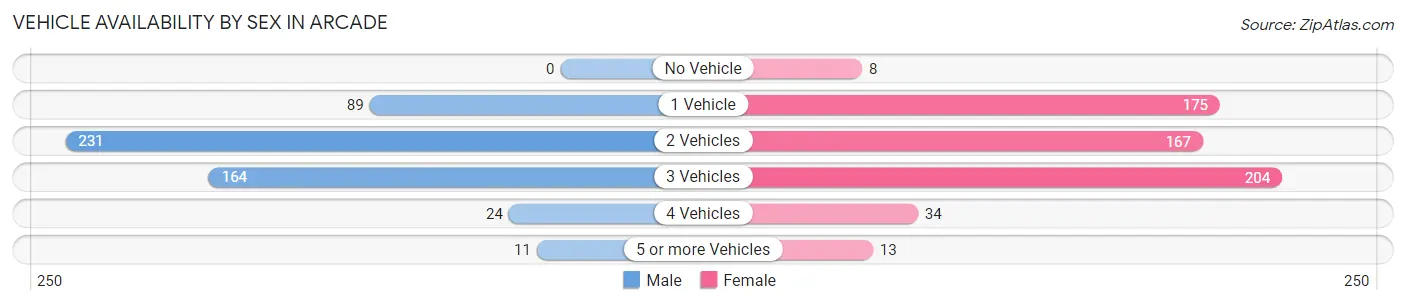
| Vehicles Available | Male | Female |
| No Vehicle | 0 (0.0%) | 8 (1.3%) |
| 1 Vehicle | 89 (17.2%) | 175 (29.1%) |
| 2 Vehicles | 231 (44.5%) | 167 (27.8%) |
| 3 Vehicles | 164 (31.6%) | 204 (33.9%) |
| 4 Vehicles | 24 (4.6%) | 34 (5.7%) |
| 5 or more Vehicles | 11 (2.1%) | 13 (2.2%) |
| Total | 519 (100.0%) | 601 (100.0%) |
Commute Time in Arcade
The most frequently occuring commute durations in Arcade are 5 to 9 minutes (272 commuters, 25.1%), 45 to 59 minutes (179 commuters, 16.5%), and 10 to 14 minutes (121 commuters, 11.2%).
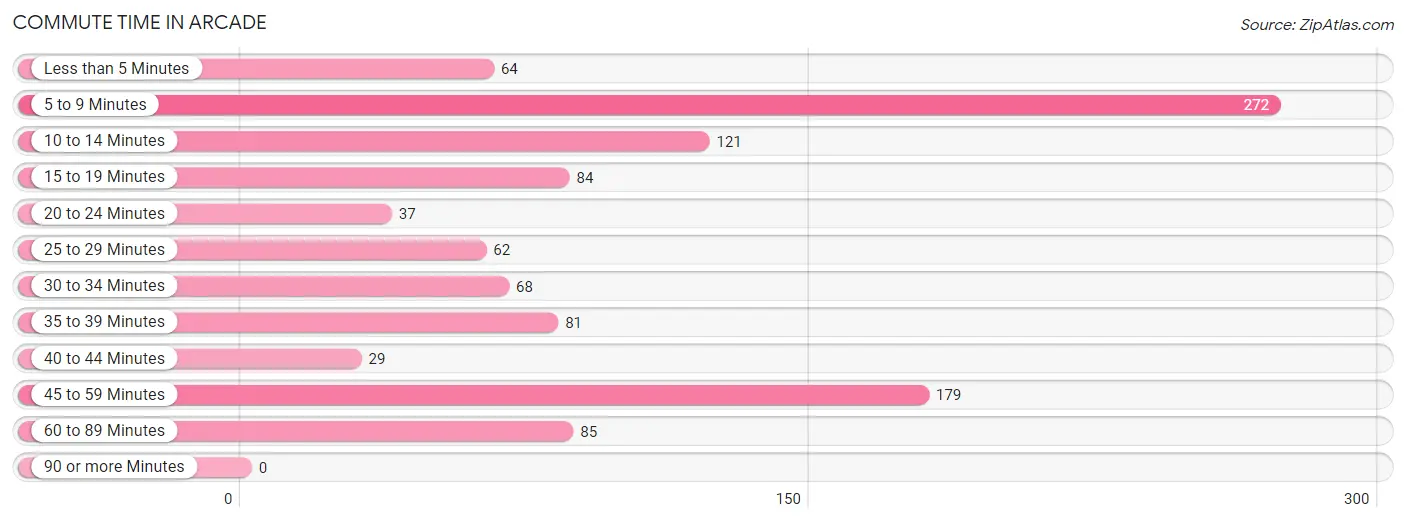
| Commute Time | # Commuters | % Commuters |
| Less than 5 Minutes | 64 | 5.9% |
| 5 to 9 Minutes | 272 | 25.1% |
| 10 to 14 Minutes | 121 | 11.2% |
| 15 to 19 Minutes | 84 | 7.8% |
| 20 to 24 Minutes | 37 | 3.4% |
| 25 to 29 Minutes | 62 | 5.7% |
| 30 to 34 Minutes | 68 | 6.3% |
| 35 to 39 Minutes | 81 | 7.5% |
| 40 to 44 Minutes | 29 | 2.7% |
| 45 to 59 Minutes | 179 | 16.5% |
| 60 to 89 Minutes | 85 | 7.9% |
| 90 or more Minutes | 0 | 0.0% |
Commute Time by Sex in Arcade
The most common commute times in Arcade are 5 to 9 minutes (133 commuters, 26.9%) for males and 5 to 9 minutes (139 commuters, 23.7%) for females.
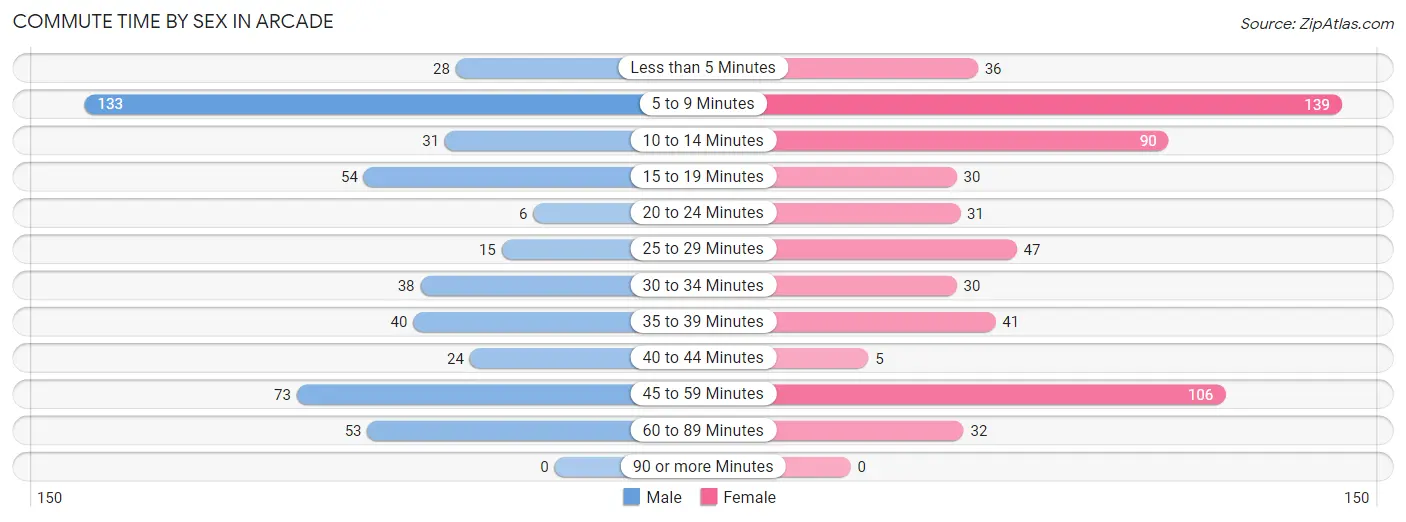
| Commute Time | Male | Female |
| Less than 5 Minutes | 28 (5.7%) | 36 (6.1%) |
| 5 to 9 Minutes | 133 (26.9%) | 139 (23.7%) |
| 10 to 14 Minutes | 31 (6.3%) | 90 (15.3%) |
| 15 to 19 Minutes | 54 (10.9%) | 30 (5.1%) |
| 20 to 24 Minutes | 6 (1.2%) | 31 (5.3%) |
| 25 to 29 Minutes | 15 (3.0%) | 47 (8.0%) |
| 30 to 34 Minutes | 38 (7.7%) | 30 (5.1%) |
| 35 to 39 Minutes | 40 (8.1%) | 41 (7.0%) |
| 40 to 44 Minutes | 24 (4.9%) | 5 (0.9%) |
| 45 to 59 Minutes | 73 (14.7%) | 106 (18.1%) |
| 60 to 89 Minutes | 53 (10.7%) | 32 (5.4%) |
| 90 or more Minutes | 0 (0.0%) | 0 (0.0%) |
Time of Departure to Work by Sex in Arcade
The most frequent times of departure to work in Arcade are 7:00 AM to 7:29 AM (109, 22.0%) for males and 7:00 AM to 7:29 AM (177, 30.1%) for females.
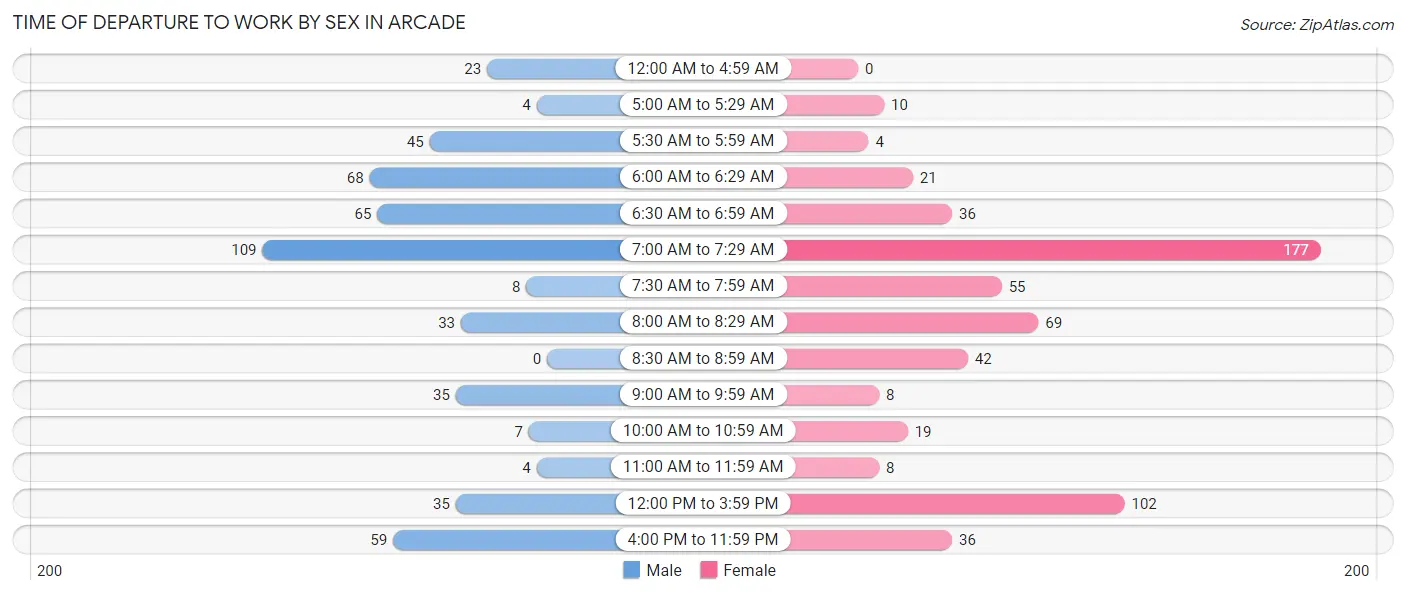
| Time of Departure | Male | Female |
| 12:00 AM to 4:59 AM | 23 (4.6%) | 0 (0.0%) |
| 5:00 AM to 5:29 AM | 4 (0.8%) | 10 (1.7%) |
| 5:30 AM to 5:59 AM | 45 (9.1%) | 4 (0.7%) |
| 6:00 AM to 6:29 AM | 68 (13.7%) | 21 (3.6%) |
| 6:30 AM to 6:59 AM | 65 (13.1%) | 36 (6.1%) |
| 7:00 AM to 7:29 AM | 109 (22.0%) | 177 (30.1%) |
| 7:30 AM to 7:59 AM | 8 (1.6%) | 55 (9.4%) |
| 8:00 AM to 8:29 AM | 33 (6.7%) | 69 (11.7%) |
| 8:30 AM to 8:59 AM | 0 (0.0%) | 42 (7.2%) |
| 9:00 AM to 9:59 AM | 35 (7.1%) | 8 (1.4%) |
| 10:00 AM to 10:59 AM | 7 (1.4%) | 19 (3.2%) |
| 11:00 AM to 11:59 AM | 4 (0.8%) | 8 (1.4%) |
| 12:00 PM to 3:59 PM | 35 (7.1%) | 102 (17.4%) |
| 4:00 PM to 11:59 PM | 59 (11.9%) | 36 (6.1%) |
| Total | 495 (100.0%) | 587 (100.0%) |
Housing Occupancy in Arcade
Occupancy by Ownership in Arcade
Of the total 1,042 dwellings in Arcade, owner-occupied units account for 583 (55.9%), while renter-occupied units make up 459 (44.1%).
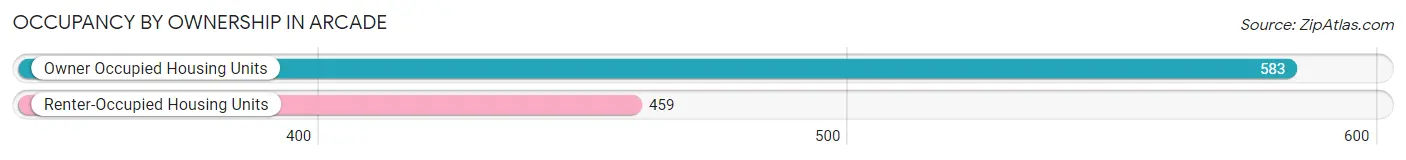
| Occupancy | # Housing Units | % Housing Units |
| Owner Occupied Housing Units | 583 | 55.9% |
| Renter-Occupied Housing Units | 459 | 44.1% |
| Total Occupied Housing Units | 1,042 | 100.0% |
Occupancy by Household Size in Arcade
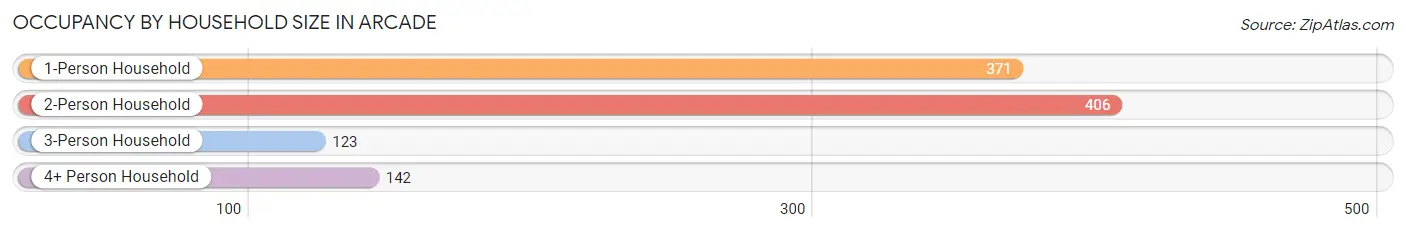
| Household Size | # Housing Units | % Housing Units |
| 1-Person Household | 371 | 35.6% |
| 2-Person Household | 406 | 39.0% |
| 3-Person Household | 123 | 11.8% |
| 4+ Person Household | 142 | 13.6% |
| Total Housing Units | 1,042 | 100.0% |
Occupancy by Ownership by Household Size in Arcade
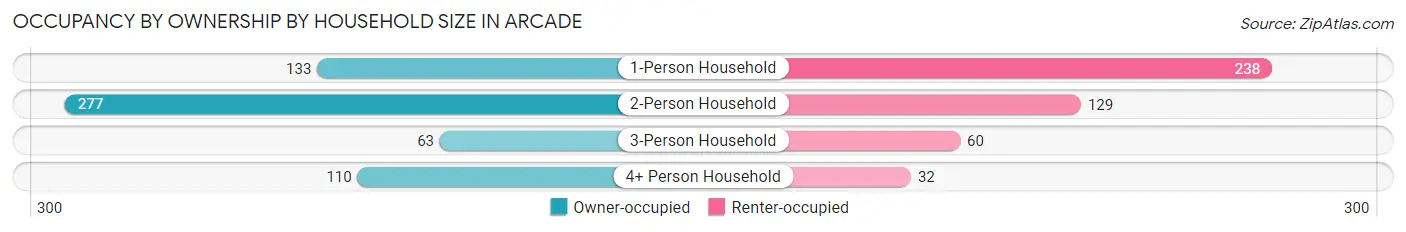
| Household Size | Owner-occupied | Renter-occupied |
| 1-Person Household | 133 (35.8%) | 238 (64.1%) |
| 2-Person Household | 277 (68.2%) | 129 (31.8%) |
| 3-Person Household | 63 (51.2%) | 60 (48.8%) |
| 4+ Person Household | 110 (77.5%) | 32 (22.5%) |
| Total Housing Units | 583 (55.9%) | 459 (44.1%) |
Occupancy by Educational Attainment in Arcade
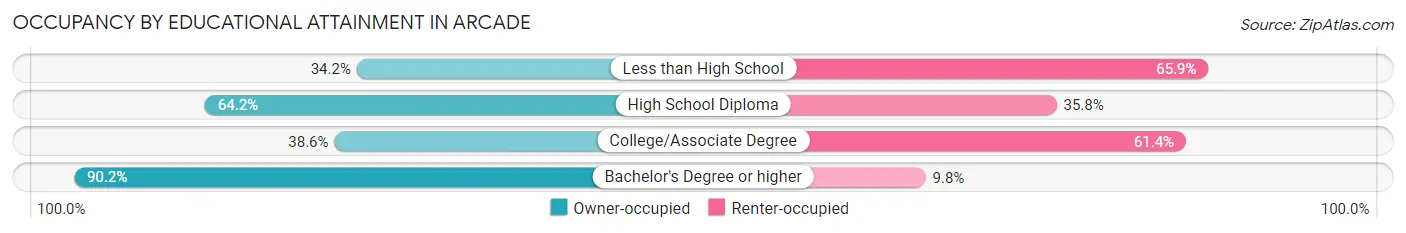
| Household Size | Owner-occupied | Renter-occupied |
| Less than High School | 14 (34.2%) | 27 (65.8%) |
| High School Diploma | 194 (64.2%) | 108 (35.8%) |
| College/Associate Degree | 191 (38.6%) | 304 (61.4%) |
| Bachelor's Degree or higher | 184 (90.2%) | 20 (9.8%) |
Occupancy by Age of Householder in Arcade
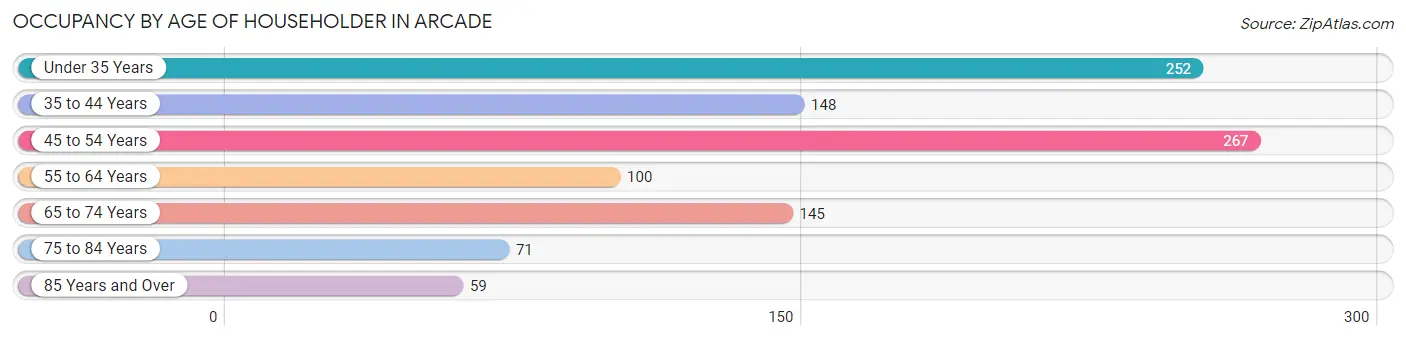
| Age Bracket | # Households | % Households |
| Under 35 Years | 252 | 24.2% |
| 35 to 44 Years | 148 | 14.2% |
| 45 to 54 Years | 267 | 25.6% |
| 55 to 64 Years | 100 | 9.6% |
| 65 to 74 Years | 145 | 13.9% |
| 75 to 84 Years | 71 | 6.8% |
| 85 Years and Over | 59 | 5.7% |
| Total | 1,042 | 100.0% |
Housing Finances in Arcade
Median Income by Occupancy in Arcade
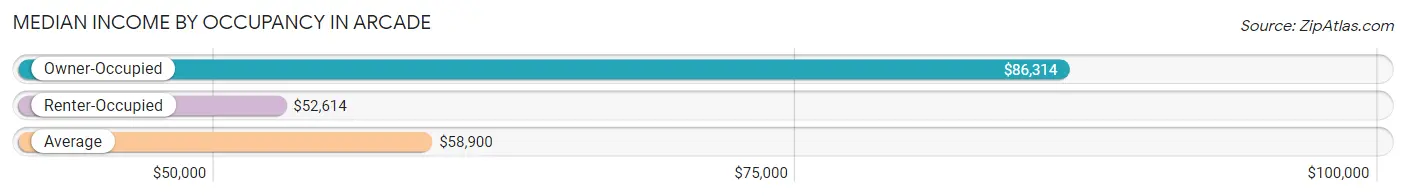
| Occupancy Type | # Households | Median Income |
| Owner-Occupied | 583 (55.9%) | $86,314 |
| Renter-Occupied | 459 (44.1%) | $52,614 |
| Average | 1,042 (100.0%) | $58,900 |
Occupancy by Householder Income Bracket in Arcade
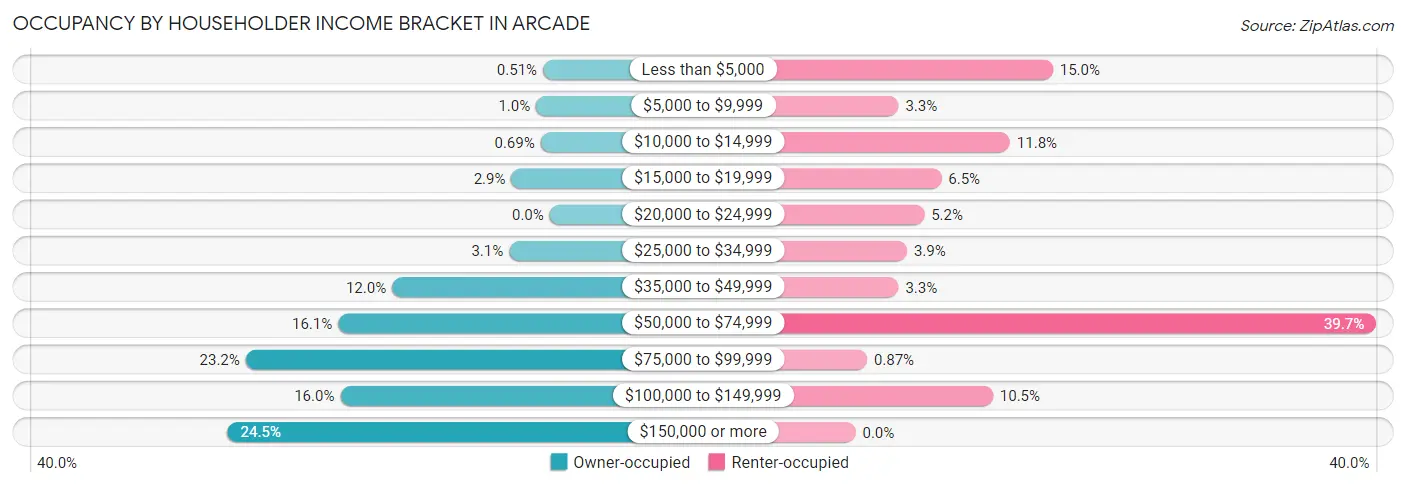
| Income Bracket | Owner-occupied | Renter-occupied |
| Less than $5,000 | 3 (0.5%) | 69 (15.0%) |
| $5,000 to $9,999 | 6 (1.0%) | 15 (3.3%) |
| $10,000 to $14,999 | 4 (0.7%) | 54 (11.8%) |
| $15,000 to $19,999 | 17 (2.9%) | 30 (6.5%) |
| $20,000 to $24,999 | 0 (0.0%) | 24 (5.2%) |
| $25,000 to $34,999 | 18 (3.1%) | 18 (3.9%) |
| $35,000 to $49,999 | 70 (12.0%) | 15 (3.3%) |
| $50,000 to $74,999 | 94 (16.1%) | 182 (39.7%) |
| $75,000 to $99,999 | 135 (23.2%) | 4 (0.9%) |
| $100,000 to $149,999 | 93 (16.0%) | 48 (10.5%) |
| $150,000 or more | 143 (24.5%) | 0 (0.0%) |
| Total | 583 (100.0%) | 459 (100.0%) |
Monthly Housing Cost Tiers in Arcade
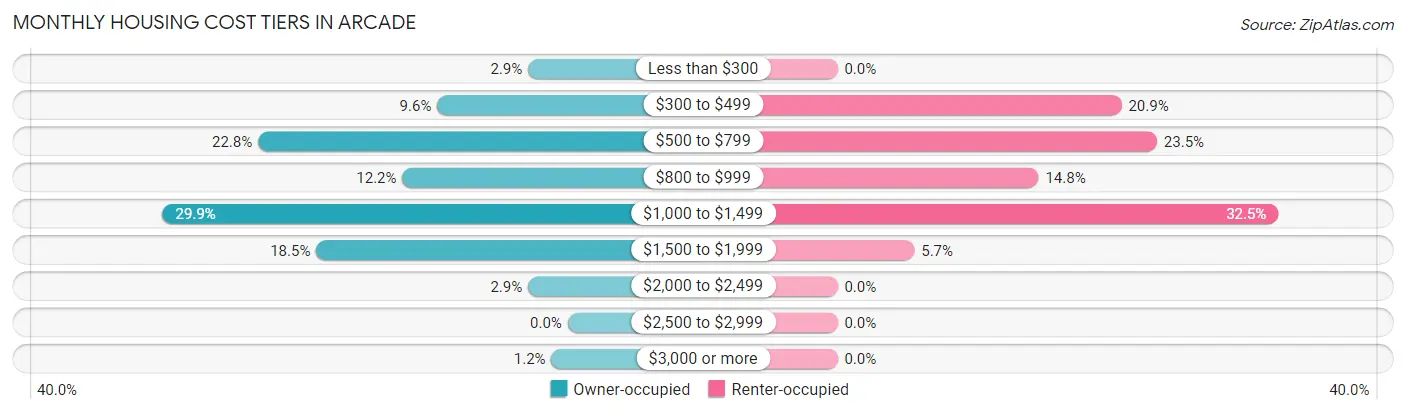
| Monthly Cost | Owner-occupied | Renter-occupied |
| Less than $300 | 17 (2.9%) | 0 (0.0%) |
| $300 to $499 | 56 (9.6%) | 96 (20.9%) |
| $500 to $799 | 133 (22.8%) | 108 (23.5%) |
| $800 to $999 | 71 (12.2%) | 68 (14.8%) |
| $1,000 to $1,499 | 174 (29.8%) | 149 (32.5%) |
| $1,500 to $1,999 | 108 (18.5%) | 26 (5.7%) |
| $2,000 to $2,499 | 17 (2.9%) | 0 (0.0%) |
| $2,500 to $2,999 | 0 (0.0%) | 0 (0.0%) |
| $3,000 or more | 7 (1.2%) | 0 (0.0%) |
| Total | 583 (100.0%) | 459 (100.0%) |
Physical Housing Characteristics in Arcade
Housing Structures in Arcade
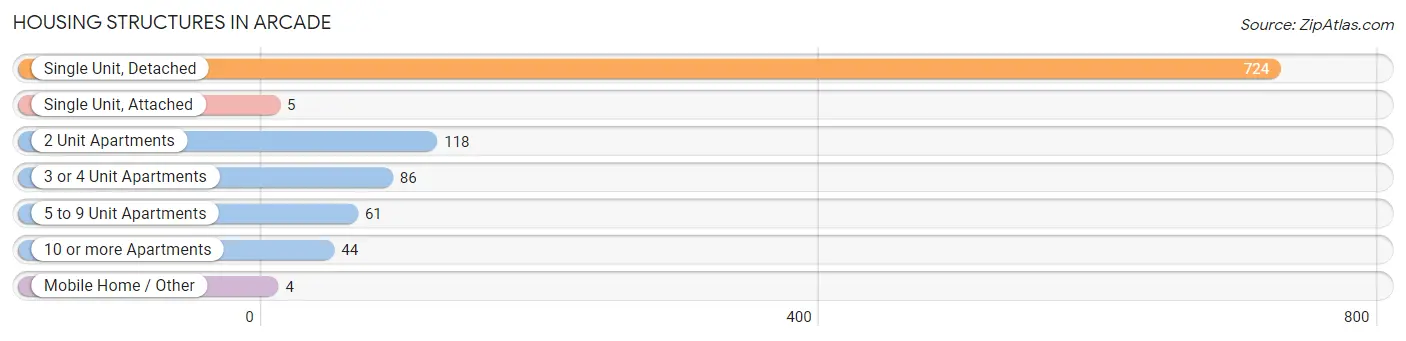
| Structure Type | # Housing Units | % Housing Units |
| Single Unit, Detached | 724 | 69.5% |
| Single Unit, Attached | 5 | 0.5% |
| 2 Unit Apartments | 118 | 11.3% |
| 3 or 4 Unit Apartments | 86 | 8.3% |
| 5 to 9 Unit Apartments | 61 | 5.9% |
| 10 or more Apartments | 44 | 4.2% |
| Mobile Home / Other | 4 | 0.4% |
| Total | 1,042 | 100.0% |
Housing Structures by Occupancy in Arcade
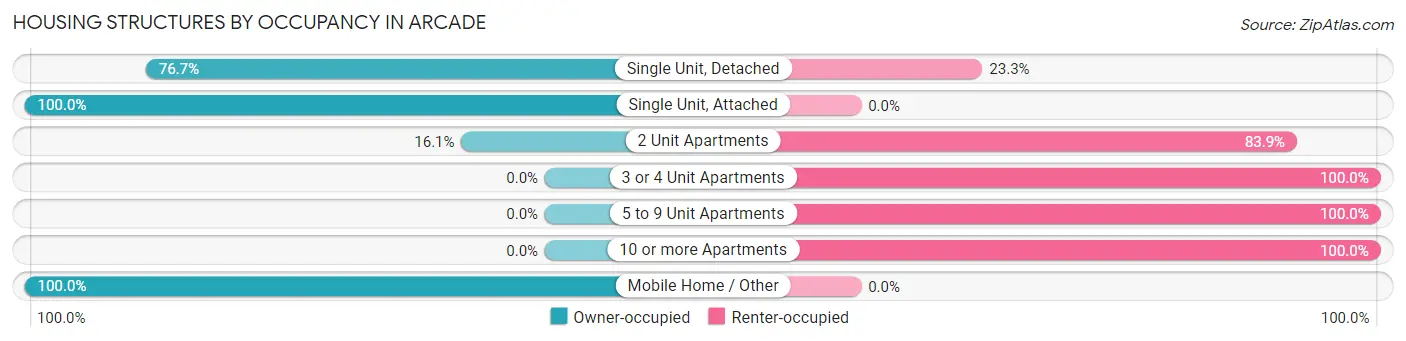
| Structure Type | Owner-occupied | Renter-occupied |
| Single Unit, Detached | 555 (76.7%) | 169 (23.3%) |
| Single Unit, Attached | 5 (100.0%) | 0 (0.0%) |
| 2 Unit Apartments | 19 (16.1%) | 99 (83.9%) |
| 3 or 4 Unit Apartments | 0 (0.0%) | 86 (100.0%) |
| 5 to 9 Unit Apartments | 0 (0.0%) | 61 (100.0%) |
| 10 or more Apartments | 0 (0.0%) | 44 (100.0%) |
| Mobile Home / Other | 4 (100.0%) | 0 (0.0%) |
| Total | 583 (55.9%) | 459 (44.1%) |
Housing Structures by Number of Rooms in Arcade
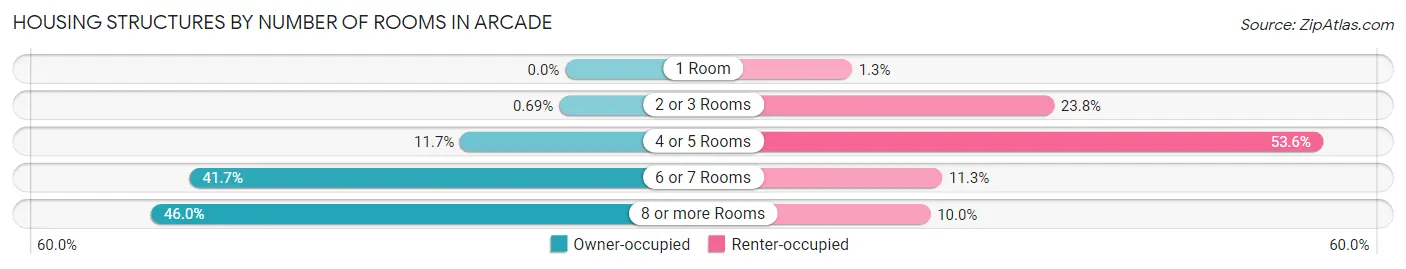
| Number of Rooms | Owner-occupied | Renter-occupied |
| 1 Room | 0 (0.0%) | 6 (1.3%) |
| 2 or 3 Rooms | 4 (0.7%) | 109 (23.7%) |
| 4 or 5 Rooms | 68 (11.7%) | 246 (53.6%) |
| 6 or 7 Rooms | 243 (41.7%) | 52 (11.3%) |
| 8 or more Rooms | 268 (46.0%) | 46 (10.0%) |
| Total | 583 (100.0%) | 459 (100.0%) |
Housing Structure by Heating Type in Arcade
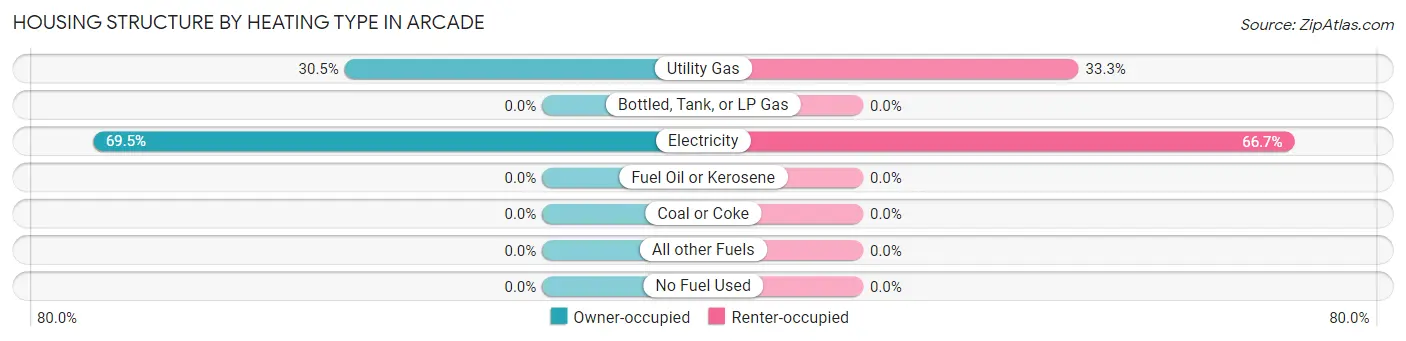
| Heating Type | Owner-occupied | Renter-occupied |
| Utility Gas | 178 (30.5%) | 153 (33.3%) |
| Bottled, Tank, or LP Gas | 0 (0.0%) | 0 (0.0%) |
| Electricity | 405 (69.5%) | 306 (66.7%) |
| Fuel Oil or Kerosene | 0 (0.0%) | 0 (0.0%) |
| Coal or Coke | 0 (0.0%) | 0 (0.0%) |
| All other Fuels | 0 (0.0%) | 0 (0.0%) |
| No Fuel Used | 0 (0.0%) | 0 (0.0%) |
| Total | 583 (100.0%) | 459 (100.0%) |
Household Vehicle Usage in Arcade
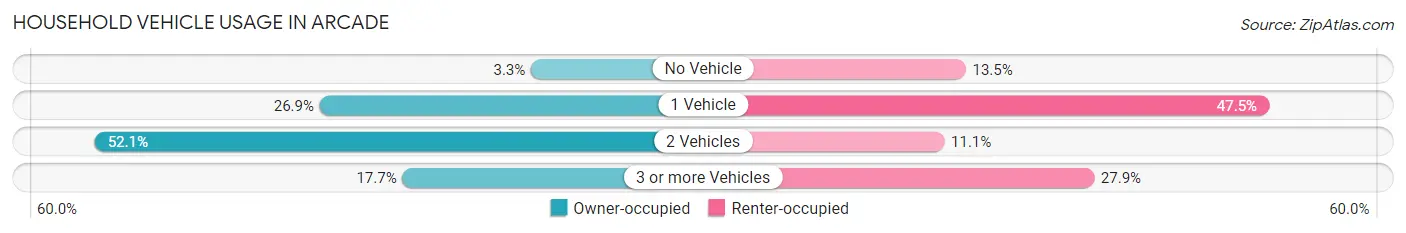
| Vehicles per Household | Owner-occupied | Renter-occupied |
| No Vehicle | 19 (3.3%) | 62 (13.5%) |
| 1 Vehicle | 157 (26.9%) | 218 (47.5%) |
| 2 Vehicles | 304 (52.1%) | 51 (11.1%) |
| 3 or more Vehicles | 103 (17.7%) | 128 (27.9%) |
| Total | 583 (100.0%) | 459 (100.0%) |
Real Estate & Mortgages in Arcade
Real Estate and Mortgage Overview in Arcade
| Characteristic | Without Mortgage | With Mortgage |
| Housing Units | 241 | 342 |
| Median Property Value | $137,500 | $156,700 |
| Median Household Income | $63,750 | $124 |
| Monthly Housing Costs | $571 | $0 |
| Real Estate Taxes | $3,961 | $15 |
Property Value by Mortgage Status in Arcade
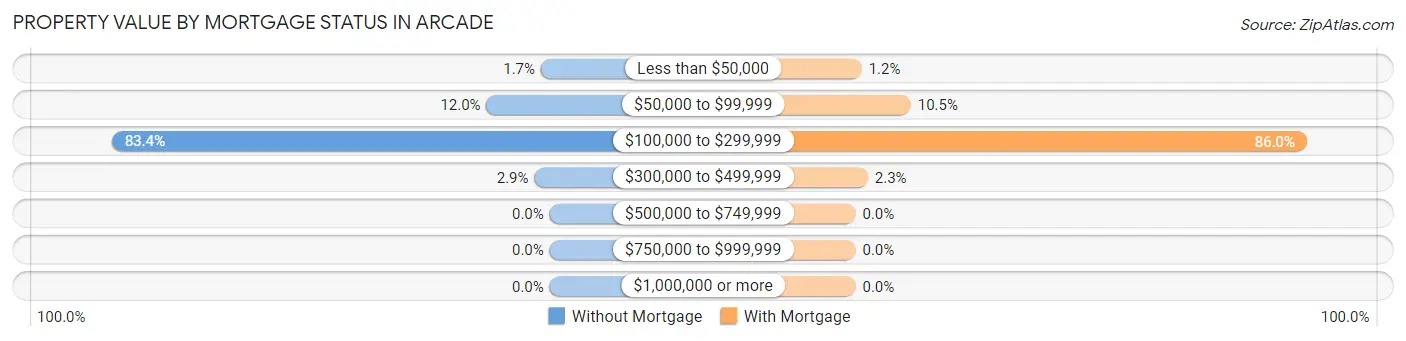
| Property Value | Without Mortgage | With Mortgage |
| Less than $50,000 | 4 (1.7%) | 4 (1.2%) |
| $50,000 to $99,999 | 29 (12.0%) | 36 (10.5%) |
| $100,000 to $299,999 | 201 (83.4%) | 294 (86.0%) |
| $300,000 to $499,999 | 7 (2.9%) | 8 (2.3%) |
| $500,000 to $749,999 | 0 (0.0%) | 0 (0.0%) |
| $750,000 to $999,999 | 0 (0.0%) | 0 (0.0%) |
| $1,000,000 or more | 0 (0.0%) | 0 (0.0%) |
| Total | 241 (100.0%) | 342 (100.0%) |
Household Income by Mortgage Status in Arcade
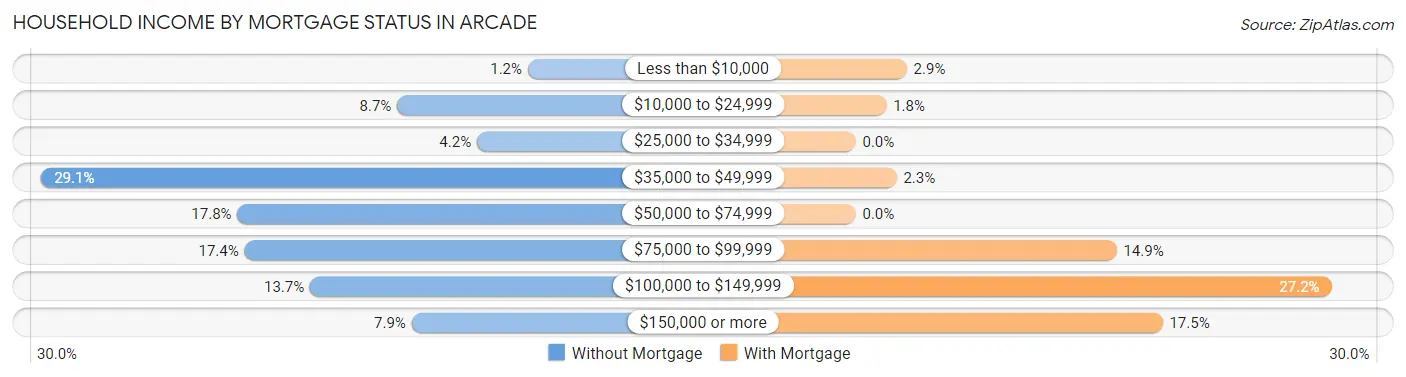
| Household Income | Without Mortgage | With Mortgage |
| Less than $10,000 | 3 (1.2%) | 10 (2.9%) |
| $10,000 to $24,999 | 21 (8.7%) | 6 (1.8%) |
| $25,000 to $34,999 | 10 (4.2%) | 0 (0.0%) |
| $35,000 to $49,999 | 70 (29.0%) | 8 (2.3%) |
| $50,000 to $74,999 | 43 (17.8%) | 0 (0.0%) |
| $75,000 to $99,999 | 42 (17.4%) | 51 (14.9%) |
| $100,000 to $149,999 | 33 (13.7%) | 93 (27.2%) |
| $150,000 or more | 19 (7.9%) | 60 (17.5%) |
| Total | 241 (100.0%) | 342 (100.0%) |
Property Value to Household Income Ratio in Arcade
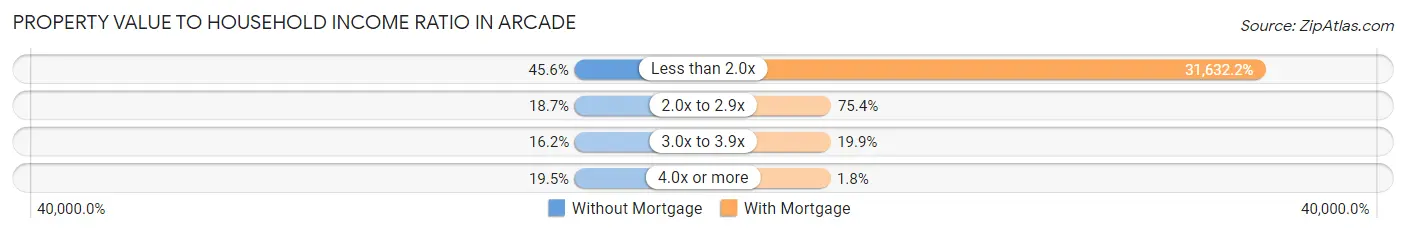
| Value-to-Income Ratio | Without Mortgage | With Mortgage |
| Less than 2.0x | 110 (45.6%) | 108,182 (31,632.2%) |
| 2.0x to 2.9x | 45 (18.7%) | 258 (75.4%) |
| 3.0x to 3.9x | 39 (16.2%) | 68 (19.9%) |
| 4.0x or more | 47 (19.5%) | 6 (1.8%) |
| Total | 241 (100.0%) | 342 (100.0%) |
Real Estate Taxes by Mortgage Status in Arcade
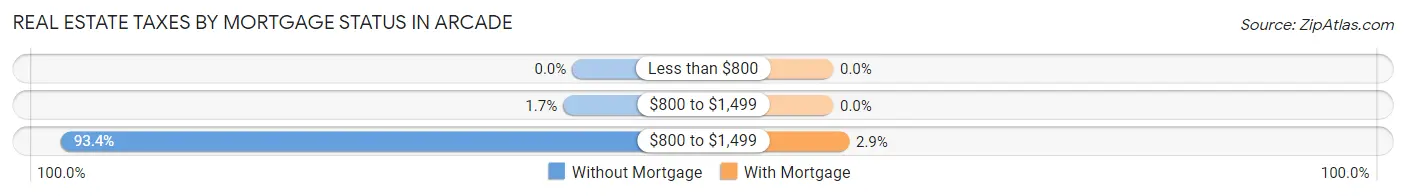
| Property Taxes | Without Mortgage | With Mortgage |
| Less than $800 | 0 (0.0%) | 0 (0.0%) |
| $800 to $1,499 | 4 (1.7%) | 0 (0.0%) |
| $800 to $1,499 | 225 (93.4%) | 10 (2.9%) |
| Total | 241 (100.0%) | 342 (100.0%) |
Health & Disability in Arcade
Health Insurance Coverage by Age in Arcade
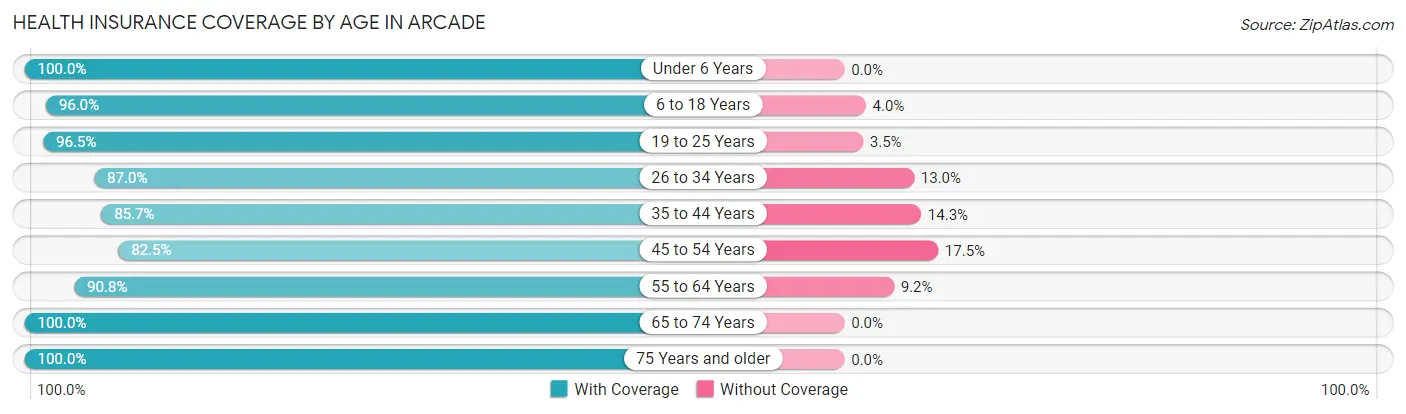
| Age Bracket | With Coverage | Without Coverage |
| Under 6 Years | 165 (100.0%) | 0 (0.0%) |
| 6 to 18 Years | 290 (96.0%) | 12 (4.0%) |
| 19 to 25 Years | 279 (96.5%) | 10 (3.5%) |
| 26 to 34 Years | 161 (87.0%) | 24 (13.0%) |
| 35 to 44 Years | 204 (85.7%) | 34 (14.3%) |
| 45 to 54 Years | 293 (82.5%) | 62 (17.5%) |
| 55 to 64 Years | 177 (90.8%) | 18 (9.2%) |
| 65 to 74 Years | 211 (100.0%) | 0 (0.0%) |
| 75 Years and older | 148 (100.0%) | 0 (0.0%) |
| Total | 1,928 (92.3%) | 160 (7.7%) |
Health Insurance Coverage by Citizenship Status in Arcade
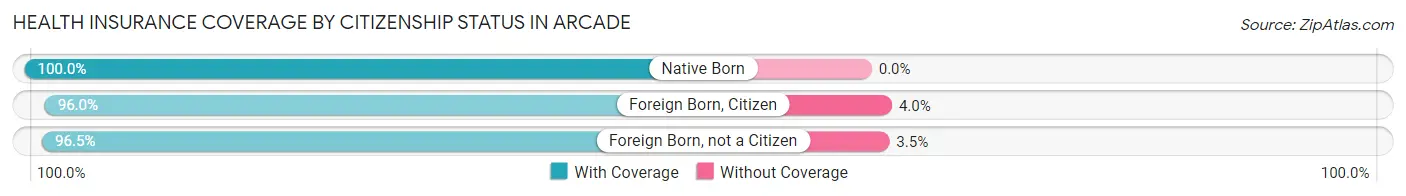
| Citizenship Status | With Coverage | Without Coverage |
| Native Born | 165 (100.0%) | 0 (0.0%) |
| Foreign Born, Citizen | 290 (96.0%) | 12 (4.0%) |
| Foreign Born, not a Citizen | 279 (96.5%) | 10 (3.5%) |
Health Insurance Coverage by Household Income in Arcade
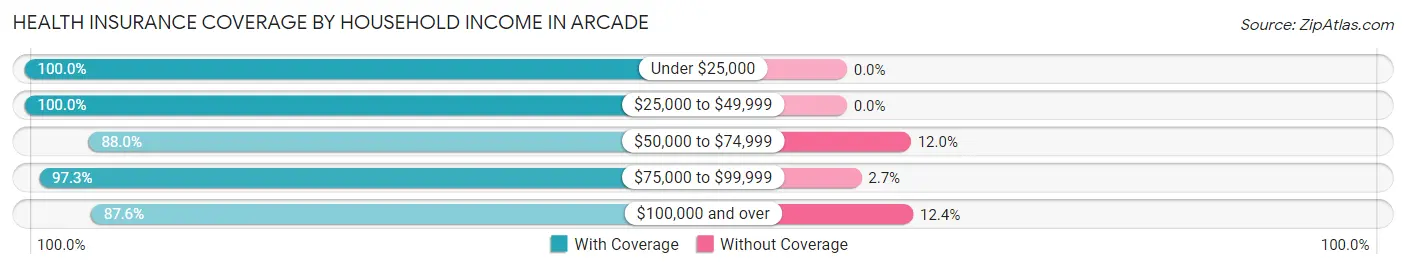
| Household Income | With Coverage | Without Coverage |
| Under $25,000 | 284 (100.0%) | 0 (0.0%) |
| $25,000 to $49,999 | 203 (100.0%) | 0 (0.0%) |
| $50,000 to $74,999 | 463 (88.0%) | 63 (12.0%) |
| $75,000 to $99,999 | 357 (97.3%) | 10 (2.7%) |
| $100,000 and over | 614 (87.6%) | 87 (12.4%) |
Public vs Private Health Insurance Coverage by Age in Arcade
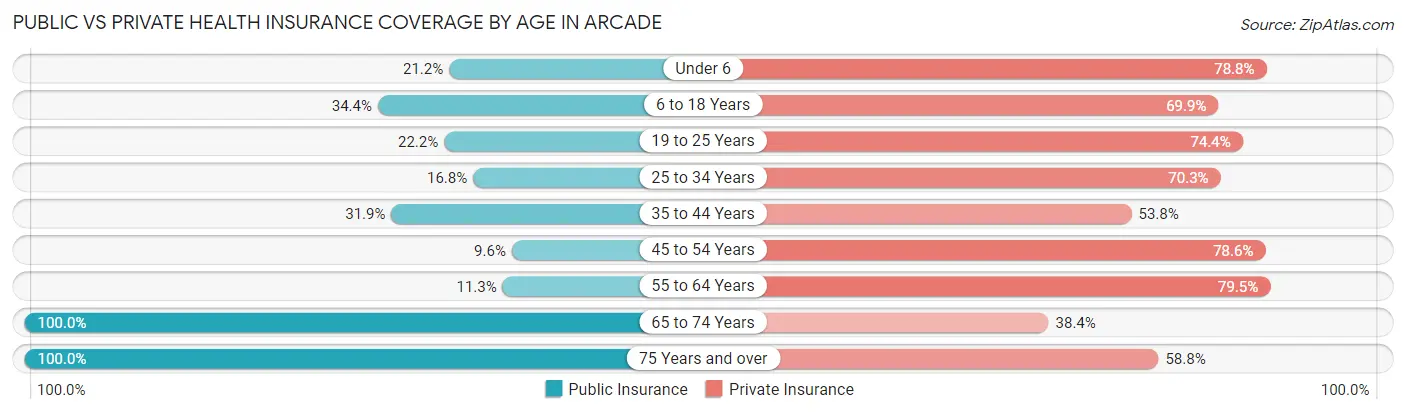
| Age Bracket | Public Insurance | Private Insurance |
| Under 6 | 35 (21.2%) | 130 (78.8%) |
| 6 to 18 Years | 104 (34.4%) | 211 (69.9%) |
| 19 to 25 Years | 64 (22.2%) | 215 (74.4%) |
| 25 to 34 Years | 31 (16.8%) | 130 (70.3%) |
| 35 to 44 Years | 76 (31.9%) | 128 (53.8%) |
| 45 to 54 Years | 34 (9.6%) | 279 (78.6%) |
| 55 to 64 Years | 22 (11.3%) | 155 (79.5%) |
| 65 to 74 Years | 211 (100.0%) | 81 (38.4%) |
| 75 Years and over | 148 (100.0%) | 87 (58.8%) |
| Total | 725 (34.7%) | 1,416 (67.8%) |
Disability Status by Sex by Age in Arcade
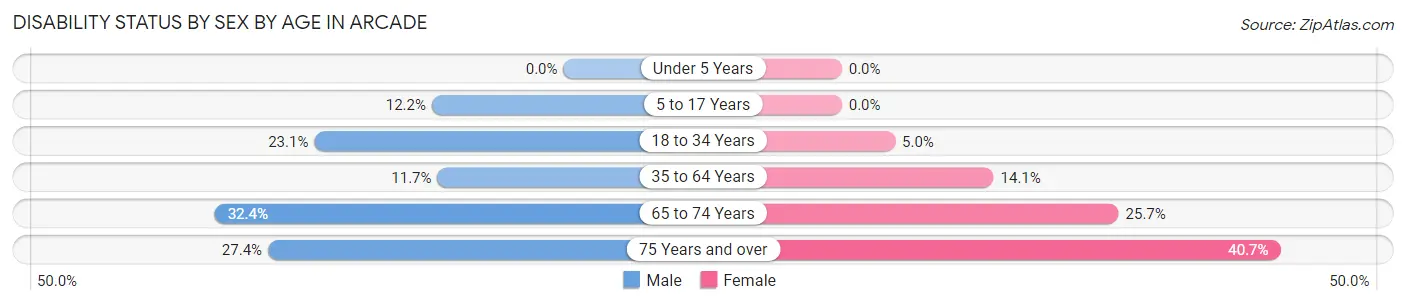
| Age Bracket | Male | Female |
| Under 5 Years | 0 (0.0%) | 0 (0.0%) |
| 5 to 17 Years | 21 (12.2%) | 0 (0.0%) |
| 18 to 34 Years | 46 (23.1%) | 14 (5.0%) |
| 35 to 64 Years | 49 (11.7%) | 52 (14.1%) |
| 65 to 74 Years | 33 (32.4%) | 28 (25.7%) |
| 75 Years and over | 17 (27.4%) | 35 (40.7%) |
Disability Class by Sex by Age in Arcade
Disability Class: Hearing Difficulty
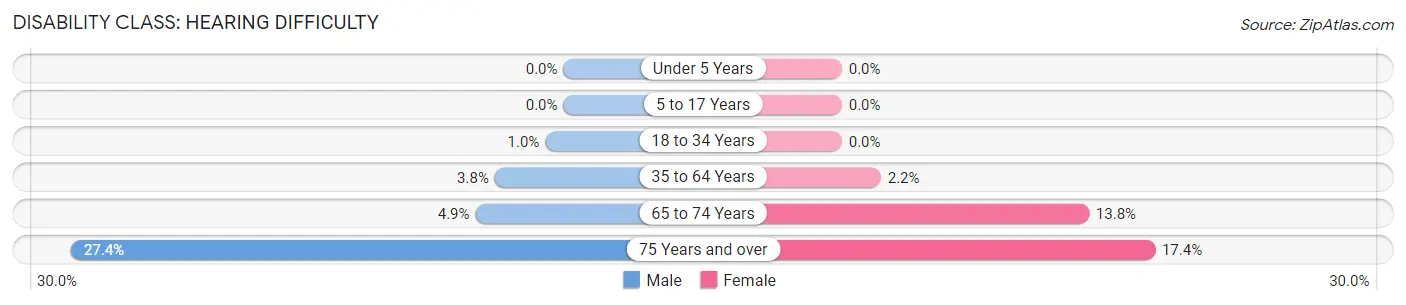
| Age Bracket | Male | Female |
| Under 5 Years | 0 (0.0%) | 0 (0.0%) |
| 5 to 17 Years | 0 (0.0%) | 0 (0.0%) |
| 18 to 34 Years | 2 (1.0%) | 0 (0.0%) |
| 35 to 64 Years | 16 (3.8%) | 8 (2.2%) |
| 65 to 74 Years | 5 (4.9%) | 15 (13.8%) |
| 75 Years and over | 17 (27.4%) | 15 (17.4%) |
Disability Class: Vision Difficulty
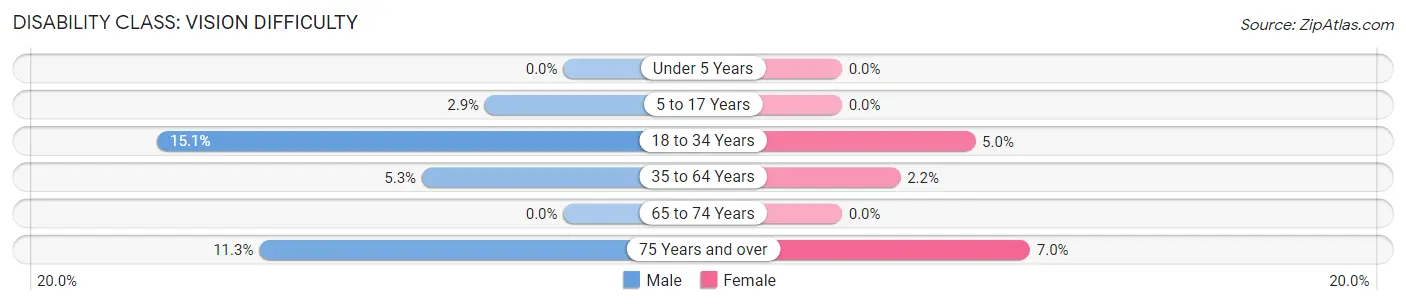
| Age Bracket | Male | Female |
| Under 5 Years | 0 (0.0%) | 0 (0.0%) |
| 5 to 17 Years | 5 (2.9%) | 0 (0.0%) |
| 18 to 34 Years | 30 (15.1%) | 14 (5.0%) |
| 35 to 64 Years | 22 (5.2%) | 8 (2.2%) |
| 65 to 74 Years | 0 (0.0%) | 0 (0.0%) |
| 75 Years and over | 7 (11.3%) | 6 (7.0%) |
Disability Class: Cognitive Difficulty
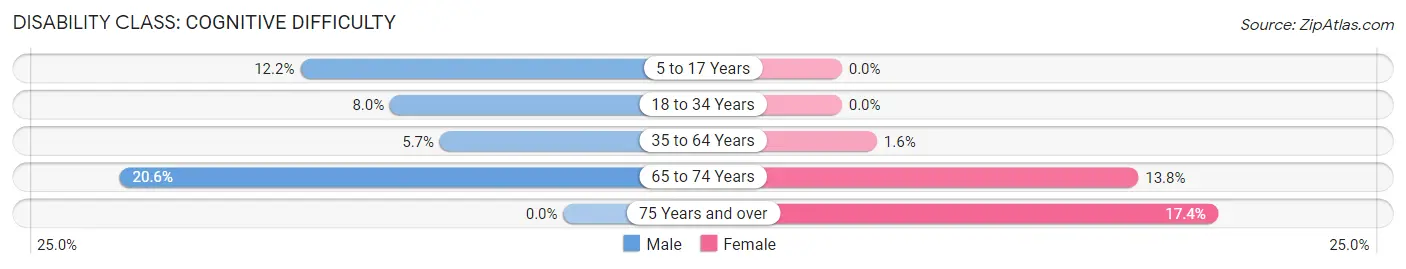
| Age Bracket | Male | Female |
| 5 to 17 Years | 21 (12.2%) | 0 (0.0%) |
| 18 to 34 Years | 16 (8.0%) | 0 (0.0%) |
| 35 to 64 Years | 24 (5.7%) | 6 (1.6%) |
| 65 to 74 Years | 21 (20.6%) | 15 (13.8%) |
| 75 Years and over | 0 (0.0%) | 15 (17.4%) |
Disability Class: Ambulatory Difficulty
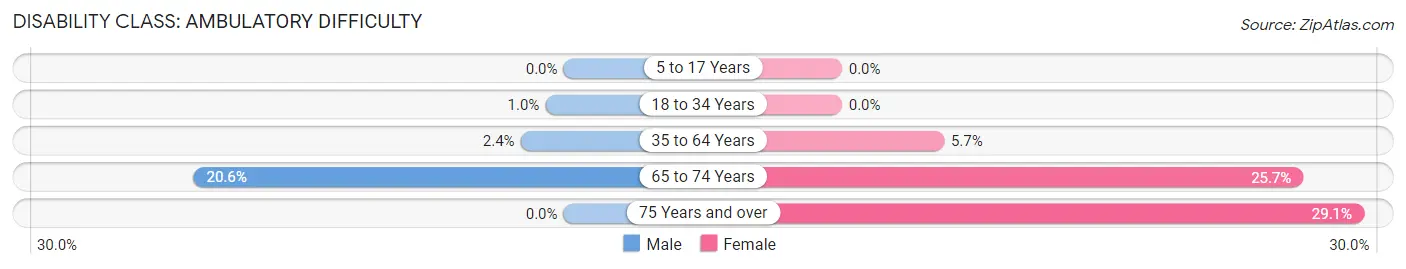
| Age Bracket | Male | Female |
| 5 to 17 Years | 0 (0.0%) | 0 (0.0%) |
| 18 to 34 Years | 2 (1.0%) | 0 (0.0%) |
| 35 to 64 Years | 10 (2.4%) | 21 (5.7%) |
| 65 to 74 Years | 21 (20.6%) | 28 (25.7%) |
| 75 Years and over | 0 (0.0%) | 25 (29.1%) |
Disability Class: Self-Care Difficulty
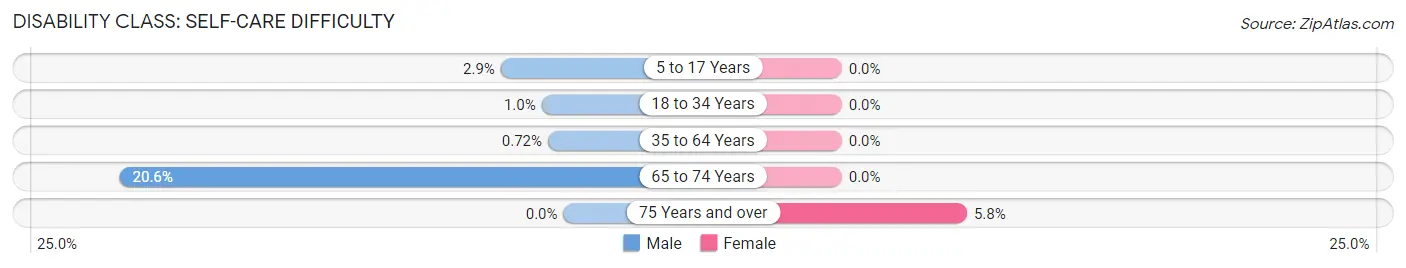
| Age Bracket | Male | Female |
| 5 to 17 Years | 5 (2.9%) | 0 (0.0%) |
| 18 to 34 Years | 2 (1.0%) | 0 (0.0%) |
| 35 to 64 Years | 3 (0.7%) | 0 (0.0%) |
| 65 to 74 Years | 21 (20.6%) | 0 (0.0%) |
| 75 Years and over | 0 (0.0%) | 5 (5.8%) |
Technology Access in Arcade
Computing Device Access in Arcade
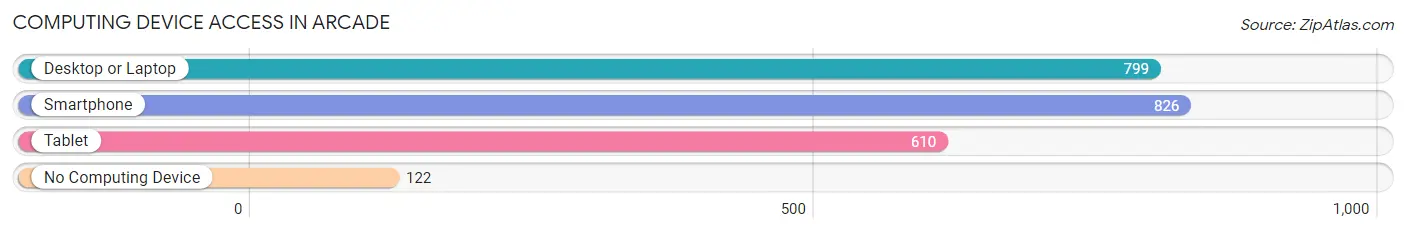
| Device Type | # Households | % Households |
| Desktop or Laptop | 799 | 76.7% |
| Smartphone | 826 | 79.3% |
| Tablet | 610 | 58.5% |
| No Computing Device | 122 | 11.7% |
| Total | 1,042 | 100.0% |
Internet Access in Arcade
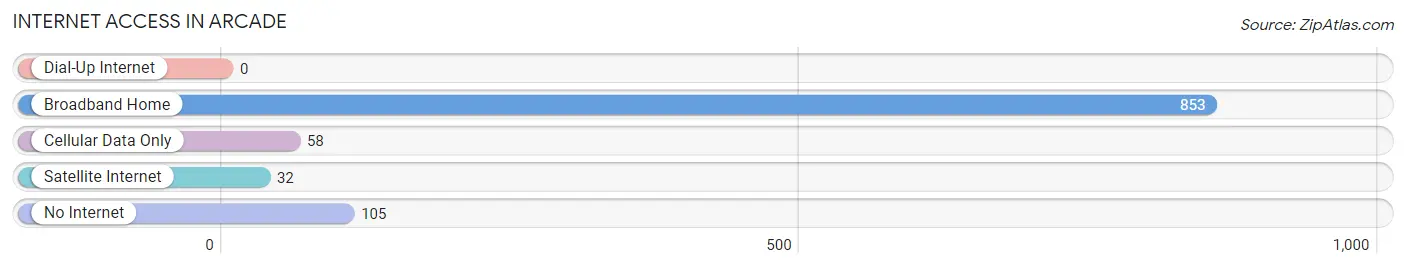
| Internet Type | # Households | % Households |
| Dial-Up Internet | 0 | 0.0% |
| Broadband Home | 853 | 81.9% |
| Cellular Data Only | 58 | 5.6% |
| Satellite Internet | 32 | 3.1% |
| No Internet | 105 | 10.1% |
| Total | 1,042 | 100.0% |
Arcade Summary
Arcade is a small village located in Wyoming County, New York. It is situated in the western part of the state, about 30 miles east of Buffalo. The village has a population of 1,619 as of the 2010 census.
History
The area that is now Arcade was first settled in 1811 by a group of settlers from Connecticut. The village was originally known as "Hardscrabble" and was later renamed "Arcade" in 1825. The name was chosen to reflect the village's location at the intersection of two major roads.
The village was incorporated in 1848 and was an important stop on the Underground Railroad. During the Civil War, Arcade was a major supplier of food and supplies to the Union Army.
Geography
Arcade is located at 42°45'N 78°25'W (42.75, -78.42). It is situated in the western part of Wyoming County, about 30 miles east of Buffalo. The village is located on the banks of the Tonawanda Creek and is surrounded by rolling hills and farmland.
The total area of the village is 1.2 square miles, all of which is land. The village is located in the Finger Lakes region of New York and is part of the Buffalo-Niagara Falls metropolitan area.
Economy
The economy of Arcade is largely based on agriculture and tourism. The village is home to several small businesses, including a grocery store, a hardware store, and a few restaurants.
The village is also home to several wineries and vineyards, which attract tourists from all over the region. The village is also home to a number of antique shops, which attract visitors from all over the state.
Demographics
As of the 2010 census, the population of Arcade was 1,619. The racial makeup of the village was 97.2% White, 0.7% African American, 0.3% Native American, 0.2% Asian, 0.1% Pacific Islander, 0.4% from other races, and 1.1% from two or more races. Hispanic or Latino of any race were 1.7% of the population.
The median income for a household in the village was $41,250, and the median income for a family was $50,000. The per capita income for the village was $20,845. About 8.3% of families and 10.2% of the population were below the poverty line, including 14.2% of those under age 18 and 5.2% of those age 65 or over.
Common Questions
What is the Total Population of Arcade?
Total Population of Arcade is 2,095.
What is the Total Male Population of Arcade?
Total Male Population of Arcade is 1,029.
What is the Total Female Population of Arcade?
Total Female Population of Arcade is 1,066.
What is the Ratio of Males per 100 Females in Arcade?
There are 96.53 Males per 100 Females in Arcade.
What is the Ratio of Females per 100 Males in Arcade?
There are 103.60 Females per 100 Males in Arcade.
What is the Median Population Age in Arcade?
Median Population Age in Arcade is 39.4 Years.
What is the Average Family Size in Arcade
Average Family Size in Arcade is 2.7 People.
What is the Average Household Size in Arcade
Average Household Size in Arcade is 2.0 People.
What is Per Capita Income in Arcade?
Per Capita income in Arcade is $38,065.
What is the Median Family Income in Arcade?
Median Family Income in Arcade is $94,338.
What is the Median Household income in Arcade?
Median Household Income in Arcade is $58,900.
What is Income or Wage Gap in Arcade?
Income or Wage Gap in Arcade is 35.5%.
Women in Arcade earn 64.5 cents for every dollar earned by a man.
What is Family Income Deficit in Arcade?
Family Income Deficit in Arcade is $13,000.
Families that are below poverty line in Arcade earn $13,000 less on average than the poverty threshold level.
What is Inequality or Gini Index in Arcade?
Inequality or Gini Index in Arcade is 0.44.
How Large is the Labor Force in Arcade?
There are 1,191 People in the Labor Forcein in Arcade.
What is the Percentage of People in the Labor Force in Arcade?
69.1% of People are in the Labor Force in Arcade.
What is the Unemployment Rate in Arcade?
Unemployment Rate in Arcade is 5.5%.