Apalachin, NY
Apalachin Map
Apalachin Overview
2,356
TOTAL POPULATION
1,168
MALE POPULATION
1,188
FEMALE POPULATION
98.32
MALES / 100 FEMALES
101.71
FEMALES / 100 MALES
39.1
MEDIAN AGE
3.1
AVG FAMILY SIZE
2.5
AVG HOUSEHOLD SIZE
$41,222
PER CAPITA INCOME
$116,453
AVG FAMILY INCOME
$76,161
AVG HOUSEHOLD INCOME
26.6%
WAGE / INCOME GAP [ % ]
73.4¢/ $1
WAGE / INCOME GAP [ $ ]
0.45
INEQUALITY / GINI INDEX
1,462
LABOR FORCE [ PEOPLE ]
77.5%
PERCENT IN LABOR FORCE
4.3%
UNEMPLOYMENT RATE
Apalachin Zip Codes
Apalachin Area Codes
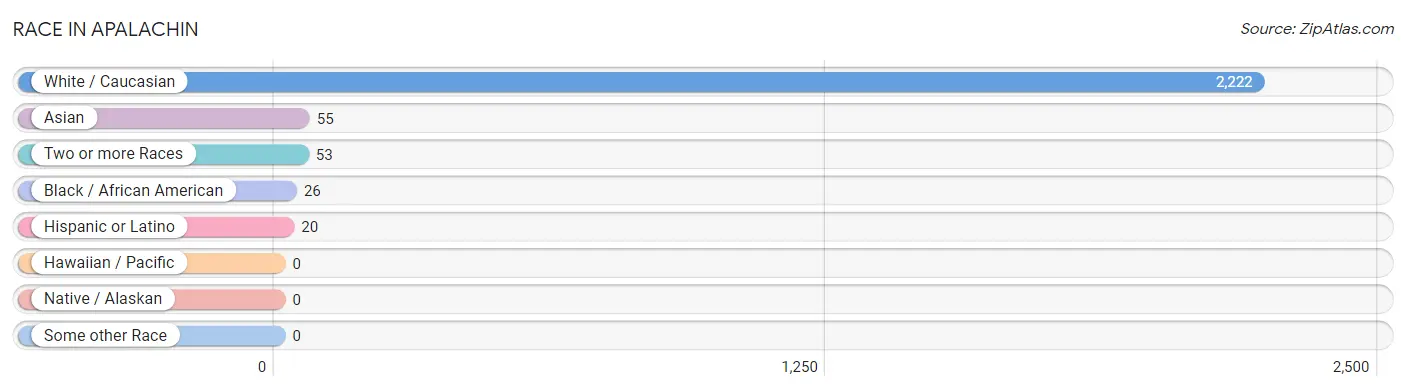
Race in Apalachin
The most populous races in Apalachin are White / Caucasian (2,222 | 94.3%), Asian (55 | 2.3%), and Two or more Races (53 | 2.2%).
| Race | # Population | % Population |
| Asian | 55 | 2.3% |
| Black / African American | 26 | 1.1% |
| Hawaiian / Pacific | 0 | 0.0% |
| Hispanic or Latino | 20 | 0.9% |
| Native / Alaskan | 0 | 0.0% |
| White / Caucasian | 2,222 | 94.3% |
| Two or more Races | 53 | 2.2% |
| Some other Race | 0 | 0.0% |
| Total | 2,356 | 100.0% |
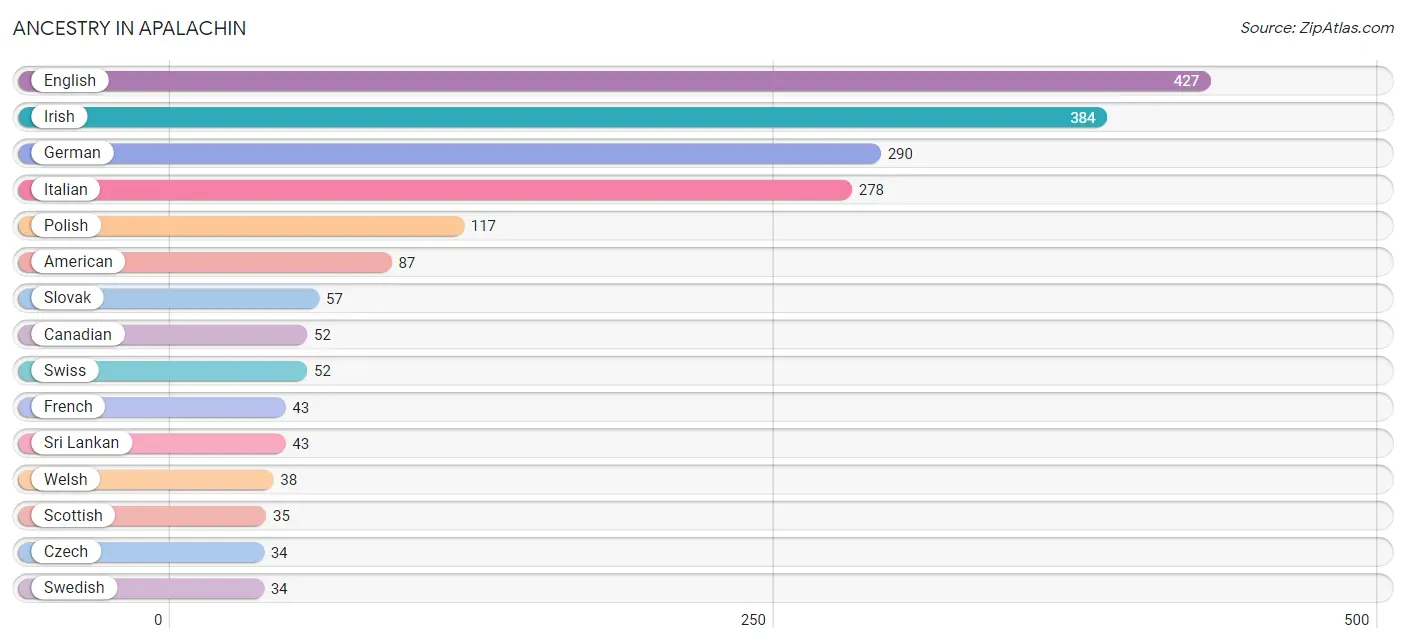
Ancestry in Apalachin
The most populous ancestries reported in Apalachin are English (427 | 18.1%), Irish (384 | 16.3%), German (290 | 12.3%), Italian (278 | 11.8%), and Polish (117 | 5.0%), together accounting for 63.5% of all Apalachin residents.
| Ancestry | # Population | % Population |
| American | 87 | 3.7% |
| Austrian | 25 | 1.1% |
| Canadian | 52 | 2.2% |
| Colombian | 19 | 0.8% |
| Cuban | 1 | 0.0% |
| Czech | 34 | 1.4% |
| Czechoslovakian | 7 | 0.3% |
| Danish | 9 | 0.4% |
| Dutch | 22 | 0.9% |
| Eastern European | 10 | 0.4% |
| English | 427 | 18.1% |
| French | 43 | 1.8% |
| French Canadian | 19 | 0.8% |
| German | 290 | 12.3% |
| Greek | 4 | 0.2% |
| Hungarian | 28 | 1.2% |
| Indian (Asian) | 6 | 0.3% |
| Irish | 384 | 16.3% |
| Italian | 278 | 11.8% |
| Lithuanian | 6 | 0.3% |
| Polish | 117 | 5.0% |
| Russian | 9 | 0.4% |
| Scotch-Irish | 9 | 0.4% |
| Scottish | 35 | 1.5% |
| Slavic | 9 | 0.4% |
| Slovak | 57 | 2.4% |
| South American | 19 | 0.8% |
| Sri Lankan | 43 | 1.8% |
| Swedish | 34 | 1.4% |
| Swiss | 52 | 2.2% |
| Thai | 6 | 0.3% |
| Welsh | 38 | 1.6% | View All 32 Rows |
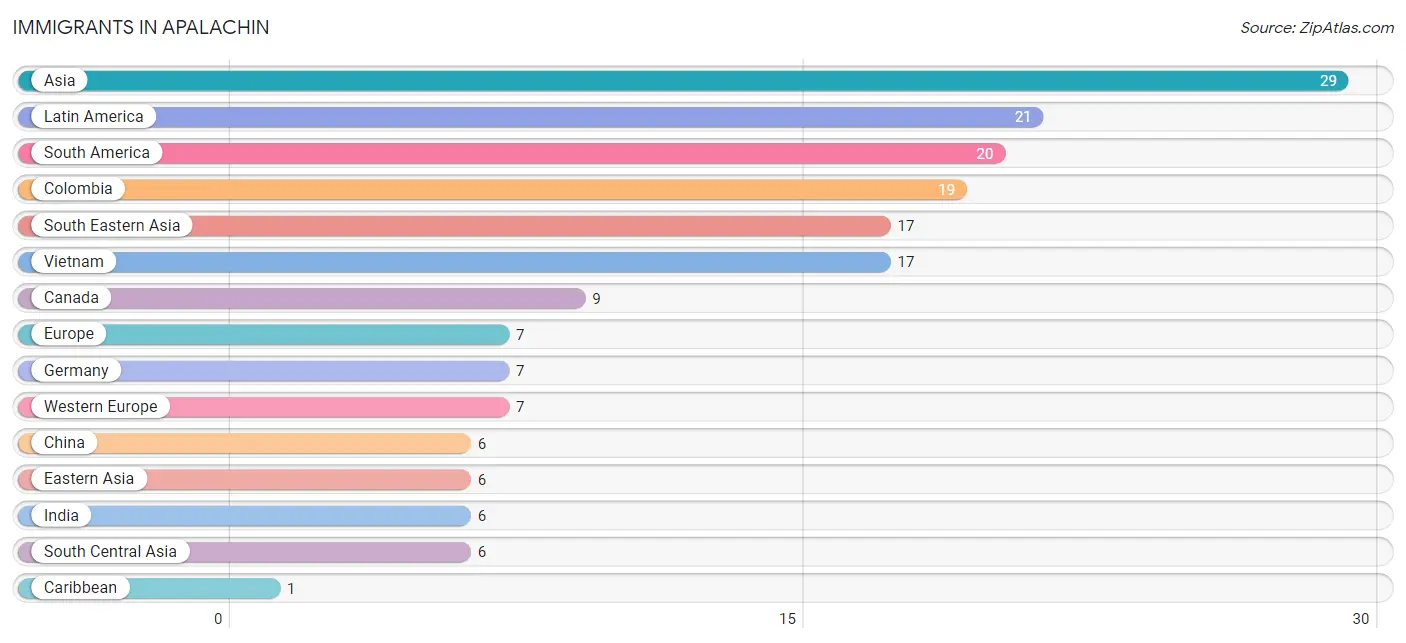
Immigrants in Apalachin
The most numerous immigrant groups reported in Apalachin came from Asia (29 | 1.2%), Latin America (21 | 0.9%), South America (20 | 0.9%), Colombia (19 | 0.8%), and South Eastern Asia (17 | 0.7%), together accounting for 4.5% of all Apalachin residents.
| Immigration Origin | # Population | % Population |
| Asia | 29 | 1.2% |
| Canada | 9 | 0.4% |
| Caribbean | 1 | 0.0% |
| China | 6 | 0.3% |
| Colombia | 19 | 0.8% |
| Cuba | 1 | 0.0% |
| Eastern Asia | 6 | 0.3% |
| Europe | 7 | 0.3% |
| Germany | 7 | 0.3% |
| India | 6 | 0.3% |
| Latin America | 21 | 0.9% |
| South America | 20 | 0.9% |
| South Central Asia | 6 | 0.3% |
| South Eastern Asia | 17 | 0.7% |
| Uruguay | 1 | 0.0% |
| Vietnam | 17 | 0.7% |
| Western Europe | 7 | 0.3% | View All 17 Rows |
Sex and Age in Apalachin
Sex and Age in Apalachin
The most populous age groups in Apalachin are 15 to 19 Years (167 | 14.3%) for men and 60 to 64 Years (134 | 11.3%) for women.
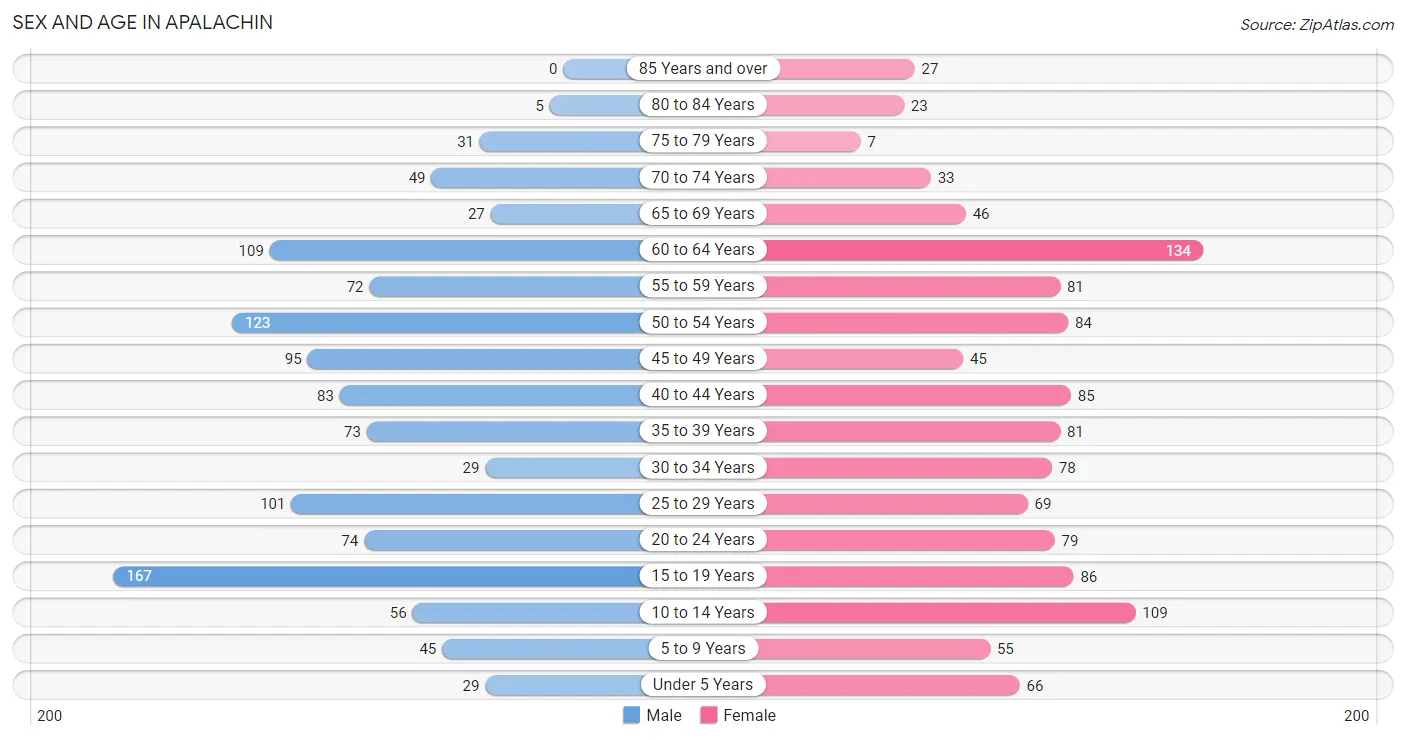
| Age Bracket | Male | Female |
| Under 5 Years | 29 (2.5%) | 66 (5.6%) |
| 5 to 9 Years | 45 (3.8%) | 55 (4.6%) |
| 10 to 14 Years | 56 (4.8%) | 109 (9.2%) |
| 15 to 19 Years | 167 (14.3%) | 86 (7.2%) |
| 20 to 24 Years | 74 (6.3%) | 79 (6.7%) |
| 25 to 29 Years | 101 (8.6%) | 69 (5.8%) |
| 30 to 34 Years | 29 (2.5%) | 78 (6.6%) |
| 35 to 39 Years | 73 (6.2%) | 81 (6.8%) |
| 40 to 44 Years | 83 (7.1%) | 85 (7.1%) |
| 45 to 49 Years | 95 (8.1%) | 45 (3.8%) |
| 50 to 54 Years | 123 (10.5%) | 84 (7.1%) |
| 55 to 59 Years | 72 (6.2%) | 81 (6.8%) |
| 60 to 64 Years | 109 (9.3%) | 134 (11.3%) |
| 65 to 69 Years | 27 (2.3%) | 46 (3.9%) |
| 70 to 74 Years | 49 (4.2%) | 33 (2.8%) |
| 75 to 79 Years | 31 (2.6%) | 7 (0.6%) |
| 80 to 84 Years | 5 (0.4%) | 23 (1.9%) |
| 85 Years and over | 0 (0.0%) | 27 (2.3%) |
| Total | 1,168 (100.0%) | 1,188 (100.0%) |
Families and Households in Apalachin
Median Family Size in Apalachin
The median family size in Apalachin is 3.12 persons per family, with married-couple families (398 | 69.2%) accounting for the largest median family size of 3.33 persons per family. On the other hand, single male/father families (97 | 16.9%) represent the smallest median family size with 2.47 persons per family.
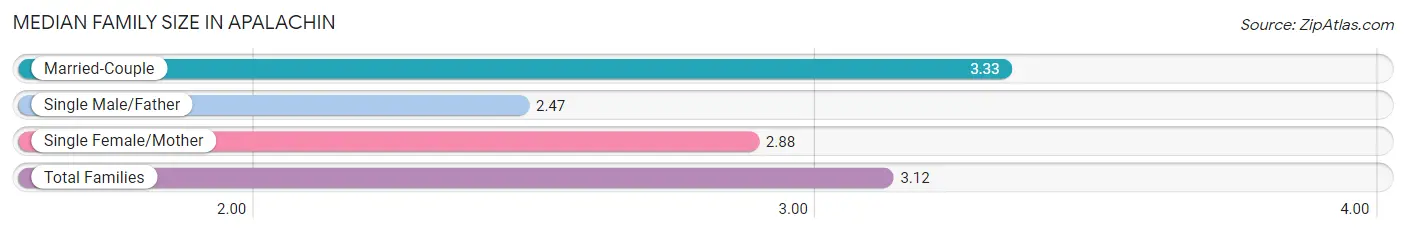
| Family Type | # Families | Family Size |
| Married-Couple | 398 (69.2%) | 3.33 |
| Single Male/Father | 97 (16.9%) | 2.47 |
| Single Female/Mother | 80 (13.9%) | 2.88 |
| Total Families | 575 (100.0%) | 3.12 |
Median Household Size in Apalachin
The median household size in Apalachin is 2.47 persons per household, with single female/mother households (80 | 8.6%) accounting for the largest median household size of 3.85 persons per household. non-family households (358 | 38.4%) represent the smallest median household size with 1.13 persons per household.
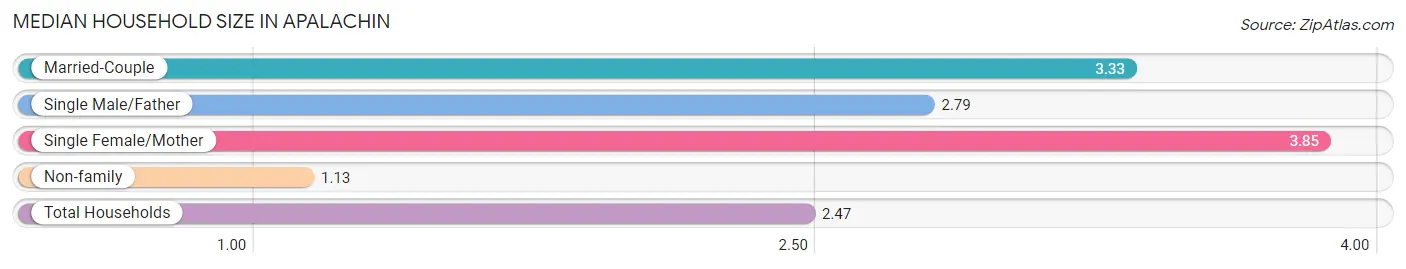
| Household Type | # Households | Household Size |
| Married-Couple | 398 (42.7%) | 3.33 |
| Single Male/Father | 97 (10.4%) | 2.79 |
| Single Female/Mother | 80 (8.6%) | 3.85 |
| Non-family | 358 (38.4%) | 1.13 |
| Total Households | 933 (100.0%) | 2.47 |
Household Size by Marriage Status in Apalachin
Out of a total of 933 households in Apalachin, 575 (61.6%) are family households, while 358 (38.4%) are nonfamily households. The most numerous type of family households are 2-person households, comprising 196, and the most common type of nonfamily households are 1-person households, comprising 315.
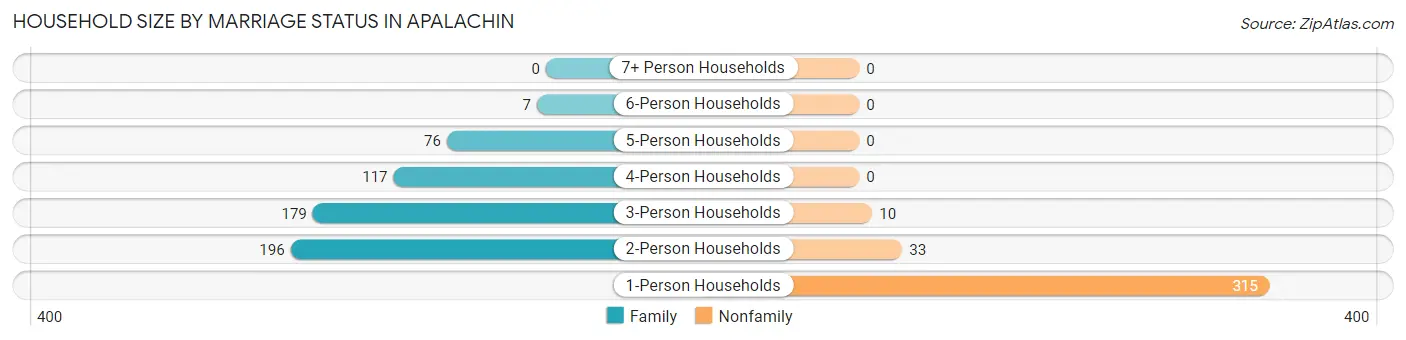
| Household Size | Family Households | Nonfamily Households |
| 1-Person Households | - | 315 (33.8%) |
| 2-Person Households | 196 (21.0%) | 33 (3.5%) |
| 3-Person Households | 179 (19.2%) | 10 (1.1%) |
| 4-Person Households | 117 (12.5%) | 0 (0.0%) |
| 5-Person Households | 76 (8.2%) | 0 (0.0%) |
| 6-Person Households | 7 (0.7%) | 0 (0.0%) |
| 7+ Person Households | 0 (0.0%) | 0 (0.0%) |
| Total | 575 (61.6%) | 358 (38.4%) |
Female Fertility in Apalachin
Fertility by Age in Apalachin
Average fertility rate in Apalachin is 36.0 births per 1,000 women. Women in the age bracket of 20 to 34 years have the highest fertility rate with 84.0 births per 1,000 women. Women in the age bracket of 20 to 34 years acount for 100.0% of all women with births.
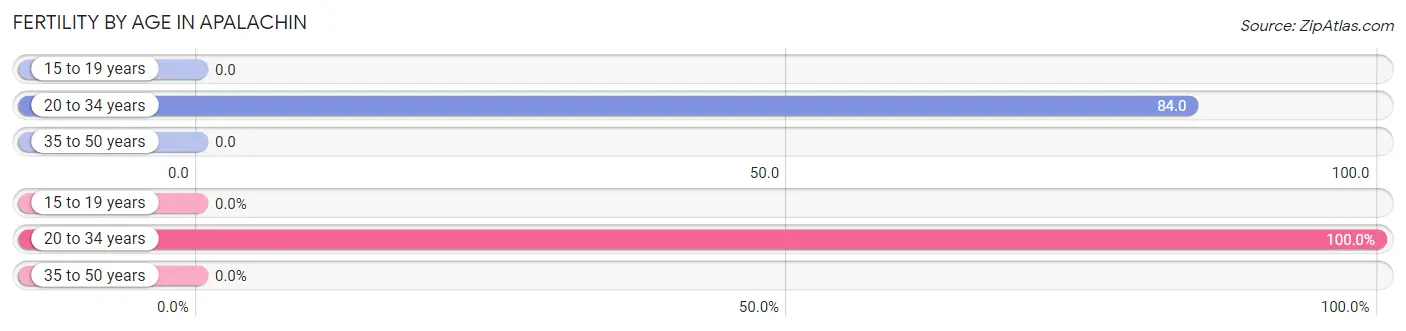
| Age Bracket | Women with Births | Births / 1,000 Women |
| 15 to 19 years | 0 (0.0%) | 0.0 |
| 20 to 34 years | 19 (100.0%) | 84.0 |
| 35 to 50 years | 0 (0.0%) | 0.0 |
| Total | 19 (100.0%) | 36.0 |
Fertility by Age by Marriage Status in Apalachin
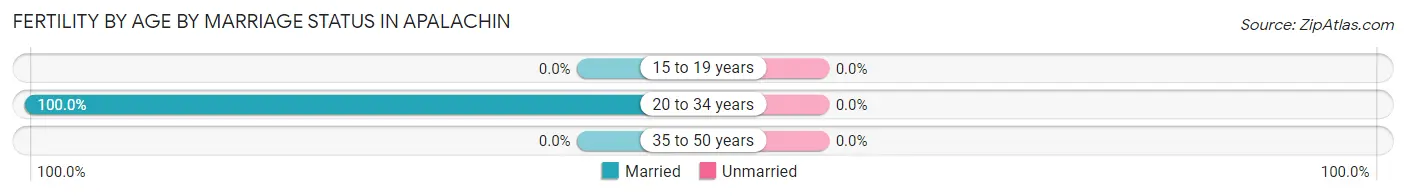
| Age Bracket | Married | Unmarried |
| 15 to 19 years | 0 (0.0%) | 0 (0.0%) |
| 20 to 34 years | 19 (100.0%) | 0 (0.0%) |
| 35 to 50 years | 0 (0.0%) | 0 (0.0%) |
| Total | 19 (100.0%) | 0 (0.0%) |
Fertility by Education in Apalachin
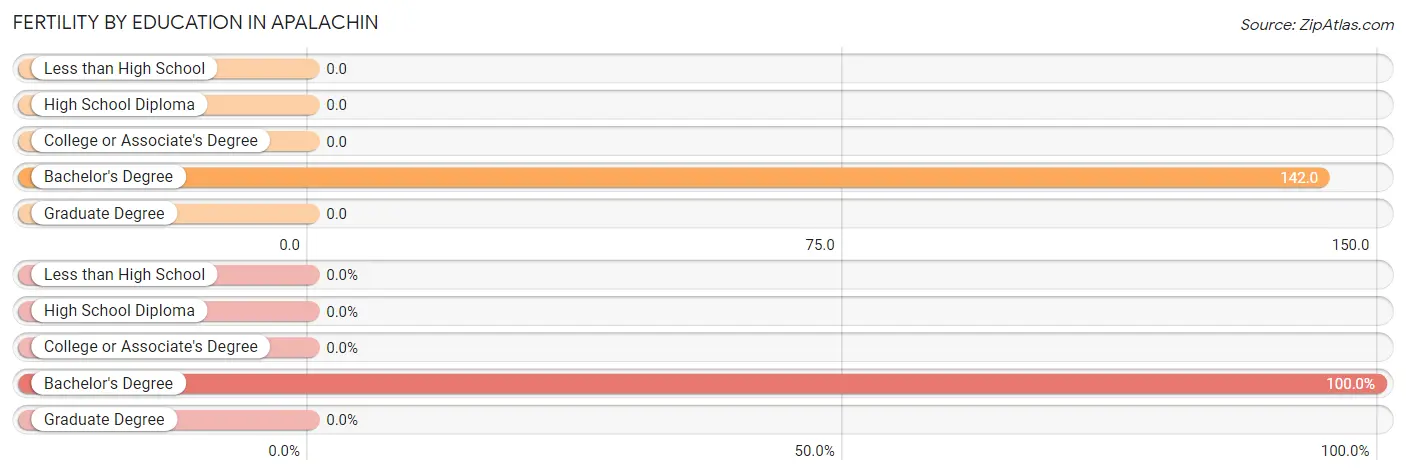
| Educational Attainment | Women with Births | Births / 1,000 Women |
| Less than High School | 0 (0.0%) | 0.0 |
| High School Diploma | 0 (0.0%) | 0.0 |
| College or Associate's Degree | 0 (0.0%) | 0.0 |
| Bachelor's Degree | 19 (100.0%) | 142.0 |
| Graduate Degree | 0 (0.0%) | 0.0 |
| Total | 19 (100.0%) | 36.0 |
Fertility by Education by Marriage Status in Apalachin
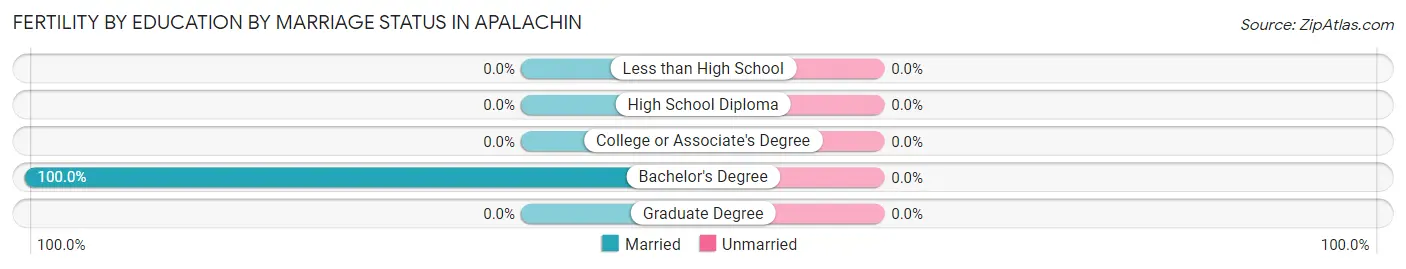
| Educational Attainment | Married | Unmarried |
| Less than High School | 0 (0.0%) | 0 (0.0%) |
| High School Diploma | 0 (0.0%) | 0 (0.0%) |
| College or Associate's Degree | 0 (0.0%) | 0 (0.0%) |
| Bachelor's Degree | 19 (100.0%) | 0 (0.0%) |
| Graduate Degree | 0 (0.0%) | 0 (0.0%) |
| Total | 19 (100.0%) | 0 (0.0%) |
Income in Apalachin
Income Overview in Apalachin
Per Capita Income in Apalachin is $41,222, while median incomes of families and households are $116,453 and $76,161 respectively.
| Characteristic | Number | Measure |
| Per Capita Income | 2,356 | $41,222 |
| Median Family Income | 575 | $116,453 |
| Mean Family Income | 575 | $131,961 |
| Median Household Income | 933 | $76,161 |
| Mean Household Income | 933 | $103,496 |
| Income Deficit | 575 | $0 |
| Wage / Income Gap (%) | 2,356 | 26.61% |
| Wage / Income Gap ($) | 2,356 | 73.39¢ per $1 |
| Gini / Inequality Index | 2,356 | 0.45 |
Earnings by Sex in Apalachin
Average Earnings in Apalachin are $41,326, $47,143 for men and $34,598 for women, a difference of 26.6%.
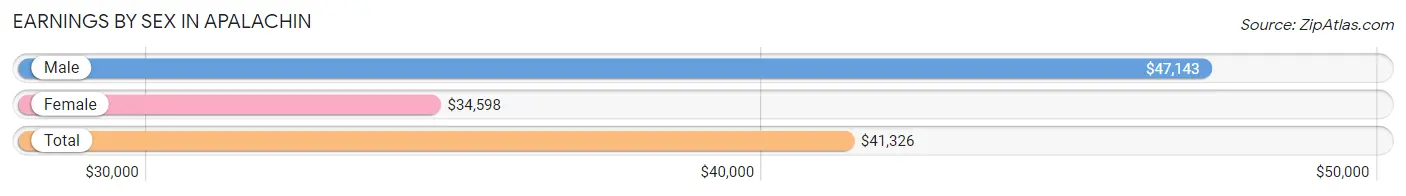
| Sex | Number | Average Earnings |
| Male | 808 (56.2%) | $47,143 |
| Female | 629 (43.8%) | $34,598 |
| Total | 1,437 (100.0%) | $41,326 |
Earnings by Sex by Income Bracket in Apalachin
The most common earnings brackets in Apalachin are $100,000+ for men (186 | 23.0%) and $50,000 to $54,999 for women (84 | 13.4%).
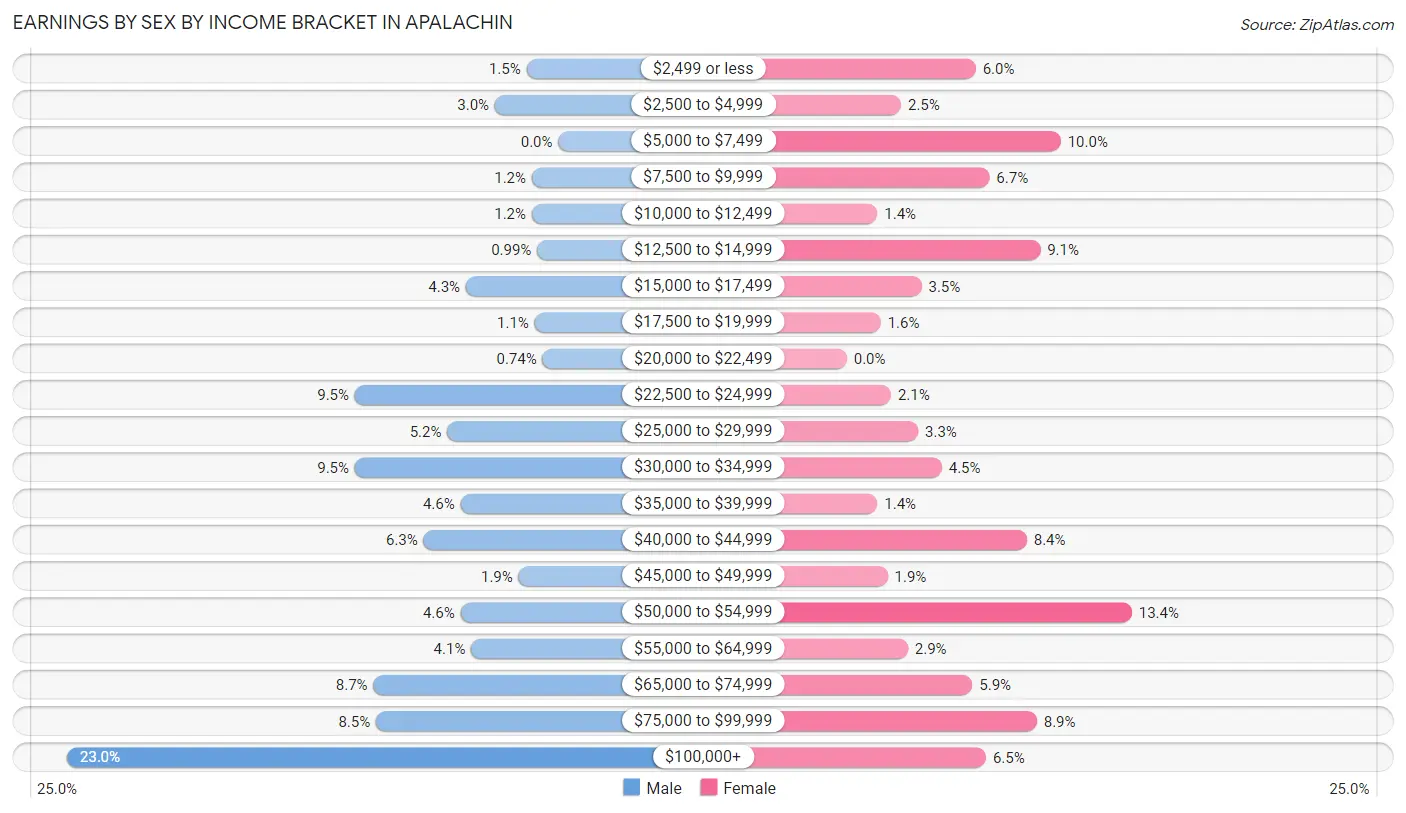
| Income | Male | Female |
| $2,499 or less | 12 (1.5%) | 38 (6.0%) |
| $2,500 to $4,999 | 24 (3.0%) | 16 (2.5%) |
| $5,000 to $7,499 | 0 (0.0%) | 63 (10.0%) |
| $7,500 to $9,999 | 10 (1.2%) | 42 (6.7%) |
| $10,000 to $12,499 | 10 (1.2%) | 9 (1.4%) |
| $12,500 to $14,999 | 8 (1.0%) | 57 (9.1%) |
| $15,000 to $17,499 | 35 (4.3%) | 22 (3.5%) |
| $17,500 to $19,999 | 9 (1.1%) | 10 (1.6%) |
| $20,000 to $22,499 | 6 (0.7%) | 0 (0.0%) |
| $22,500 to $24,999 | 77 (9.5%) | 13 (2.1%) |
| $25,000 to $29,999 | 42 (5.2%) | 21 (3.3%) |
| $30,000 to $34,999 | 77 (9.5%) | 28 (4.4%) |
| $35,000 to $39,999 | 37 (4.6%) | 9 (1.4%) |
| $40,000 to $44,999 | 51 (6.3%) | 53 (8.4%) |
| $45,000 to $49,999 | 15 (1.9%) | 12 (1.9%) |
| $50,000 to $54,999 | 37 (4.6%) | 84 (13.4%) |
| $55,000 to $64,999 | 33 (4.1%) | 18 (2.9%) |
| $65,000 to $74,999 | 70 (8.7%) | 37 (5.9%) |
| $75,000 to $99,999 | 69 (8.5%) | 56 (8.9%) |
| $100,000+ | 186 (23.0%) | 41 (6.5%) |
| Total | 808 (100.0%) | 629 (100.0%) |
Earnings by Sex by Educational Attainment in Apalachin
Average earnings in Apalachin are $64,063 for men and $40,887 for women, a difference of 36.2%. Men with an educational attainment of bachelor's degree enjoy the highest average annual earnings of $72,159, while those with high school diploma education earn the least with $34,246. Women with an educational attainment of graduate degree earn the most with the average annual earnings of $69,423, while those with high school diploma education have the smallest earnings of $19,500.
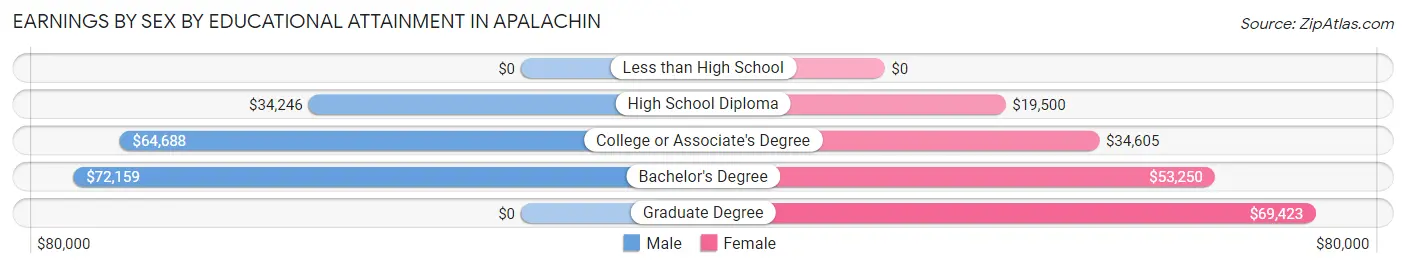
| Educational Attainment | Male Income | Female Income |
| Less than High School | - | - |
| High School Diploma | $34,246 | $19,500 |
| College or Associate's Degree | $64,688 | $34,605 |
| Bachelor's Degree | $72,159 | $53,250 |
| Graduate Degree | - | - |
| Total | $64,063 | $40,887 |
Family Income in Apalachin
Family Income Brackets in Apalachin
According to the Apalachin family income data, there are 181 families falling into the $100,000 to $149,999 income range, which is the most common income bracket and makes up 31.5% of all families.
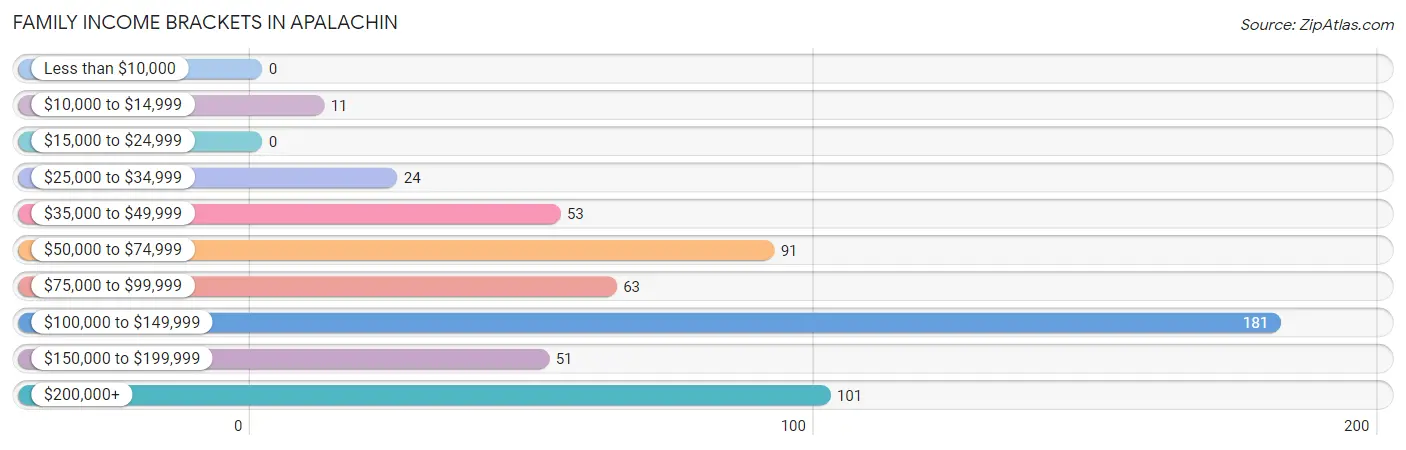
| Income Bracket | # Families | % Families |
| Less than $10,000 | 0 | 0.0% |
| $10,000 to $14,999 | 11 | 1.9% |
| $15,000 to $24,999 | 0 | 0.0% |
| $25,000 to $34,999 | 24 | 4.2% |
| $35,000 to $49,999 | 53 | 9.2% |
| $50,000 to $74,999 | 91 | 15.8% |
| $75,000 to $99,999 | 63 | 11.0% |
| $100,000 to $149,999 | 181 | 31.5% |
| $150,000 to $199,999 | 51 | 8.9% |
| $200,000+ | 101 | 17.6% |
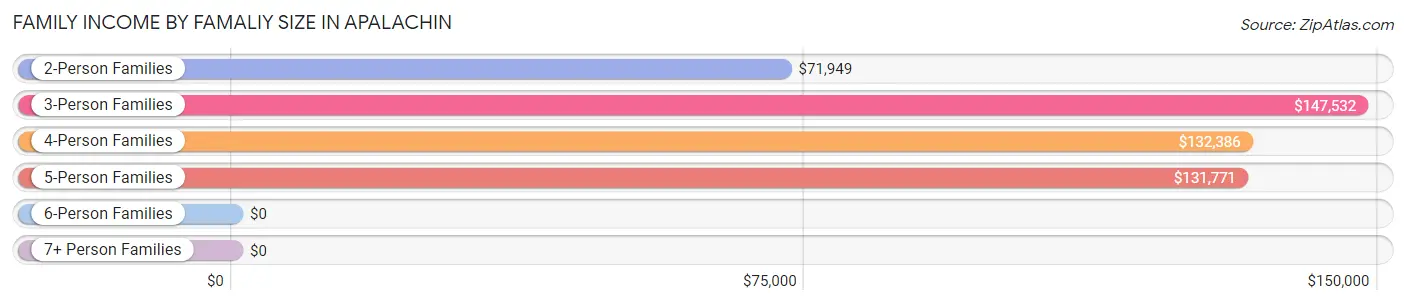
Family Income by Famaliy Size in Apalachin
3-person families (175 | 30.4%) account for the highest median family income in Apalachin with $147,532 per family, while 3-person families (175 | 30.4%) have the highest median income of $49,177 per family member.
| Income Bracket | # Families | Median Income |
| 2-Person Families | 239 (41.6%) | $71,949 |
| 3-Person Families | 175 (30.4%) | $147,532 |
| 4-Person Families | 89 (15.5%) | $132,386 |
| 5-Person Families | 65 (11.3%) | $131,771 |
| 6-Person Families | 7 (1.2%) | $0 |
| 7+ Person Families | 0 (0.0%) | $0 |
| Total | 575 (100.0%) | $116,453 |
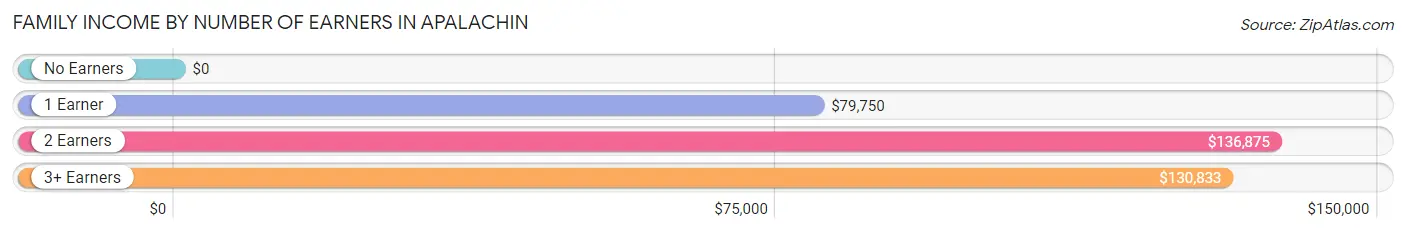
Family Income by Number of Earners in Apalachin
| Number of Earners | # Families | Median Income |
| No Earners | 50 (8.7%) | $0 |
| 1 Earner | 177 (30.8%) | $79,750 |
| 2 Earners | 256 (44.5%) | $136,875 |
| 3+ Earners | 92 (16.0%) | $130,833 |
| Total | 575 (100.0%) | $116,453 |
Household Income in Apalachin
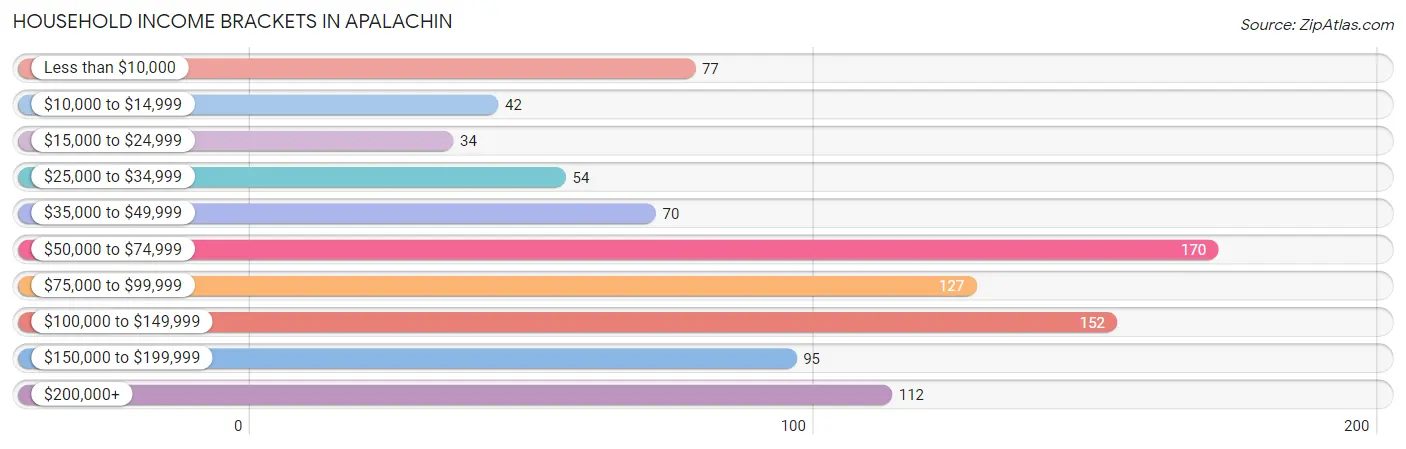
Household Income Brackets in Apalachin
With 170 households falling in the category, the $50,000 to $74,999 income range is the most frequent in Apalachin, accounting for 18.2% of all households. In contrast, only 34 households (3.6%) fall into the $15,000 to $24,999 income bracket, making it the least populous group.
| Income Bracket | # Households | % Households |
| Less than $10,000 | 77 | 8.3% |
| $10,000 to $14,999 | 42 | 4.5% |
| $15,000 to $24,999 | 34 | 3.6% |
| $25,000 to $34,999 | 54 | 5.8% |
| $35,000 to $49,999 | 70 | 7.5% |
| $50,000 to $74,999 | 170 | 18.2% |
| $75,000 to $99,999 | 127 | 13.6% |
| $100,000 to $149,999 | 152 | 16.3% |
| $150,000 to $199,999 | 95 | 10.2% |
| $200,000+ | 112 | 12.0% |
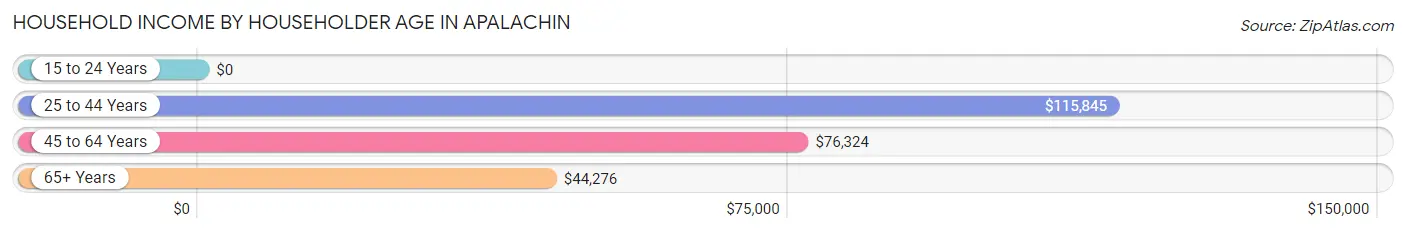
Household Income by Householder Age in Apalachin
The median household income in Apalachin is $76,161, with the highest median household income of $115,845 found in the 25 to 44 years age bracket for the primary householder. A total of 261 households (28.0%) fall into this category. Meanwhile, the 15 to 24 years age bracket for the primary householder has the lowest median household income of $0, with 71 households (7.6%) in this group.
| Income Bracket | # Households | Median Income |
| 15 to 24 Years | 71 (7.6%) | $0 |
| 25 to 44 Years | 261 (28.0%) | $115,845 |
| 45 to 64 Years | 420 (45.0%) | $76,324 |
| 65+ Years | 181 (19.4%) | $44,276 |
| Total | 933 (100.0%) | $76,161 |
Poverty in Apalachin
Income Below Poverty by Sex and Age in Apalachin
With 4.5% poverty level for males and 19.4% for females among the residents of Apalachin, under 5 year old males and 6 to 11 year old females are the most vulnerable to poverty, with 10 males (34.5%) and 28 females (51.8%) in their respective age groups living below the poverty level.
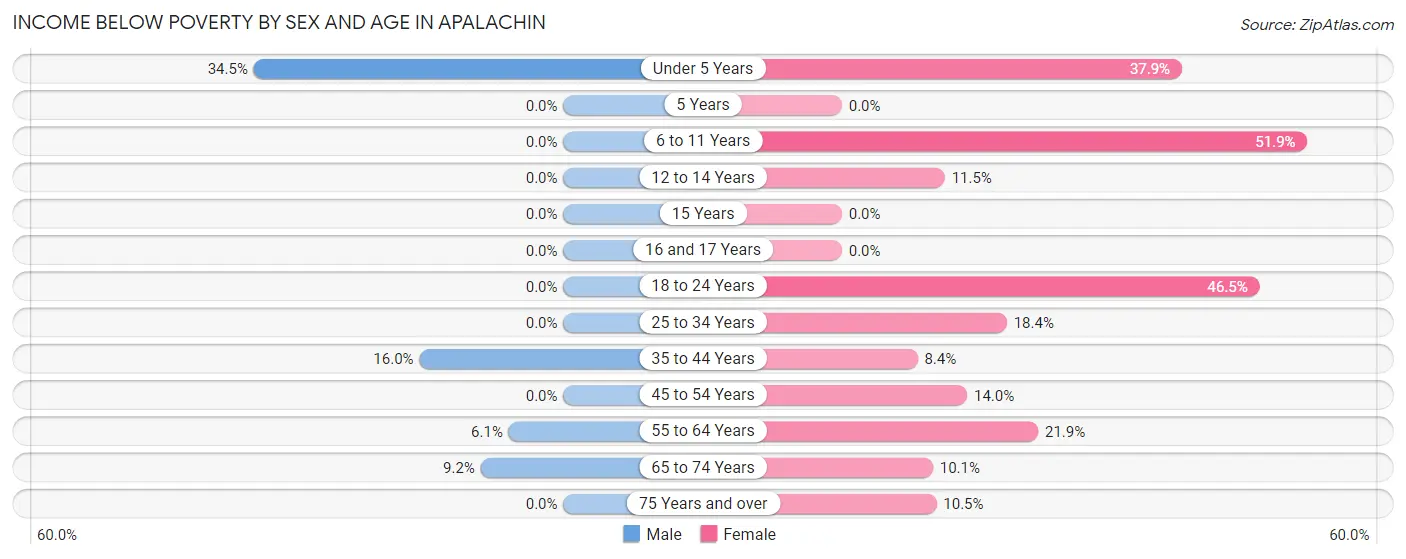
| Age Bracket | Male | Female |
| Under 5 Years | 10 (34.5%) | 25 (37.9%) |
| 5 Years | 0 (0.0%) | 0 (0.0%) |
| 6 to 11 Years | 0 (0.0%) | 28 (51.8%) |
| 12 to 14 Years | 0 (0.0%) | 11 (11.5%) |
| 15 Years | 0 (0.0%) | 0 (0.0%) |
| 16 and 17 Years | 0 (0.0%) | 0 (0.0%) |
| 18 to 24 Years | 0 (0.0%) | 47 (46.5%) |
| 25 to 34 Years | 0 (0.0%) | 27 (18.4%) |
| 35 to 44 Years | 25 (16.0%) | 14 (8.4%) |
| 45 to 54 Years | 0 (0.0%) | 18 (14.0%) |
| 55 to 64 Years | 11 (6.1%) | 47 (21.9%) |
| 65 to 74 Years | 7 (9.2%) | 8 (10.1%) |
| 75 Years and over | 0 (0.0%) | 6 (10.5%) |
| Total | 53 (4.5%) | 231 (19.4%) |
Income Above Poverty by Sex and Age in Apalachin
According to the poverty statistics in Apalachin, males aged 5 years and females aged 5 years are the age groups that are most secure financially, with 100.0% of males and 100.0% of females in these age groups living above the poverty line.
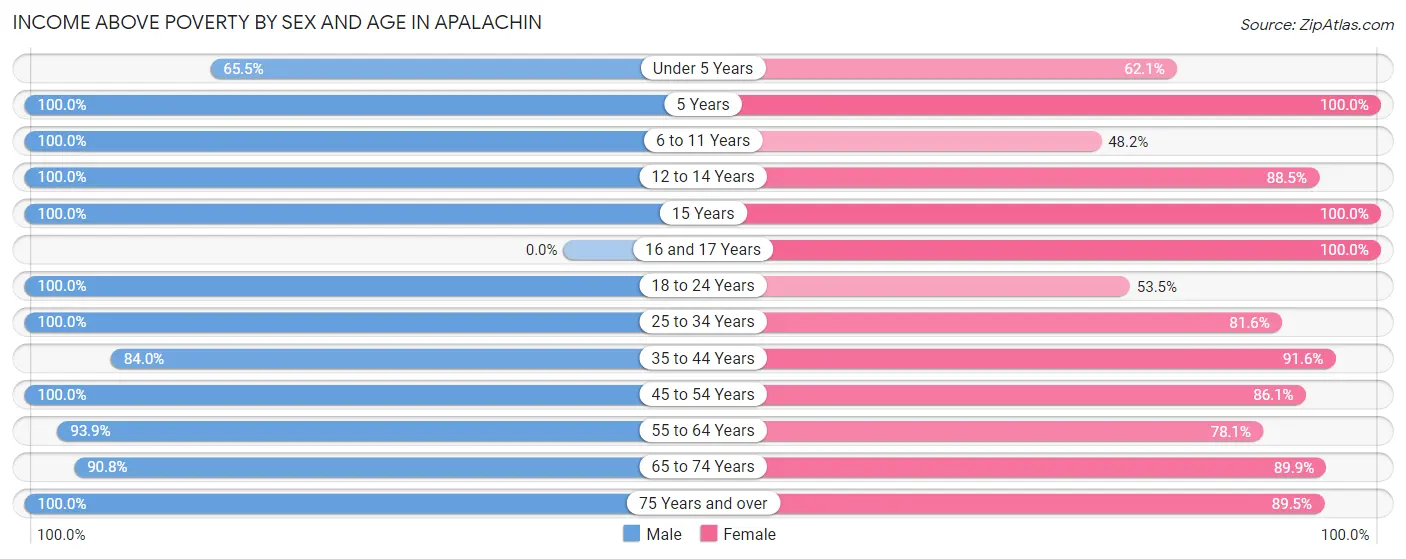
| Age Bracket | Male | Female |
| Under 5 Years | 19 (65.5%) | 41 (62.1%) |
| 5 Years | 7 (100.0%) | 14 (100.0%) |
| 6 to 11 Years | 67 (100.0%) | 26 (48.1%) |
| 12 to 14 Years | 27 (100.0%) | 85 (88.5%) |
| 15 Years | 89 (100.0%) | 21 (100.0%) |
| 16 and 17 Years | 0 (0.0%) | 43 (100.0%) |
| 18 to 24 Years | 152 (100.0%) | 54 (53.5%) |
| 25 to 34 Years | 130 (100.0%) | 120 (81.6%) |
| 35 to 44 Years | 131 (84.0%) | 152 (91.6%) |
| 45 to 54 Years | 218 (100.0%) | 111 (86.1%) |
| 55 to 64 Years | 170 (93.9%) | 168 (78.1%) |
| 65 to 74 Years | 69 (90.8%) | 71 (89.9%) |
| 75 Years and over | 36 (100.0%) | 51 (89.5%) |
| Total | 1,115 (95.5%) | 957 (80.6%) |
Income Below Poverty Among Married-Couple Families in Apalachin
The poverty statistics for married-couple families in Apalachin show that 3.5% or 14 of the total 398 families live below the poverty line. Families with 3 or 4 children have the highest poverty rate of 25.5%, comprising of 14 families. On the other hand, families with no children have the lowest poverty rate of 0.0%, which includes 0 families.
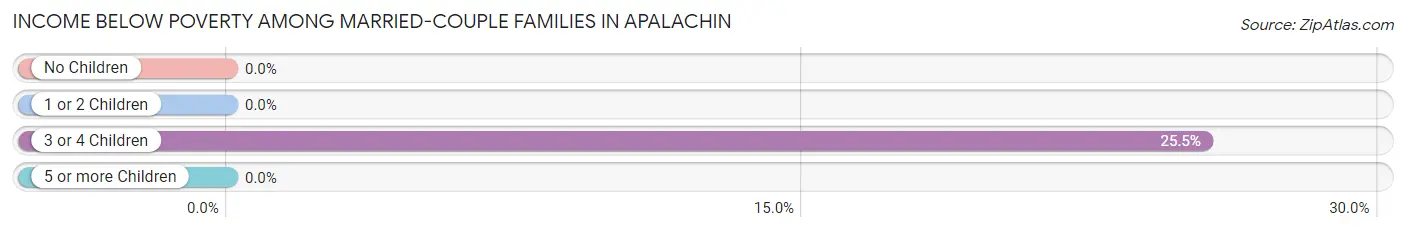
| Children | Above Poverty | Below Poverty |
| No Children | 216 (100.0%) | 0 (0.0%) |
| 1 or 2 Children | 127 (100.0%) | 0 (0.0%) |
| 3 or 4 Children | 41 (74.6%) | 14 (25.5%) |
| 5 or more Children | 0 (0.0%) | 0 (0.0%) |
| Total | 384 (96.5%) | 14 (3.5%) |
Income Below Poverty Among Single-Parent Households in Apalachin
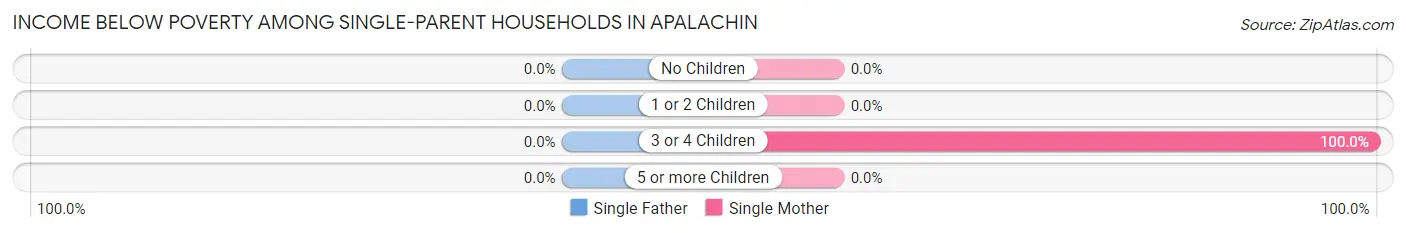
| Children | Single Father | Single Mother |
| No Children | 0 (0.0%) | 0 (0.0%) |
| 1 or 2 Children | 0 (0.0%) | 0 (0.0%) |
| 3 or 4 Children | 0 (0.0%) | 11 (100.0%) |
| 5 or more Children | 0 (0.0%) | 0 (0.0%) |
| Total | 0 (0.0%) | 11 (13.8%) |
Income Below Poverty Among Married-Couple vs Single-Parent Households in Apalachin
The poverty data for Apalachin shows that 14 of the married-couple family households (3.5%) and 11 of the single-parent households (6.2%) are living below the poverty level. Within the married-couple family households, those with 3 or 4 children have the highest poverty rate, with 14 households (25.5%) falling below the poverty line. Among the single-parent households, those with 3 or 4 children have the highest poverty rate, with 11 household (100.0%) living below poverty.
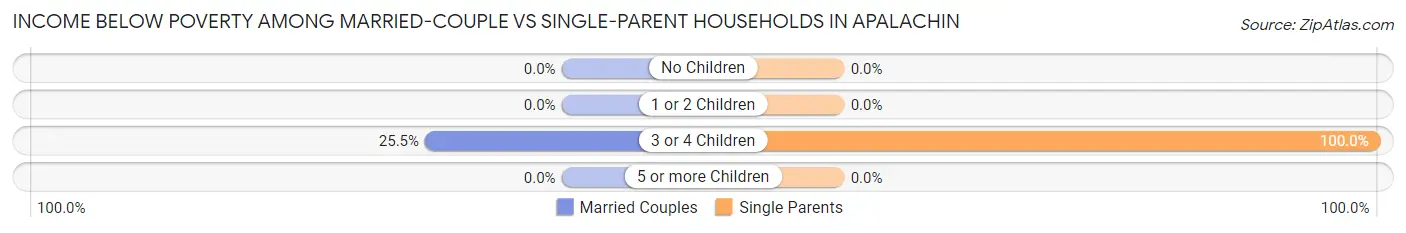
| Children | Married-Couple Families | Single-Parent Households |
| No Children | 0 (0.0%) | 0 (0.0%) |
| 1 or 2 Children | 0 (0.0%) | 0 (0.0%) |
| 3 or 4 Children | 14 (25.5%) | 11 (100.0%) |
| 5 or more Children | 0 (0.0%) | 0 (0.0%) |
| Total | 14 (3.5%) | 11 (6.2%) |
Employment Characteristics in Apalachin
Employment by Class of Employer in Apalachin
Among the 1,363 employed individuals in Apalachin, private company employees (874 | 64.1%), local government employees (158 | 11.6%), and self-employed (not incorporated) (109 | 8.0%) make up the most common classes of employment.
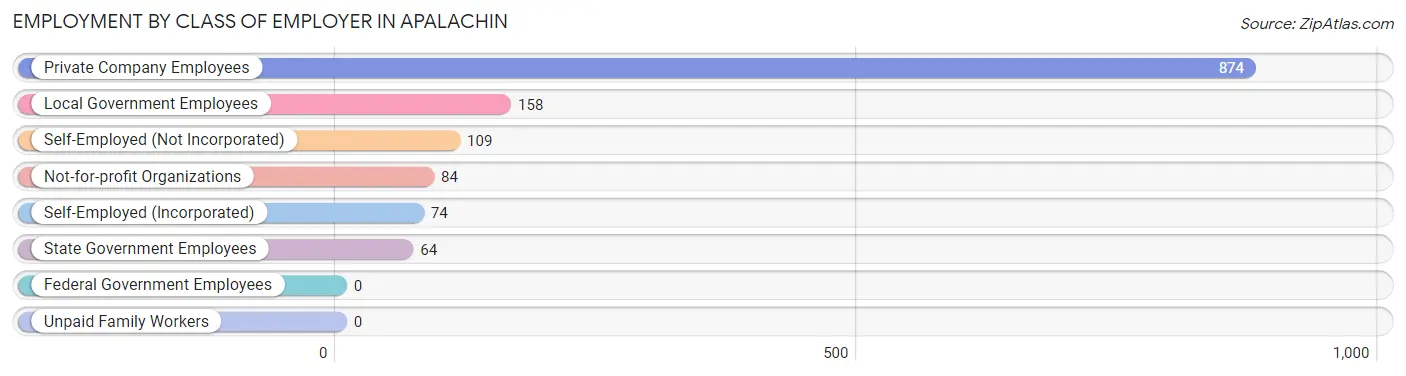
| Employer Class | # Employees | % Employees |
| Private Company Employees | 874 | 64.1% |
| Self-Employed (Incorporated) | 74 | 5.4% |
| Self-Employed (Not Incorporated) | 109 | 8.0% |
| Not-for-profit Organizations | 84 | 6.2% |
| Local Government Employees | 158 | 11.6% |
| State Government Employees | 64 | 4.7% |
| Federal Government Employees | 0 | 0.0% |
| Unpaid Family Workers | 0 | 0.0% |
| Total | 1,363 | 100.0% |
Employment Status by Age in Apalachin
According to the labor force statistics for Apalachin, out of the total population over 16 years of age (1,886), 77.5% or 1,462 individuals are in the labor force, with 4.3% or 63 of them unemployed. The age group with the highest labor force participation rate is 25 to 29 years, with 100.0% or 170 individuals in the labor force. Within the labor force, the 16 to 19 years age range has the highest percentage of unemployed individuals, with 16.1% or 18 of them being unemployed.
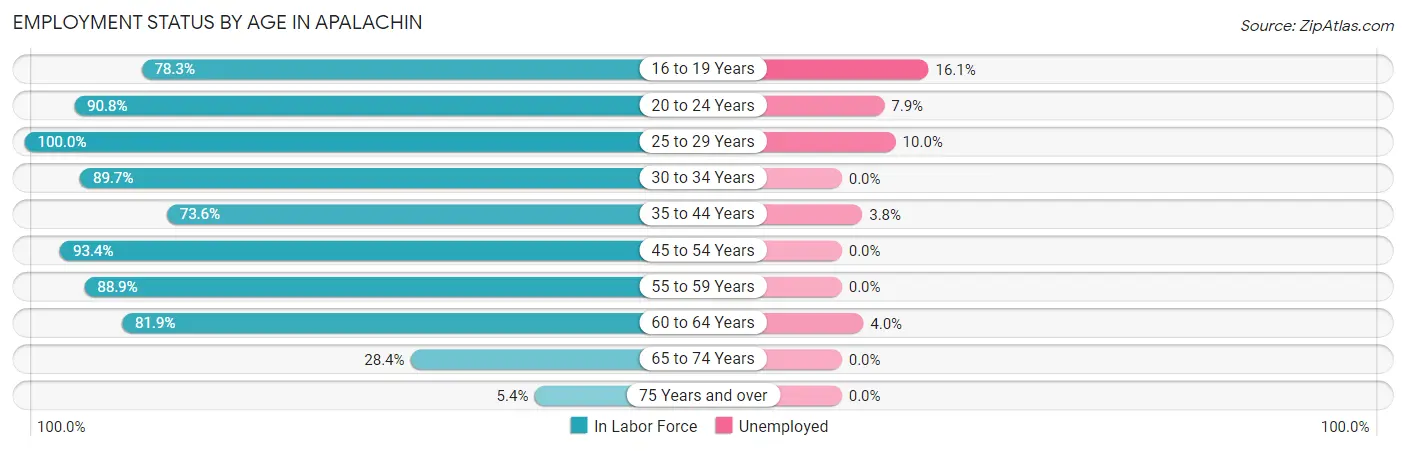
| Age Bracket | In Labor Force | Unemployed |
| 16 to 19 Years | 112 (78.3%) | 18 (16.1%) |
| 20 to 24 Years | 139 (90.8%) | 11 (7.9%) |
| 25 to 29 Years | 170 (100.0%) | 17 (10.0%) |
| 30 to 34 Years | 96 (89.7%) | 0 (0.0%) |
| 35 to 44 Years | 237 (73.6%) | 9 (3.8%) |
| 45 to 54 Years | 324 (93.4%) | 0 (0.0%) |
| 55 to 59 Years | 136 (88.9%) | 0 (0.0%) |
| 60 to 64 Years | 199 (81.9%) | 8 (4.0%) |
| 65 to 74 Years | 44 (28.4%) | 0 (0.0%) |
| 75 Years and over | 5 (5.4%) | 0 (0.0%) |
| Total | 1,462 (77.5%) | 63 (4.3%) |
Employment Status by Educational Attainment in Apalachin
According to labor force statistics for Apalachin, 86.6% of individuals (1,162) out of the total population between 25 and 64 years of age (1,342) are in the labor force, with 2.9% or 34 of them being unemployed. The group with the highest labor force participation rate are those with the educational attainment of less than high school, with 93.1% or 54 individuals in the labor force. Within the labor force, individuals with high school diploma education have the highest percentage of unemployment, with 9.9% or 17 of them being unemployed.
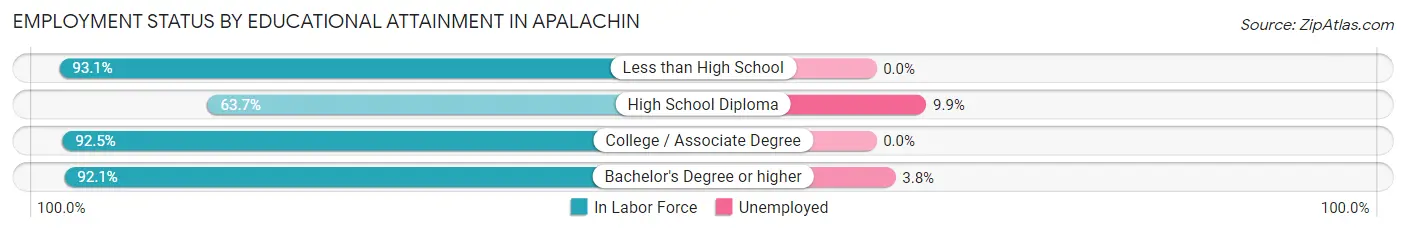
| Educational Attainment | In Labor Force | Unemployed |
| Less than High School | 54 (93.1%) | 0 (0.0%) |
| High School Diploma | 172 (63.7%) | 27 (9.9%) |
| College / Associate Degree | 483 (92.5%) | 0 (0.0%) |
| Bachelor's Degree or higher | 453 (92.1%) | 19 (3.8%) |
| Total | 1,162 (86.6%) | 39 (2.9%) |
Employment Occupations by Sex in Apalachin
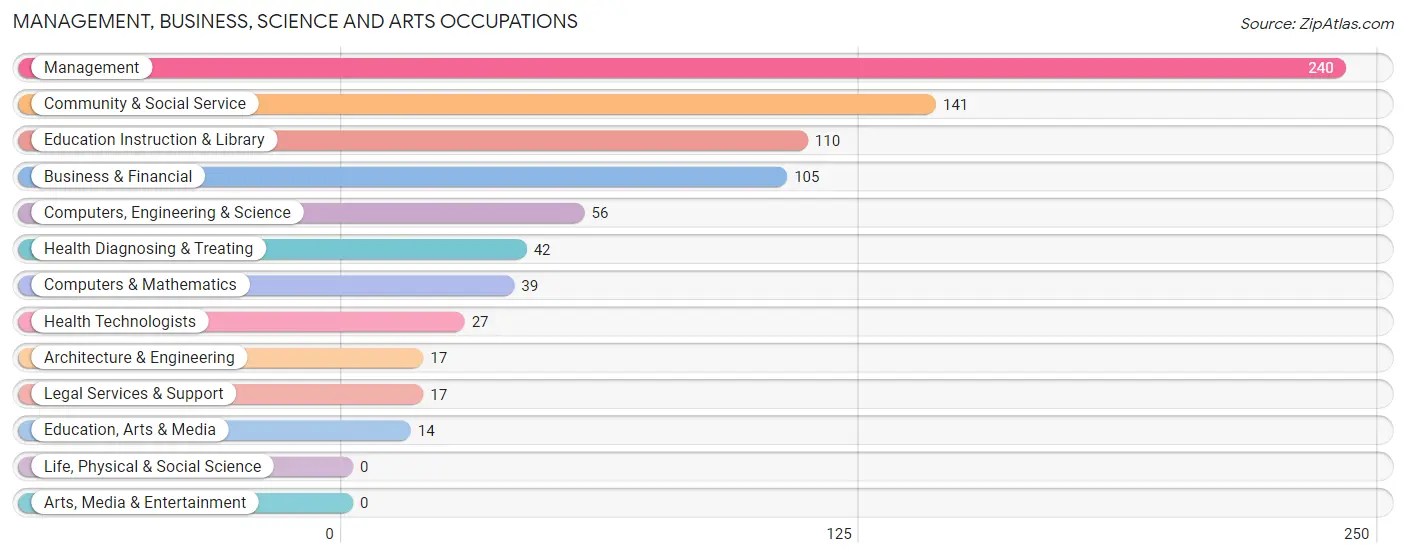
Management, Business, Science and Arts Occupations
The most common Management, Business, Science and Arts occupations in Apalachin are Management (240 | 17.2%), Community & Social Service (141 | 10.1%), Education Instruction & Library (110 | 7.9%), Business & Financial (105 | 7.5%), and Computers, Engineering & Science (56 | 4.0%).
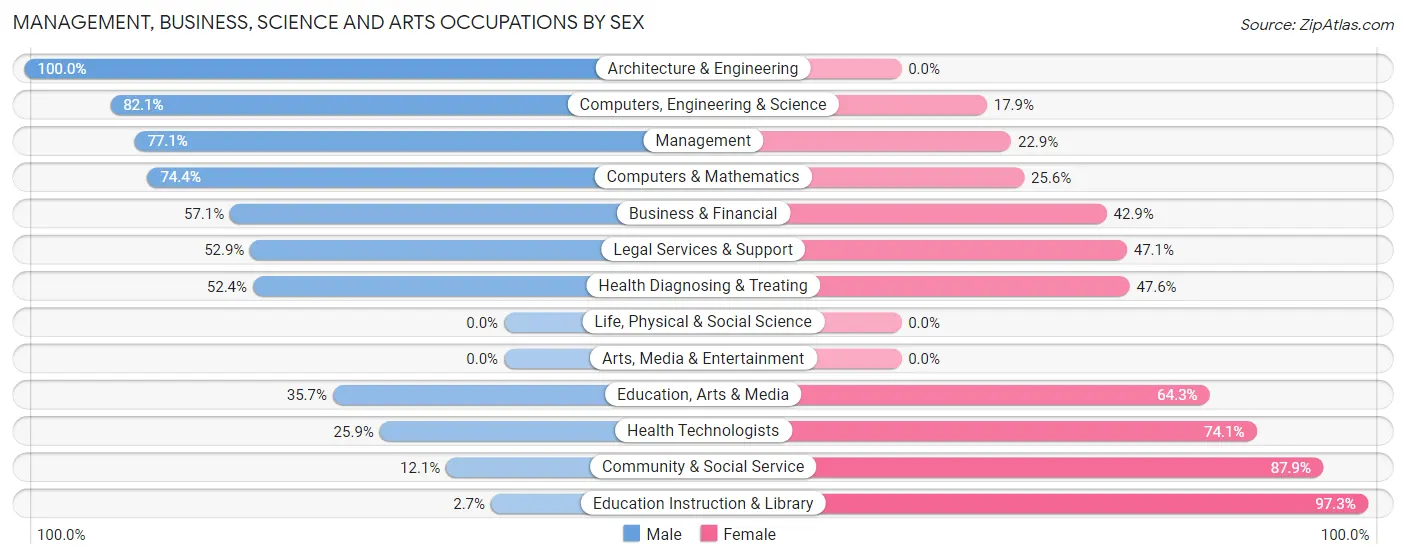
Management, Business, Science and Arts Occupations by Sex
Within the Management, Business, Science and Arts occupations in Apalachin, the most male-oriented occupations are Architecture & Engineering (100.0%), Computers, Engineering & Science (82.1%), and Management (77.1%), while the most female-oriented occupations are Education Instruction & Library (97.3%), Community & Social Service (87.9%), and Health Technologists (74.1%).
| Occupation | Male | Female |
| Management | 185 (77.1%) | 55 (22.9%) |
| Business & Financial | 60 (57.1%) | 45 (42.9%) |
| Computers, Engineering & Science | 46 (82.1%) | 10 (17.9%) |
| Computers & Mathematics | 29 (74.4%) | 10 (25.6%) |
| Architecture & Engineering | 17 (100.0%) | 0 (0.0%) |
| Life, Physical & Social Science | 0 (0.0%) | 0 (0.0%) |
| Community & Social Service | 17 (12.1%) | 124 (87.9%) |
| Education, Arts & Media | 5 (35.7%) | 9 (64.3%) |
| Legal Services & Support | 9 (52.9%) | 8 (47.1%) |
| Education Instruction & Library | 3 (2.7%) | 107 (97.3%) |
| Arts, Media & Entertainment | 0 (0.0%) | 0 (0.0%) |
| Health Diagnosing & Treating | 22 (52.4%) | 20 (47.6%) |
| Health Technologists | 7 (25.9%) | 20 (74.1%) |
| Total (Category) | 330 (56.5%) | 254 (43.5%) |
| Total (Overall) | 796 (56.9%) | 603 (43.1%) |
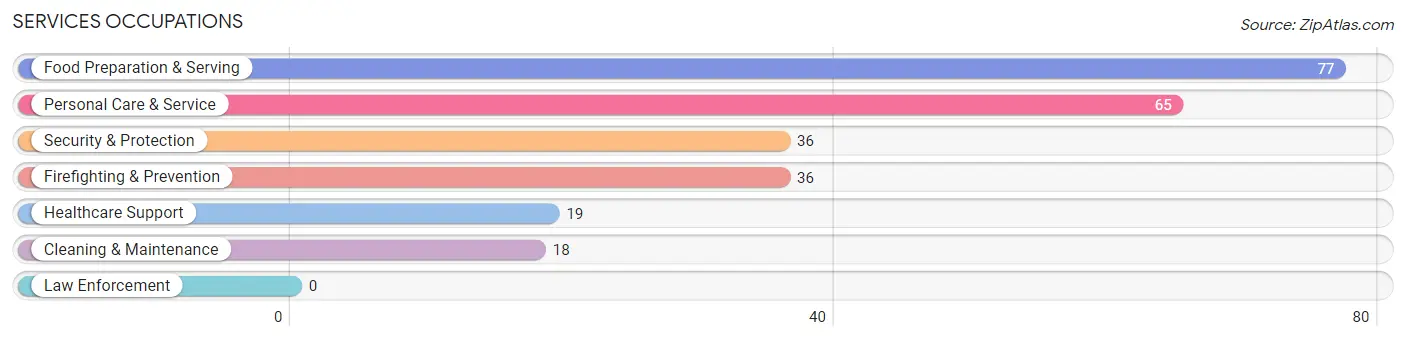
Services Occupations
The most common Services occupations in Apalachin are Food Preparation & Serving (77 | 5.5%), Personal Care & Service (65 | 4.6%), Security & Protection (36 | 2.6%), Firefighting & Prevention (36 | 2.6%), and Healthcare Support (19 | 1.4%).
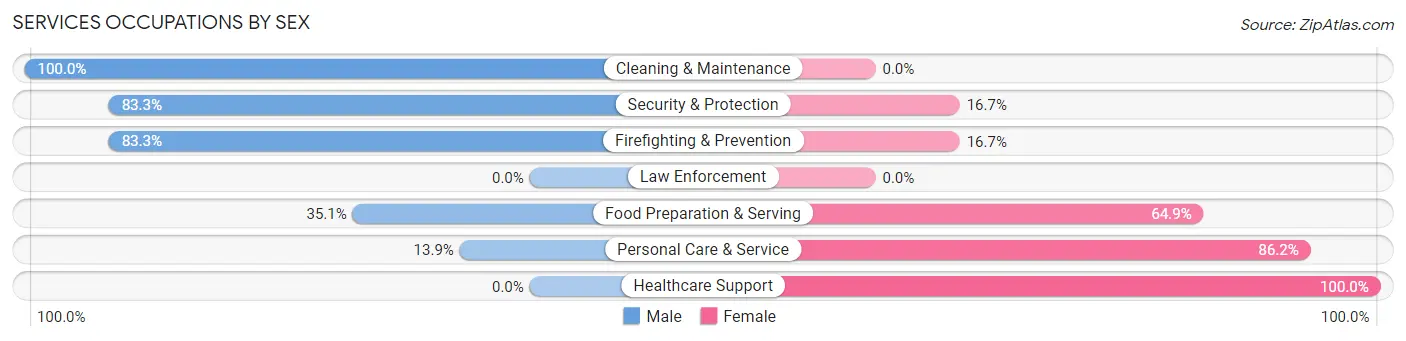
Services Occupations by Sex
Within the Services occupations in Apalachin, the most male-oriented occupations are Cleaning & Maintenance (100.0%), Security & Protection (83.3%), and Firefighting & Prevention (83.3%), while the most female-oriented occupations are Healthcare Support (100.0%), Personal Care & Service (86.2%), and Food Preparation & Serving (64.9%).
| Occupation | Male | Female |
| Healthcare Support | 0 (0.0%) | 19 (100.0%) |
| Security & Protection | 30 (83.3%) | 6 (16.7%) |
| Firefighting & Prevention | 30 (83.3%) | 6 (16.7%) |
| Law Enforcement | 0 (0.0%) | 0 (0.0%) |
| Food Preparation & Serving | 27 (35.1%) | 50 (64.9%) |
| Cleaning & Maintenance | 18 (100.0%) | 0 (0.0%) |
| Personal Care & Service | 9 (13.9%) | 56 (86.2%) |
| Total (Category) | 84 (39.1%) | 131 (60.9%) |
| Total (Overall) | 796 (56.9%) | 603 (43.1%) |
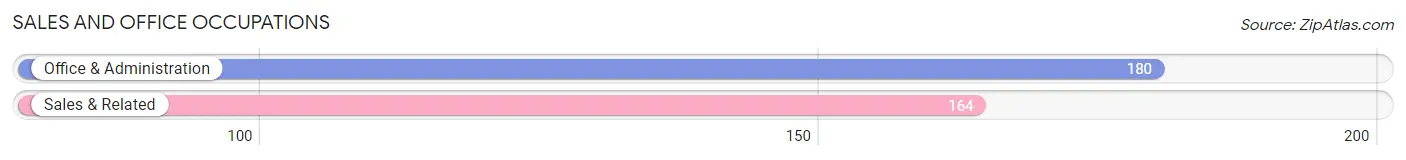
Sales and Office Occupations
The most common Sales and Office occupations in Apalachin are Office & Administration (180 | 12.9%), and Sales & Related (164 | 11.7%).
Sales and Office Occupations by Sex
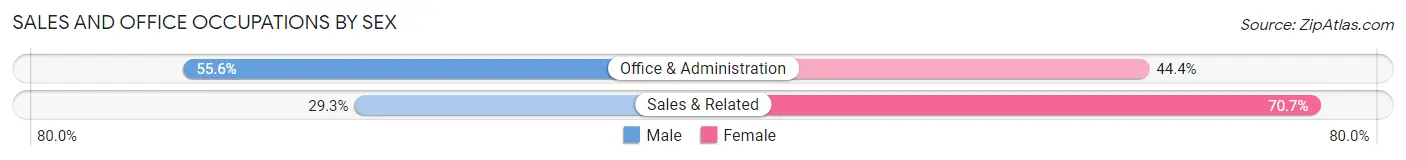
| Occupation | Male | Female |
| Sales & Related | 48 (29.3%) | 116 (70.7%) |
| Office & Administration | 100 (55.6%) | 80 (44.4%) |
| Total (Category) | 148 (43.0%) | 196 (57.0%) |
| Total (Overall) | 796 (56.9%) | 603 (43.1%) |
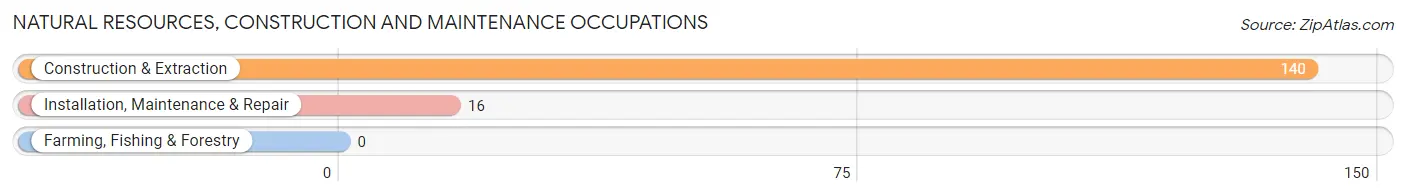
Natural Resources, Construction and Maintenance Occupations
The most common Natural Resources, Construction and Maintenance occupations in Apalachin are Construction & Extraction (140 | 10.0%), and Installation, Maintenance & Repair (16 | 1.1%).
Natural Resources, Construction and Maintenance Occupations by Sex
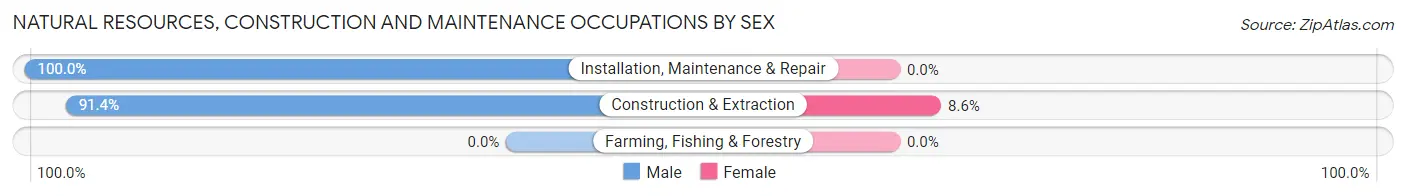
| Occupation | Male | Female |
| Farming, Fishing & Forestry | 0 (0.0%) | 0 (0.0%) |
| Construction & Extraction | 128 (91.4%) | 12 (8.6%) |
| Installation, Maintenance & Repair | 16 (100.0%) | 0 (0.0%) |
| Total (Category) | 144 (92.3%) | 12 (7.7%) |
| Total (Overall) | 796 (56.9%) | 603 (43.1%) |
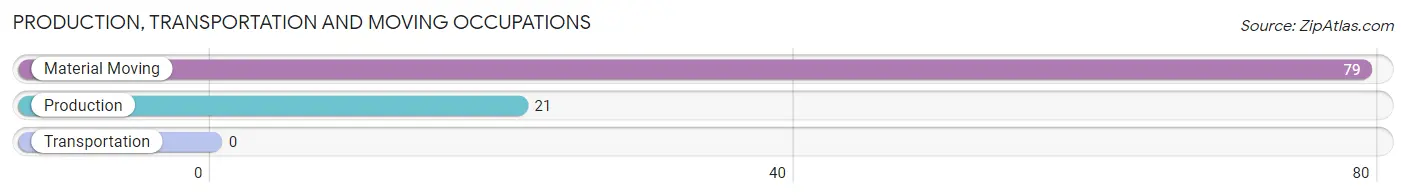
Production, Transportation and Moving Occupations
The most common Production, Transportation and Moving occupations in Apalachin are Material Moving (79 | 5.7%), and Production (21 | 1.5%).
Production, Transportation and Moving Occupations by Sex
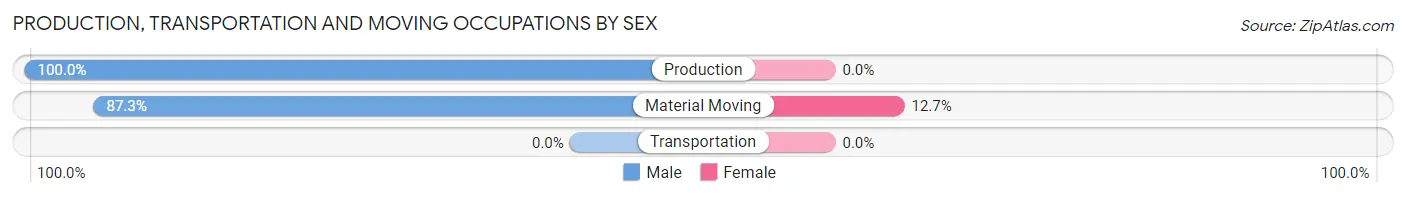
| Occupation | Male | Female |
| Production | 21 (100.0%) | 0 (0.0%) |
| Transportation | 0 (0.0%) | 0 (0.0%) |
| Material Moving | 69 (87.3%) | 10 (12.7%) |
| Total (Category) | 90 (90.0%) | 10 (10.0%) |
| Total (Overall) | 796 (56.9%) | 603 (43.1%) |
Employment Industries by Sex in Apalachin
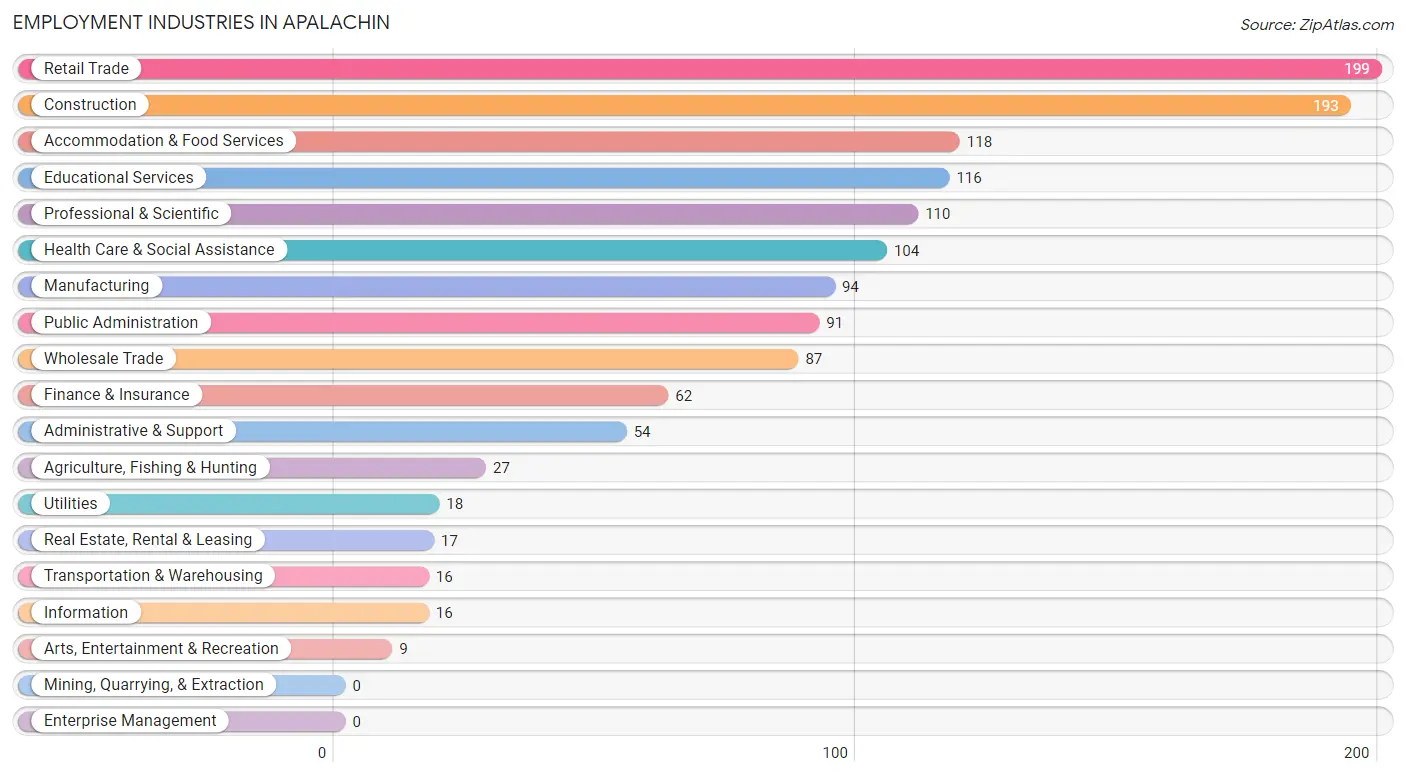
Employment Industries in Apalachin
The major employment industries in Apalachin include Retail Trade (199 | 14.2%), Construction (193 | 13.8%), Accommodation & Food Services (118 | 8.4%), Educational Services (116 | 8.3%), and Professional & Scientific (110 | 7.9%).
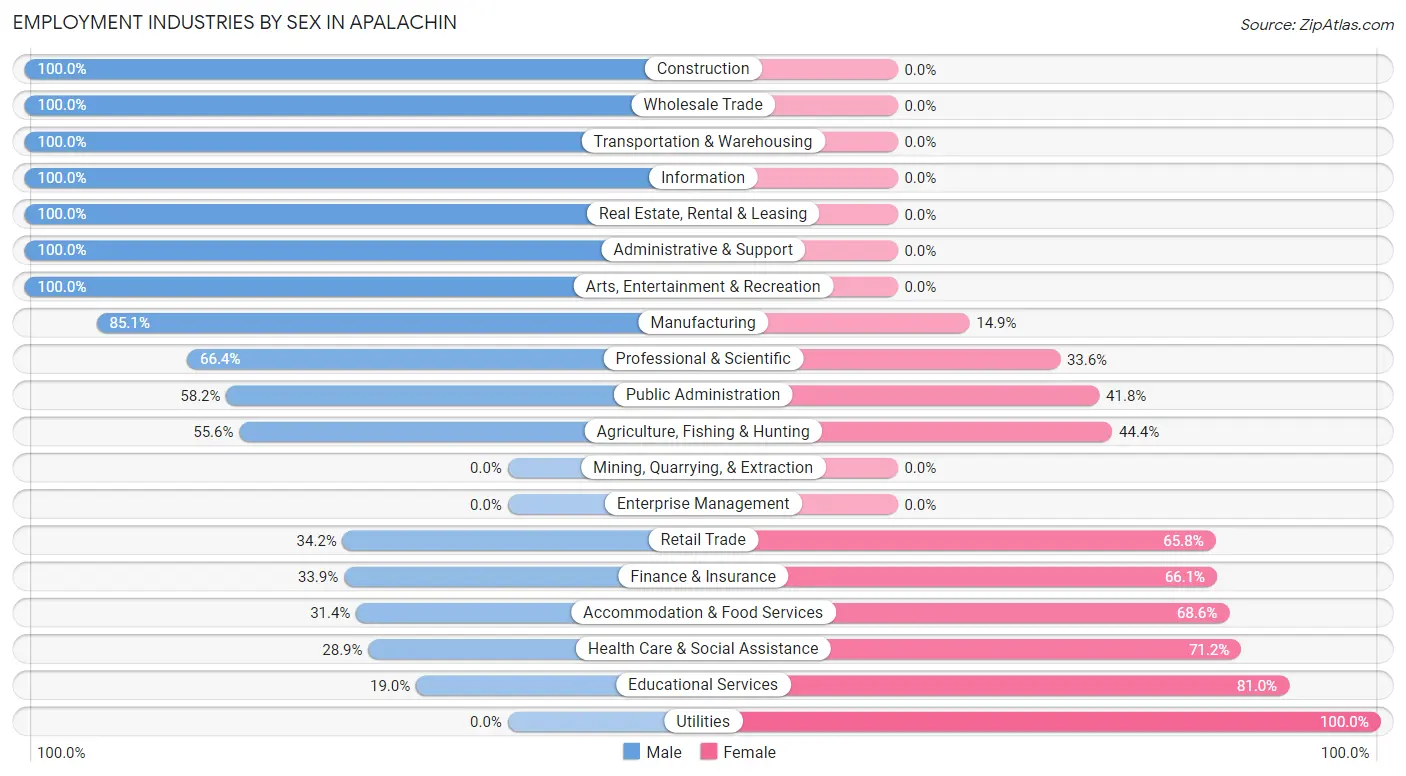
Employment Industries by Sex in Apalachin
The Apalachin industries that see more men than women are Construction (100.0%), Wholesale Trade (100.0%), and Transportation & Warehousing (100.0%), whereas the industries that tend to have a higher number of women are Utilities (100.0%), Educational Services (81.0%), and Health Care & Social Assistance (71.2%).
| Industry | Male | Female |
| Agriculture, Fishing & Hunting | 15 (55.6%) | 12 (44.4%) |
| Mining, Quarrying, & Extraction | 0 (0.0%) | 0 (0.0%) |
| Construction | 193 (100.0%) | 0 (0.0%) |
| Manufacturing | 80 (85.1%) | 14 (14.9%) |
| Wholesale Trade | 87 (100.0%) | 0 (0.0%) |
| Retail Trade | 68 (34.2%) | 131 (65.8%) |
| Transportation & Warehousing | 16 (100.0%) | 0 (0.0%) |
| Utilities | 0 (0.0%) | 18 (100.0%) |
| Information | 16 (100.0%) | 0 (0.0%) |
| Finance & Insurance | 21 (33.9%) | 41 (66.1%) |
| Real Estate, Rental & Leasing | 17 (100.0%) | 0 (0.0%) |
| Professional & Scientific | 73 (66.4%) | 37 (33.6%) |
| Enterprise Management | 0 (0.0%) | 0 (0.0%) |
| Administrative & Support | 54 (100.0%) | 0 (0.0%) |
| Educational Services | 22 (19.0%) | 94 (81.0%) |
| Health Care & Social Assistance | 30 (28.8%) | 74 (71.2%) |
| Arts, Entertainment & Recreation | 9 (100.0%) | 0 (0.0%) |
| Accommodation & Food Services | 37 (31.4%) | 81 (68.6%) |
| Public Administration | 53 (58.2%) | 38 (41.8%) |
| Total | 796 (56.9%) | 603 (43.1%) |
Education in Apalachin
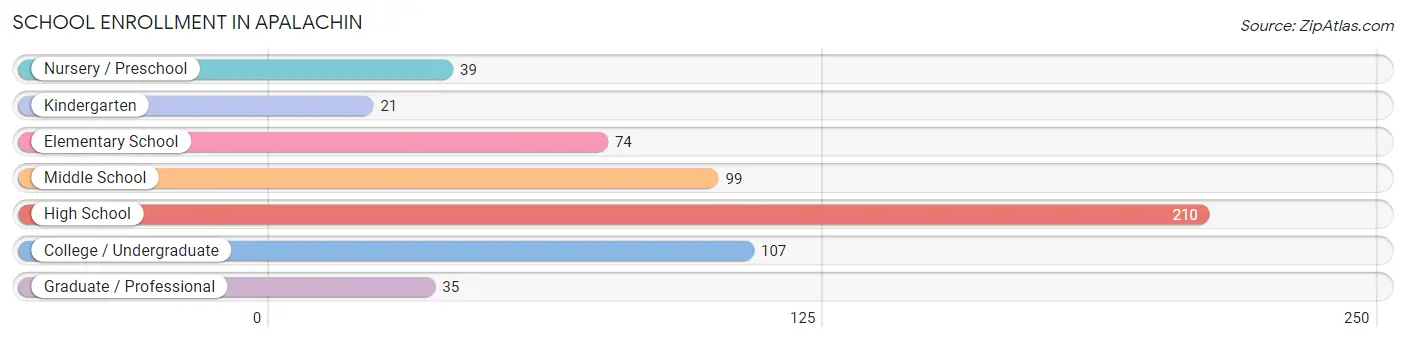
School Enrollment in Apalachin
The most common levels of schooling among the 585 students in Apalachin are high school (210 | 35.9%), college / undergraduate (107 | 18.3%), and middle school (99 | 16.9%).
| School Level | # Students | % Students |
| Nursery / Preschool | 39 | 6.7% |
| Kindergarten | 21 | 3.6% |
| Elementary School | 74 | 12.7% |
| Middle School | 99 | 16.9% |
| High School | 210 | 35.9% |
| College / Undergraduate | 107 | 18.3% |
| Graduate / Professional | 35 | 6.0% |
| Total | 585 | 100.0% |
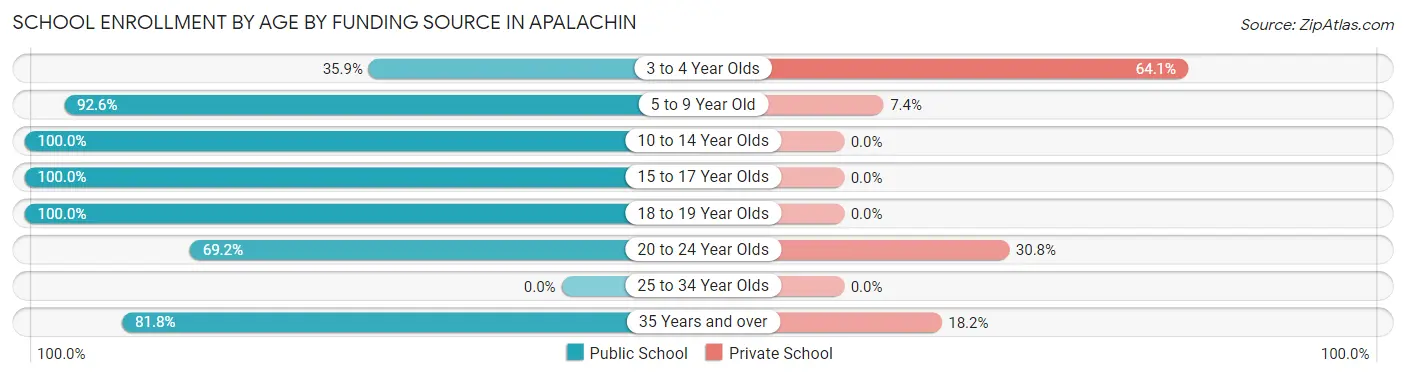
School Enrollment by Age by Funding Source in Apalachin
Out of a total of 585 students who are enrolled in schools in Apalachin, 64 (10.9%) attend a private institution, while the remaining 521 (89.1%) are enrolled in public schools. The age group of 3 to 4 year olds has the highest likelihood of being enrolled in private schools, with 25 (64.1% in the age bracket) enrolled. Conversely, the age group of 10 to 14 year olds has the lowest likelihood of being enrolled in a private school, with 165 (100.0% in the age bracket) attending a public institution.
| Age Bracket | Public School | Private School |
| 3 to 4 Year Olds | 14 (35.9%) | 25 (64.1%) |
| 5 to 9 Year Old | 88 (92.6%) | 7 (7.4%) |
| 10 to 14 Year Olds | 165 (100.0%) | 0 (0.0%) |
| 15 to 17 Year Olds | 142 (100.0%) | 0 (0.0%) |
| 18 to 19 Year Olds | 22 (100.0%) | 0 (0.0%) |
| 20 to 24 Year Olds | 54 (69.2%) | 24 (30.8%) |
| 25 to 34 Year Olds | 0 (0.0%) | 0 (0.0%) |
| 35 Years and over | 36 (81.8%) | 8 (18.2%) |
| Total | 521 (89.1%) | 64 (10.9%) |
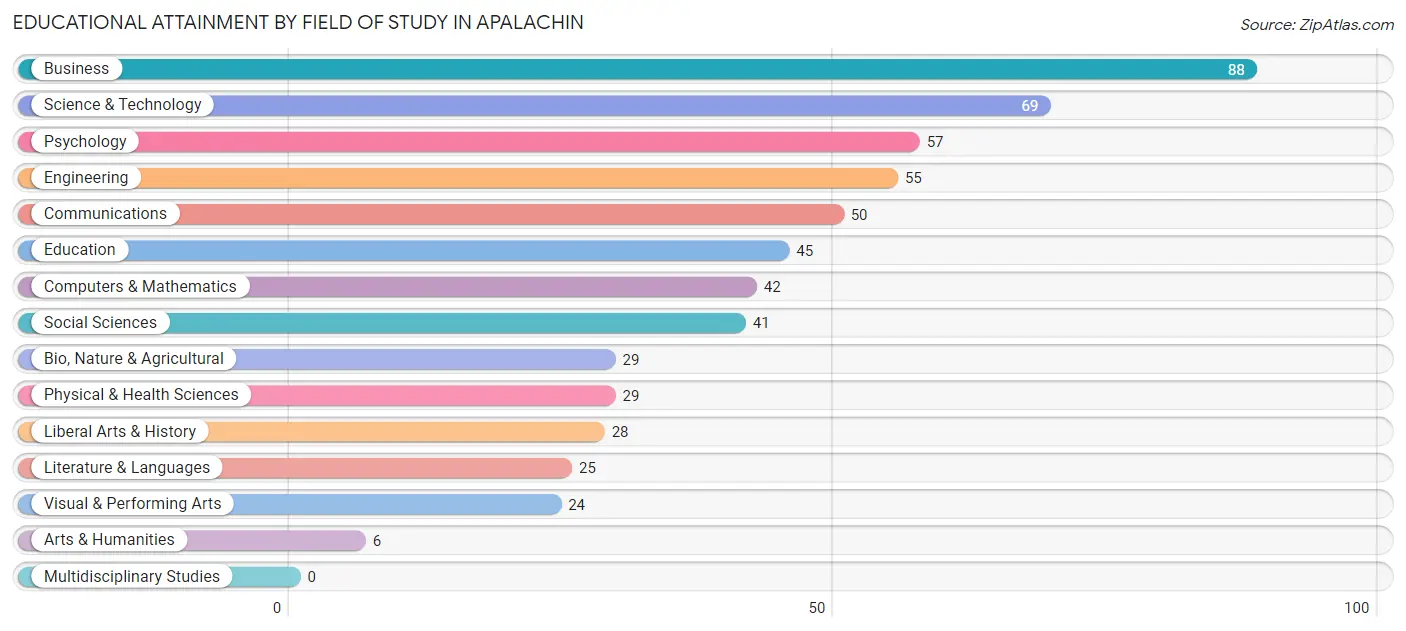
Educational Attainment by Field of Study in Apalachin
Business (88 | 15.0%), science & technology (69 | 11.7%), psychology (57 | 9.7%), engineering (55 | 9.3%), and communications (50 | 8.5%) are the most common fields of study among 588 individuals in Apalachin who have obtained a bachelor's degree or higher.
| Field of Study | # Graduates | % Graduates |
| Computers & Mathematics | 42 | 7.1% |
| Bio, Nature & Agricultural | 29 | 4.9% |
| Physical & Health Sciences | 29 | 4.9% |
| Psychology | 57 | 9.7% |
| Social Sciences | 41 | 7.0% |
| Engineering | 55 | 9.3% |
| Multidisciplinary Studies | 0 | 0.0% |
| Science & Technology | 69 | 11.7% |
| Business | 88 | 15.0% |
| Education | 45 | 7.6% |
| Literature & Languages | 25 | 4.3% |
| Liberal Arts & History | 28 | 4.8% |
| Visual & Performing Arts | 24 | 4.1% |
| Communications | 50 | 8.5% |
| Arts & Humanities | 6 | 1.0% |
| Total | 588 | 100.0% |
Transportation & Commute in Apalachin
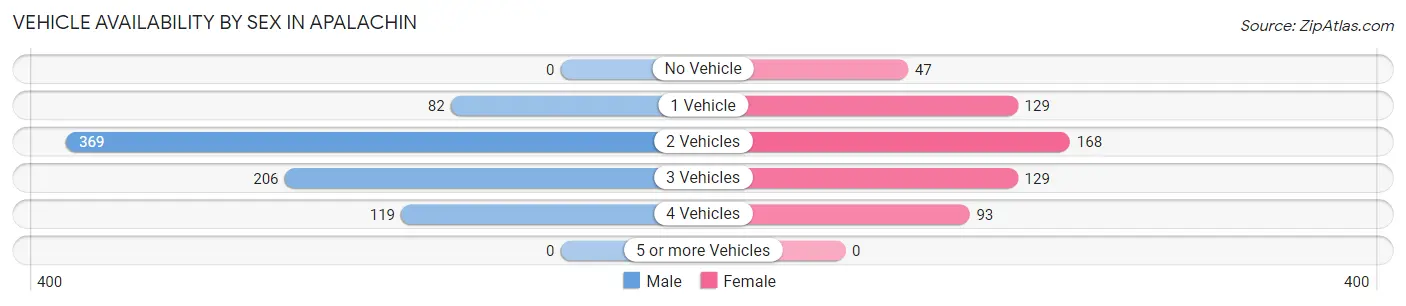
Vehicle Availability by Sex in Apalachin
The most prevalent vehicle ownership categories in Apalachin are males with 2 vehicles (369, accounting for 47.5%) and females with 2 vehicles (168, making up 65.2%).
| Vehicles Available | Male | Female |
| No Vehicle | 0 (0.0%) | 47 (8.3%) |
| 1 Vehicle | 82 (10.6%) | 129 (22.8%) |
| 2 Vehicles | 369 (47.5%) | 168 (29.7%) |
| 3 Vehicles | 206 (26.6%) | 129 (22.8%) |
| 4 Vehicles | 119 (15.3%) | 93 (16.4%) |
| 5 or more Vehicles | 0 (0.0%) | 0 (0.0%) |
| Total | 776 (100.0%) | 566 (100.0%) |
Commute Time in Apalachin
The most frequently occuring commute durations in Apalachin are 15 to 19 minutes (298 commuters, 24.2%), 20 to 24 minutes (248 commuters, 20.2%), and 10 to 14 minutes (223 commuters, 18.1%).
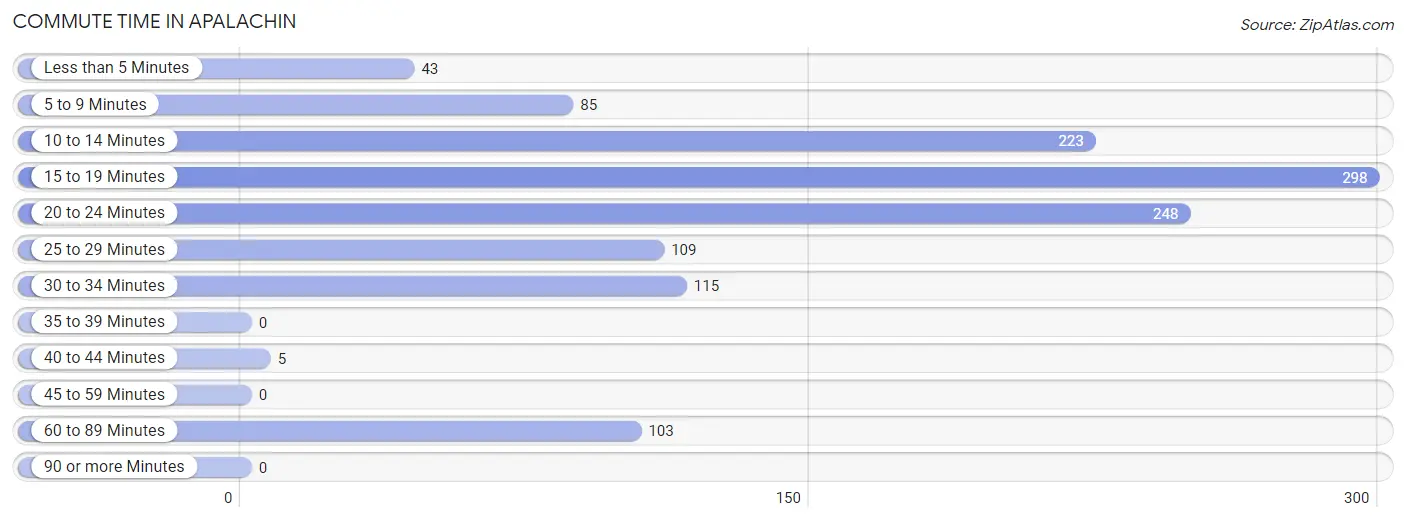
| Commute Time | # Commuters | % Commuters |
| Less than 5 Minutes | 43 | 3.5% |
| 5 to 9 Minutes | 85 | 6.9% |
| 10 to 14 Minutes | 223 | 18.1% |
| 15 to 19 Minutes | 298 | 24.2% |
| 20 to 24 Minutes | 248 | 20.2% |
| 25 to 29 Minutes | 109 | 8.9% |
| 30 to 34 Minutes | 115 | 9.4% |
| 35 to 39 Minutes | 0 | 0.0% |
| 40 to 44 Minutes | 5 | 0.4% |
| 45 to 59 Minutes | 0 | 0.0% |
| 60 to 89 Minutes | 103 | 8.4% |
| 90 or more Minutes | 0 | 0.0% |
Commute Time by Sex in Apalachin
The most common commute times in Apalachin are 15 to 19 minutes (190 commuters, 25.2%) for males and 20 to 24 minutes (155 commuters, 32.6%) for females.
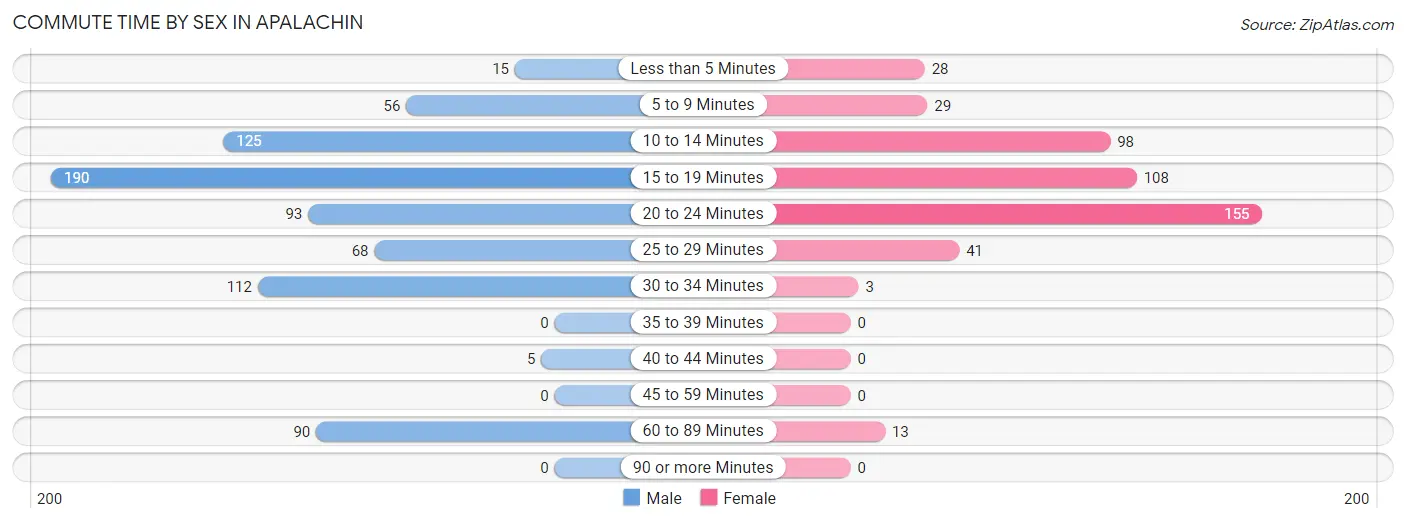
| Commute Time | Male | Female |
| Less than 5 Minutes | 15 (2.0%) | 28 (5.9%) |
| 5 to 9 Minutes | 56 (7.4%) | 29 (6.1%) |
| 10 to 14 Minutes | 125 (16.6%) | 98 (20.6%) |
| 15 to 19 Minutes | 190 (25.2%) | 108 (22.7%) |
| 20 to 24 Minutes | 93 (12.3%) | 155 (32.6%) |
| 25 to 29 Minutes | 68 (9.0%) | 41 (8.6%) |
| 30 to 34 Minutes | 112 (14.8%) | 3 (0.6%) |
| 35 to 39 Minutes | 0 (0.0%) | 0 (0.0%) |
| 40 to 44 Minutes | 5 (0.7%) | 0 (0.0%) |
| 45 to 59 Minutes | 0 (0.0%) | 0 (0.0%) |
| 60 to 89 Minutes | 90 (11.9%) | 13 (2.7%) |
| 90 or more Minutes | 0 (0.0%) | 0 (0.0%) |
Time of Departure to Work by Sex in Apalachin
The most frequent times of departure to work in Apalachin are 7:30 AM to 7:59 AM (199, 26.4%) for males and 7:00 AM to 7:29 AM (120, 25.3%) for females.
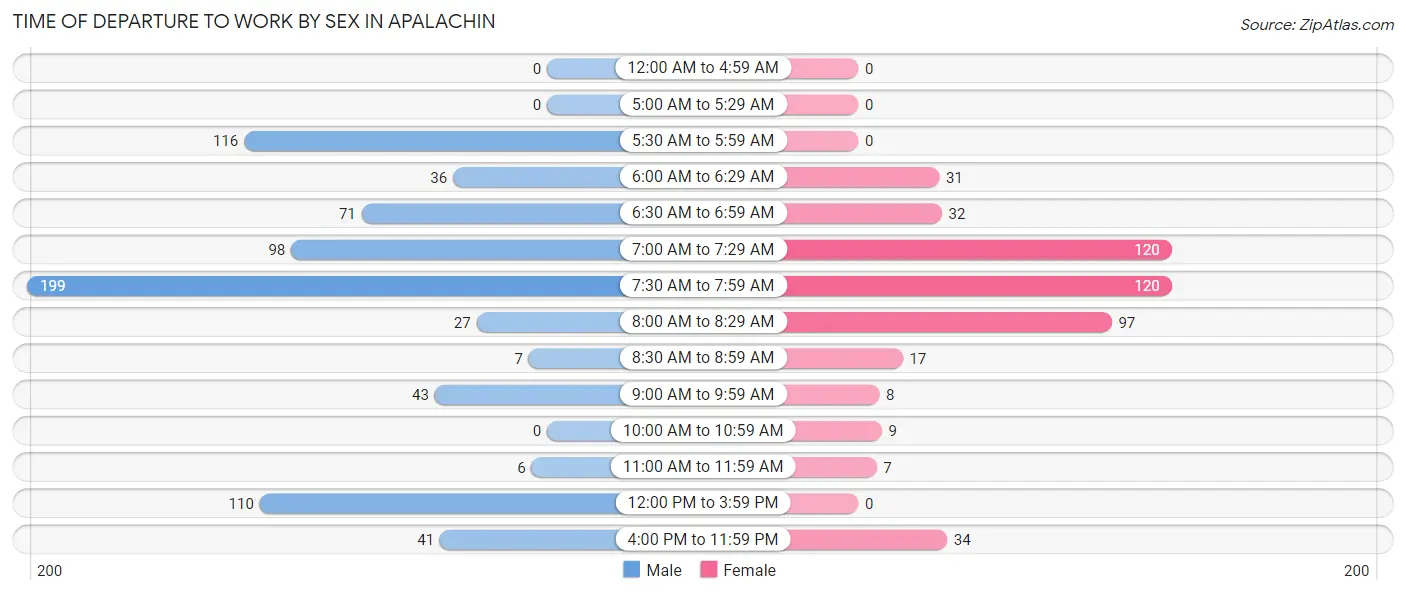
| Time of Departure | Male | Female |
| 12:00 AM to 4:59 AM | 0 (0.0%) | 0 (0.0%) |
| 5:00 AM to 5:29 AM | 0 (0.0%) | 0 (0.0%) |
| 5:30 AM to 5:59 AM | 116 (15.4%) | 0 (0.0%) |
| 6:00 AM to 6:29 AM | 36 (4.8%) | 31 (6.5%) |
| 6:30 AM to 6:59 AM | 71 (9.4%) | 32 (6.7%) |
| 7:00 AM to 7:29 AM | 98 (13.0%) | 120 (25.3%) |
| 7:30 AM to 7:59 AM | 199 (26.4%) | 120 (25.3%) |
| 8:00 AM to 8:29 AM | 27 (3.6%) | 97 (20.4%) |
| 8:30 AM to 8:59 AM | 7 (0.9%) | 17 (3.6%) |
| 9:00 AM to 9:59 AM | 43 (5.7%) | 8 (1.7%) |
| 10:00 AM to 10:59 AM | 0 (0.0%) | 9 (1.9%) |
| 11:00 AM to 11:59 AM | 6 (0.8%) | 7 (1.5%) |
| 12:00 PM to 3:59 PM | 110 (14.6%) | 0 (0.0%) |
| 4:00 PM to 11:59 PM | 41 (5.4%) | 34 (7.2%) |
| Total | 754 (100.0%) | 475 (100.0%) |
Housing Occupancy in Apalachin
Occupancy by Ownership in Apalachin
Of the total 933 dwellings in Apalachin, owner-occupied units account for 735 (78.8%), while renter-occupied units make up 198 (21.2%).
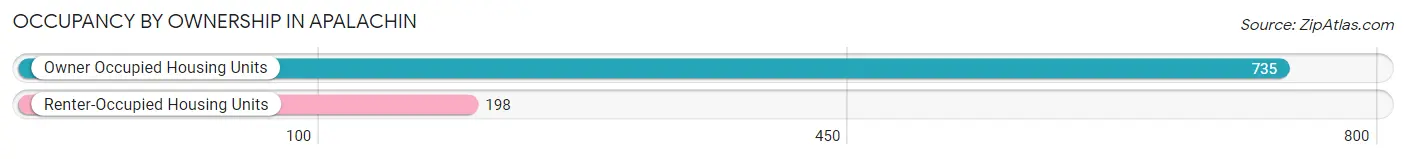
| Occupancy | # Housing Units | % Housing Units |
| Owner Occupied Housing Units | 735 | 78.8% |
| Renter-Occupied Housing Units | 198 | 21.2% |
| Total Occupied Housing Units | 933 | 100.0% |
Occupancy by Household Size in Apalachin
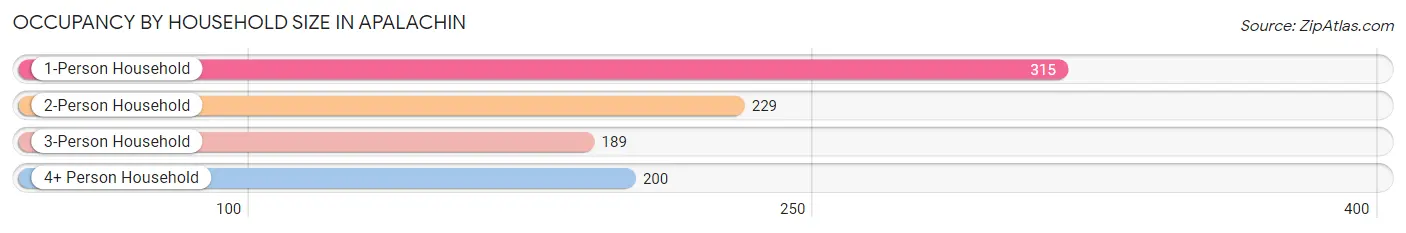
| Household Size | # Housing Units | % Housing Units |
| 1-Person Household | 315 | 33.8% |
| 2-Person Household | 229 | 24.5% |
| 3-Person Household | 189 | 20.3% |
| 4+ Person Household | 200 | 21.4% |
| Total Housing Units | 933 | 100.0% |
Occupancy by Ownership by Household Size in Apalachin
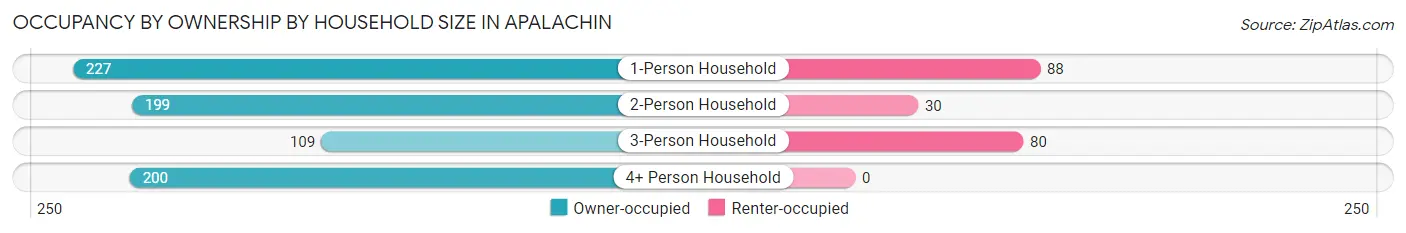
| Household Size | Owner-occupied | Renter-occupied |
| 1-Person Household | 227 (72.1%) | 88 (27.9%) |
| 2-Person Household | 199 (86.9%) | 30 (13.1%) |
| 3-Person Household | 109 (57.7%) | 80 (42.3%) |
| 4+ Person Household | 200 (100.0%) | 0 (0.0%) |
| Total Housing Units | 735 (78.8%) | 198 (21.2%) |
Occupancy by Educational Attainment in Apalachin
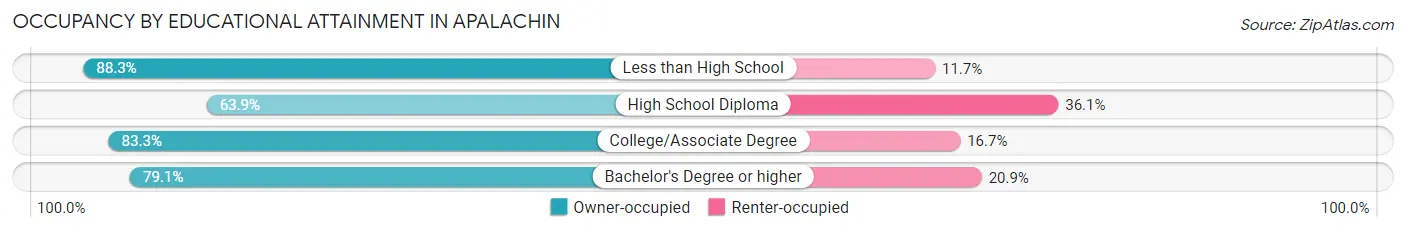
| Household Size | Owner-occupied | Renter-occupied |
| Less than High School | 53 (88.3%) | 7 (11.7%) |
| High School Diploma | 92 (63.9%) | 52 (36.1%) |
| College/Associate Degree | 265 (83.3%) | 53 (16.7%) |
| Bachelor's Degree or higher | 325 (79.1%) | 86 (20.9%) |
Occupancy by Age of Householder in Apalachin
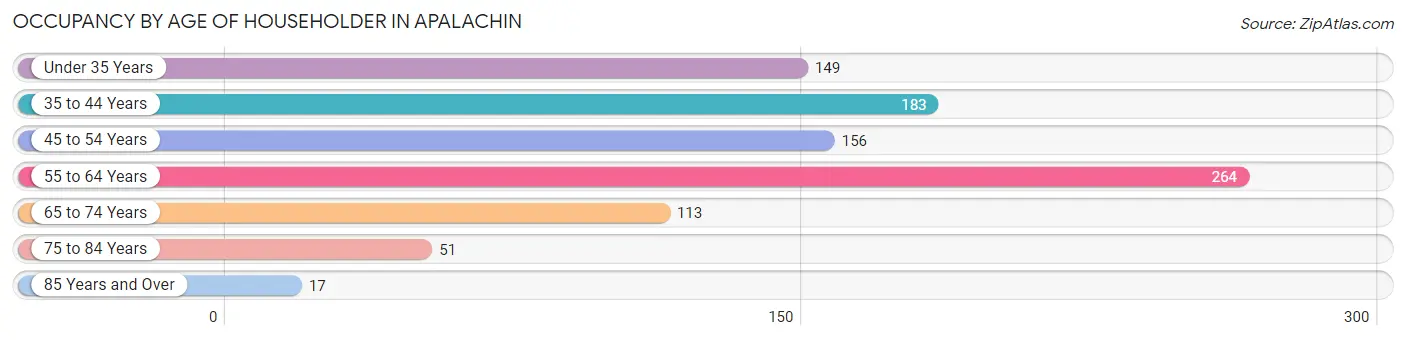
| Age Bracket | # Households | % Households |
| Under 35 Years | 149 | 16.0% |
| 35 to 44 Years | 183 | 19.6% |
| 45 to 54 Years | 156 | 16.7% |
| 55 to 64 Years | 264 | 28.3% |
| 65 to 74 Years | 113 | 12.1% |
| 75 to 84 Years | 51 | 5.5% |
| 85 Years and Over | 17 | 1.8% |
| Total | 933 | 100.0% |
Housing Finances in Apalachin
Median Income by Occupancy in Apalachin
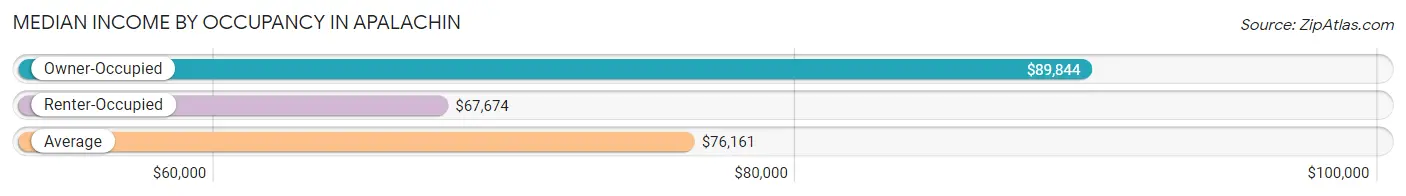
| Occupancy Type | # Households | Median Income |
| Owner-Occupied | 735 (78.8%) | $89,844 |
| Renter-Occupied | 198 (21.2%) | $67,674 |
| Average | 933 (100.0%) | $76,161 |
Occupancy by Householder Income Bracket in Apalachin
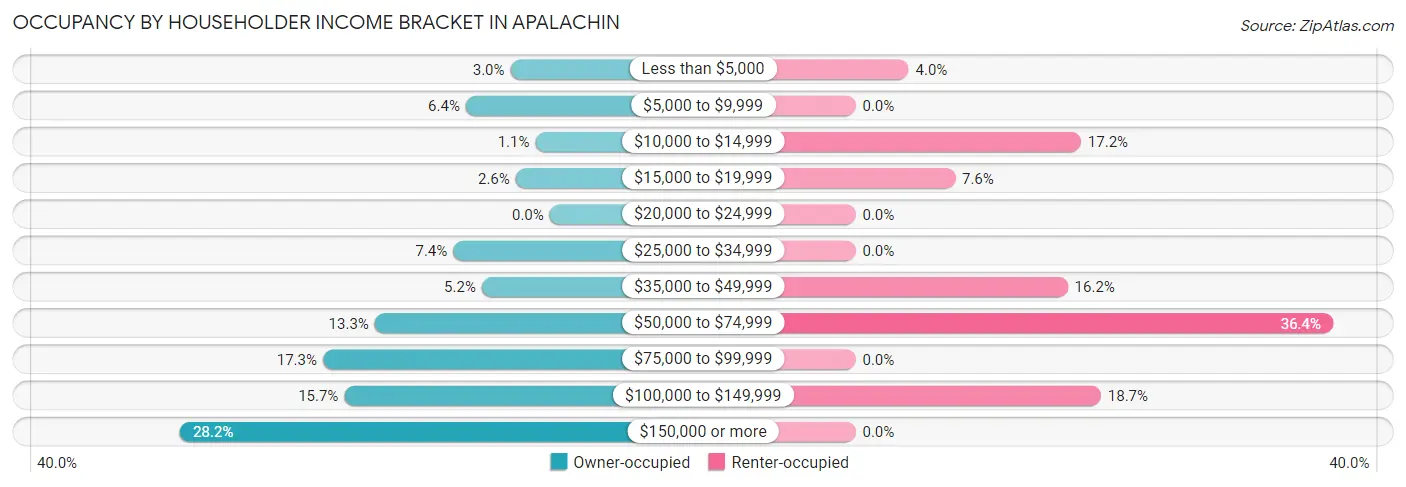
| Income Bracket | Owner-occupied | Renter-occupied |
| Less than $5,000 | 22 (3.0%) | 8 (4.0%) |
| $5,000 to $9,999 | 47 (6.4%) | 0 (0.0%) |
| $10,000 to $14,999 | 8 (1.1%) | 34 (17.2%) |
| $15,000 to $19,999 | 19 (2.6%) | 15 (7.6%) |
| $20,000 to $24,999 | 0 (0.0%) | 0 (0.0%) |
| $25,000 to $34,999 | 54 (7.3%) | 0 (0.0%) |
| $35,000 to $49,999 | 38 (5.2%) | 32 (16.2%) |
| $50,000 to $74,999 | 98 (13.3%) | 72 (36.4%) |
| $75,000 to $99,999 | 127 (17.3%) | 0 (0.0%) |
| $100,000 to $149,999 | 115 (15.7%) | 37 (18.7%) |
| $150,000 or more | 207 (28.2%) | 0 (0.0%) |
| Total | 735 (100.0%) | 198 (100.0%) |
Monthly Housing Cost Tiers in Apalachin
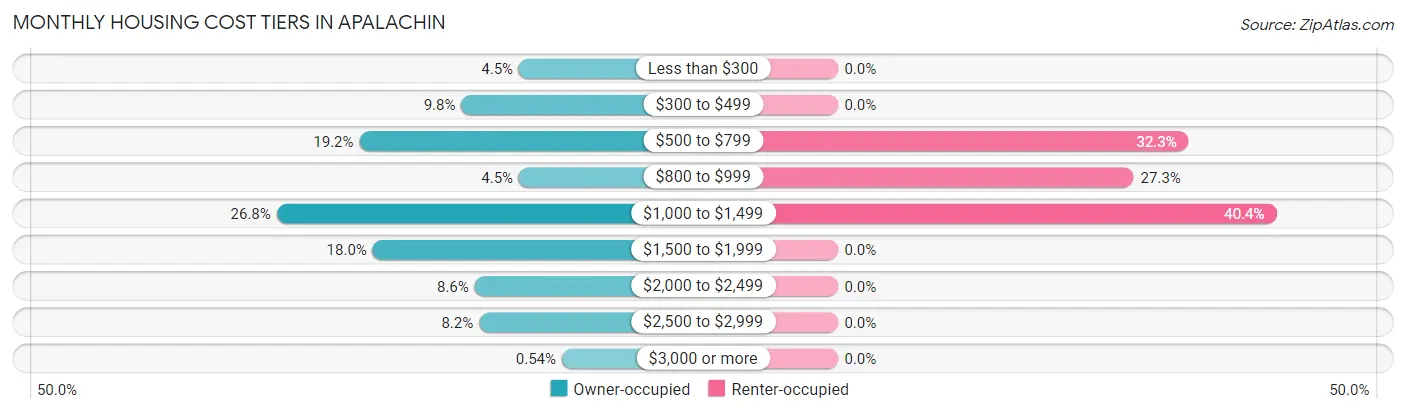
| Monthly Cost | Owner-occupied | Renter-occupied |
| Less than $300 | 33 (4.5%) | 0 (0.0%) |
| $300 to $499 | 72 (9.8%) | 0 (0.0%) |
| $500 to $799 | 141 (19.2%) | 64 (32.3%) |
| $800 to $999 | 33 (4.5%) | 54 (27.3%) |
| $1,000 to $1,499 | 197 (26.8%) | 80 (40.4%) |
| $1,500 to $1,999 | 132 (18.0%) | 0 (0.0%) |
| $2,000 to $2,499 | 63 (8.6%) | 0 (0.0%) |
| $2,500 to $2,999 | 60 (8.2%) | 0 (0.0%) |
| $3,000 or more | 4 (0.5%) | 0 (0.0%) |
| Total | 735 (100.0%) | 198 (100.0%) |
Physical Housing Characteristics in Apalachin
Housing Structures in Apalachin
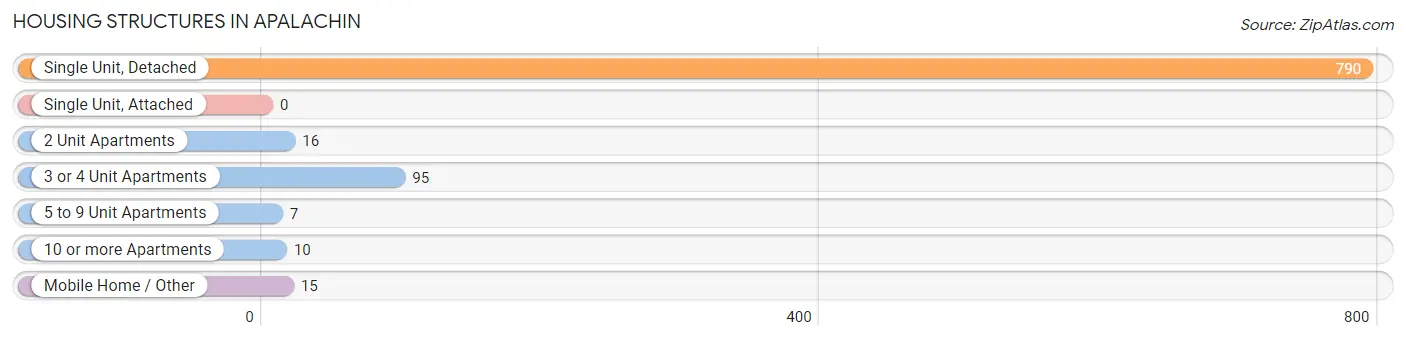
| Structure Type | # Housing Units | % Housing Units |
| Single Unit, Detached | 790 | 84.7% |
| Single Unit, Attached | 0 | 0.0% |
| 2 Unit Apartments | 16 | 1.7% |
| 3 or 4 Unit Apartments | 95 | 10.2% |
| 5 to 9 Unit Apartments | 7 | 0.7% |
| 10 or more Apartments | 10 | 1.1% |
| Mobile Home / Other | 15 | 1.6% |
| Total | 933 | 100.0% |
Housing Structures by Occupancy in Apalachin
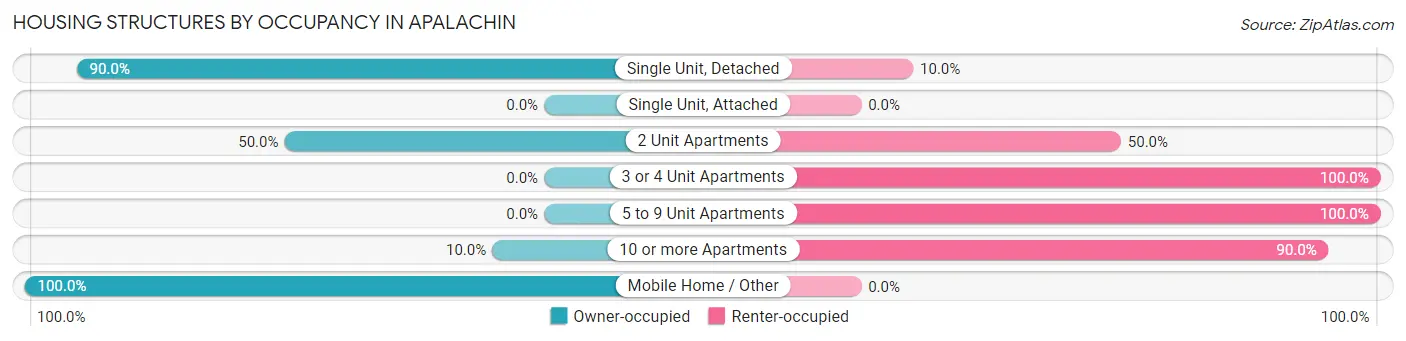
| Structure Type | Owner-occupied | Renter-occupied |
| Single Unit, Detached | 711 (90.0%) | 79 (10.0%) |
| Single Unit, Attached | 0 (0.0%) | 0 (0.0%) |
| 2 Unit Apartments | 8 (50.0%) | 8 (50.0%) |
| 3 or 4 Unit Apartments | 0 (0.0%) | 95 (100.0%) |
| 5 to 9 Unit Apartments | 0 (0.0%) | 7 (100.0%) |
| 10 or more Apartments | 1 (10.0%) | 9 (90.0%) |
| Mobile Home / Other | 15 (100.0%) | 0 (0.0%) |
| Total | 735 (78.8%) | 198 (21.2%) |
Housing Structures by Number of Rooms in Apalachin
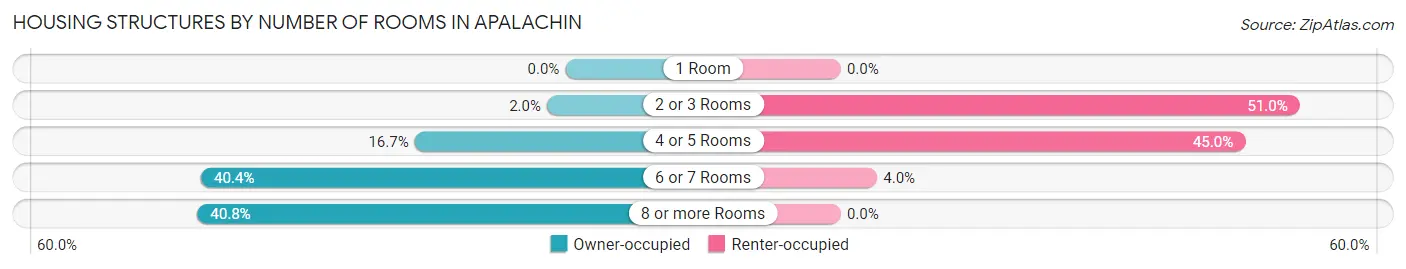
| Number of Rooms | Owner-occupied | Renter-occupied |
| 1 Room | 0 (0.0%) | 0 (0.0%) |
| 2 or 3 Rooms | 15 (2.0%) | 101 (51.0%) |
| 4 or 5 Rooms | 123 (16.7%) | 89 (45.0%) |
| 6 or 7 Rooms | 297 (40.4%) | 8 (4.0%) |
| 8 or more Rooms | 300 (40.8%) | 0 (0.0%) |
| Total | 735 (100.0%) | 198 (100.0%) |
Housing Structure by Heating Type in Apalachin
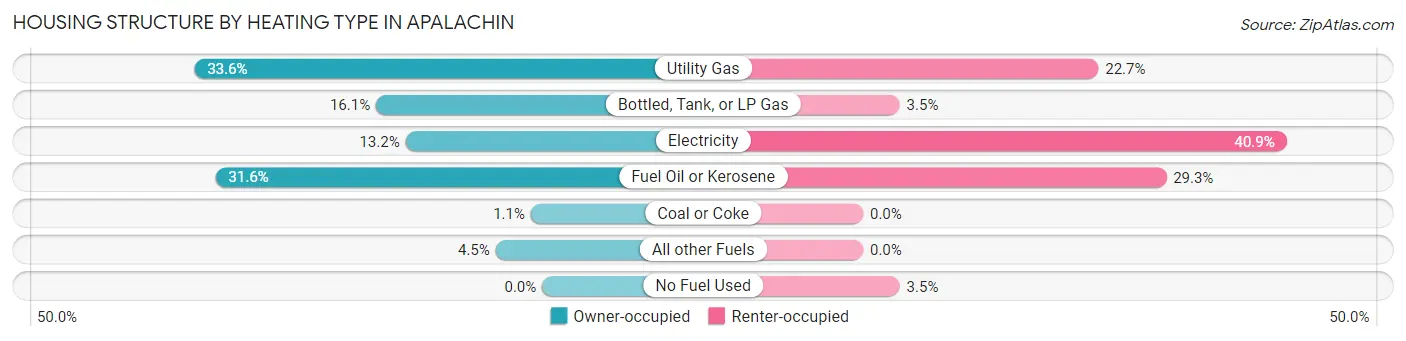
| Heating Type | Owner-occupied | Renter-occupied |
| Utility Gas | 247 (33.6%) | 45 (22.7%) |
| Bottled, Tank, or LP Gas | 118 (16.1%) | 7 (3.5%) |
| Electricity | 97 (13.2%) | 81 (40.9%) |
| Fuel Oil or Kerosene | 232 (31.6%) | 58 (29.3%) |
| Coal or Coke | 8 (1.1%) | 0 (0.0%) |
| All other Fuels | 33 (4.5%) | 0 (0.0%) |
| No Fuel Used | 0 (0.0%) | 7 (3.5%) |
| Total | 735 (100.0%) | 198 (100.0%) |
Household Vehicle Usage in Apalachin
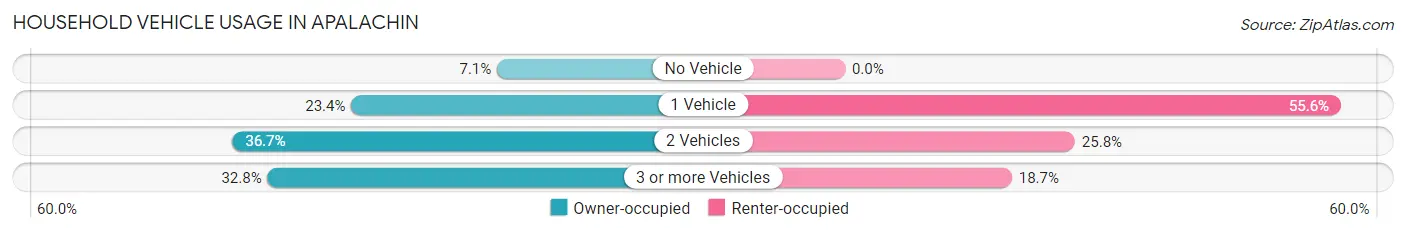
| Vehicles per Household | Owner-occupied | Renter-occupied |
| No Vehicle | 52 (7.1%) | 0 (0.0%) |
| 1 Vehicle | 172 (23.4%) | 110 (55.6%) |
| 2 Vehicles | 270 (36.7%) | 51 (25.8%) |
| 3 or more Vehicles | 241 (32.8%) | 37 (18.7%) |
| Total | 735 (100.0%) | 198 (100.0%) |
Real Estate & Mortgages in Apalachin
Real Estate and Mortgage Overview in Apalachin
| Characteristic | Without Mortgage | With Mortgage |
| Housing Units | 268 | 467 |
| Median Property Value | $128,200 | $156,600 |
| Median Household Income | $43,947 | $183 |
| Monthly Housing Costs | $609 | $4 |
| Real Estate Taxes | $2,813 | $0 |
Property Value by Mortgage Status in Apalachin
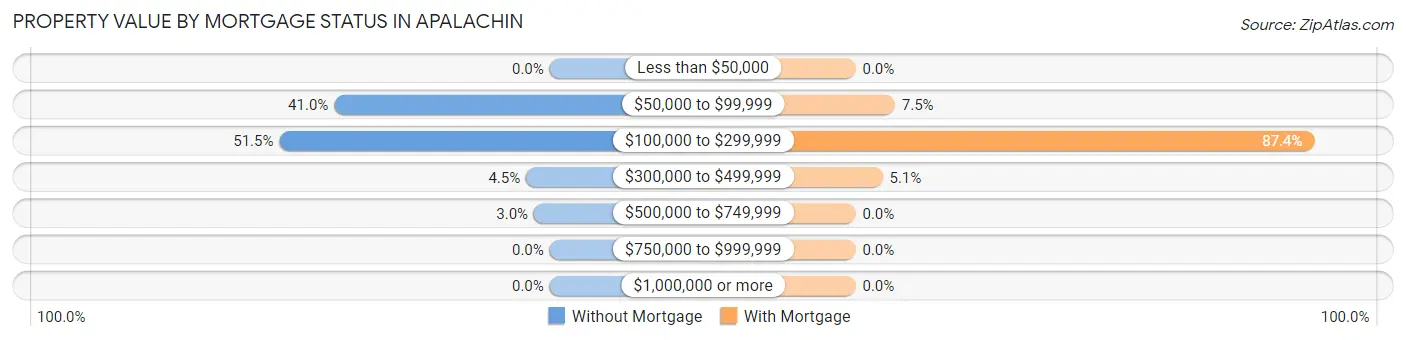
| Property Value | Without Mortgage | With Mortgage |
| Less than $50,000 | 0 (0.0%) | 0 (0.0%) |
| $50,000 to $99,999 | 110 (41.0%) | 35 (7.5%) |
| $100,000 to $299,999 | 138 (51.5%) | 408 (87.4%) |
| $300,000 to $499,999 | 12 (4.5%) | 24 (5.1%) |
| $500,000 to $749,999 | 8 (3.0%) | 0 (0.0%) |
| $750,000 to $999,999 | 0 (0.0%) | 0 (0.0%) |
| $1,000,000 or more | 0 (0.0%) | 0 (0.0%) |
| Total | 268 (100.0%) | 467 (100.0%) |
Household Income by Mortgage Status in Apalachin
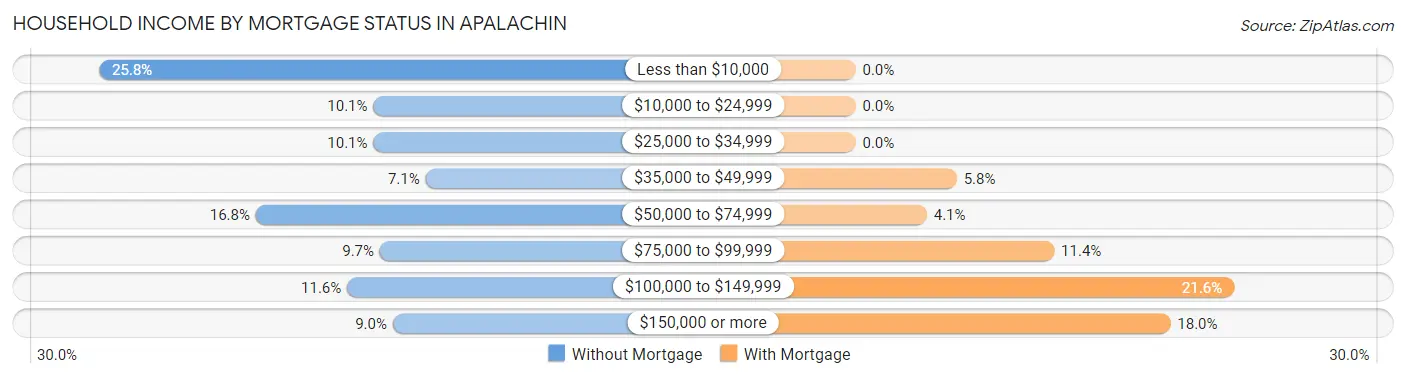
| Household Income | Without Mortgage | With Mortgage |
| Less than $10,000 | 69 (25.8%) | 0 (0.0%) |
| $10,000 to $24,999 | 27 (10.1%) | 0 (0.0%) |
| $25,000 to $34,999 | 27 (10.1%) | 0 (0.0%) |
| $35,000 to $49,999 | 19 (7.1%) | 27 (5.8%) |
| $50,000 to $74,999 | 45 (16.8%) | 19 (4.1%) |
| $75,000 to $99,999 | 26 (9.7%) | 53 (11.4%) |
| $100,000 to $149,999 | 31 (11.6%) | 101 (21.6%) |
| $150,000 or more | 24 (9.0%) | 84 (18.0%) |
| Total | 268 (100.0%) | 467 (100.0%) |
Property Value to Household Income Ratio in Apalachin
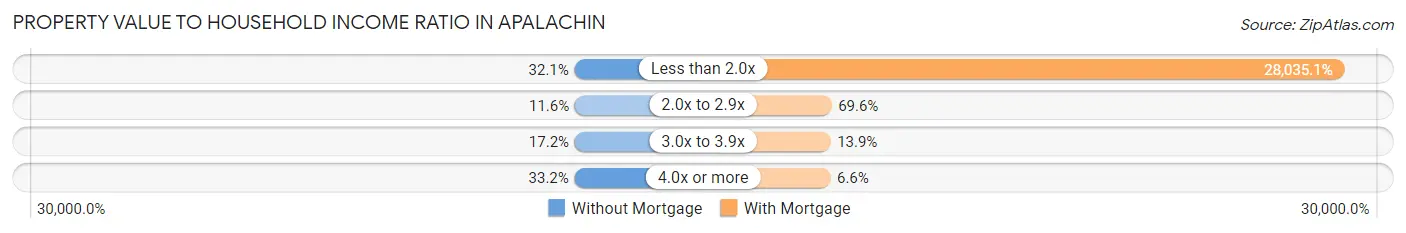
| Value-to-Income Ratio | Without Mortgage | With Mortgage |
| Less than 2.0x | 86 (32.1%) | 130,924 (28,035.1%) |
| 2.0x to 2.9x | 31 (11.6%) | 325 (69.6%) |
| 3.0x to 3.9x | 46 (17.2%) | 65 (13.9%) |
| 4.0x or more | 89 (33.2%) | 31 (6.6%) |
| Total | 268 (100.0%) | 467 (100.0%) |
Real Estate Taxes by Mortgage Status in Apalachin
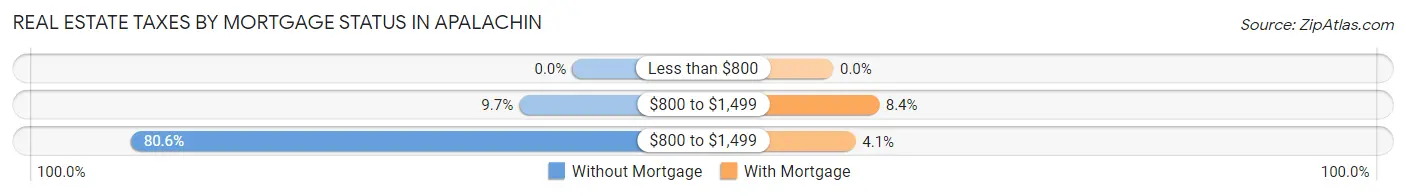
| Property Taxes | Without Mortgage | With Mortgage |
| Less than $800 | 0 (0.0%) | 0 (0.0%) |
| $800 to $1,499 | 26 (9.7%) | 39 (8.4%) |
| $800 to $1,499 | 216 (80.6%) | 19 (4.1%) |
| Total | 268 (100.0%) | 467 (100.0%) |
Health & Disability in Apalachin
Health Insurance Coverage by Age in Apalachin
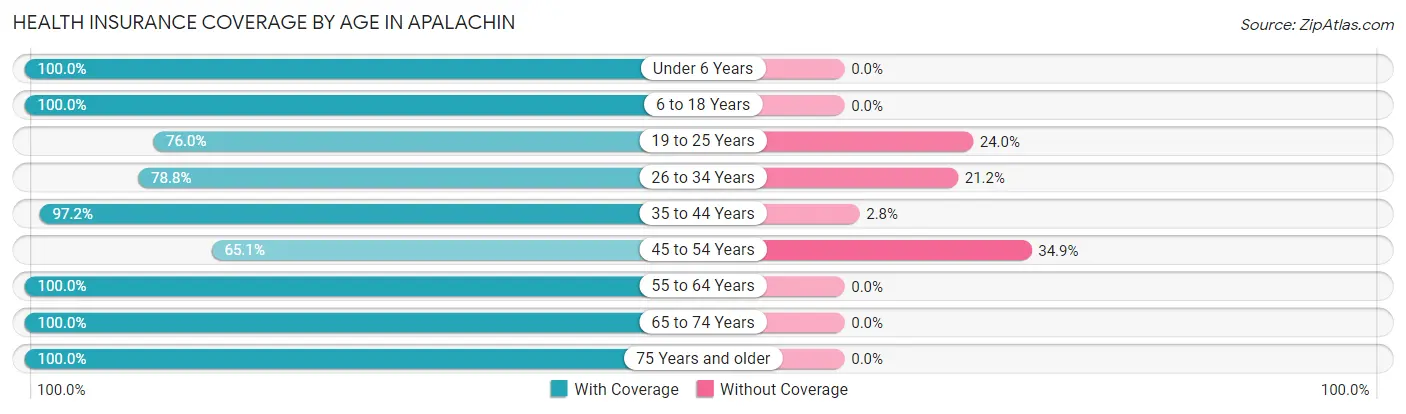
| Age Bracket | With Coverage | Without Coverage |
| Under 6 Years | 116 (100.0%) | 0 (0.0%) |
| 6 to 18 Years | 417 (100.0%) | 0 (0.0%) |
| 19 to 25 Years | 219 (76.0%) | 69 (24.0%) |
| 26 to 34 Years | 175 (78.8%) | 47 (21.2%) |
| 35 to 44 Years | 313 (97.2%) | 9 (2.8%) |
| 45 to 54 Years | 226 (65.1%) | 121 (34.9%) |
| 55 to 64 Years | 396 (100.0%) | 0 (0.0%) |
| 65 to 74 Years | 155 (100.0%) | 0 (0.0%) |
| 75 Years and older | 93 (100.0%) | 0 (0.0%) |
| Total | 2,110 (89.6%) | 246 (10.4%) |
Health Insurance Coverage by Citizenship Status in Apalachin
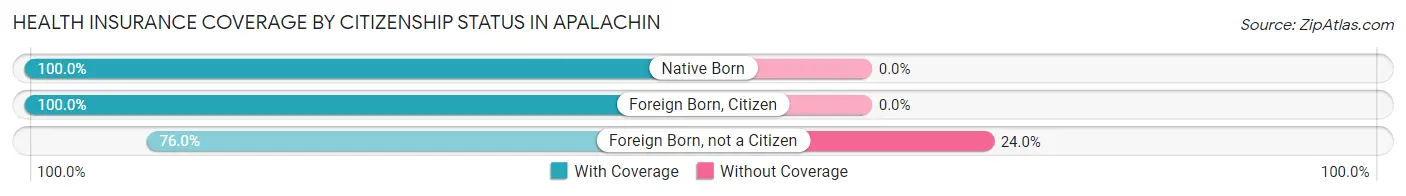
| Citizenship Status | With Coverage | Without Coverage |
| Native Born | 116 (100.0%) | 0 (0.0%) |
| Foreign Born, Citizen | 417 (100.0%) | 0 (0.0%) |
| Foreign Born, not a Citizen | 219 (76.0%) | 69 (24.0%) |
Health Insurance Coverage by Household Income in Apalachin
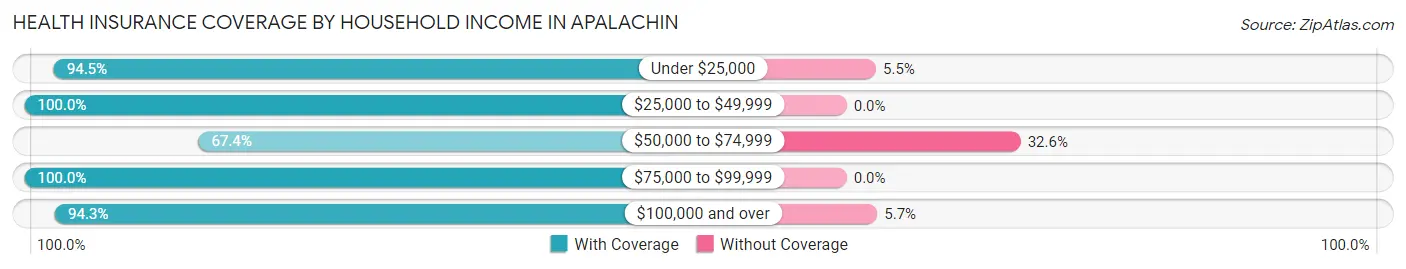
| Household Income | With Coverage | Without Coverage |
| Under $25,000 | 155 (94.5%) | 9 (5.5%) |
| $25,000 to $49,999 | 198 (100.0%) | 0 (0.0%) |
| $50,000 to $74,999 | 302 (67.4%) | 146 (32.6%) |
| $75,000 to $99,999 | 275 (100.0%) | 0 (0.0%) |
| $100,000 and over | 1,154 (94.3%) | 70 (5.7%) |
Public vs Private Health Insurance Coverage by Age in Apalachin
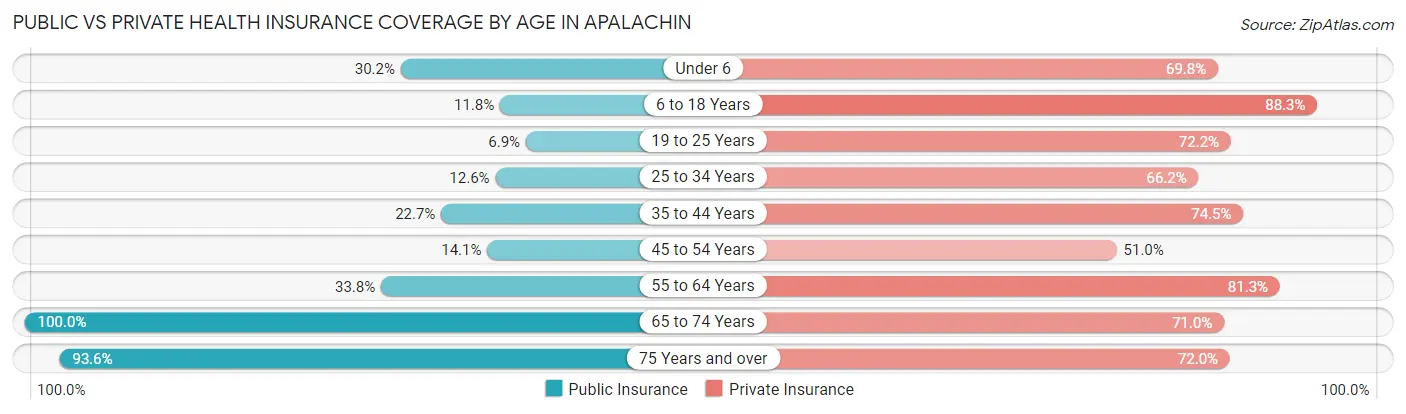
| Age Bracket | Public Insurance | Private Insurance |
| Under 6 | 35 (30.2%) | 81 (69.8%) |
| 6 to 18 Years | 49 (11.7%) | 368 (88.2%) |
| 19 to 25 Years | 20 (6.9%) | 208 (72.2%) |
| 25 to 34 Years | 28 (12.6%) | 147 (66.2%) |
| 35 to 44 Years | 73 (22.7%) | 240 (74.5%) |
| 45 to 54 Years | 49 (14.1%) | 177 (51.0%) |
| 55 to 64 Years | 134 (33.8%) | 322 (81.3%) |
| 65 to 74 Years | 155 (100.0%) | 110 (71.0%) |
| 75 Years and over | 87 (93.5%) | 67 (72.0%) |
| Total | 630 (26.7%) | 1,720 (73.0%) |
Disability Status by Sex by Age in Apalachin
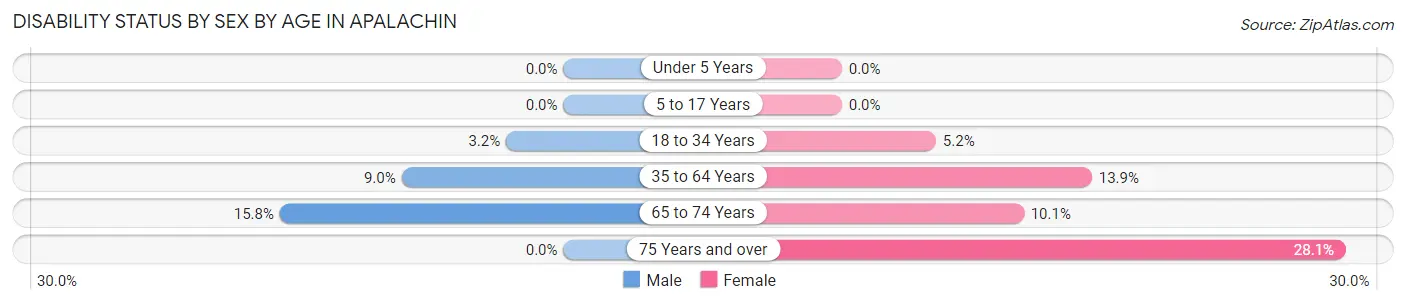
| Age Bracket | Male | Female |
| Under 5 Years | 0 (0.0%) | 0 (0.0%) |
| 5 to 17 Years | 0 (0.0%) | 0 (0.0%) |
| 18 to 34 Years | 9 (3.2%) | 13 (5.2%) |
| 35 to 64 Years | 50 (9.0%) | 71 (13.9%) |
| 65 to 74 Years | 12 (15.8%) | 8 (10.1%) |
| 75 Years and over | 0 (0.0%) | 16 (28.1%) |
Disability Class by Sex by Age in Apalachin
Disability Class: Hearing Difficulty
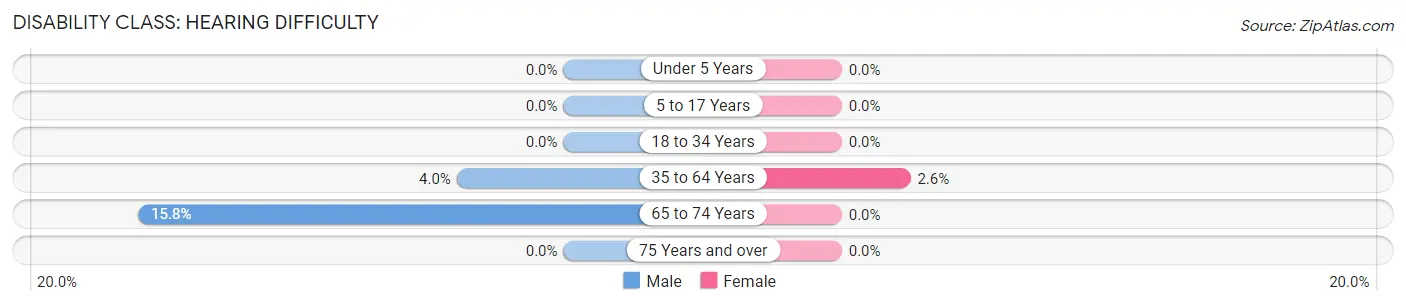
| Age Bracket | Male | Female |
| Under 5 Years | 0 (0.0%) | 0 (0.0%) |
| 5 to 17 Years | 0 (0.0%) | 0 (0.0%) |
| 18 to 34 Years | 0 (0.0%) | 0 (0.0%) |
| 35 to 64 Years | 22 (4.0%) | 13 (2.5%) |
| 65 to 74 Years | 12 (15.8%) | 0 (0.0%) |
| 75 Years and over | 0 (0.0%) | 0 (0.0%) |
Disability Class: Vision Difficulty
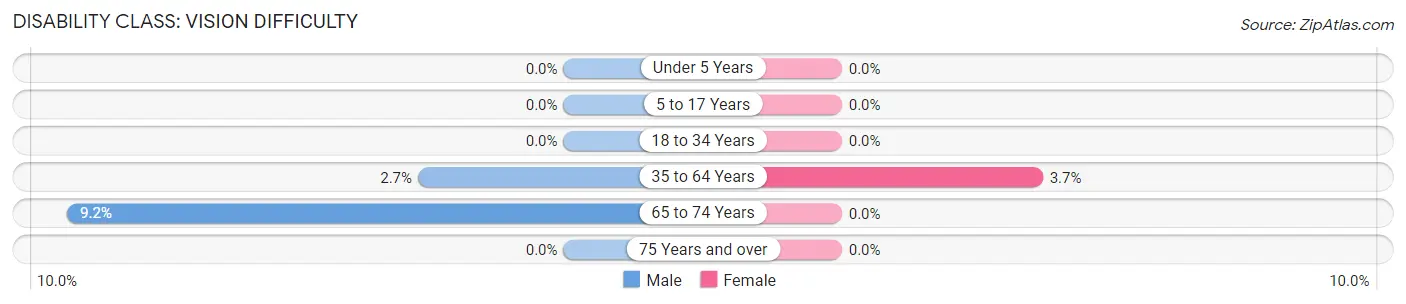
| Age Bracket | Male | Female |
| Under 5 Years | 0 (0.0%) | 0 (0.0%) |
| 5 to 17 Years | 0 (0.0%) | 0 (0.0%) |
| 18 to 34 Years | 0 (0.0%) | 0 (0.0%) |
| 35 to 64 Years | 15 (2.7%) | 19 (3.7%) |
| 65 to 74 Years | 7 (9.2%) | 0 (0.0%) |
| 75 Years and over | 0 (0.0%) | 0 (0.0%) |
Disability Class: Cognitive Difficulty
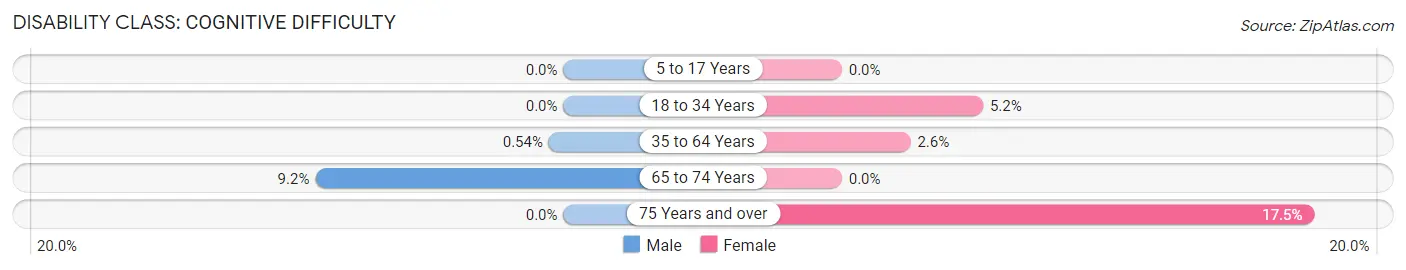
| Age Bracket | Male | Female |
| 5 to 17 Years | 0 (0.0%) | 0 (0.0%) |
| 18 to 34 Years | 0 (0.0%) | 13 (5.2%) |
| 35 to 64 Years | 3 (0.5%) | 13 (2.5%) |
| 65 to 74 Years | 7 (9.2%) | 0 (0.0%) |
| 75 Years and over | 0 (0.0%) | 10 (17.5%) |
Disability Class: Ambulatory Difficulty
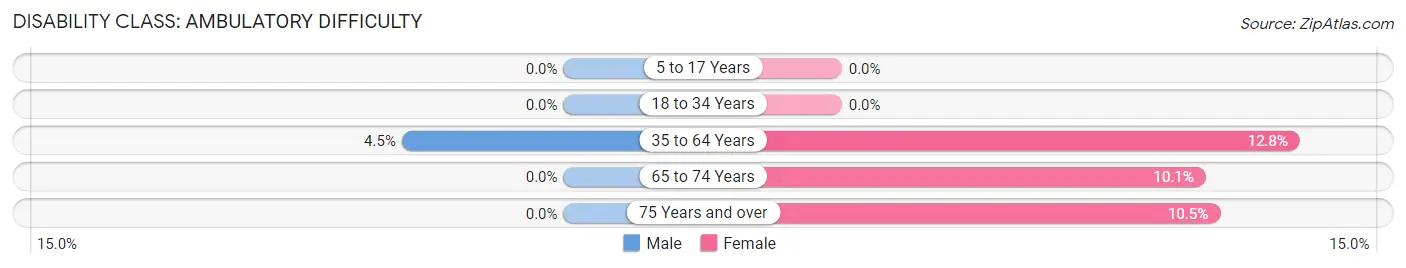
| Age Bracket | Male | Female |
| 5 to 17 Years | 0 (0.0%) | 0 (0.0%) |
| 18 to 34 Years | 0 (0.0%) | 0 (0.0%) |
| 35 to 64 Years | 25 (4.5%) | 65 (12.8%) |
| 65 to 74 Years | 0 (0.0%) | 8 (10.1%) |
| 75 Years and over | 0 (0.0%) | 6 (10.5%) |
Disability Class: Self-Care Difficulty
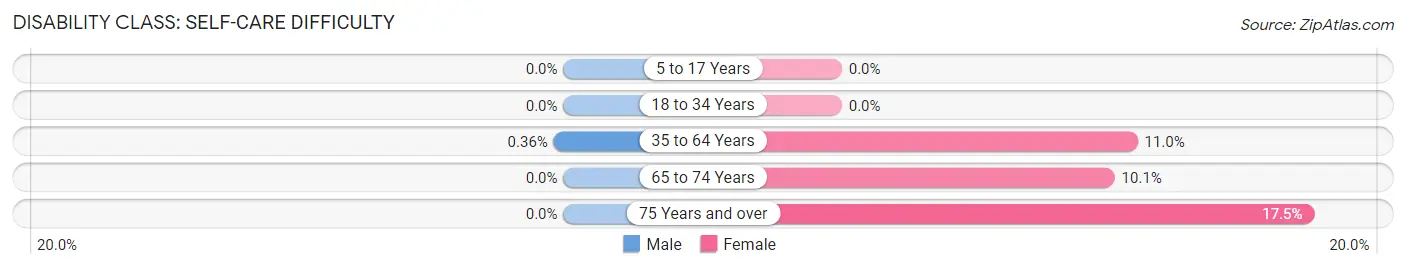
| Age Bracket | Male | Female |
| 5 to 17 Years | 0 (0.0%) | 0 (0.0%) |
| 18 to 34 Years | 0 (0.0%) | 0 (0.0%) |
| 35 to 64 Years | 2 (0.4%) | 56 (11.0%) |
| 65 to 74 Years | 0 (0.0%) | 8 (10.1%) |
| 75 Years and over | 0 (0.0%) | 10 (17.5%) |
Technology Access in Apalachin
Computing Device Access in Apalachin
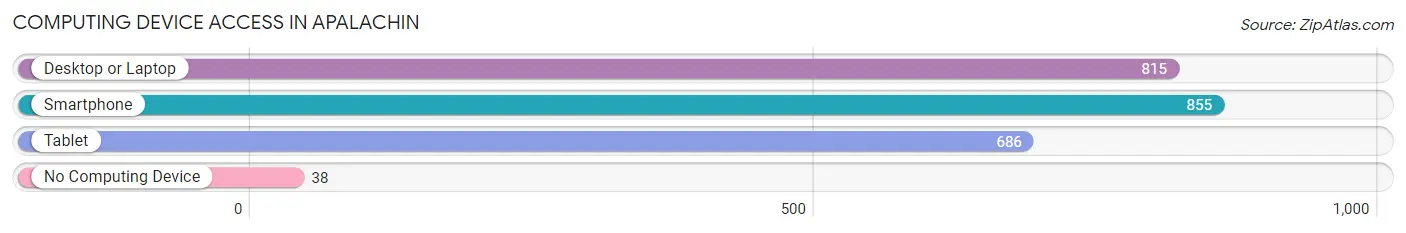
| Device Type | # Households | % Households |
| Desktop or Laptop | 815 | 87.4% |
| Smartphone | 855 | 91.6% |
| Tablet | 686 | 73.5% |
| No Computing Device | 38 | 4.1% |
| Total | 933 | 100.0% |
Internet Access in Apalachin
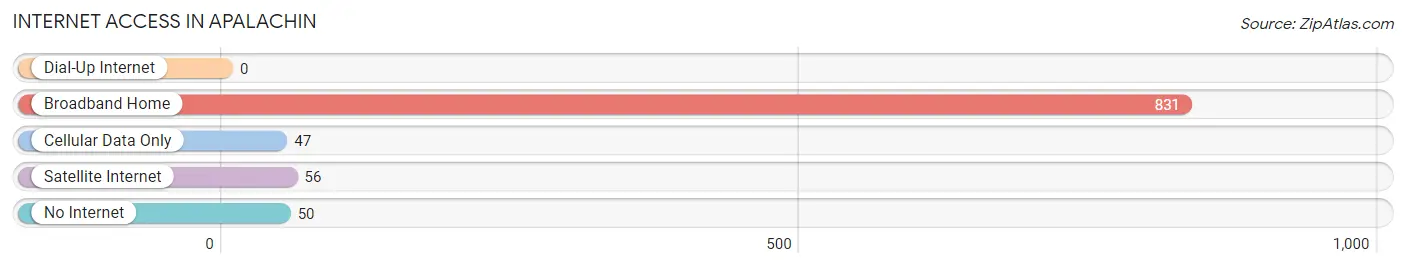
| Internet Type | # Households | % Households |
| Dial-Up Internet | 0 | 0.0% |
| Broadband Home | 831 | 89.1% |
| Cellular Data Only | 47 | 5.0% |
| Satellite Internet | 56 | 6.0% |
| No Internet | 50 | 5.4% |
| Total | 933 | 100.0% |
Apalachin Summary
Apalachin is a small hamlet located in the Town of Owego in Tioga County, New York. It is situated on the banks of the Susquehanna River, approximately 10 miles west of the City of Binghamton. The population of Apalachin was 1,741 at the 2010 census.
History
The area that is now Apalachin was originally inhabited by the Iroquois Native American tribe. The first European settlers arrived in the area in the late 1700s. The hamlet was originally known as "Park Settlement" and was renamed Apalachin in 1848. The name is derived from the Native American word "Apalachin," which means "where two rivers meet."
The hamlet was an important stop on the Erie Railroad, which ran through the area in the late 1800s. The railroad brought many new settlers to the area, and the hamlet grew rapidly. In 1892, the Apalachin post office was established.
In the early 1900s, Apalachin was a thriving community with several businesses, including a hotel, a general store, a blacksmith shop, and a sawmill. The hamlet also had a school, a church, and a library.
Geography
Apalachin is located at 42°06'N 76°09'W (42.10, -76.15). According to the United States Census Bureau, the hamlet has a total area of 0.7 square miles (1.8 km2), all of it land.
The hamlet is situated on the banks of the Susquehanna River, approximately 10 miles west of the City of Binghamton. The terrain is mostly flat, with some rolling hills. The climate is humid continental, with cold winters and hot, humid summers.
Economy
Apalachin's economy is largely based on agriculture and tourism. The hamlet is home to several farms, which produce a variety of crops, including corn, soybeans, and hay. The hamlet is also home to several wineries, which produce a variety of wines.
The hamlet is also home to several small businesses, including restaurants, retail stores, and service providers. The hamlet is also home to several manufacturing companies, which produce a variety of products, including furniture, clothing, and electronics.
Demographics
As of the 2010 census, there were 1,741 people, 690 households, and 463 families residing in the hamlet. The population density was 2,521.3 people per square mile (973.2/km2). The racial makeup of the hamlet was 97.2% White, 0.7% African American, 0.2% Native American, 0.3% Asian, 0.1% Pacific Islander, 0.3% from other races, and 1.3% from two or more races. Hispanic or Latino of any race were 1.3% of the population.
The median age in the hamlet was 43.2 years. 22.2% of residents were under the age of 18; 6.2% were between the ages of 18 and 24; 22.7% were from 25 to 44; 32.2% were from 45 to 64; and 16.7% were 65 years of age or older. The gender makeup of the hamlet was 48.2% male and 51.8% female.
The median income for a household in the hamlet was $45,000, and the median income for a family was $51,000. Males had a median income of $37,000 versus $27,000 for females. The per capita income for the hamlet was $20,000. About 5.2% of families and 8.2% of the population were below the poverty line, including 10.2% of those under age 18 and 5.2% of those age 65 or over.
Common Questions
What is the Total Population of Apalachin?
Total Population of Apalachin is 2,356.
What is the Total Male Population of Apalachin?
Total Male Population of Apalachin is 1,168.
What is the Total Female Population of Apalachin?
Total Female Population of Apalachin is 1,188.
What is the Ratio of Males per 100 Females in Apalachin?
There are 98.32 Males per 100 Females in Apalachin.
What is the Ratio of Females per 100 Males in Apalachin?
There are 101.71 Females per 100 Males in Apalachin.
What is the Median Population Age in Apalachin?
Median Population Age in Apalachin is 39.1 Years.
What is the Average Family Size in Apalachin
Average Family Size in Apalachin is 3.1 People.
What is the Average Household Size in Apalachin
Average Household Size in Apalachin is 2.5 People.
What is Per Capita Income in Apalachin?
Per Capita income in Apalachin is $41,222.
What is the Median Family Income in Apalachin?
Median Family Income in Apalachin is $116,453.
What is the Median Household income in Apalachin?
Median Household Income in Apalachin is $76,161.
What is Income or Wage Gap in Apalachin?
Income or Wage Gap in Apalachin is 26.6%.
Women in Apalachin earn 73.4 cents for every dollar earned by a man.
What is Inequality or Gini Index in Apalachin?
Inequality or Gini Index in Apalachin is 0.45.
How Large is the Labor Force in Apalachin?
There are 1,462 People in the Labor Forcein in Apalachin.
What is the Percentage of People in the Labor Force in Apalachin?
77.5% of People are in the Labor Force in Apalachin.
What is the Unemployment Rate in Apalachin?
Unemployment Rate in Apalachin is 4.3%.