Zip Codes with the Highest Percentage of Population Employed in Transportation & Warehousing in Nevada
RELATED REPORTS & OPTIONS
Transportation & Warehousing
Nevada
Compare Zip Codes
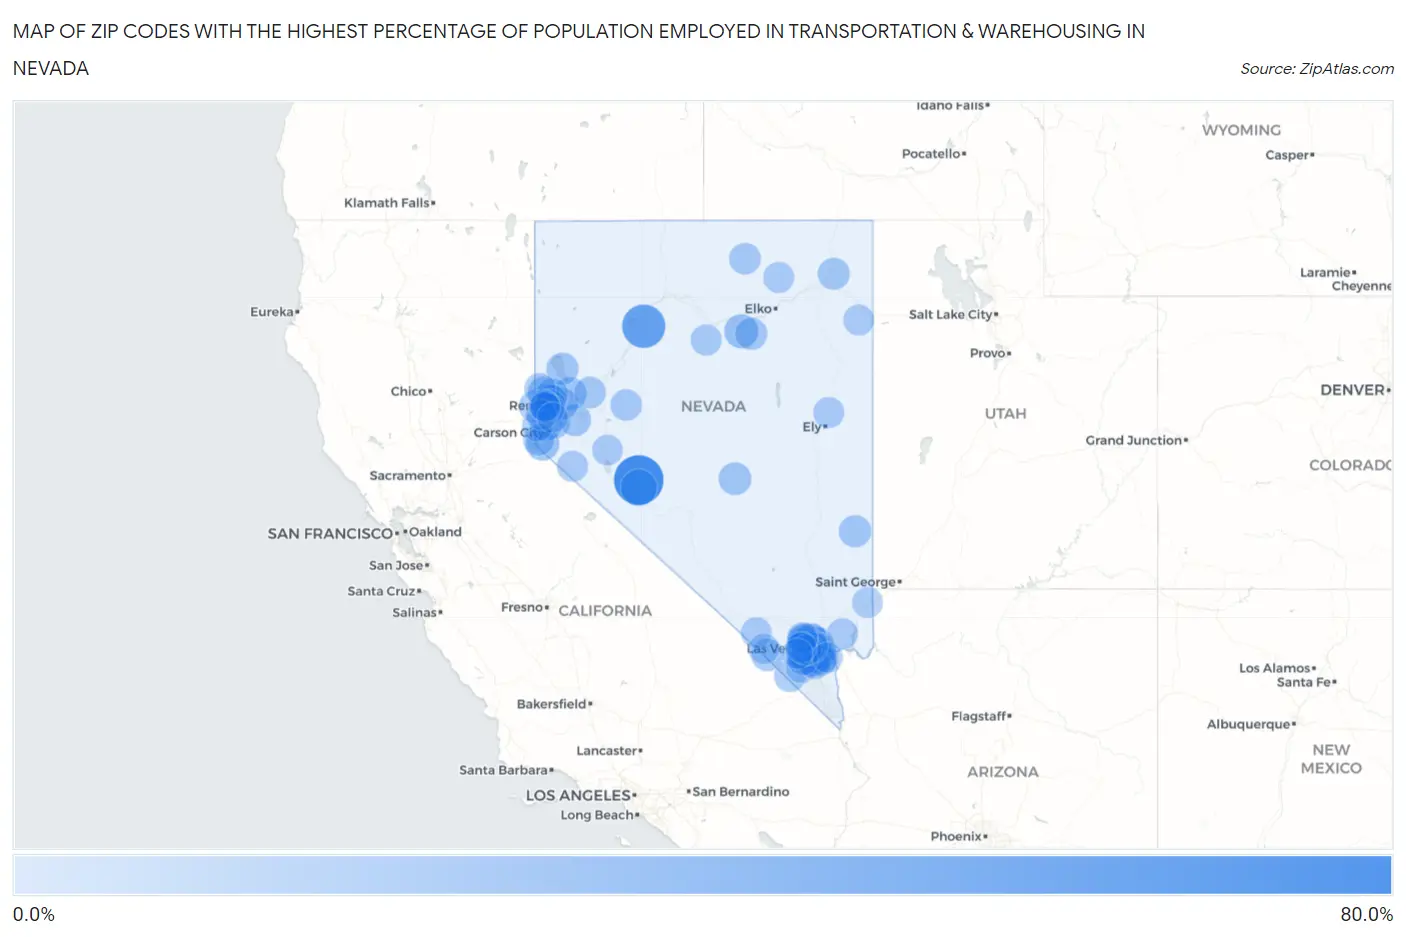
Map of Zip Codes with the Highest Percentage of Population Employed in Transportation & Warehousing in Nevada
0.0%
80.0%
Zip Codes with the Highest Percentage of Population Employed in Transportation & Warehousing in Nevada
| Zip Code | % Employed | vs State | vs National | |
| 1. | 89420 | 73.0% | 6.1%(+66.8)#1 | 4.9%(+68.0)#36 |
| 2. | 89418 | 50.0% | 6.1%(+43.9)#2 | 4.9%(+45.1)#77 |
| 3. | 89422 | 25.7% | 6.1%(+19.6)#3 | 4.9%(+20.8)#318 |
| 4. | 89821 | 16.9% | 6.1%(+10.7)#4 | 4.9%(+11.9)#787 |
| 5. | 89411 | 15.0% | 6.1%(+8.85)#5 | 4.9%(+10.0)#1,068 |
| 6. | 89118 | 14.4% | 6.1%(+8.28)#6 | 4.9%(+9.46)#1,178 |
| 7. | 89442 | 12.9% | 6.1%(+6.74)#7 | 4.9%(+7.92)#1,570 |
| 8. | 89049 | 12.0% | 6.1%(+5.89)#8 | 4.9%(+7.08)#1,848 |
| 9. | 89433 | 11.5% | 6.1%(+5.34)#9 | 4.9%(+6.53)#2,083 |
| 10. | 89440 | 11.3% | 6.1%(+5.19)#10 | 4.9%(+6.37)#2,165 |
| 11. | 89061 | 11.1% | 6.1%(+4.96)#11 | 4.9%(+6.15)#2,283 |
| 12. | 89042 | 10.9% | 6.1%(+4.76)#12 | 4.9%(+5.95)#2,370 |
| 13. | 89424 | 10.5% | 6.1%(+4.39)#13 | 4.9%(+5.58)#2,575 |
| 14. | 89429 | 10.2% | 6.1%(+4.03)#14 | 4.9%(+5.22)#2,783 |
| 15. | 89822 | 10.0% | 6.1%(+3.85)#15 | 4.9%(+5.04)#2,909 |
| 16. | 89704 | 9.9% | 6.1%(+3.75)#16 | 4.9%(+4.94)#2,959 |
| 17. | 89439 | 9.3% | 6.1%(+3.15)#17 | 4.9%(+4.34)#3,411 |
| 18. | 89835 | 9.2% | 6.1%(+3.04)#18 | 4.9%(+4.23)#3,509 |
| 19. | 89434 | 9.1% | 6.1%(+3.00)#19 | 4.9%(+4.19)#3,548 |
| 20. | 89506 | 9.1% | 6.1%(+2.99)#20 | 4.9%(+4.18)#3,566 |
| 21. | 89086 | 9.0% | 6.1%(+2.88)#21 | 4.9%(+4.07)#3,678 |
| 22. | 89081 | 8.9% | 6.1%(+2.81)#22 | 4.9%(+4.00)#3,757 |
| 23. | 89103 | 8.9% | 6.1%(+2.80)#23 | 4.9%(+3.99)#3,775 |
| 24. | 89122 | 8.7% | 6.1%(+2.52)#24 | 4.9%(+3.71)#4,087 |
| 25. | 89834 | 8.3% | 6.1%(+2.20)#25 | 4.9%(+3.39)#4,477 |
| 26. | 89014 | 8.3% | 6.1%(+2.19)#26 | 4.9%(+3.37)#4,489 |
| 27. | 89408 | 8.3% | 6.1%(+2.18)#27 | 4.9%(+3.37)#4,504 |
| 28. | 89117 | 8.1% | 6.1%(+1.98)#28 | 4.9%(+3.16)#4,740 |
| 29. | 89019 | 8.0% | 6.1%(+1.88)#29 | 4.9%(+3.07)#4,872 |
| 30. | 89119 | 7.9% | 6.1%(+1.77)#30 | 4.9%(+2.95)#5,031 |
| 31. | 89183 | 7.8% | 6.1%(+1.69)#31 | 4.9%(+2.88)#5,143 |
| 32. | 89406 | 7.6% | 6.1%(+1.50)#32 | 4.9%(+2.69)#5,428 |
| 33. | 89512 | 7.6% | 6.1%(+1.49)#33 | 4.9%(+2.67)#5,458 |
| 34. | 89441 | 7.5% | 6.1%(+1.33)#34 | 4.9%(+2.52)#5,705 |
| 35. | 89032 | 7.5% | 6.1%(+1.32)#35 | 4.9%(+2.51)#5,727 |
| 36. | 89147 | 7.4% | 6.1%(+1.31)#36 | 4.9%(+2.50)#5,739 |
| 37. | 89436 | 7.4% | 6.1%(+1.30)#37 | 4.9%(+2.49)#5,769 |
| 38. | 89031 | 7.3% | 6.1%(+1.21)#38 | 4.9%(+2.40)#5,911 |
| 39. | 89012 | 7.3% | 6.1%(+1.18)#39 | 4.9%(+2.37)#5,985 |
| 40. | 89120 | 7.3% | 6.1%(+1.17)#40 | 4.9%(+2.36)#5,995 |
| 41. | 89508 | 7.3% | 6.1%(+1.15)#41 | 4.9%(+2.33)#6,032 |
| 42. | 89142 | 7.2% | 6.1%(+1.04)#42 | 4.9%(+2.23)#6,230 |
| 43. | 89011 | 7.1% | 6.1%(+1.00)#43 | 4.9%(+2.19)#6,298 |
| 44. | 89431 | 7.1% | 6.1%(+0.998)#44 | 4.9%(+2.19)#6,304 |
| 45. | 89139 | 7.1% | 6.1%(+0.967)#45 | 4.9%(+2.15)#6,351 |
| 46. | 89121 | 6.9% | 6.1%(+0.783)#46 | 4.9%(+1.97)#6,719 |
| 47. | 89413 | 6.9% | 6.1%(+0.744)#47 | 4.9%(+1.93)#6,795 |
| 48. | 89084 | 6.8% | 6.1%(+0.631)#48 | 4.9%(+1.82)#7,035 |
| 49. | 89104 | 6.7% | 6.1%(+0.603)#49 | 4.9%(+1.79)#7,081 |
| 50. | 89108 | 6.7% | 6.1%(+0.518)#50 | 4.9%(+1.71)#7,271 |
| 51. | 89130 | 6.5% | 6.1%(+0.357)#51 | 4.9%(+1.54)#7,588 |
| 52. | 89074 | 6.4% | 6.1%(+0.309)#52 | 4.9%(+1.50)#7,701 |
| 53. | 89115 | 6.4% | 6.1%(+0.303)#53 | 4.9%(+1.49)#7,716 |
| 54. | 89169 | 6.4% | 6.1%(+0.284)#54 | 4.9%(+1.47)#7,764 |
| 55. | 89113 | 6.3% | 6.1%(+0.186)#55 | 4.9%(+1.37)#7,999 |
| 56. | 89128 | 6.3% | 6.1%(+0.153)#56 | 4.9%(+1.34)#8,075 |
| 57. | 89820 | 6.2% | 6.1%(+0.025)#57 | 4.9%(+1.21)#8,383 |
| 58. | 89156 | 6.1% | 6.1%(-0.047)#58 | 4.9%(+1.14)#8,568 |
| 59. | 89052 | 6.0% | 6.1%(-0.164)#59 | 4.9%(+1.02)#8,868 |
| 60. | 89301 | 5.9% | 6.1%(-0.250)#60 | 4.9%(+0.938)#9,073 |
| 61. | 89502 | 5.9% | 6.1%(-0.250)#61 | 4.9%(+0.938)#9,074 |
| 62. | 89801 | 5.9% | 6.1%(-0.258)#62 | 4.9%(+0.930)#9,118 |
| 63. | 89123 | 5.9% | 6.1%(-0.264)#63 | 4.9%(+0.925)#9,134 |
| 64. | 89883 | 5.8% | 6.1%(-0.285)#64 | 4.9%(+0.903)#9,194 |
| 65. | 89107 | 5.8% | 6.1%(-0.336)#65 | 4.9%(+0.852)#9,344 |
| 66. | 89444 | 5.8% | 6.1%(-0.345)#66 | 4.9%(+0.844)#9,374 |
| 67. | 89131 | 5.8% | 6.1%(-0.382)#67 | 4.9%(+0.806)#9,494 |
| 68. | 89109 | 5.7% | 6.1%(-0.400)#68 | 4.9%(+0.788)#9,557 |
| 69. | 89015 | 5.6% | 6.1%(-0.552)#69 | 4.9%(+0.636)#10,008 |
| 70. | 89503 | 5.5% | 6.1%(-0.639)#70 | 4.9%(+0.549)#10,262 |
| 71. | 89129 | 5.5% | 6.1%(-0.650)#71 | 4.9%(+0.538)#10,297 |
| 72. | 89141 | 5.4% | 6.1%(-0.760)#72 | 4.9%(+0.428)#10,664 |
| 73. | 89451 | 5.4% | 6.1%(-0.772)#73 | 4.9%(+0.416)#10,706 |
| 74. | 89148 | 5.4% | 6.1%(-0.774)#74 | 4.9%(+0.414)#10,714 |
| 75. | 89179 | 5.4% | 6.1%(-0.775)#75 | 4.9%(+0.413)#10,720 |
| 76. | 89106 | 5.3% | 6.1%(-0.882)#76 | 4.9%(+0.306)#11,064 |
| 77. | 89134 | 5.2% | 6.1%(-0.890)#77 | 4.9%(+0.298)#11,084 |
| 78. | 89110 | 5.2% | 6.1%(-0.895)#78 | 4.9%(+0.293)#11,100 |
| 79. | 89060 | 5.2% | 6.1%(-0.967)#79 | 4.9%(+0.221)#11,367 |
| 80. | 89002 | 5.0% | 6.1%(-1.14)#80 | 4.9%(+0.048)#11,964 |
| 81. | 89145 | 4.9% | 6.1%(-1.22)#81 | 4.9%(-0.035)#12,238 |
| 82. | 89044 | 4.9% | 6.1%(-1.23)#82 | 4.9%(-0.043)#12,262 |
| 83. | 89040 | 4.9% | 6.1%(-1.26)#83 | 4.9%(-0.074)#12,372 |
| 84. | 89101 | 4.9% | 6.1%(-1.27)#84 | 4.9%(-0.078)#12,386 |
| 85. | 89102 | 4.9% | 6.1%(-1.27)#85 | 4.9%(-0.079)#12,392 |
| 86. | 89030 | 4.9% | 6.1%(-1.28)#86 | 4.9%(-0.094)#12,437 |
| 87. | 89034 | 4.8% | 6.1%(-1.34)#87 | 4.9%(-0.148)#12,653 |
| 88. | 89427 | 4.7% | 6.1%(-1.40)#88 | 4.9%(-0.211)#12,889 |
| 89. | 89509 | 4.7% | 6.1%(-1.46)#89 | 4.9%(-0.271)#13,121 |
| 90. | 89149 | 4.7% | 6.1%(-1.46)#90 | 4.9%(-0.275)#13,134 |
| 91. | 89511 | 4.7% | 6.1%(-1.47)#91 | 4.9%(-0.277)#13,141 |
| 92. | 89178 | 4.6% | 6.1%(-1.54)#92 | 4.9%(-0.353)#13,430 |
| 93. | 89501 | 4.6% | 6.1%(-1.55)#93 | 4.9%(-0.365)#13,471 |
| 94. | 89521 | 4.5% | 6.1%(-1.60)#94 | 4.9%(-0.411)#13,679 |
| 95. | 89146 | 4.4% | 6.1%(-1.71)#95 | 4.9%(-0.518)#14,042 |
| 96. | 89005 | 4.4% | 6.1%(-1.73)#96 | 4.9%(-0.545)#14,162 |
| 97. | 89143 | 4.3% | 6.1%(-1.80)#97 | 4.9%(-0.607)#14,439 |
| 98. | 89144 | 4.3% | 6.1%(-1.87)#98 | 4.9%(-0.685)#14,758 |
| 99. | 89048 | 4.2% | 6.1%(-1.98)#99 | 4.9%(-0.796)#15,249 |
| 100. | 89135 | 3.8% | 6.1%(-2.28)#100 | 4.9%(-1.10)#16,567 |
1
2Common Questions
What are the Top 10 Zip Codes with the Highest Percentage of Population Employed in Transportation & Warehousing in Nevada?
Top 10 Zip Codes with the Highest Percentage of Population Employed in Transportation & Warehousing in Nevada are:
What zip code has the Highest Percentage of Population Employed in Transportation & Warehousing in Nevada?
89420 has the Highest Percentage of Population Employed in Transportation & Warehousing in Nevada with 73.0%.
What is the Percentage of Population Employed in Transportation & Warehousing in the State of Nevada?
Percentage of Population Employed in Transportation & Warehousing in Nevada is 6.1%.
What is the Percentage of Population Employed in Transportation & Warehousing in the United States?
Percentage of Population Employed in Transportation & Warehousing in the United States is 4.9%.