Cities with the Highest Percentage of Population Employed in Transportation & Warehousing in New Mexico
RELATED REPORTS & OPTIONS
Transportation & Warehousing
New Mexico
Compare Cities
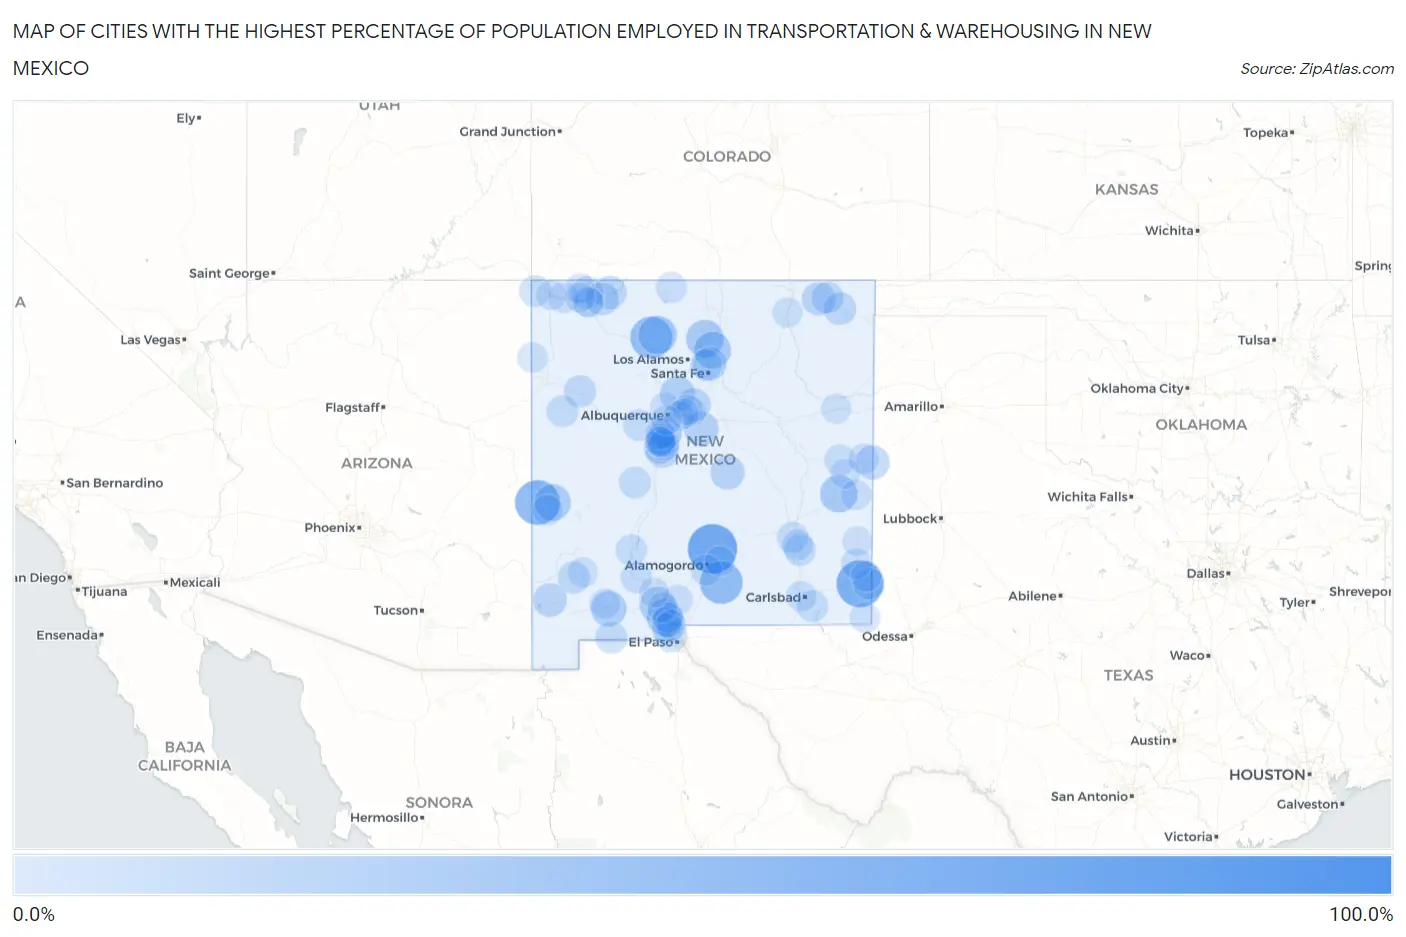
Map of Cities with the Highest Percentage of Population Employed in Transportation & Warehousing in New Mexico
0.0%
100.0%
Cities with the Highest Percentage of Population Employed in Transportation & Warehousing in New Mexico
| City | % Employed | vs State | vs National | |
| 1. | Candy Kitchen | 100.0% | 3.6%(+96.4)#1 | 4.9%(+95.1)#13 |
| 2. | Bent | 72.0% | 3.6%(+68.5)#2 | 4.9%(+67.1)#46 |
| 3. | Monument | 62.9% | 3.6%(+59.3)#3 | 4.9%(+58.0)#62 |
| 4. | Luna | 55.6% | 3.6%(+52.0)#4 | 4.9%(+50.6)#88 |
| 5. | Timberon | 48.1% | 3.6%(+44.6)#5 | 4.9%(+43.2)#137 |
| 6. | Regina | 45.0% | 3.6%(+41.4)#6 | 4.9%(+40.1)#162 |
| 7. | Gallina | 32.6% | 3.6%(+29.0)#7 | 4.9%(+27.7)#320 |
| 8. | Canova | 30.7% | 3.6%(+27.2)#8 | 4.9%(+25.8)#352 |
| 9. | Elida | 29.5% | 3.6%(+25.9)#9 | 4.9%(+24.6)#379 |
| 10. | Cordova | 27.8% | 3.6%(+24.3)#10 | 4.9%(+22.9)#432 |
| 11. | Cruzville | 27.0% | 3.6%(+23.4)#11 | 4.9%(+22.0)#460 |
| 12. | La Mesa | 26.7% | 3.6%(+23.1)#12 | 4.9%(+21.7)#470 |
| 13. | Fairacres | 25.5% | 3.6%(+21.9)#13 | 4.9%(+20.5)#517 |
| 14. | Ventura | 23.8% | 3.6%(+20.2)#14 | 4.9%(+18.8)#597 |
| 15. | Algodones | 21.9% | 3.6%(+18.3)#15 | 4.9%(+16.9)#699 |
| 16. | Mcintosh | 19.9% | 3.6%(+16.3)#16 | 4.9%(+14.9)#843 |
| 17. | Corona | 18.5% | 3.6%(+14.9)#17 | 4.9%(+13.6)#956 |
| 18. | Texico | 18.4% | 3.6%(+14.8)#18 | 4.9%(+13.4)#972 |
| 19. | Prewitt | 17.5% | 3.6%(+13.9)#19 | 4.9%(+12.6)#1,093 |
| 20. | San Pedro | 17.3% | 3.6%(+13.7)#20 | 4.9%(+12.4)#1,114 |
| 21. | Totah Vista | 17.1% | 3.6%(+13.5)#21 | 4.9%(+12.2)#1,144 |
| 22. | Chupadero | 16.9% | 3.6%(+13.4)#22 | 4.9%(+12.0)#1,171 |
| 23. | Glen Acres | 16.9% | 3.6%(+13.3)#23 | 4.9%(+12.0)#1,183 |
| 24. | Capulin | 16.7% | 3.6%(+13.1)#24 | 4.9%(+11.7)#1,230 |
| 25. | Navajo Dam | 15.8% | 3.6%(+12.2)#25 | 4.9%(+10.9)#1,361 |
| 26. | Casa Colorada | 15.8% | 3.6%(+12.2)#26 | 4.9%(+10.8)#1,368 |
| 27. | Bluewater | 15.5% | 3.6%(+11.9)#27 | 4.9%(+10.5)#1,434 |
| 28. | Blanco | 14.8% | 3.6%(+11.2)#28 | 4.9%(+9.85)#1,590 |
| 29. | Pueblitos | 14.0% | 3.6%(+10.4)#29 | 4.9%(+9.02)#1,802 |
| 30. | Grenville | 13.8% | 3.6%(+10.2)#30 | 4.9%(+8.85)#1,854 |
| 31. | Thoreau | 12.5% | 3.6%(+8.92)#31 | 4.9%(+7.55)#2,237 |
| 32. | Des Moines | 12.5% | 3.6%(+8.92)#32 | 4.9%(+7.55)#2,263 |
| 33. | Tyrone | 12.1% | 3.6%(+8.48)#33 | 4.9%(+7.12)#2,441 |
| 34. | San Antonito Cdp Bernalillo County | 11.7% | 3.6%(+8.11)#34 | 4.9%(+6.74)#2,602 |
| 35. | Torreon Cdp Sandoval County | 11.7% | 3.6%(+8.11)#35 | 4.9%(+6.74)#2,603 |
| 36. | Spencerville | 11.6% | 3.6%(+7.99)#36 | 4.9%(+6.62)#2,653 |
| 37. | Ramah | 11.4% | 3.6%(+7.77)#37 | 4.9%(+6.41)#2,772 |
| 38. | Valencia | 11.1% | 3.6%(+7.51)#38 | 4.9%(+6.14)#2,920 |
| 39. | Columbus | 11.0% | 3.6%(+7.42)#39 | 4.9%(+6.06)#2,945 |
| 40. | Magdalena | 10.8% | 3.6%(+7.21)#40 | 4.9%(+5.85)#3,055 |
| 41. | Tesuque Pueblo | 10.8% | 3.6%(+7.20)#41 | 4.9%(+5.83)#3,069 |
| 42. | Sunland Park | 10.7% | 3.6%(+7.14)#42 | 4.9%(+5.78)#3,092 |
| 43. | Hagerman | 10.3% | 3.6%(+6.72)#43 | 4.9%(+5.36)#3,350 |
| 44. | Loving | 10.1% | 3.6%(+6.48)#44 | 4.9%(+5.12)#3,502 |
| 45. | Adelino | 9.9% | 3.6%(+6.37)#45 | 4.9%(+5.00)#3,579 |
| 46. | Williamsburg | 9.8% | 3.6%(+6.22)#46 | 4.9%(+4.86)#3,677 |
| 47. | Beclabito | 9.8% | 3.6%(+6.20)#47 | 4.9%(+4.84)#3,697 |
| 48. | Berino | 9.6% | 3.6%(+6.00)#48 | 4.9%(+4.63)#3,849 |
| 49. | Highland Meadows | 9.5% | 3.6%(+5.88)#49 | 4.9%(+4.51)#3,947 |
| 50. | Midway | 9.2% | 3.6%(+5.66)#50 | 4.9%(+4.29)#4,099 |
| 51. | Nadine | 9.2% | 3.6%(+5.62)#51 | 4.9%(+4.26)#4,127 |
| 52. | Salem | 8.9% | 3.6%(+5.33)#52 | 4.9%(+3.96)#4,394 |
| 53. | La Union | 8.7% | 3.6%(+5.14)#53 | 4.9%(+3.78)#4,571 |
| 54. | Dexter | 8.7% | 3.6%(+5.08)#54 | 4.9%(+3.72)#4,639 |
| 55. | Peralta | 8.7% | 3.6%(+5.08)#55 | 4.9%(+3.72)#4,642 |
| 56. | Boles Acres | 8.5% | 3.6%(+4.93)#56 | 4.9%(+3.56)#4,789 |
| 57. | Melrose | 8.2% | 3.6%(+4.64)#57 | 4.9%(+3.27)#5,114 |
| 58. | Los Chaves | 8.1% | 3.6%(+4.53)#58 | 4.9%(+3.16)#5,222 |
| 59. | Chama | 7.9% | 3.6%(+4.30)#59 | 4.9%(+2.93)#5,525 |
| 60. | Rio Communities | 7.5% | 3.6%(+3.96)#60 | 4.9%(+2.59)#5,968 |
| 61. | Lovington | 7.1% | 3.6%(+3.56)#61 | 4.9%(+2.19)#6,589 |
| 62. | Lee Acres | 7.1% | 3.6%(+3.53)#62 | 4.9%(+2.16)#6,622 |
| 63. | Waterflow | 6.9% | 3.6%(+3.32)#63 | 4.9%(+1.95)#6,975 |
| 64. | Butterfield Park | 6.8% | 3.6%(+3.24)#64 | 4.9%(+1.87)#7,115 |
| 65. | Happy Valley | 6.7% | 3.6%(+3.12)#65 | 4.9%(+1.75)#7,316 |
| 66. | Hobbs | 6.7% | 3.6%(+3.10)#66 | 4.9%(+1.73)#7,347 |
| 67. | White Sands | 6.6% | 3.6%(+3.05)#67 | 4.9%(+1.68)#7,453 |
| 68. | Los Lunas | 6.6% | 3.6%(+2.99)#68 | 4.9%(+1.62)#7,534 |
| 69. | Keeler Farm | 6.6% | 3.6%(+2.99)#69 | 4.9%(+1.62)#7,547 |
| 70. | La Plata | 6.5% | 3.6%(+2.94)#70 | 4.9%(+1.57)#7,659 |
| 71. | Clovis | 6.3% | 3.6%(+2.70)#71 | 4.9%(+1.33)#8,123 |
| 72. | Paradise Hills | 6.1% | 3.6%(+2.54)#72 | 4.9%(+1.18)#8,400 |
| 73. | Carnuel | 6.1% | 3.6%(+2.53)#73 | 4.9%(+1.17)#8,432 |
| 74. | Barton | 6.0% | 3.6%(+2.43)#74 | 4.9%(+1.06)#8,658 |
| 75. | Jal | 6.0% | 3.6%(+2.41)#75 | 4.9%(+1.05)#8,694 |
| 76. | Santa Clara | 6.0% | 3.6%(+2.39)#76 | 4.9%(+1.03)#8,725 |
| 77. | Chamberino | 6.0% | 3.6%(+2.38)#77 | 4.9%(+1.01)#8,746 |
| 78. | University Park | 6.0% | 3.6%(+2.37)#78 | 4.9%(+1.01)#8,760 |
| 79. | Maxwell | 5.9% | 3.6%(+2.30)#79 | 4.9%(+0.936)#8,912 |
| 80. | Navajo | 5.8% | 3.6%(+2.24)#80 | 4.9%(+0.873)#9,056 |
| 81. | Sausal | 5.8% | 3.6%(+2.21)#81 | 4.9%(+0.843)#9,106 |
| 82. | Vado | 5.8% | 3.6%(+2.20)#82 | 4.9%(+0.832)#9,123 |
| 83. | Dora | 5.7% | 3.6%(+2.13)#83 | 4.9%(+0.768)#9,281 |
| 84. | West Hammond | 5.6% | 3.6%(+2.03)#84 | 4.9%(+0.665)#9,523 |
| 85. | Belen | 5.6% | 3.6%(+2.03)#85 | 4.9%(+0.662)#9,530 |
| 86. | Lindrith | 5.6% | 3.6%(+2.03)#86 | 4.9%(+0.661)#9,535 |
| 87. | Shiprock | 5.6% | 3.6%(+2.02)#87 | 4.9%(+0.655)#9,545 |
| 88. | Reserve | 5.6% | 3.6%(+1.98)#88 | 4.9%(+0.609)#9,663 |
| 89. | Cloudcroft | 5.4% | 3.6%(+1.87)#89 | 4.9%(+0.501)#9,936 |
| 90. | Farmington | 5.4% | 3.6%(+1.86)#90 | 4.9%(+0.495)#9,952 |
| 91. | Tucumcari | 5.4% | 3.6%(+1.80)#91 | 4.9%(+0.433)#10,073 |
| 92. | Edgewood | 5.3% | 3.6%(+1.67)#92 | 4.9%(+0.309)#10,384 |
| 93. | Sandia Knolls | 5.2% | 3.6%(+1.66)#93 | 4.9%(+0.289)#10,424 |
| 94. | Anthony | 5.2% | 3.6%(+1.60)#94 | 4.9%(+0.235)#10,555 |
| 95. | Pena Blanca | 5.1% | 3.6%(+1.51)#95 | 4.9%(+0.148)#10,803 |
| 96. | South Valley | 5.0% | 3.6%(+1.42)#96 | 4.9%(+0.053)#11,088 |
| 97. | Tatum | 4.9% | 3.6%(+1.30)#97 | 4.9%(-0.062)#11,365 |
| 98. | Radium Springs | 4.8% | 3.6%(+1.27)#98 | 4.9%(-0.099)#11,466 |
| 99. | Floyd | 4.8% | 3.6%(+1.18)#99 | 4.9%(-0.184)#11,695 |
| 100. | Cedar Crest | 4.7% | 3.6%(+1.16)#100 | 4.9%(-0.207)#11,759 |
Common Questions
What are the Top 10 Cities with the Highest Percentage of Population Employed in Transportation & Warehousing in New Mexico?
Top 10 Cities with the Highest Percentage of Population Employed in Transportation & Warehousing in New Mexico are:
What city has the Highest Percentage of Population Employed in Transportation & Warehousing in New Mexico?
Bent has the Highest Percentage of Population Employed in Transportation & Warehousing in New Mexico with 72.0%.
What is the Percentage of Population Employed in Transportation & Warehousing in the State of New Mexico?
Percentage of Population Employed in Transportation & Warehousing in New Mexico is 3.6%.
What is the Percentage of Population Employed in Transportation & Warehousing in the United States?
Percentage of Population Employed in Transportation & Warehousing in the United States is 4.9%.