Zip Codes with the Highest Percentage of Population Employed in Construction & Extraction in New Jersey
RELATED REPORTS & OPTIONS
Construction & Extraction
New Jersey
Compare Zip Codes
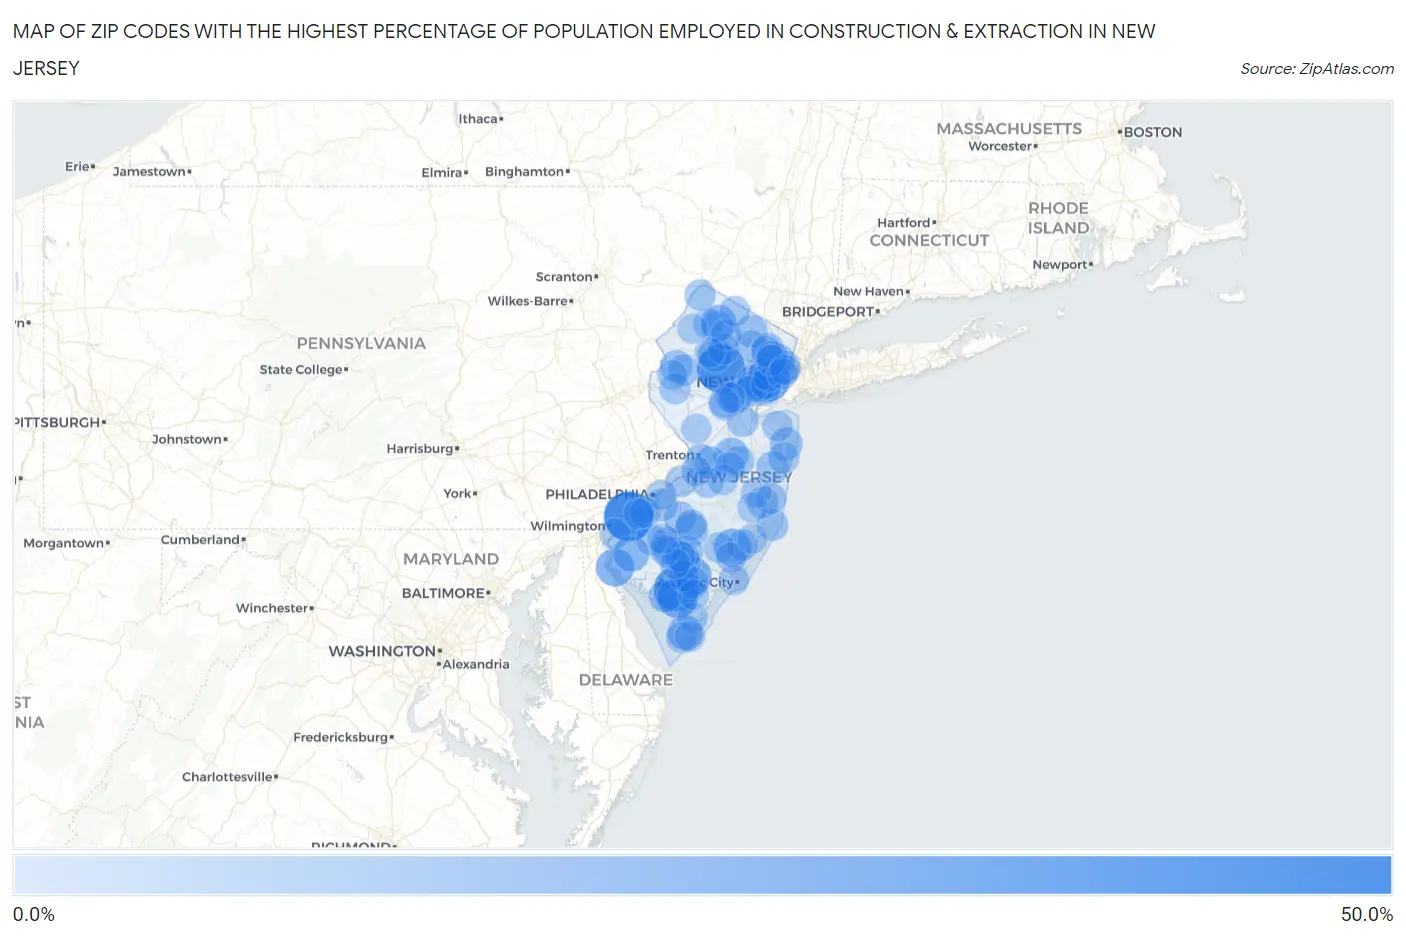
Map of Zip Codes with the Highest Percentage of Population Employed in Construction & Extraction in New Jersey
0.0%
50.0%
Zip Codes with the Highest Percentage of Population Employed in Construction & Extraction in New Jersey
| Zip Code | % Employed | vs State | vs National | |
| 1. | 08014 | 40.7% | 4.4%(+36.3)#1 | 5.0%(+35.7)#202 |
| 2. | 07926 | 38.5% | 4.4%(+34.1)#2 | 5.0%(+33.5)#237 |
| 3. | 08348 | 32.3% | 4.4%(+27.9)#3 | 5.0%(+27.3)#350 |
| 4. | 07105 | 28.5% | 4.4%(+24.1)#4 | 5.0%(+23.5)#445 |
| 5. | 08327 | 25.1% | 4.4%(+20.8)#5 | 5.0%(+20.1)#584 |
| 6. | 08317 | 21.0% | 4.4%(+16.7)#6 | 5.0%(+16.0)#888 |
| 7. | 08038 | 20.2% | 4.4%(+15.8)#7 | 5.0%(+15.2)#976 |
| 8. | 08224 | 19.4% | 4.4%(+15.1)#8 | 5.0%(+14.4)#1,076 |
| 9. | 08001 | 16.8% | 4.4%(+12.5)#9 | 5.0%(+11.8)#1,503 |
| 10. | 07416 | 15.7% | 4.4%(+11.3)#10 | 5.0%(+10.7)#1,802 |
| 11. | 08242 | 15.0% | 4.4%(+10.7)#11 | 5.0%(+10.0)#2,012 |
| 12. | 08555 | 14.4% | 4.4%(+10.0)#12 | 5.0%(+9.39)#2,285 |
| 13. | 07847 | 13.7% | 4.4%(+9.35)#13 | 5.0%(+8.71)#2,595 |
| 14. | 08089 | 13.2% | 4.4%(+8.85)#14 | 5.0%(+8.21)#2,835 |
| 15. | 07740 | 11.4% | 4.4%(+7.09)#15 | 5.0%(+6.45)#4,003 |
| 16. | 08322 | 11.4% | 4.4%(+7.03)#16 | 5.0%(+6.39)#4,041 |
| 17. | 08720 | 11.3% | 4.4%(+6.93)#17 | 5.0%(+6.29)#4,124 |
| 18. | 08059 | 11.2% | 4.4%(+6.88)#18 | 5.0%(+6.24)#4,166 |
| 19. | 07057 | 11.2% | 4.4%(+6.84)#19 | 5.0%(+6.20)#4,198 |
| 20. | 08349 | 11.1% | 4.4%(+6.77)#20 | 5.0%(+6.13)#4,259 |
| 21. | 07465 | 11.1% | 4.4%(+6.72)#21 | 5.0%(+6.08)#4,313 |
| 22. | 08310 | 10.9% | 4.4%(+6.56)#22 | 5.0%(+5.92)#4,442 |
| 23. | 07863 | 10.7% | 4.4%(+6.38)#23 | 5.0%(+5.74)#4,612 |
| 24. | 08344 | 10.6% | 4.4%(+6.29)#24 | 5.0%(+5.65)#4,714 |
| 25. | 08620 | 10.6% | 4.4%(+6.22)#25 | 5.0%(+5.57)#4,786 |
| 26. | 07608 | 10.5% | 4.4%(+6.17)#26 | 5.0%(+5.53)#4,836 |
| 27. | 07063 | 10.5% | 4.4%(+6.14)#27 | 5.0%(+5.50)#4,860 |
| 28. | 08091 | 10.5% | 4.4%(+6.13)#28 | 5.0%(+5.49)#4,871 |
| 29. | 07206 | 10.4% | 4.4%(+6.05)#29 | 5.0%(+5.41)#4,960 |
| 30. | 07201 | 10.3% | 4.4%(+5.91)#30 | 5.0%(+5.27)#5,123 |
| 31. | 08611 | 10.1% | 4.4%(+5.78)#31 | 5.0%(+5.14)#5,244 |
| 32. | 07440 | 10.1% | 4.4%(+5.74)#32 | 5.0%(+5.10)#5,280 |
| 33. | 08319 | 10.1% | 4.4%(+5.74)#33 | 5.0%(+5.10)#5,290 |
| 34. | 07439 | 10.0% | 4.4%(+5.67)#34 | 5.0%(+5.03)#5,373 |
| 35. | 07524 | 9.9% | 4.4%(+5.52)#35 | 5.0%(+4.88)#5,562 |
| 36. | 07060 | 9.8% | 4.4%(+5.41)#36 | 5.0%(+4.77)#5,699 |
| 37. | 08006 | 9.5% | 4.4%(+5.17)#37 | 5.0%(+4.53)#6,006 |
| 38. | 07050 | 9.5% | 4.4%(+5.14)#38 | 5.0%(+4.50)#6,048 |
| 39. | 07865 | 9.4% | 4.4%(+5.06)#39 | 5.0%(+4.42)#6,151 |
| 40. | 08350 | 9.4% | 4.4%(+5.06)#40 | 5.0%(+4.42)#6,154 |
| 41. | 08721 | 9.4% | 4.4%(+5.02)#41 | 5.0%(+4.37)#6,212 |
| 42. | 08010 | 9.4% | 4.4%(+5.01)#42 | 5.0%(+4.37)#6,221 |
| 43. | 08882 | 9.2% | 4.4%(+4.89)#43 | 5.0%(+4.25)#6,380 |
| 44. | 07848 | 9.2% | 4.4%(+4.81)#44 | 5.0%(+4.17)#6,497 |
| 45. | 07088 | 9.1% | 4.4%(+4.76)#45 | 5.0%(+4.12)#6,585 |
| 46. | 07720 | 9.1% | 4.4%(+4.74)#46 | 5.0%(+4.10)#6,606 |
| 47. | 08346 | 9.1% | 4.4%(+4.70)#47 | 5.0%(+4.06)#6,681 |
| 48. | 08510 | 9.0% | 4.4%(+4.70)#48 | 5.0%(+4.06)#6,687 |
| 49. | 07801 | 9.0% | 4.4%(+4.69)#49 | 5.0%(+4.05)#6,688 |
| 50. | 08343 | 9.0% | 4.4%(+4.68)#50 | 5.0%(+4.04)#6,714 |
| 51. | 07022 | 9.0% | 4.4%(+4.63)#51 | 5.0%(+3.99)#6,795 |
| 52. | 07208 | 8.8% | 4.4%(+4.46)#52 | 5.0%(+3.82)#7,069 |
| 53. | 08004 | 8.8% | 4.4%(+4.44)#53 | 5.0%(+3.79)#7,109 |
| 54. | 07827 | 8.7% | 4.4%(+4.36)#54 | 5.0%(+3.72)#7,219 |
| 55. | 07033 | 8.6% | 4.4%(+4.29)#55 | 5.0%(+3.65)#7,342 |
| 56. | 07438 | 8.5% | 4.4%(+4.15)#56 | 5.0%(+3.51)#7,579 |
| 57. | 08087 | 8.5% | 4.4%(+4.13)#57 | 5.0%(+3.48)#7,619 |
| 58. | 07107 | 8.4% | 4.4%(+4.05)#58 | 5.0%(+3.41)#7,747 |
| 59. | 08827 | 8.3% | 4.4%(+3.98)#59 | 5.0%(+3.33)#7,887 |
| 60. | 08041 | 8.3% | 4.4%(+3.95)#60 | 5.0%(+3.30)#7,926 |
| 61. | 08066 | 8.3% | 4.4%(+3.91)#61 | 5.0%(+3.27)#7,986 |
| 62. | 08023 | 8.2% | 4.4%(+3.88)#62 | 5.0%(+3.24)#8,044 |
| 63. | 07027 | 8.2% | 4.4%(+3.86)#63 | 5.0%(+3.22)#8,075 |
| 64. | 07026 | 8.2% | 4.4%(+3.82)#64 | 5.0%(+3.18)#8,145 |
| 65. | 07114 | 8.2% | 4.4%(+3.81)#65 | 5.0%(+3.16)#8,175 |
| 66. | 07029 | 8.0% | 4.4%(+3.62)#66 | 5.0%(+2.98)#8,543 |
| 67. | 07505 | 8.0% | 4.4%(+3.61)#67 | 5.0%(+2.97)#8,575 |
| 68. | 08340 | 8.0% | 4.4%(+3.60)#68 | 5.0%(+2.96)#8,597 |
| 69. | 07422 | 7.9% | 4.4%(+3.51)#69 | 5.0%(+2.87)#8,748 |
| 70. | 08215 | 7.8% | 4.4%(+3.48)#70 | 5.0%(+2.83)#8,824 |
| 71. | 08880 | 7.8% | 4.4%(+3.44)#71 | 5.0%(+2.79)#8,905 |
| 72. | 08511 | 7.8% | 4.4%(+3.40)#72 | 5.0%(+2.76)#8,975 |
| 73. | 08241 | 7.7% | 4.4%(+3.39)#73 | 5.0%(+2.75)#9,007 |
| 74. | 08514 | 7.7% | 4.4%(+3.37)#74 | 5.0%(+2.73)#9,034 |
| 75. | 08105 | 7.7% | 4.4%(+3.37)#75 | 5.0%(+2.73)#9,037 |
| 76. | 08204 | 7.7% | 4.4%(+3.37)#76 | 5.0%(+2.73)#9,042 |
| 77. | 08210 | 7.7% | 4.4%(+3.33)#77 | 5.0%(+2.69)#9,128 |
| 78. | 08027 | 7.7% | 4.4%(+3.31)#78 | 5.0%(+2.67)#9,172 |
| 79. | 07737 | 7.7% | 4.4%(+3.30)#79 | 5.0%(+2.66)#9,186 |
| 80. | 08740 | 7.6% | 4.4%(+3.27)#80 | 5.0%(+2.63)#9,263 |
| 81. | 07055 | 7.6% | 4.4%(+3.25)#81 | 5.0%(+2.61)#9,312 |
| 82. | 08326 | 7.6% | 4.4%(+3.23)#82 | 5.0%(+2.59)#9,360 |
| 83. | 08260 | 7.5% | 4.4%(+3.20)#83 | 5.0%(+2.55)#9,427 |
| 84. | 08757 | 7.5% | 4.4%(+3.20)#84 | 5.0%(+2.55)#9,429 |
| 85. | 08328 | 7.5% | 4.4%(+3.19)#85 | 5.0%(+2.55)#9,445 |
| 86. | 08731 | 7.5% | 4.4%(+3.19)#86 | 5.0%(+2.55)#9,448 |
| 87. | 07087 | 7.5% | 4.4%(+3.18)#87 | 5.0%(+2.54)#9,460 |
| 88. | 08805 | 7.5% | 4.4%(+3.17)#88 | 5.0%(+2.53)#9,481 |
| 89. | 08812 | 7.5% | 4.4%(+3.13)#89 | 5.0%(+2.49)#9,580 |
| 90. | 08554 | 7.4% | 4.4%(+3.05)#90 | 5.0%(+2.41)#9,760 |
| 91. | 07093 | 7.4% | 4.4%(+3.02)#91 | 5.0%(+2.38)#9,810 |
| 92. | 08401 | 7.3% | 4.4%(+2.99)#92 | 5.0%(+2.35)#9,883 |
| 93. | 08270 | 7.3% | 4.4%(+2.99)#93 | 5.0%(+2.35)#9,891 |
| 94. | 08360 | 7.3% | 4.4%(+2.95)#94 | 5.0%(+2.31)#9,981 |
| 95. | 08312 | 7.3% | 4.4%(+2.91)#95 | 5.0%(+2.27)#10,067 |
| 96. | 08092 | 7.2% | 4.4%(+2.87)#96 | 5.0%(+2.23)#10,202 |
| 97. | 07882 | 7.1% | 4.4%(+2.78)#97 | 5.0%(+2.14)#10,403 |
| 98. | 08525 | 7.0% | 4.4%(+2.61)#98 | 5.0%(+1.96)#10,832 |
| 99. | 07860 | 6.9% | 4.4%(+2.58)#99 | 5.0%(+1.94)#10,920 |
| 100. | 07850 | 6.9% | 4.4%(+2.53)#100 | 5.0%(+1.89)#11,026 |
Common Questions
What are the Top 10 Zip Codes with the Highest Percentage of Population Employed in Construction & Extraction in New Jersey?
Top 10 Zip Codes with the Highest Percentage of Population Employed in Construction & Extraction in New Jersey are:
What zip code has the Highest Percentage of Population Employed in Construction & Extraction in New Jersey?
08014 has the Highest Percentage of Population Employed in Construction & Extraction in New Jersey with 40.7%.
What is the Percentage of Population Employed in Construction & Extraction in the State of New Jersey?
Percentage of Population Employed in Construction & Extraction in New Jersey is 4.4%.
What is the Percentage of Population Employed in Construction & Extraction in the United States?
Percentage of Population Employed in Construction & Extraction in the United States is 5.0%.