Cities with the Highest Percentage of Population Employed in Information in New Jersey
RELATED REPORTS & OPTIONS
Information & Technology
New Jersey
Compare Cities
Map of Cities with the Highest Percentage of Population Employed in Information in New Jersey
0.0%
40.0%
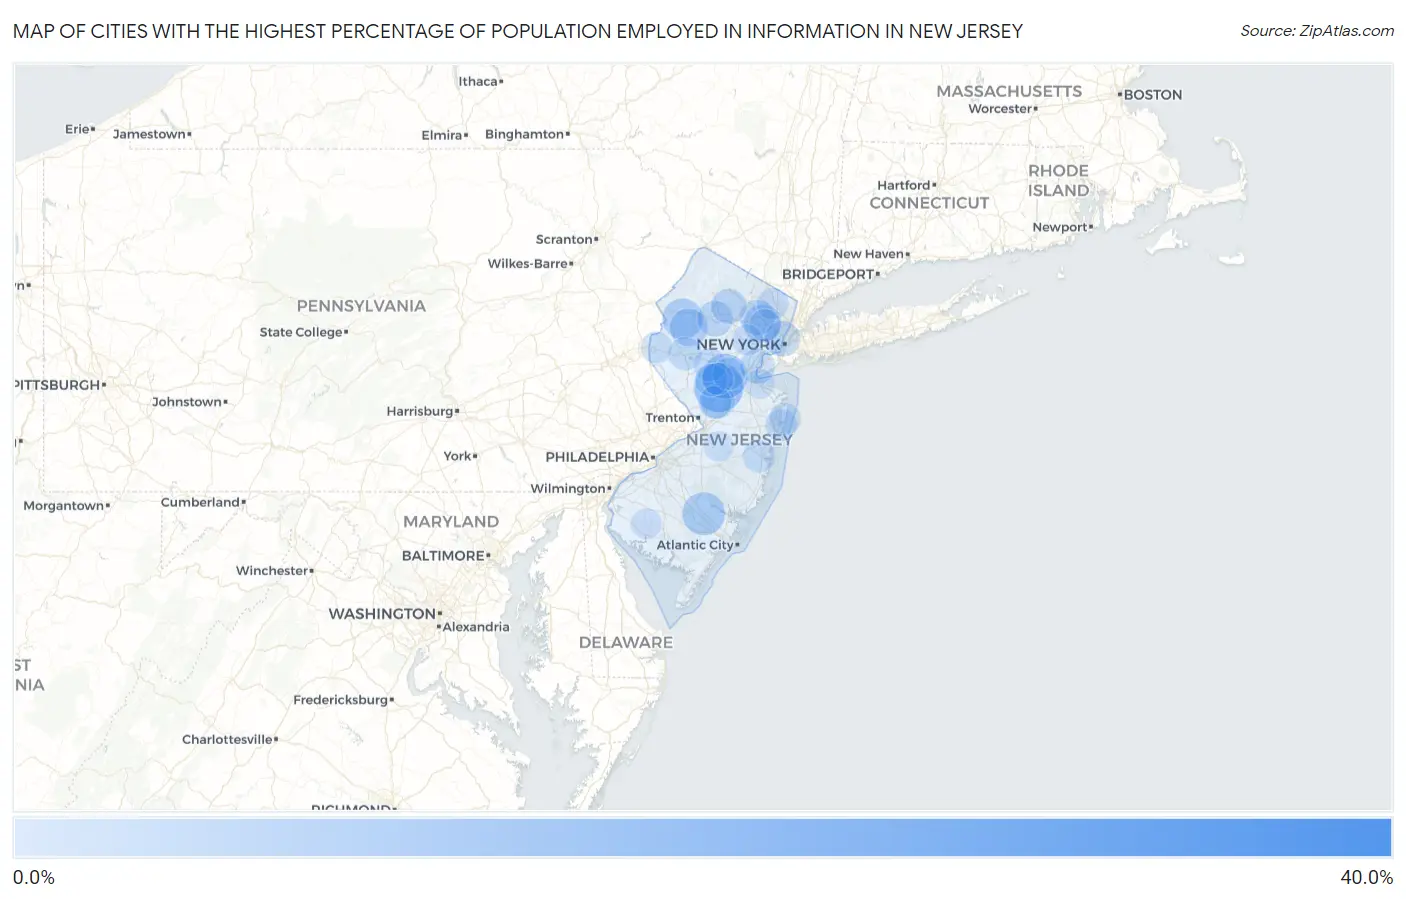
Cities with the Highest Percentage of Population Employed in Information in New Jersey
| City | % Employed | vs State | vs National | |
| 1. | Laurel Heights | 34.6% | 2.6%(+32.0)#1 | 1.9%(+32.7)#47 |
| 2. | Oceanville | 29.4% | 2.6%(+26.9)#2 | 1.9%(+27.5)#55 |
| 3. | Pottersville | 29.4% | 2.6%(+26.8)#3 | 1.9%(+27.5)#56 |
| 4. | Three Bridges | 18.0% | 2.6%(+15.4)#4 | 1.9%(+16.1)#133 |
| 5. | Green | 17.4% | 2.6%(+14.8)#5 | 1.9%(+15.5)#145 |
| 6. | Ten Mile Run | 15.4% | 2.6%(+12.8)#6 | 1.9%(+13.5)#178 |
| 7. | Oldwick | 14.2% | 2.6%(+11.7)#7 | 1.9%(+12.3)#216 |
| 8. | Branchville Borough | 13.5% | 2.6%(+11.0)#8 | 1.9%(+11.6)#233 |
| 9. | Goshen | 13.1% | 2.6%(+10.5)#9 | 1.9%(+11.2)#249 |
| 10. | Middlebush | 12.8% | 2.6%(+10.3)#10 | 1.9%(+10.9)#257 |
| 11. | Elwood | 11.6% | 2.6%(+9.06)#11 | 1.9%(+9.72)#308 |
| 12. | Great Meadows | 10.3% | 2.6%(+7.76)#12 | 1.9%(+8.42)#366 |
| 13. | Tavistock Borough | 10.0% | 2.6%(+7.44)#13 | 1.9%(+8.10)#399 |
| 14. | Glen Ridge Borough | 9.2% | 2.6%(+6.67)#14 | 1.9%(+7.33)#458 |
| 15. | Upper Montclair | 8.9% | 2.6%(+6.36)#15 | 1.9%(+7.02)#488 |
| 16. | Beattystown | 8.7% | 2.6%(+6.15)#16 | 1.9%(+6.81)#510 |
| 17. | Basking Ridge | 7.8% | 2.6%(+5.25)#17 | 1.9%(+5.91)#604 |
| 18. | Kenvil | 7.6% | 2.6%(+5.03)#18 | 1.9%(+5.69)#639 |
| 19. | Flagtown | 7.6% | 2.6%(+5.01)#19 | 1.9%(+5.67)#644 |
| 20. | Singac | 7.5% | 2.6%(+4.90)#20 | 1.9%(+5.56)#665 |
| 21. | Shrewsbury Borough | 7.4% | 2.6%(+4.86)#21 | 1.9%(+5.52)#676 |
| 22. | Hoboken | 7.4% | 2.6%(+4.83)#22 | 1.9%(+5.49)#686 |
| 23. | Lake Telemark | 7.2% | 2.6%(+4.64)#23 | 1.9%(+5.30)#722 |
| 24. | The Hills | 7.1% | 2.6%(+4.59)#24 | 1.9%(+5.25)#728 |
| 25. | Port Reading | 7.1% | 2.6%(+4.54)#25 | 1.9%(+5.20)#746 |
| 26. | Watsessing | 7.0% | 2.6%(+4.48)#26 | 1.9%(+5.14)#763 |
| 27. | Oradell Borough | 6.9% | 2.6%(+4.34)#27 | 1.9%(+5.00)#797 |
| 28. | Plainsboro Center | 6.8% | 2.6%(+4.25)#28 | 1.9%(+4.91)#812 |
| 29. | Sweetwater | 6.8% | 2.6%(+4.24)#29 | 1.9%(+4.90)#815 |
| 30. | Ledgewood | 6.6% | 2.6%(+4.06)#30 | 1.9%(+4.72)#857 |
| 31. | Maywood Borough | 6.6% | 2.6%(+4.02)#31 | 1.9%(+4.68)#865 |
| 32. | Norwood Borough | 6.5% | 2.6%(+3.98)#32 | 1.9%(+4.64)#875 |
| 33. | Park Ridge Borough | 6.4% | 2.6%(+3.82)#33 | 1.9%(+4.48)#908 |
| 34. | Regency At Monroe | 6.3% | 2.6%(+3.70)#34 | 1.9%(+4.36)#944 |
| 35. | Ocean Gate Borough | 6.2% | 2.6%(+3.69)#35 | 1.9%(+4.35)#947 |
| 36. | Annandale | 6.2% | 2.6%(+3.68)#36 | 1.9%(+4.34)#956 |
| 37. | Haddonfield Borough | 6.1% | 2.6%(+3.58)#37 | 1.9%(+4.24)#981 |
| 38. | Seaside Heights Borough | 6.1% | 2.6%(+3.49)#38 | 1.9%(+4.15)#1,011 |
| 39. | Bradley Gardens | 6.0% | 2.6%(+3.47)#39 | 1.9%(+4.13)#1,023 |
| 40. | Monroe Manor | 6.0% | 2.6%(+3.44)#40 | 1.9%(+4.10)#1,033 |
| 41. | Frenchtown Borough | 5.9% | 2.6%(+3.38)#41 | 1.9%(+4.04)#1,050 |
| 42. | Andover Borough | 5.9% | 2.6%(+3.31)#42 | 1.9%(+3.97)#1,076 |
| 43. | Princeton Junction | 5.8% | 2.6%(+3.28)#43 | 1.9%(+3.94)#1,083 |
| 44. | Bridgewater Center | 5.8% | 2.6%(+3.24)#44 | 1.9%(+3.90)#1,102 |
| 45. | Rutherford Borough | 5.7% | 2.6%(+3.18)#45 | 1.9%(+3.84)#1,122 |
| 46. | Silver Ridge | 5.7% | 2.6%(+3.18)#46 | 1.9%(+3.84)#1,124 |
| 47. | Belle Mead | 5.7% | 2.6%(+3.17)#47 | 1.9%(+3.83)#1,126 |
| 48. | Eatontown Borough | 5.7% | 2.6%(+3.16)#48 | 1.9%(+3.82)#1,130 |
| 49. | Somerset | 5.7% | 2.6%(+3.11)#49 | 1.9%(+3.77)#1,153 |
| 50. | Bradley Beach Borough | 5.7% | 2.6%(+3.09)#50 | 1.9%(+3.76)#1,161 |
| 51. | Sussex Borough | 5.6% | 2.6%(+3.08)#51 | 1.9%(+3.74)#1,168 |
| 52. | Ringoes | 5.6% | 2.6%(+3.08)#52 | 1.9%(+3.74)#1,170 |
| 53. | Mendham Borough | 5.6% | 2.6%(+3.07)#53 | 1.9%(+3.73)#1,175 |
| 54. | Mount Royal | 5.6% | 2.6%(+3.02)#54 | 1.9%(+3.68)#1,197 |
| 55. | New Providence Borough | 5.6% | 2.6%(+2.99)#55 | 1.9%(+3.65)#1,213 |
| 56. | Upper Saddle River Borough | 5.5% | 2.6%(+2.98)#56 | 1.9%(+3.64)#1,216 |
| 57. | Peapack And Gladstone Borough | 5.5% | 2.6%(+2.96)#57 | 1.9%(+3.62)#1,222 |
| 58. | West Belmar | 5.5% | 2.6%(+2.90)#58 | 1.9%(+3.56)#1,241 |
| 59. | Liberty Corner | 5.5% | 2.6%(+2.89)#59 | 1.9%(+3.55)#1,248 |
| 60. | Ocean Grove | 5.4% | 2.6%(+2.81)#60 | 1.9%(+3.47)#1,280 |
| 61. | Audubon Borough | 5.4% | 2.6%(+2.80)#61 | 1.9%(+3.46)#1,289 |
| 62. | Blackwells Mills | 5.3% | 2.6%(+2.76)#62 | 1.9%(+3.42)#1,305 |
| 63. | Silver Lake Cdp Essex County | 5.3% | 2.6%(+2.76)#63 | 1.9%(+3.42)#1,306 |
| 64. | Ridgewood | 5.3% | 2.6%(+2.72)#64 | 1.9%(+3.38)#1,321 |
| 65. | Brookdale | 5.3% | 2.6%(+2.71)#65 | 1.9%(+3.37)#1,324 |
| 66. | Teterboro Borough | 5.3% | 2.6%(+2.70)#66 | 1.9%(+3.36)#1,337 |
| 67. | Stockton Borough | 5.2% | 2.6%(+2.68)#67 | 1.9%(+3.35)#1,345 |
| 68. | Greenwich | 5.2% | 2.6%(+2.65)#68 | 1.9%(+3.31)#1,355 |
| 69. | Glen Rock Borough | 5.2% | 2.6%(+2.62)#69 | 1.9%(+3.28)#1,366 |
| 70. | Highlands Borough | 5.2% | 2.6%(+2.60)#70 | 1.9%(+3.26)#1,377 |
| 71. | Robbinsville Center | 5.1% | 2.6%(+2.56)#71 | 1.9%(+3.23)#1,402 |
| 72. | Keyport Borough | 5.1% | 2.6%(+2.56)#72 | 1.9%(+3.22)#1,406 |
| 73. | Springfield | 5.1% | 2.6%(+2.56)#73 | 1.9%(+3.22)#1,407 |
| 74. | Essex Fells Borough | 5.1% | 2.6%(+2.54)#74 | 1.9%(+3.20)#1,412 |
| 75. | Wildwood Crest Borough | 5.0% | 2.6%(+2.43)#75 | 1.9%(+3.09)#1,480 |
| 76. | Bedminster | 5.0% | 2.6%(+2.43)#76 | 1.9%(+3.09)#1,481 |
| 77. | Fair Haven Borough | 5.0% | 2.6%(+2.42)#77 | 1.9%(+3.08)#1,485 |
| 78. | Short Hills | 5.0% | 2.6%(+2.40)#78 | 1.9%(+3.06)#1,493 |
| 79. | Monmouth Beach Borough | 5.0% | 2.6%(+2.40)#79 | 1.9%(+3.06)#1,494 |
| 80. | Macopin | 4.9% | 2.6%(+2.37)#80 | 1.9%(+3.03)#1,522 |
| 81. | Far Hills Borough | 4.9% | 2.6%(+2.34)#81 | 1.9%(+3.00)#1,535 |
| 82. | Red Bank Borough | 4.9% | 2.6%(+2.34)#82 | 1.9%(+3.00)#1,536 |
| 83. | New Gretna | 4.9% | 2.6%(+2.30)#83 | 1.9%(+2.96)#1,561 |
| 84. | Wood Ridge Borough | 4.9% | 2.6%(+2.29)#84 | 1.9%(+2.95)#1,563 |
| 85. | Tenafly Borough | 4.8% | 2.6%(+2.21)#85 | 1.9%(+2.87)#1,605 |
| 86. | Cedar Knolls | 4.8% | 2.6%(+2.20)#86 | 1.9%(+2.86)#1,616 |
| 87. | Hillsdale Borough | 4.7% | 2.6%(+2.17)#87 | 1.9%(+2.83)#1,630 |
| 88. | East Rutherford Borough | 4.7% | 2.6%(+2.17)#88 | 1.9%(+2.83)#1,632 |
| 89. | Westville Borough | 4.7% | 2.6%(+2.14)#89 | 1.9%(+2.80)#1,644 |
| 90. | Ridgefield Borough | 4.7% | 2.6%(+2.10)#90 | 1.9%(+2.76)#1,669 |
| 91. | Bargaintown | 4.7% | 2.6%(+2.09)#91 | 1.9%(+2.75)#1,672 |
| 92. | Metuchen Borough | 4.6% | 2.6%(+2.09)#92 | 1.9%(+2.75)#1,681 |
| 93. | Chatham Borough | 4.6% | 2.6%(+2.09)#93 | 1.9%(+2.75)#1,685 |
| 94. | Seabrook Farms | 4.6% | 2.6%(+2.07)#94 | 1.9%(+2.73)#1,701 |
| 95. | Chester Borough | 4.5% | 2.6%(+1.97)#95 | 1.9%(+2.63)#1,765 |
| 96. | Mcguire Afb | 4.5% | 2.6%(+1.90)#96 | 1.9%(+2.56)#1,814 |
| 97. | Riverton Borough | 4.4% | 2.6%(+1.89)#97 | 1.9%(+2.55)#1,819 |
| 98. | Bernardsville Borough | 4.4% | 2.6%(+1.84)#98 | 1.9%(+2.50)#1,862 |
| 99. | Packanack Lake | 4.4% | 2.6%(+1.83)#99 | 1.9%(+2.49)#1,876 |
| 100. | Cliffwood Beach | 4.4% | 2.6%(+1.81)#100 | 1.9%(+2.47)#1,890 |
Common Questions
What are the Top 10 Cities with the Highest Percentage of Population Employed in Information in New Jersey?
Top 10 Cities with the Highest Percentage of Population Employed in Information in New Jersey are:
#1
15.4%
#2
12.8%
#3
11.6%
#4
10.3%
#5
8.9%
#6
8.7%
#7
7.6%
#8
7.5%
#9
7.4%
#10
7.2%
What city has the Highest Percentage of Population Employed in Information in New Jersey?
Ten Mile Run has the Highest Percentage of Population Employed in Information in New Jersey with 15.4%.
What is the Percentage of Population Employed in Information in the State of New Jersey?
Percentage of Population Employed in Information in New Jersey is 2.6%.
What is the Percentage of Population Employed in Information in the United States?
Percentage of Population Employed in Information in the United States is 1.9%.