Lehr, ND
Lehr Map
Lehr Overview
73
TOTAL POPULATION
40
MALE POPULATION
33
FEMALE POPULATION
121.21
MALES / 100 FEMALES
82.50
FEMALES / 100 MALES
60.5
MEDIAN AGE
2.4
AVG FAMILY SIZE
1.8
AVG HOUSEHOLD SIZE
$31,158
PER CAPITA INCOME
$48,750
AVG FAMILY INCOME
$43,750
AVG HOUSEHOLD INCOME
35.7%
WAGE / INCOME GAP [ % ]
64.3¢/ $1
WAGE / INCOME GAP [ $ ]
0.41
INEQUALITY / GINI INDEX
44
LABOR FORCE [ PEOPLE ]
65.7%
PERCENT IN LABOR FORCE
4.5%
UNEMPLOYMENT RATE
Lehr Zip Codes
Lehr Area Codes
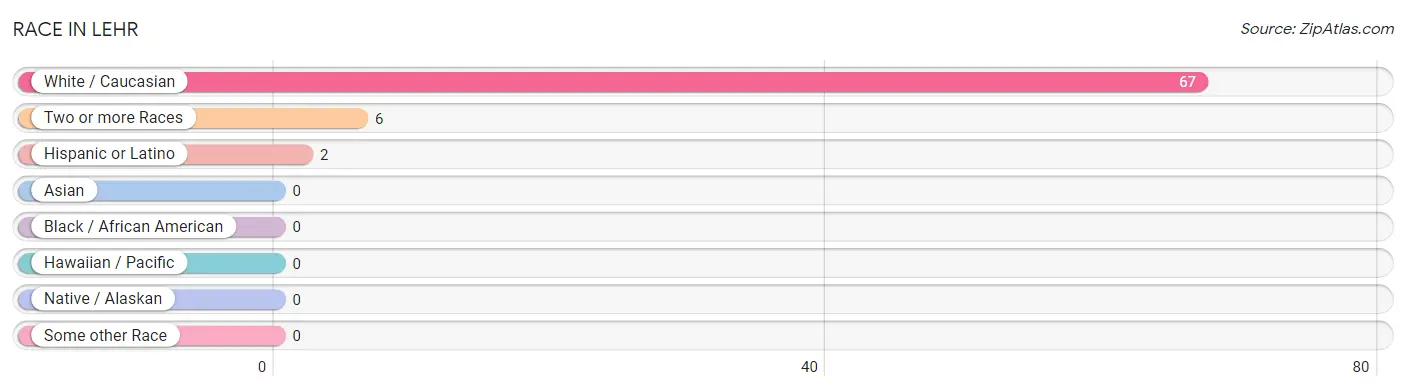
Race in Lehr
The most populous races in Lehr are White / Caucasian (67 | 91.8%), Two or more Races (6 | 8.2%), and Hispanic or Latino (2 | 2.7%).
| Race | # Population | % Population |
| Asian | 0 | 0.0% |
| Black / African American | 0 | 0.0% |
| Hawaiian / Pacific | 0 | 0.0% |
| Hispanic or Latino | 2 | 2.7% |
| Native / Alaskan | 0 | 0.0% |
| White / Caucasian | 67 | 91.8% |
| Two or more Races | 6 | 8.2% |
| Some other Race | 0 | 0.0% |
| Total | 73 | 100.0% |
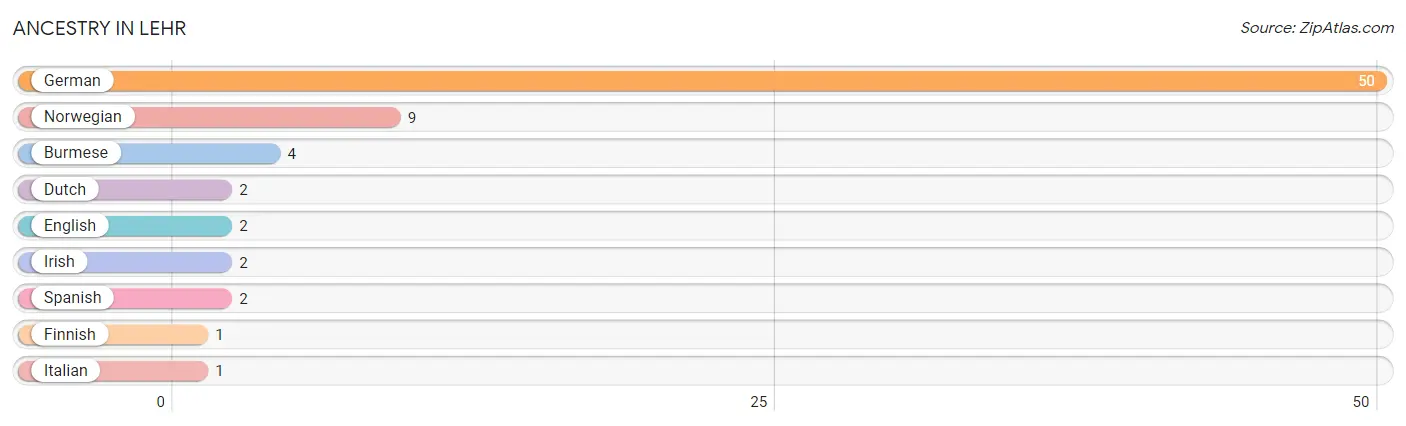
Ancestry in Lehr
The most populous ancestries reported in Lehr are German (50 | 68.5%), Norwegian (9 | 12.3%), Burmese (4 | 5.5%), Dutch (2 | 2.7%), and English (2 | 2.7%), together accounting for 91.8% of all Lehr residents.
| Ancestry | # Population | % Population |
| Burmese | 4 | 5.5% |
| Dutch | 2 | 2.7% |
| English | 2 | 2.7% |
| Finnish | 1 | 1.4% |
| German | 50 | 68.5% |
| Irish | 2 | 2.7% |
| Italian | 1 | 1.4% |
| Norwegian | 9 | 12.3% |
| Spanish | 2 | 2.7% | View All 9 Rows |
Immigrants in Lehr

| Immigration Origin | # Population | % Population | View All 0 Rows |
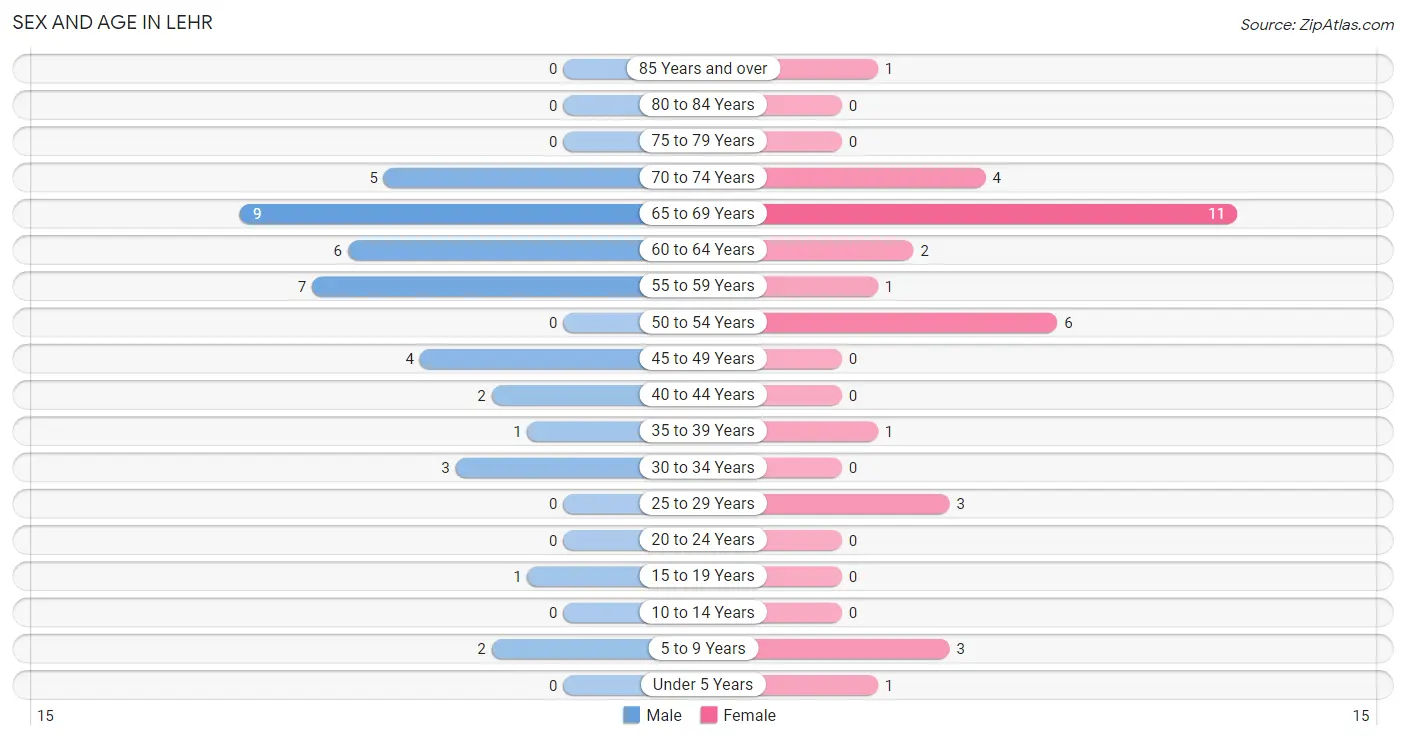
Sex and Age in Lehr
Sex and Age in Lehr
The most populous age groups in Lehr are 65 to 69 Years (9 | 22.5%) for men and 65 to 69 Years (11 | 33.3%) for women.
| Age Bracket | Male | Female |
| Under 5 Years | 0 (0.0%) | 1 (3.0%) |
| 5 to 9 Years | 2 (5.0%) | 3 (9.1%) |
| 10 to 14 Years | 0 (0.0%) | 0 (0.0%) |
| 15 to 19 Years | 1 (2.5%) | 0 (0.0%) |
| 20 to 24 Years | 0 (0.0%) | 0 (0.0%) |
| 25 to 29 Years | 0 (0.0%) | 3 (9.1%) |
| 30 to 34 Years | 3 (7.5%) | 0 (0.0%) |
| 35 to 39 Years | 1 (2.5%) | 1 (3.0%) |
| 40 to 44 Years | 2 (5.0%) | 0 (0.0%) |
| 45 to 49 Years | 4 (10.0%) | 0 (0.0%) |
| 50 to 54 Years | 0 (0.0%) | 6 (18.2%) |
| 55 to 59 Years | 7 (17.5%) | 1 (3.0%) |
| 60 to 64 Years | 6 (15.0%) | 2 (6.1%) |
| 65 to 69 Years | 9 (22.5%) | 11 (33.3%) |
| 70 to 74 Years | 5 (12.5%) | 4 (12.1%) |
| 75 to 79 Years | 0 (0.0%) | 0 (0.0%) |
| 80 to 84 Years | 0 (0.0%) | 0 (0.0%) |
| 85 Years and over | 0 (0.0%) | 1 (3.0%) |
| Total | 40 (100.0%) | 33 (100.0%) |
Families and Households in Lehr
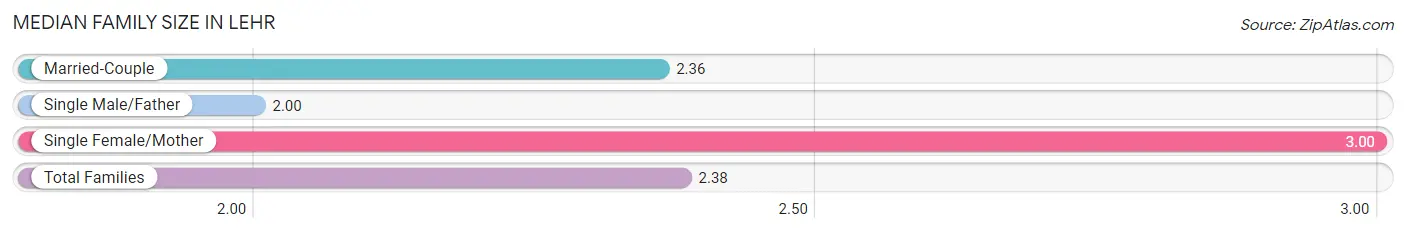
Median Family Size in Lehr
The median family size in Lehr is 2.38 persons per family, with single female/mother families (1 | 4.2%) accounting for the largest median family size of 3 persons per family. On the other hand, single male/father families (1 | 4.2%) represent the smallest median family size with 2.00 persons per family.
| Family Type | # Families | Family Size |
| Married-Couple | 22 (91.7%) | 2.36 |
| Single Male/Father | 1 (4.2%) | 2.00 |
| Single Female/Mother | 1 (4.2%) | 3.00 |
| Total Families | 24 (100.0%) | 2.38 |
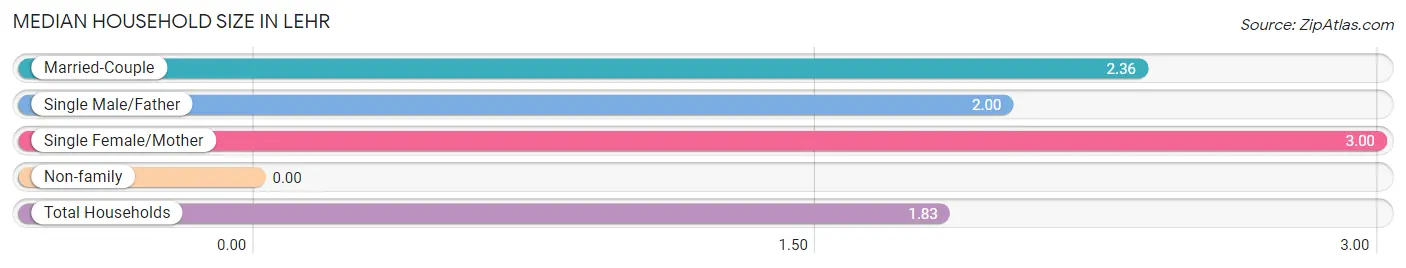
Median Household Size in Lehr
| Household Type | # Households | Household Size |
| Married-Couple | 22 (55.0%) | 2.36 |
| Single Male/Father | 1 (2.5%) | 2.00 |
| Single Female/Mother | 1 (2.5%) | 3.00 |
| Non-family | 16 (40.0%) | - |
| Total Households | 40 (100.0%) | 1.83 |
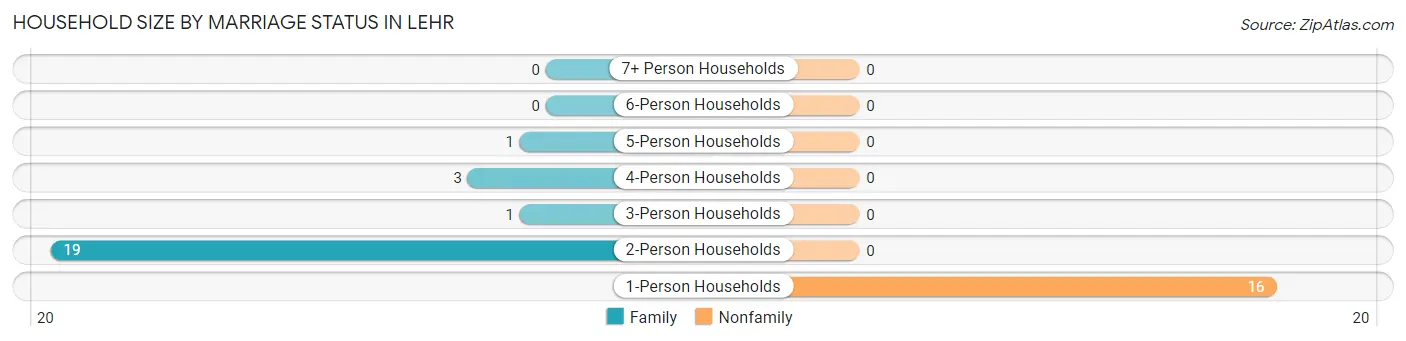
Household Size by Marriage Status in Lehr
Out of a total of 40 households in Lehr, 24 (60.0%) are family households, while 16 (40.0%) are nonfamily households. The most numerous type of family households are 2-person households, comprising 19, and the most common type of nonfamily households are 1-person households, comprising 16.
| Household Size | Family Households | Nonfamily Households |
| 1-Person Households | - | 16 (40.0%) |
| 2-Person Households | 19 (47.5%) | 0 (0.0%) |
| 3-Person Households | 1 (2.5%) | 0 (0.0%) |
| 4-Person Households | 3 (7.5%) | 0 (0.0%) |
| 5-Person Households | 1 (2.5%) | 0 (0.0%) |
| 6-Person Households | 0 (0.0%) | 0 (0.0%) |
| 7+ Person Households | 0 (0.0%) | 0 (0.0%) |
| Total | 24 (60.0%) | 16 (40.0%) |
Female Fertility in Lehr
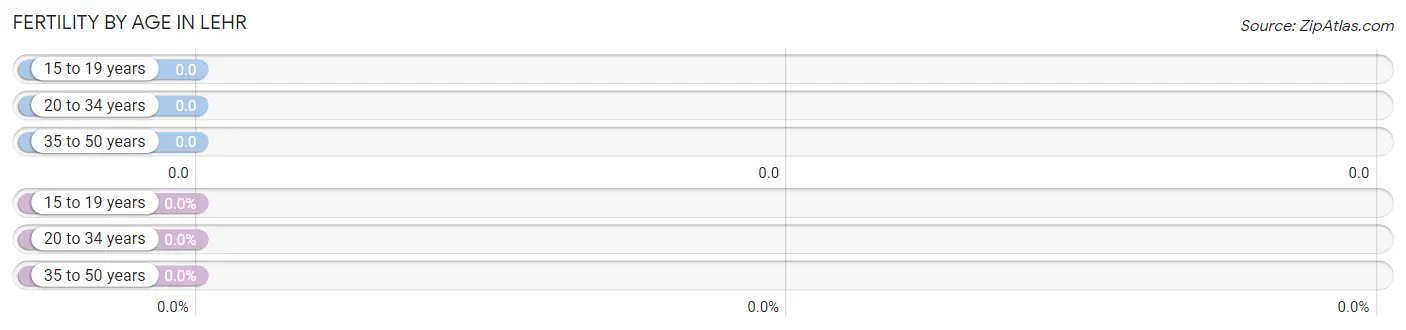
Fertility by Age in Lehr
| Age Bracket | Women with Births | Births / 1,000 Women |
| 15 to 19 years | 0 (0.0%) | 0.0 |
| 20 to 34 years | 0 (0.0%) | 0.0 |
| 35 to 50 years | 0 (0.0%) | 0.0 |
| Total | 0 (0.0%) | 0.0 |
Fertility by Age by Marriage Status in Lehr
| Age Bracket | Married | Unmarried |
| 15 to 19 years | 0 (0.0%) | 0 (0.0%) |
| 20 to 34 years | 0 (0.0%) | 0 (0.0%) |
| 35 to 50 years | 0 (0.0%) | 0 (0.0%) |
| Total | 0 (0.0%) | 0 (0.0%) |
Fertility by Education in Lehr
| Educational Attainment | Women with Births | Births / 1,000 Women |
| Less than High School | 0 (0.0%) | 0.0 |
| High School Diploma | 0 (0.0%) | 0.0 |
| College or Associate's Degree | 0 (0.0%) | 0.0 |
| Bachelor's Degree | 0 (0.0%) | 0.0 |
| Graduate Degree | 0 (0.0%) | 0.0 |
| Total | 0 (0.0%) | 0.0 |
Fertility by Education by Marriage Status in Lehr
| Educational Attainment | Married | Unmarried |
| Less than High School | 0 (0.0%) | 0 (0.0%) |
| High School Diploma | 0 (0.0%) | 0 (0.0%) |
| College or Associate's Degree | 0 (0.0%) | 0 (0.0%) |
| Bachelor's Degree | 0 (0.0%) | 0 (0.0%) |
| Graduate Degree | 0 (0.0%) | 0 (0.0%) |
| Total | 0 (0.0%) | 0 (0.0%) |
Income in Lehr
Income Overview in Lehr
Per Capita Income in Lehr is $31,158, while median incomes of families and households are $48,750 and $43,750 respectively.
| Characteristic | Number | Measure |
| Per Capita Income | 73 | $31,158 |
| Median Family Income | 24 | $48,750 |
| Mean Family Income | 24 | $66,771 |
| Median Household Income | 40 | $43,750 |
| Mean Household Income | 40 | $53,553 |
| Income Deficit | 24 | $0 |
| Wage / Income Gap (%) | 73 | 35.68% |
| Wage / Income Gap ($) | 73 | 64.32¢ per $1 |
| Gini / Inequality Index | 73 | 0.41 |
Earnings by Sex in Lehr
Average Earnings in Lehr are $34,688, $46,250 for men and $29,750 for women, a difference of 35.7%.
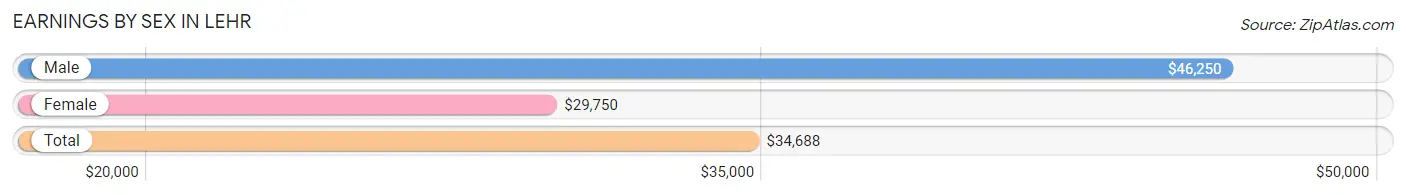
| Sex | Number | Average Earnings |
| Male | 20 (44.4%) | $46,250 |
| Female | 25 (55.6%) | $29,750 |
| Total | 45 (100.0%) | $34,688 |
Earnings by Sex by Income Bracket in Lehr
The most common earnings brackets in Lehr are $100,000+ for men (6 | 30.0%) and $12,500 to $14,999 for women (5 | 20.0%).
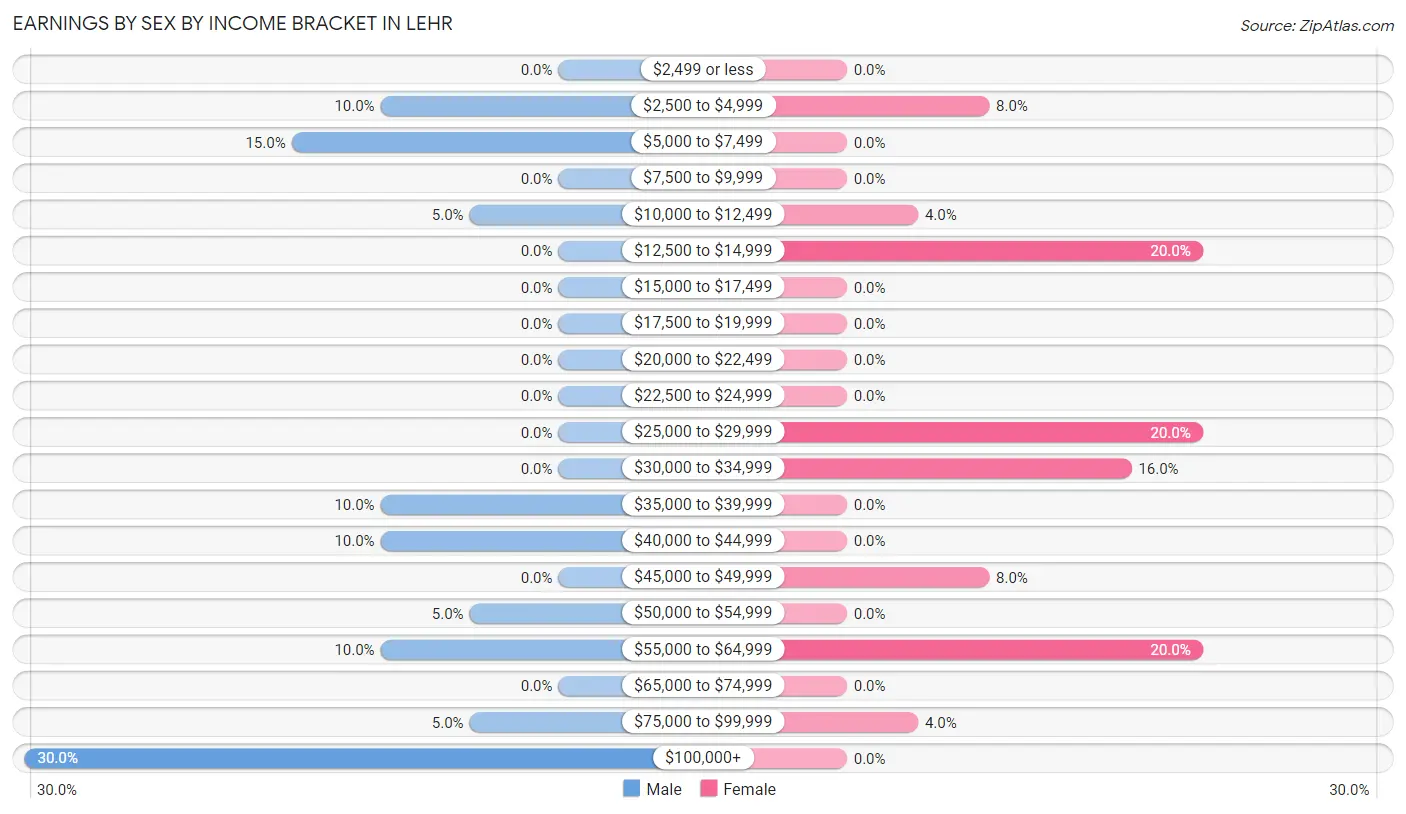
| Income | Male | Female |
| $2,499 or less | 0 (0.0%) | 0 (0.0%) |
| $2,500 to $4,999 | 2 (10.0%) | 2 (8.0%) |
| $5,000 to $7,499 | 3 (15.0%) | 0 (0.0%) |
| $7,500 to $9,999 | 0 (0.0%) | 0 (0.0%) |
| $10,000 to $12,499 | 1 (5.0%) | 1 (4.0%) |
| $12,500 to $14,999 | 0 (0.0%) | 5 (20.0%) |
| $15,000 to $17,499 | 0 (0.0%) | 0 (0.0%) |
| $17,500 to $19,999 | 0 (0.0%) | 0 (0.0%) |
| $20,000 to $22,499 | 0 (0.0%) | 0 (0.0%) |
| $22,500 to $24,999 | 0 (0.0%) | 0 (0.0%) |
| $25,000 to $29,999 | 0 (0.0%) | 5 (20.0%) |
| $30,000 to $34,999 | 0 (0.0%) | 4 (16.0%) |
| $35,000 to $39,999 | 2 (10.0%) | 0 (0.0%) |
| $40,000 to $44,999 | 2 (10.0%) | 0 (0.0%) |
| $45,000 to $49,999 | 0 (0.0%) | 2 (8.0%) |
| $50,000 to $54,999 | 1 (5.0%) | 0 (0.0%) |
| $55,000 to $64,999 | 2 (10.0%) | 5 (20.0%) |
| $65,000 to $74,999 | 0 (0.0%) | 0 (0.0%) |
| $75,000 to $99,999 | 1 (5.0%) | 1 (4.0%) |
| $100,000+ | 6 (30.0%) | 0 (0.0%) |
| Total | 20 (100.0%) | 25 (100.0%) |
Earnings by Sex by Educational Attainment in Lehr
Average earnings in Lehr are $51,250 for men and $29,750 for women, a difference of 41.9%. Men with an educational attainment of high school diploma enjoy the highest average annual earnings of $112,708, while those with high school diploma education earn the least with $112,708. Women with an educational attainment of high school diploma earn the most with the average annual earnings of $29,500, while those with high school diploma education have the smallest earnings of $29,500.
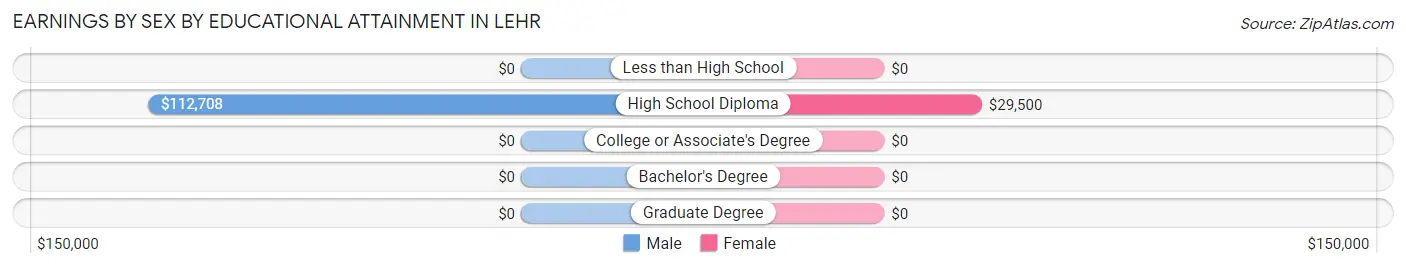
| Educational Attainment | Male Income | Female Income |
| Less than High School | - | - |
| High School Diploma | $112,708 | $29,500 |
| College or Associate's Degree | - | - |
| Bachelor's Degree | - | - |
| Graduate Degree | - | - |
| Total | $51,250 | $29,750 |
Family Income in Lehr
Family Income Brackets in Lehr
According to the Lehr family income data, there are 6 families falling into the $100,000 to $149,999 income range, which is the most common income bracket and makes up 25.0% of all families.
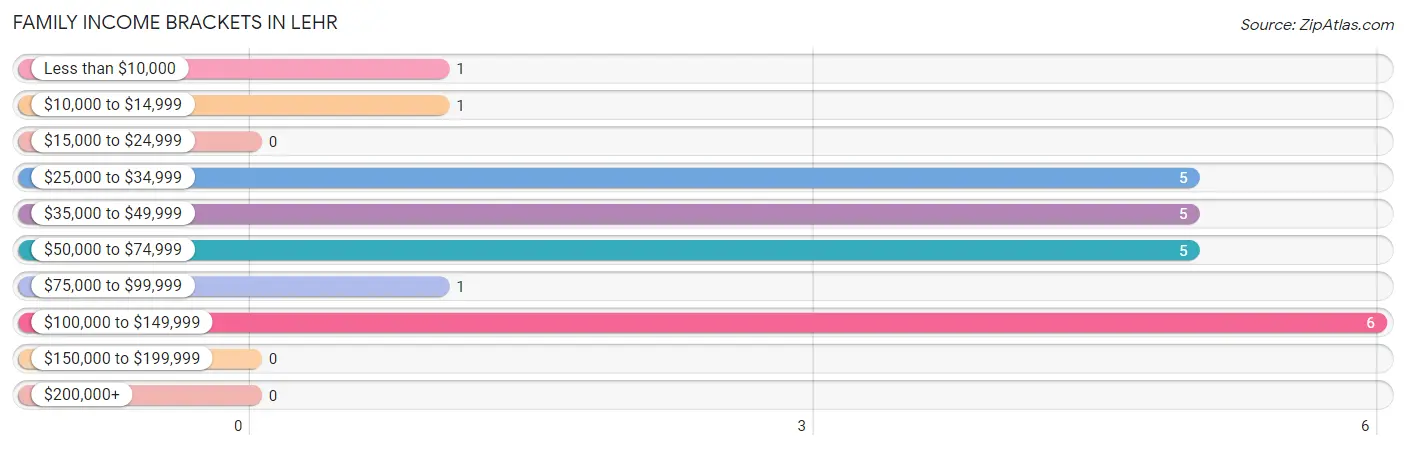
| Income Bracket | # Families | % Families |
| Less than $10,000 | 1 | 4.2% |
| $10,000 to $14,999 | 1 | 4.2% |
| $15,000 to $24,999 | 0 | 0.0% |
| $25,000 to $34,999 | 5 | 20.8% |
| $35,000 to $49,999 | 5 | 20.8% |
| $50,000 to $74,999 | 5 | 20.8% |
| $75,000 to $99,999 | 1 | 4.2% |
| $100,000 to $149,999 | 6 | 25.0% |
| $150,000 to $199,999 | 0 | 0.0% |
| $200,000+ | 0 | 0.0% |
Family Income by Famaliy Size in Lehr
| Income Bracket | # Families | Median Income |
| 2-Person Families | 19 (79.2%) | $0 |
| 3-Person Families | 1 (4.2%) | $0 |
| 4-Person Families | 3 (12.5%) | $0 |
| 5-Person Families | 1 (4.2%) | $0 |
| 6-Person Families | 0 (0.0%) | $0 |
| 7+ Person Families | 0 (0.0%) | $0 |
| Total | 24 (100.0%) | $48,750 |
Family Income by Number of Earners in Lehr
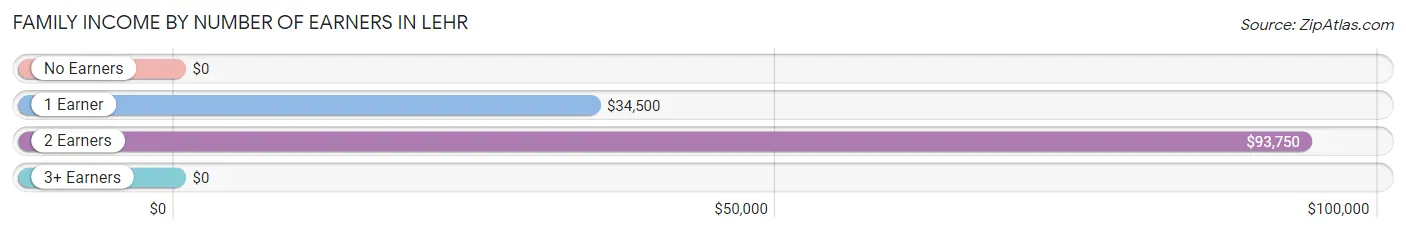
| Number of Earners | # Families | Median Income |
| No Earners | 1 (4.2%) | $0 |
| 1 Earner | 10 (41.7%) | $34,500 |
| 2 Earners | 13 (54.2%) | $93,750 |
| 3+ Earners | 0 (0.0%) | $0 |
| Total | 24 (100.0%) | $48,750 |
Household Income in Lehr
Household Income Brackets in Lehr
With 11 households falling in the category, the $50,000 to $74,999 income range is the most frequent in Lehr, accounting for 27.5% of all households.
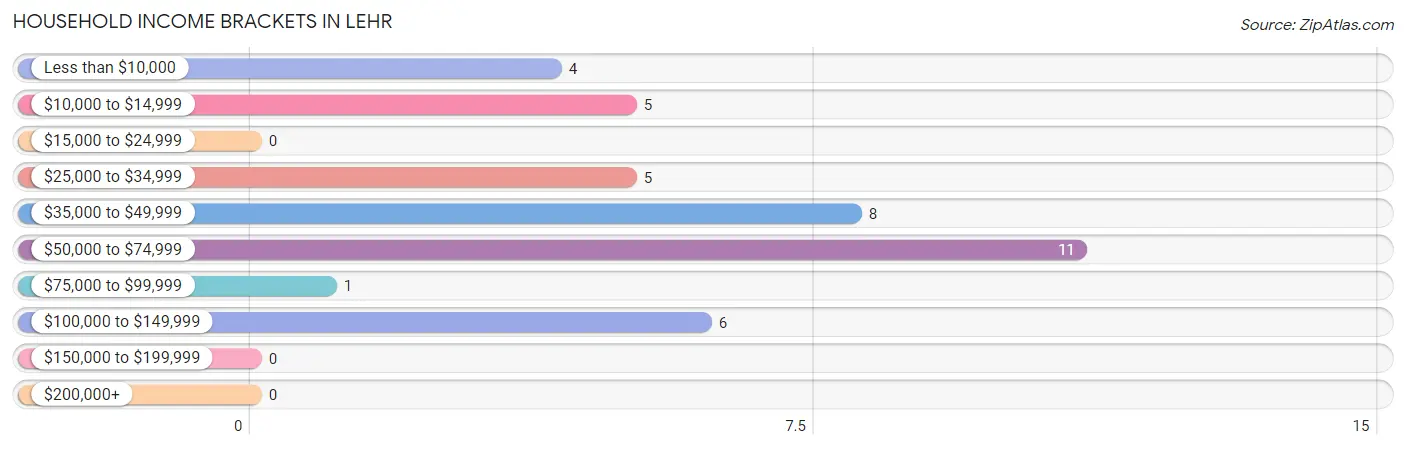
| Income Bracket | # Households | % Households |
| Less than $10,000 | 4 | 10.0% |
| $10,000 to $14,999 | 5 | 12.5% |
| $15,000 to $24,999 | 0 | 0.0% |
| $25,000 to $34,999 | 5 | 12.5% |
| $35,000 to $49,999 | 8 | 20.0% |
| $50,000 to $74,999 | 11 | 27.5% |
| $75,000 to $99,999 | 1 | 2.5% |
| $100,000 to $149,999 | 6 | 15.0% |
| $150,000 to $199,999 | 0 | 0.0% |
| $200,000+ | 0 | 0.0% |
Household Income by Householder Age in Lehr
The median household income in Lehr is $43,750, with the highest median household income of $65,625 found in the 45 to 64 years age bracket for the primary householder. A total of 17 households (42.5%) fall into this category.
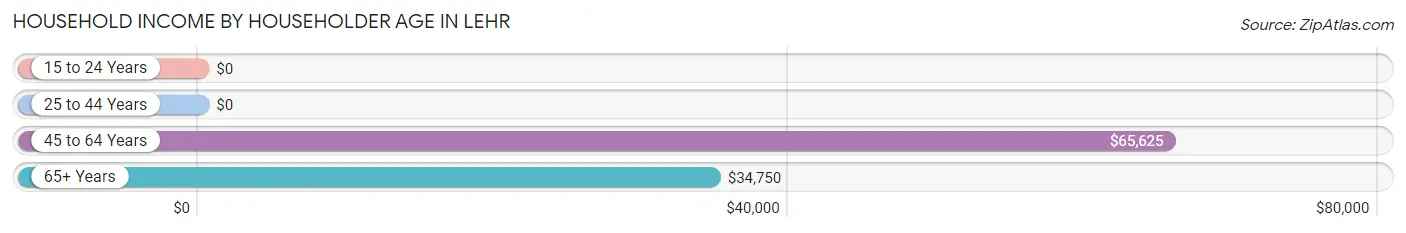
| Income Bracket | # Households | Median Income |
| 15 to 24 Years | 0 (0.0%) | $0 |
| 25 to 44 Years | 4 (10.0%) | $0 |
| 45 to 64 Years | 17 (42.5%) | $65,625 |
| 65+ Years | 19 (47.5%) | $34,750 |
| Total | 40 (100.0%) | $43,750 |
Poverty in Lehr
Income Below Poverty by Sex and Age in Lehr
With 17.5% poverty level for males and 9.1% for females among the residents of Lehr, 55 to 64 year old males and 75 year old and over females are the most vulnerable to poverty, with 4 males (30.8%) and 1 females (100.0%) in their respective age groups living below the poverty level.
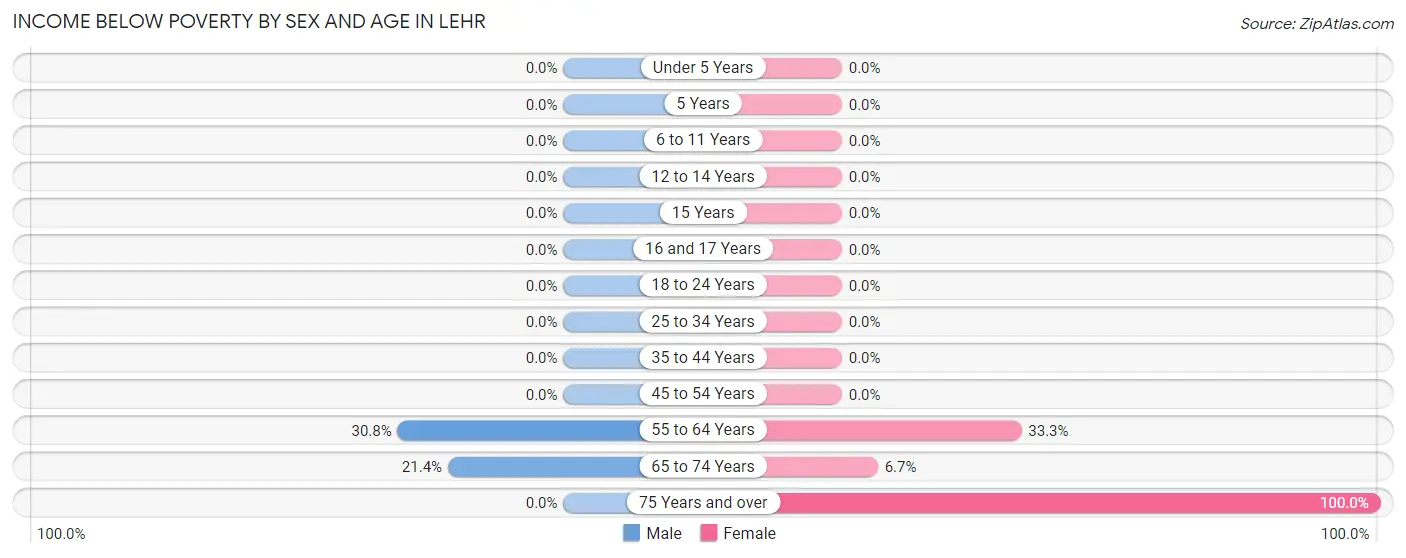
| Age Bracket | Male | Female |
| Under 5 Years | 0 (0.0%) | 0 (0.0%) |
| 5 Years | 0 (0.0%) | 0 (0.0%) |
| 6 to 11 Years | 0 (0.0%) | 0 (0.0%) |
| 12 to 14 Years | 0 (0.0%) | 0 (0.0%) |
| 15 Years | 0 (0.0%) | 0 (0.0%) |
| 16 and 17 Years | 0 (0.0%) | 0 (0.0%) |
| 18 to 24 Years | 0 (0.0%) | 0 (0.0%) |
| 25 to 34 Years | 0 (0.0%) | 0 (0.0%) |
| 35 to 44 Years | 0 (0.0%) | 0 (0.0%) |
| 45 to 54 Years | 0 (0.0%) | 0 (0.0%) |
| 55 to 64 Years | 4 (30.8%) | 1 (33.3%) |
| 65 to 74 Years | 3 (21.4%) | 1 (6.7%) |
| 75 Years and over | 0 (0.0%) | 1 (100.0%) |
| Total | 7 (17.5%) | 3 (9.1%) |
Income Above Poverty by Sex and Age in Lehr
According to the poverty statistics in Lehr, males aged 6 to 11 years and females aged under 5 years are the age groups that are most secure financially, with 100.0% of males and 100.0% of females in these age groups living above the poverty line.
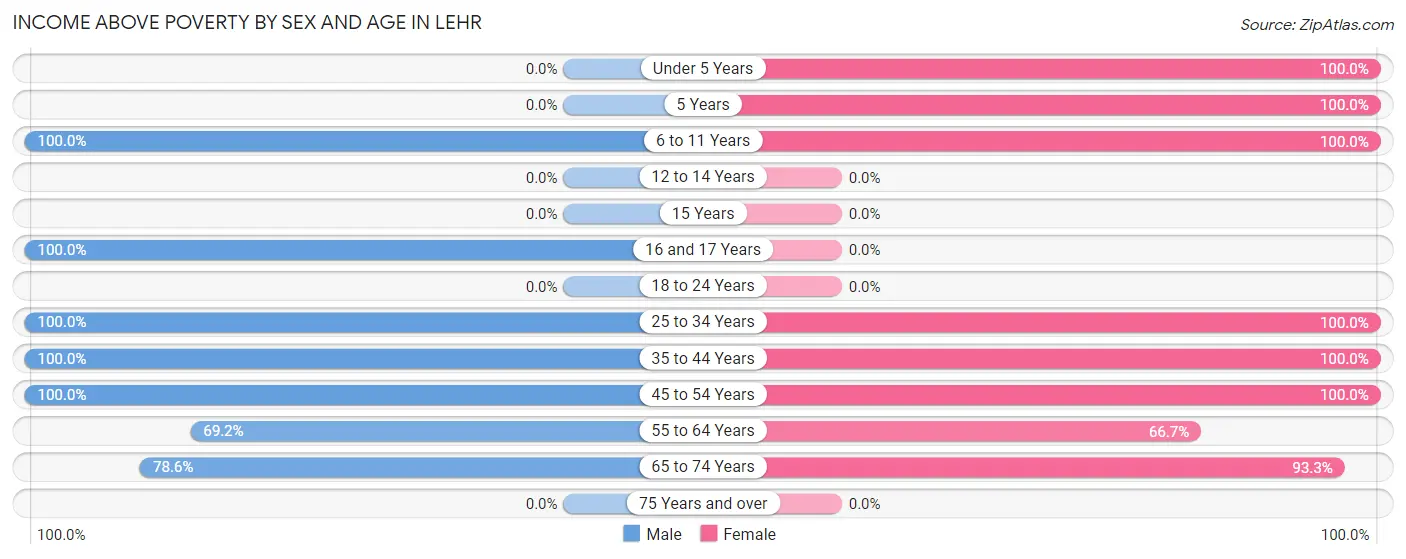
| Age Bracket | Male | Female |
| Under 5 Years | 0 (0.0%) | 1 (100.0%) |
| 5 Years | 0 (0.0%) | 2 (100.0%) |
| 6 to 11 Years | 2 (100.0%) | 1 (100.0%) |
| 12 to 14 Years | 0 (0.0%) | 0 (0.0%) |
| 15 Years | 0 (0.0%) | 0 (0.0%) |
| 16 and 17 Years | 1 (100.0%) | 0 (0.0%) |
| 18 to 24 Years | 0 (0.0%) | 0 (0.0%) |
| 25 to 34 Years | 3 (100.0%) | 3 (100.0%) |
| 35 to 44 Years | 3 (100.0%) | 1 (100.0%) |
| 45 to 54 Years | 4 (100.0%) | 6 (100.0%) |
| 55 to 64 Years | 9 (69.2%) | 2 (66.7%) |
| 65 to 74 Years | 11 (78.6%) | 14 (93.3%) |
| 75 Years and over | 0 (0.0%) | 0 (0.0%) |
| Total | 33 (82.5%) | 30 (90.9%) |
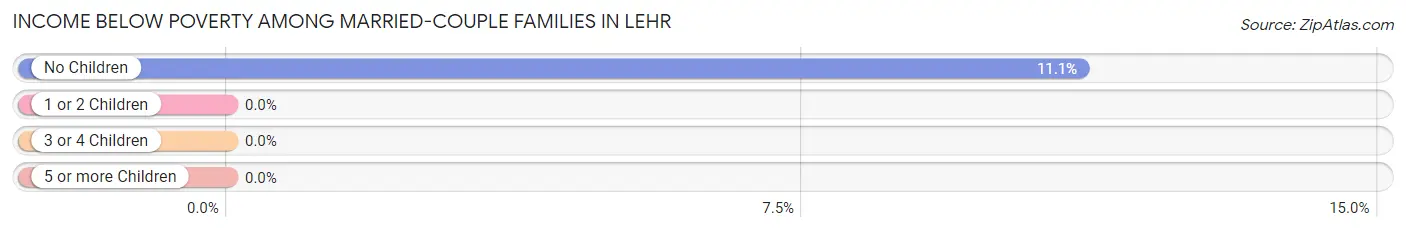
Income Below Poverty Among Married-Couple Families in Lehr
The poverty statistics for married-couple families in Lehr show that 9.1% or 2 of the total 22 families live below the poverty line. Families with no children have the highest poverty rate of 11.1%, comprising of 2 families. On the other hand, families with 1 or 2 children have the lowest poverty rate of 0.0%, which includes 0 families.
| Children | Above Poverty | Below Poverty |
| No Children | 16 (88.9%) | 2 (11.1%) |
| 1 or 2 Children | 3 (100.0%) | 0 (0.0%) |
| 3 or 4 Children | 1 (100.0%) | 0 (0.0%) |
| 5 or more Children | 0 (0.0%) | 0 (0.0%) |
| Total | 20 (90.9%) | 2 (9.1%) |
Income Below Poverty Among Single-Parent Households in Lehr
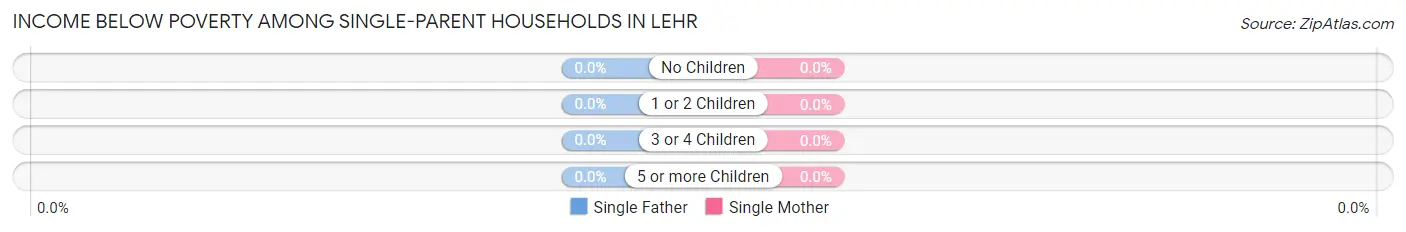
| Children | Single Father | Single Mother |
| No Children | 0 (0.0%) | 0 (0.0%) |
| 1 or 2 Children | 0 (0.0%) | 0 (0.0%) |
| 3 or 4 Children | 0 (0.0%) | 0 (0.0%) |
| 5 or more Children | 0 (0.0%) | 0 (0.0%) |
| Total | 0 (0.0%) | 0 (0.0%) |
Income Below Poverty Among Married-Couple vs Single-Parent Households in Lehr
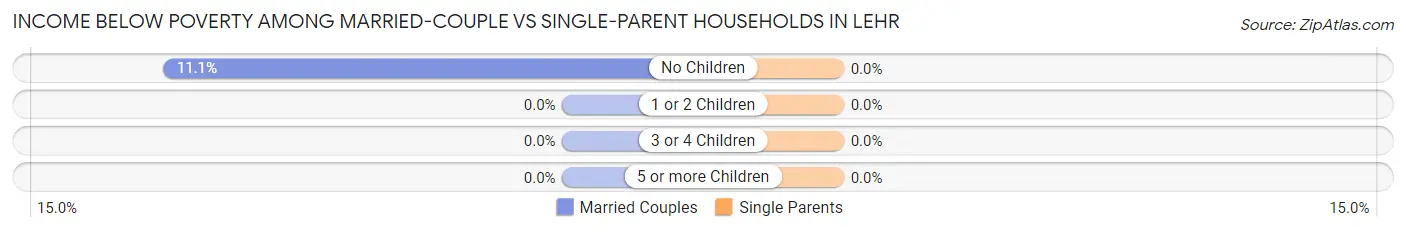
| Children | Married-Couple Families | Single-Parent Households |
| No Children | 2 (11.1%) | 0 (0.0%) |
| 1 or 2 Children | 0 (0.0%) | 0 (0.0%) |
| 3 or 4 Children | 0 (0.0%) | 0 (0.0%) |
| 5 or more Children | 0 (0.0%) | 0 (0.0%) |
| Total | 2 (9.1%) | 0 (0.0%) |
Employment Characteristics in Lehr
Employment by Class of Employer in Lehr
Among the 42 employed individuals in Lehr, private company employees (19 | 45.2%), not-for-profit organizations (12 | 28.6%), and local government employees (7 | 16.7%) make up the most common classes of employment.
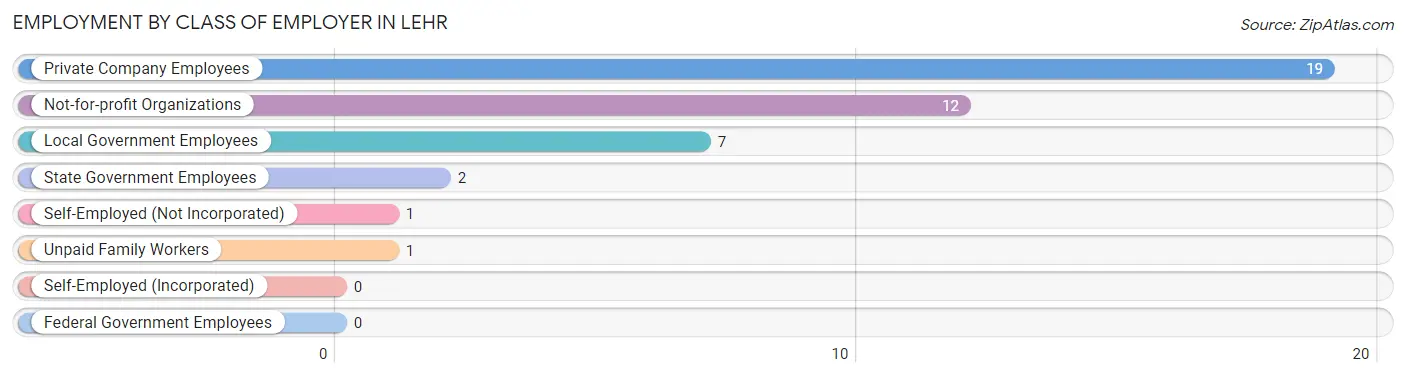
| Employer Class | # Employees | % Employees |
| Private Company Employees | 19 | 45.2% |
| Self-Employed (Incorporated) | 0 | 0.0% |
| Self-Employed (Not Incorporated) | 1 | 2.4% |
| Not-for-profit Organizations | 12 | 28.6% |
| Local Government Employees | 7 | 16.7% |
| State Government Employees | 2 | 4.8% |
| Federal Government Employees | 0 | 0.0% |
| Unpaid Family Workers | 1 | 2.4% |
| Total | 42 | 100.0% |
Employment Status by Age in Lehr
According to the labor force statistics for Lehr, out of the total population over 16 years of age (67), 65.7% or 44 individuals are in the labor force, with 4.5% or 2 of them unemployed. The age group with the highest labor force participation rate is 16 to 19 years, with 100.0% or 1 individuals in the labor force. Within the labor force, the 30 to 34 years age range has the highest percentage of unemployed individuals, with 100.0% or 2 of them being unemployed.
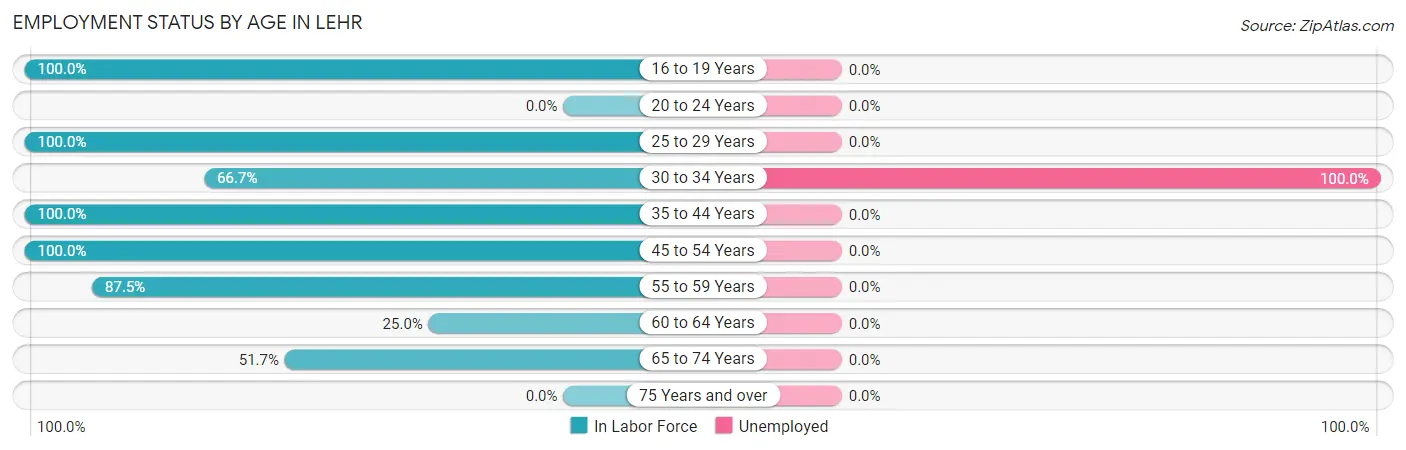
| Age Bracket | In Labor Force | Unemployed |
| 16 to 19 Years | 1 (100.0%) | 0 (0.0%) |
| 20 to 24 Years | 0 (0.0%) | 0 (0.0%) |
| 25 to 29 Years | 3 (100.0%) | 0 (0.0%) |
| 30 to 34 Years | 2 (66.7%) | 2 (100.0%) |
| 35 to 44 Years | 4 (100.0%) | 0 (0.0%) |
| 45 to 54 Years | 10 (100.0%) | 0 (0.0%) |
| 55 to 59 Years | 7 (87.5%) | 0 (0.0%) |
| 60 to 64 Years | 2 (25.0%) | 0 (0.0%) |
| 65 to 74 Years | 15 (51.7%) | 0 (0.0%) |
| 75 Years and over | 0 (0.0%) | 0 (0.0%) |
| Total | 44 (65.7%) | 2 (4.5%) |
Employment Status by Educational Attainment in Lehr
According to labor force statistics for Lehr, 77.8% of individuals (28) out of the total population between 25 and 64 years of age (36) are in the labor force, with 7.1% or 2 of them being unemployed. The group with the highest labor force participation rate are those with the educational attainment of bachelor's degree or higher, with 100.0% or 5 individuals in the labor force. Within the labor force, individuals with high school diploma education have the highest percentage of unemployment, with 10.5% or 2 of them being unemployed.
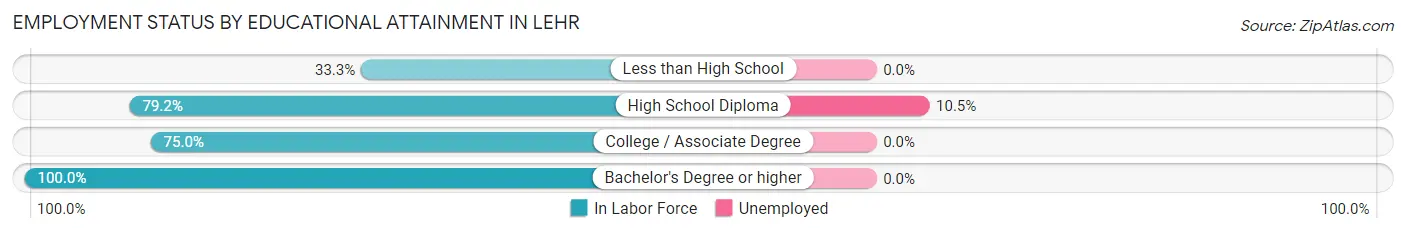
| Educational Attainment | In Labor Force | Unemployed |
| Less than High School | 1 (33.3%) | 0 (0.0%) |
| High School Diploma | 19 (79.2%) | 3 (10.5%) |
| College / Associate Degree | 3 (75.0%) | 0 (0.0%) |
| Bachelor's Degree or higher | 5 (100.0%) | 0 (0.0%) |
| Total | 28 (77.8%) | 3 (7.1%) |
Employment Occupations by Sex in Lehr
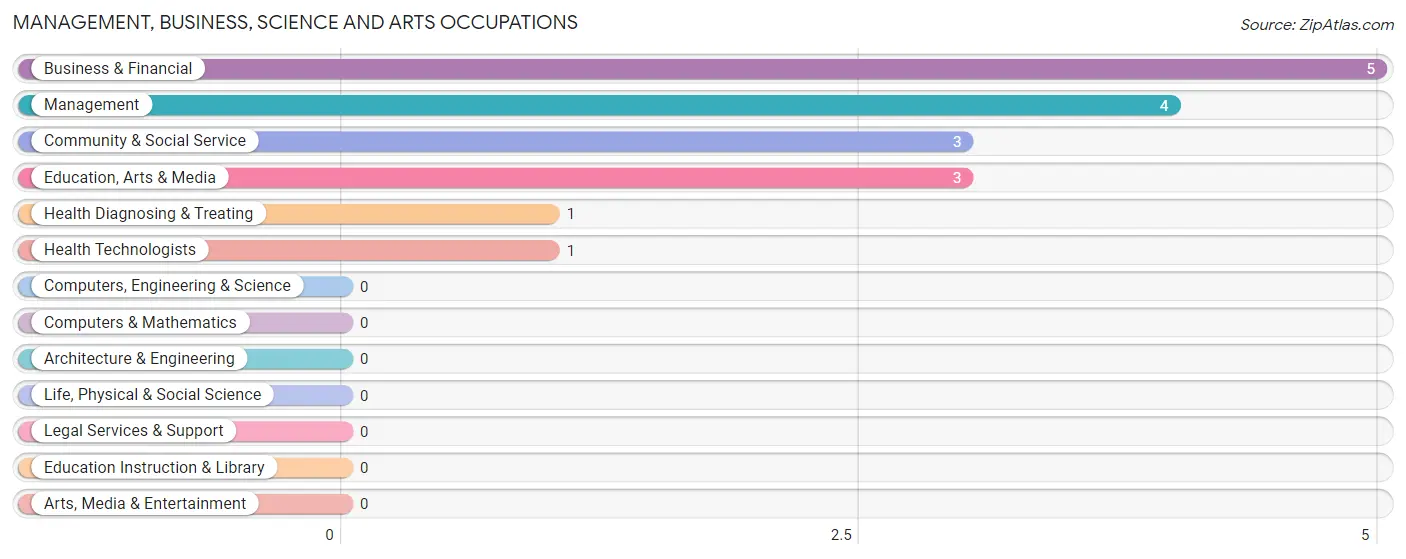
Management, Business, Science and Arts Occupations
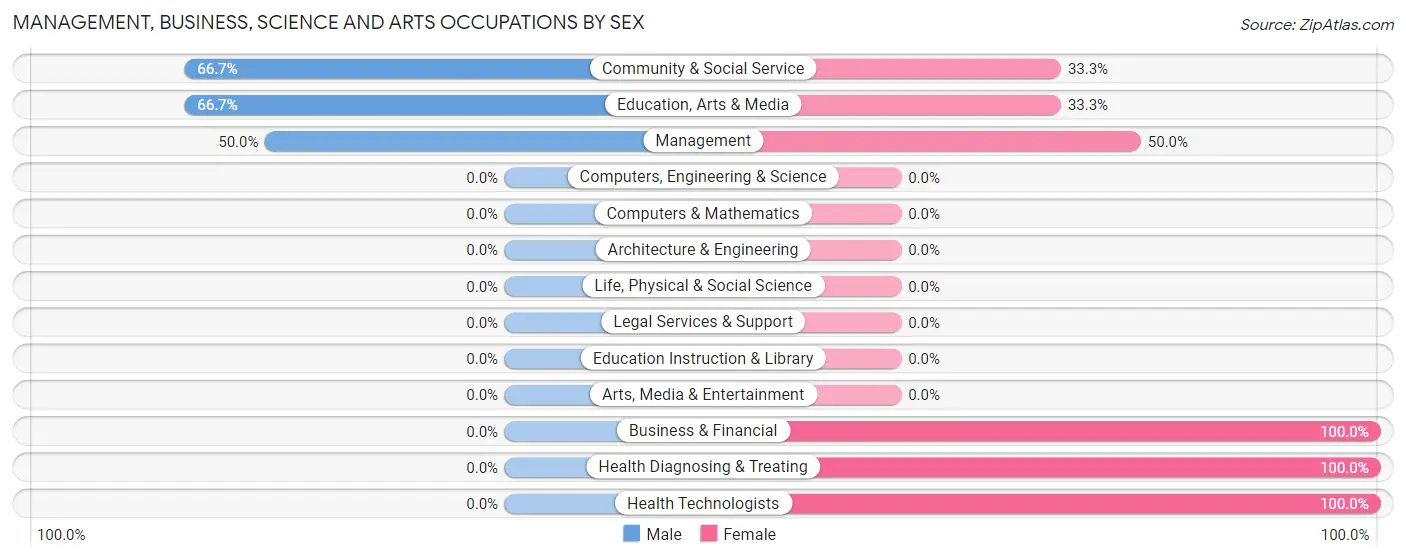
The most common Management, Business, Science and Arts occupations in Lehr are Business & Financial (5 | 11.9%), Management (4 | 9.5%), Community & Social Service (3 | 7.1%), Education, Arts & Media (3 | 7.1%), and Health Diagnosing & Treating (1 | 2.4%).
Management, Business, Science and Arts Occupations by Sex
Within the Management, Business, Science and Arts occupations in Lehr, the most male-oriented occupations are Community & Social Service (66.7%), Education, Arts & Media (66.7%), and Management (50.0%), while the most female-oriented occupations are Business & Financial (100.0%), Health Diagnosing & Treating (100.0%), and Health Technologists (100.0%).
| Occupation | Male | Female |
| Management | 2 (50.0%) | 2 (50.0%) |
| Business & Financial | 0 (0.0%) | 5 (100.0%) |
| Computers, Engineering & Science | 0 (0.0%) | 0 (0.0%) |
| Computers & Mathematics | 0 (0.0%) | 0 (0.0%) |
| Architecture & Engineering | 0 (0.0%) | 0 (0.0%) |
| Life, Physical & Social Science | 0 (0.0%) | 0 (0.0%) |
| Community & Social Service | 2 (66.7%) | 1 (33.3%) |
| Education, Arts & Media | 2 (66.7%) | 1 (33.3%) |
| Legal Services & Support | 0 (0.0%) | 0 (0.0%) |
| Education Instruction & Library | 0 (0.0%) | 0 (0.0%) |
| Arts, Media & Entertainment | 0 (0.0%) | 0 (0.0%) |
| Health Diagnosing & Treating | 0 (0.0%) | 1 (100.0%) |
| Health Technologists | 0 (0.0%) | 1 (100.0%) |
| Total (Category) | 4 (30.8%) | 9 (69.2%) |
| Total (Overall) | 18 (42.9%) | 24 (57.1%) |
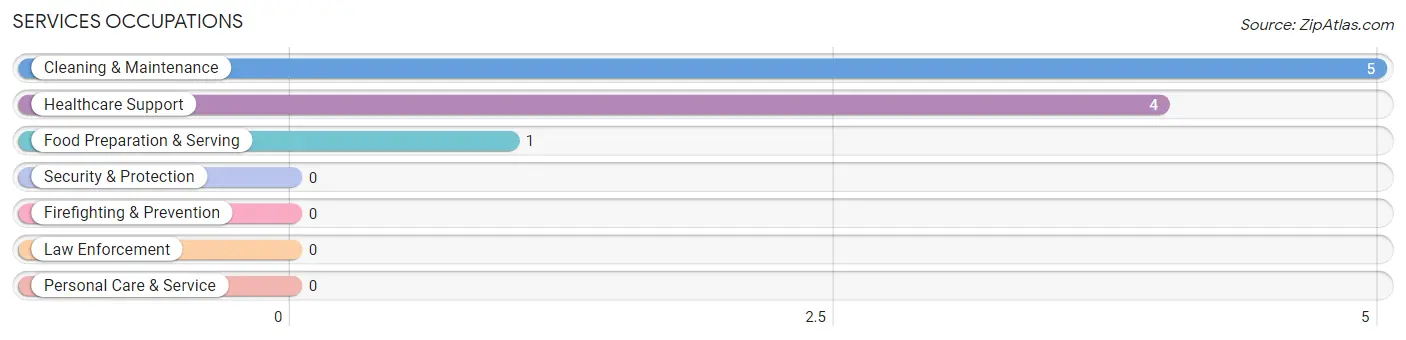
Services Occupations
The most common Services occupations in Lehr are Cleaning & Maintenance (5 | 11.9%), Healthcare Support (4 | 9.5%), and Food Preparation & Serving (1 | 2.4%).
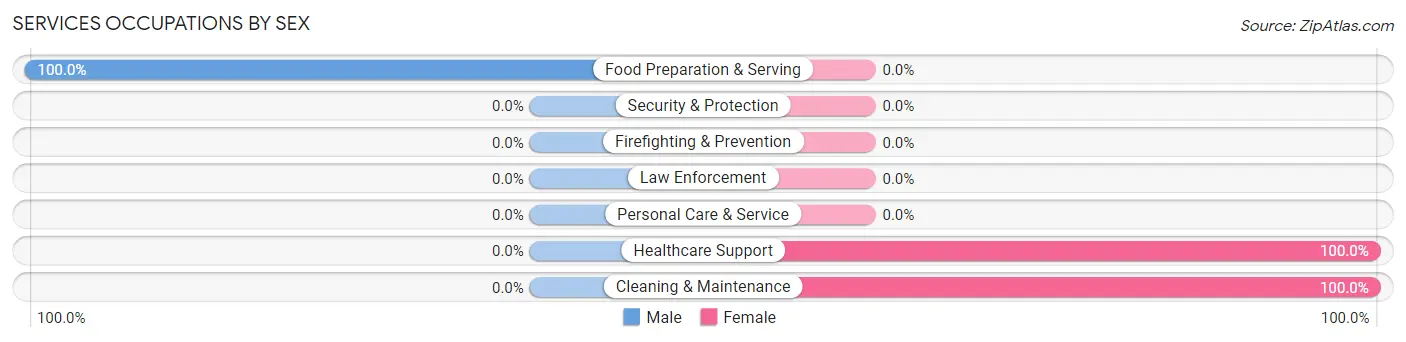
Services Occupations by Sex
| Occupation | Male | Female |
| Healthcare Support | 0 (0.0%) | 4 (100.0%) |
| Security & Protection | 0 (0.0%) | 0 (0.0%) |
| Firefighting & Prevention | 0 (0.0%) | 0 (0.0%) |
| Law Enforcement | 0 (0.0%) | 0 (0.0%) |
| Food Preparation & Serving | 1 (100.0%) | 0 (0.0%) |
| Cleaning & Maintenance | 0 (0.0%) | 5 (100.0%) |
| Personal Care & Service | 0 (0.0%) | 0 (0.0%) |
| Total (Category) | 1 (10.0%) | 9 (90.0%) |
| Total (Overall) | 18 (42.9%) | 24 (57.1%) |
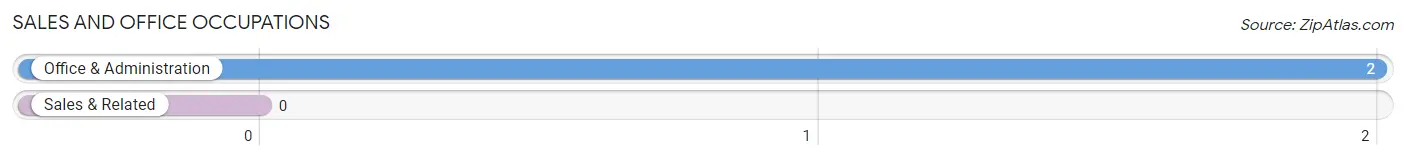
Sales and Office Occupations
The most common Sales and Office occupations in Lehr are , and Office & Administration (2 | 4.8%).
Sales and Office Occupations by Sex
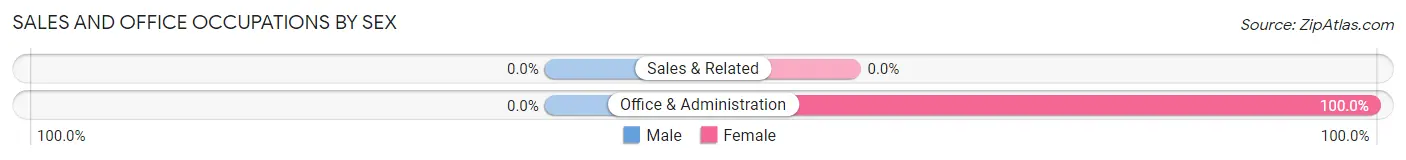
| Occupation | Male | Female |
| Sales & Related | 0 (0.0%) | 0 (0.0%) |
| Office & Administration | 0 (0.0%) | 2 (100.0%) |
| Total (Category) | 0 (0.0%) | 2 (100.0%) |
| Total (Overall) | 18 (42.9%) | 24 (57.1%) |
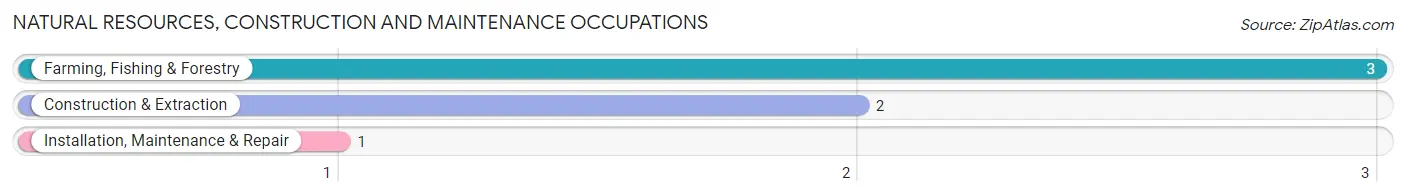
Natural Resources, Construction and Maintenance Occupations
The most common Natural Resources, Construction and Maintenance occupations in Lehr are Farming, Fishing & Forestry (3 | 7.1%), Construction & Extraction (2 | 4.8%), and Installation, Maintenance & Repair (1 | 2.4%).
Natural Resources, Construction and Maintenance Occupations by Sex
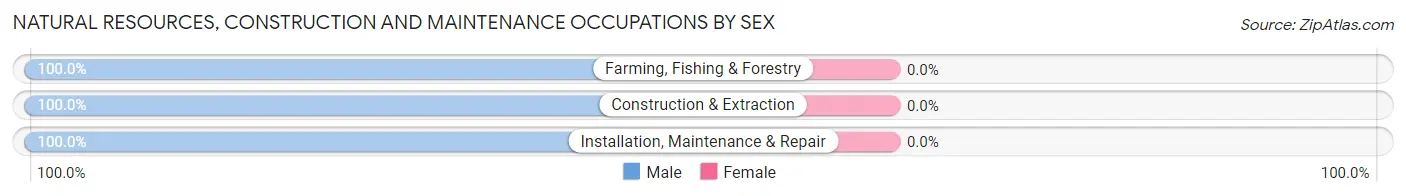
| Occupation | Male | Female |
| Farming, Fishing & Forestry | 3 (100.0%) | 0 (0.0%) |
| Construction & Extraction | 2 (100.0%) | 0 (0.0%) |
| Installation, Maintenance & Repair | 1 (100.0%) | 0 (0.0%) |
| Total (Category) | 6 (100.0%) | 0 (0.0%) |
| Total (Overall) | 18 (42.9%) | 24 (57.1%) |
Production, Transportation and Moving Occupations
The most common Production, Transportation and Moving occupations in Lehr are Transportation (7 | 16.7%), and Production (4 | 9.5%).
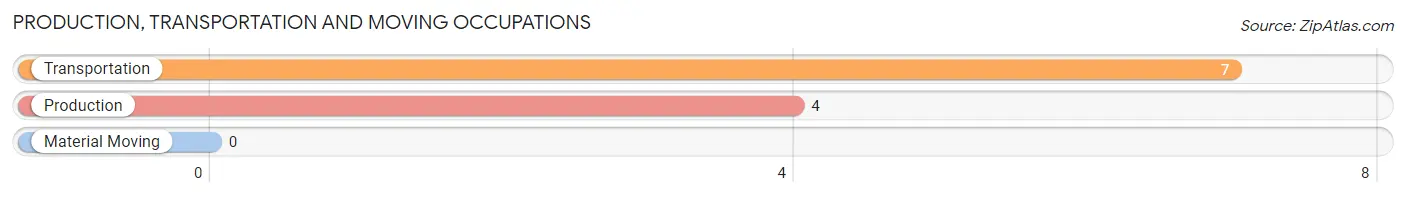
Production, Transportation and Moving Occupations by Sex
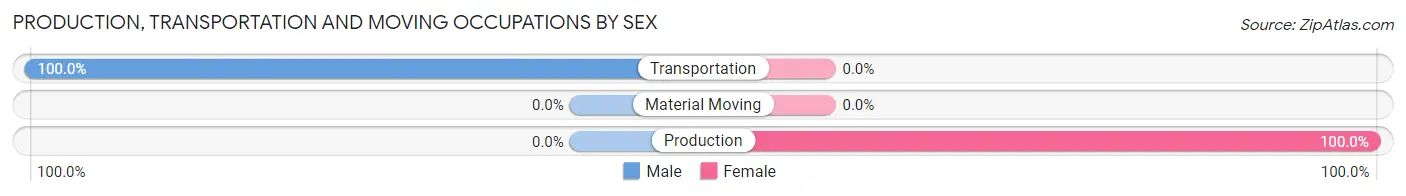
| Occupation | Male | Female |
| Production | 0 (0.0%) | 4 (100.0%) |
| Transportation | 7 (100.0%) | 0 (0.0%) |
| Material Moving | 0 (0.0%) | 0 (0.0%) |
| Total (Category) | 7 (63.6%) | 4 (36.4%) |
| Total (Overall) | 18 (42.9%) | 24 (57.1%) |
Employment Industries by Sex in Lehr
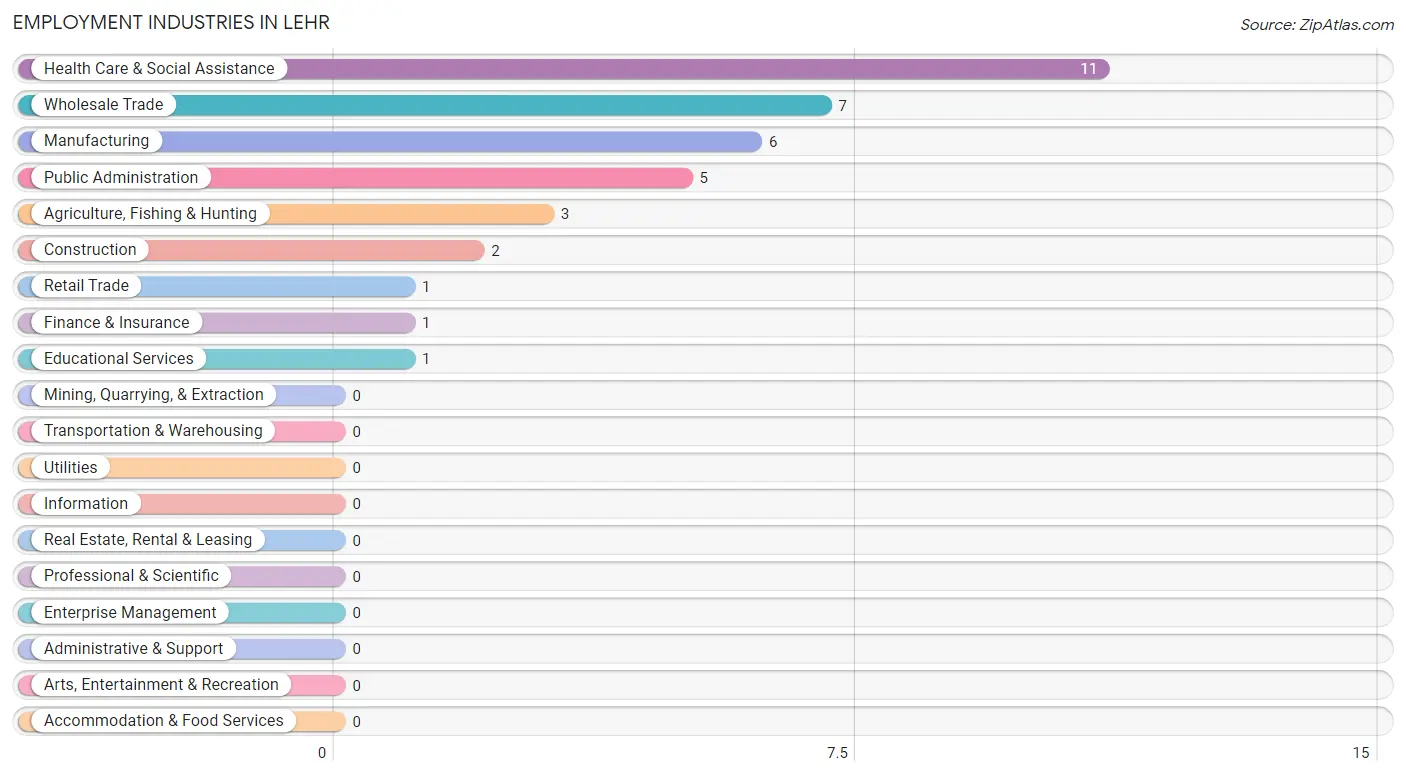
Employment Industries in Lehr
The major employment industries in Lehr include Health Care & Social Assistance (11 | 26.2%), Wholesale Trade (7 | 16.7%), Manufacturing (6 | 14.3%), Public Administration (5 | 11.9%), and Agriculture, Fishing & Hunting (3 | 7.1%).
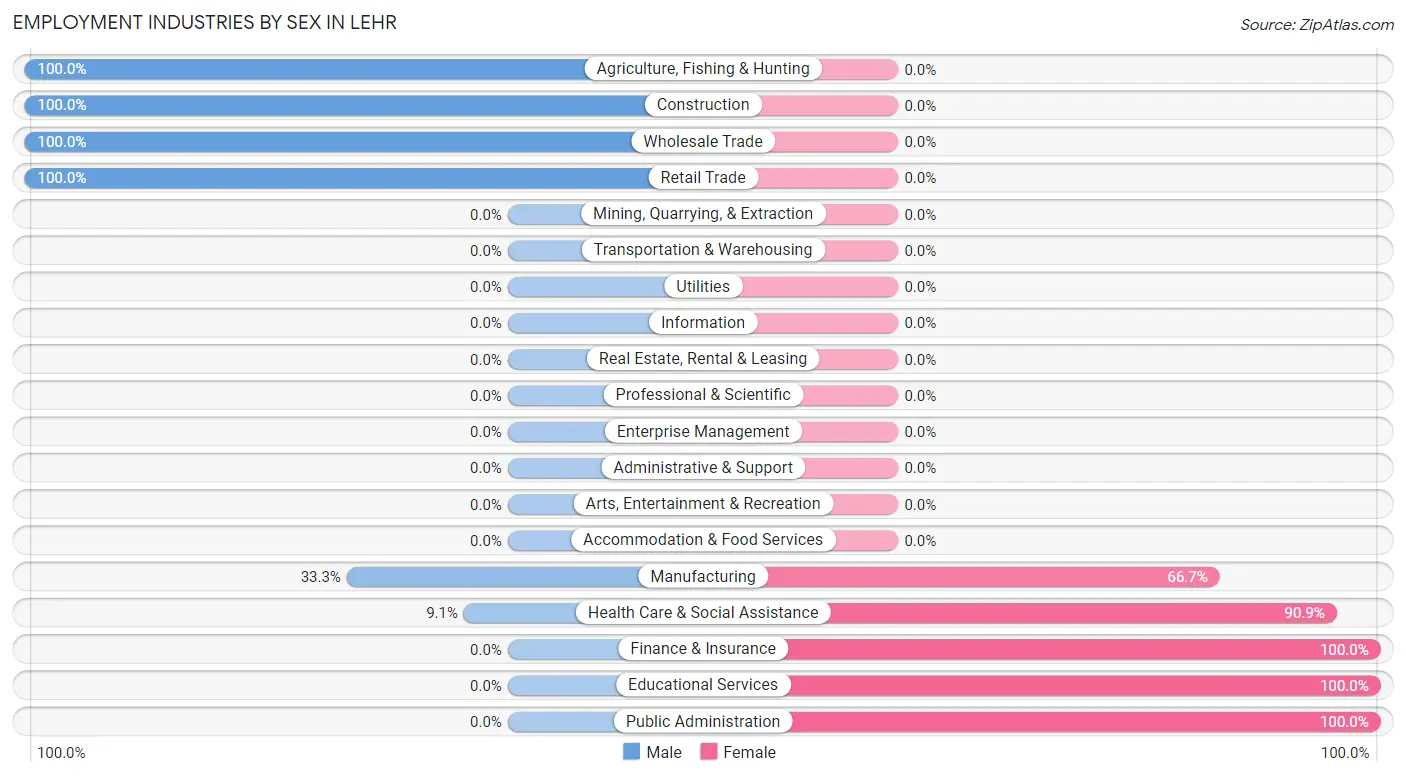
Employment Industries by Sex in Lehr
The Lehr industries that see more men than women are Agriculture, Fishing & Hunting (100.0%), Construction (100.0%), and Wholesale Trade (100.0%), whereas the industries that tend to have a higher number of women are Finance & Insurance (100.0%), Educational Services (100.0%), and Public Administration (100.0%).
| Industry | Male | Female |
| Agriculture, Fishing & Hunting | 3 (100.0%) | 0 (0.0%) |
| Mining, Quarrying, & Extraction | 0 (0.0%) | 0 (0.0%) |
| Construction | 2 (100.0%) | 0 (0.0%) |
| Manufacturing | 2 (33.3%) | 4 (66.7%) |
| Wholesale Trade | 7 (100.0%) | 0 (0.0%) |
| Retail Trade | 1 (100.0%) | 0 (0.0%) |
| Transportation & Warehousing | 0 (0.0%) | 0 (0.0%) |
| Utilities | 0 (0.0%) | 0 (0.0%) |
| Information | 0 (0.0%) | 0 (0.0%) |
| Finance & Insurance | 0 (0.0%) | 1 (100.0%) |
| Real Estate, Rental & Leasing | 0 (0.0%) | 0 (0.0%) |
| Professional & Scientific | 0 (0.0%) | 0 (0.0%) |
| Enterprise Management | 0 (0.0%) | 0 (0.0%) |
| Administrative & Support | 0 (0.0%) | 0 (0.0%) |
| Educational Services | 0 (0.0%) | 1 (100.0%) |
| Health Care & Social Assistance | 1 (9.1%) | 10 (90.9%) |
| Arts, Entertainment & Recreation | 0 (0.0%) | 0 (0.0%) |
| Accommodation & Food Services | 0 (0.0%) | 0 (0.0%) |
| Public Administration | 0 (0.0%) | 5 (100.0%) |
| Total | 18 (42.9%) | 24 (57.1%) |
Education in Lehr
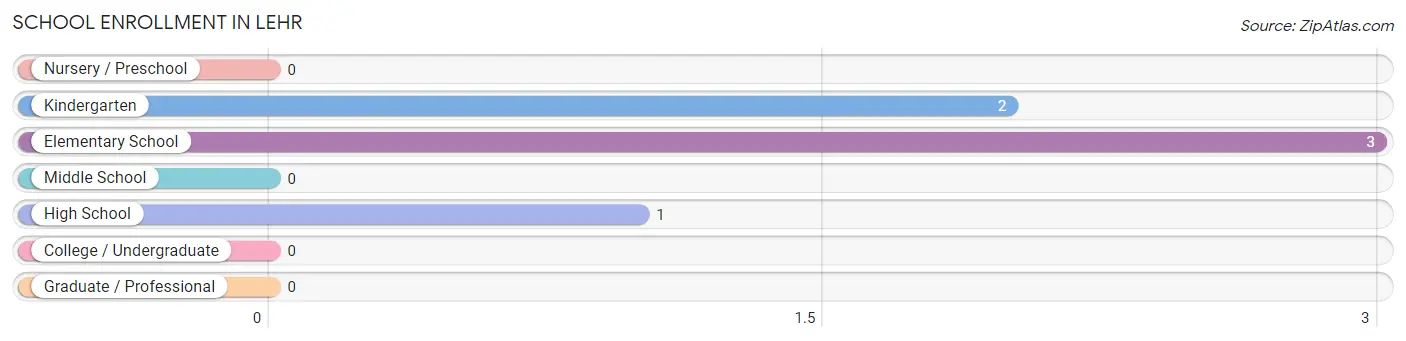
School Enrollment in Lehr
The most common levels of schooling among the 6 students in Lehr are elementary school (3 | 50.0%), kindergarten (2 | 33.3%), and high school (1 | 16.7%).
| School Level | # Students | % Students |
| Nursery / Preschool | 0 | 0.0% |
| Kindergarten | 2 | 33.3% |
| Elementary School | 3 | 50.0% |
| Middle School | 0 | 0.0% |
| High School | 1 | 16.7% |
| College / Undergraduate | 0 | 0.0% |
| Graduate / Professional | 0 | 0.0% |
| Total | 6 | 100.0% |
School Enrollment by Age by Funding Source in Lehr
Out of a total of 6 students who are enrolled in schools in Lehr, 2 (33.3%) attend a private institution, while the remaining 4 (66.7%) are enrolled in public schools. The age group of 5 to 9 year old has the highest likelihood of being enrolled in private schools, with 2 (40.0% in the age bracket) enrolled. Conversely, the age group of 15 to 17 year olds has the lowest likelihood of being enrolled in a private school, with 1 (100.0% in the age bracket) attending a public institution.
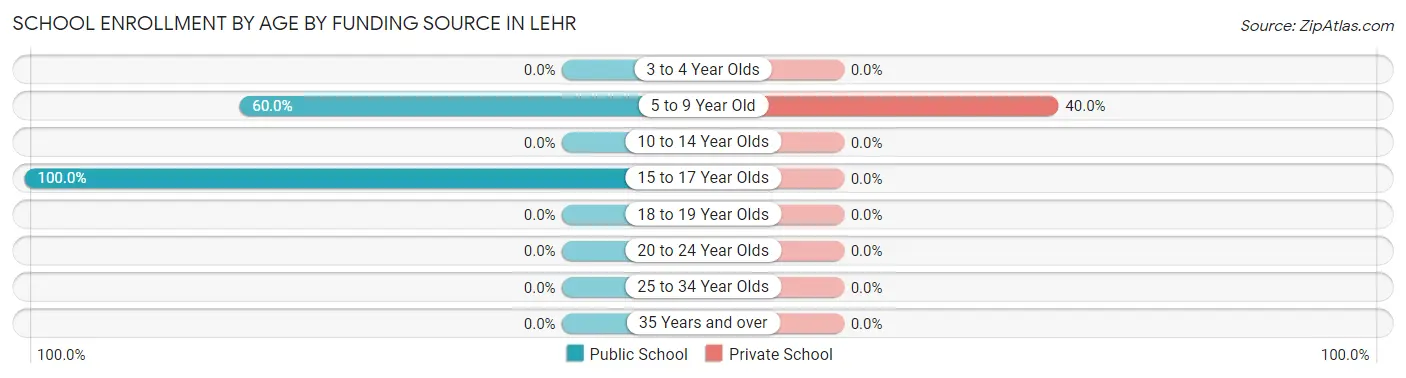
| Age Bracket | Public School | Private School |
| 3 to 4 Year Olds | 0 (0.0%) | 0 (0.0%) |
| 5 to 9 Year Old | 3 (60.0%) | 2 (40.0%) |
| 10 to 14 Year Olds | 0 (0.0%) | 0 (0.0%) |
| 15 to 17 Year Olds | 1 (100.0%) | 0 (0.0%) |
| 18 to 19 Year Olds | 0 (0.0%) | 0 (0.0%) |
| 20 to 24 Year Olds | 0 (0.0%) | 0 (0.0%) |
| 25 to 34 Year Olds | 0 (0.0%) | 0 (0.0%) |
| 35 Years and over | 0 (0.0%) | 0 (0.0%) |
| Total | 4 (66.7%) | 2 (33.3%) |
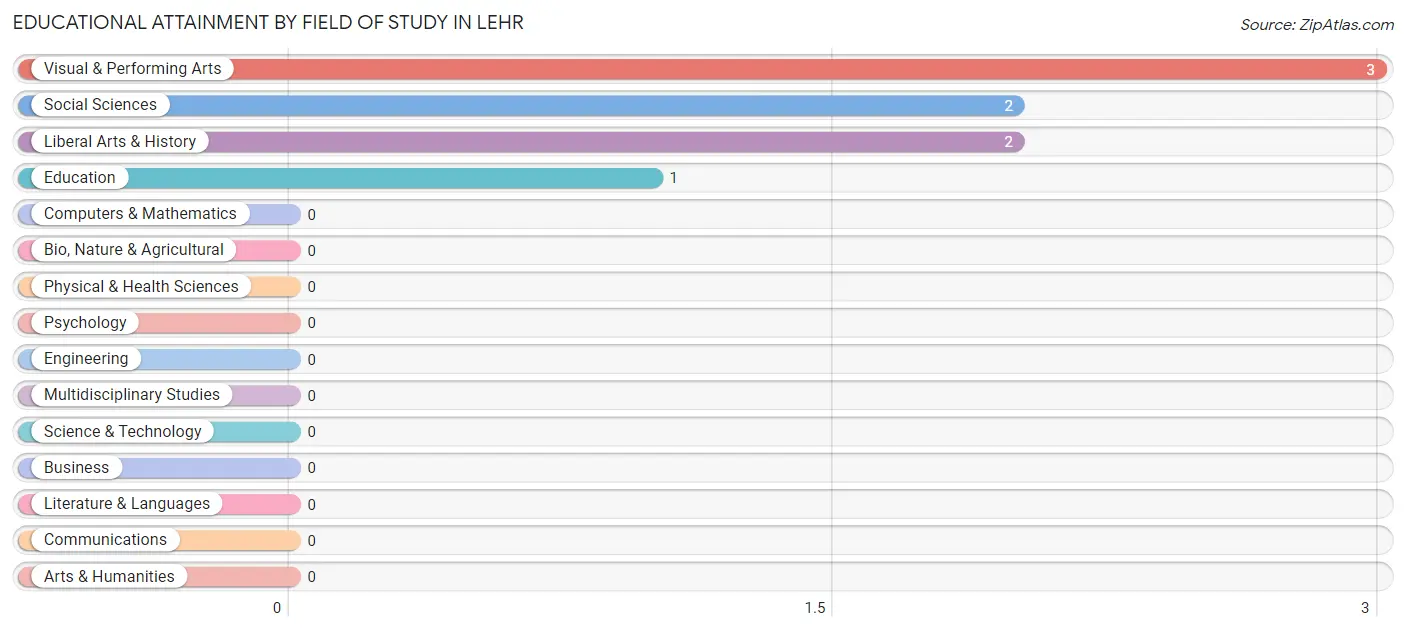
Educational Attainment by Field of Study in Lehr
Visual & performing arts (3 | 37.5%), social sciences (2 | 25.0%), liberal arts & history (2 | 25.0%), and education (1 | 12.5%) are the most common fields of study among 8 individuals in Lehr who have obtained a bachelor's degree or higher.
| Field of Study | # Graduates | % Graduates |
| Computers & Mathematics | 0 | 0.0% |
| Bio, Nature & Agricultural | 0 | 0.0% |
| Physical & Health Sciences | 0 | 0.0% |
| Psychology | 0 | 0.0% |
| Social Sciences | 2 | 25.0% |
| Engineering | 0 | 0.0% |
| Multidisciplinary Studies | 0 | 0.0% |
| Science & Technology | 0 | 0.0% |
| Business | 0 | 0.0% |
| Education | 1 | 12.5% |
| Literature & Languages | 0 | 0.0% |
| Liberal Arts & History | 2 | 25.0% |
| Visual & Performing Arts | 3 | 37.5% |
| Communications | 0 | 0.0% |
| Arts & Humanities | 0 | 0.0% |
| Total | 8 | 100.0% |
Transportation & Commute in Lehr
Vehicle Availability by Sex in Lehr
The most prevalent vehicle ownership categories in Lehr are males with 1 vehicle (8, accounting for 44.4%) and females with 1 vehicle (8, making up 33.3%).
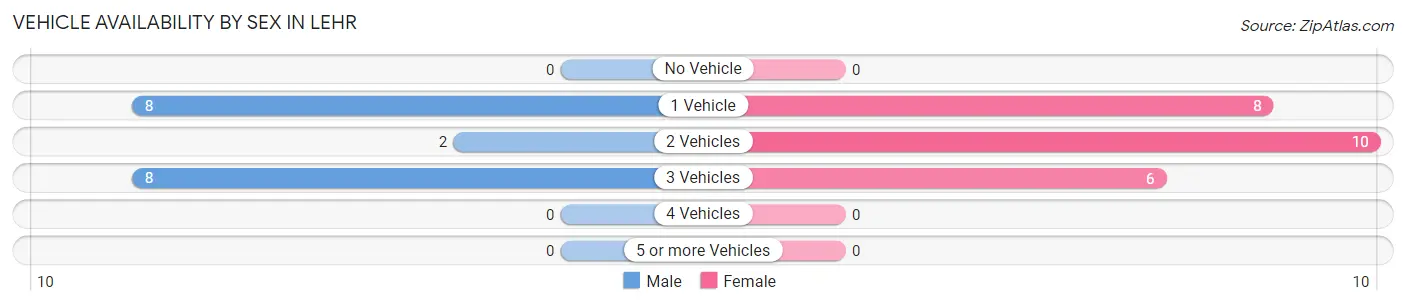
| Vehicles Available | Male | Female |
| No Vehicle | 0 (0.0%) | 0 (0.0%) |
| 1 Vehicle | 8 (44.4%) | 8 (33.3%) |
| 2 Vehicles | 2 (11.1%) | 10 (41.7%) |
| 3 Vehicles | 8 (44.4%) | 6 (25.0%) |
| 4 Vehicles | 0 (0.0%) | 0 (0.0%) |
| 5 or more Vehicles | 0 (0.0%) | 0 (0.0%) |
| Total | 18 (100.0%) | 24 (100.0%) |
Commute Time in Lehr
The most frequently occuring commute durations in Lehr are 15 to 19 minutes (13 commuters, 41.9%), less than 5 minutes (8 commuters, 25.8%), and 5 to 9 minutes (4 commuters, 12.9%).
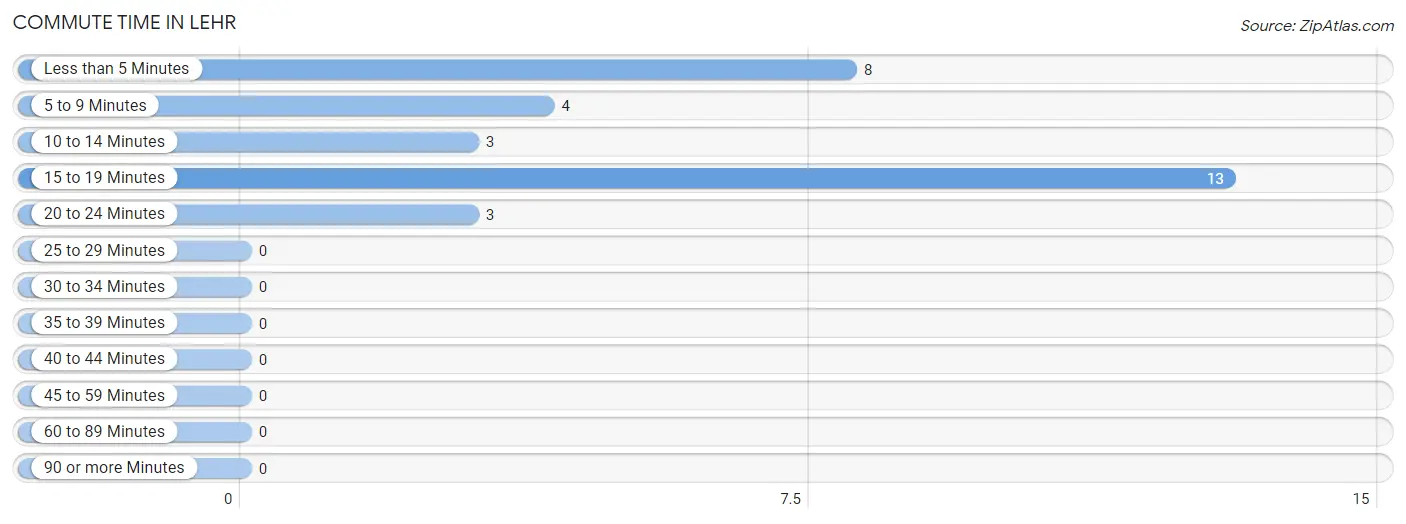
| Commute Time | # Commuters | % Commuters |
| Less than 5 Minutes | 8 | 25.8% |
| 5 to 9 Minutes | 4 | 12.9% |
| 10 to 14 Minutes | 3 | 9.7% |
| 15 to 19 Minutes | 13 | 41.9% |
| 20 to 24 Minutes | 3 | 9.7% |
| 25 to 29 Minutes | 0 | 0.0% |
| 30 to 34 Minutes | 0 | 0.0% |
| 35 to 39 Minutes | 0 | 0.0% |
| 40 to 44 Minutes | 0 | 0.0% |
| 45 to 59 Minutes | 0 | 0.0% |
| 60 to 89 Minutes | 0 | 0.0% |
| 90 or more Minutes | 0 | 0.0% |
Commute Time by Sex in Lehr
The most common commute times in Lehr are 15 to 19 minutes (7 commuters, 43.8%) for males and 15 to 19 minutes (6 commuters, 40.0%) for females.
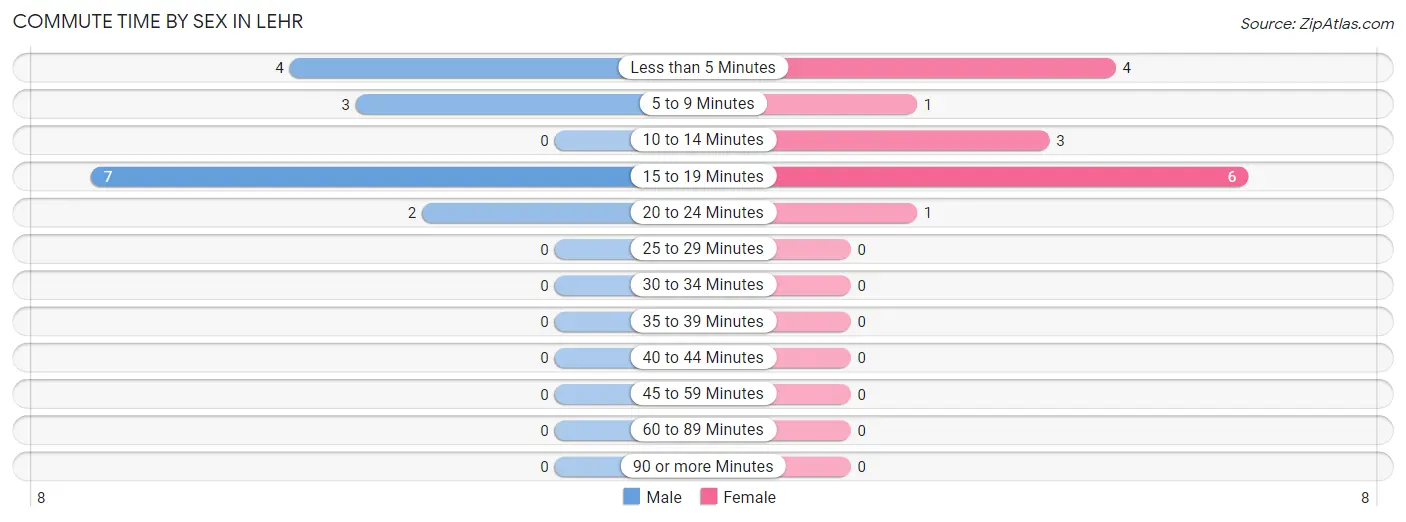
| Commute Time | Male | Female |
| Less than 5 Minutes | 4 (25.0%) | 4 (26.7%) |
| 5 to 9 Minutes | 3 (18.8%) | 1 (6.7%) |
| 10 to 14 Minutes | 0 (0.0%) | 3 (20.0%) |
| 15 to 19 Minutes | 7 (43.8%) | 6 (40.0%) |
| 20 to 24 Minutes | 2 (12.5%) | 1 (6.7%) |
| 25 to 29 Minutes | 0 (0.0%) | 0 (0.0%) |
| 30 to 34 Minutes | 0 (0.0%) | 0 (0.0%) |
| 35 to 39 Minutes | 0 (0.0%) | 0 (0.0%) |
| 40 to 44 Minutes | 0 (0.0%) | 0 (0.0%) |
| 45 to 59 Minutes | 0 (0.0%) | 0 (0.0%) |
| 60 to 89 Minutes | 0 (0.0%) | 0 (0.0%) |
| 90 or more Minutes | 0 (0.0%) | 0 (0.0%) |
Time of Departure to Work by Sex in Lehr
The most frequent times of departure to work in Lehr are 5:30 AM to 5:59 AM (6, 37.5%) for males and 5:00 AM to 5:29 AM (6, 40.0%) for females.
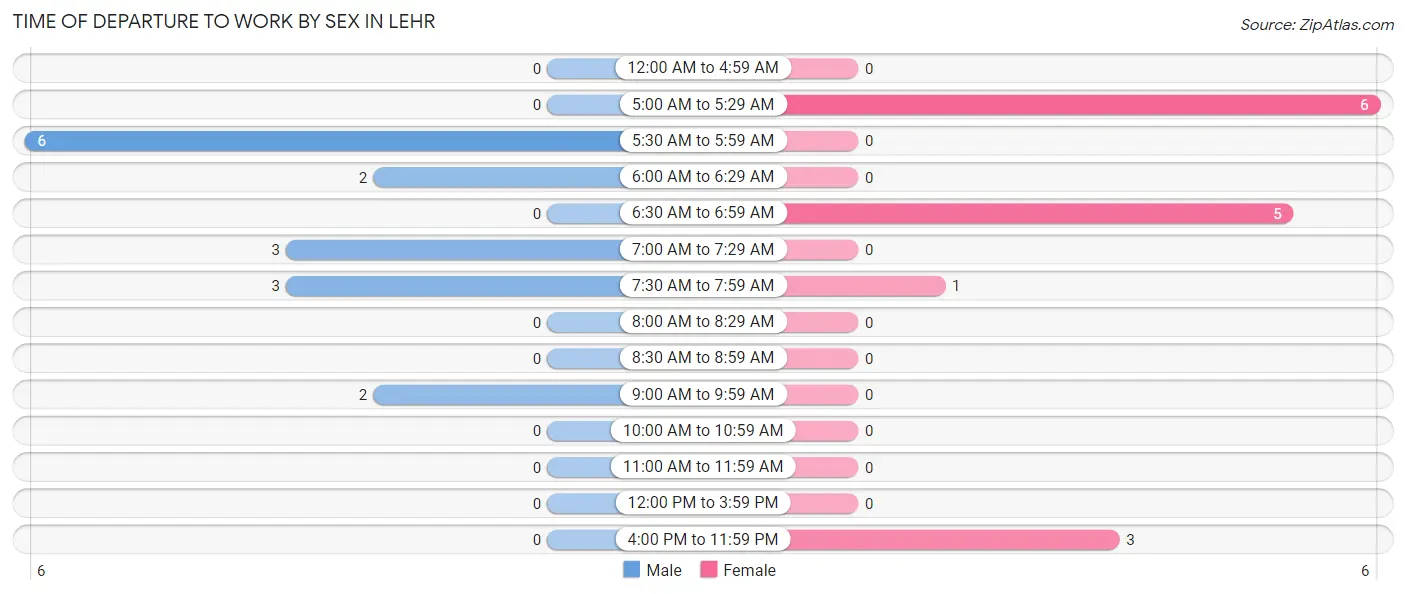
| Time of Departure | Male | Female |
| 12:00 AM to 4:59 AM | 0 (0.0%) | 0 (0.0%) |
| 5:00 AM to 5:29 AM | 0 (0.0%) | 6 (40.0%) |
| 5:30 AM to 5:59 AM | 6 (37.5%) | 0 (0.0%) |
| 6:00 AM to 6:29 AM | 2 (12.5%) | 0 (0.0%) |
| 6:30 AM to 6:59 AM | 0 (0.0%) | 5 (33.3%) |
| 7:00 AM to 7:29 AM | 3 (18.8%) | 0 (0.0%) |
| 7:30 AM to 7:59 AM | 3 (18.8%) | 1 (6.7%) |
| 8:00 AM to 8:29 AM | 0 (0.0%) | 0 (0.0%) |
| 8:30 AM to 8:59 AM | 0 (0.0%) | 0 (0.0%) |
| 9:00 AM to 9:59 AM | 2 (12.5%) | 0 (0.0%) |
| 10:00 AM to 10:59 AM | 0 (0.0%) | 0 (0.0%) |
| 11:00 AM to 11:59 AM | 0 (0.0%) | 0 (0.0%) |
| 12:00 PM to 3:59 PM | 0 (0.0%) | 0 (0.0%) |
| 4:00 PM to 11:59 PM | 0 (0.0%) | 3 (20.0%) |
| Total | 16 (100.0%) | 15 (100.0%) |
Housing Occupancy in Lehr
Occupancy by Ownership in Lehr
Of the total 40 dwellings in Lehr, owner-occupied units account for 31 (77.5%), while renter-occupied units make up 9 (22.5%).
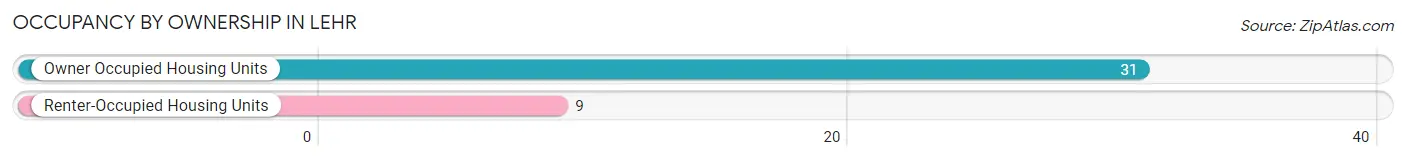
| Occupancy | # Housing Units | % Housing Units |
| Owner Occupied Housing Units | 31 | 77.5% |
| Renter-Occupied Housing Units | 9 | 22.5% |
| Total Occupied Housing Units | 40 | 100.0% |
Occupancy by Household Size in Lehr
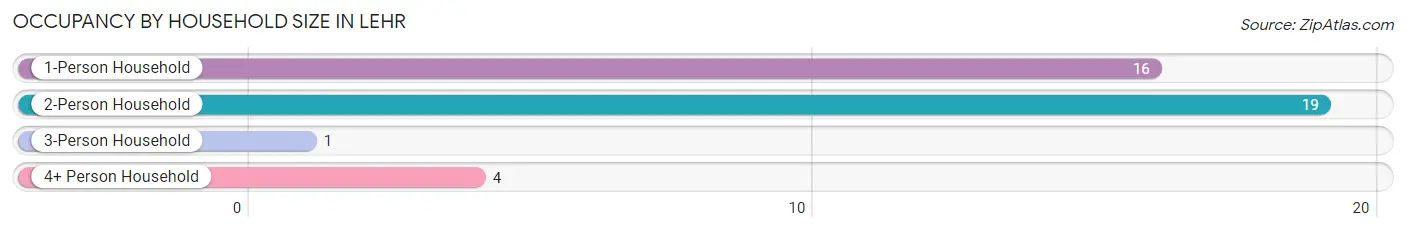
| Household Size | # Housing Units | % Housing Units |
| 1-Person Household | 16 | 40.0% |
| 2-Person Household | 19 | 47.5% |
| 3-Person Household | 1 | 2.5% |
| 4+ Person Household | 4 | 10.0% |
| Total Housing Units | 40 | 100.0% |
Occupancy by Ownership by Household Size in Lehr
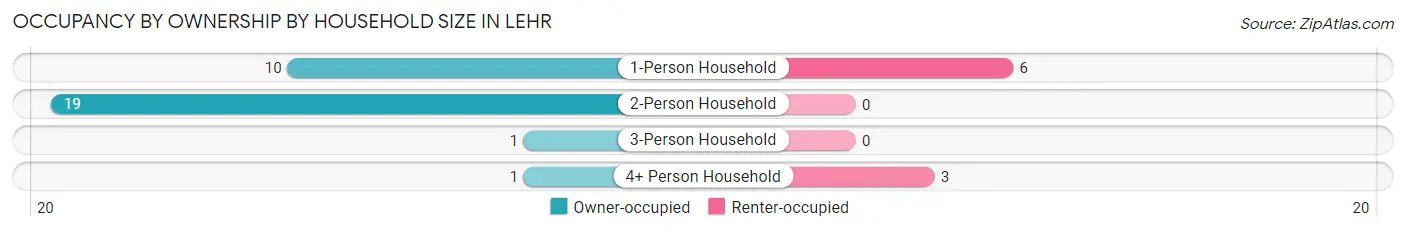
| Household Size | Owner-occupied | Renter-occupied |
| 1-Person Household | 10 (62.5%) | 6 (37.5%) |
| 2-Person Household | 19 (100.0%) | 0 (0.0%) |
| 3-Person Household | 1 (100.0%) | 0 (0.0%) |
| 4+ Person Household | 1 (25.0%) | 3 (75.0%) |
| Total Housing Units | 31 (77.5%) | 9 (22.5%) |
Occupancy by Educational Attainment in Lehr
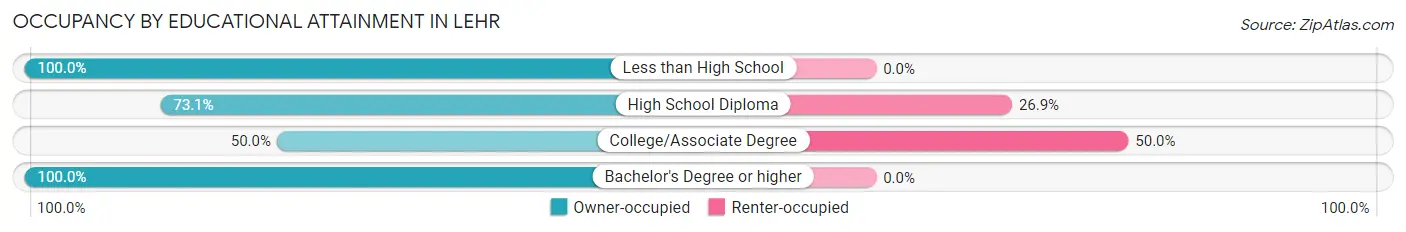
| Household Size | Owner-occupied | Renter-occupied |
| Less than High School | 4 (100.0%) | 0 (0.0%) |
| High School Diploma | 19 (73.1%) | 7 (26.9%) |
| College/Associate Degree | 2 (50.0%) | 2 (50.0%) |
| Bachelor's Degree or higher | 6 (100.0%) | 0 (0.0%) |
Occupancy by Age of Householder in Lehr
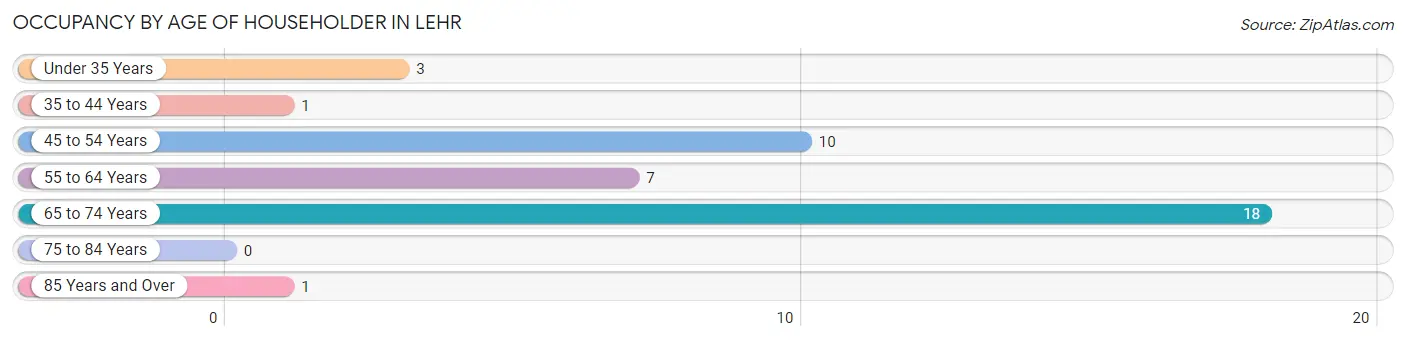
| Age Bracket | # Households | % Households |
| Under 35 Years | 3 | 7.5% |
| 35 to 44 Years | 1 | 2.5% |
| 45 to 54 Years | 10 | 25.0% |
| 55 to 64 Years | 7 | 17.5% |
| 65 to 74 Years | 18 | 45.0% |
| 75 to 84 Years | 0 | 0.0% |
| 85 Years and Over | 1 | 2.5% |
| Total | 40 | 100.0% |
Housing Finances in Lehr
Median Income by Occupancy in Lehr
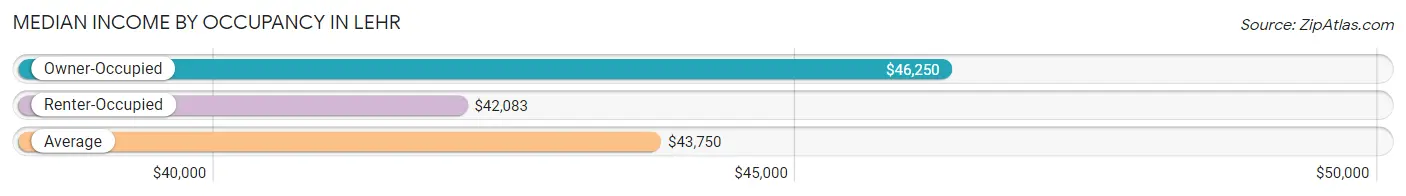
| Occupancy Type | # Households | Median Income |
| Owner-Occupied | 31 (77.5%) | $46,250 |
| Renter-Occupied | 9 (22.5%) | $42,083 |
| Average | 40 (100.0%) | $43,750 |
Occupancy by Householder Income Bracket in Lehr
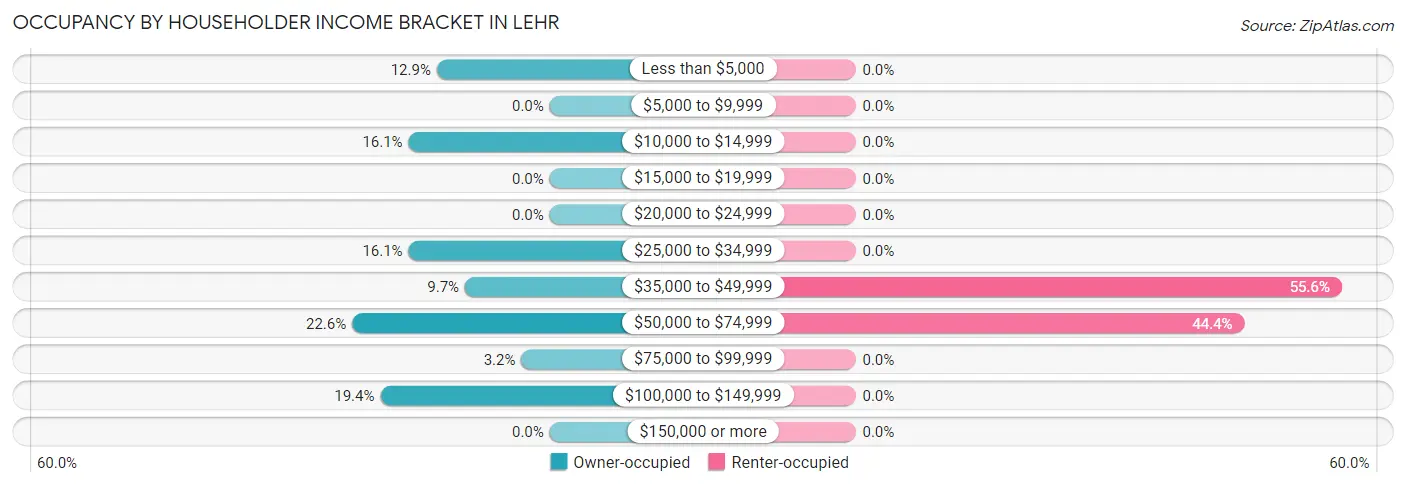
| Income Bracket | Owner-occupied | Renter-occupied |
| Less than $5,000 | 4 (12.9%) | 0 (0.0%) |
| $5,000 to $9,999 | 0 (0.0%) | 0 (0.0%) |
| $10,000 to $14,999 | 5 (16.1%) | 0 (0.0%) |
| $15,000 to $19,999 | 0 (0.0%) | 0 (0.0%) |
| $20,000 to $24,999 | 0 (0.0%) | 0 (0.0%) |
| $25,000 to $34,999 | 5 (16.1%) | 0 (0.0%) |
| $35,000 to $49,999 | 3 (9.7%) | 5 (55.6%) |
| $50,000 to $74,999 | 7 (22.6%) | 4 (44.4%) |
| $75,000 to $99,999 | 1 (3.2%) | 0 (0.0%) |
| $100,000 to $149,999 | 6 (19.4%) | 0 (0.0%) |
| $150,000 or more | 0 (0.0%) | 0 (0.0%) |
| Total | 31 (100.0%) | 9 (100.0%) |
Monthly Housing Cost Tiers in Lehr
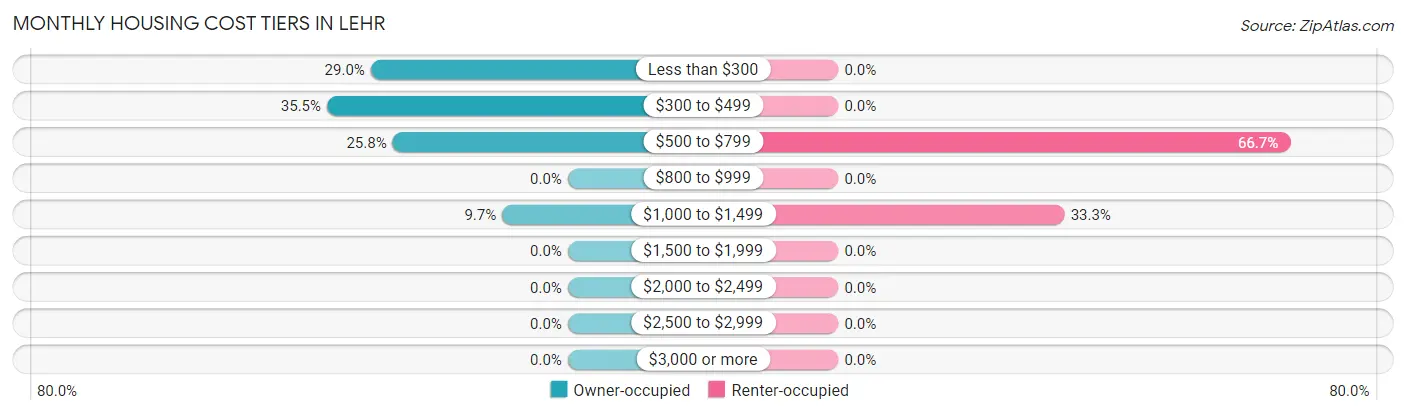
| Monthly Cost | Owner-occupied | Renter-occupied |
| Less than $300 | 9 (29.0%) | 0 (0.0%) |
| $300 to $499 | 11 (35.5%) | 0 (0.0%) |
| $500 to $799 | 8 (25.8%) | 6 (66.7%) |
| $800 to $999 | 0 (0.0%) | 0 (0.0%) |
| $1,000 to $1,499 | 3 (9.7%) | 3 (33.3%) |
| $1,500 to $1,999 | 0 (0.0%) | 0 (0.0%) |
| $2,000 to $2,499 | 0 (0.0%) | 0 (0.0%) |
| $2,500 to $2,999 | 0 (0.0%) | 0 (0.0%) |
| $3,000 or more | 0 (0.0%) | 0 (0.0%) |
| Total | 31 (100.0%) | 9 (100.0%) |
Physical Housing Characteristics in Lehr
Housing Structures in Lehr
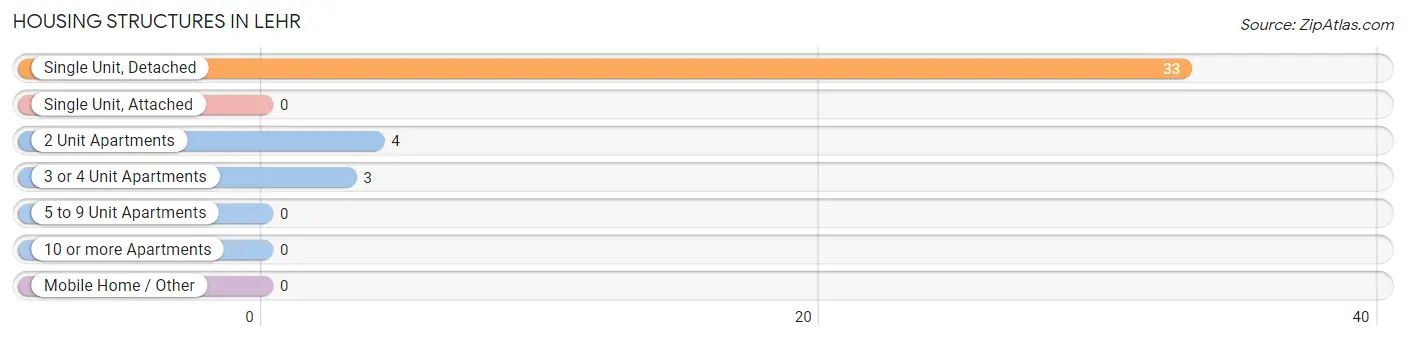
| Structure Type | # Housing Units | % Housing Units |
| Single Unit, Detached | 33 | 82.5% |
| Single Unit, Attached | 0 | 0.0% |
| 2 Unit Apartments | 4 | 10.0% |
| 3 or 4 Unit Apartments | 3 | 7.5% |
| 5 to 9 Unit Apartments | 0 | 0.0% |
| 10 or more Apartments | 0 | 0.0% |
| Mobile Home / Other | 0 | 0.0% |
| Total | 40 | 100.0% |
Housing Structures by Occupancy in Lehr
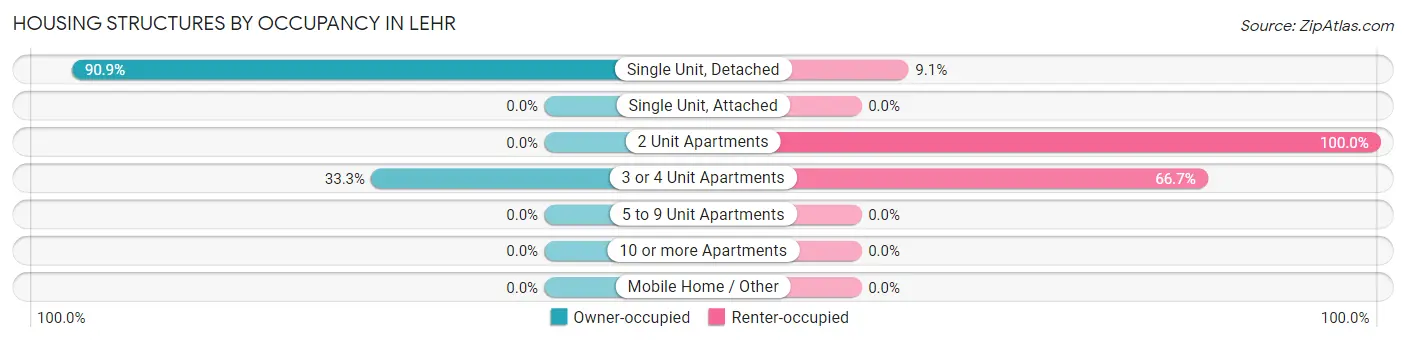
| Structure Type | Owner-occupied | Renter-occupied |
| Single Unit, Detached | 30 (90.9%) | 3 (9.1%) |
| Single Unit, Attached | 0 (0.0%) | 0 (0.0%) |
| 2 Unit Apartments | 0 (0.0%) | 4 (100.0%) |
| 3 or 4 Unit Apartments | 1 (33.3%) | 2 (66.7%) |
| 5 to 9 Unit Apartments | 0 (0.0%) | 0 (0.0%) |
| 10 or more Apartments | 0 (0.0%) | 0 (0.0%) |
| Mobile Home / Other | 0 (0.0%) | 0 (0.0%) |
| Total | 31 (77.5%) | 9 (22.5%) |
Housing Structures by Number of Rooms in Lehr
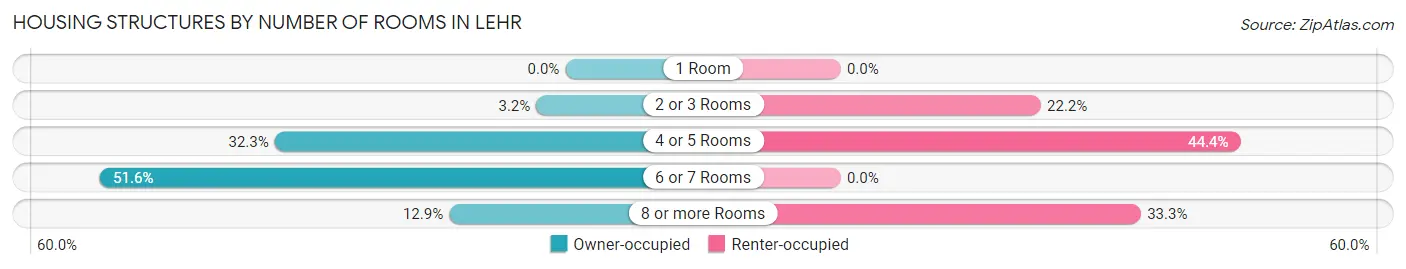
| Number of Rooms | Owner-occupied | Renter-occupied |
| 1 Room | 0 (0.0%) | 0 (0.0%) |
| 2 or 3 Rooms | 1 (3.2%) | 2 (22.2%) |
| 4 or 5 Rooms | 10 (32.3%) | 4 (44.4%) |
| 6 or 7 Rooms | 16 (51.6%) | 0 (0.0%) |
| 8 or more Rooms | 4 (12.9%) | 3 (33.3%) |
| Total | 31 (100.0%) | 9 (100.0%) |
Housing Structure by Heating Type in Lehr
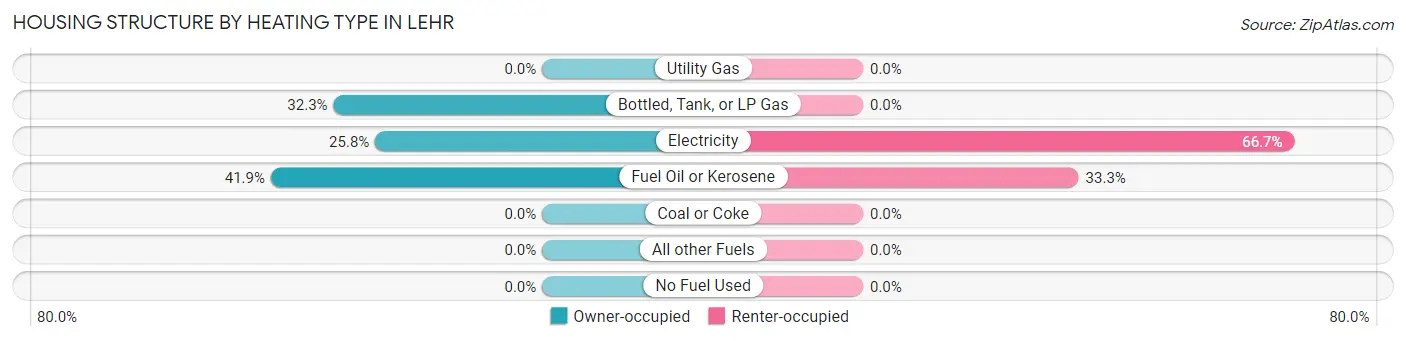
| Heating Type | Owner-occupied | Renter-occupied |
| Utility Gas | 0 (0.0%) | 0 (0.0%) |
| Bottled, Tank, or LP Gas | 10 (32.3%) | 0 (0.0%) |
| Electricity | 8 (25.8%) | 6 (66.7%) |
| Fuel Oil or Kerosene | 13 (41.9%) | 3 (33.3%) |
| Coal or Coke | 0 (0.0%) | 0 (0.0%) |
| All other Fuels | 0 (0.0%) | 0 (0.0%) |
| No Fuel Used | 0 (0.0%) | 0 (0.0%) |
| Total | 31 (100.0%) | 9 (100.0%) |
Household Vehicle Usage in Lehr
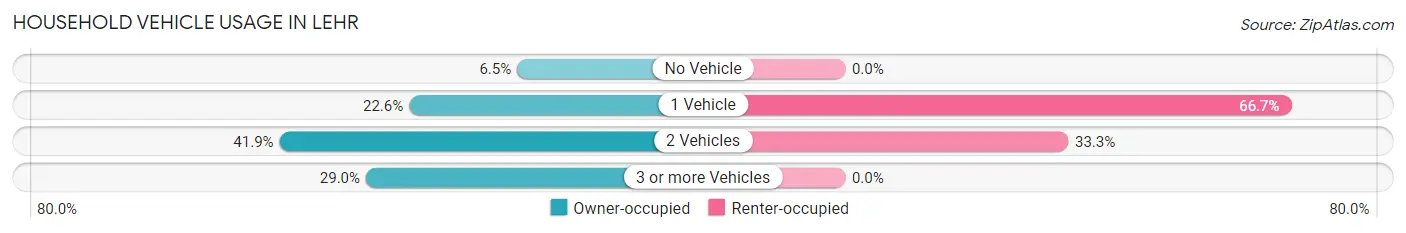
| Vehicles per Household | Owner-occupied | Renter-occupied |
| No Vehicle | 2 (6.5%) | 0 (0.0%) |
| 1 Vehicle | 7 (22.6%) | 6 (66.7%) |
| 2 Vehicles | 13 (41.9%) | 3 (33.3%) |
| 3 or more Vehicles | 9 (29.0%) | 0 (0.0%) |
| Total | 31 (100.0%) | 9 (100.0%) |
Real Estate & Mortgages in Lehr
Real Estate and Mortgage Overview in Lehr
| Characteristic | Without Mortgage | With Mortgage |
| Housing Units | 27 | 4 |
| Median Property Value | $47,500 | $0 |
| Median Household Income | $48,750 | $0 |
| Monthly Housing Costs | $345 | $0 |
| Real Estate Taxes | $500 | $0 |
Property Value by Mortgage Status in Lehr
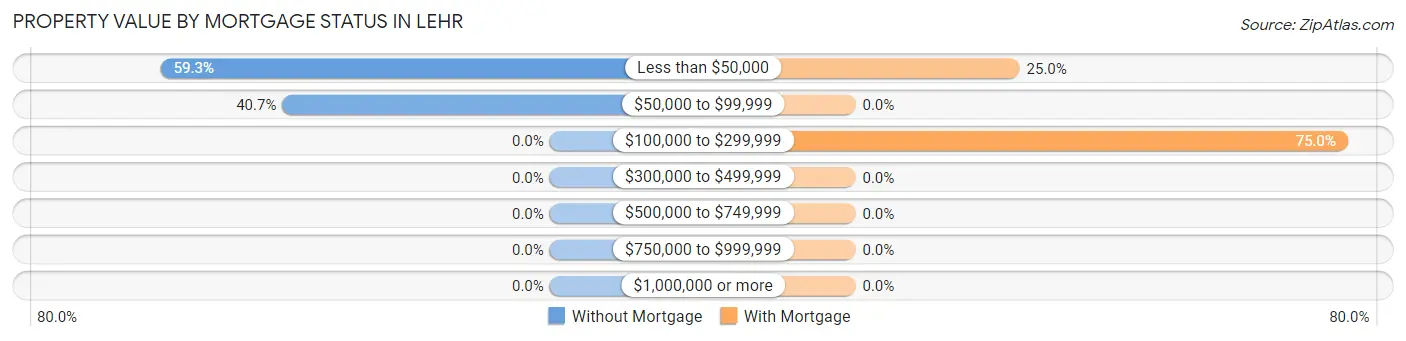
| Property Value | Without Mortgage | With Mortgage |
| Less than $50,000 | 16 (59.3%) | 1 (25.0%) |
| $50,000 to $99,999 | 11 (40.7%) | 0 (0.0%) |
| $100,000 to $299,999 | 0 (0.0%) | 3 (75.0%) |
| $300,000 to $499,999 | 0 (0.0%) | 0 (0.0%) |
| $500,000 to $749,999 | 0 (0.0%) | 0 (0.0%) |
| $750,000 to $999,999 | 0 (0.0%) | 0 (0.0%) |
| $1,000,000 or more | 0 (0.0%) | 0 (0.0%) |
| Total | 27 (100.0%) | 4 (100.0%) |
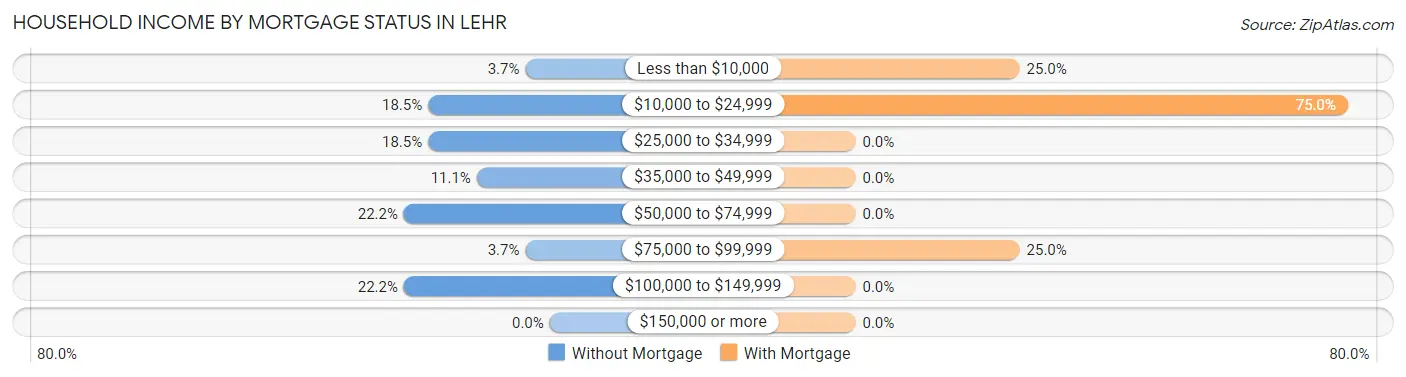
Household Income by Mortgage Status in Lehr
| Household Income | Without Mortgage | With Mortgage |
| Less than $10,000 | 1 (3.7%) | 1 (25.0%) |
| $10,000 to $24,999 | 5 (18.5%) | 3 (75.0%) |
| $25,000 to $34,999 | 5 (18.5%) | 0 (0.0%) |
| $35,000 to $49,999 | 3 (11.1%) | 0 (0.0%) |
| $50,000 to $74,999 | 6 (22.2%) | 0 (0.0%) |
| $75,000 to $99,999 | 1 (3.7%) | 1 (25.0%) |
| $100,000 to $149,999 | 6 (22.2%) | 0 (0.0%) |
| $150,000 or more | 0 (0.0%) | 0 (0.0%) |
| Total | 27 (100.0%) | 4 (100.0%) |
Property Value to Household Income Ratio in Lehr
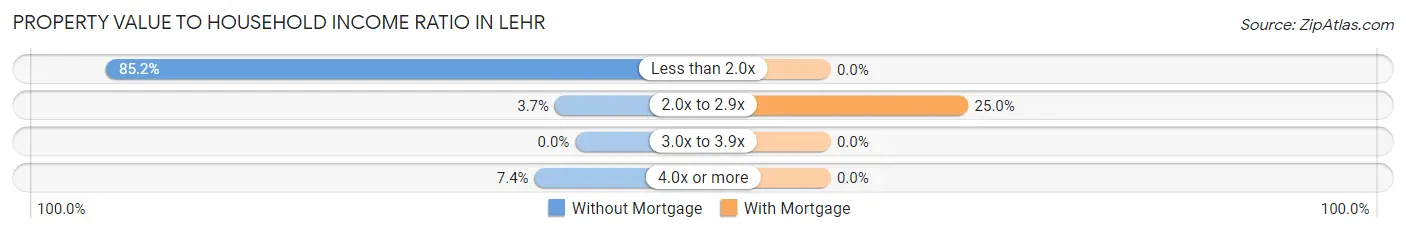
| Value-to-Income Ratio | Without Mortgage | With Mortgage |
| Less than 2.0x | 23 (85.2%) | 0 (0.0%) |
| 2.0x to 2.9x | 1 (3.7%) | 1 (25.0%) |
| 3.0x to 3.9x | 0 (0.0%) | 0 (0.0%) |
| 4.0x or more | 2 (7.4%) | 0 (0.0%) |
| Total | 27 (100.0%) | 4 (100.0%) |
Real Estate Taxes by Mortgage Status in Lehr
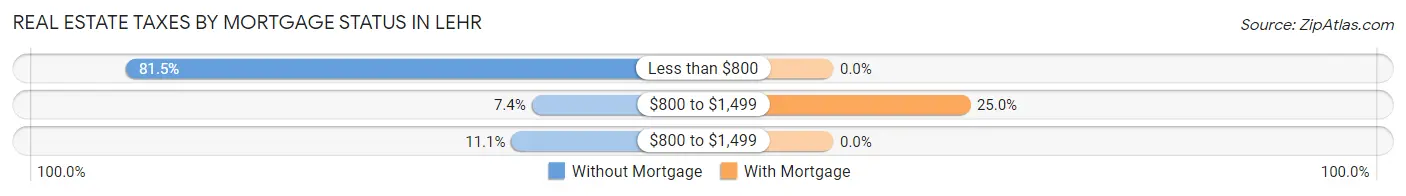
| Property Taxes | Without Mortgage | With Mortgage |
| Less than $800 | 22 (81.5%) | 0 (0.0%) |
| $800 to $1,499 | 2 (7.4%) | 1 (25.0%) |
| $800 to $1,499 | 3 (11.1%) | 0 (0.0%) |
| Total | 27 (100.0%) | 4 (100.0%) |
Health & Disability in Lehr
Health Insurance Coverage by Age in Lehr
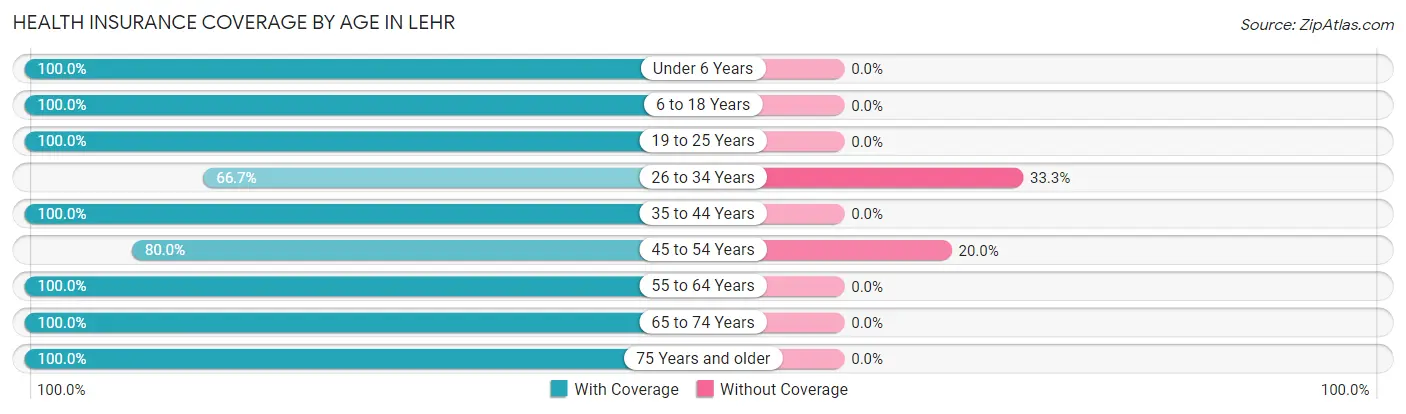
| Age Bracket | With Coverage | Without Coverage |
| Under 6 Years | 3 (100.0%) | 0 (0.0%) |
| 6 to 18 Years | 4 (100.0%) | 0 (0.0%) |
| 19 to 25 Years | 3 (100.0%) | 0 (0.0%) |
| 26 to 34 Years | 2 (66.7%) | 1 (33.3%) |
| 35 to 44 Years | 4 (100.0%) | 0 (0.0%) |
| 45 to 54 Years | 8 (80.0%) | 2 (20.0%) |
| 55 to 64 Years | 16 (100.0%) | 0 (0.0%) |
| 65 to 74 Years | 29 (100.0%) | 0 (0.0%) |
| 75 Years and older | 1 (100.0%) | 0 (0.0%) |
| Total | 70 (95.9%) | 3 (4.1%) |
Health Insurance Coverage by Citizenship Status in Lehr
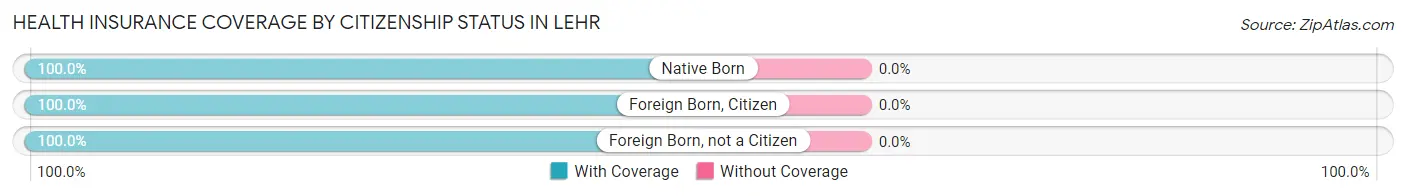
| Citizenship Status | With Coverage | Without Coverage |
| Native Born | 3 (100.0%) | 0 (0.0%) |
| Foreign Born, Citizen | 4 (100.0%) | 0 (0.0%) |
| Foreign Born, not a Citizen | 3 (100.0%) | 0 (0.0%) |
Health Insurance Coverage by Household Income in Lehr
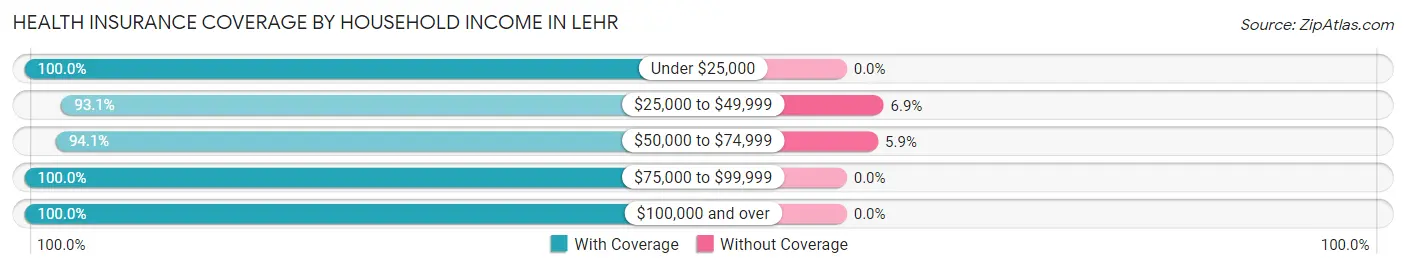
| Household Income | With Coverage | Without Coverage |
| Under $25,000 | 12 (100.0%) | 0 (0.0%) |
| $25,000 to $49,999 | 27 (93.1%) | 2 (6.9%) |
| $50,000 to $74,999 | 16 (94.1%) | 1 (5.9%) |
| $75,000 to $99,999 | 2 (100.0%) | 0 (0.0%) |
| $100,000 and over | 13 (100.0%) | 0 (0.0%) |
Public vs Private Health Insurance Coverage by Age in Lehr
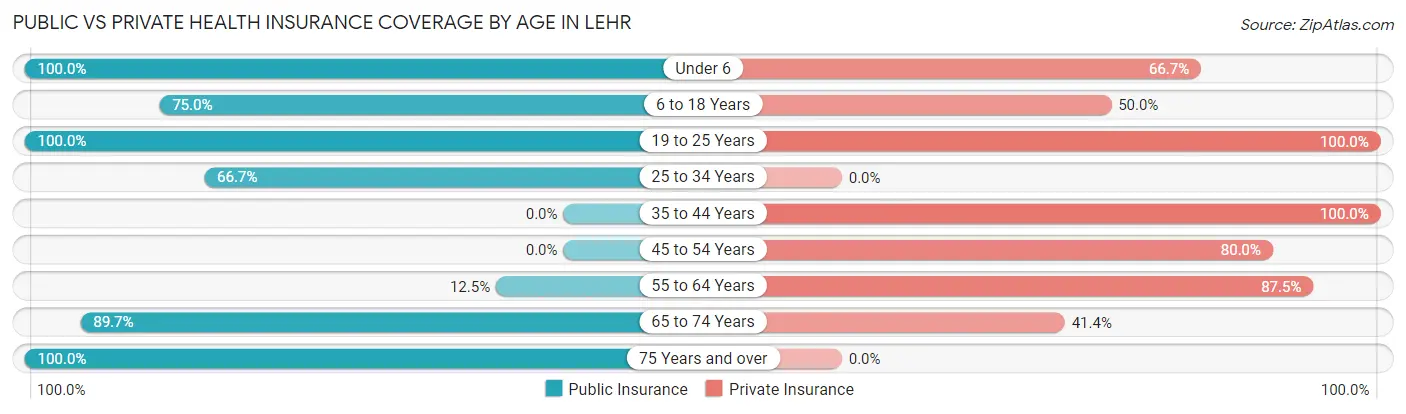
| Age Bracket | Public Insurance | Private Insurance |
| Under 6 | 3 (100.0%) | 2 (66.7%) |
| 6 to 18 Years | 3 (75.0%) | 2 (50.0%) |
| 19 to 25 Years | 3 (100.0%) | 3 (100.0%) |
| 25 to 34 Years | 2 (66.7%) | 0 (0.0%) |
| 35 to 44 Years | 0 (0.0%) | 4 (100.0%) |
| 45 to 54 Years | 0 (0.0%) | 8 (80.0%) |
| 55 to 64 Years | 2 (12.5%) | 14 (87.5%) |
| 65 to 74 Years | 26 (89.7%) | 12 (41.4%) |
| 75 Years and over | 1 (100.0%) | 0 (0.0%) |
| Total | 40 (54.8%) | 45 (61.6%) |
Disability Status by Sex by Age in Lehr
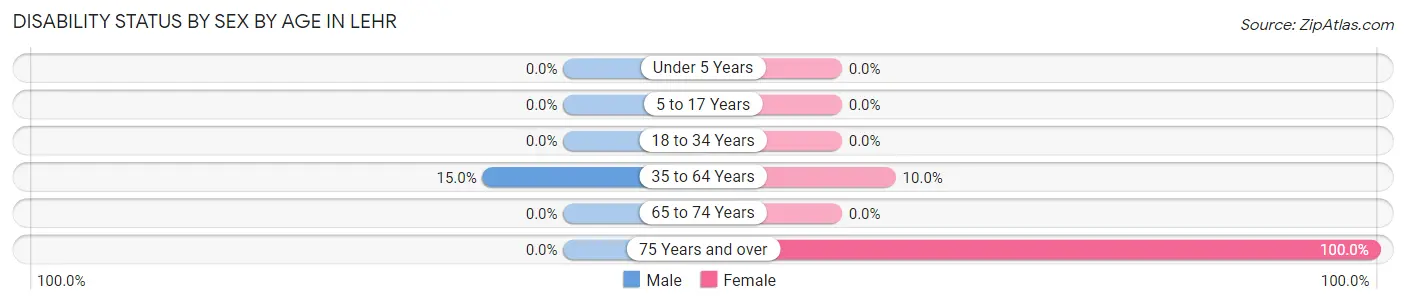
| Age Bracket | Male | Female |
| Under 5 Years | 0 (0.0%) | 0 (0.0%) |
| 5 to 17 Years | 0 (0.0%) | 0 (0.0%) |
| 18 to 34 Years | 0 (0.0%) | 0 (0.0%) |
| 35 to 64 Years | 3 (15.0%) | 1 (10.0%) |
| 65 to 74 Years | 0 (0.0%) | 0 (0.0%) |
| 75 Years and over | 0 (0.0%) | 1 (100.0%) |
Disability Class by Sex by Age in Lehr
Disability Class: Hearing Difficulty
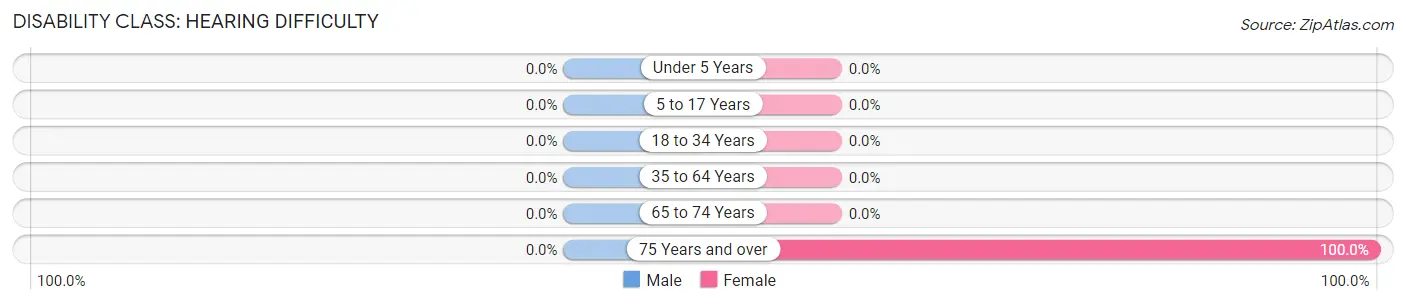
| Age Bracket | Male | Female |
| Under 5 Years | 0 (0.0%) | 0 (0.0%) |
| 5 to 17 Years | 0 (0.0%) | 0 (0.0%) |
| 18 to 34 Years | 0 (0.0%) | 0 (0.0%) |
| 35 to 64 Years | 0 (0.0%) | 0 (0.0%) |
| 65 to 74 Years | 0 (0.0%) | 0 (0.0%) |
| 75 Years and over | 0 (0.0%) | 1 (100.0%) |
Disability Class: Vision Difficulty
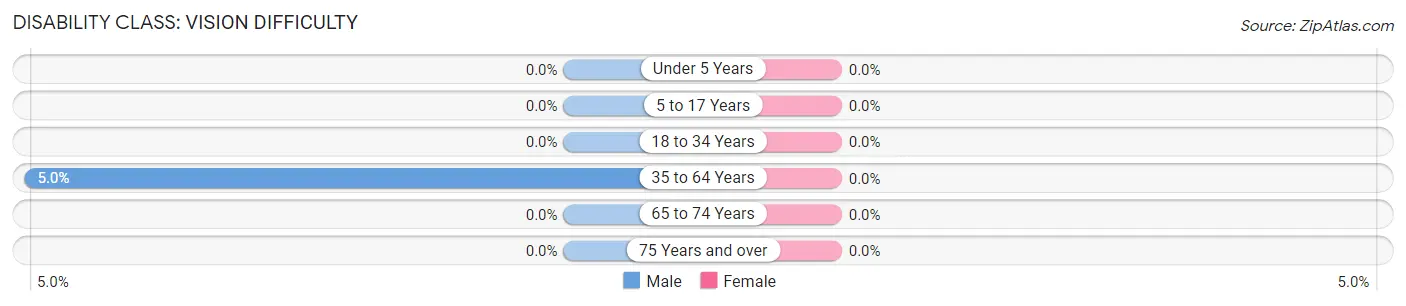
| Age Bracket | Male | Female |
| Under 5 Years | 0 (0.0%) | 0 (0.0%) |
| 5 to 17 Years | 0 (0.0%) | 0 (0.0%) |
| 18 to 34 Years | 0 (0.0%) | 0 (0.0%) |
| 35 to 64 Years | 1 (5.0%) | 0 (0.0%) |
| 65 to 74 Years | 0 (0.0%) | 0 (0.0%) |
| 75 Years and over | 0 (0.0%) | 0 (0.0%) |
Disability Class: Cognitive Difficulty
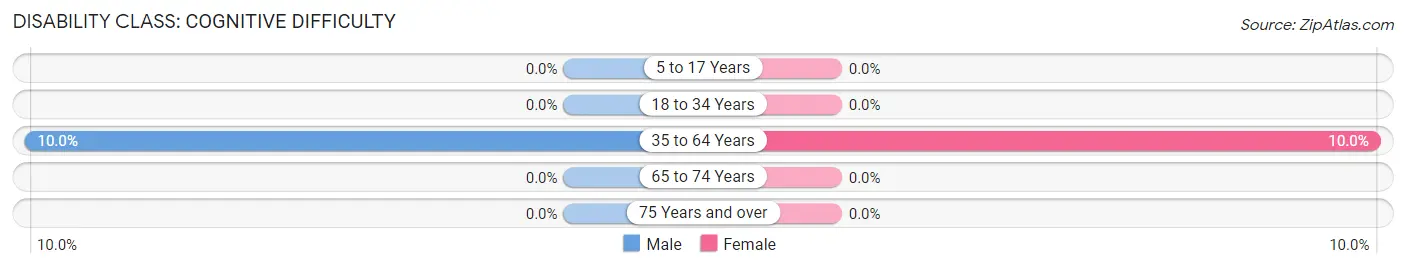
| Age Bracket | Male | Female |
| 5 to 17 Years | 0 (0.0%) | 0 (0.0%) |
| 18 to 34 Years | 0 (0.0%) | 0 (0.0%) |
| 35 to 64 Years | 2 (10.0%) | 1 (10.0%) |
| 65 to 74 Years | 0 (0.0%) | 0 (0.0%) |
| 75 Years and over | 0 (0.0%) | 0 (0.0%) |
Disability Class: Ambulatory Difficulty
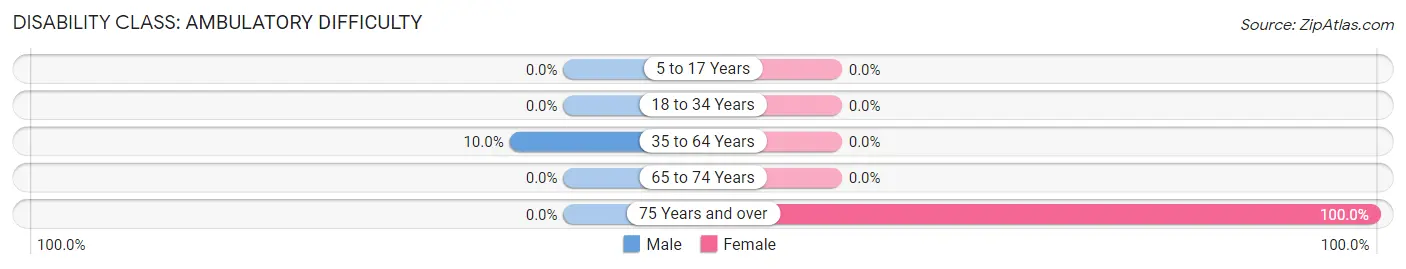
| Age Bracket | Male | Female |
| 5 to 17 Years | 0 (0.0%) | 0 (0.0%) |
| 18 to 34 Years | 0 (0.0%) | 0 (0.0%) |
| 35 to 64 Years | 2 (10.0%) | 0 (0.0%) |
| 65 to 74 Years | 0 (0.0%) | 0 (0.0%) |
| 75 Years and over | 0 (0.0%) | 1 (100.0%) |
Disability Class: Self-Care Difficulty
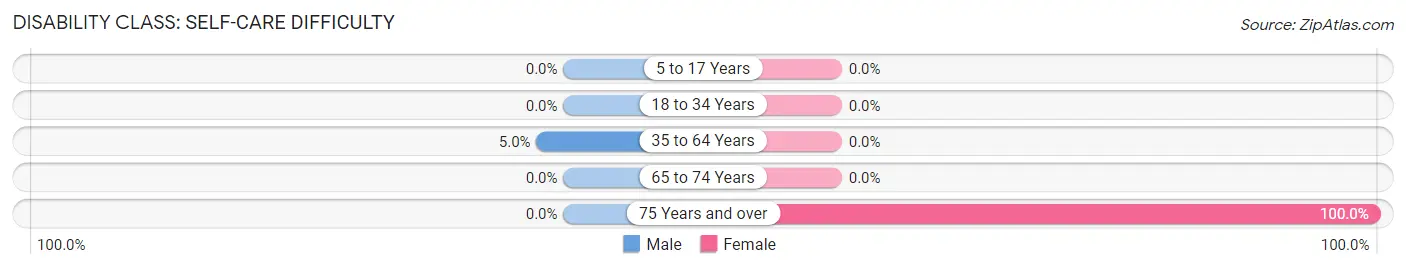
| Age Bracket | Male | Female |
| 5 to 17 Years | 0 (0.0%) | 0 (0.0%) |
| 18 to 34 Years | 0 (0.0%) | 0 (0.0%) |
| 35 to 64 Years | 1 (5.0%) | 0 (0.0%) |
| 65 to 74 Years | 0 (0.0%) | 0 (0.0%) |
| 75 Years and over | 0 (0.0%) | 1 (100.0%) |
Technology Access in Lehr
Computing Device Access in Lehr
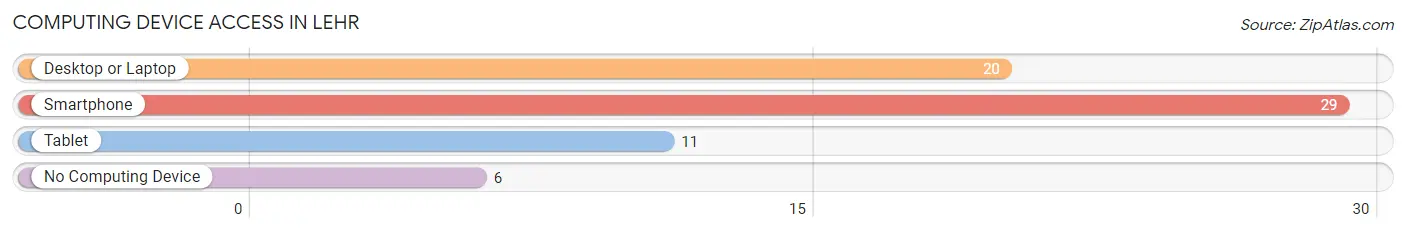
| Device Type | # Households | % Households |
| Desktop or Laptop | 20 | 50.0% |
| Smartphone | 29 | 72.5% |
| Tablet | 11 | 27.5% |
| No Computing Device | 6 | 15.0% |
| Total | 40 | 100.0% |
Internet Access in Lehr
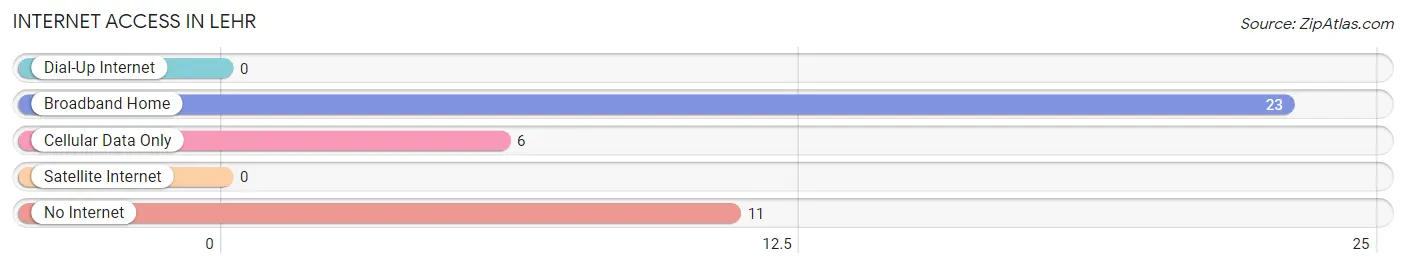
| Internet Type | # Households | % Households |
| Dial-Up Internet | 0 | 0.0% |
| Broadband Home | 23 | 57.5% |
| Cellular Data Only | 6 | 15.0% |
| Satellite Internet | 0 | 0.0% |
| No Internet | 11 | 27.5% |
| Total | 40 | 100.0% |
Lehr Summary
North Dakota is a state located in the Midwestern and Great Plains regions of the United States. It is bordered by Minnesota to the east, South Dakota to the south, Montana to the west, and the Canadian provinces of Saskatchewan and Manitoba to the north. North Dakota is the 19th-most extensive but the 4th-least populous and the 4th-least densely populated of the 50 United States. The state capital is Bismarck, and the largest city is Fargo.
History
The area that is now North Dakota has been inhabited for thousands of years by various Native American tribes. The first Europeans to explore the area were French fur traders, who arrived in the late 17th century. The area became part of the United States in 1803 as part of the Louisiana Purchase. In the mid-19th century, the area was part of the Dakota Territory, which was divided into the states of North and South Dakota in 1889.
North Dakota was admitted to the Union as the 39th state on November 2, 1889. The state's economy was initially based on agriculture, but in the early 20th century, the state began to diversify its economy with the development of the oil and gas industry. The state also experienced a population boom during this period, as thousands of people moved to the state to take advantage of the economic opportunities.
Geography
North Dakota is located in the northern Great Plains region of the United States. It is bordered by Minnesota to the east, South Dakota to the south, Montana to the west, and the Canadian provinces of Saskatchewan and Manitoba to the north. The state has an area of 70,762 square miles, making it the 19th-largest state in the country.
The geography of North Dakota is dominated by the Great Plains, which cover most of the state. The eastern part of the state is characterized by rolling hills and wooded areas, while the western part is dominated by the Badlands, a region of rugged terrain and deep canyons. The state also contains several large lakes, including Lake Sakakawea, Lake Oahe, and Lake Audubon.
Economy
North Dakota's economy is largely based on agriculture, with wheat, corn, and soybeans being the state's primary crops. The state is also a major producer of beef, pork, and dairy products. Other important industries in the state include oil and gas production, manufacturing, and tourism.
The state's economy has been diversifying in recent years, with the development of the technology and energy sectors. The state is also home to several large companies, including Microsoft, Amazon, and Walmart.
Demographics
As of 2019, North Dakota had an estimated population of 762,062, making it the 4th-least populous state in the country. The state's population is largely concentrated in the eastern part of the state, with the largest cities being Fargo, Bismarck, Grand Forks, and Minot.
The state's population is largely white (90.2%), with the largest minority groups being Native American (5.2%), Hispanic (2.2%), and Asian (1.3%). The state's median household income is $58,906, and the poverty rate is 11.2%.
Common Questions
What is the Total Population of Lehr?
Total Population of Lehr is 73.
What is the Total Male Population of Lehr?
Total Male Population of Lehr is 40.
What is the Total Female Population of Lehr?
Total Female Population of Lehr is 33.
What is the Ratio of Males per 100 Females in Lehr?
There are 121.21 Males per 100 Females in Lehr.
What is the Ratio of Females per 100 Males in Lehr?
There are 82.50 Females per 100 Males in Lehr.
What is the Median Population Age in Lehr?
Median Population Age in Lehr is 60.5 Years.
What is the Average Family Size in Lehr
Average Family Size in Lehr is 2.4 People.
What is the Average Household Size in Lehr
Average Household Size in Lehr is 1.8 People.
What is Per Capita Income in Lehr?
Per Capita income in Lehr is $31,158.
What is the Median Family Income in Lehr?
Median Family Income in Lehr is $48,750.
What is the Median Household income in Lehr?
Median Household Income in Lehr is $43,750.
What is Income or Wage Gap in Lehr?
Income or Wage Gap in Lehr is 35.7%.
Women in Lehr earn 64.3 cents for every dollar earned by a man.
What is Inequality or Gini Index in Lehr?
Inequality or Gini Index in Lehr is 0.41.
How Large is the Labor Force in Lehr?
There are 44 People in the Labor Forcein in Lehr.
What is the Percentage of People in the Labor Force in Lehr?
65.7% of People are in the Labor Force in Lehr.
What is the Unemployment Rate in Lehr?
Unemployment Rate in Lehr is 4.5%.