Roseboro, NC
Roseboro Map
Roseboro Overview
900
TOTAL POPULATION
470
MALE POPULATION
430
FEMALE POPULATION
109.30
MALES / 100 FEMALES
91.49
FEMALES / 100 MALES
38.6
MEDIAN AGE
3.1
AVG FAMILY SIZE
2.3
AVG HOUSEHOLD SIZE
$23,198
PER CAPITA INCOME
$69,583
AVG FAMILY INCOME
$50,455
AVG HOUSEHOLD INCOME
41.5%
WAGE / INCOME GAP [ % ]
58.5¢/ $1
WAGE / INCOME GAP [ $ ]
$20,328
FAMILY INCOME DEFICIT
0.40
INEQUALITY / GINI INDEX
356
LABOR FORCE [ PEOPLE ]
49.3%
PERCENT IN LABOR FORCE
2.0%
UNEMPLOYMENT RATE
Roseboro Zip Codes
Roseboro Area Codes
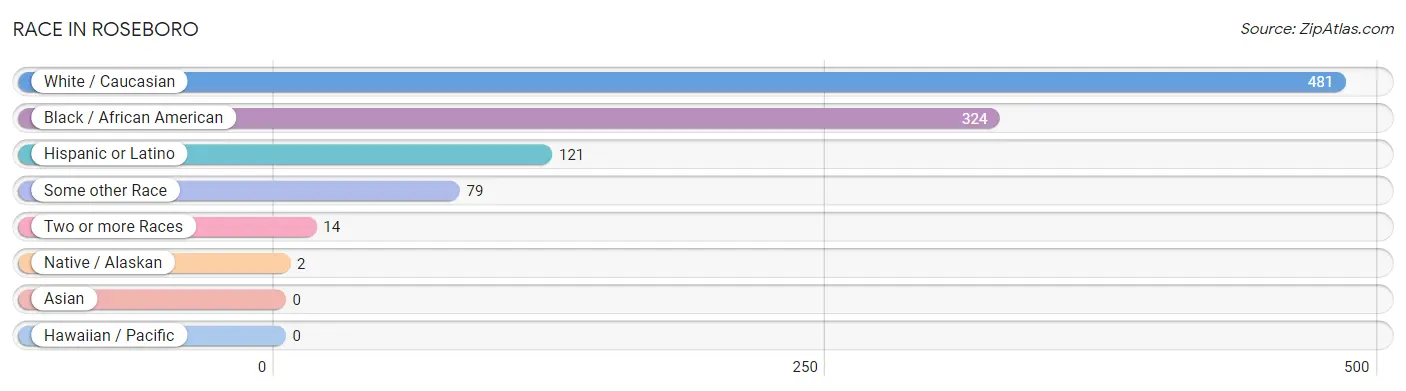
Race in Roseboro
The most populous races in Roseboro are White / Caucasian (481 | 53.4%), Black / African American (324 | 36.0%), and Hispanic or Latino (121 | 13.4%).
| Race | # Population | % Population |
| Asian | 0 | 0.0% |
| Black / African American | 324 | 36.0% |
| Hawaiian / Pacific | 0 | 0.0% |
| Hispanic or Latino | 121 | 13.4% |
| Native / Alaskan | 2 | 0.2% |
| White / Caucasian | 481 | 53.4% |
| Two or more Races | 14 | 1.6% |
| Some other Race | 79 | 8.8% |
| Total | 900 | 100.0% |
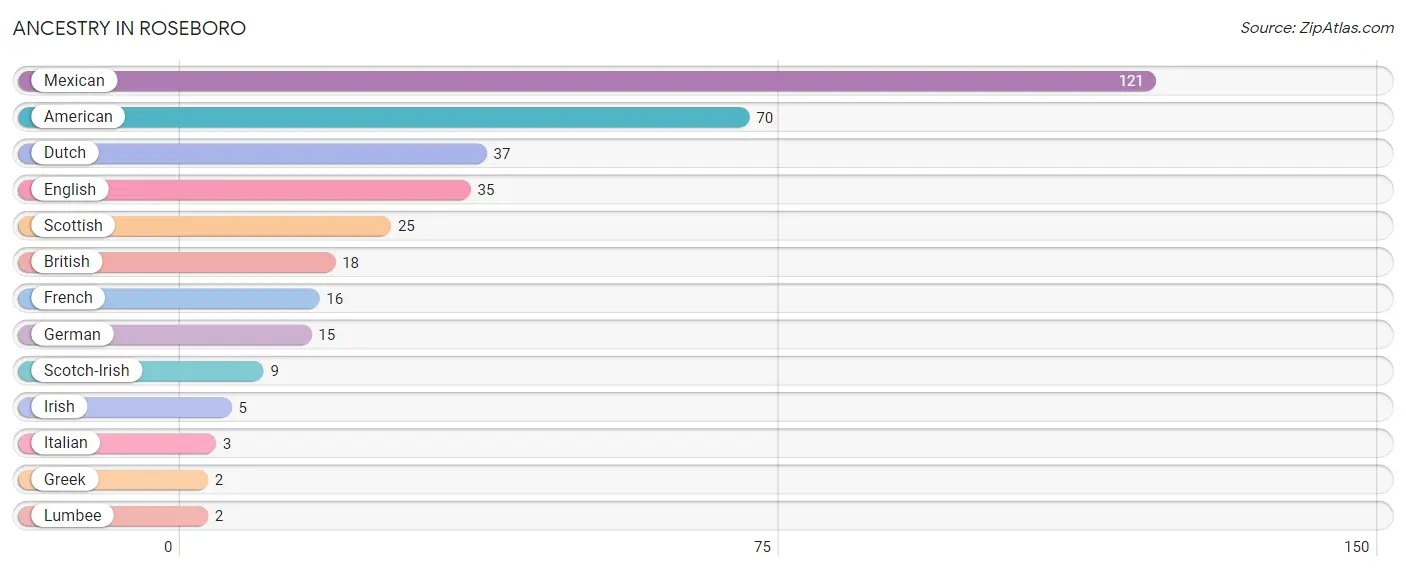
Ancestry in Roseboro
The most populous ancestries reported in Roseboro are Mexican (121 | 13.4%), American (70 | 7.8%), Dutch (37 | 4.1%), English (35 | 3.9%), and Scottish (25 | 2.8%), together accounting for 32.0% of all Roseboro residents.
| Ancestry | # Population | % Population |
| American | 70 | 7.8% |
| British | 18 | 2.0% |
| Dutch | 37 | 4.1% |
| English | 35 | 3.9% |
| French | 16 | 1.8% |
| German | 15 | 1.7% |
| Greek | 2 | 0.2% |
| Irish | 5 | 0.6% |
| Italian | 3 | 0.3% |
| Lumbee | 2 | 0.2% |
| Mexican | 121 | 13.4% |
| Scotch-Irish | 9 | 1.0% |
| Scottish | 25 | 2.8% | View All 13 Rows |
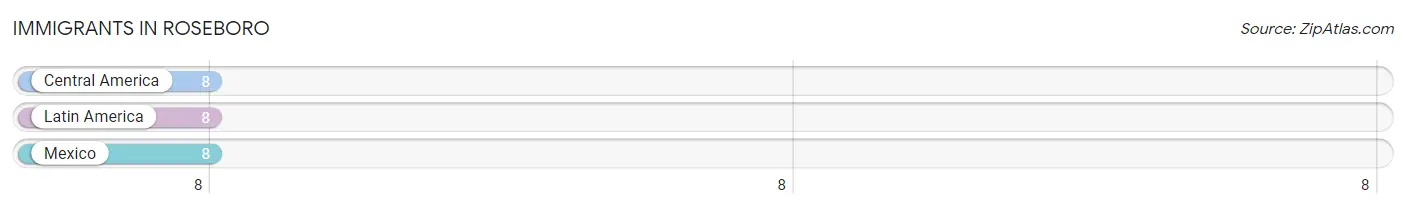
Immigrants in Roseboro
The most numerous immigrant groups reported in Roseboro came from Central America (8 | 0.9%), Latin America (8 | 0.9%), and Mexico (8 | 0.9%), together accounting for 2.7% of all Roseboro residents.
| Immigration Origin | # Population | % Population |
| Central America | 8 | 0.9% |
| Latin America | 8 | 0.9% |
| Mexico | 8 | 0.9% | View All 3 Rows |
Sex and Age in Roseboro
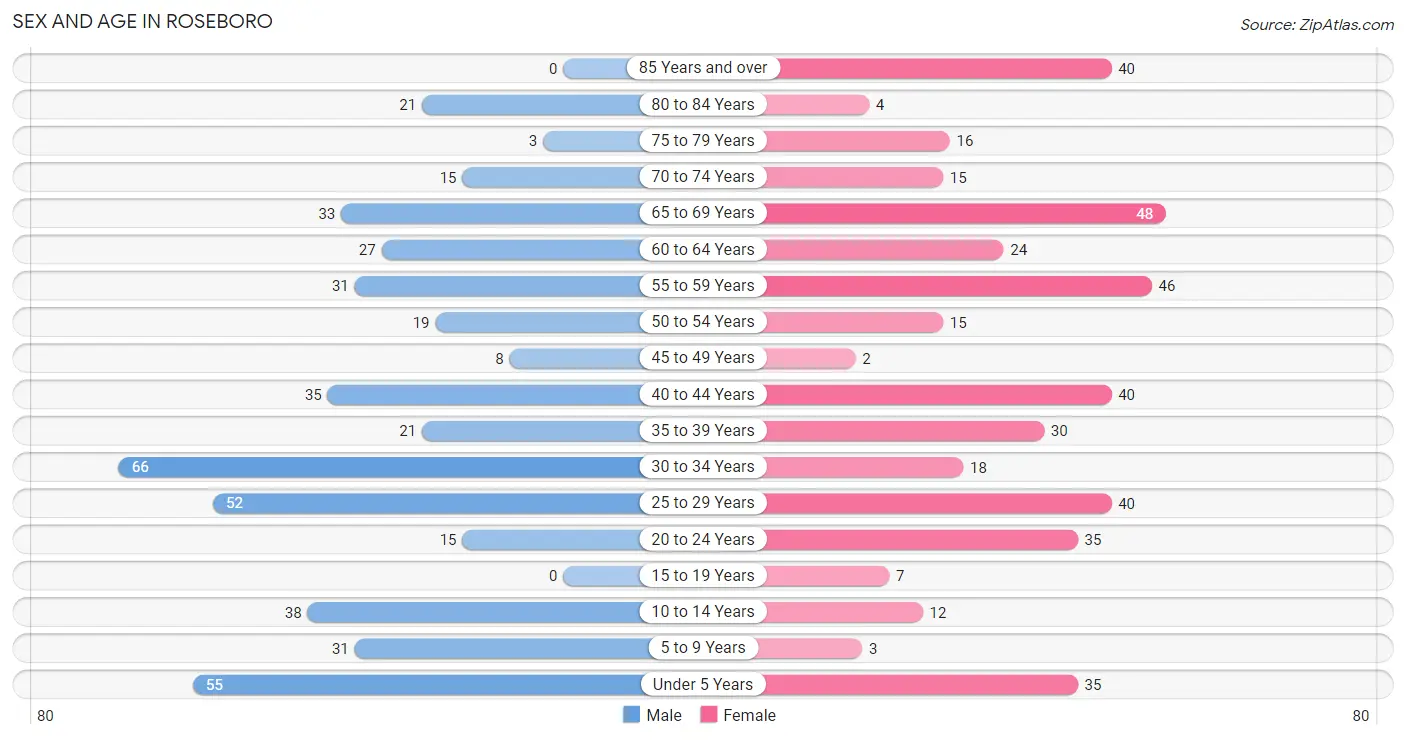
Sex and Age in Roseboro
The most populous age groups in Roseboro are 30 to 34 Years (66 | 14.0%) for men and 65 to 69 Years (48 | 11.2%) for women.
| Age Bracket | Male | Female |
| Under 5 Years | 55 (11.7%) | 35 (8.1%) |
| 5 to 9 Years | 31 (6.6%) | 3 (0.7%) |
| 10 to 14 Years | 38 (8.1%) | 12 (2.8%) |
| 15 to 19 Years | 0 (0.0%) | 7 (1.6%) |
| 20 to 24 Years | 15 (3.2%) | 35 (8.1%) |
| 25 to 29 Years | 52 (11.1%) | 40 (9.3%) |
| 30 to 34 Years | 66 (14.0%) | 18 (4.2%) |
| 35 to 39 Years | 21 (4.5%) | 30 (7.0%) |
| 40 to 44 Years | 35 (7.4%) | 40 (9.3%) |
| 45 to 49 Years | 8 (1.7%) | 2 (0.5%) |
| 50 to 54 Years | 19 (4.0%) | 15 (3.5%) |
| 55 to 59 Years | 31 (6.6%) | 46 (10.7%) |
| 60 to 64 Years | 27 (5.7%) | 24 (5.6%) |
| 65 to 69 Years | 33 (7.0%) | 48 (11.2%) |
| 70 to 74 Years | 15 (3.2%) | 15 (3.5%) |
| 75 to 79 Years | 3 (0.6%) | 16 (3.7%) |
| 80 to 84 Years | 21 (4.5%) | 4 (0.9%) |
| 85 Years and over | 0 (0.0%) | 40 (9.3%) |
| Total | 470 (100.0%) | 430 (100.0%) |
Families and Households in Roseboro
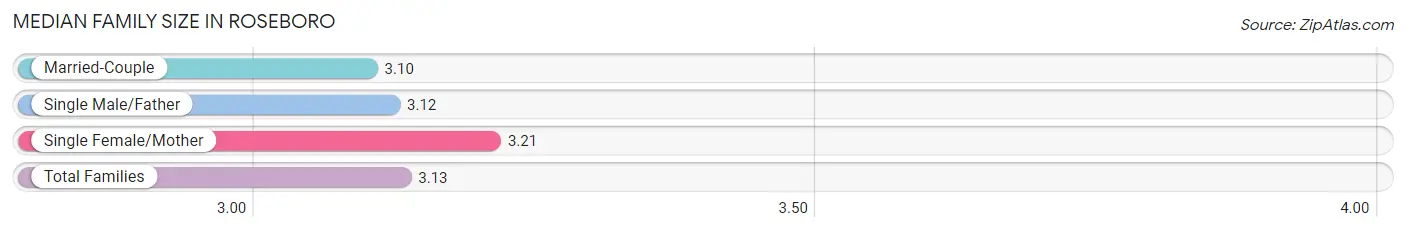
Median Family Size in Roseboro
The median family size in Roseboro is 3.13 persons per family, with single female/mother families (48 | 21.8%) accounting for the largest median family size of 3.21 persons per family. On the other hand, married-couple families (123 | 55.9%) represent the smallest median family size with 3.10 persons per family.
| Family Type | # Families | Family Size |
| Married-Couple | 123 (55.9%) | 3.10 |
| Single Male/Father | 49 (22.3%) | 3.12 |
| Single Female/Mother | 48 (21.8%) | 3.21 |
| Total Families | 220 (100.0%) | 3.13 |
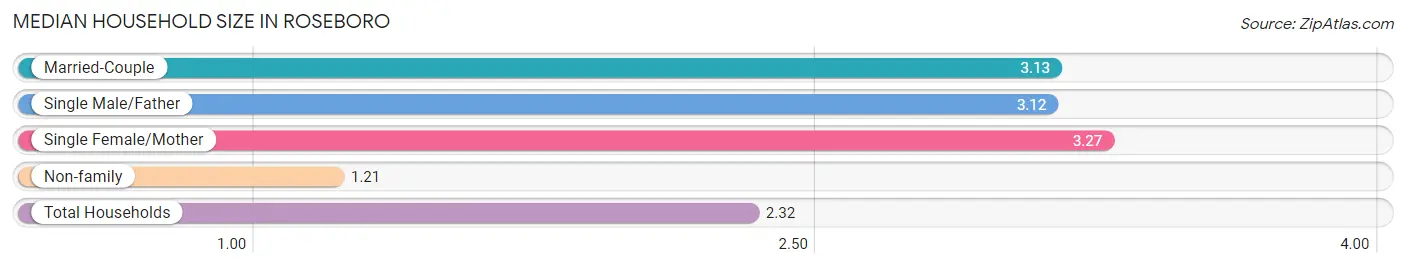
Median Household Size in Roseboro
The median household size in Roseboro is 2.32 persons per household, with single female/mother households (48 | 12.4%) accounting for the largest median household size of 3.27 persons per household. non-family households (168 | 43.3%) represent the smallest median household size with 1.21 persons per household.
| Household Type | # Households | Household Size |
| Married-Couple | 123 (31.7%) | 3.13 |
| Single Male/Father | 49 (12.6%) | 3.12 |
| Single Female/Mother | 48 (12.4%) | 3.27 |
| Non-family | 168 (43.3%) | 1.21 |
| Total Households | 388 (100.0%) | 2.32 |
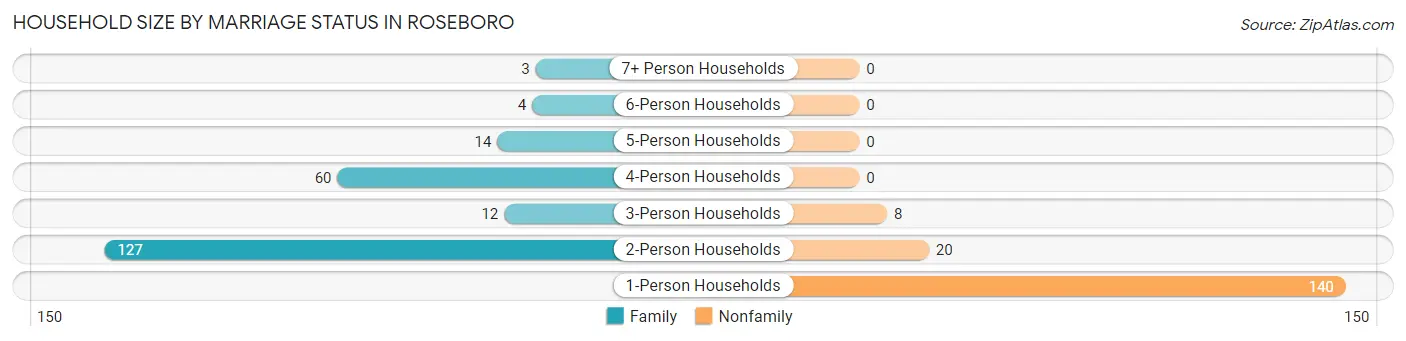
Household Size by Marriage Status in Roseboro
Out of a total of 388 households in Roseboro, 220 (56.7%) are family households, while 168 (43.3%) are nonfamily households. The most numerous type of family households are 2-person households, comprising 127, and the most common type of nonfamily households are 1-person households, comprising 140.
| Household Size | Family Households | Nonfamily Households |
| 1-Person Households | - | 140 (36.1%) |
| 2-Person Households | 127 (32.7%) | 20 (5.1%) |
| 3-Person Households | 12 (3.1%) | 8 (2.1%) |
| 4-Person Households | 60 (15.5%) | 0 (0.0%) |
| 5-Person Households | 14 (3.6%) | 0 (0.0%) |
| 6-Person Households | 4 (1.0%) | 0 (0.0%) |
| 7+ Person Households | 3 (0.8%) | 0 (0.0%) |
| Total | 220 (56.7%) | 168 (43.3%) |
Female Fertility in Roseboro
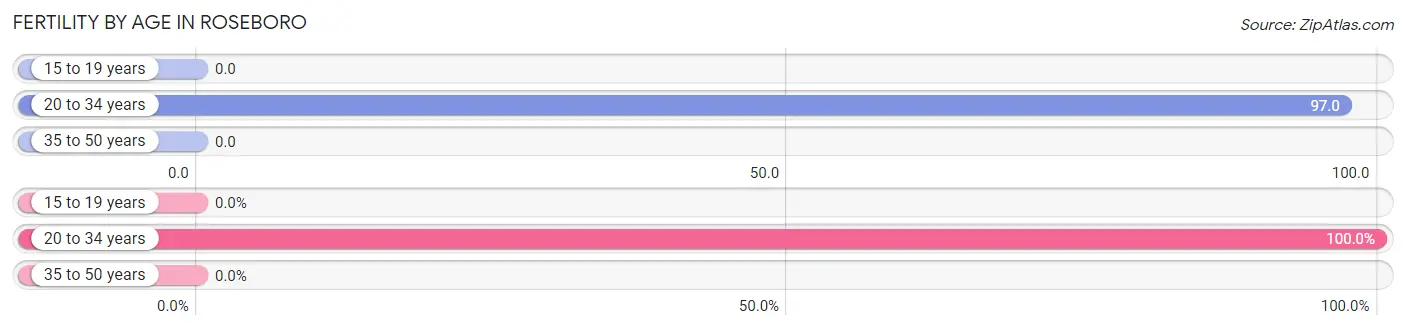
Fertility by Age in Roseboro
Average fertility rate in Roseboro is 52.0 births per 1,000 women. Women in the age bracket of 20 to 34 years have the highest fertility rate with 97.0 births per 1,000 women. Women in the age bracket of 20 to 34 years acount for 100.0% of all women with births.
| Age Bracket | Women with Births | Births / 1,000 Women |
| 15 to 19 years | 0 (0.0%) | 0.0 |
| 20 to 34 years | 9 (100.0%) | 97.0 |
| 35 to 50 years | 0 (0.0%) | 0.0 |
| Total | 9 (100.0%) | 52.0 |
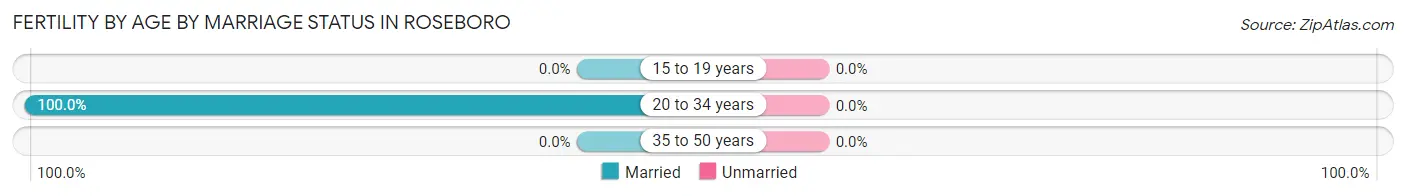
Fertility by Age by Marriage Status in Roseboro
| Age Bracket | Married | Unmarried |
| 15 to 19 years | 0 (0.0%) | 0 (0.0%) |
| 20 to 34 years | 9 (100.0%) | 0 (0.0%) |
| 35 to 50 years | 0 (0.0%) | 0 (0.0%) |
| Total | 9 (100.0%) | 0 (0.0%) |
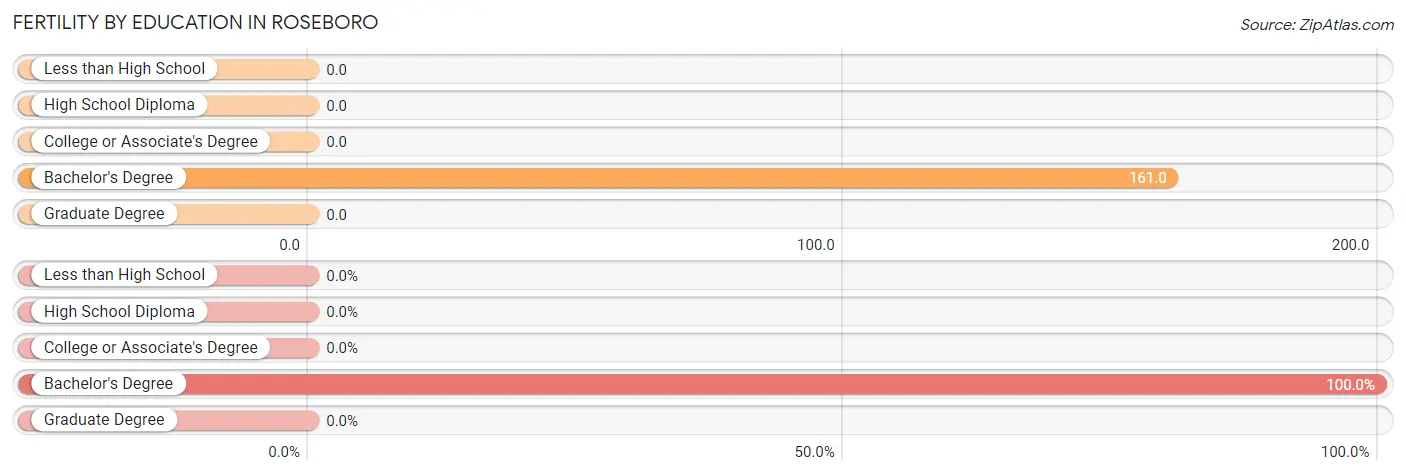
Fertility by Education in Roseboro
| Educational Attainment | Women with Births | Births / 1,000 Women |
| Less than High School | 0 (0.0%) | 0.0 |
| High School Diploma | 0 (0.0%) | 0.0 |
| College or Associate's Degree | 0 (0.0%) | 0.0 |
| Bachelor's Degree | 9 (100.0%) | 161.0 |
| Graduate Degree | 0 (0.0%) | 0.0 |
| Total | 9 (100.0%) | 52.0 |
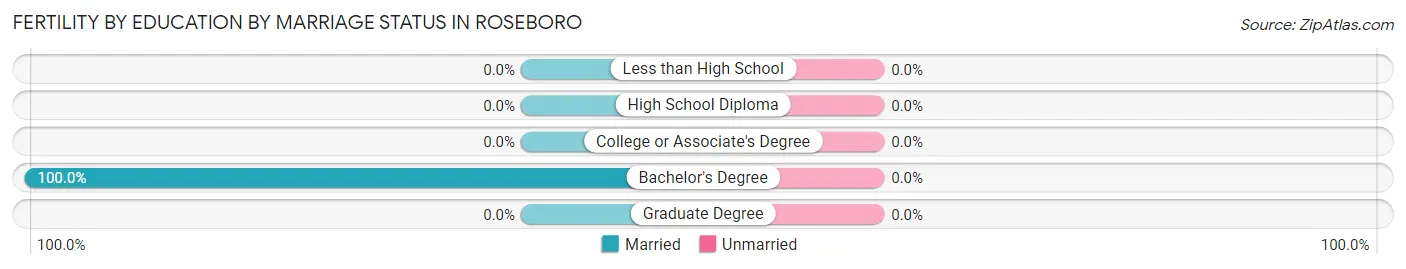
Fertility by Education by Marriage Status in Roseboro
| Educational Attainment | Married | Unmarried |
| Less than High School | 0 (0.0%) | 0 (0.0%) |
| High School Diploma | 0 (0.0%) | 0 (0.0%) |
| College or Associate's Degree | 0 (0.0%) | 0 (0.0%) |
| Bachelor's Degree | 9 (100.0%) | 0 (0.0%) |
| Graduate Degree | 0 (0.0%) | 0 (0.0%) |
| Total | 9 (100.0%) | 0 (0.0%) |
Income in Roseboro
Income Overview in Roseboro
Per Capita Income in Roseboro is $23,198, while median incomes of families and households are $69,583 and $50,455 respectively.
| Characteristic | Number | Measure |
| Per Capita Income | 900 | $23,198 |
| Median Family Income | 220 | $69,583 |
| Mean Family Income | 220 | $62,525 |
| Median Household Income | 388 | $50,455 |
| Mean Household Income | 388 | $50,619 |
| Income Deficit | 220 | $20,328 |
| Wage / Income Gap (%) | 900 | 41.53% |
| Wage / Income Gap ($) | 900 | 58.47¢ per $1 |
| Gini / Inequality Index | 900 | 0.40 |
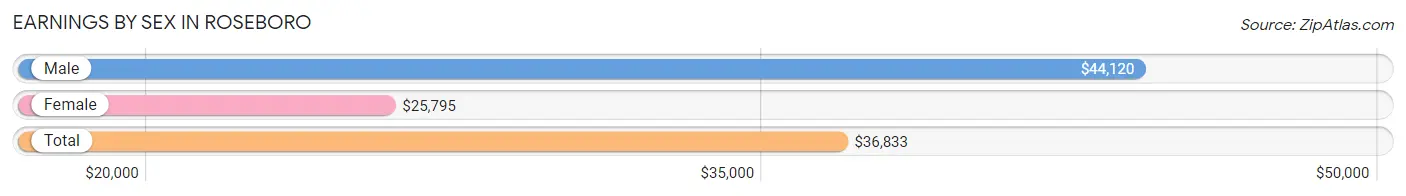
Earnings by Sex in Roseboro
Average Earnings in Roseboro are $36,833, $44,120 for men and $25,795 for women, a difference of 41.5%.
| Sex | Number | Average Earnings |
| Male | 211 (57.3%) | $44,120 |
| Female | 157 (42.7%) | $25,795 |
| Total | 368 (100.0%) | $36,833 |
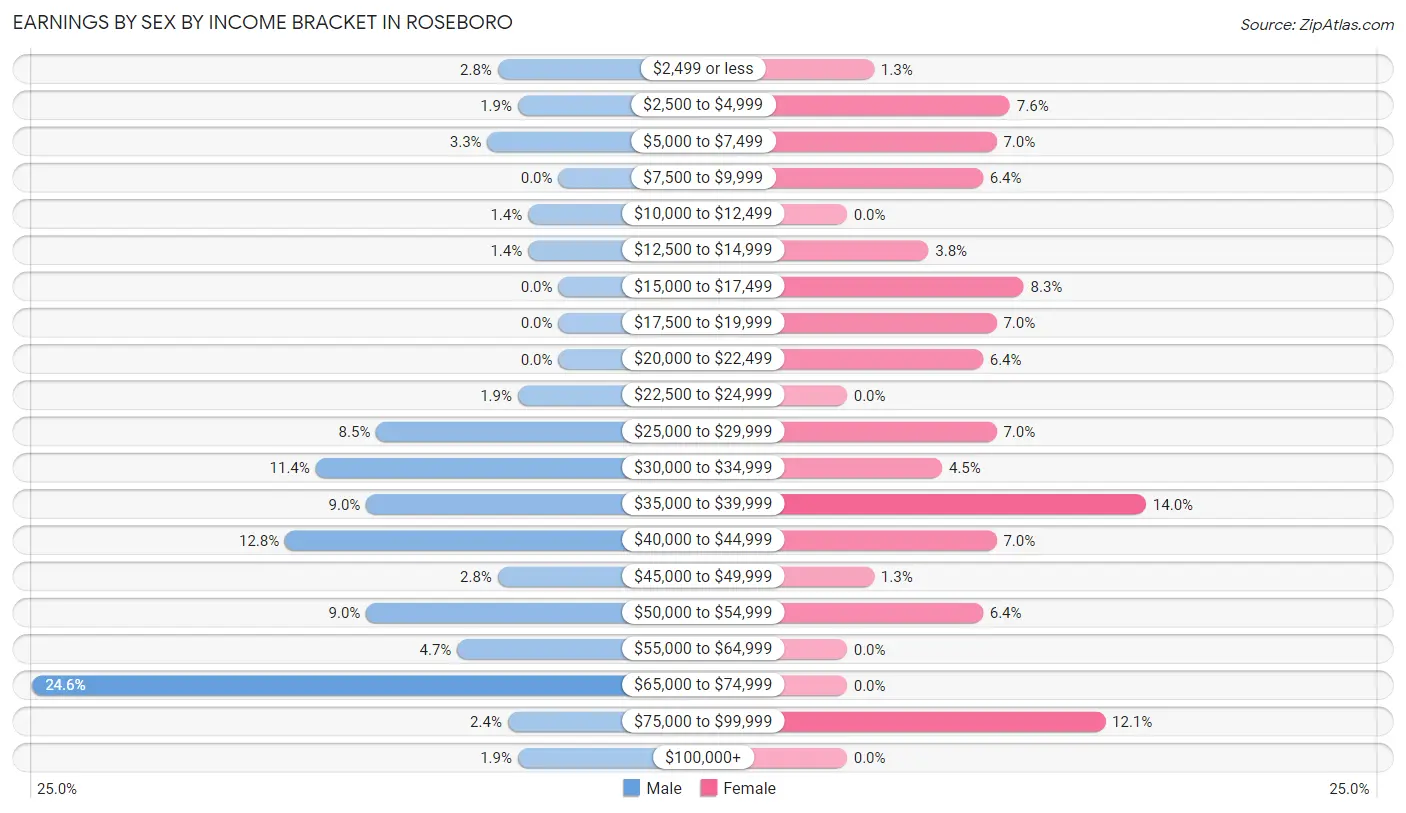
Earnings by Sex by Income Bracket in Roseboro
The most common earnings brackets in Roseboro are $65,000 to $74,999 for men (52 | 24.6%) and $35,000 to $39,999 for women (22 | 14.0%).
| Income | Male | Female |
| $2,499 or less | 6 (2.8%) | 2 (1.3%) |
| $2,500 to $4,999 | 4 (1.9%) | 12 (7.6%) |
| $5,000 to $7,499 | 7 (3.3%) | 11 (7.0%) |
| $7,500 to $9,999 | 0 (0.0%) | 10 (6.4%) |
| $10,000 to $12,499 | 3 (1.4%) | 0 (0.0%) |
| $12,500 to $14,999 | 3 (1.4%) | 6 (3.8%) |
| $15,000 to $17,499 | 0 (0.0%) | 13 (8.3%) |
| $17,500 to $19,999 | 0 (0.0%) | 11 (7.0%) |
| $20,000 to $22,499 | 0 (0.0%) | 10 (6.4%) |
| $22,500 to $24,999 | 4 (1.9%) | 0 (0.0%) |
| $25,000 to $29,999 | 18 (8.5%) | 11 (7.0%) |
| $30,000 to $34,999 | 24 (11.4%) | 7 (4.5%) |
| $35,000 to $39,999 | 19 (9.0%) | 22 (14.0%) |
| $40,000 to $44,999 | 27 (12.8%) | 11 (7.0%) |
| $45,000 to $49,999 | 6 (2.8%) | 2 (1.3%) |
| $50,000 to $54,999 | 19 (9.0%) | 10 (6.4%) |
| $55,000 to $64,999 | 10 (4.7%) | 0 (0.0%) |
| $65,000 to $74,999 | 52 (24.6%) | 0 (0.0%) |
| $75,000 to $99,999 | 5 (2.4%) | 19 (12.1%) |
| $100,000+ | 4 (1.9%) | 0 (0.0%) |
| Total | 211 (100.0%) | 157 (100.0%) |
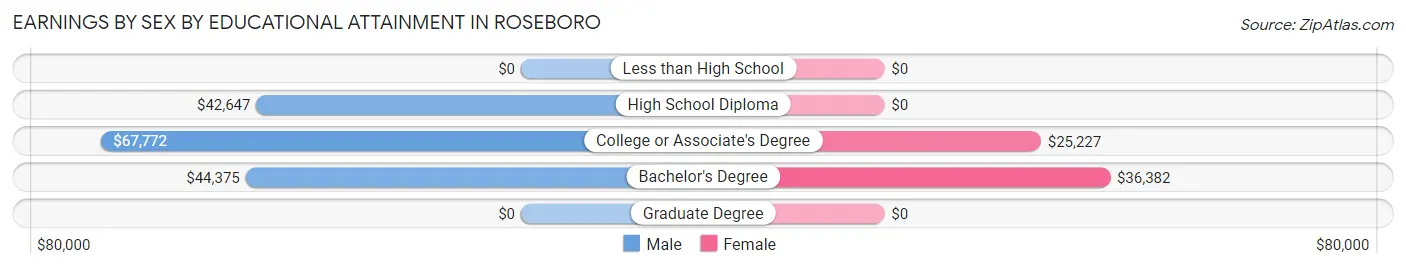
Earnings by Sex by Educational Attainment in Roseboro
Average earnings in Roseboro are $44,074 for men and $27,045 for women, a difference of 38.6%. Men with an educational attainment of college or associate's degree enjoy the highest average annual earnings of $67,772, while those with high school diploma education earn the least with $42,647. Women with an educational attainment of bachelor's degree earn the most with the average annual earnings of $36,382, while those with college or associate's degree education have the smallest earnings of $25,227.
| Educational Attainment | Male Income | Female Income |
| Less than High School | - | - |
| High School Diploma | $42,647 | $0 |
| College or Associate's Degree | $67,772 | $25,227 |
| Bachelor's Degree | $44,375 | $36,382 |
| Graduate Degree | - | - |
| Total | $44,074 | $27,045 |
Family Income in Roseboro
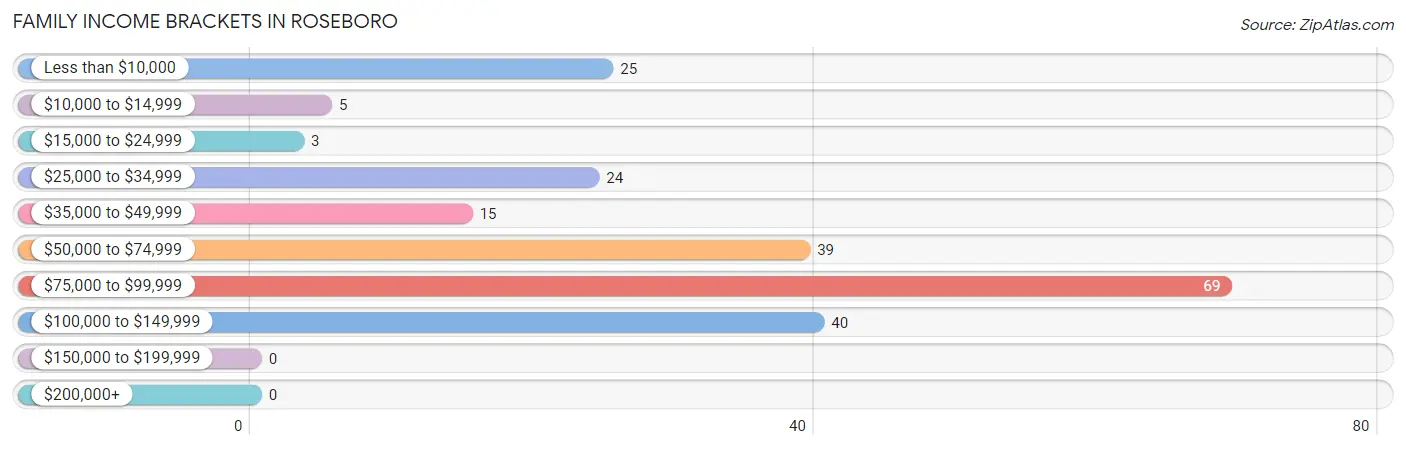
Family Income Brackets in Roseboro
According to the Roseboro family income data, there are 69 families falling into the $75,000 to $99,999 income range, which is the most common income bracket and makes up 31.4% of all families.
| Income Bracket | # Families | % Families |
| Less than $10,000 | 25 | 11.4% |
| $10,000 to $14,999 | 5 | 2.3% |
| $15,000 to $24,999 | 3 | 1.4% |
| $25,000 to $34,999 | 24 | 10.9% |
| $35,000 to $49,999 | 15 | 6.8% |
| $50,000 to $74,999 | 39 | 17.7% |
| $75,000 to $99,999 | 69 | 31.4% |
| $100,000 to $149,999 | 40 | 18.2% |
| $150,000 to $199,999 | 0 | 0.0% |
| $200,000+ | 0 | 0.0% |
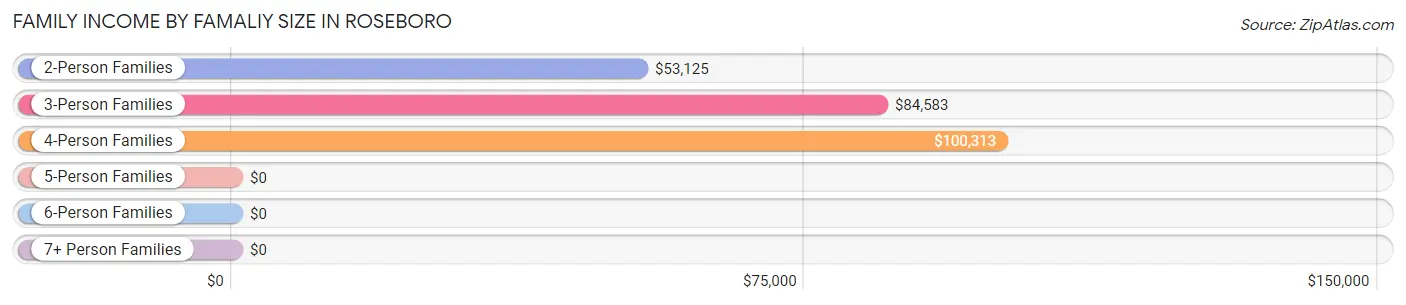
Family Income by Famaliy Size in Roseboro
4-person families (60 | 27.3%) account for the highest median family income in Roseboro with $100,313 per family, while 3-person families (9 | 4.1%) have the highest median income of $28,194 per family member.
| Income Bracket | # Families | Median Income |
| 2-Person Families | 130 (59.1%) | $53,125 |
| 3-Person Families | 9 (4.1%) | $84,583 |
| 4-Person Families | 60 (27.3%) | $100,313 |
| 5-Person Families | 14 (6.4%) | $0 |
| 6-Person Families | 4 (1.8%) | $0 |
| 7+ Person Families | 3 (1.4%) | $0 |
| Total | 220 (100.0%) | $69,583 |
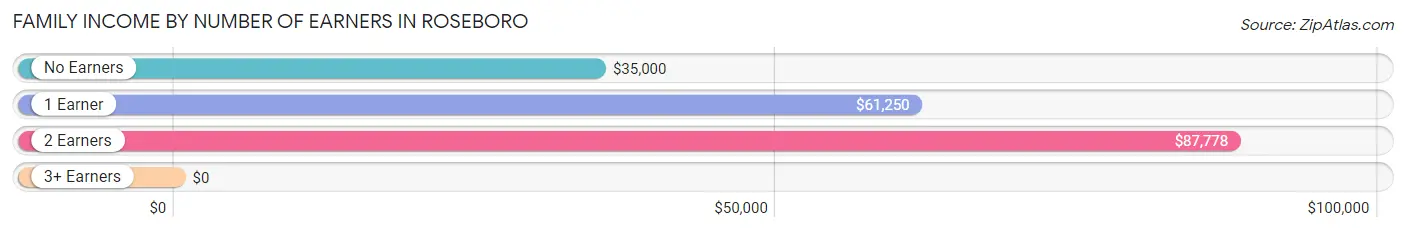
Family Income by Number of Earners in Roseboro
| Number of Earners | # Families | Median Income |
| No Earners | 66 (30.0%) | $35,000 |
| 1 Earner | 70 (31.8%) | $61,250 |
| 2 Earners | 80 (36.4%) | $87,778 |
| 3+ Earners | 4 (1.8%) | $0 |
| Total | 220 (100.0%) | $69,583 |
Household Income in Roseboro
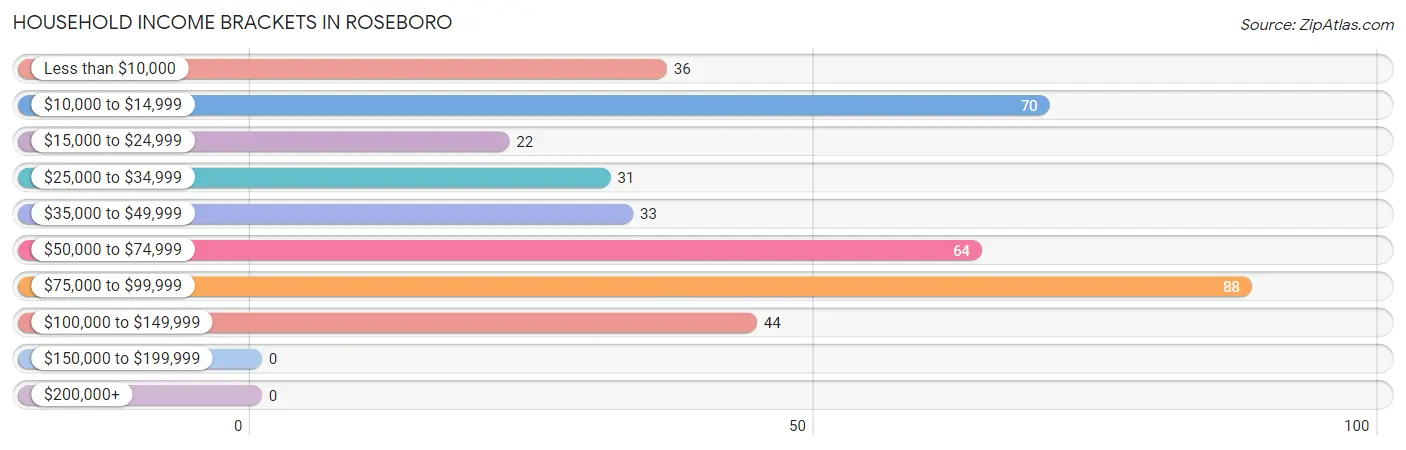
Household Income Brackets in Roseboro
With 88 households falling in the category, the $75,000 to $99,999 income range is the most frequent in Roseboro, accounting for 22.7% of all households.
| Income Bracket | # Households | % Households |
| Less than $10,000 | 36 | 9.3% |
| $10,000 to $14,999 | 70 | 18.0% |
| $15,000 to $24,999 | 22 | 5.7% |
| $25,000 to $34,999 | 31 | 8.0% |
| $35,000 to $49,999 | 33 | 8.5% |
| $50,000 to $74,999 | 64 | 16.5% |
| $75,000 to $99,999 | 88 | 22.7% |
| $100,000 to $149,999 | 44 | 11.3% |
| $150,000 to $199,999 | 0 | 0.0% |
| $200,000+ | 0 | 0.0% |
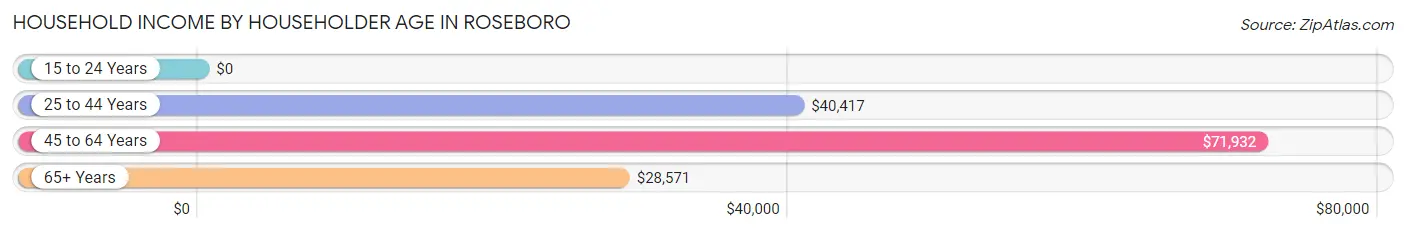
Household Income by Householder Age in Roseboro
The median household income in Roseboro is $50,455, with the highest median household income of $71,932 found in the 45 to 64 years age bracket for the primary householder. A total of 111 households (28.6%) fall into this category. Meanwhile, the 15 to 24 years age bracket for the primary householder has the lowest median household income of $0, with 8 households (2.1%) in this group.
| Income Bracket | # Households | Median Income |
| 15 to 24 Years | 8 (2.1%) | $0 |
| 25 to 44 Years | 125 (32.2%) | $40,417 |
| 45 to 64 Years | 111 (28.6%) | $71,932 |
| 65+ Years | 144 (37.1%) | $28,571 |
| Total | 388 (100.0%) | $50,455 |
Poverty in Roseboro
Income Below Poverty by Sex and Age in Roseboro
With 17.6% poverty level for males and 38.6% for females among the residents of Roseboro, under 5 year old males and 12 to 14 year old females are the most vulnerable to poverty, with 21 males (46.7%) and 3 females (100.0%) in their respective age groups living below the poverty level.
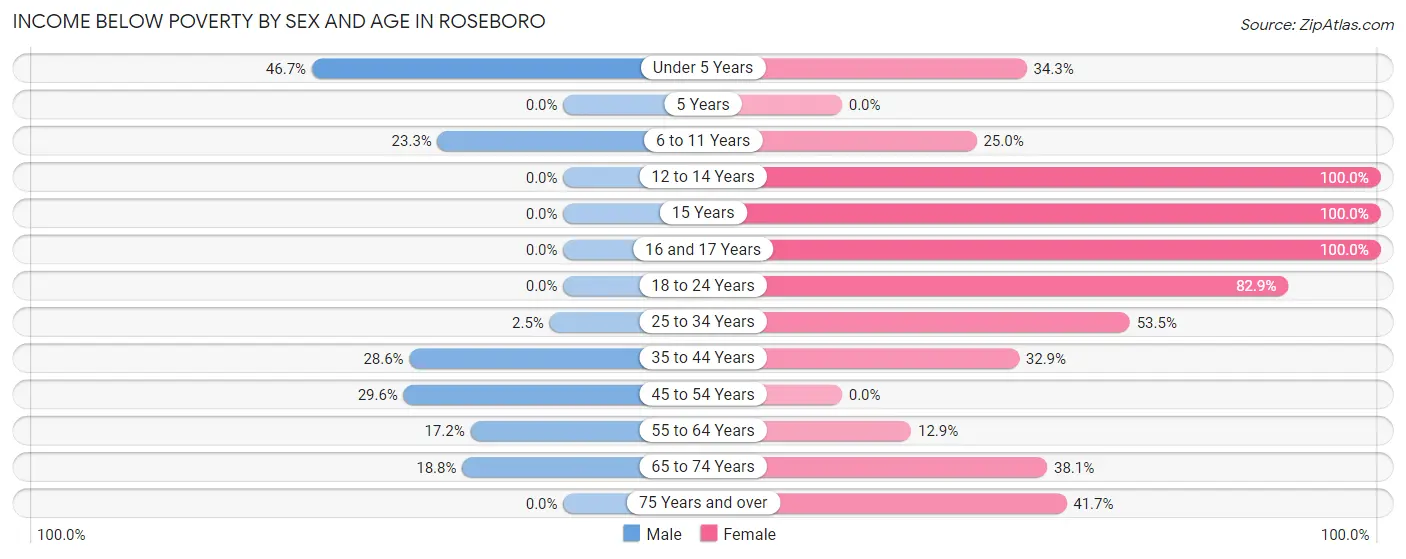
| Age Bracket | Male | Female |
| Under 5 Years | 21 (46.7%) | 12 (34.3%) |
| 5 Years | 0 (0.0%) | 0 (0.0%) |
| 6 to 11 Years | 14 (23.3%) | 3 (25.0%) |
| 12 to 14 Years | 0 (0.0%) | 3 (100.0%) |
| 15 Years | 0 (0.0%) | 4 (100.0%) |
| 16 and 17 Years | 0 (0.0%) | 3 (100.0%) |
| 18 to 24 Years | 0 (0.0%) | 29 (82.9%) |
| 25 to 34 Years | 3 (2.5%) | 31 (53.4%) |
| 35 to 44 Years | 16 (28.6%) | 23 (32.9%) |
| 45 to 54 Years | 8 (29.6%) | 0 (0.0%) |
| 55 to 64 Years | 10 (17.2%) | 9 (12.9%) |
| 65 to 74 Years | 9 (18.8%) | 24 (38.1%) |
| 75 Years and over | 0 (0.0%) | 25 (41.7%) |
| Total | 81 (17.6%) | 166 (38.6%) |
Income Above Poverty by Sex and Age in Roseboro
According to the poverty statistics in Roseboro, males aged 12 to 14 years and females aged 45 to 54 years are the age groups that are most secure financially, with 100.0% of males and 100.0% of females in these age groups living above the poverty line.
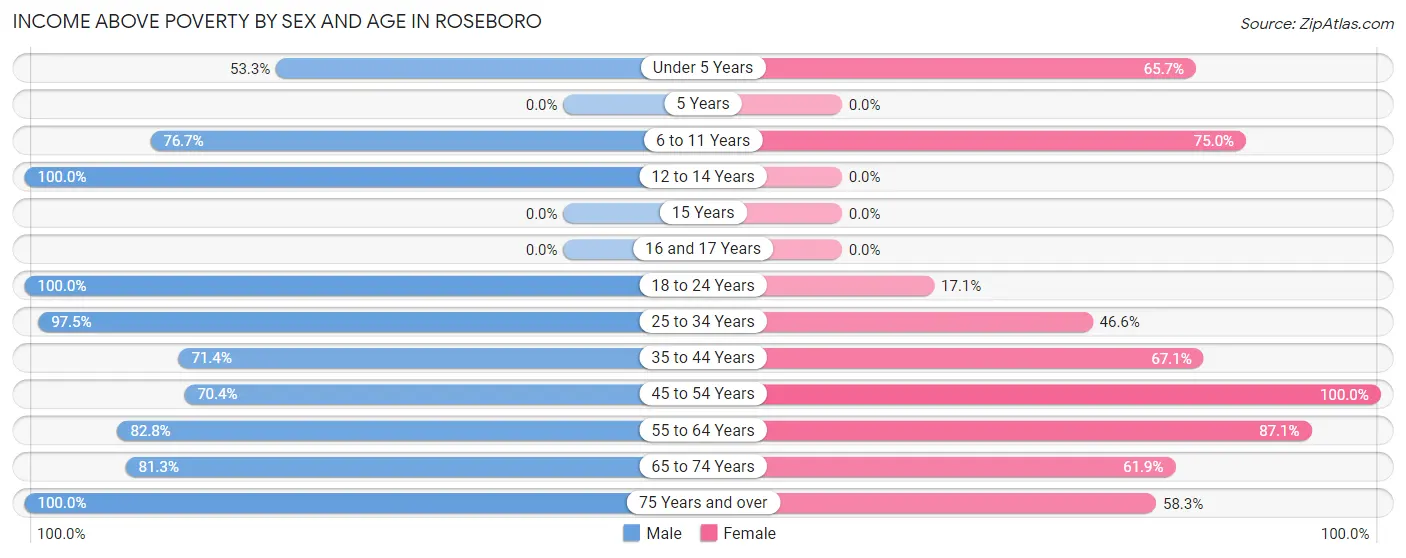
| Age Bracket | Male | Female |
| Under 5 Years | 24 (53.3%) | 23 (65.7%) |
| 5 Years | 0 (0.0%) | 0 (0.0%) |
| 6 to 11 Years | 46 (76.7%) | 9 (75.0%) |
| 12 to 14 Years | 8 (100.0%) | 0 (0.0%) |
| 15 Years | 0 (0.0%) | 0 (0.0%) |
| 16 and 17 Years | 0 (0.0%) | 0 (0.0%) |
| 18 to 24 Years | 15 (100.0%) | 6 (17.1%) |
| 25 to 34 Years | 115 (97.5%) | 27 (46.6%) |
| 35 to 44 Years | 40 (71.4%) | 47 (67.1%) |
| 45 to 54 Years | 19 (70.4%) | 17 (100.0%) |
| 55 to 64 Years | 48 (82.8%) | 61 (87.1%) |
| 65 to 74 Years | 39 (81.2%) | 39 (61.9%) |
| 75 Years and over | 24 (100.0%) | 35 (58.3%) |
| Total | 378 (82.4%) | 264 (61.4%) |
Income Below Poverty Among Married-Couple Families in Roseboro
The poverty statistics for married-couple families in Roseboro show that 16.3% or 20 of the total 123 families live below the poverty line. Families with 1 or 2 children have the highest poverty rate of 41.2%, comprising of 14 families. On the other hand, families with 3 or 4 children have the lowest poverty rate of 0.0%, which includes 0 families.
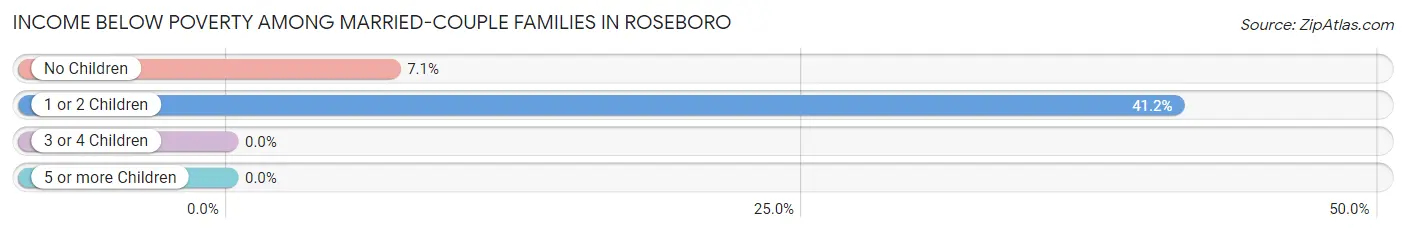
| Children | Above Poverty | Below Poverty |
| No Children | 79 (92.9%) | 6 (7.1%) |
| 1 or 2 Children | 20 (58.8%) | 14 (41.2%) |
| 3 or 4 Children | 4 (100.0%) | 0 (0.0%) |
| 5 or more Children | 0 (0.0%) | 0 (0.0%) |
| Total | 103 (83.7%) | 20 (16.3%) |
Income Below Poverty Among Single-Parent Households in Roseboro
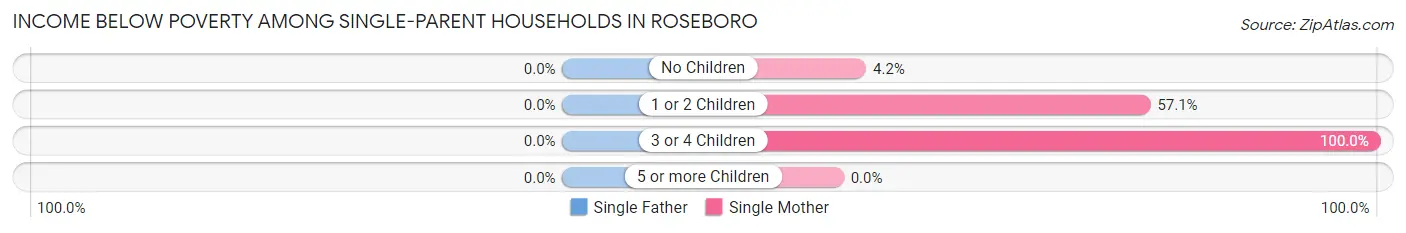
| Children | Single Father | Single Mother |
| No Children | 0 (0.0%) | 1 (4.2%) |
| 1 or 2 Children | 0 (0.0%) | 12 (57.1%) |
| 3 or 4 Children | 0 (0.0%) | 3 (100.0%) |
| 5 or more Children | 0 (0.0%) | 0 (0.0%) |
| Total | 0 (0.0%) | 16 (33.3%) |
Income Below Poverty Among Married-Couple vs Single-Parent Households in Roseboro
The poverty data for Roseboro shows that 20 of the married-couple family households (16.3%) and 16 of the single-parent households (16.5%) are living below the poverty level. Within the married-couple family households, those with 1 or 2 children have the highest poverty rate, with 14 households (41.2%) falling below the poverty line. Among the single-parent households, those with 3 or 4 children have the highest poverty rate, with 3 household (100.0%) living below poverty.
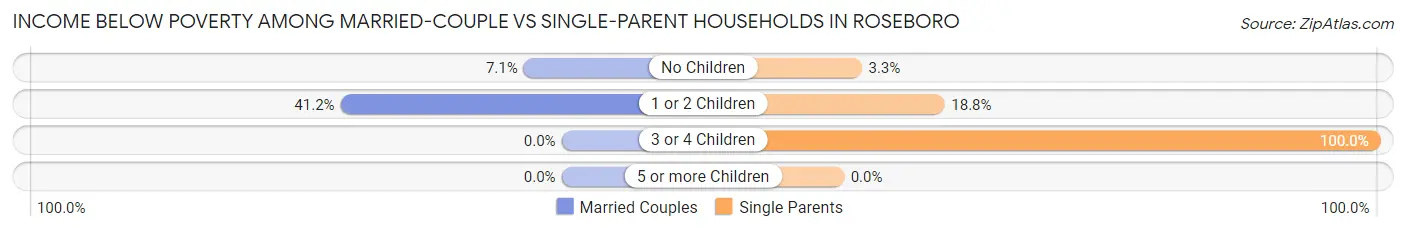
| Children | Married-Couple Families | Single-Parent Households |
| No Children | 6 (7.1%) | 1 (3.3%) |
| 1 or 2 Children | 14 (41.2%) | 12 (18.8%) |
| 3 or 4 Children | 0 (0.0%) | 3 (100.0%) |
| 5 or more Children | 0 (0.0%) | 0 (0.0%) |
| Total | 20 (16.3%) | 16 (16.5%) |
Employment Characteristics in Roseboro
Employment by Class of Employer in Roseboro
Among the 339 employed individuals in Roseboro, private company employees (199 | 58.7%), self-employed (incorporated) (66 | 19.5%), and local government employees (22 | 6.5%) make up the most common classes of employment.
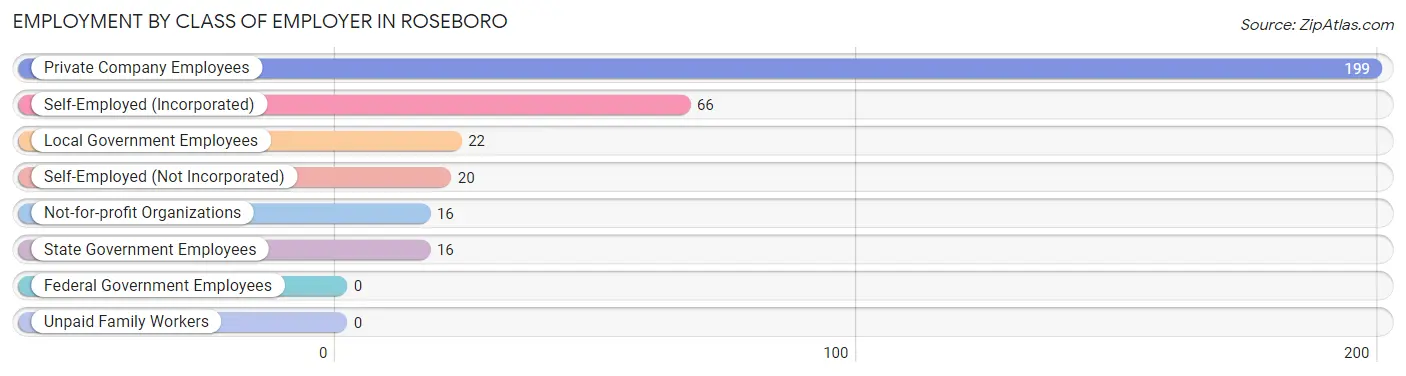
| Employer Class | # Employees | % Employees |
| Private Company Employees | 199 | 58.7% |
| Self-Employed (Incorporated) | 66 | 19.5% |
| Self-Employed (Not Incorporated) | 20 | 5.9% |
| Not-for-profit Organizations | 16 | 4.7% |
| Local Government Employees | 22 | 6.5% |
| State Government Employees | 16 | 4.7% |
| Federal Government Employees | 0 | 0.0% |
| Unpaid Family Workers | 0 | 0.0% |
| Total | 339 | 100.0% |
Employment Status by Age in Roseboro
According to the labor force statistics for Roseboro, out of the total population over 16 years of age (722), 49.3% or 356 individuals are in the labor force, with 2.0% or 7 of them unemployed. The age group with the highest labor force participation rate is 55 to 59 years, with 88.3% or 68 individuals in the labor force. Within the labor force, the 60 to 64 years age range has the highest percentage of unemployed individuals, with 50.0% or 3 of them being unemployed.
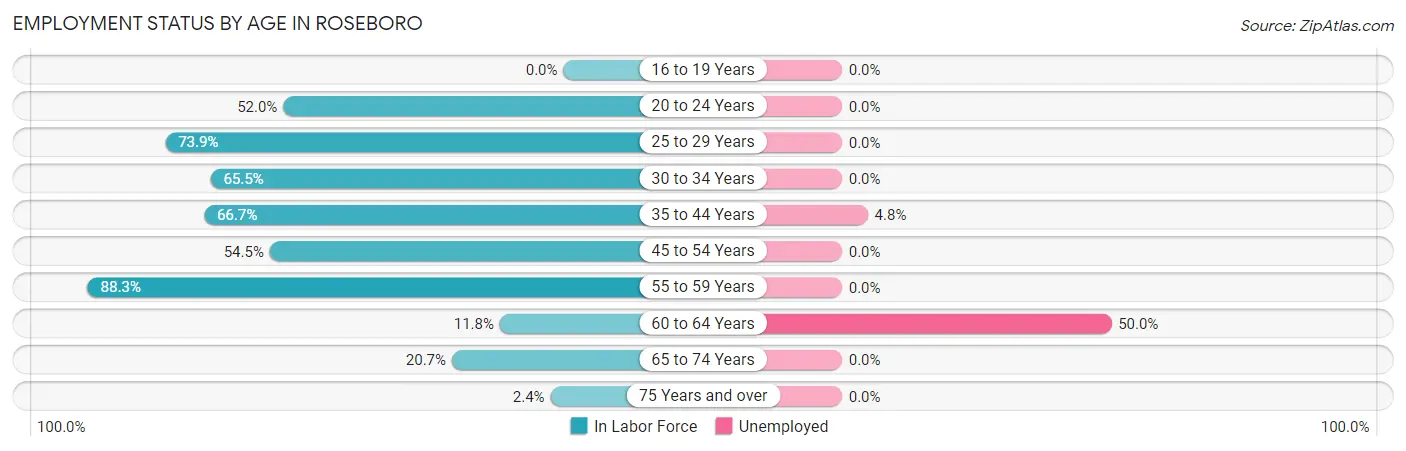
| Age Bracket | In Labor Force | Unemployed |
| 16 to 19 Years | 0 (0.0%) | 0 (0.0%) |
| 20 to 24 Years | 26 (52.0%) | 0 (0.0%) |
| 25 to 29 Years | 68 (73.9%) | 0 (0.0%) |
| 30 to 34 Years | 55 (65.5%) | 0 (0.0%) |
| 35 to 44 Years | 84 (66.7%) | 4 (4.8%) |
| 45 to 54 Years | 24 (54.5%) | 0 (0.0%) |
| 55 to 59 Years | 68 (88.3%) | 0 (0.0%) |
| 60 to 64 Years | 6 (11.8%) | 3 (50.0%) |
| 65 to 74 Years | 23 (20.7%) | 0 (0.0%) |
| 75 Years and over | 2 (2.4%) | 0 (0.0%) |
| Total | 356 (49.3%) | 7 (2.0%) |
Employment Status by Educational Attainment in Roseboro
According to labor force statistics for Roseboro, 64.3% of individuals (305) out of the total population between 25 and 64 years of age (474) are in the labor force, with 2.3% or 7 of them being unemployed. The group with the highest labor force participation rate are those with the educational attainment of less than high school, with 100.0% or 29 individuals in the labor force. Within the labor force, individuals with bachelor's degree or higher education have the highest percentage of unemployment, with 5.0% or 4 of them being unemployed.
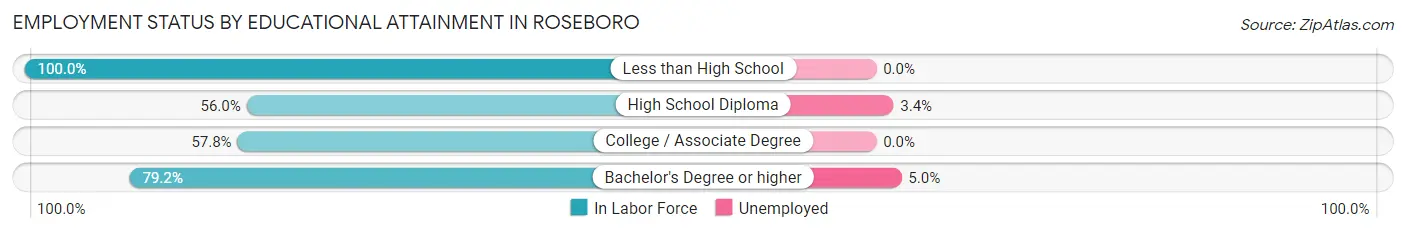
| Educational Attainment | In Labor Force | Unemployed |
| Less than High School | 29 (100.0%) | 0 (0.0%) |
| High School Diploma | 89 (56.0%) | 5 (3.4%) |
| College / Associate Degree | 107 (57.8%) | 0 (0.0%) |
| Bachelor's Degree or higher | 80 (79.2%) | 5 (5.0%) |
| Total | 305 (64.3%) | 11 (2.3%) |
Employment Occupations by Sex in Roseboro
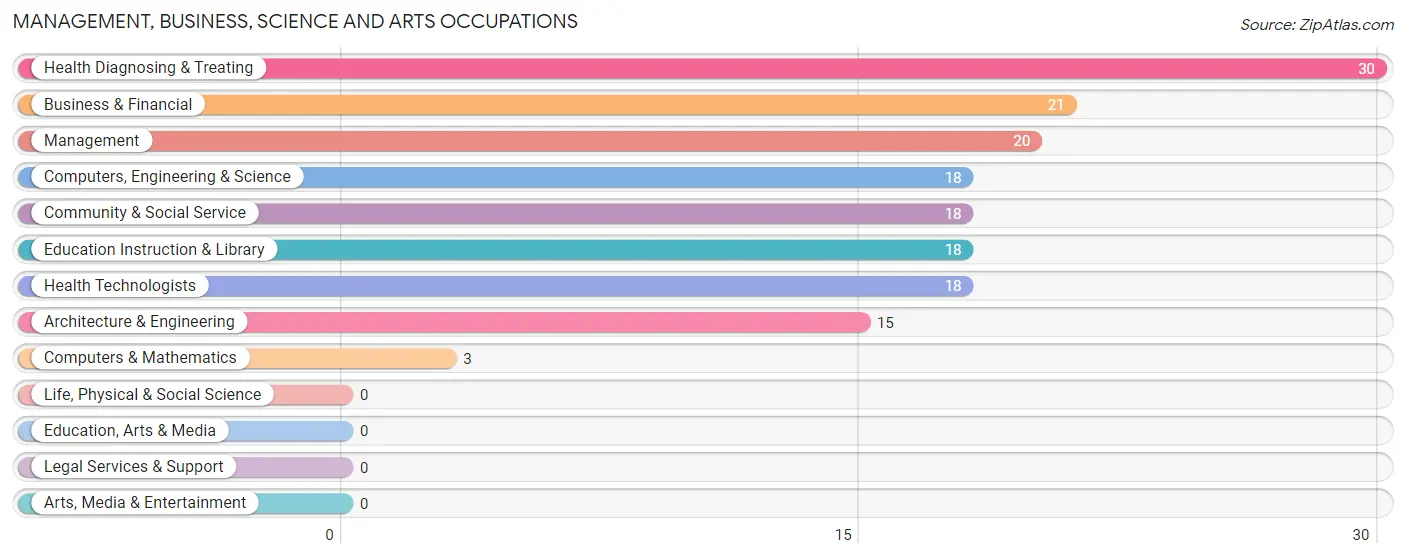
Management, Business, Science and Arts Occupations
The most common Management, Business, Science and Arts occupations in Roseboro are Health Diagnosing & Treating (30 | 8.6%), Business & Financial (21 | 6.0%), Management (20 | 5.7%), Computers, Engineering & Science (18 | 5.2%), and Community & Social Service (18 | 5.2%).
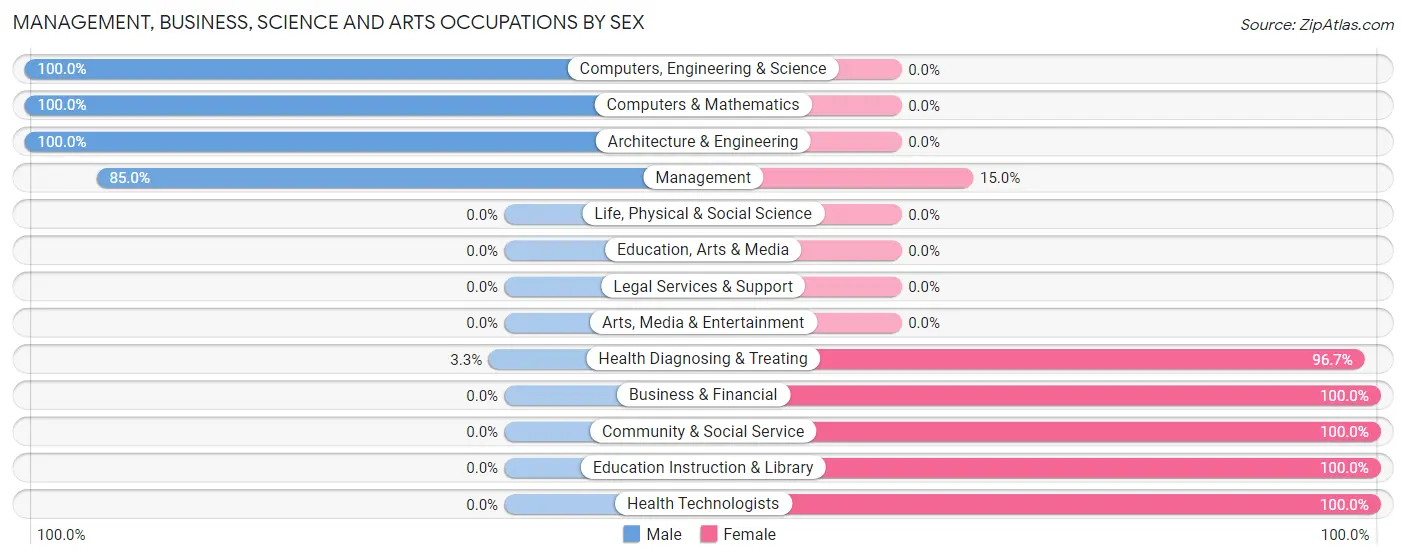
Management, Business, Science and Arts Occupations by Sex
Within the Management, Business, Science and Arts occupations in Roseboro, the most male-oriented occupations are Computers, Engineering & Science (100.0%), Computers & Mathematics (100.0%), and Architecture & Engineering (100.0%), while the most female-oriented occupations are Business & Financial (100.0%), Community & Social Service (100.0%), and Education Instruction & Library (100.0%).
| Occupation | Male | Female |
| Management | 17 (85.0%) | 3 (15.0%) |
| Business & Financial | 0 (0.0%) | 21 (100.0%) |
| Computers, Engineering & Science | 18 (100.0%) | 0 (0.0%) |
| Computers & Mathematics | 3 (100.0%) | 0 (0.0%) |
| Architecture & Engineering | 15 (100.0%) | 0 (0.0%) |
| Life, Physical & Social Science | 0 (0.0%) | 0 (0.0%) |
| Community & Social Service | 0 (0.0%) | 18 (100.0%) |
| Education, Arts & Media | 0 (0.0%) | 0 (0.0%) |
| Legal Services & Support | 0 (0.0%) | 0 (0.0%) |
| Education Instruction & Library | 0 (0.0%) | 18 (100.0%) |
| Arts, Media & Entertainment | 0 (0.0%) | 0 (0.0%) |
| Health Diagnosing & Treating | 1 (3.3%) | 29 (96.7%) |
| Health Technologists | 0 (0.0%) | 18 (100.0%) |
| Total (Category) | 36 (33.6%) | 71 (66.4%) |
| Total (Overall) | 201 (57.6%) | 148 (42.4%) |
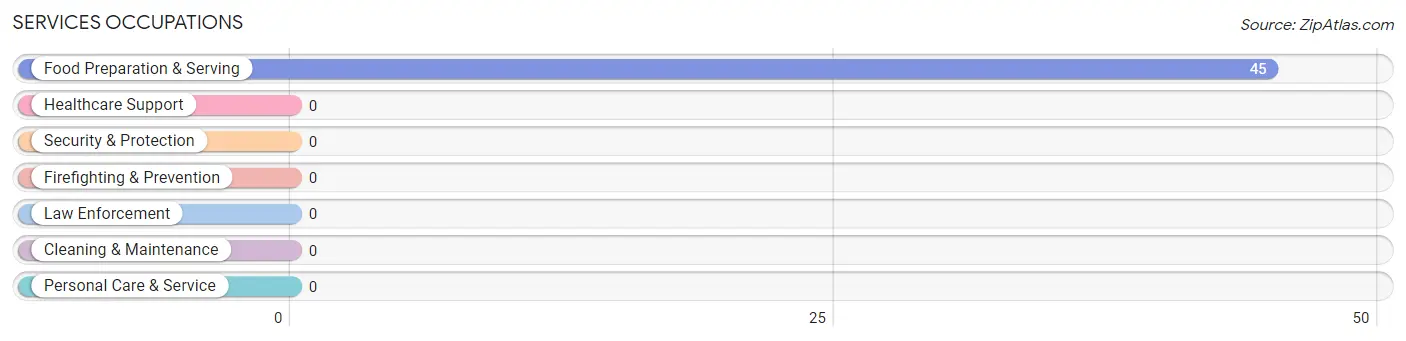
Services Occupations
The most common Services occupations in Roseboro are , and Food Preparation & Serving (45 | 12.9%).
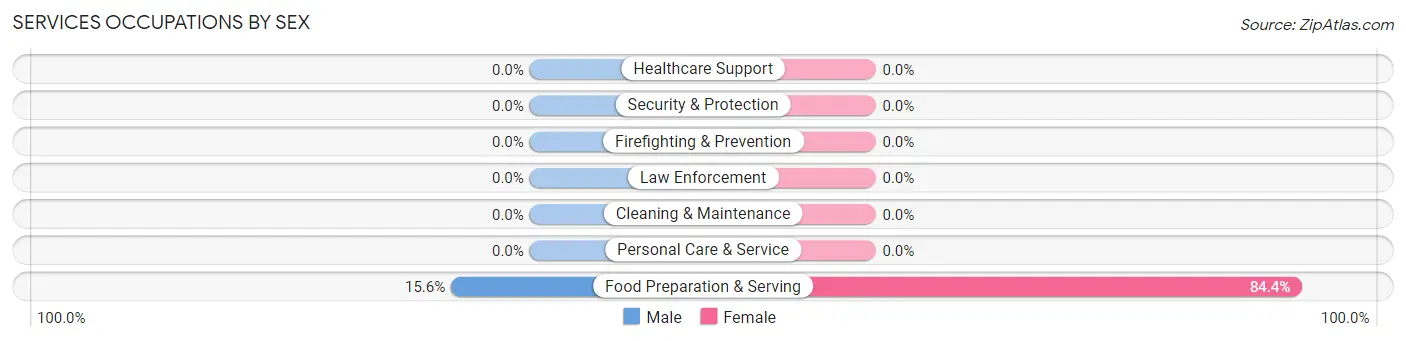
Services Occupations by Sex
| Occupation | Male | Female |
| Healthcare Support | 0 (0.0%) | 0 (0.0%) |
| Security & Protection | 0 (0.0%) | 0 (0.0%) |
| Firefighting & Prevention | 0 (0.0%) | 0 (0.0%) |
| Law Enforcement | 0 (0.0%) | 0 (0.0%) |
| Food Preparation & Serving | 7 (15.6%) | 38 (84.4%) |
| Cleaning & Maintenance | 0 (0.0%) | 0 (0.0%) |
| Personal Care & Service | 0 (0.0%) | 0 (0.0%) |
| Total (Category) | 7 (15.6%) | 38 (84.4%) |
| Total (Overall) | 201 (57.6%) | 148 (42.4%) |
Sales and Office Occupations
The most common Sales and Office occupations in Roseboro are Sales & Related (53 | 15.2%), and Office & Administration (20 | 5.7%).
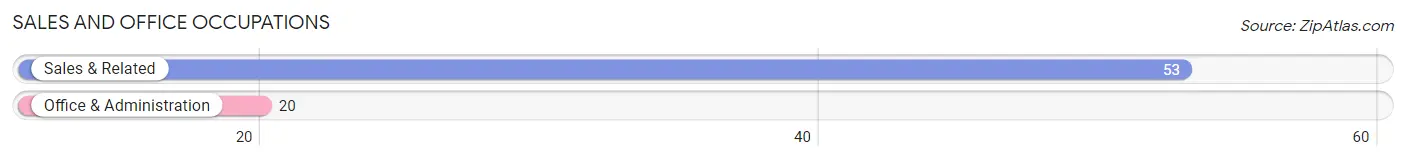
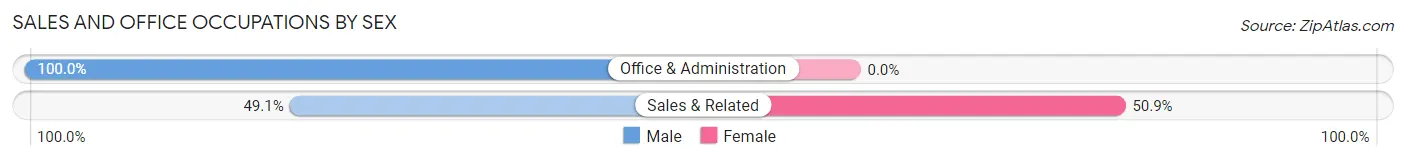
Sales and Office Occupations by Sex
| Occupation | Male | Female |
| Sales & Related | 26 (49.1%) | 27 (50.9%) |
| Office & Administration | 20 (100.0%) | 0 (0.0%) |
| Total (Category) | 46 (63.0%) | 27 (37.0%) |
| Total (Overall) | 201 (57.6%) | 148 (42.4%) |
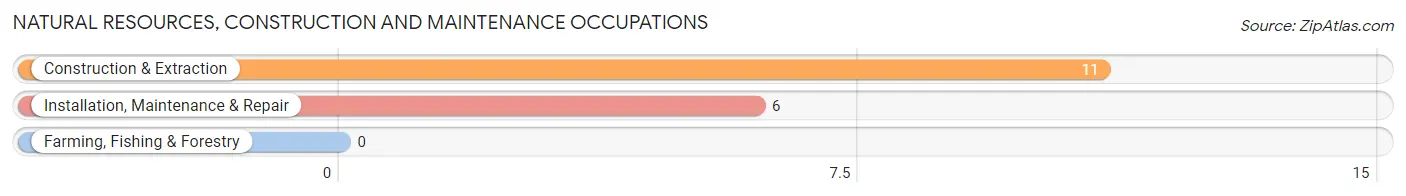
Natural Resources, Construction and Maintenance Occupations
The most common Natural Resources, Construction and Maintenance occupations in Roseboro are Construction & Extraction (11 | 3.2%), and Installation, Maintenance & Repair (6 | 1.7%).
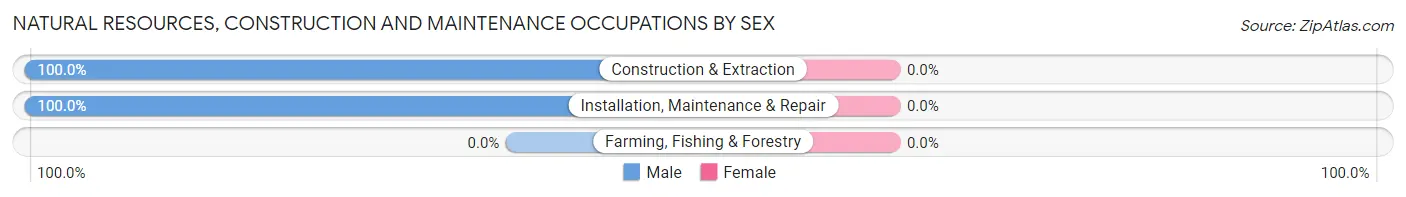
Natural Resources, Construction and Maintenance Occupations by Sex
| Occupation | Male | Female |
| Farming, Fishing & Forestry | 0 (0.0%) | 0 (0.0%) |
| Construction & Extraction | 11 (100.0%) | 0 (0.0%) |
| Installation, Maintenance & Repair | 6 (100.0%) | 0 (0.0%) |
| Total (Category) | 17 (100.0%) | 0 (0.0%) |
| Total (Overall) | 201 (57.6%) | 148 (42.4%) |
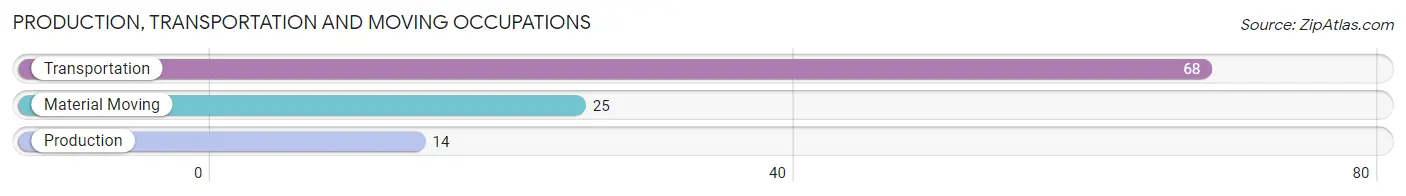
Production, Transportation and Moving Occupations
The most common Production, Transportation and Moving occupations in Roseboro are Transportation (68 | 19.5%), Material Moving (25 | 7.2%), and Production (14 | 4.0%).
Production, Transportation and Moving Occupations by Sex
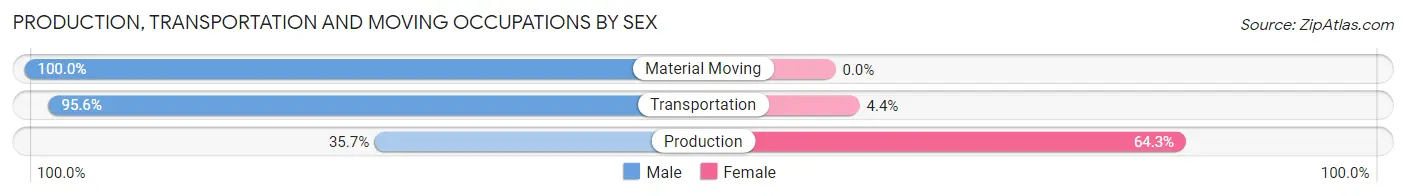
| Occupation | Male | Female |
| Production | 5 (35.7%) | 9 (64.3%) |
| Transportation | 65 (95.6%) | 3 (4.4%) |
| Material Moving | 25 (100.0%) | 0 (0.0%) |
| Total (Category) | 95 (88.8%) | 12 (11.2%) |
| Total (Overall) | 201 (57.6%) | 148 (42.4%) |
Employment Industries by Sex in Roseboro
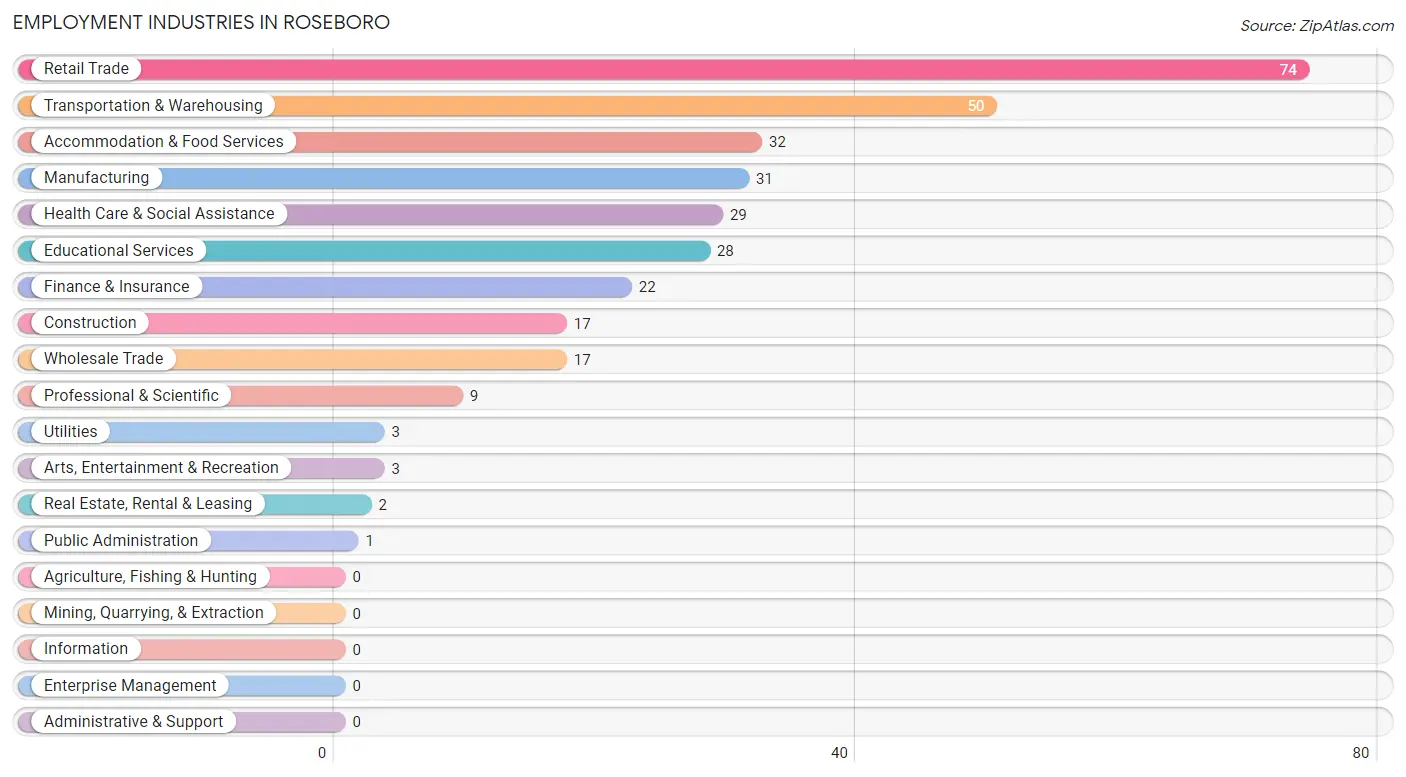
Employment Industries in Roseboro
The major employment industries in Roseboro include Retail Trade (74 | 21.2%), Transportation & Warehousing (50 | 14.3%), Accommodation & Food Services (32 | 9.2%), Manufacturing (31 | 8.9%), and Health Care & Social Assistance (29 | 8.3%).
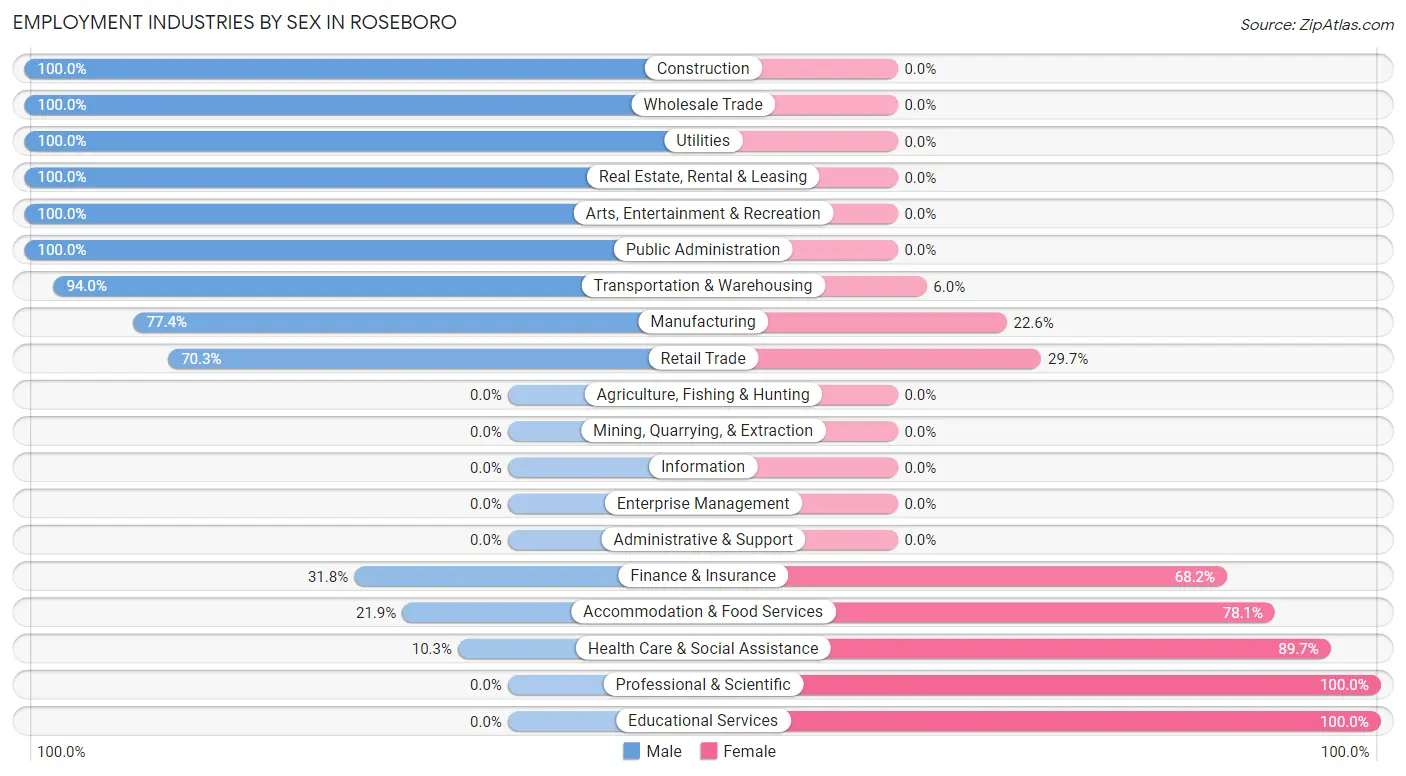
Employment Industries by Sex in Roseboro
The Roseboro industries that see more men than women are Construction (100.0%), Wholesale Trade (100.0%), and Utilities (100.0%), whereas the industries that tend to have a higher number of women are Professional & Scientific (100.0%), Educational Services (100.0%), and Health Care & Social Assistance (89.7%).
| Industry | Male | Female |
| Agriculture, Fishing & Hunting | 0 (0.0%) | 0 (0.0%) |
| Mining, Quarrying, & Extraction | 0 (0.0%) | 0 (0.0%) |
| Construction | 17 (100.0%) | 0 (0.0%) |
| Manufacturing | 24 (77.4%) | 7 (22.6%) |
| Wholesale Trade | 17 (100.0%) | 0 (0.0%) |
| Retail Trade | 52 (70.3%) | 22 (29.7%) |
| Transportation & Warehousing | 47 (94.0%) | 3 (6.0%) |
| Utilities | 3 (100.0%) | 0 (0.0%) |
| Information | 0 (0.0%) | 0 (0.0%) |
| Finance & Insurance | 7 (31.8%) | 15 (68.2%) |
| Real Estate, Rental & Leasing | 2 (100.0%) | 0 (0.0%) |
| Professional & Scientific | 0 (0.0%) | 9 (100.0%) |
| Enterprise Management | 0 (0.0%) | 0 (0.0%) |
| Administrative & Support | 0 (0.0%) | 0 (0.0%) |
| Educational Services | 0 (0.0%) | 28 (100.0%) |
| Health Care & Social Assistance | 3 (10.3%) | 26 (89.7%) |
| Arts, Entertainment & Recreation | 3 (100.0%) | 0 (0.0%) |
| Accommodation & Food Services | 7 (21.9%) | 25 (78.1%) |
| Public Administration | 1 (100.0%) | 0 (0.0%) |
| Total | 201 (57.6%) | 148 (42.4%) |
Education in Roseboro
School Enrollment in Roseboro
The most common levels of schooling among the 122 students in Roseboro are middle school (42 | 34.4%), elementary school (24 | 19.7%), and high school (18 | 14.7%).
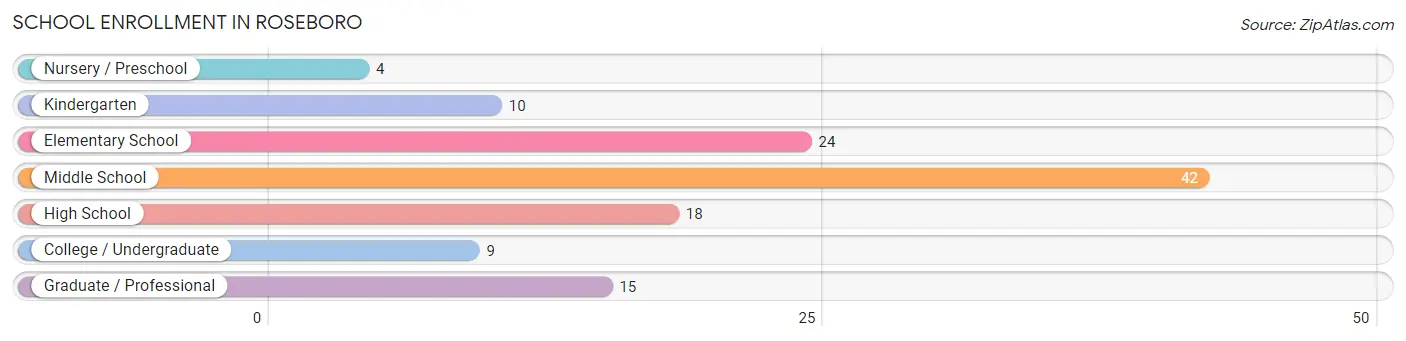
| School Level | # Students | % Students |
| Nursery / Preschool | 4 | 3.3% |
| Kindergarten | 10 | 8.2% |
| Elementary School | 24 | 19.7% |
| Middle School | 42 | 34.4% |
| High School | 18 | 14.7% |
| College / Undergraduate | 9 | 7.4% |
| Graduate / Professional | 15 | 12.3% |
| Total | 122 | 100.0% |
School Enrollment by Age by Funding Source in Roseboro
Out of a total of 122 students who are enrolled in schools in Roseboro, 25 (20.5%) attend a private institution, while the remaining 97 (79.5%) are enrolled in public schools. The age group of 20 to 24 year olds has the highest likelihood of being enrolled in private schools, with 13 (100.0% in the age bracket) enrolled. Conversely, the age group of 3 to 4 year olds has the lowest likelihood of being enrolled in a private school, with 4 (100.0% in the age bracket) attending a public institution.
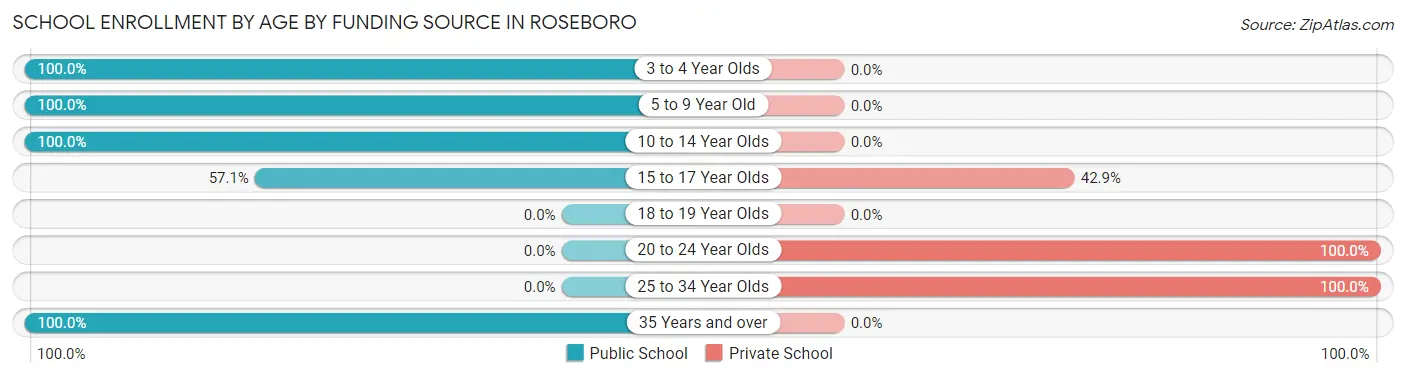
| Age Bracket | Public School | Private School |
| 3 to 4 Year Olds | 4 (100.0%) | 0 (0.0%) |
| 5 to 9 Year Old | 34 (100.0%) | 0 (0.0%) |
| 10 to 14 Year Olds | 50 (100.0%) | 0 (0.0%) |
| 15 to 17 Year Olds | 4 (57.1%) | 3 (42.9%) |
| 18 to 19 Year Olds | 0 (0.0%) | 0 (0.0%) |
| 20 to 24 Year Olds | 0 (0.0%) | 13 (100.0%) |
| 25 to 34 Year Olds | 0 (0.0%) | 9 (100.0%) |
| 35 Years and over | 5 (100.0%) | 0 (0.0%) |
| Total | 97 (79.5%) | 25 (20.5%) |
Educational Attainment by Field of Study in Roseboro
Business (30 | 24.2%), psychology (26 | 21.0%), physical & health sciences (19 | 15.3%), education (19 | 15.3%), and science & technology (13 | 10.5%) are the most common fields of study among 124 individuals in Roseboro who have obtained a bachelor's degree or higher.
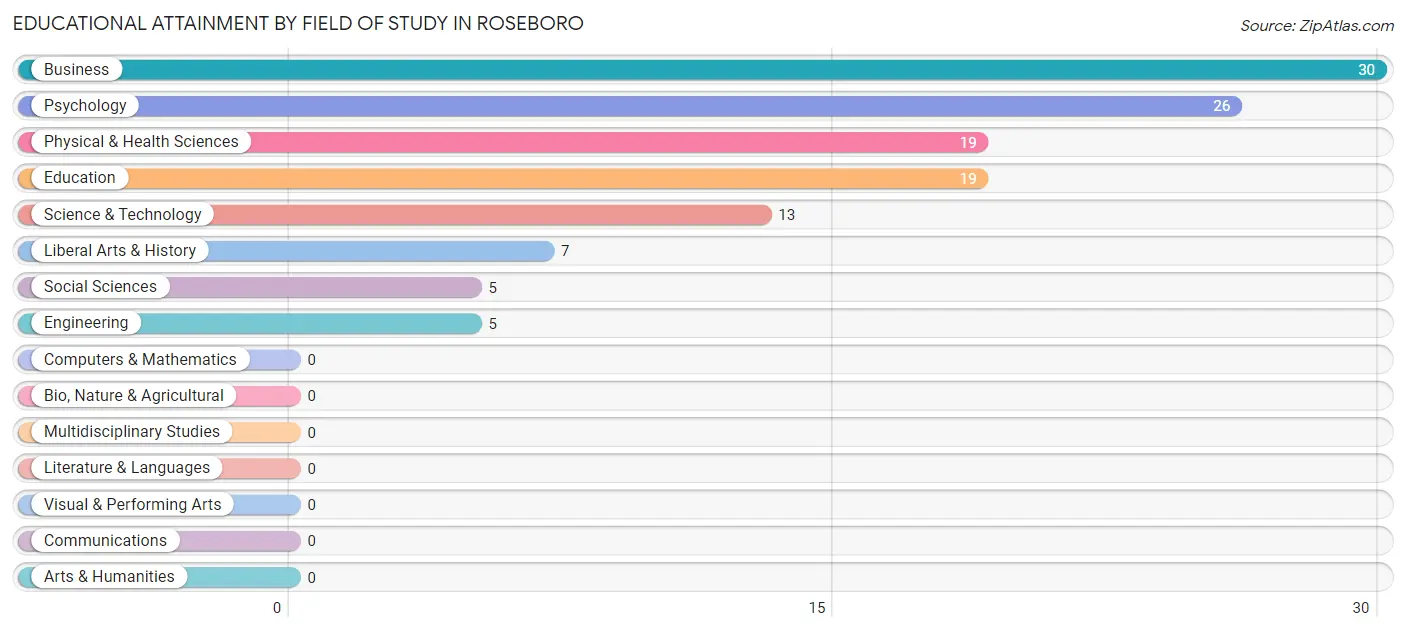
| Field of Study | # Graduates | % Graduates |
| Computers & Mathematics | 0 | 0.0% |
| Bio, Nature & Agricultural | 0 | 0.0% |
| Physical & Health Sciences | 19 | 15.3% |
| Psychology | 26 | 21.0% |
| Social Sciences | 5 | 4.0% |
| Engineering | 5 | 4.0% |
| Multidisciplinary Studies | 0 | 0.0% |
| Science & Technology | 13 | 10.5% |
| Business | 30 | 24.2% |
| Education | 19 | 15.3% |
| Literature & Languages | 0 | 0.0% |
| Liberal Arts & History | 7 | 5.7% |
| Visual & Performing Arts | 0 | 0.0% |
| Communications | 0 | 0.0% |
| Arts & Humanities | 0 | 0.0% |
| Total | 124 | 100.0% |
Transportation & Commute in Roseboro
Vehicle Availability by Sex in Roseboro
The most prevalent vehicle ownership categories in Roseboro are males with 2 vehicles (92, accounting for 45.8%) and females with 2 vehicles (40, making up 66.7%).
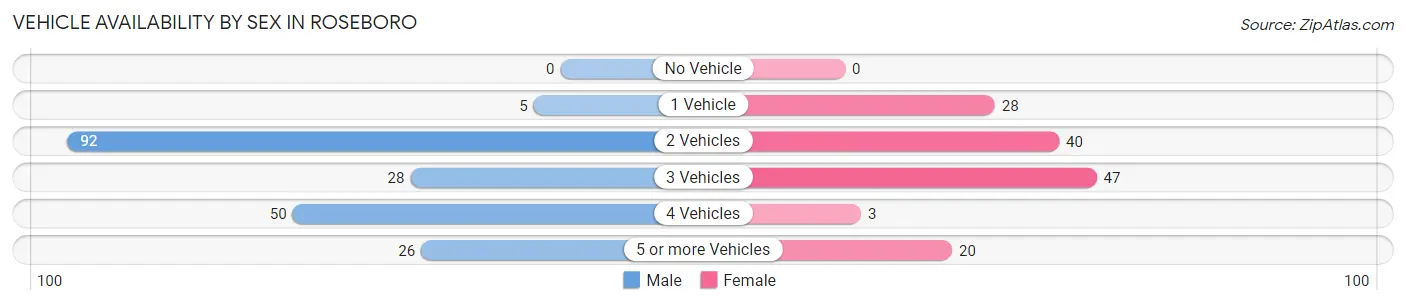
| Vehicles Available | Male | Female |
| No Vehicle | 0 (0.0%) | 0 (0.0%) |
| 1 Vehicle | 5 (2.5%) | 28 (20.3%) |
| 2 Vehicles | 92 (45.8%) | 40 (29.0%) |
| 3 Vehicles | 28 (13.9%) | 47 (34.1%) |
| 4 Vehicles | 50 (24.9%) | 3 (2.2%) |
| 5 or more Vehicles | 26 (12.9%) | 20 (14.5%) |
| Total | 201 (100.0%) | 138 (100.0%) |
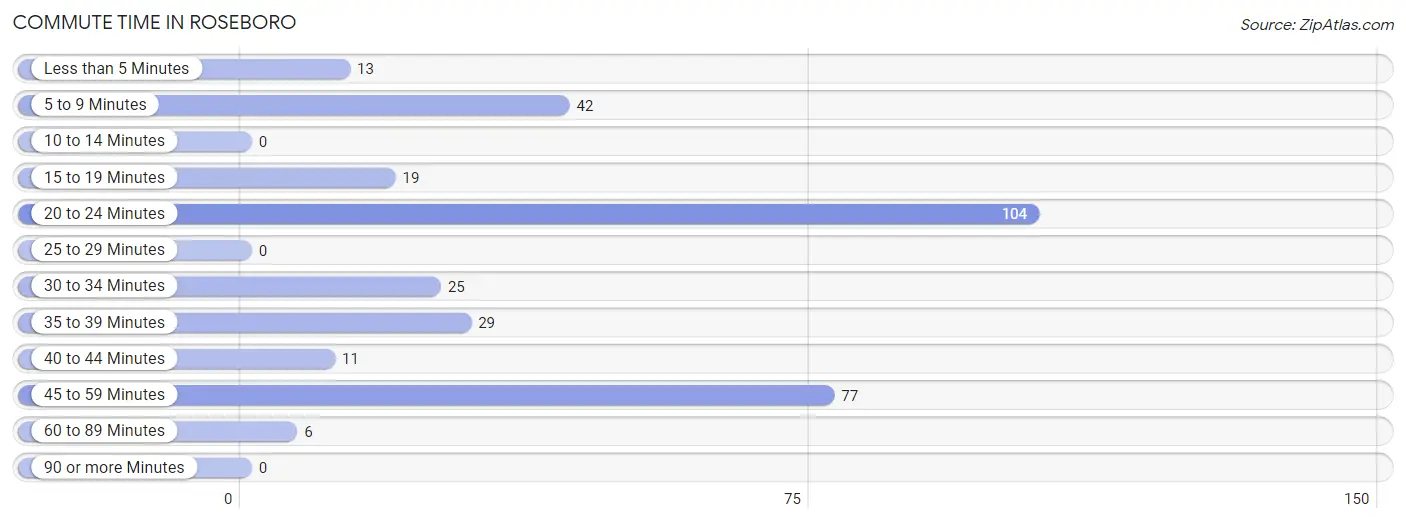
Commute Time in Roseboro
The most frequently occuring commute durations in Roseboro are 20 to 24 minutes (104 commuters, 31.9%), 45 to 59 minutes (77 commuters, 23.6%), and 5 to 9 minutes (42 commuters, 12.9%).
| Commute Time | # Commuters | % Commuters |
| Less than 5 Minutes | 13 | 4.0% |
| 5 to 9 Minutes | 42 | 12.9% |
| 10 to 14 Minutes | 0 | 0.0% |
| 15 to 19 Minutes | 19 | 5.8% |
| 20 to 24 Minutes | 104 | 31.9% |
| 25 to 29 Minutes | 0 | 0.0% |
| 30 to 34 Minutes | 25 | 7.7% |
| 35 to 39 Minutes | 29 | 8.9% |
| 40 to 44 Minutes | 11 | 3.4% |
| 45 to 59 Minutes | 77 | 23.6% |
| 60 to 89 Minutes | 6 | 1.8% |
| 90 or more Minutes | 0 | 0.0% |
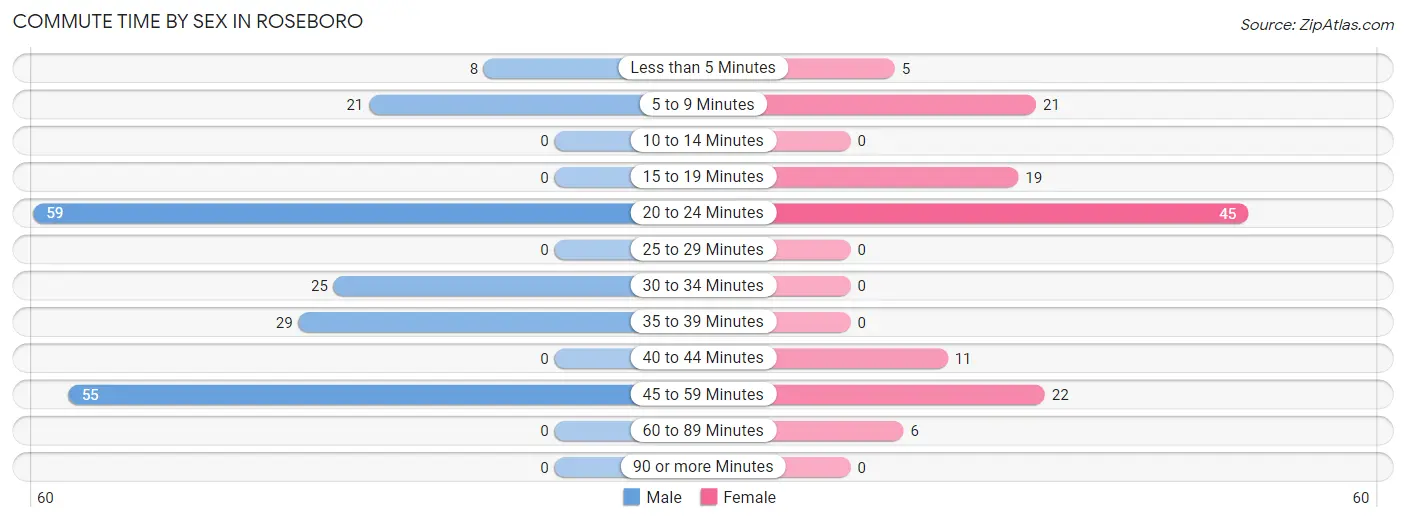
Commute Time by Sex in Roseboro
The most common commute times in Roseboro are 20 to 24 minutes (59 commuters, 29.9%) for males and 20 to 24 minutes (45 commuters, 34.9%) for females.
| Commute Time | Male | Female |
| Less than 5 Minutes | 8 (4.1%) | 5 (3.9%) |
| 5 to 9 Minutes | 21 (10.7%) | 21 (16.3%) |
| 10 to 14 Minutes | 0 (0.0%) | 0 (0.0%) |
| 15 to 19 Minutes | 0 (0.0%) | 19 (14.7%) |
| 20 to 24 Minutes | 59 (29.9%) | 45 (34.9%) |
| 25 to 29 Minutes | 0 (0.0%) | 0 (0.0%) |
| 30 to 34 Minutes | 25 (12.7%) | 0 (0.0%) |
| 35 to 39 Minutes | 29 (14.7%) | 0 (0.0%) |
| 40 to 44 Minutes | 0 (0.0%) | 11 (8.5%) |
| 45 to 59 Minutes | 55 (27.9%) | 22 (17.1%) |
| 60 to 89 Minutes | 0 (0.0%) | 6 (4.6%) |
| 90 or more Minutes | 0 (0.0%) | 0 (0.0%) |
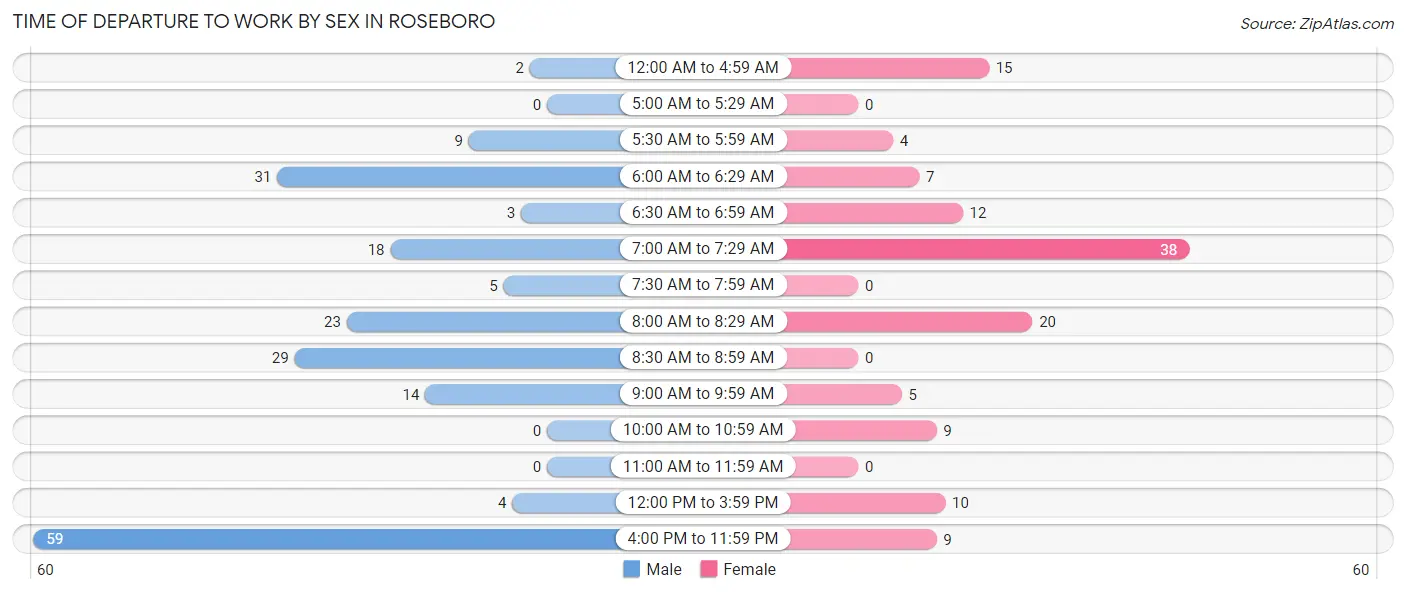
Time of Departure to Work by Sex in Roseboro
The most frequent times of departure to work in Roseboro are 4:00 PM to 11:59 PM (59, 29.9%) for males and 7:00 AM to 7:29 AM (38, 29.5%) for females.
| Time of Departure | Male | Female |
| 12:00 AM to 4:59 AM | 2 (1.0%) | 15 (11.6%) |
| 5:00 AM to 5:29 AM | 0 (0.0%) | 0 (0.0%) |
| 5:30 AM to 5:59 AM | 9 (4.6%) | 4 (3.1%) |
| 6:00 AM to 6:29 AM | 31 (15.7%) | 7 (5.4%) |
| 6:30 AM to 6:59 AM | 3 (1.5%) | 12 (9.3%) |
| 7:00 AM to 7:29 AM | 18 (9.1%) | 38 (29.5%) |
| 7:30 AM to 7:59 AM | 5 (2.5%) | 0 (0.0%) |
| 8:00 AM to 8:29 AM | 23 (11.7%) | 20 (15.5%) |
| 8:30 AM to 8:59 AM | 29 (14.7%) | 0 (0.0%) |
| 9:00 AM to 9:59 AM | 14 (7.1%) | 5 (3.9%) |
| 10:00 AM to 10:59 AM | 0 (0.0%) | 9 (7.0%) |
| 11:00 AM to 11:59 AM | 0 (0.0%) | 0 (0.0%) |
| 12:00 PM to 3:59 PM | 4 (2.0%) | 10 (7.7%) |
| 4:00 PM to 11:59 PM | 59 (29.9%) | 9 (7.0%) |
| Total | 197 (100.0%) | 129 (100.0%) |
Housing Occupancy in Roseboro
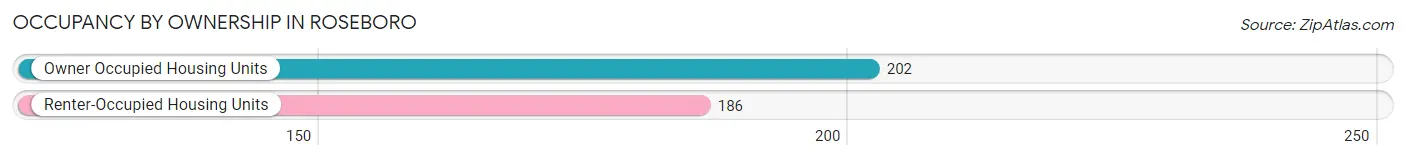
Occupancy by Ownership in Roseboro
Of the total 388 dwellings in Roseboro, owner-occupied units account for 202 (52.1%), while renter-occupied units make up 186 (47.9%).
| Occupancy | # Housing Units | % Housing Units |
| Owner Occupied Housing Units | 202 | 52.1% |
| Renter-Occupied Housing Units | 186 | 47.9% |
| Total Occupied Housing Units | 388 | 100.0% |
Occupancy by Household Size in Roseboro
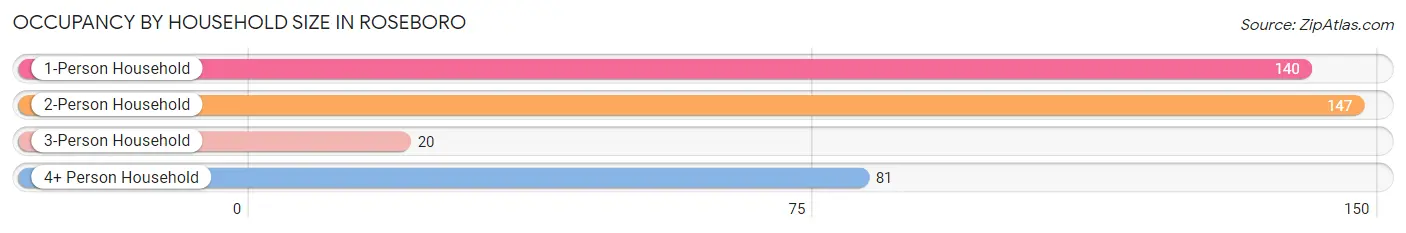
| Household Size | # Housing Units | % Housing Units |
| 1-Person Household | 140 | 36.1% |
| 2-Person Household | 147 | 37.9% |
| 3-Person Household | 20 | 5.1% |
| 4+ Person Household | 81 | 20.9% |
| Total Housing Units | 388 | 100.0% |
Occupancy by Ownership by Household Size in Roseboro
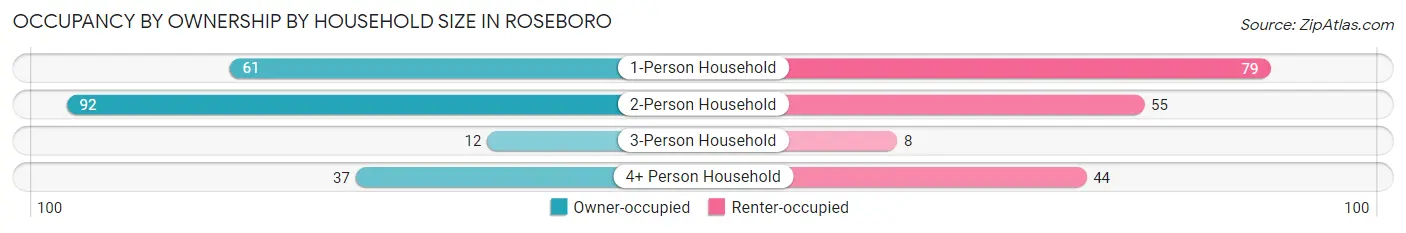
| Household Size | Owner-occupied | Renter-occupied |
| 1-Person Household | 61 (43.6%) | 79 (56.4%) |
| 2-Person Household | 92 (62.6%) | 55 (37.4%) |
| 3-Person Household | 12 (60.0%) | 8 (40.0%) |
| 4+ Person Household | 37 (45.7%) | 44 (54.3%) |
| Total Housing Units | 202 (52.1%) | 186 (47.9%) |
Occupancy by Educational Attainment in Roseboro
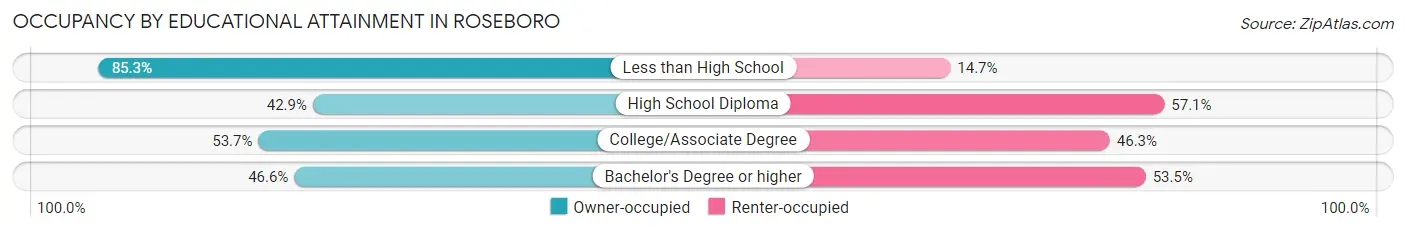
| Household Size | Owner-occupied | Renter-occupied |
| Less than High School | 29 (85.3%) | 5 (14.7%) |
| High School Diploma | 51 (42.9%) | 68 (57.1%) |
| College/Associate Degree | 95 (53.7%) | 82 (46.3%) |
| Bachelor's Degree or higher | 27 (46.6%) | 31 (53.4%) |
Occupancy by Age of Householder in Roseboro
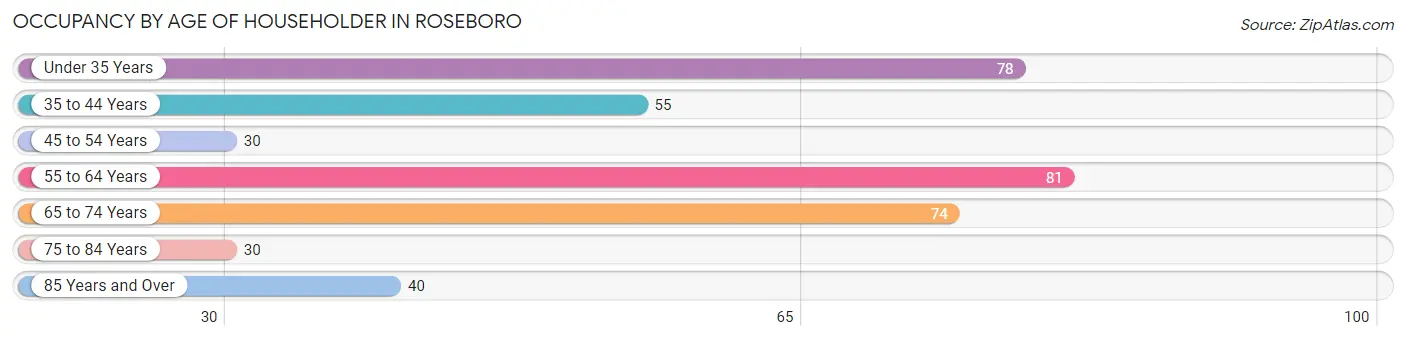
| Age Bracket | # Households | % Households |
| Under 35 Years | 78 | 20.1% |
| 35 to 44 Years | 55 | 14.2% |
| 45 to 54 Years | 30 | 7.7% |
| 55 to 64 Years | 81 | 20.9% |
| 65 to 74 Years | 74 | 19.1% |
| 75 to 84 Years | 30 | 7.7% |
| 85 Years and Over | 40 | 10.3% |
| Total | 388 | 100.0% |
Housing Finances in Roseboro
Median Income by Occupancy in Roseboro
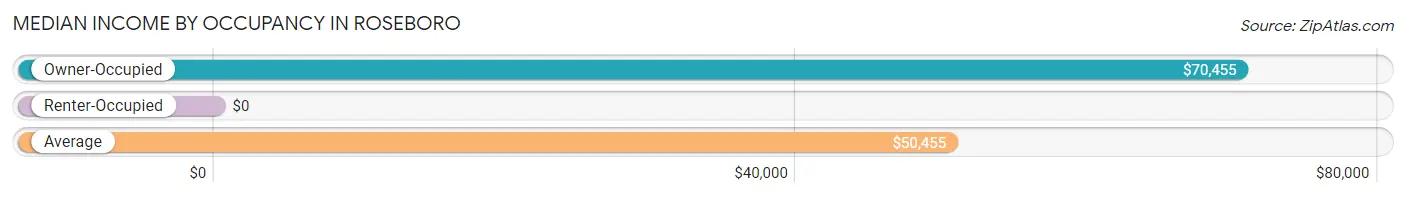
| Occupancy Type | # Households | Median Income |
| Owner-Occupied | 202 (52.1%) | $70,455 |
| Renter-Occupied | 186 (47.9%) | $0 |
| Average | 388 (100.0%) | $50,455 |
Occupancy by Householder Income Bracket in Roseboro
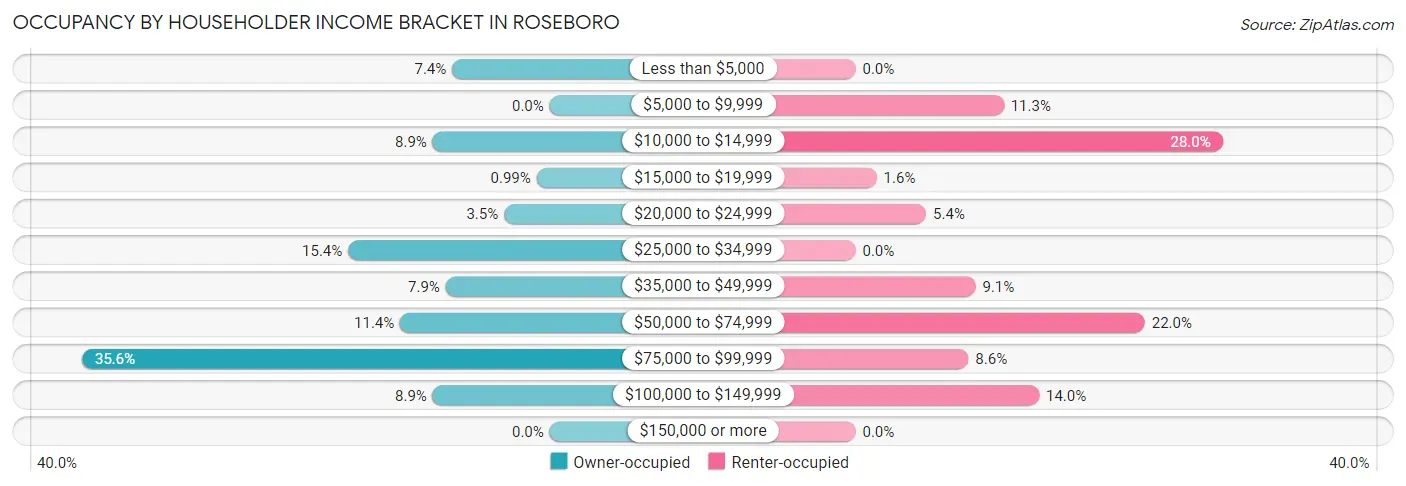
| Income Bracket | Owner-occupied | Renter-occupied |
| Less than $5,000 | 15 (7.4%) | 0 (0.0%) |
| $5,000 to $9,999 | 0 (0.0%) | 21 (11.3%) |
| $10,000 to $14,999 | 18 (8.9%) | 52 (28.0%) |
| $15,000 to $19,999 | 2 (1.0%) | 3 (1.6%) |
| $20,000 to $24,999 | 7 (3.5%) | 10 (5.4%) |
| $25,000 to $34,999 | 31 (15.3%) | 0 (0.0%) |
| $35,000 to $49,999 | 16 (7.9%) | 17 (9.1%) |
| $50,000 to $74,999 | 23 (11.4%) | 41 (22.0%) |
| $75,000 to $99,999 | 72 (35.6%) | 16 (8.6%) |
| $100,000 to $149,999 | 18 (8.9%) | 26 (14.0%) |
| $150,000 or more | 0 (0.0%) | 0 (0.0%) |
| Total | 202 (100.0%) | 186 (100.0%) |
Monthly Housing Cost Tiers in Roseboro
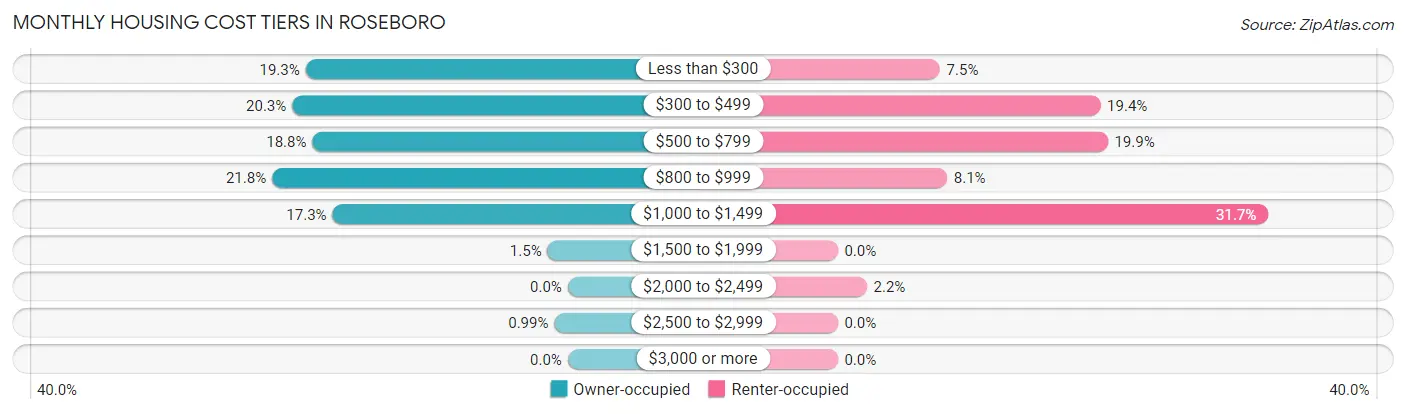
| Monthly Cost | Owner-occupied | Renter-occupied |
| Less than $300 | 39 (19.3%) | 14 (7.5%) |
| $300 to $499 | 41 (20.3%) | 36 (19.4%) |
| $500 to $799 | 38 (18.8%) | 37 (19.9%) |
| $800 to $999 | 44 (21.8%) | 15 (8.1%) |
| $1,000 to $1,499 | 35 (17.3%) | 59 (31.7%) |
| $1,500 to $1,999 | 3 (1.5%) | 0 (0.0%) |
| $2,000 to $2,499 | 0 (0.0%) | 4 (2.1%) |
| $2,500 to $2,999 | 2 (1.0%) | 0 (0.0%) |
| $3,000 or more | 0 (0.0%) | 0 (0.0%) |
| Total | 202 (100.0%) | 186 (100.0%) |
Physical Housing Characteristics in Roseboro
Housing Structures in Roseboro
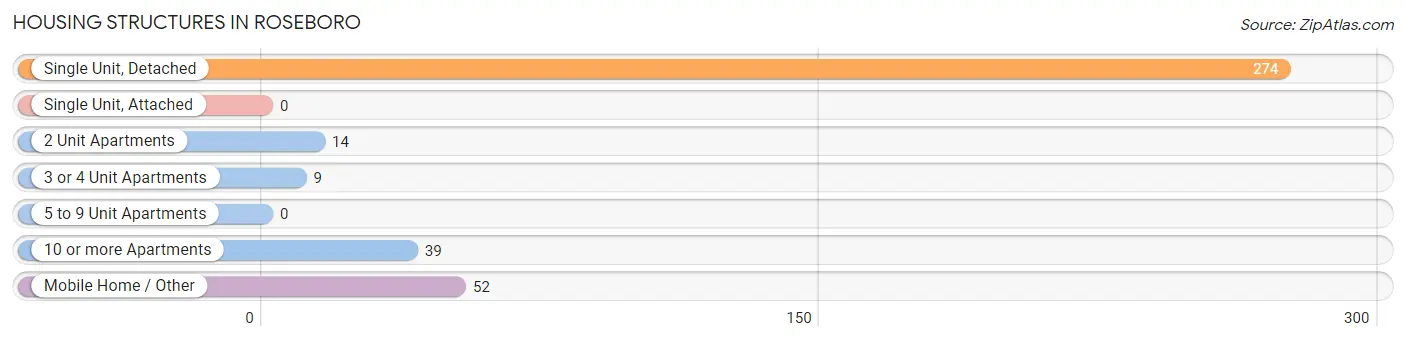
| Structure Type | # Housing Units | % Housing Units |
| Single Unit, Detached | 274 | 70.6% |
| Single Unit, Attached | 0 | 0.0% |
| 2 Unit Apartments | 14 | 3.6% |
| 3 or 4 Unit Apartments | 9 | 2.3% |
| 5 to 9 Unit Apartments | 0 | 0.0% |
| 10 or more Apartments | 39 | 10.1% |
| Mobile Home / Other | 52 | 13.4% |
| Total | 388 | 100.0% |
Housing Structures by Occupancy in Roseboro
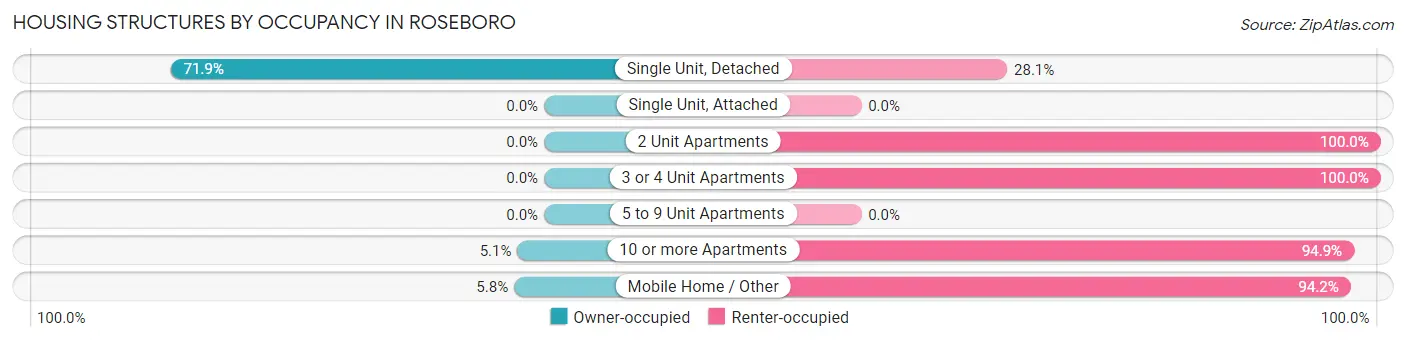
| Structure Type | Owner-occupied | Renter-occupied |
| Single Unit, Detached | 197 (71.9%) | 77 (28.1%) |
| Single Unit, Attached | 0 (0.0%) | 0 (0.0%) |
| 2 Unit Apartments | 0 (0.0%) | 14 (100.0%) |
| 3 or 4 Unit Apartments | 0 (0.0%) | 9 (100.0%) |
| 5 to 9 Unit Apartments | 0 (0.0%) | 0 (0.0%) |
| 10 or more Apartments | 2 (5.1%) | 37 (94.9%) |
| Mobile Home / Other | 3 (5.8%) | 49 (94.2%) |
| Total | 202 (52.1%) | 186 (47.9%) |
Housing Structures by Number of Rooms in Roseboro
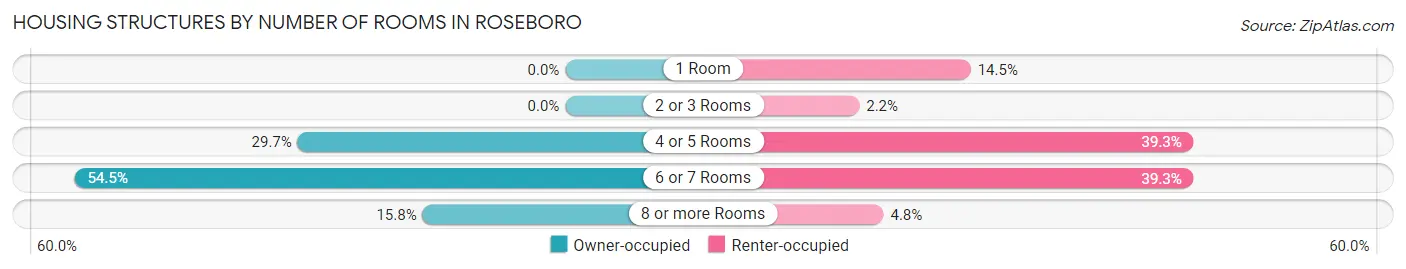
| Number of Rooms | Owner-occupied | Renter-occupied |
| 1 Room | 0 (0.0%) | 27 (14.5%) |
| 2 or 3 Rooms | 0 (0.0%) | 4 (2.1%) |
| 4 or 5 Rooms | 60 (29.7%) | 73 (39.3%) |
| 6 or 7 Rooms | 110 (54.5%) | 73 (39.3%) |
| 8 or more Rooms | 32 (15.8%) | 9 (4.8%) |
| Total | 202 (100.0%) | 186 (100.0%) |
Housing Structure by Heating Type in Roseboro
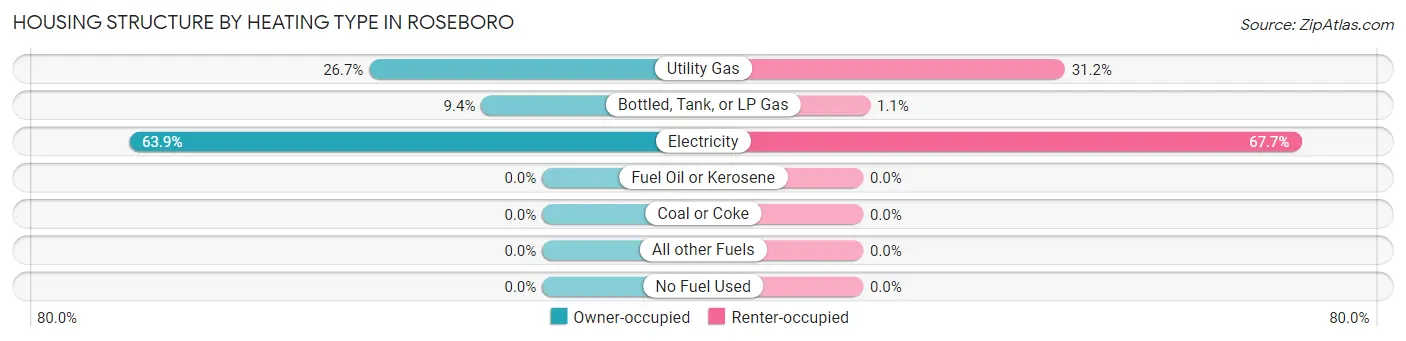
| Heating Type | Owner-occupied | Renter-occupied |
| Utility Gas | 54 (26.7%) | 58 (31.2%) |
| Bottled, Tank, or LP Gas | 19 (9.4%) | 2 (1.1%) |
| Electricity | 129 (63.9%) | 126 (67.7%) |
| Fuel Oil or Kerosene | 0 (0.0%) | 0 (0.0%) |
| Coal or Coke | 0 (0.0%) | 0 (0.0%) |
| All other Fuels | 0 (0.0%) | 0 (0.0%) |
| No Fuel Used | 0 (0.0%) | 0 (0.0%) |
| Total | 202 (100.0%) | 186 (100.0%) |
Household Vehicle Usage in Roseboro
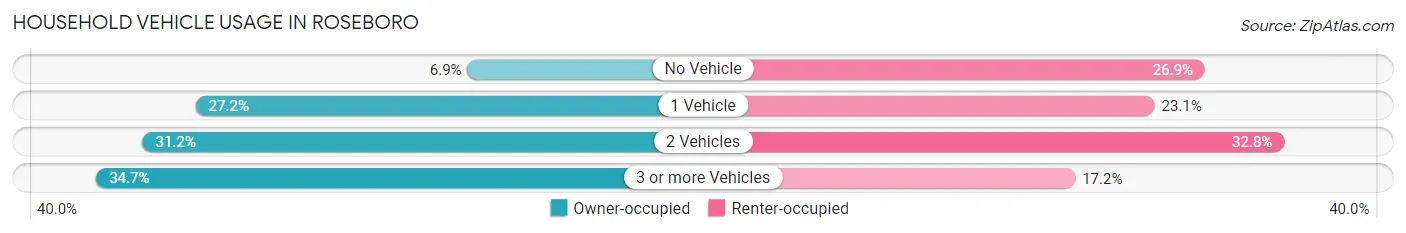
| Vehicles per Household | Owner-occupied | Renter-occupied |
| No Vehicle | 14 (6.9%) | 50 (26.9%) |
| 1 Vehicle | 55 (27.2%) | 43 (23.1%) |
| 2 Vehicles | 63 (31.2%) | 61 (32.8%) |
| 3 or more Vehicles | 70 (34.6%) | 32 (17.2%) |
| Total | 202 (100.0%) | 186 (100.0%) |
Real Estate & Mortgages in Roseboro
Real Estate and Mortgage Overview in Roseboro
| Characteristic | Without Mortgage | With Mortgage |
| Housing Units | 120 | 82 |
| Median Property Value | $92,500 | $112,100 |
| Median Household Income | $68,750 | $0 |
| Monthly Housing Costs | $410 | $0 |
| Real Estate Taxes | $1,181 | $0 |
Property Value by Mortgage Status in Roseboro
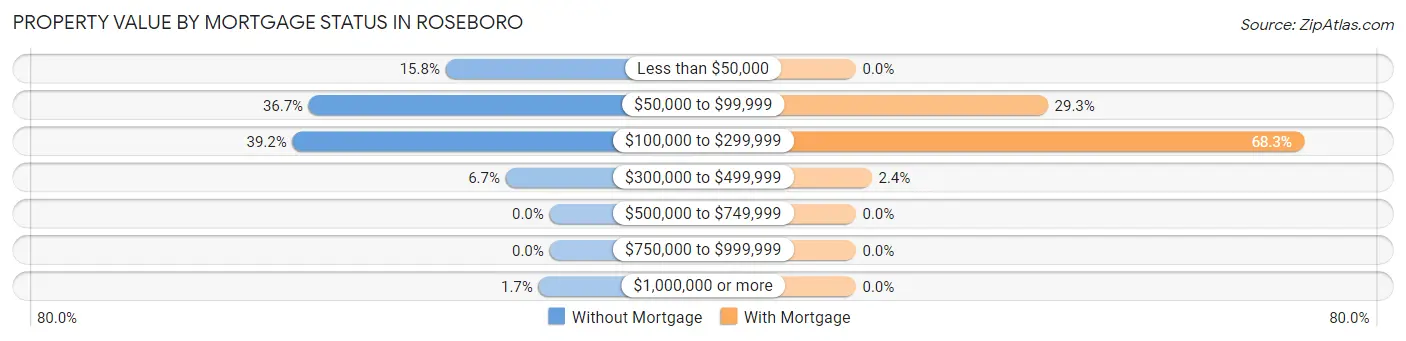
| Property Value | Without Mortgage | With Mortgage |
| Less than $50,000 | 19 (15.8%) | 0 (0.0%) |
| $50,000 to $99,999 | 44 (36.7%) | 24 (29.3%) |
| $100,000 to $299,999 | 47 (39.2%) | 56 (68.3%) |
| $300,000 to $499,999 | 8 (6.7%) | 2 (2.4%) |
| $500,000 to $749,999 | 0 (0.0%) | 0 (0.0%) |
| $750,000 to $999,999 | 0 (0.0%) | 0 (0.0%) |
| $1,000,000 or more | 2 (1.7%) | 0 (0.0%) |
| Total | 120 (100.0%) | 82 (100.0%) |
Household Income by Mortgage Status in Roseboro
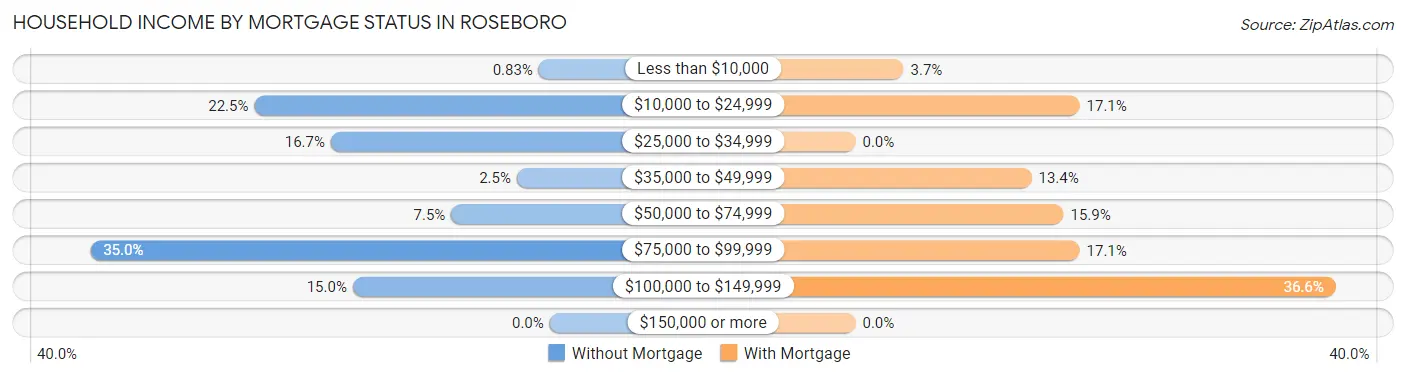
| Household Income | Without Mortgage | With Mortgage |
| Less than $10,000 | 1 (0.8%) | 3 (3.7%) |
| $10,000 to $24,999 | 27 (22.5%) | 14 (17.1%) |
| $25,000 to $34,999 | 20 (16.7%) | 0 (0.0%) |
| $35,000 to $49,999 | 3 (2.5%) | 11 (13.4%) |
| $50,000 to $74,999 | 9 (7.5%) | 13 (15.9%) |
| $75,000 to $99,999 | 42 (35.0%) | 14 (17.1%) |
| $100,000 to $149,999 | 18 (15.0%) | 30 (36.6%) |
| $150,000 or more | 0 (0.0%) | 0 (0.0%) |
| Total | 120 (100.0%) | 82 (100.0%) |
Property Value to Household Income Ratio in Roseboro
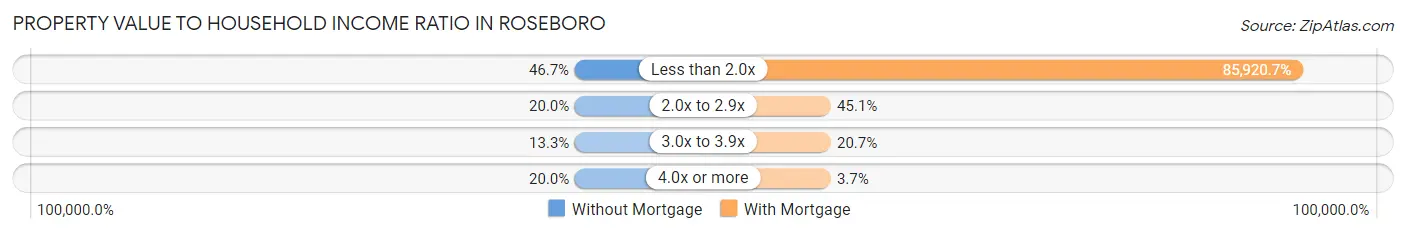
| Value-to-Income Ratio | Without Mortgage | With Mortgage |
| Less than 2.0x | 56 (46.7%) | 70,455 (85,920.7%) |
| 2.0x to 2.9x | 24 (20.0%) | 37 (45.1%) |
| 3.0x to 3.9x | 16 (13.3%) | 17 (20.7%) |
| 4.0x or more | 24 (20.0%) | 3 (3.7%) |
| Total | 120 (100.0%) | 82 (100.0%) |
Real Estate Taxes by Mortgage Status in Roseboro
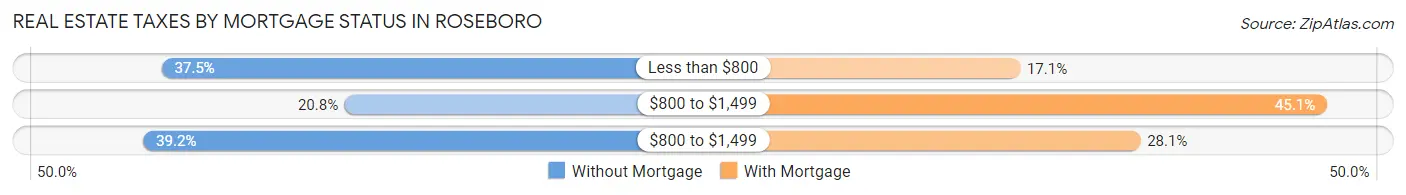
| Property Taxes | Without Mortgage | With Mortgage |
| Less than $800 | 45 (37.5%) | 14 (17.1%) |
| $800 to $1,499 | 25 (20.8%) | 37 (45.1%) |
| $800 to $1,499 | 47 (39.2%) | 23 (28.1%) |
| Total | 120 (100.0%) | 82 (100.0%) |
Health & Disability in Roseboro
Health Insurance Coverage by Age in Roseboro
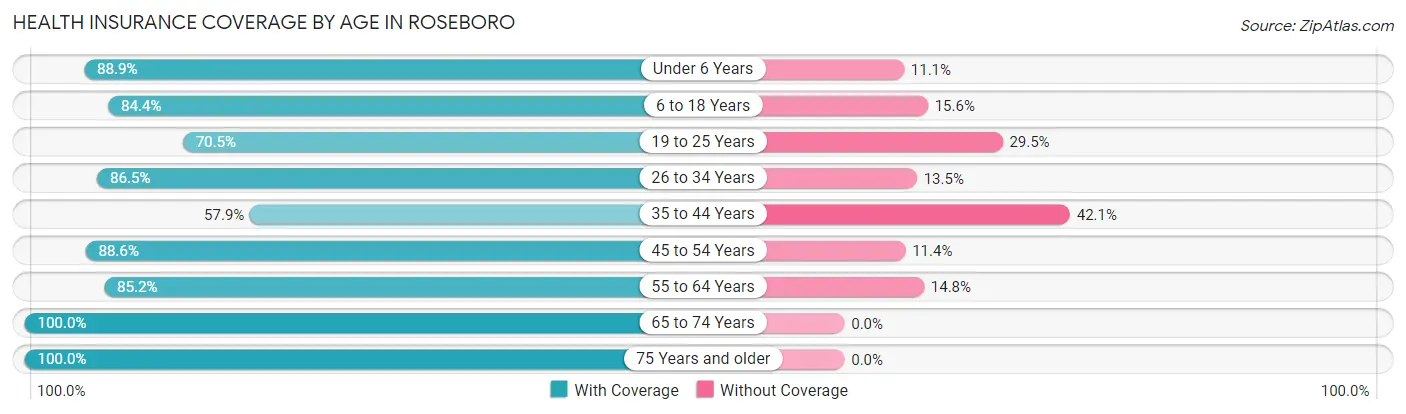
| Age Bracket | With Coverage | Without Coverage |
| Under 6 Years | 80 (88.9%) | 10 (11.1%) |
| 6 to 18 Years | 76 (84.4%) | 14 (15.6%) |
| 19 to 25 Years | 55 (70.5%) | 23 (29.5%) |
| 26 to 34 Years | 128 (86.5%) | 20 (13.5%) |
| 35 to 44 Years | 73 (57.9%) | 53 (42.1%) |
| 45 to 54 Years | 39 (88.6%) | 5 (11.4%) |
| 55 to 64 Years | 109 (85.2%) | 19 (14.8%) |
| 65 to 74 Years | 111 (100.0%) | 0 (0.0%) |
| 75 Years and older | 84 (100.0%) | 0 (0.0%) |
| Total | 755 (84.0%) | 144 (16.0%) |
Health Insurance Coverage by Citizenship Status in Roseboro
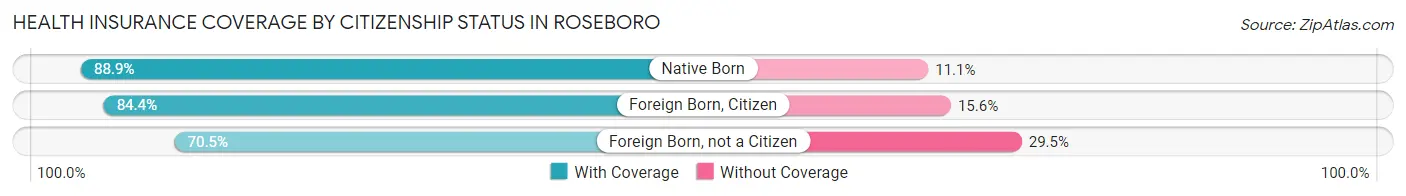
| Citizenship Status | With Coverage | Without Coverage |
| Native Born | 80 (88.9%) | 10 (11.1%) |
| Foreign Born, Citizen | 76 (84.4%) | 14 (15.6%) |
| Foreign Born, not a Citizen | 55 (70.5%) | 23 (29.5%) |
Health Insurance Coverage by Household Income in Roseboro
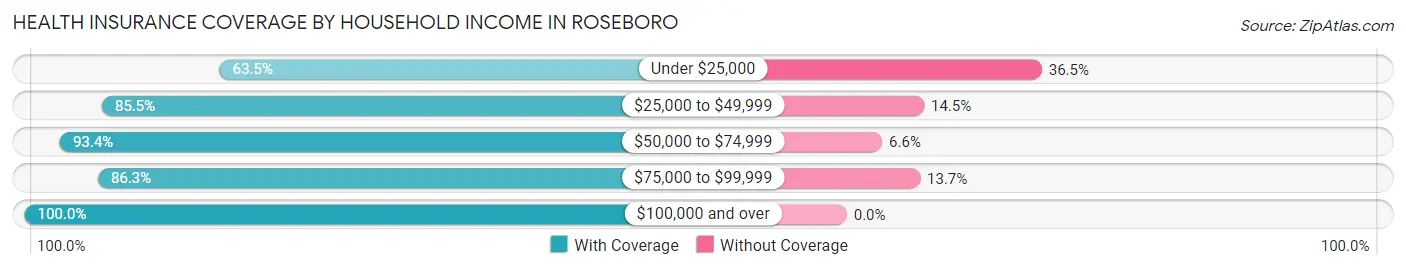
| Household Income | With Coverage | Without Coverage |
| Under $25,000 | 139 (63.5%) | 80 (36.5%) |
| $25,000 to $49,999 | 124 (85.5%) | 21 (14.5%) |
| $50,000 to $74,999 | 155 (93.4%) | 11 (6.6%) |
| $75,000 to $99,999 | 201 (86.3%) | 32 (13.7%) |
| $100,000 and over | 136 (100.0%) | 0 (0.0%) |
Public vs Private Health Insurance Coverage by Age in Roseboro
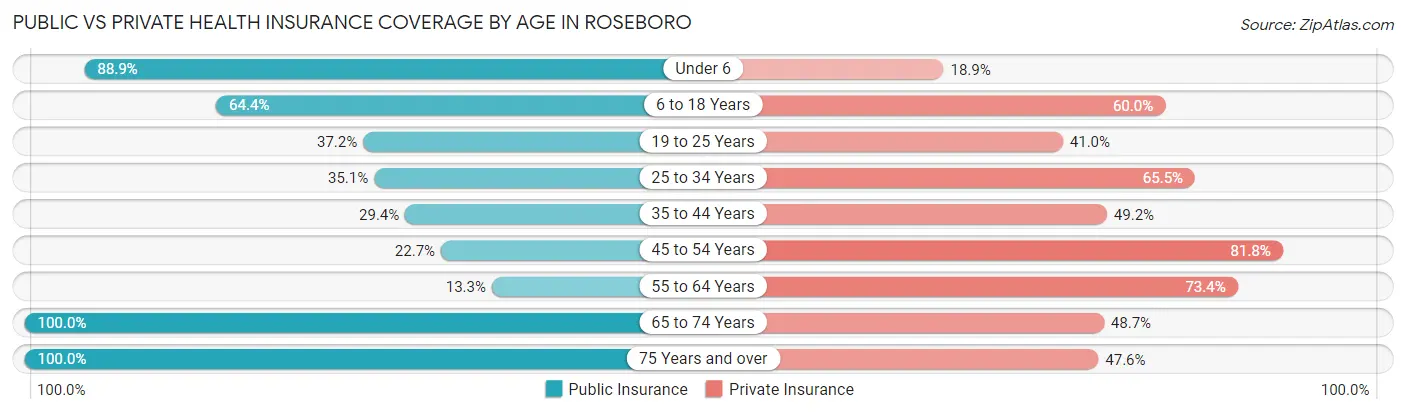
| Age Bracket | Public Insurance | Private Insurance |
| Under 6 | 80 (88.9%) | 17 (18.9%) |
| 6 to 18 Years | 58 (64.4%) | 54 (60.0%) |
| 19 to 25 Years | 29 (37.2%) | 32 (41.0%) |
| 25 to 34 Years | 52 (35.1%) | 97 (65.5%) |
| 35 to 44 Years | 37 (29.4%) | 62 (49.2%) |
| 45 to 54 Years | 10 (22.7%) | 36 (81.8%) |
| 55 to 64 Years | 17 (13.3%) | 94 (73.4%) |
| 65 to 74 Years | 111 (100.0%) | 54 (48.6%) |
| 75 Years and over | 84 (100.0%) | 40 (47.6%) |
| Total | 478 (53.2%) | 486 (54.1%) |
Disability Status by Sex by Age in Roseboro
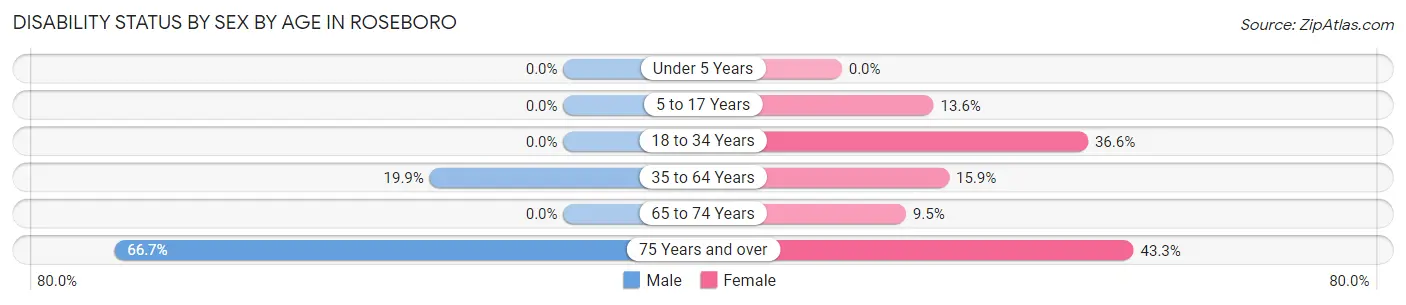
| Age Bracket | Male | Female |
| Under 5 Years | 0 (0.0%) | 0 (0.0%) |
| 5 to 17 Years | 0 (0.0%) | 3 (13.6%) |
| 18 to 34 Years | 0 (0.0%) | 34 (36.6%) |
| 35 to 64 Years | 28 (19.9%) | 25 (15.9%) |
| 65 to 74 Years | 0 (0.0%) | 6 (9.5%) |
| 75 Years and over | 16 (66.7%) | 26 (43.3%) |
Disability Class by Sex by Age in Roseboro
Disability Class: Hearing Difficulty
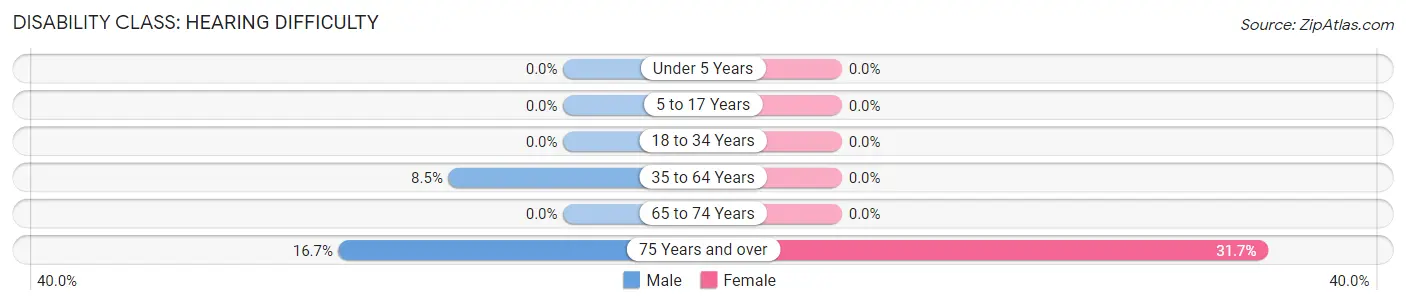
| Age Bracket | Male | Female |
| Under 5 Years | 0 (0.0%) | 0 (0.0%) |
| 5 to 17 Years | 0 (0.0%) | 0 (0.0%) |
| 18 to 34 Years | 0 (0.0%) | 0 (0.0%) |
| 35 to 64 Years | 12 (8.5%) | 0 (0.0%) |
| 65 to 74 Years | 0 (0.0%) | 0 (0.0%) |
| 75 Years and over | 4 (16.7%) | 19 (31.7%) |
Disability Class: Vision Difficulty
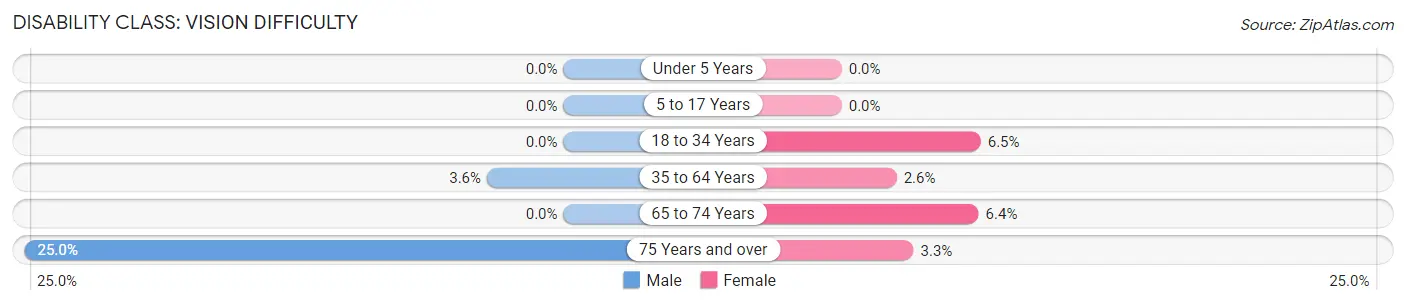
| Age Bracket | Male | Female |
| Under 5 Years | 0 (0.0%) | 0 (0.0%) |
| 5 to 17 Years | 0 (0.0%) | 0 (0.0%) |
| 18 to 34 Years | 0 (0.0%) | 6 (6.5%) |
| 35 to 64 Years | 5 (3.5%) | 4 (2.5%) |
| 65 to 74 Years | 0 (0.0%) | 4 (6.4%) |
| 75 Years and over | 6 (25.0%) | 2 (3.3%) |
Disability Class: Cognitive Difficulty
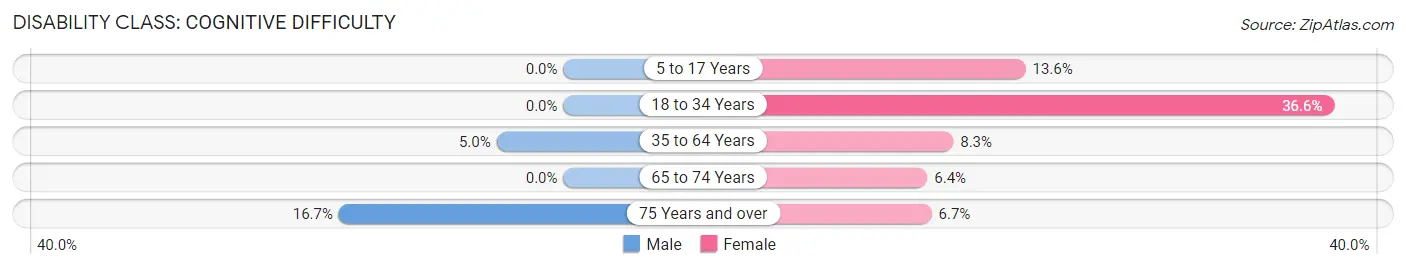
| Age Bracket | Male | Female |
| 5 to 17 Years | 0 (0.0%) | 3 (13.6%) |
| 18 to 34 Years | 0 (0.0%) | 34 (36.6%) |
| 35 to 64 Years | 7 (5.0%) | 13 (8.3%) |
| 65 to 74 Years | 0 (0.0%) | 4 (6.4%) |
| 75 Years and over | 4 (16.7%) | 4 (6.7%) |
Disability Class: Ambulatory Difficulty
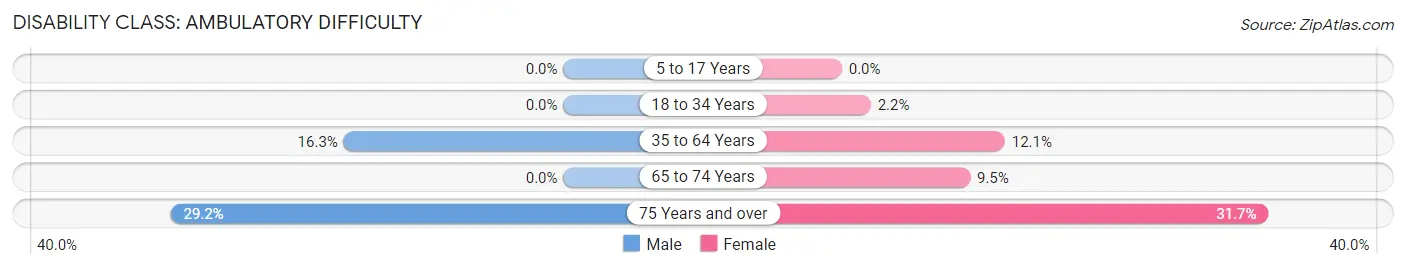
| Age Bracket | Male | Female |
| 5 to 17 Years | 0 (0.0%) | 0 (0.0%) |
| 18 to 34 Years | 0 (0.0%) | 2 (2.1%) |
| 35 to 64 Years | 23 (16.3%) | 19 (12.1%) |
| 65 to 74 Years | 0 (0.0%) | 6 (9.5%) |
| 75 Years and over | 7 (29.2%) | 19 (31.7%) |
Disability Class: Self-Care Difficulty
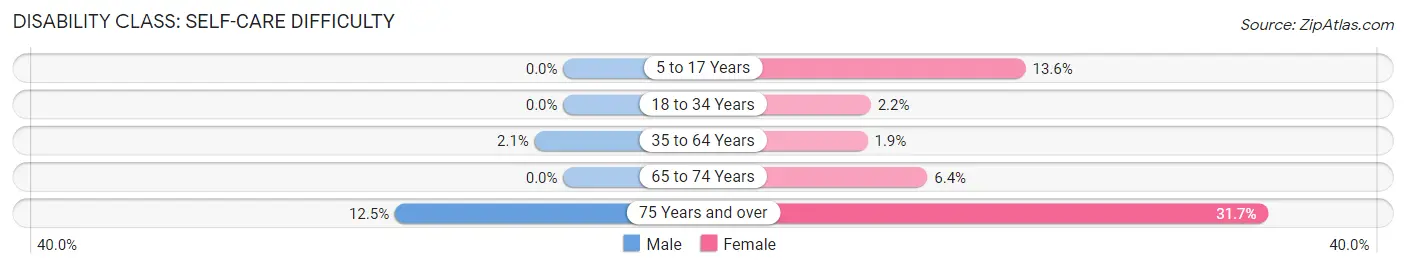
| Age Bracket | Male | Female |
| 5 to 17 Years | 0 (0.0%) | 3 (13.6%) |
| 18 to 34 Years | 0 (0.0%) | 2 (2.1%) |
| 35 to 64 Years | 3 (2.1%) | 3 (1.9%) |
| 65 to 74 Years | 0 (0.0%) | 4 (6.4%) |
| 75 Years and over | 3 (12.5%) | 19 (31.7%) |
Technology Access in Roseboro
Computing Device Access in Roseboro
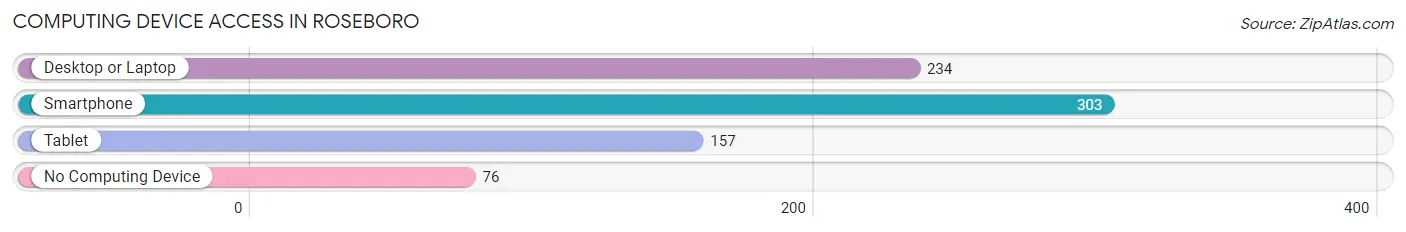
| Device Type | # Households | % Households |
| Desktop or Laptop | 234 | 60.3% |
| Smartphone | 303 | 78.1% |
| Tablet | 157 | 40.5% |
| No Computing Device | 76 | 19.6% |
| Total | 388 | 100.0% |
Internet Access in Roseboro
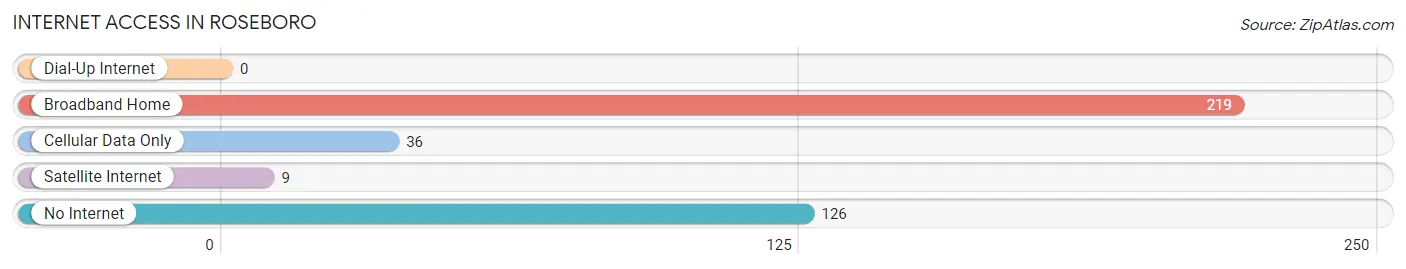
| Internet Type | # Households | % Households |
| Dial-Up Internet | 0 | 0.0% |
| Broadband Home | 219 | 56.4% |
| Cellular Data Only | 36 | 9.3% |
| Satellite Internet | 9 | 2.3% |
| No Internet | 126 | 32.5% |
| Total | 388 | 100.0% |
Roseboro Summary
Roseboro is a small town located in Sampson County, North Carolina. It is situated on the banks of the Black River, approximately 30 miles south of Fayetteville. The town was founded in 1883 and has a population of 1,717 as of the 2010 census.
Geography
Roseboro is located in the Coastal Plain region of North Carolina. The town is situated on the banks of the Black River, which flows through the town and is a tributary of the Cape Fear River. The town is located in the southeastern corner of Sampson County, approximately 30 miles south of Fayetteville. The town is surrounded by rural farmland and is located near the towns of Clinton, Autryville, and Garland.
Climate
Roseboro has a humid subtropical climate, with hot, humid summers and mild winters. The average annual temperature is around 70°F, with an average high of around 90°F in the summer and an average low of around 50°F in the winter. The town receives an average of 48 inches of precipitation per year, with most of it falling in the summer months.
Demographics
As of the 2010 census, Roseboro had a population of 1,717. The racial makeup of the town was 57.3% White, 37.2% African American, 0.3% Native American, 0.7% Asian, 0.1% Pacific Islander, and 4.4% from other races. Hispanic or Latino of any race were 2.2% of the population.
Economy
Roseboro’s economy is largely based on agriculture and manufacturing. The town is home to several poultry processing plants, as well as a number of small businesses. The town is also home to a number of farms, which produce a variety of crops, including corn, soybeans, cotton, and tobacco.
History
Roseboro was founded in 1883 by a group of settlers from the nearby town of Clinton. The town was named after the Rose family, who were among the first settlers. The town grew slowly over the years, and by the early 1900s, it had become a thriving agricultural center. The town was incorporated in 1911, and the first mayor was elected in 1912.
In the early 20th century, Roseboro was a major center for tobacco production. The town was home to several tobacco warehouses, and the tobacco industry was a major source of income for the town. The town also had a thriving lumber industry, and several sawmills were located in the area.
In the late 20th century, the town’s economy shifted away from agriculture and towards manufacturing. Several poultry processing plants were established in the area, and the town became a major center for poultry production. The town also saw an influx of new residents, as people moved to the area in search of employment.
Today, Roseboro is a small, rural town with a population of just over 1,700. The town is still largely agricultural, and the poultry industry is still a major source of employment. The town is also home to several small businesses, and the local economy is largely based on agriculture and manufacturing.
Common Questions
What is the Total Population of Roseboro?
Total Population of Roseboro is 900.
What is the Total Male Population of Roseboro?
Total Male Population of Roseboro is 470.
What is the Total Female Population of Roseboro?
Total Female Population of Roseboro is 430.
What is the Ratio of Males per 100 Females in Roseboro?
There are 109.30 Males per 100 Females in Roseboro.
What is the Ratio of Females per 100 Males in Roseboro?
There are 91.49 Females per 100 Males in Roseboro.
What is the Median Population Age in Roseboro?
Median Population Age in Roseboro is 38.6 Years.
What is the Average Family Size in Roseboro
Average Family Size in Roseboro is 3.1 People.
What is the Average Household Size in Roseboro
Average Household Size in Roseboro is 2.3 People.
What is Per Capita Income in Roseboro?
Per Capita income in Roseboro is $23,198.
What is the Median Family Income in Roseboro?
Median Family Income in Roseboro is $69,583.
What is the Median Household income in Roseboro?
Median Household Income in Roseboro is $50,455.
What is Income or Wage Gap in Roseboro?
Income or Wage Gap in Roseboro is 41.5%.
Women in Roseboro earn 58.5 cents for every dollar earned by a man.
What is Family Income Deficit in Roseboro?
Family Income Deficit in Roseboro is $20,328.
Families that are below poverty line in Roseboro earn $20,328 less on average than the poverty threshold level.
What is Inequality or Gini Index in Roseboro?
Inequality or Gini Index in Roseboro is 0.40.
How Large is the Labor Force in Roseboro?
There are 356 People in the Labor Forcein in Roseboro.
What is the Percentage of People in the Labor Force in Roseboro?
49.3% of People are in the Labor Force in Roseboro.
What is the Unemployment Rate in Roseboro?
Unemployment Rate in Roseboro is 2.0%.