Cities with the Highest Percentage of Households Heated by Bottled Gas / Liquid Propane in North Carolina
RELATED REPORTS & OPTIONS
Bottled Gas / LP Heating
North Carolina
Compare Cities
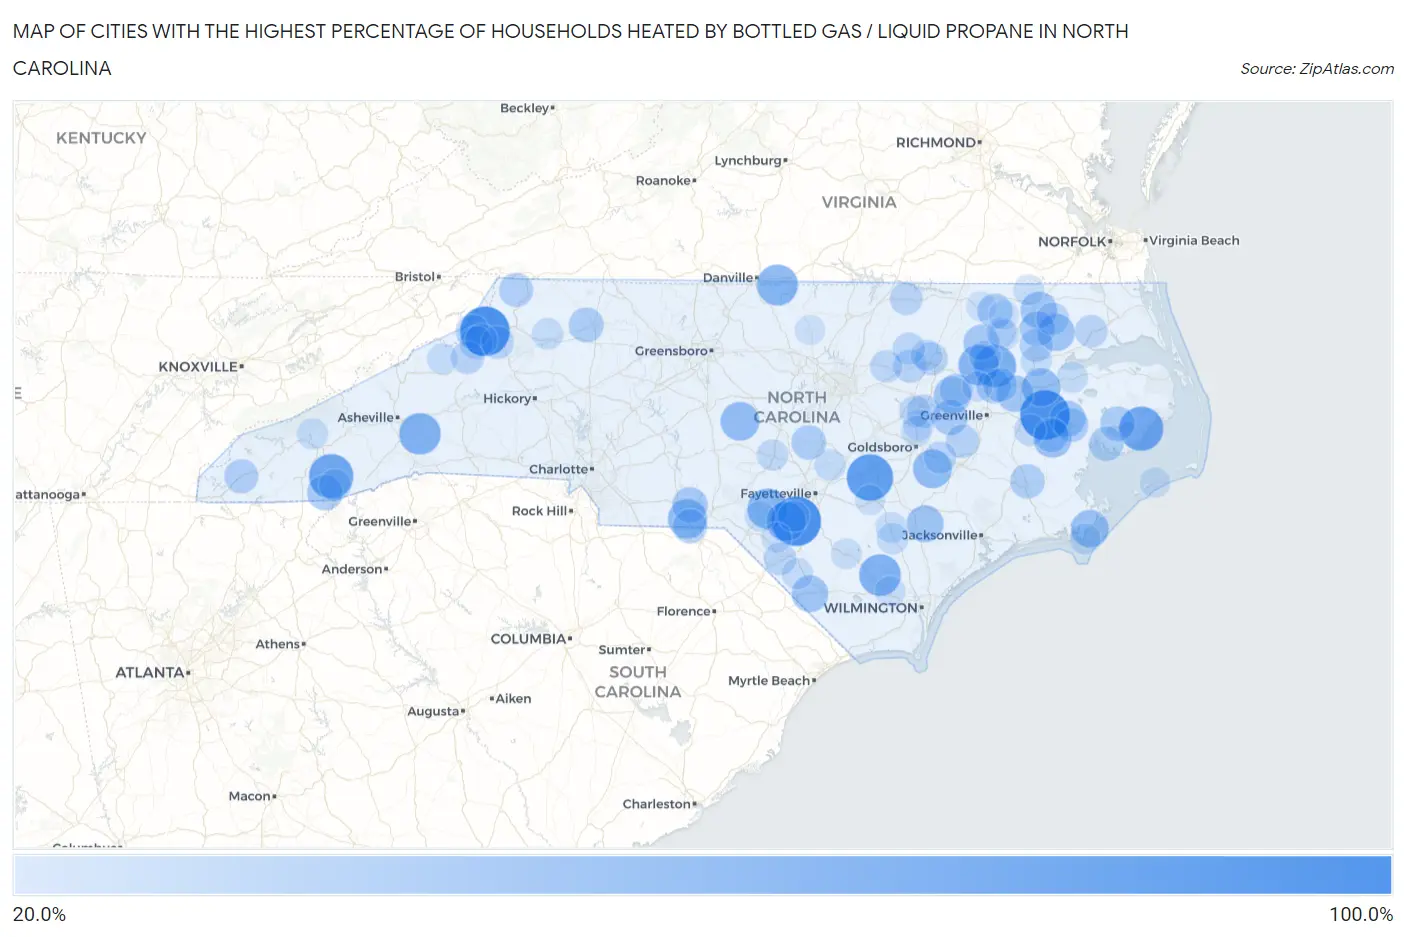
Map of Cities with the Highest Percentage of Households Heated by Bottled Gas / Liquid Propane in North Carolina
0.0%
100.0%
Cities with the Highest Percentage of Households Heated by Bottled Gas / Liquid Propane in North Carolina
| City | Bottled Gas / LP Heating | vs State | vs National | |
| 1. | Valle Crucis | 100.0% | 6.4%(+93.6)#1 | 4.9%(+95.1)#18 |
| 2. | Pinetown | 100.0% | 6.4%(+93.6)#2 | 4.9%(+95.1)#121 |
| 3. | Rex | 100.0% | 6.4%(+93.6)#3 | 4.9%(+95.1)#122 |
| 4. | Vann Crossroads | 87.9% | 6.4%(+81.5)#4 | 4.9%(+83.0)#437 |
| 5. | Glenville | 80.4% | 6.4%(+74.0)#5 | 4.9%(+75.5)#661 |
| 6. | Engelhard | 79.8% | 6.4%(+73.4)#6 | 4.9%(+74.9)#685 |
| 7. | Graingers | 73.1% | 6.4%(+66.7)#7 | 4.9%(+68.2)#970 |
| 8. | Oak City | 72.3% | 6.4%(+65.9)#8 | 4.9%(+67.4)#1,007 |
| 9. | Kelly | 69.8% | 6.4%(+63.4)#9 | 4.9%(+64.9)#1,127 |
| 10. | Gerton | 69.3% | 6.4%(+62.9)#10 | 4.9%(+64.4)#1,152 |
| 11. | Milton | 66.7% | 6.4%(+60.3)#11 | 4.9%(+61.8)#1,285 |
| 12. | Speed | 65.5% | 6.4%(+59.1)#12 | 4.9%(+60.6)#1,382 |
| 13. | Bowmore | 64.8% | 6.4%(+58.4)#13 | 4.9%(+59.9)#1,407 |
| 14. | Shannon | 62.5% | 6.4%(+56.1)#14 | 4.9%(+57.6)#1,526 |
| 15. | Morven | 60.5% | 6.4%(+54.1)#15 | 4.9%(+55.6)#1,651 |
| 16. | Seven Springs | 60.0% | 6.4%(+53.6)#16 | 4.9%(+55.1)#1,697 |
| 17. | Bennett | 59.3% | 6.4%(+52.9)#17 | 4.9%(+54.4)#1,752 |
| 18. | Jamesville | 57.4% | 6.4%(+51.0)#18 | 4.9%(+52.5)#1,890 |
| 19. | Bayview | 56.0% | 6.4%(+49.6)#19 | 4.9%(+51.1)#1,997 |
| 20. | Davis | 55.1% | 6.4%(+48.7)#20 | 4.9%(+50.2)#2,050 |
| 21. | Yadkin College | 53.8% | 6.4%(+47.4)#21 | 4.9%(+48.9)#2,141 |
| 22. | Macclesfield | 53.0% | 6.4%(+46.6)#22 | 4.9%(+48.1)#2,201 |
| 23. | Colerain | 53.0% | 6.4%(+46.6)#23 | 4.9%(+48.1)#2,202 |
| 24. | Greenevers | 52.4% | 6.4%(+46.0)#24 | 4.9%(+47.5)#2,241 |
| 25. | Cerro Gordo | 51.2% | 6.4%(+44.8)#25 | 4.9%(+46.3)#2,319 |
| 26. | Cape Colony | 51.1% | 6.4%(+44.7)#26 | 4.9%(+46.2)#2,324 |
| 27. | Bear Grass | 51.1% | 6.4%(+44.7)#27 | 4.9%(+46.2)#2,327 |
| 28. | Cofield | 50.9% | 6.4%(+44.5)#28 | 4.9%(+46.0)#2,336 |
| 29. | Pantego | 49.5% | 6.4%(+43.1)#29 | 4.9%(+44.6)#2,451 |
| 30. | Milwaukee | 48.0% | 6.4%(+41.6)#30 | 4.9%(+43.1)#2,551 |
| 31. | Highlands | 47.4% | 6.4%(+41.0)#31 | 4.9%(+42.5)#2,606 |
| 32. | Scotland Neck | 47.3% | 6.4%(+40.9)#32 | 4.9%(+42.4)#2,618 |
| 33. | Lilesville | 46.4% | 6.4%(+40.0)#33 | 4.9%(+41.5)#2,695 |
| 34. | Walstonburg | 46.4% | 6.4%(+40.0)#34 | 4.9%(+41.5)#2,698 |
| 35. | Powellsville | 46.2% | 6.4%(+39.8)#35 | 4.9%(+41.3)#2,715 |
| 36. | Lasker | 45.3% | 6.4%(+38.9)#36 | 4.9%(+40.4)#2,785 |
| 37. | Pleasant Hill | 44.7% | 6.4%(+38.3)#37 | 4.9%(+39.8)#2,828 |
| 38. | Fairfield | 44.6% | 6.4%(+38.2)#38 | 4.9%(+39.7)#2,839 |
| 39. | Mamers | 43.6% | 6.4%(+37.2)#39 | 4.9%(+38.7)#2,927 |
| 40. | Bridgeton | 43.3% | 6.4%(+36.9)#40 | 4.9%(+38.4)#2,950 |
| 41. | Swan Quarter | 43.2% | 6.4%(+36.8)#41 | 4.9%(+38.3)#2,959 |
| 42. | Belhaven | 43.0% | 6.4%(+36.6)#42 | 4.9%(+38.1)#2,972 |
| 43. | Bath | 42.6% | 6.4%(+36.2)#43 | 4.9%(+37.7)#3,024 |
| 44. | Parmele | 42.6% | 6.4%(+36.2)#44 | 4.9%(+37.7)#3,025 |
| 45. | Mcfarlan | 42.4% | 6.4%(+36.0)#45 | 4.9%(+37.5)#3,040 |
| 46. | Robersonville | 42.0% | 6.4%(+35.6)#46 | 4.9%(+37.1)#3,069 |
| 47. | Lansing | 42.0% | 6.4%(+35.6)#47 | 4.9%(+37.1)#3,075 |
| 48. | Marble | 41.9% | 6.4%(+35.5)#48 | 4.9%(+37.0)#3,081 |
| 49. | Askewville | 39.5% | 6.4%(+33.1)#49 | 4.9%(+34.6)#3,276 |
| 50. | Hookerton | 39.1% | 6.4%(+32.7)#50 | 4.9%(+34.2)#3,311 |
| 51. | Beech Mountain | 38.9% | 6.4%(+32.5)#51 | 4.9%(+34.0)#3,331 |
| 52. | Momeyer | 38.4% | 6.4%(+32.0)#52 | 4.9%(+33.5)#3,378 |
| 53. | Black Creek | 38.3% | 6.4%(+31.9)#53 | 4.9%(+33.4)#3,383 |
| 54. | Sugar Mountain | 37.9% | 6.4%(+31.5)#54 | 4.9%(+33.0)#3,423 |
| 55. | Pinetops | 37.7% | 6.4%(+31.3)#55 | 4.9%(+32.8)#3,441 |
| 56. | Dortches | 37.6% | 6.4%(+31.2)#56 | 4.9%(+32.7)#3,450 |
| 57. | Blowing Rock | 37.5% | 6.4%(+31.1)#57 | 4.9%(+32.6)#3,455 |
| 58. | Crossnore | 37.5% | 6.4%(+31.1)#58 | 4.9%(+32.6)#3,466 |
| 59. | Macon | 37.5% | 6.4%(+31.1)#59 | 4.9%(+32.6)#3,469 |
| 60. | Harrellsville | 36.9% | 6.4%(+30.5)#60 | 4.9%(+32.0)#3,518 |
| 61. | Winfall | 36.6% | 6.4%(+30.2)#61 | 4.9%(+31.7)#3,541 |
| 62. | Raynham | 36.4% | 6.4%(+30.0)#62 | 4.9%(+31.5)#3,566 |
| 63. | Castalia | 35.7% | 6.4%(+29.3)#63 | 4.9%(+30.8)#3,614 |
| 64. | La Grange | 35.2% | 6.4%(+28.8)#64 | 4.9%(+30.3)#3,657 |
| 65. | Bunn | 35.2% | 6.4%(+28.8)#65 | 4.9%(+30.3)#3,662 |
| 66. | Seven Devils | 34.8% | 6.4%(+28.4)#66 | 4.9%(+29.9)#3,699 |
| 67. | Cashiers | 34.6% | 6.4%(+28.2)#67 | 4.9%(+29.7)#3,716 |
| 68. | Hobgood | 34.0% | 6.4%(+27.6)#68 | 4.9%(+29.1)#3,776 |
| 69. | Grandfather | 33.3% | 6.4%(+26.9)#69 | 4.9%(+28.4)#3,855 |
| 70. | River Road | 32.9% | 6.4%(+26.5)#70 | 4.9%(+28.0)#3,898 |
| 71. | Lucama | 32.9% | 6.4%(+26.5)#71 | 4.9%(+28.0)#3,899 |
| 72. | Cameron | 32.7% | 6.4%(+26.3)#72 | 4.9%(+27.8)#3,925 |
| 73. | Millers Creek | 32.3% | 6.4%(+25.9)#73 | 4.9%(+27.4)#3,962 |
| 74. | Harrells | 32.1% | 6.4%(+25.7)#74 | 4.9%(+27.2)#3,990 |
| 75. | Linden | 32.0% | 6.4%(+25.6)#75 | 4.9%(+27.1)#4,002 |
| 76. | Red Oak | 31.4% | 6.4%(+25.0)#76 | 4.9%(+26.5)#4,065 |
| 77. | Cherokee | 31.4% | 6.4%(+25.0)#77 | 4.9%(+26.5)#4,066 |
| 78. | Proctorville | 31.4% | 6.4%(+25.0)#78 | 4.9%(+26.5)#4,071 |
| 79. | Lumber Bridge | 31.4% | 6.4%(+25.0)#79 | 4.9%(+26.5)#4,073 |
| 80. | Delway | 31.3% | 6.4%(+24.9)#80 | 4.9%(+26.4)#4,081 |
| 81. | Windsor | 31.1% | 6.4%(+24.7)#81 | 4.9%(+26.2)#4,091 |
| 82. | Kelford | 30.8% | 6.4%(+24.4)#82 | 4.9%(+25.9)#4,134 |
| 83. | Roper | 30.5% | 6.4%(+24.1)#83 | 4.9%(+25.6)#4,171 |
| 84. | Bakersville | 30.4% | 6.4%(+24.0)#84 | 4.9%(+25.5)#4,179 |
| 85. | Marshallberg | 30.4% | 6.4%(+24.0)#85 | 4.9%(+25.5)#4,181 |
| 86. | Wagram | 30.1% | 6.4%(+23.7)#86 | 4.9%(+25.2)#4,210 |
| 87. | Fremont | 30.1% | 6.4%(+23.7)#87 | 4.9%(+25.2)#4,211 |
| 88. | Como | 30.0% | 6.4%(+23.6)#88 | 4.9%(+25.1)#4,228 |
| 89. | Elizabethtown | 29.9% | 6.4%(+23.5)#89 | 4.9%(+25.0)#4,237 |
| 90. | Pikeville | 29.1% | 6.4%(+22.7)#90 | 4.9%(+24.2)#4,338 |
| 91. | Riegelwood | 28.9% | 6.4%(+22.5)#91 | 4.9%(+24.0)#4,357 |
| 92. | Prospect | 28.7% | 6.4%(+22.3)#92 | 4.9%(+23.8)#4,377 |
| 93. | Roxobel | 28.7% | 6.4%(+22.3)#93 | 4.9%(+23.8)#4,378 |
| 94. | Ocracoke | 28.5% | 6.4%(+22.1)#94 | 4.9%(+23.6)#4,427 |
| 95. | Cypress Landing | 28.4% | 6.4%(+22.0)#95 | 4.9%(+23.5)#4,433 |
| 96. | Bonnetsville | 28.3% | 6.4%(+21.9)#96 | 4.9%(+23.4)#4,446 |
| 97. | Conetoe | 28.3% | 6.4%(+21.9)#97 | 4.9%(+23.4)#4,451 |
| 98. | Jackson | 27.7% | 6.4%(+21.3)#98 | 4.9%(+22.8)#4,509 |
| 99. | Woodland | 27.5% | 6.4%(+21.1)#99 | 4.9%(+22.6)#4,535 |
| 100. | Rougemont | 27.2% | 6.4%(+20.8)#100 | 4.9%(+22.3)#4,580 |
Common Questions
What are the Top 10 Cities with the Highest Percentage of Households Heated by Bottled Gas / Liquid Propane in North Carolina?
Top 10 Cities with the Highest Percentage of Households Heated by Bottled Gas / Liquid Propane in North Carolina are:
#1
100.0%
#2
100.0%
#3
100.0%
#4
87.9%
#5
80.4%
#6
79.8%
#7
72.3%
#8
69.8%
#9
69.3%
#10
66.7%
What city has the Highest Percentage of Households Heated by Bottled Gas / Liquid Propane in North Carolina?
Valle Crucis has the Highest Percentage of Households Heated by Bottled Gas / Liquid Propane in North Carolina with 100.0%.
What is the Percentage of Households Heated by Bottled Gas / Liquid Propane in the State of North Carolina?
Percentage of Households Heated by Bottled Gas / Liquid Propane in North Carolina is 6.4%.
What is the Percentage of Households Heated by Bottled Gas / Liquid Propane in the United States?
Percentage of Households Heated by Bottled Gas / Liquid Propane in the United States is 4.9%.