Olney, MT
Olney Map
Olney Overview
132
TOTAL POPULATION
85
MALE POPULATION
47
FEMALE POPULATION
180.85
MALES / 100 FEMALES
55.29
FEMALES / 100 MALES
46.5
MEDIAN AGE
4.7
AVG FAMILY SIZE
2.6
AVG HOUSEHOLD SIZE
$29,094
PER CAPITA INCOME
28.0%
WAGE / INCOME GAP [ % ]
72.0¢/ $1
WAGE / INCOME GAP [ $ ]
0.52
INEQUALITY / GINI INDEX
70
LABOR FORCE [ PEOPLE ]
58.3%
PERCENT IN LABOR FORCE
Olney Zip Codes
Olney Area Codes
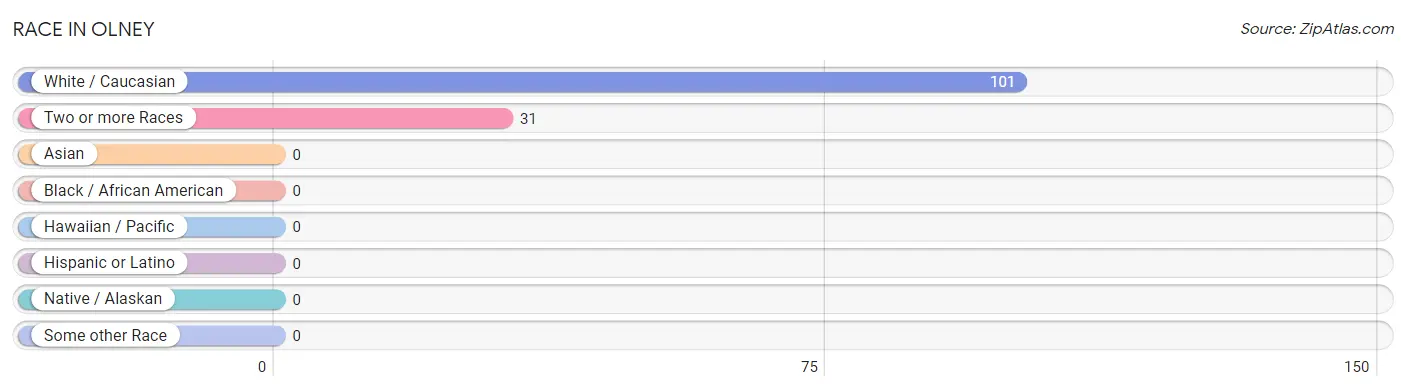
Race in Olney
The most populous races in Olney are White / Caucasian (101 | 76.5%), and Two or more Races (31 | 23.5%).
| Race | # Population | % Population |
| Asian | 0 | 0.0% |
| Black / African American | 0 | 0.0% |
| Hawaiian / Pacific | 0 | 0.0% |
| Hispanic or Latino | 0 | 0.0% |
| Native / Alaskan | 0 | 0.0% |
| White / Caucasian | 101 | 76.5% |
| Two or more Races | 31 | 23.5% |
| Some other Race | 0 | 0.0% |
| Total | 132 | 100.0% |
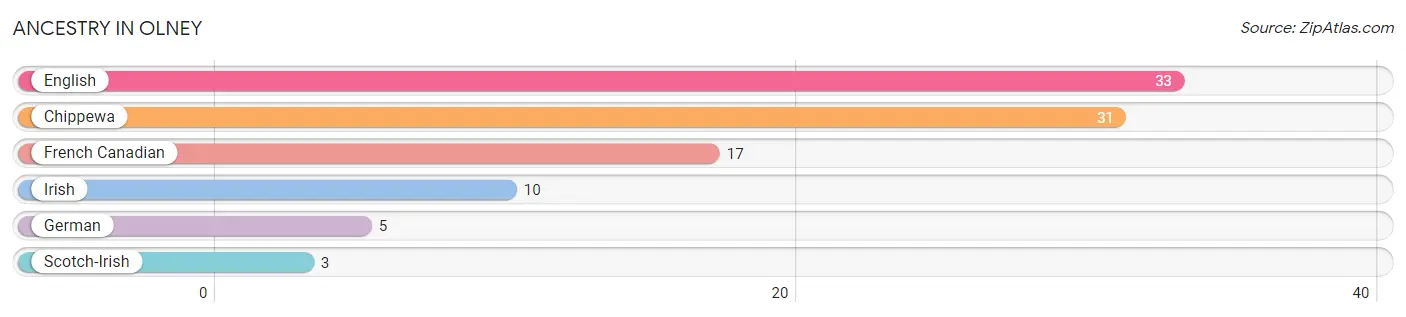
Ancestry in Olney
The most populous ancestries reported in Olney are English (33 | 25.0%), Chippewa (31 | 23.5%), French Canadian (17 | 12.9%), Irish (10 | 7.6%), and German (5 | 3.8%), together accounting for 72.7% of all Olney residents.
| Ancestry | # Population | % Population |
| Chippewa | 31 | 23.5% |
| English | 33 | 25.0% |
| French Canadian | 17 | 12.9% |
| German | 5 | 3.8% |
| Irish | 10 | 7.6% |
| Scotch-Irish | 3 | 2.3% | View All 6 Rows |
Immigrants in Olney

| Immigration Origin | # Population | % Population | View All 0 Rows |
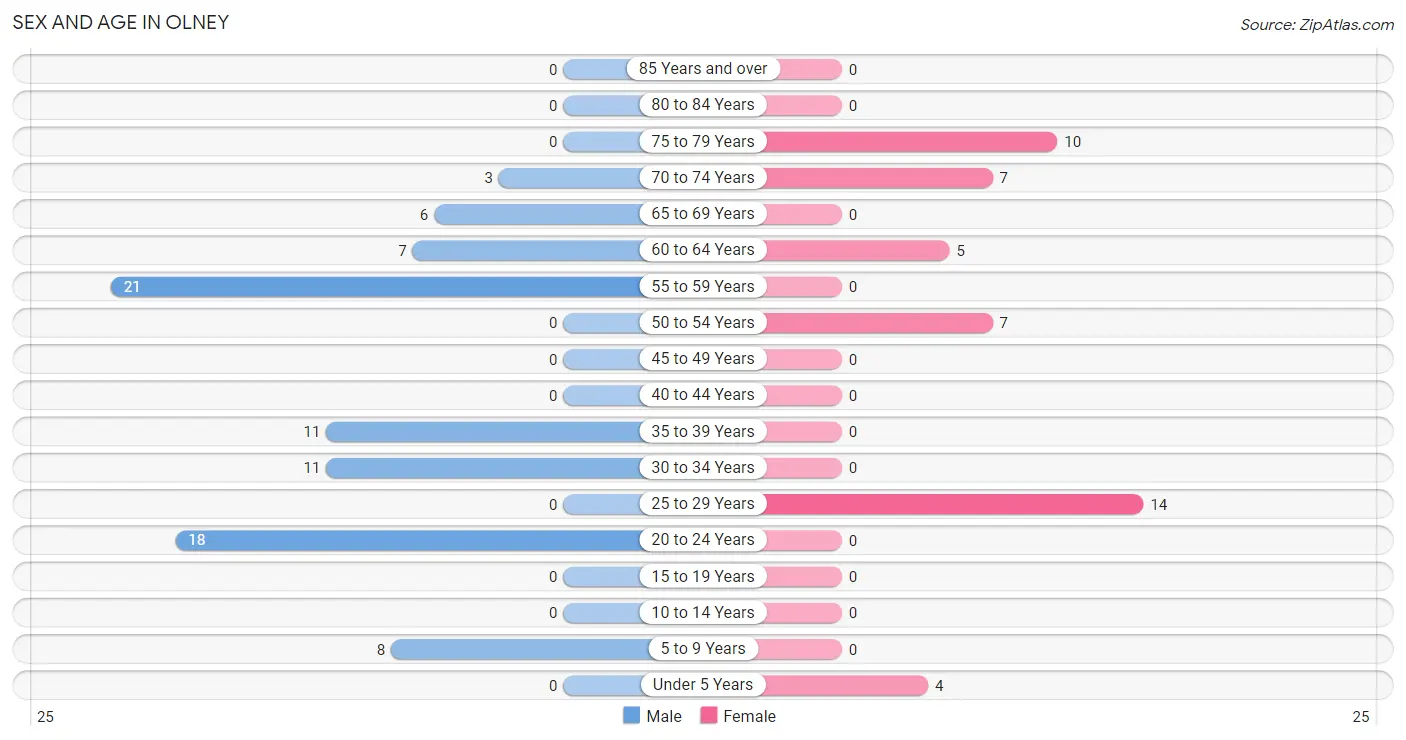
Sex and Age in Olney
Sex and Age in Olney
The most populous age groups in Olney are 55 to 59 Years (21 | 24.7%) for men and 25 to 29 Years (14 | 29.8%) for women.
| Age Bracket | Male | Female |
| Under 5 Years | 0 (0.0%) | 4 (8.5%) |
| 5 to 9 Years | 8 (9.4%) | 0 (0.0%) |
| 10 to 14 Years | 0 (0.0%) | 0 (0.0%) |
| 15 to 19 Years | 0 (0.0%) | 0 (0.0%) |
| 20 to 24 Years | 18 (21.2%) | 0 (0.0%) |
| 25 to 29 Years | 0 (0.0%) | 14 (29.8%) |
| 30 to 34 Years | 11 (12.9%) | 0 (0.0%) |
| 35 to 39 Years | 11 (12.9%) | 0 (0.0%) |
| 40 to 44 Years | 0 (0.0%) | 0 (0.0%) |
| 45 to 49 Years | 0 (0.0%) | 0 (0.0%) |
| 50 to 54 Years | 0 (0.0%) | 7 (14.9%) |
| 55 to 59 Years | 21 (24.7%) | 0 (0.0%) |
| 60 to 64 Years | 7 (8.2%) | 5 (10.6%) |
| 65 to 69 Years | 6 (7.1%) | 0 (0.0%) |
| 70 to 74 Years | 3 (3.5%) | 7 (14.9%) |
| 75 to 79 Years | 0 (0.0%) | 10 (21.3%) |
| 80 to 84 Years | 0 (0.0%) | 0 (0.0%) |
| 85 Years and over | 0 (0.0%) | 0 (0.0%) |
| Total | 85 (100.0%) | 47 (100.0%) |
Families and Households in Olney
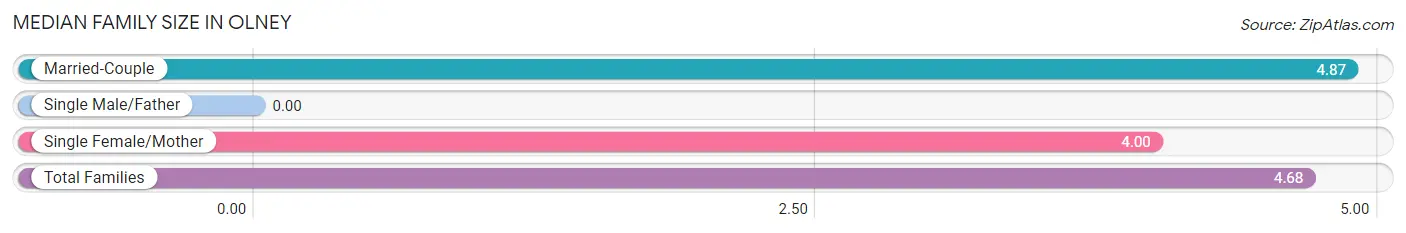
Median Family Size in Olney
| Family Type | # Families | Family Size |
| Married-Couple | 15 (78.9%) | 4.87 |
| Single Male/Father | 0 (0.0%) | - |
| Single Female/Mother | 4 (21.0%) | 4.00 |
| Total Families | 19 (100.0%) | 4.68 |
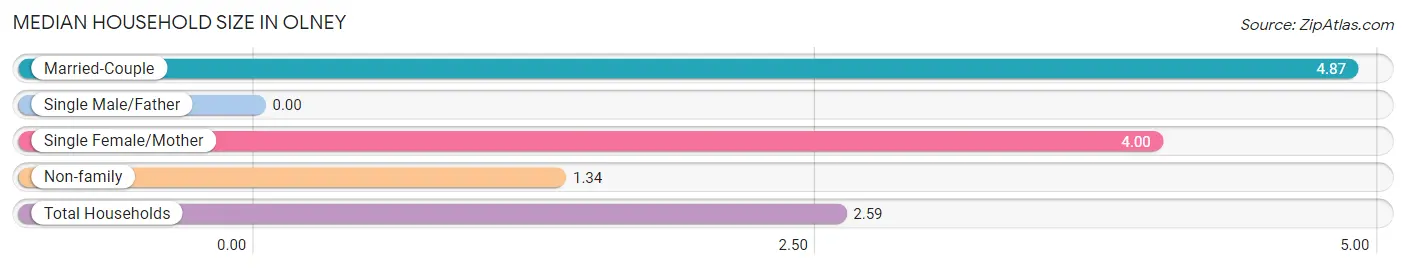
Median Household Size in Olney
| Household Type | # Households | Household Size |
| Married-Couple | 15 (29.4%) | 4.87 |
| Single Male/Father | 0 (0.0%) | - |
| Single Female/Mother | 4 (7.8%) | 4.00 |
| Non-family | 32 (62.7%) | 1.34 |
| Total Households | 51 (100.0%) | 2.59 |
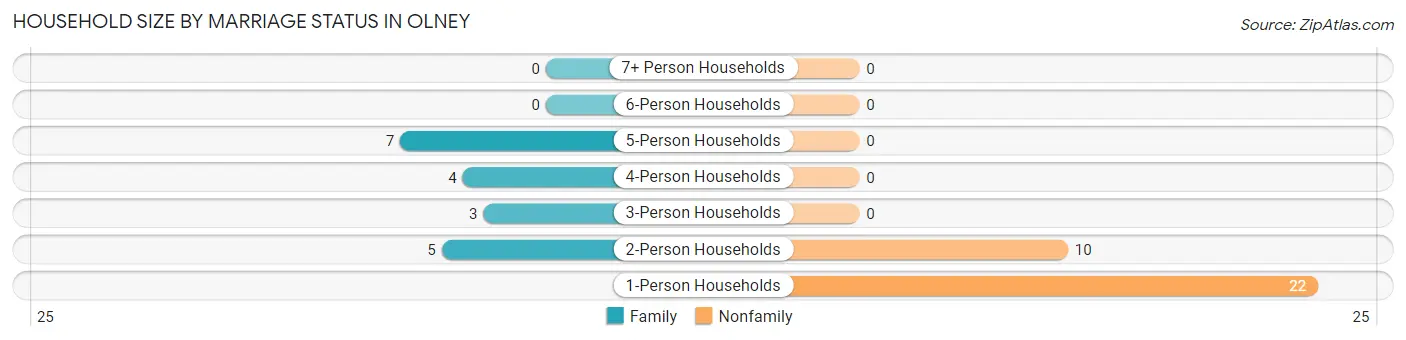
Household Size by Marriage Status in Olney
Out of a total of 51 households in Olney, 19 (37.2%) are family households, while 32 (62.7%) are nonfamily households. The most numerous type of family households are 5-person households, comprising 7, and the most common type of nonfamily households are 1-person households, comprising 22.
| Household Size | Family Households | Nonfamily Households |
| 1-Person Households | - | 22 (43.1%) |
| 2-Person Households | 5 (9.8%) | 10 (19.6%) |
| 3-Person Households | 3 (5.9%) | 0 (0.0%) |
| 4-Person Households | 4 (7.8%) | 0 (0.0%) |
| 5-Person Households | 7 (13.7%) | 0 (0.0%) |
| 6-Person Households | 0 (0.0%) | 0 (0.0%) |
| 7+ Person Households | 0 (0.0%) | 0 (0.0%) |
| Total | 19 (37.2%) | 32 (62.7%) |
Female Fertility in Olney
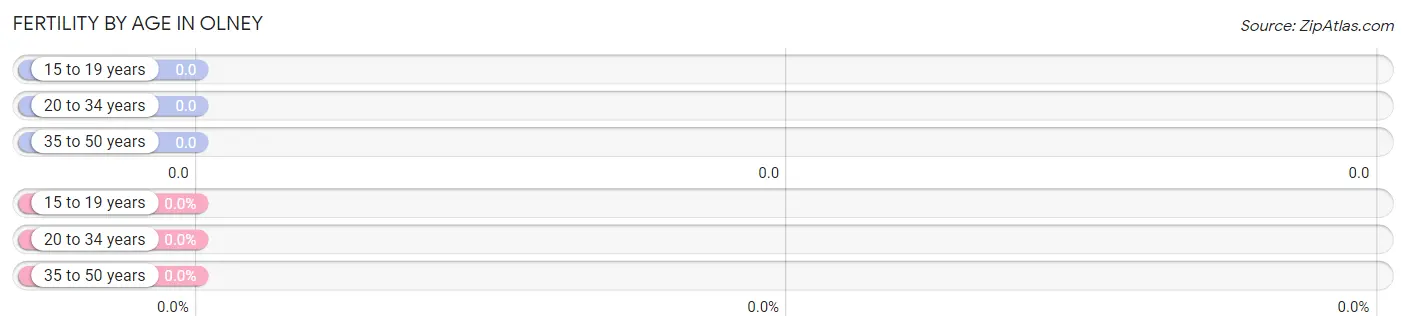
Fertility by Age in Olney
| Age Bracket | Women with Births | Births / 1,000 Women |
| 15 to 19 years | 0 (0.0%) | 0.0 |
| 20 to 34 years | 0 (0.0%) | 0.0 |
| 35 to 50 years | 0 (0.0%) | 0.0 |
| Total | 0 (0.0%) | 0.0 |
Fertility by Age by Marriage Status in Olney
| Age Bracket | Married | Unmarried |
| 15 to 19 years | 0 (0.0%) | 0 (0.0%) |
| 20 to 34 years | 0 (0.0%) | 0 (0.0%) |
| 35 to 50 years | 0 (0.0%) | 0 (0.0%) |
| Total | 0 (0.0%) | 0 (0.0%) |
Fertility by Education in Olney
| Educational Attainment | Women with Births | Births / 1,000 Women |
| Less than High School | 0 (0.0%) | 0.0 |
| High School Diploma | 0 (0.0%) | 0.0 |
| College or Associate's Degree | 0 (0.0%) | 0.0 |
| Bachelor's Degree | 0 (0.0%) | 0.0 |
| Graduate Degree | 0 (0.0%) | 0.0 |
| Total | 0 (0.0%) | 0.0 |
Fertility by Education by Marriage Status in Olney
| Educational Attainment | Married | Unmarried |
| Less than High School | 0 (0.0%) | 0 (0.0%) |
| High School Diploma | 0 (0.0%) | 0 (0.0%) |
| College or Associate's Degree | 0 (0.0%) | 0 (0.0%) |
| Bachelor's Degree | 0 (0.0%) | 0 (0.0%) |
| Graduate Degree | 0 (0.0%) | 0 (0.0%) |
| Total | 0 (0.0%) | 0 (0.0%) |
Income in Olney
Income Overview in Olney
| Characteristic | Number | Measure |
| Per Capita Income | 132 | $29,094 |
| Median Family Income | 19 | $0 |
| Mean Family Income | 19 | $100,447 |
| Median Household Income | 51 | $0 |
| Mean Household Income | 51 | $62,437 |
| Income Deficit | 19 | $0 |
| Wage / Income Gap (%) | 132 | 28.02% |
| Wage / Income Gap ($) | 132 | 71.98¢ per $1 |
| Gini / Inequality Index | 132 | 0.52 |
Earnings by Sex in Olney
Average Earnings in Olney are $34,412, $46,477 for men and $33,456 for women, a difference of 28.0%.
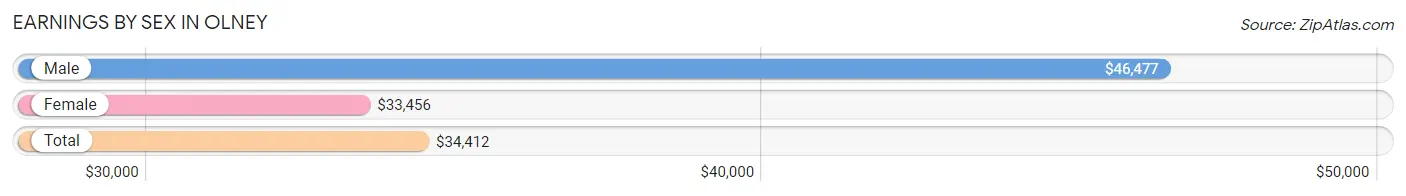
| Sex | Number | Average Earnings |
| Male | 49 (70.0%) | $46,477 |
| Female | 21 (30.0%) | $33,456 |
| Total | 70 (100.0%) | $34,412 |
Earnings by Sex by Income Bracket in Olney
The most common earnings brackets in Olney are $20,000 to $22,499 for men (11 | 22.5%) and $30,000 to $34,999 for women (17 | 80.9%).
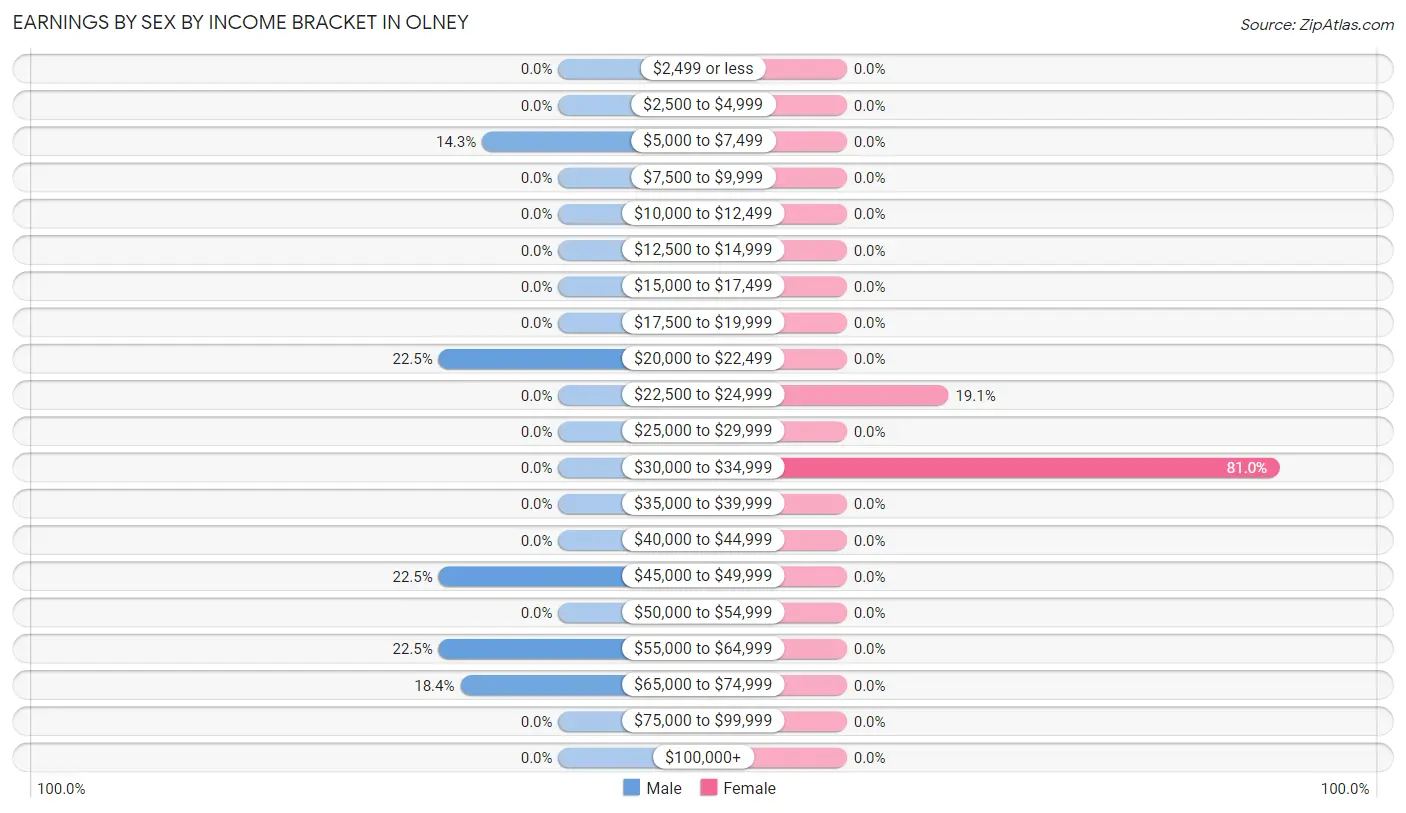
| Income | Male | Female |
| $2,499 or less | 0 (0.0%) | 0 (0.0%) |
| $2,500 to $4,999 | 0 (0.0%) | 0 (0.0%) |
| $5,000 to $7,499 | 7 (14.3%) | 0 (0.0%) |
| $7,500 to $9,999 | 0 (0.0%) | 0 (0.0%) |
| $10,000 to $12,499 | 0 (0.0%) | 0 (0.0%) |
| $12,500 to $14,999 | 0 (0.0%) | 0 (0.0%) |
| $15,000 to $17,499 | 0 (0.0%) | 0 (0.0%) |
| $17,500 to $19,999 | 0 (0.0%) | 0 (0.0%) |
| $20,000 to $22,499 | 11 (22.5%) | 0 (0.0%) |
| $22,500 to $24,999 | 0 (0.0%) | 4 (19.1%) |
| $25,000 to $29,999 | 0 (0.0%) | 0 (0.0%) |
| $30,000 to $34,999 | 0 (0.0%) | 17 (80.9%) |
| $35,000 to $39,999 | 0 (0.0%) | 0 (0.0%) |
| $40,000 to $44,999 | 0 (0.0%) | 0 (0.0%) |
| $45,000 to $49,999 | 11 (22.5%) | 0 (0.0%) |
| $50,000 to $54,999 | 0 (0.0%) | 0 (0.0%) |
| $55,000 to $64,999 | 11 (22.5%) | 0 (0.0%) |
| $65,000 to $74,999 | 9 (18.4%) | 0 (0.0%) |
| $75,000 to $99,999 | 0 (0.0%) | 0 (0.0%) |
| $100,000+ | 0 (0.0%) | 0 (0.0%) |
| Total | 49 (100.0%) | 21 (100.0%) |
Earnings by Sex by Educational Attainment in Olney
| Educational Attainment | Male Income | Female Income |
| Less than High School | - | - |
| High School Diploma | - | - |
| College or Associate's Degree | - | - |
| Bachelor's Degree | - | - |
| Graduate Degree | - | - |
| Total | $58,523 | $33,456 |
Family Income in Olney
Family Income Brackets in Olney
According to the Olney family income data, there are 7 families falling into the $200,000+ income range, which is the most common income bracket and makes up 36.8% of all families.
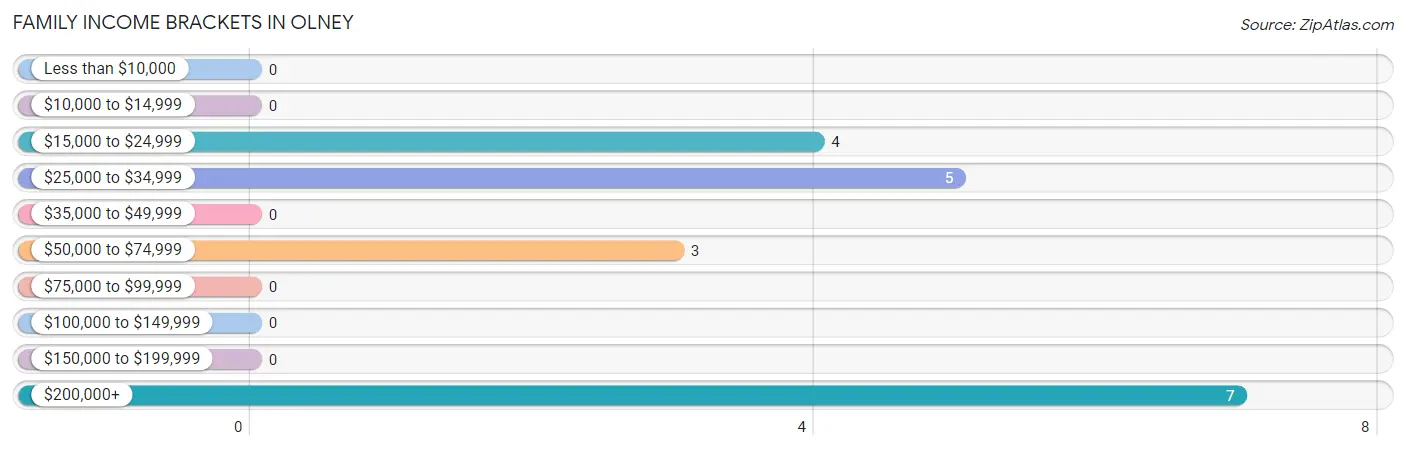
| Income Bracket | # Families | % Families |
| Less than $10,000 | 0 | 0.0% |
| $10,000 to $14,999 | 0 | 0.0% |
| $15,000 to $24,999 | 4 | 21.1% |
| $25,000 to $34,999 | 5 | 26.3% |
| $35,000 to $49,999 | 0 | 0.0% |
| $50,000 to $74,999 | 3 | 15.8% |
| $75,000 to $99,999 | 0 | 0.0% |
| $100,000 to $149,999 | 0 | 0.0% |
| $150,000 to $199,999 | 0 | 0.0% |
| $200,000+ | 7 | 36.8% |
Family Income by Famaliy Size in Olney
| Income Bracket | # Families | Median Income |
| 2-Person Families | 5 (26.3%) | $0 |
| 3-Person Families | 3 (15.8%) | $0 |
| 4-Person Families | 4 (21.0%) | $0 |
| 5-Person Families | 7 (36.8%) | $0 |
| 6-Person Families | 0 (0.0%) | $0 |
| 7+ Person Families | 0 (0.0%) | $0 |
| Total | 19 (100.0%) | $0 |
Family Income by Number of Earners in Olney
| Number of Earners | # Families | Median Income |
| No Earners | 5 (26.3%) | $0 |
| 1 Earner | 7 (36.8%) | $0 |
| 2 Earners | 0 (0.0%) | $0 |
| 3+ Earners | 7 (36.8%) | $0 |
| Total | 19 (100.0%) | $0 |
Household Income in Olney
Household Income Brackets in Olney
With 23 households falling in the category, the $15,000 to $24,999 income range is the most frequent in Olney, accounting for 45.1% of all households.
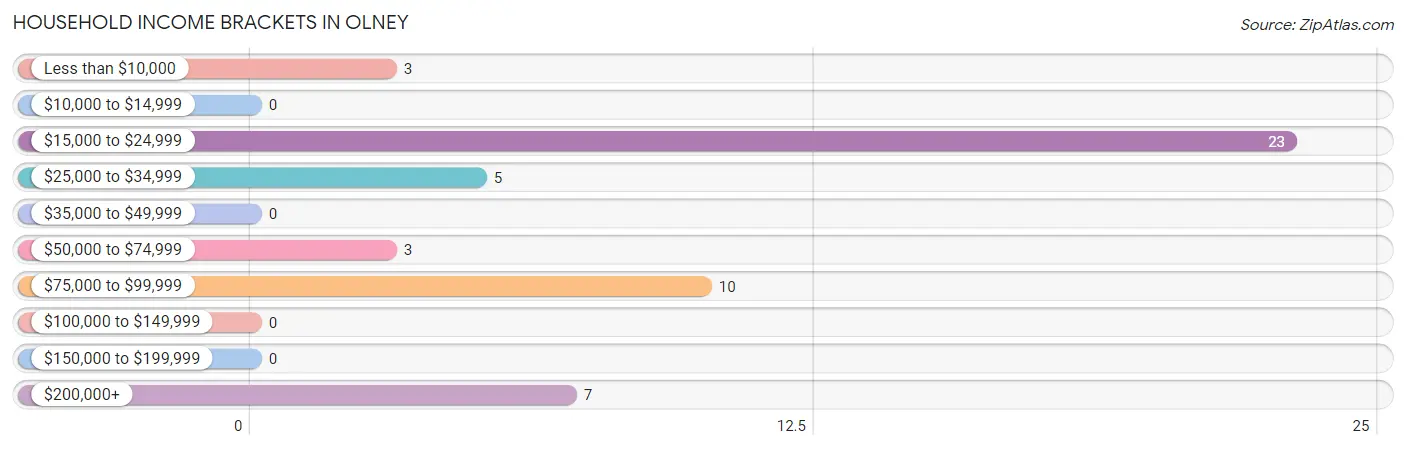
| Income Bracket | # Households | % Households |
| Less than $10,000 | 3 | 5.9% |
| $10,000 to $14,999 | 0 | 0.0% |
| $15,000 to $24,999 | 23 | 45.1% |
| $25,000 to $34,999 | 5 | 9.8% |
| $35,000 to $49,999 | 0 | 0.0% |
| $50,000 to $74,999 | 3 | 5.9% |
| $75,000 to $99,999 | 10 | 19.6% |
| $100,000 to $149,999 | 0 | 0.0% |
| $150,000 to $199,999 | 0 | 0.0% |
| $200,000+ | 7 | 13.7% |
Household Income by Householder Age in Olney
| Income Bracket | # Households | Median Income |
| 15 to 24 Years | 0 (0.0%) | $0 |
| 25 to 44 Years | 14 (27.5%) | $0 |
| 45 to 64 Years | 31 (60.8%) | $0 |
| 65+ Years | 6 (11.8%) | $0 |
| Total | 51 (100.0%) | $0 |
Poverty in Olney
Income Below Poverty by Sex and Age in Olney
With 9.4% poverty level for males and 23.4% for females among the residents of Olney, 5 year old males and under 5 year old females are the most vulnerable to poverty, with 4 males (100.0%) and 4 females (100.0%) in their respective age groups living below the poverty level.
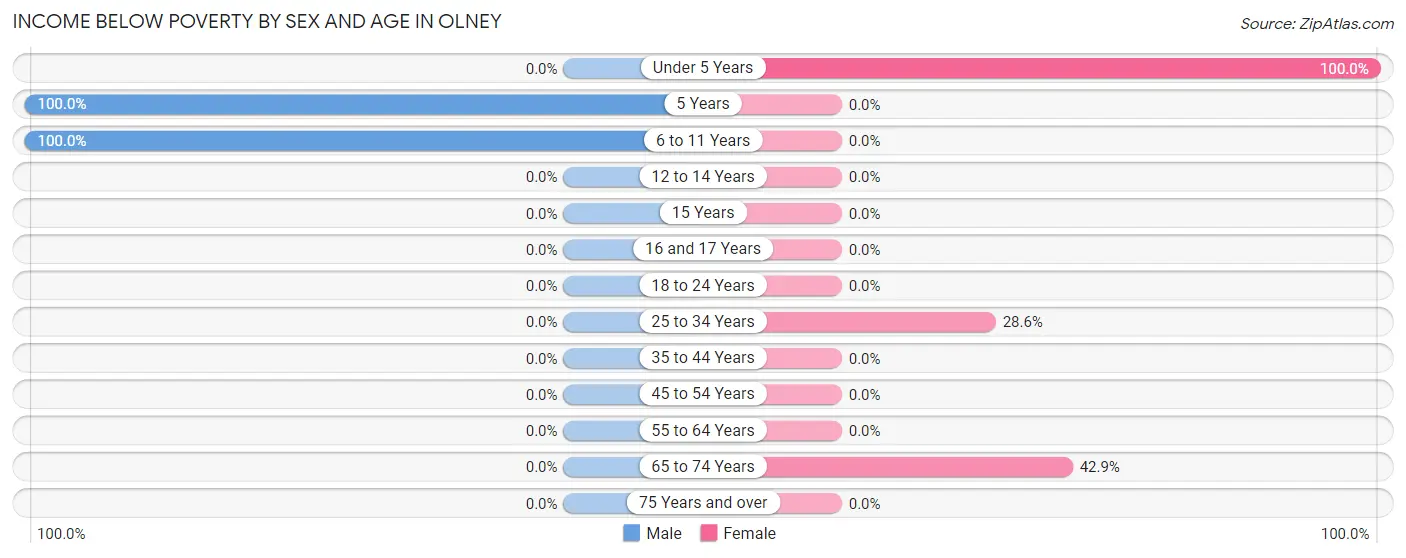
| Age Bracket | Male | Female |
| Under 5 Years | 0 (0.0%) | 4 (100.0%) |
| 5 Years | 4 (100.0%) | 0 (0.0%) |
| 6 to 11 Years | 4 (100.0%) | 0 (0.0%) |
| 12 to 14 Years | 0 (0.0%) | 0 (0.0%) |
| 15 Years | 0 (0.0%) | 0 (0.0%) |
| 16 and 17 Years | 0 (0.0%) | 0 (0.0%) |
| 18 to 24 Years | 0 (0.0%) | 0 (0.0%) |
| 25 to 34 Years | 0 (0.0%) | 4 (28.6%) |
| 35 to 44 Years | 0 (0.0%) | 0 (0.0%) |
| 45 to 54 Years | 0 (0.0%) | 0 (0.0%) |
| 55 to 64 Years | 0 (0.0%) | 0 (0.0%) |
| 65 to 74 Years | 0 (0.0%) | 3 (42.9%) |
| 75 Years and over | 0 (0.0%) | 0 (0.0%) |
| Total | 8 (9.4%) | 11 (23.4%) |
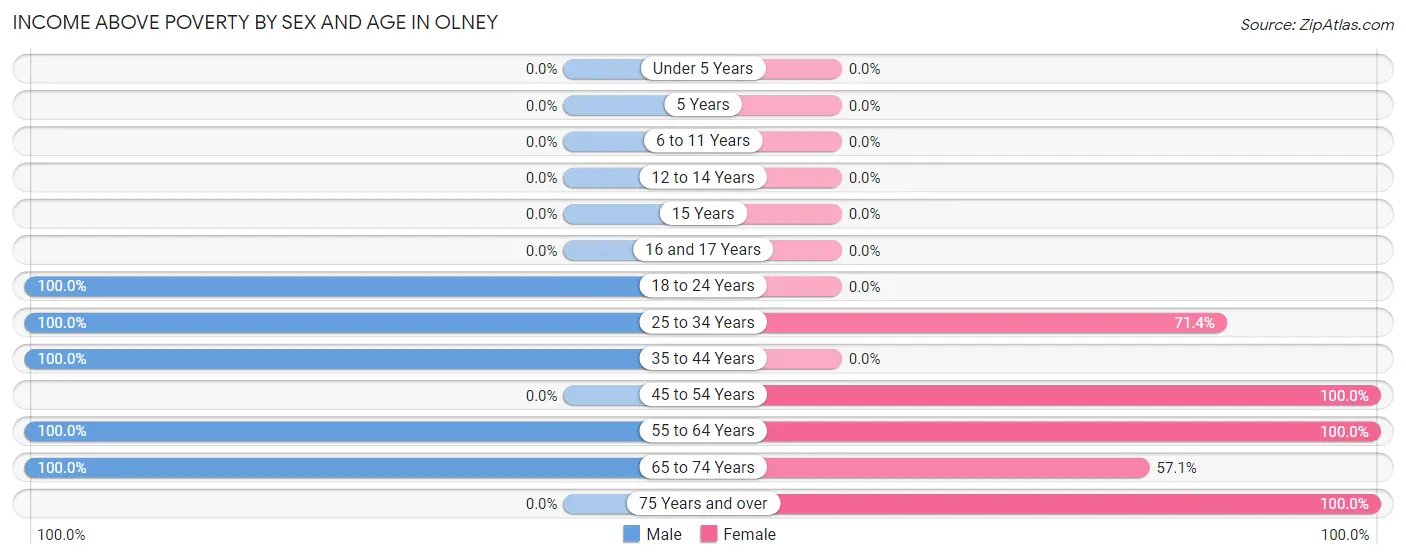
Income Above Poverty by Sex and Age in Olney
According to the poverty statistics in Olney, males aged 18 to 24 years and females aged 45 to 54 years are the age groups that are most secure financially, with 100.0% of males and 100.0% of females in these age groups living above the poverty line.
| Age Bracket | Male | Female |
| Under 5 Years | 0 (0.0%) | 0 (0.0%) |
| 5 Years | 0 (0.0%) | 0 (0.0%) |
| 6 to 11 Years | 0 (0.0%) | 0 (0.0%) |
| 12 to 14 Years | 0 (0.0%) | 0 (0.0%) |
| 15 Years | 0 (0.0%) | 0 (0.0%) |
| 16 and 17 Years | 0 (0.0%) | 0 (0.0%) |
| 18 to 24 Years | 18 (100.0%) | 0 (0.0%) |
| 25 to 34 Years | 11 (100.0%) | 10 (71.4%) |
| 35 to 44 Years | 11 (100.0%) | 0 (0.0%) |
| 45 to 54 Years | 0 (0.0%) | 7 (100.0%) |
| 55 to 64 Years | 28 (100.0%) | 5 (100.0%) |
| 65 to 74 Years | 9 (100.0%) | 4 (57.1%) |
| 75 Years and over | 0 (0.0%) | 10 (100.0%) |
| Total | 77 (90.6%) | 36 (76.6%) |
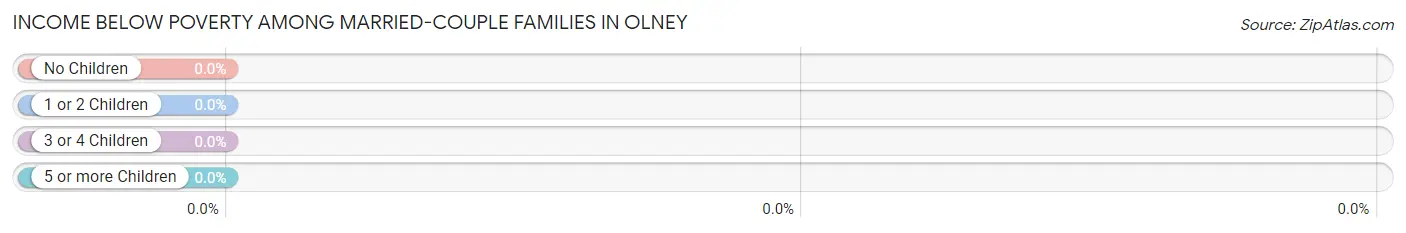
Income Below Poverty Among Married-Couple Families in Olney
| Children | Above Poverty | Below Poverty |
| No Children | 15 (100.0%) | 0 (0.0%) |
| 1 or 2 Children | 0 (0.0%) | 0 (0.0%) |
| 3 or 4 Children | 0 (0.0%) | 0 (0.0%) |
| 5 or more Children | 0 (0.0%) | 0 (0.0%) |
| Total | 15 (100.0%) | 0 (0.0%) |
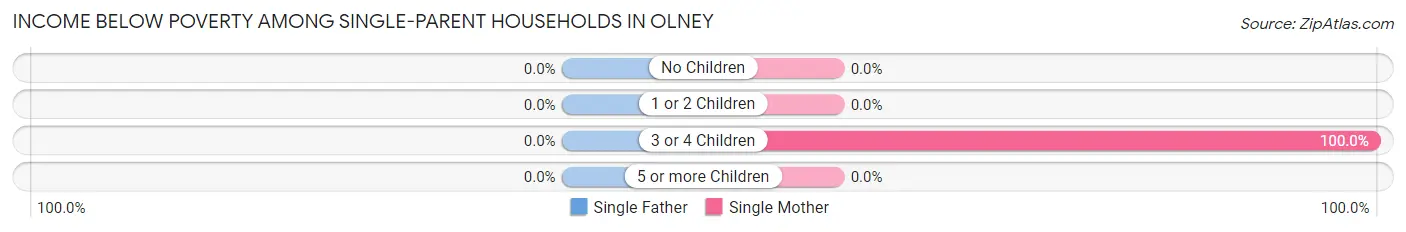
Income Below Poverty Among Single-Parent Households in Olney
| Children | Single Father | Single Mother |
| No Children | 0 (0.0%) | 0 (0.0%) |
| 1 or 2 Children | 0 (0.0%) | 0 (0.0%) |
| 3 or 4 Children | 0 (0.0%) | 4 (100.0%) |
| 5 or more Children | 0 (0.0%) | 0 (0.0%) |
| Total | 0 (0.0%) | 4 (100.0%) |
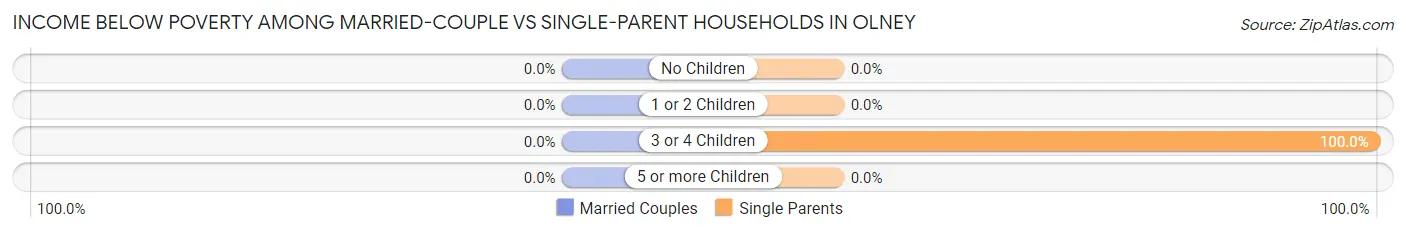
Income Below Poverty Among Married-Couple vs Single-Parent Households in Olney
| Children | Married-Couple Families | Single-Parent Households |
| No Children | 0 (0.0%) | 0 (0.0%) |
| 1 or 2 Children | 0 (0.0%) | 0 (0.0%) |
| 3 or 4 Children | 0 (0.0%) | 4 (100.0%) |
| 5 or more Children | 0 (0.0%) | 0 (0.0%) |
| Total | 0 (0.0%) | 4 (100.0%) |
Employment Characteristics in Olney
Employment by Class of Employer in Olney
Among the 70 employed individuals in Olney, private company employees (66 | 94.3%), and state government employees (4 | 5.7%) make up the most common classes of employment.
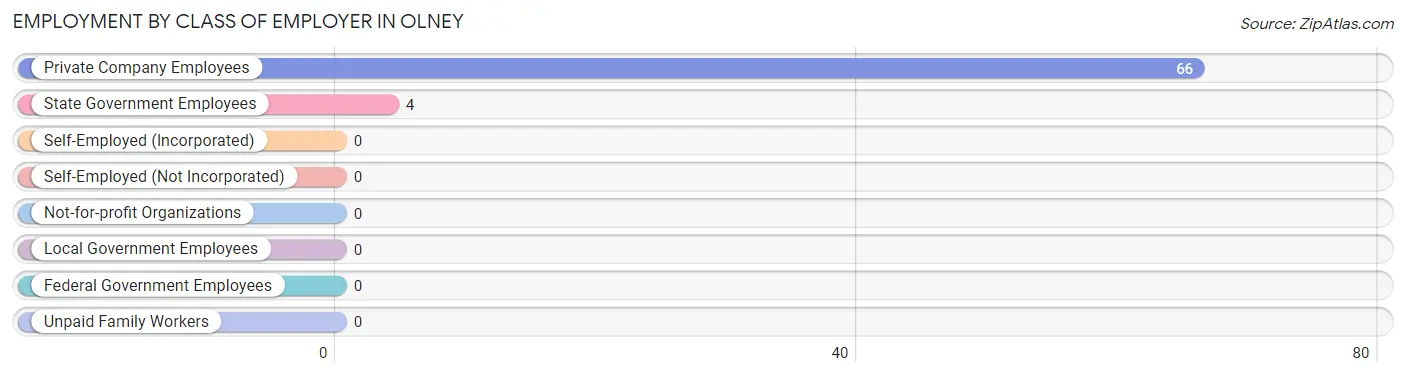
| Employer Class | # Employees | % Employees |
| Private Company Employees | 66 | 94.3% |
| Self-Employed (Incorporated) | 0 | 0.0% |
| Self-Employed (Not Incorporated) | 0 | 0.0% |
| Not-for-profit Organizations | 0 | 0.0% |
| Local Government Employees | 0 | 0.0% |
| State Government Employees | 4 | 5.7% |
| Federal Government Employees | 0 | 0.0% |
| Unpaid Family Workers | 0 | 0.0% |
| Total | 70 | 100.0% |
Employment Status by Age in Olney
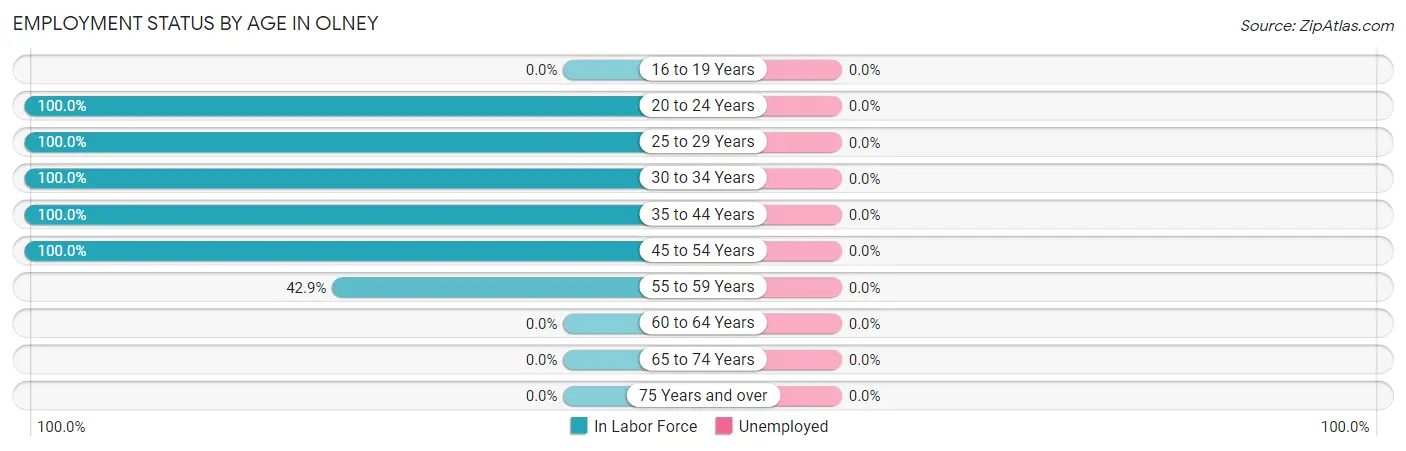
| Age Bracket | In Labor Force | Unemployed |
| 16 to 19 Years | 0 (0.0%) | 0 (0.0%) |
| 20 to 24 Years | 18 (100.0%) | 0 (0.0%) |
| 25 to 29 Years | 14 (100.0%) | 0 (0.0%) |
| 30 to 34 Years | 11 (100.0%) | 0 (0.0%) |
| 35 to 44 Years | 11 (100.0%) | 0 (0.0%) |
| 45 to 54 Years | 7 (100.0%) | 0 (0.0%) |
| 55 to 59 Years | 9 (42.9%) | 0 (0.0%) |
| 60 to 64 Years | 0 (0.0%) | 0 (0.0%) |
| 65 to 74 Years | 0 (0.0%) | 0 (0.0%) |
| 75 Years and over | 0 (0.0%) | 0 (0.0%) |
| Total | 70 (58.3%) | 0 (0.0%) |
Employment Status by Educational Attainment in Olney
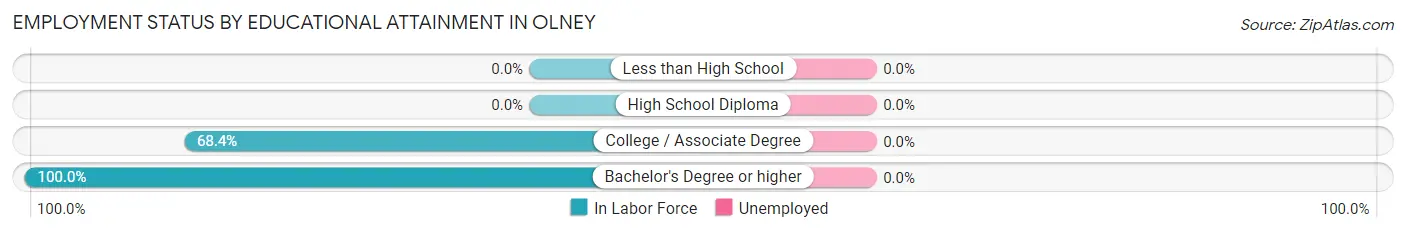
| Educational Attainment | In Labor Force | Unemployed |
| Less than High School | 0 (0.0%) | 0 (0.0%) |
| High School Diploma | 0 (0.0%) | 0 (0.0%) |
| College / Associate Degree | 26 (68.4%) | 0 (0.0%) |
| Bachelor's Degree or higher | 26 (100.0%) | 0 (0.0%) |
| Total | 52 (68.4%) | 0 (0.0%) |
Employment Occupations by Sex in Olney
Management, Business, Science and Arts Occupations
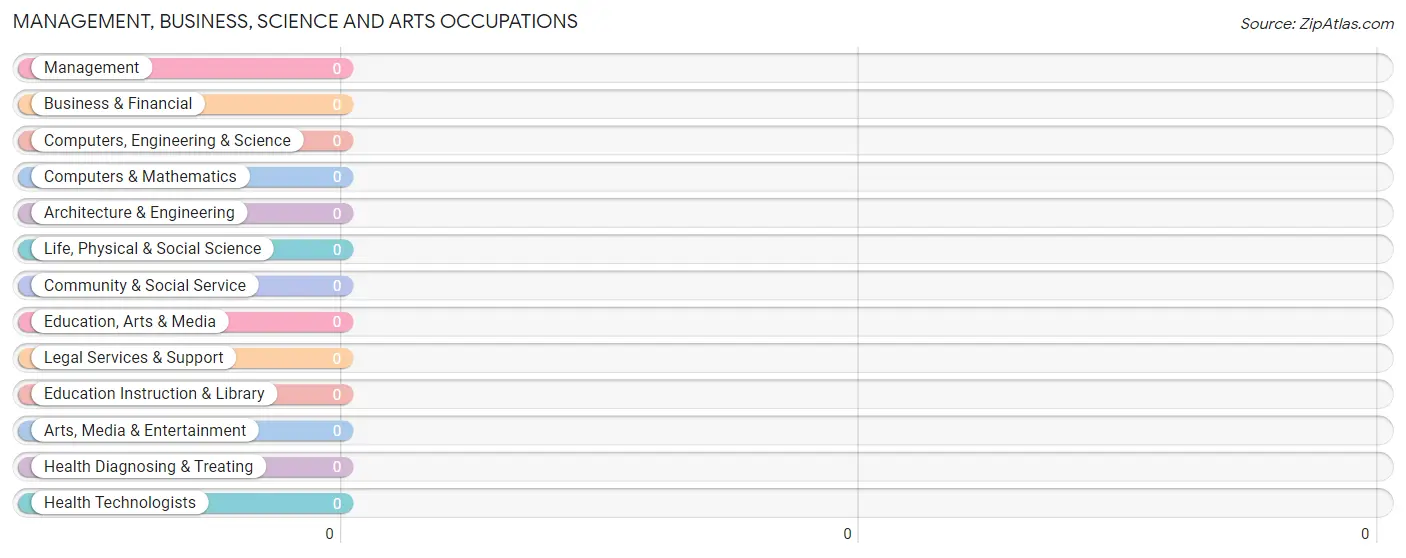
Management, Business, Science and Arts Occupations by Sex
| Occupation | Male | Female |
| Management | 0 (0.0%) | 0 (0.0%) |
| Business & Financial | 0 (0.0%) | 0 (0.0%) |
| Computers, Engineering & Science | 0 (0.0%) | 0 (0.0%) |
| Computers & Mathematics | 0 (0.0%) | 0 (0.0%) |
| Architecture & Engineering | 0 (0.0%) | 0 (0.0%) |
| Life, Physical & Social Science | 0 (0.0%) | 0 (0.0%) |
| Community & Social Service | 0 (0.0%) | 0 (0.0%) |
| Education, Arts & Media | 0 (0.0%) | 0 (0.0%) |
| Legal Services & Support | 0 (0.0%) | 0 (0.0%) |
| Education Instruction & Library | 0 (0.0%) | 0 (0.0%) |
| Arts, Media & Entertainment | 0 (0.0%) | 0 (0.0%) |
| Health Diagnosing & Treating | 0 (0.0%) | 0 (0.0%) |
| Health Technologists | 0 (0.0%) | 0 (0.0%) |
| Total (Category) | 0 (0.0%) | 0 (0.0%) |
| Total (Overall) | 49 (70.0%) | 21 (30.0%) |
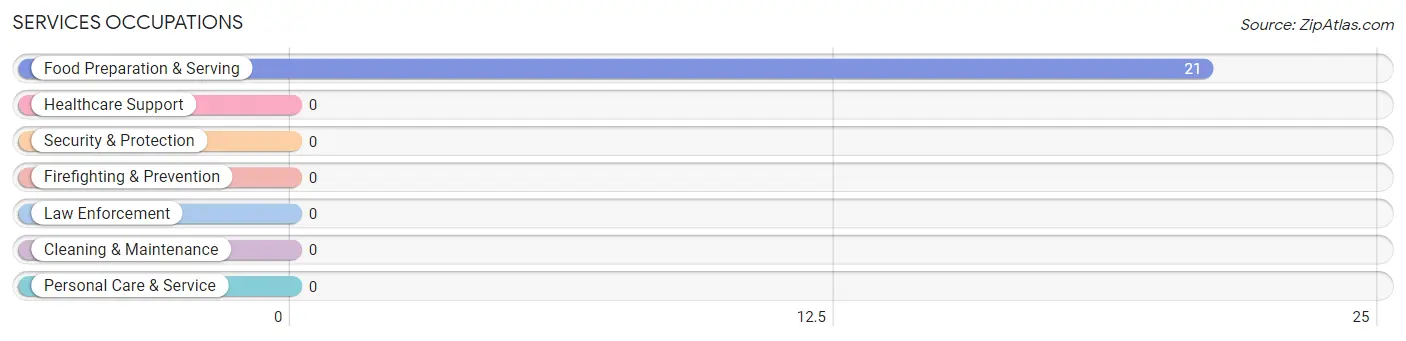
Services Occupations
The most common Services occupations in Olney are , and Food Preparation & Serving (21 | 30.0%).
Services Occupations by Sex
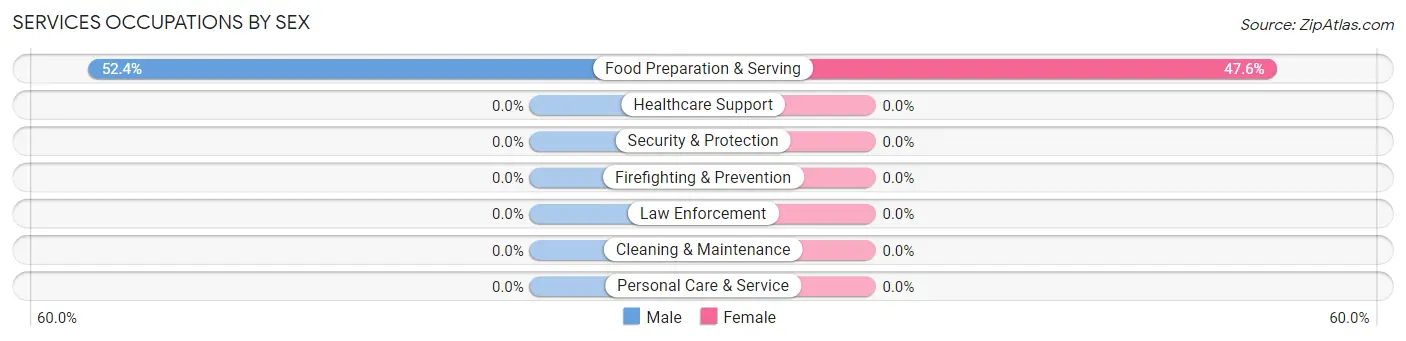
| Occupation | Male | Female |
| Healthcare Support | 0 (0.0%) | 0 (0.0%) |
| Security & Protection | 0 (0.0%) | 0 (0.0%) |
| Firefighting & Prevention | 0 (0.0%) | 0 (0.0%) |
| Law Enforcement | 0 (0.0%) | 0 (0.0%) |
| Food Preparation & Serving | 11 (52.4%) | 10 (47.6%) |
| Cleaning & Maintenance | 0 (0.0%) | 0 (0.0%) |
| Personal Care & Service | 0 (0.0%) | 0 (0.0%) |
| Total (Category) | 11 (52.4%) | 10 (47.6%) |
| Total (Overall) | 49 (70.0%) | 21 (30.0%) |
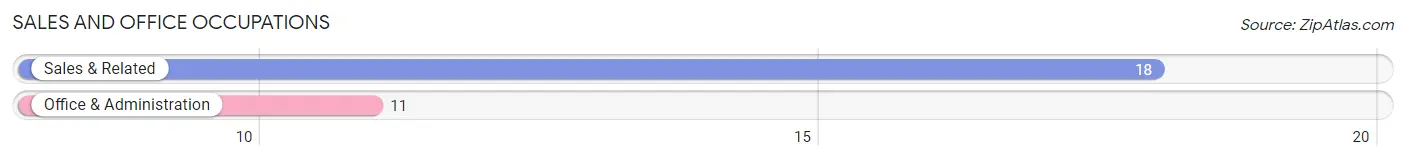
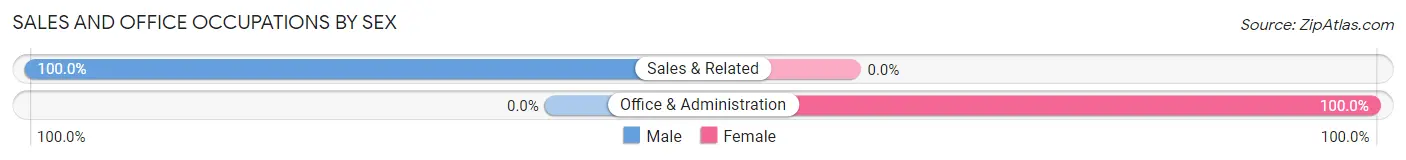
Sales and Office Occupations
The most common Sales and Office occupations in Olney are Sales & Related (18 | 25.7%), and Office & Administration (11 | 15.7%).
Sales and Office Occupations by Sex
| Occupation | Male | Female |
| Sales & Related | 18 (100.0%) | 0 (0.0%) |
| Office & Administration | 0 (0.0%) | 11 (100.0%) |
| Total (Category) | 18 (62.1%) | 11 (37.9%) |
| Total (Overall) | 49 (70.0%) | 21 (30.0%) |
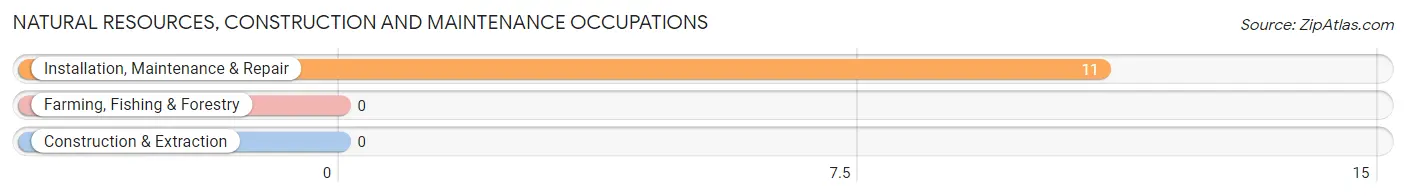
Natural Resources, Construction and Maintenance Occupations
The most common Natural Resources, Construction and Maintenance occupations in Olney are , and Installation, Maintenance & Repair (11 | 15.7%).
Natural Resources, Construction and Maintenance Occupations by Sex
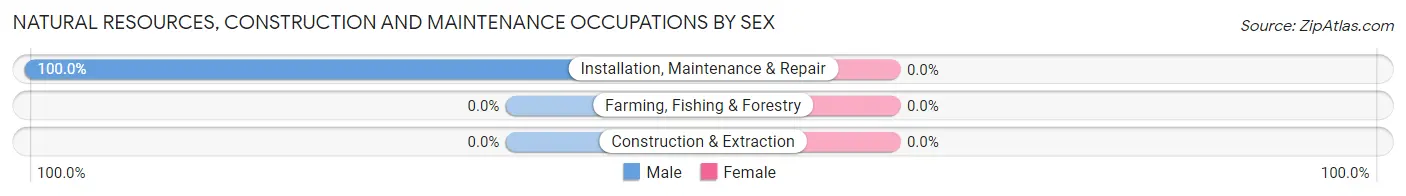
| Occupation | Male | Female |
| Farming, Fishing & Forestry | 0 (0.0%) | 0 (0.0%) |
| Construction & Extraction | 0 (0.0%) | 0 (0.0%) |
| Installation, Maintenance & Repair | 11 (100.0%) | 0 (0.0%) |
| Total (Category) | 11 (100.0%) | 0 (0.0%) |
| Total (Overall) | 49 (70.0%) | 21 (30.0%) |
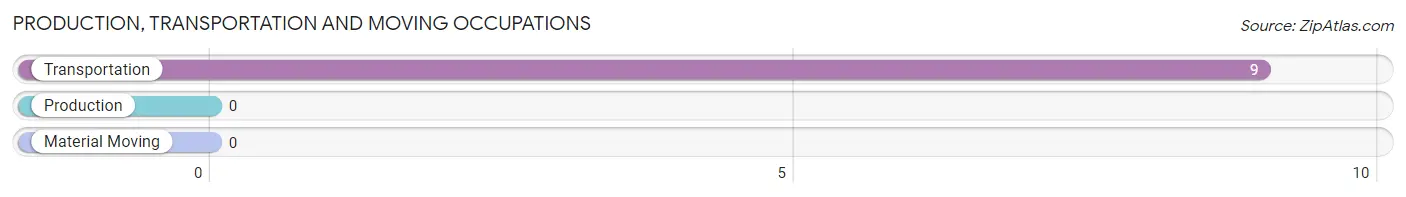
Production, Transportation and Moving Occupations
The most common Production, Transportation and Moving occupations in Olney are , and Transportation (9 | 12.9%).
Production, Transportation and Moving Occupations by Sex
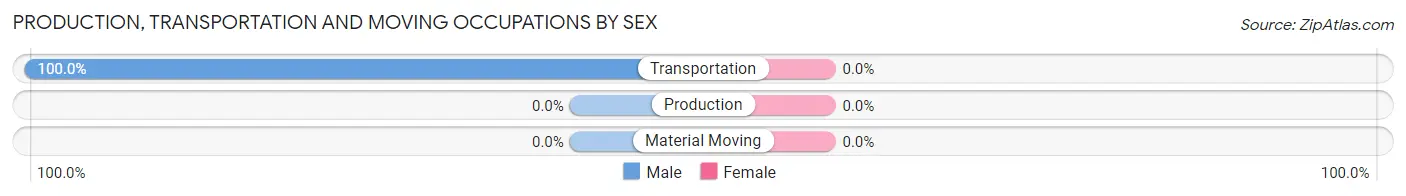
| Occupation | Male | Female |
| Production | 0 (0.0%) | 0 (0.0%) |
| Transportation | 9 (100.0%) | 0 (0.0%) |
| Material Moving | 0 (0.0%) | 0 (0.0%) |
| Total (Category) | 9 (100.0%) | 0 (0.0%) |
| Total (Overall) | 49 (70.0%) | 21 (30.0%) |
Employment Industries by Sex in Olney
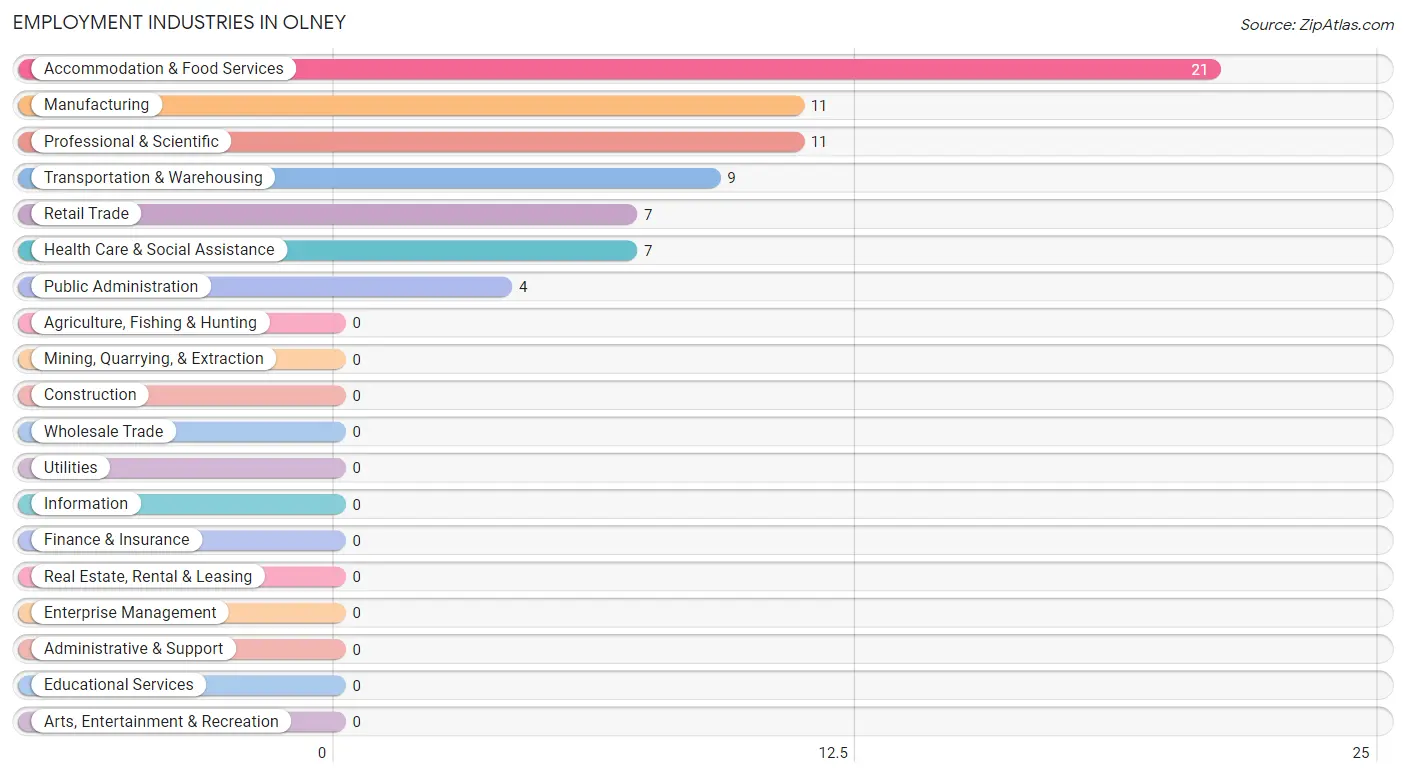
Employment Industries in Olney
The major employment industries in Olney include Accommodation & Food Services (21 | 30.0%), Manufacturing (11 | 15.7%), Professional & Scientific (11 | 15.7%), Transportation & Warehousing (9 | 12.9%), and Retail Trade (7 | 10.0%).
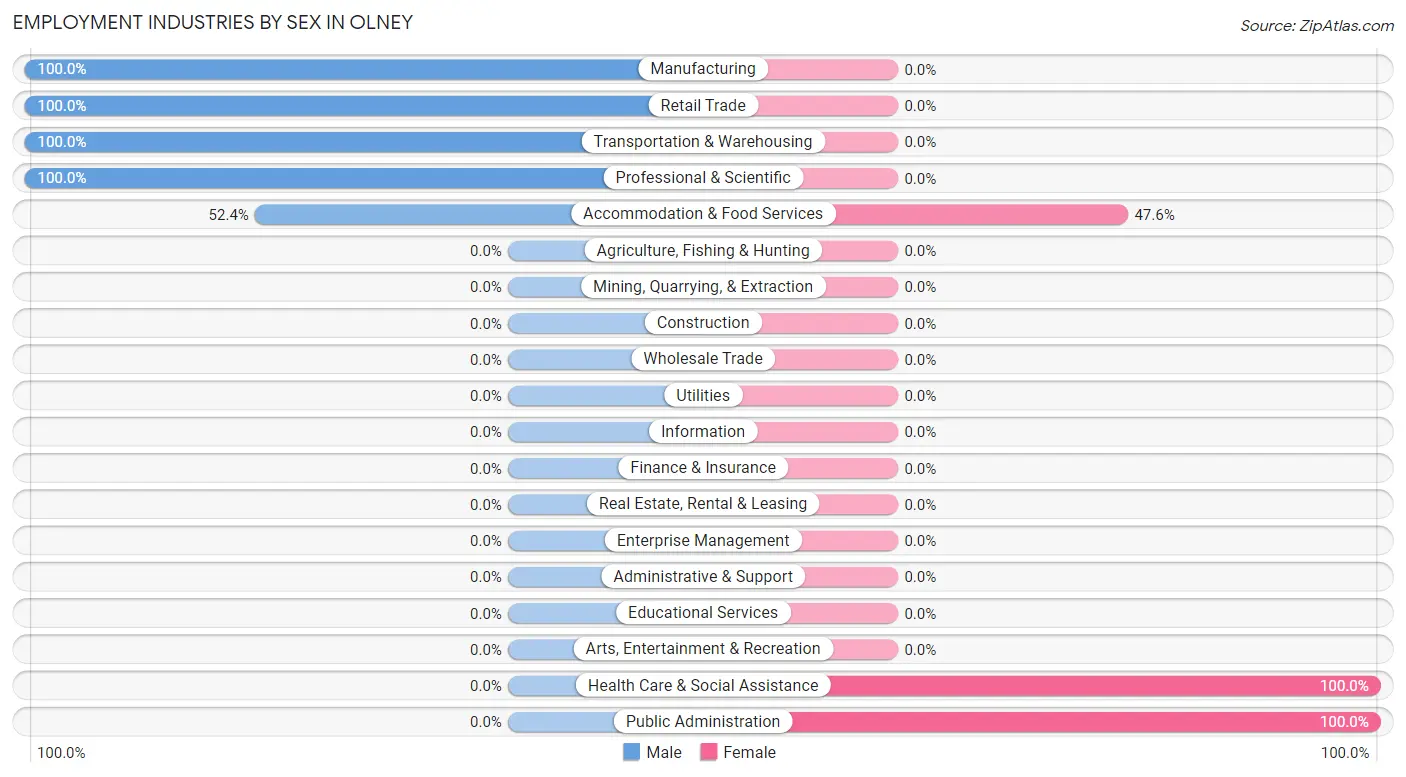
Employment Industries by Sex in Olney
The Olney industries that see more men than women are Manufacturing (100.0%), Retail Trade (100.0%), and Transportation & Warehousing (100.0%), whereas the industries that tend to have a higher number of women are Health Care & Social Assistance (100.0%), Public Administration (100.0%), and Accommodation & Food Services (47.6%).
| Industry | Male | Female |
| Agriculture, Fishing & Hunting | 0 (0.0%) | 0 (0.0%) |
| Mining, Quarrying, & Extraction | 0 (0.0%) | 0 (0.0%) |
| Construction | 0 (0.0%) | 0 (0.0%) |
| Manufacturing | 11 (100.0%) | 0 (0.0%) |
| Wholesale Trade | 0 (0.0%) | 0 (0.0%) |
| Retail Trade | 7 (100.0%) | 0 (0.0%) |
| Transportation & Warehousing | 9 (100.0%) | 0 (0.0%) |
| Utilities | 0 (0.0%) | 0 (0.0%) |
| Information | 0 (0.0%) | 0 (0.0%) |
| Finance & Insurance | 0 (0.0%) | 0 (0.0%) |
| Real Estate, Rental & Leasing | 0 (0.0%) | 0 (0.0%) |
| Professional & Scientific | 11 (100.0%) | 0 (0.0%) |
| Enterprise Management | 0 (0.0%) | 0 (0.0%) |
| Administrative & Support | 0 (0.0%) | 0 (0.0%) |
| Educational Services | 0 (0.0%) | 0 (0.0%) |
| Health Care & Social Assistance | 0 (0.0%) | 7 (100.0%) |
| Arts, Entertainment & Recreation | 0 (0.0%) | 0 (0.0%) |
| Accommodation & Food Services | 11 (52.4%) | 10 (47.6%) |
| Public Administration | 0 (0.0%) | 4 (100.0%) |
| Total | 49 (70.0%) | 21 (30.0%) |
Education in Olney
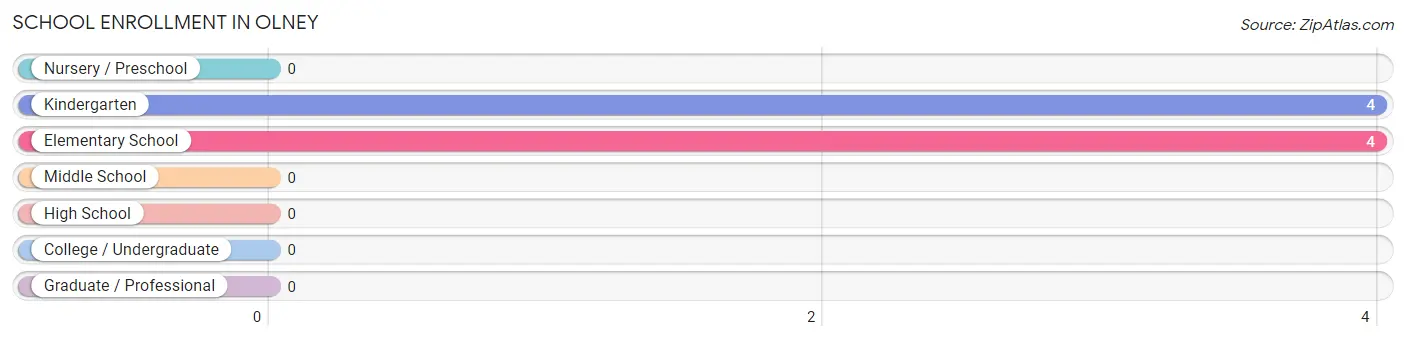
School Enrollment in Olney
The most common levels of schooling among the 8 students in Olney are kindergarten (4 | 50.0%), and elementary school (4 | 50.0%).
| School Level | # Students | % Students |
| Nursery / Preschool | 0 | 0.0% |
| Kindergarten | 4 | 50.0% |
| Elementary School | 4 | 50.0% |
| Middle School | 0 | 0.0% |
| High School | 0 | 0.0% |
| College / Undergraduate | 0 | 0.0% |
| Graduate / Professional | 0 | 0.0% |
| Total | 8 | 100.0% |
School Enrollment by Age by Funding Source in Olney
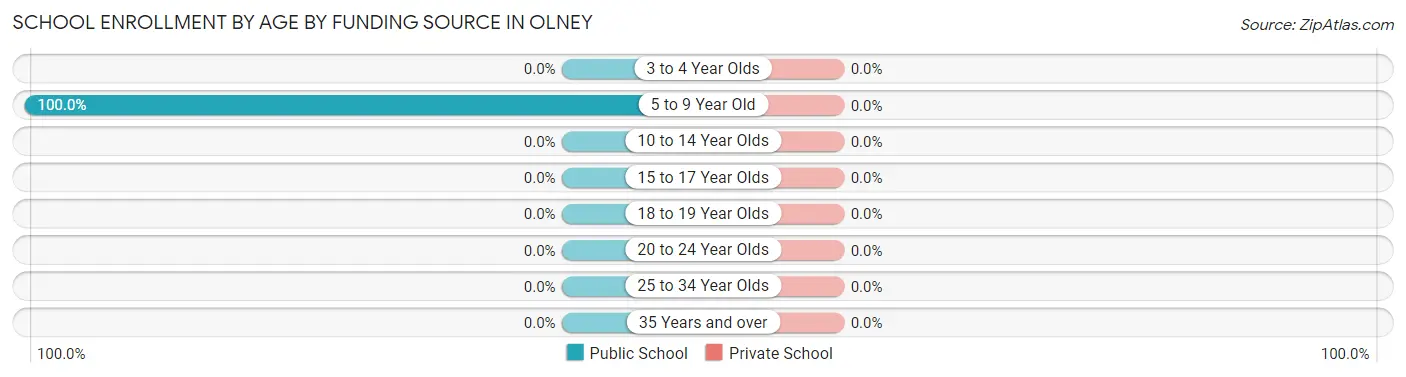
| Age Bracket | Public School | Private School |
| 3 to 4 Year Olds | 0 (0.0%) | 0 (0.0%) |
| 5 to 9 Year Old | 8 (100.0%) | 0 (0.0%) |
| 10 to 14 Year Olds | 0 (0.0%) | 0 (0.0%) |
| 15 to 17 Year Olds | 0 (0.0%) | 0 (0.0%) |
| 18 to 19 Year Olds | 0 (0.0%) | 0 (0.0%) |
| 20 to 24 Year Olds | 0 (0.0%) | 0 (0.0%) |
| 25 to 34 Year Olds | 0 (0.0%) | 0 (0.0%) |
| 35 Years and over | 0 (0.0%) | 0 (0.0%) |
| Total | 8 (100.0%) | 0 (0.0%) |
Educational Attainment by Field of Study in Olney
Social sciences (11 | 36.7%), liberal arts & history (11 | 36.7%), psychology (4 | 13.3%), and arts & humanities (4 | 13.3%) are the most common fields of study among 30 individuals in Olney who have obtained a bachelor's degree or higher.
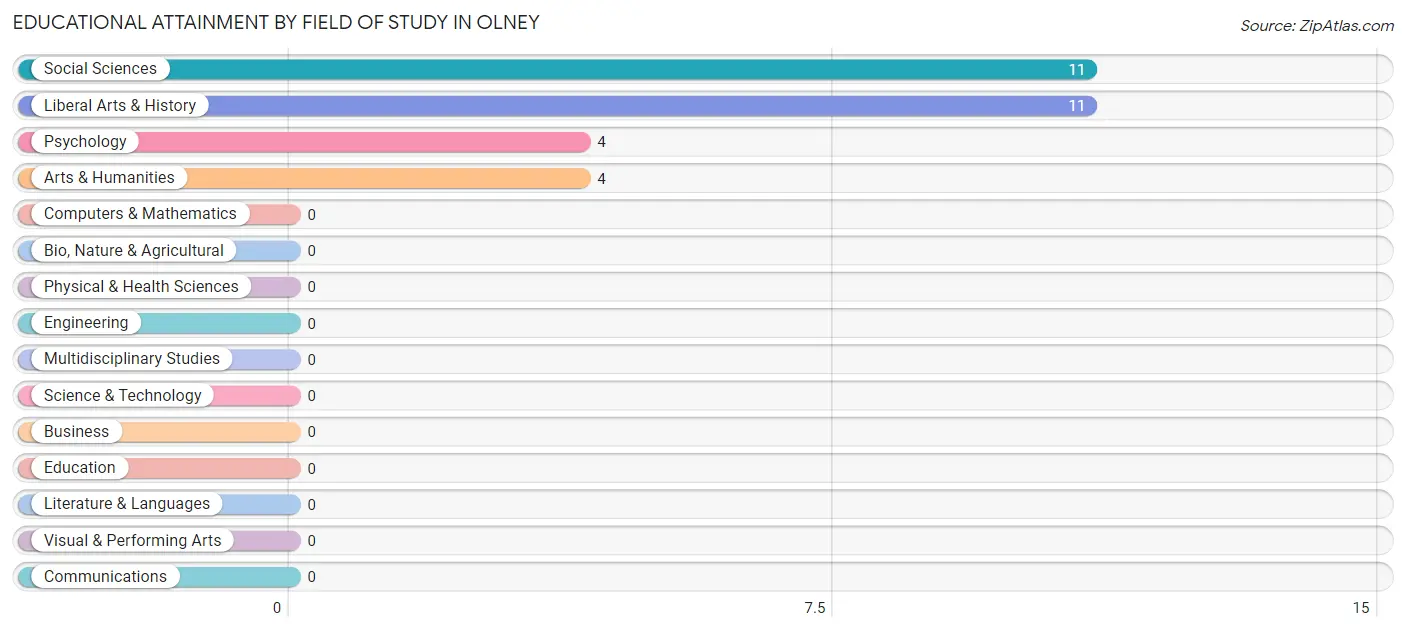
| Field of Study | # Graduates | % Graduates |
| Computers & Mathematics | 0 | 0.0% |
| Bio, Nature & Agricultural | 0 | 0.0% |
| Physical & Health Sciences | 0 | 0.0% |
| Psychology | 4 | 13.3% |
| Social Sciences | 11 | 36.7% |
| Engineering | 0 | 0.0% |
| Multidisciplinary Studies | 0 | 0.0% |
| Science & Technology | 0 | 0.0% |
| Business | 0 | 0.0% |
| Education | 0 | 0.0% |
| Literature & Languages | 0 | 0.0% |
| Liberal Arts & History | 11 | 36.7% |
| Visual & Performing Arts | 0 | 0.0% |
| Communications | 0 | 0.0% |
| Arts & Humanities | 4 | 13.3% |
| Total | 30 | 100.0% |
Transportation & Commute in Olney
Vehicle Availability by Sex in Olney
The most prevalent vehicle ownership categories in Olney are males with 5 or more vehicles (31, accounting for 63.3%) and females with 5 or more vehicles (7, making up 147.6%).
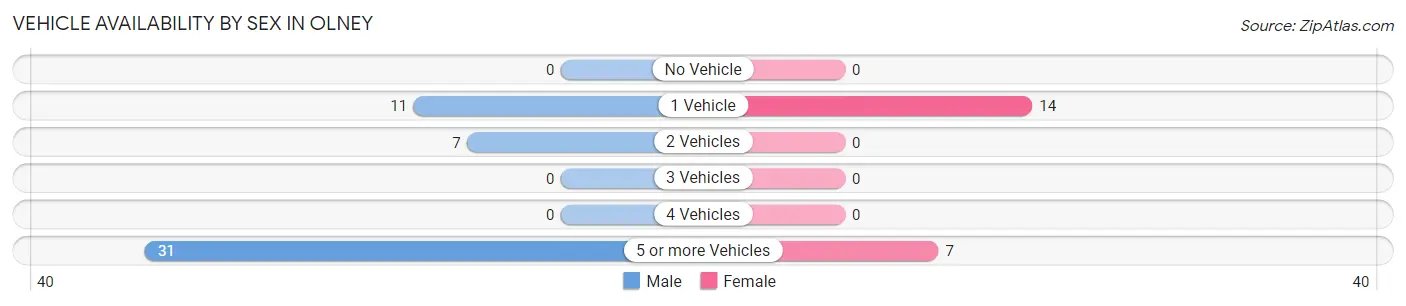
| Vehicles Available | Male | Female |
| No Vehicle | 0 (0.0%) | 0 (0.0%) |
| 1 Vehicle | 11 (22.5%) | 14 (66.7%) |
| 2 Vehicles | 7 (14.3%) | 0 (0.0%) |
| 3 Vehicles | 0 (0.0%) | 0 (0.0%) |
| 4 Vehicles | 0 (0.0%) | 0 (0.0%) |
| 5 or more Vehicles | 31 (63.3%) | 7 (33.3%) |
| Total | 49 (100.0%) | 21 (100.0%) |
Commute Time in Olney
The most frequently occuring commute durations in Olney are 5 to 9 minutes (31 commuters, 47.0%), 30 to 34 minutes (21 commuters, 31.8%), and 20 to 24 minutes (7 commuters, 10.6%).
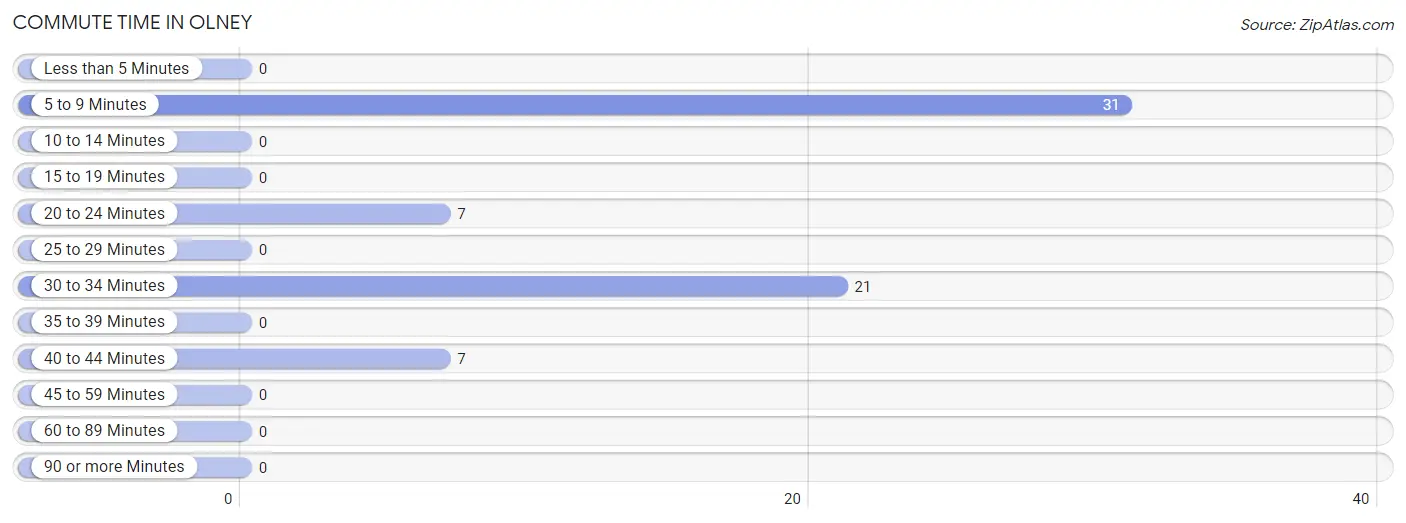
| Commute Time | # Commuters | % Commuters |
| Less than 5 Minutes | 0 | 0.0% |
| 5 to 9 Minutes | 31 | 47.0% |
| 10 to 14 Minutes | 0 | 0.0% |
| 15 to 19 Minutes | 0 | 0.0% |
| 20 to 24 Minutes | 7 | 10.6% |
| 25 to 29 Minutes | 0 | 0.0% |
| 30 to 34 Minutes | 21 | 31.8% |
| 35 to 39 Minutes | 0 | 0.0% |
| 40 to 44 Minutes | 7 | 10.6% |
| 45 to 59 Minutes | 0 | 0.0% |
| 60 to 89 Minutes | 0 | 0.0% |
| 90 or more Minutes | 0 | 0.0% |
Commute Time by Sex in Olney
The most common commute times in Olney are 5 to 9 minutes (31 commuters, 63.3%) for males and 30 to 34 minutes (10 commuters, 58.8%) for females.
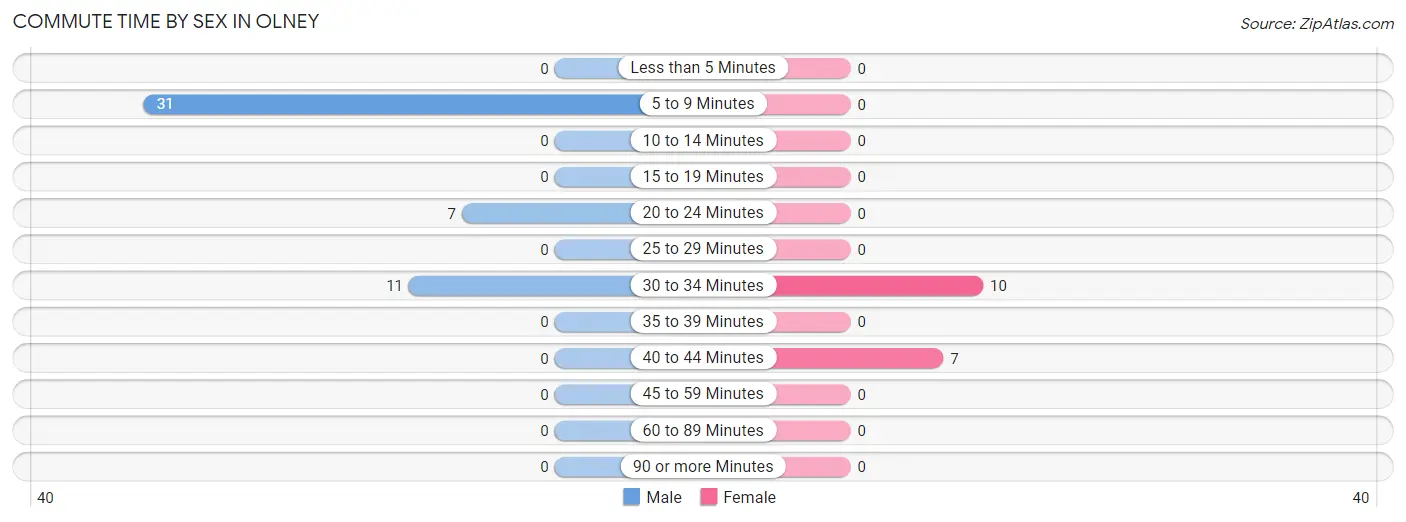
| Commute Time | Male | Female |
| Less than 5 Minutes | 0 (0.0%) | 0 (0.0%) |
| 5 to 9 Minutes | 31 (63.3%) | 0 (0.0%) |
| 10 to 14 Minutes | 0 (0.0%) | 0 (0.0%) |
| 15 to 19 Minutes | 0 (0.0%) | 0 (0.0%) |
| 20 to 24 Minutes | 7 (14.3%) | 0 (0.0%) |
| 25 to 29 Minutes | 0 (0.0%) | 0 (0.0%) |
| 30 to 34 Minutes | 11 (22.5%) | 10 (58.8%) |
| 35 to 39 Minutes | 0 (0.0%) | 0 (0.0%) |
| 40 to 44 Minutes | 0 (0.0%) | 7 (41.2%) |
| 45 to 59 Minutes | 0 (0.0%) | 0 (0.0%) |
| 60 to 89 Minutes | 0 (0.0%) | 0 (0.0%) |
| 90 or more Minutes | 0 (0.0%) | 0 (0.0%) |
Time of Departure to Work by Sex in Olney
The most frequent times of departure to work in Olney are 6:30 AM to 6:59 AM (11, 22.5%) for males and 9:00 AM to 9:59 AM (10, 58.8%) for females.
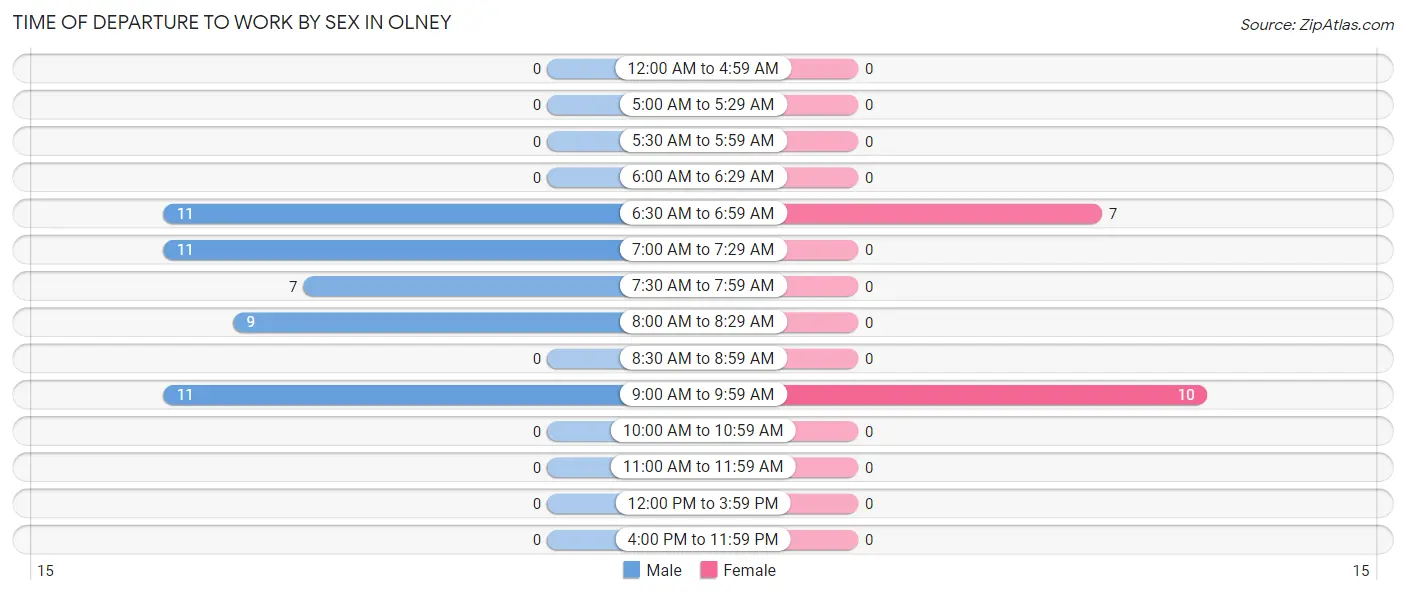
| Time of Departure | Male | Female |
| 12:00 AM to 4:59 AM | 0 (0.0%) | 0 (0.0%) |
| 5:00 AM to 5:29 AM | 0 (0.0%) | 0 (0.0%) |
| 5:30 AM to 5:59 AM | 0 (0.0%) | 0 (0.0%) |
| 6:00 AM to 6:29 AM | 0 (0.0%) | 0 (0.0%) |
| 6:30 AM to 6:59 AM | 11 (22.5%) | 7 (41.2%) |
| 7:00 AM to 7:29 AM | 11 (22.5%) | 0 (0.0%) |
| 7:30 AM to 7:59 AM | 7 (14.3%) | 0 (0.0%) |
| 8:00 AM to 8:29 AM | 9 (18.4%) | 0 (0.0%) |
| 8:30 AM to 8:59 AM | 0 (0.0%) | 0 (0.0%) |
| 9:00 AM to 9:59 AM | 11 (22.5%) | 10 (58.8%) |
| 10:00 AM to 10:59 AM | 0 (0.0%) | 0 (0.0%) |
| 11:00 AM to 11:59 AM | 0 (0.0%) | 0 (0.0%) |
| 12:00 PM to 3:59 PM | 0 (0.0%) | 0 (0.0%) |
| 4:00 PM to 11:59 PM | 0 (0.0%) | 0 (0.0%) |
| Total | 49 (100.0%) | 17 (100.0%) |
Housing Occupancy in Olney
Occupancy by Ownership in Olney
Of the total 51 dwellings in Olney, owner-occupied units account for 29 (56.9%), while renter-occupied units make up 22 (43.1%).
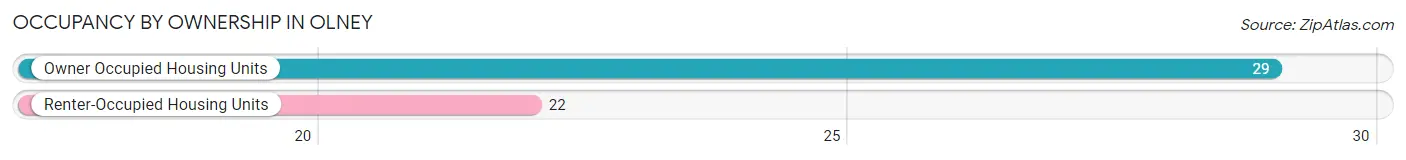
| Occupancy | # Housing Units | % Housing Units |
| Owner Occupied Housing Units | 29 | 56.9% |
| Renter-Occupied Housing Units | 22 | 43.1% |
| Total Occupied Housing Units | 51 | 100.0% |
Occupancy by Household Size in Olney
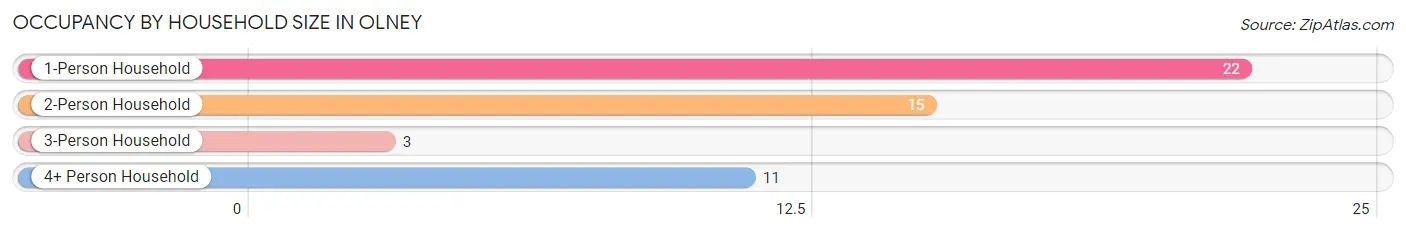
| Household Size | # Housing Units | % Housing Units |
| 1-Person Household | 22 | 43.1% |
| 2-Person Household | 15 | 29.4% |
| 3-Person Household | 3 | 5.9% |
| 4+ Person Household | 11 | 21.6% |
| Total Housing Units | 51 | 100.0% |
Occupancy by Ownership by Household Size in Olney
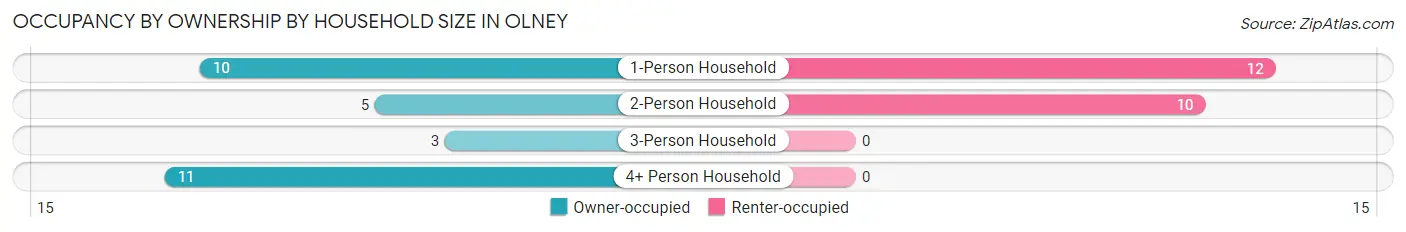
| Household Size | Owner-occupied | Renter-occupied |
| 1-Person Household | 10 (45.5%) | 12 (54.5%) |
| 2-Person Household | 5 (33.3%) | 10 (66.7%) |
| 3-Person Household | 3 (100.0%) | 0 (0.0%) |
| 4+ Person Household | 11 (100.0%) | 0 (0.0%) |
| Total Housing Units | 29 (56.9%) | 22 (43.1%) |
Occupancy by Educational Attainment in Olney
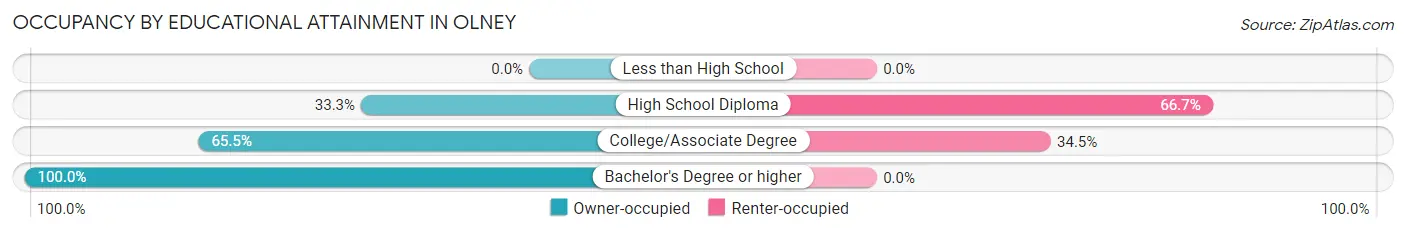
| Household Size | Owner-occupied | Renter-occupied |
| Less than High School | 0 (0.0%) | 0 (0.0%) |
| High School Diploma | 6 (33.3%) | 12 (66.7%) |
| College/Associate Degree | 19 (65.5%) | 10 (34.5%) |
| Bachelor's Degree or higher | 4 (100.0%) | 0 (0.0%) |
Occupancy by Age of Householder in Olney
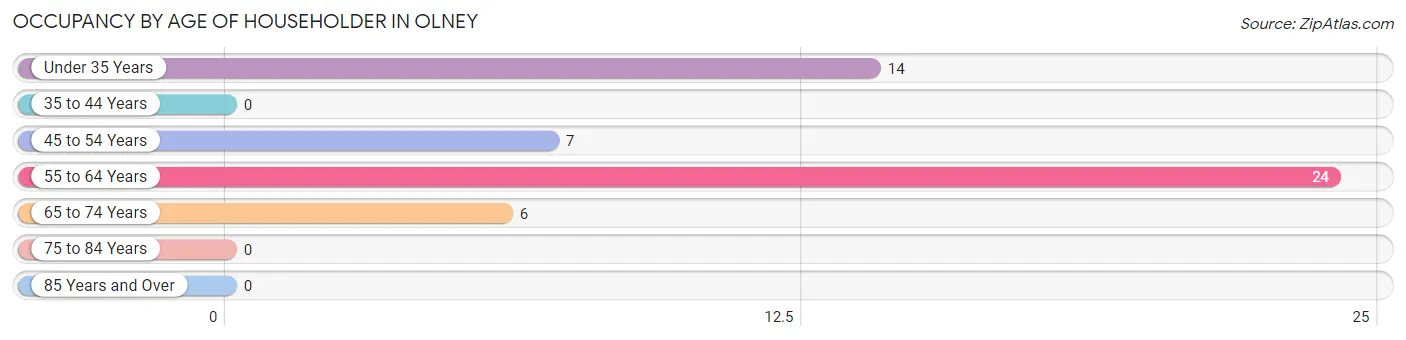
| Age Bracket | # Households | % Households |
| Under 35 Years | 14 | 27.5% |
| 35 to 44 Years | 0 | 0.0% |
| 45 to 54 Years | 7 | 13.7% |
| 55 to 64 Years | 24 | 47.1% |
| 65 to 74 Years | 6 | 11.8% |
| 75 to 84 Years | 0 | 0.0% |
| 85 Years and Over | 0 | 0.0% |
| Total | 51 | 100.0% |
Housing Finances in Olney
Median Income by Occupancy in Olney
| Occupancy Type | # Households | Median Income |
| Owner-Occupied | 29 (56.9%) | $0 |
| Renter-Occupied | 22 (43.1%) | $0 |
| Average | 51 (100.0%) | $0 |
Occupancy by Householder Income Bracket in Olney
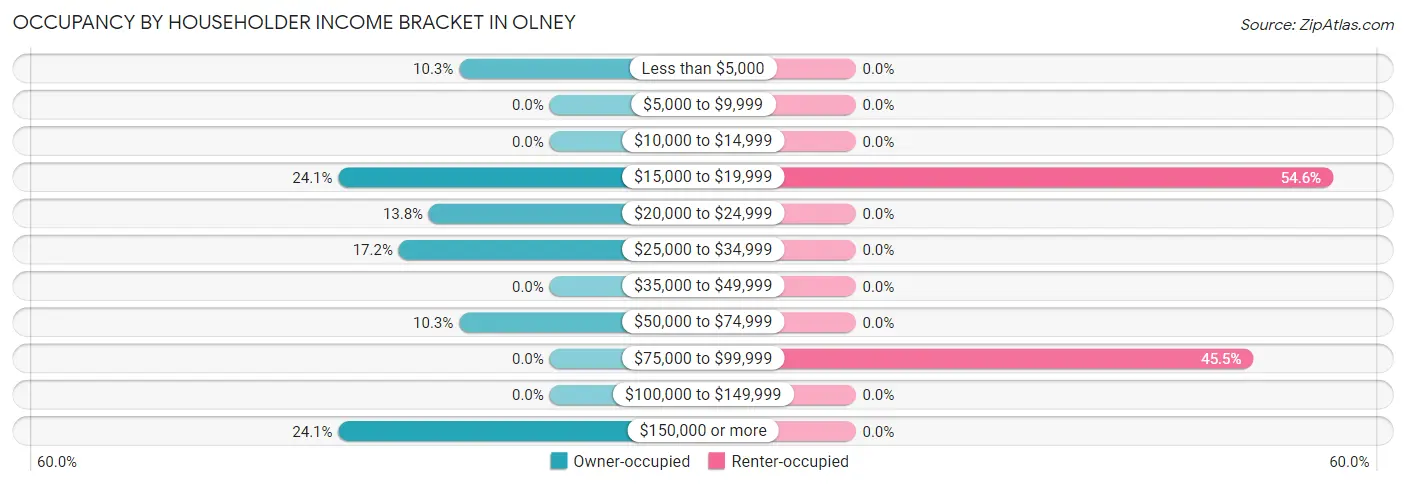
| Income Bracket | Owner-occupied | Renter-occupied |
| Less than $5,000 | 3 (10.3%) | 0 (0.0%) |
| $5,000 to $9,999 | 0 (0.0%) | 0 (0.0%) |
| $10,000 to $14,999 | 0 (0.0%) | 0 (0.0%) |
| $15,000 to $19,999 | 7 (24.1%) | 12 (54.5%) |
| $20,000 to $24,999 | 4 (13.8%) | 0 (0.0%) |
| $25,000 to $34,999 | 5 (17.2%) | 0 (0.0%) |
| $35,000 to $49,999 | 0 (0.0%) | 0 (0.0%) |
| $50,000 to $74,999 | 3 (10.3%) | 0 (0.0%) |
| $75,000 to $99,999 | 0 (0.0%) | 10 (45.5%) |
| $100,000 to $149,999 | 0 (0.0%) | 0 (0.0%) |
| $150,000 or more | 7 (24.1%) | 0 (0.0%) |
| Total | 29 (100.0%) | 22 (100.0%) |
Monthly Housing Cost Tiers in Olney
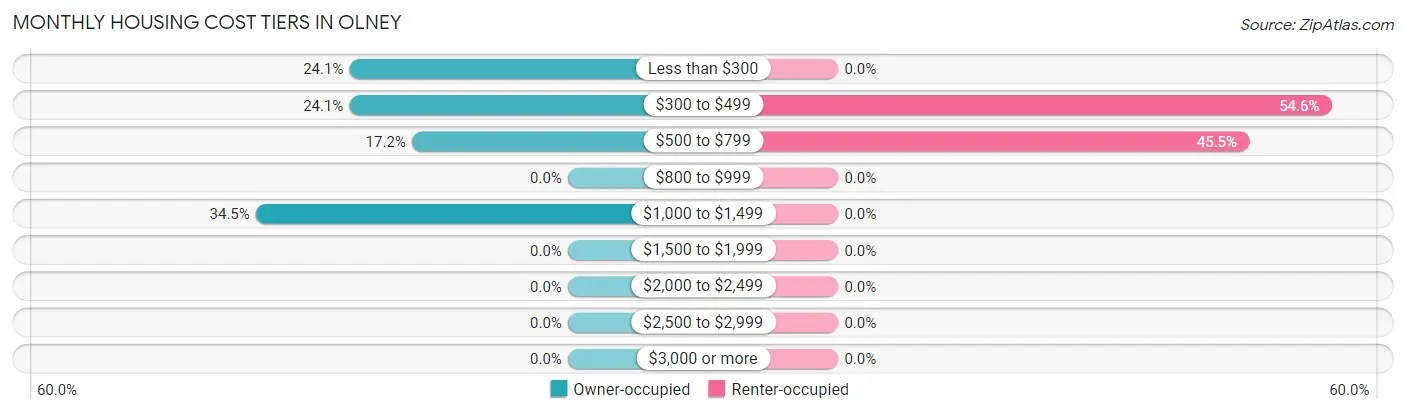
| Monthly Cost | Owner-occupied | Renter-occupied |
| Less than $300 | 7 (24.1%) | 0 (0.0%) |
| $300 to $499 | 7 (24.1%) | 12 (54.5%) |
| $500 to $799 | 5 (17.2%) | 10 (45.5%) |
| $800 to $999 | 0 (0.0%) | 0 (0.0%) |
| $1,000 to $1,499 | 10 (34.5%) | 0 (0.0%) |
| $1,500 to $1,999 | 0 (0.0%) | 0 (0.0%) |
| $2,000 to $2,499 | 0 (0.0%) | 0 (0.0%) |
| $2,500 to $2,999 | 0 (0.0%) | 0 (0.0%) |
| $3,000 or more | 0 (0.0%) | 0 (0.0%) |
| Total | 29 (100.0%) | 22 (100.0%) |
Physical Housing Characteristics in Olney
Housing Structures in Olney
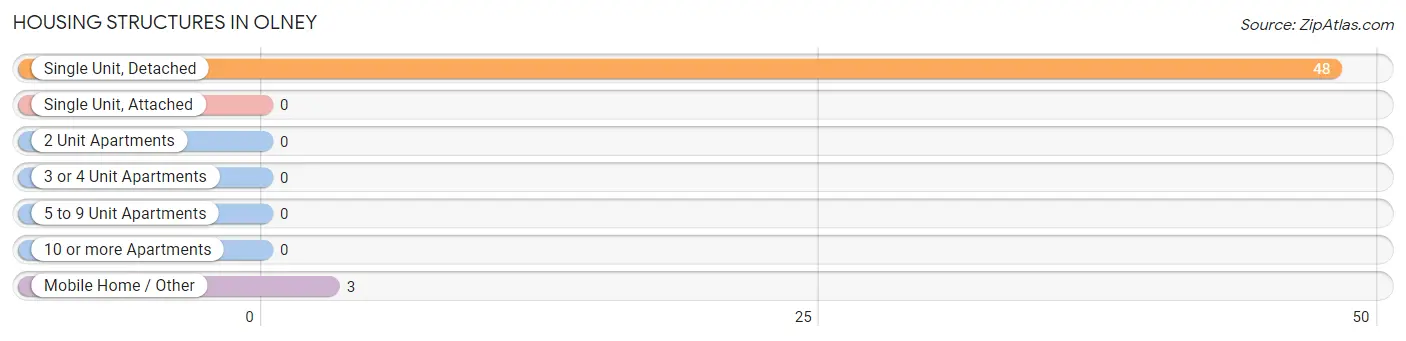
| Structure Type | # Housing Units | % Housing Units |
| Single Unit, Detached | 48 | 94.1% |
| Single Unit, Attached | 0 | 0.0% |
| 2 Unit Apartments | 0 | 0.0% |
| 3 or 4 Unit Apartments | 0 | 0.0% |
| 5 to 9 Unit Apartments | 0 | 0.0% |
| 10 or more Apartments | 0 | 0.0% |
| Mobile Home / Other | 3 | 5.9% |
| Total | 51 | 100.0% |
Housing Structures by Occupancy in Olney
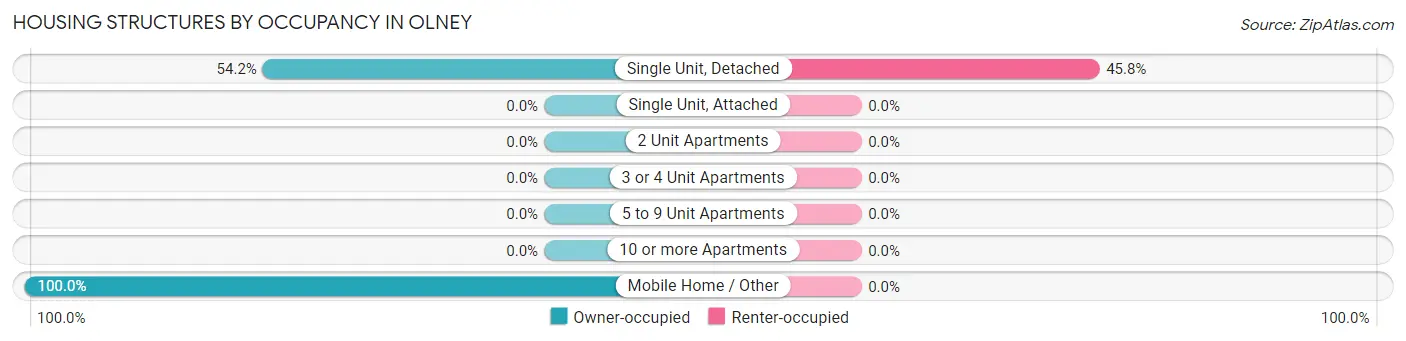
| Structure Type | Owner-occupied | Renter-occupied |
| Single Unit, Detached | 26 (54.2%) | 22 (45.8%) |
| Single Unit, Attached | 0 (0.0%) | 0 (0.0%) |
| 2 Unit Apartments | 0 (0.0%) | 0 (0.0%) |
| 3 or 4 Unit Apartments | 0 (0.0%) | 0 (0.0%) |
| 5 to 9 Unit Apartments | 0 (0.0%) | 0 (0.0%) |
| 10 or more Apartments | 0 (0.0%) | 0 (0.0%) |
| Mobile Home / Other | 3 (100.0%) | 0 (0.0%) |
| Total | 29 (56.9%) | 22 (43.1%) |
Housing Structures by Number of Rooms in Olney
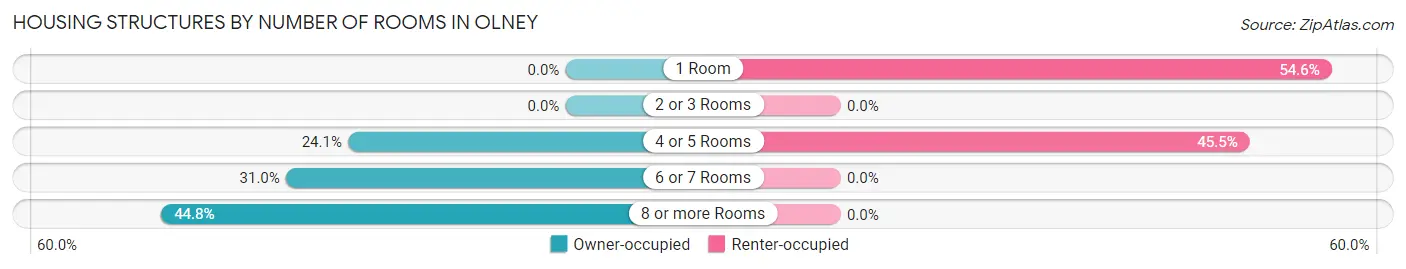
| Number of Rooms | Owner-occupied | Renter-occupied |
| 1 Room | 0 (0.0%) | 12 (54.5%) |
| 2 or 3 Rooms | 0 (0.0%) | 0 (0.0%) |
| 4 or 5 Rooms | 7 (24.1%) | 10 (45.5%) |
| 6 or 7 Rooms | 9 (31.0%) | 0 (0.0%) |
| 8 or more Rooms | 13 (44.8%) | 0 (0.0%) |
| Total | 29 (100.0%) | 22 (100.0%) |
Housing Structure by Heating Type in Olney
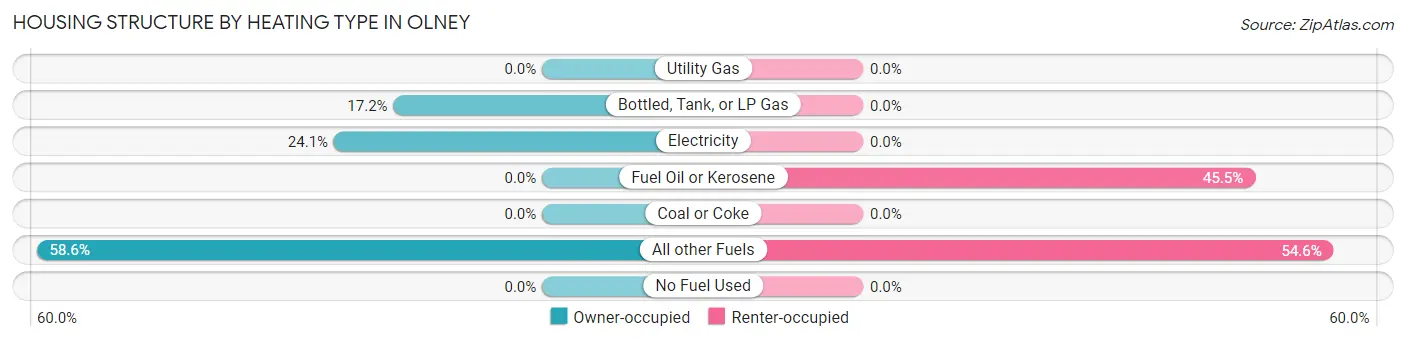
| Heating Type | Owner-occupied | Renter-occupied |
| Utility Gas | 0 (0.0%) | 0 (0.0%) |
| Bottled, Tank, or LP Gas | 5 (17.2%) | 0 (0.0%) |
| Electricity | 7 (24.1%) | 0 (0.0%) |
| Fuel Oil or Kerosene | 0 (0.0%) | 10 (45.5%) |
| Coal or Coke | 0 (0.0%) | 0 (0.0%) |
| All other Fuels | 17 (58.6%) | 12 (54.5%) |
| No Fuel Used | 0 (0.0%) | 0 (0.0%) |
| Total | 29 (100.0%) | 22 (100.0%) |
Household Vehicle Usage in Olney
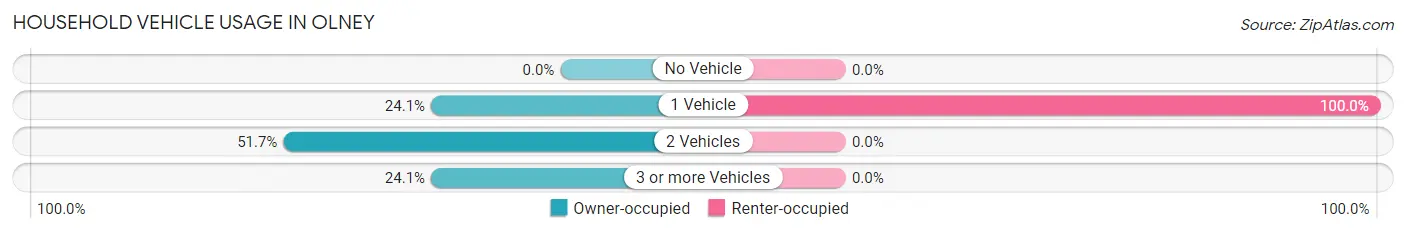
| Vehicles per Household | Owner-occupied | Renter-occupied |
| No Vehicle | 0 (0.0%) | 0 (0.0%) |
| 1 Vehicle | 7 (24.1%) | 22 (100.0%) |
| 2 Vehicles | 15 (51.7%) | 0 (0.0%) |
| 3 or more Vehicles | 7 (24.1%) | 0 (0.0%) |
| Total | 29 (100.0%) | 22 (100.0%) |
Real Estate & Mortgages in Olney
Real Estate and Mortgage Overview in Olney
| Characteristic | Without Mortgage | With Mortgage |
| Housing Units | 19 | 10 |
| Median Property Value | - | - |
| Median Household Income | $24,063 | $7 |
| Monthly Housing Costs | $392 | $0 |
| Real Estate Taxes | - | - |
Property Value by Mortgage Status in Olney
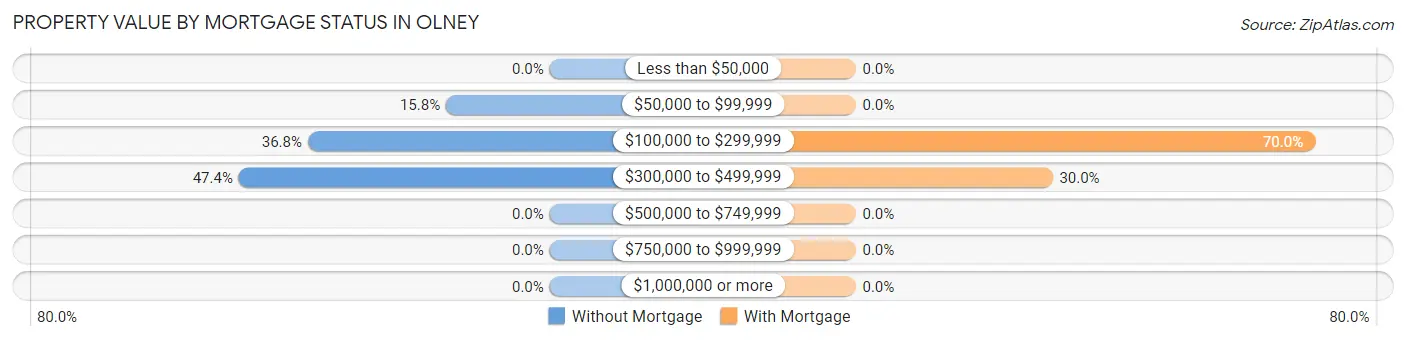
| Property Value | Without Mortgage | With Mortgage |
| Less than $50,000 | 0 (0.0%) | 0 (0.0%) |
| $50,000 to $99,999 | 3 (15.8%) | 0 (0.0%) |
| $100,000 to $299,999 | 7 (36.8%) | 7 (70.0%) |
| $300,000 to $499,999 | 9 (47.4%) | 3 (30.0%) |
| $500,000 to $749,999 | 0 (0.0%) | 0 (0.0%) |
| $750,000 to $999,999 | 0 (0.0%) | 0 (0.0%) |
| $1,000,000 or more | 0 (0.0%) | 0 (0.0%) |
| Total | 19 (100.0%) | 10 (100.0%) |
Household Income by Mortgage Status in Olney
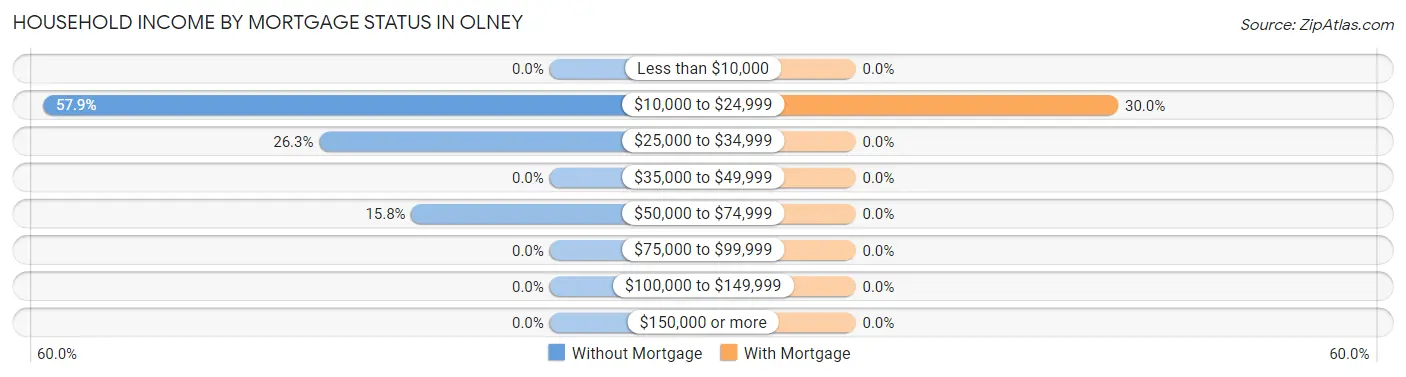
| Household Income | Without Mortgage | With Mortgage |
| Less than $10,000 | 0 (0.0%) | 0 (0.0%) |
| $10,000 to $24,999 | 11 (57.9%) | 3 (30.0%) |
| $25,000 to $34,999 | 5 (26.3%) | 0 (0.0%) |
| $35,000 to $49,999 | 0 (0.0%) | 0 (0.0%) |
| $50,000 to $74,999 | 3 (15.8%) | 0 (0.0%) |
| $75,000 to $99,999 | 0 (0.0%) | 0 (0.0%) |
| $100,000 to $149,999 | 0 (0.0%) | 0 (0.0%) |
| $150,000 or more | 0 (0.0%) | 0 (0.0%) |
| Total | 19 (100.0%) | 10 (100.0%) |
Property Value to Household Income Ratio in Olney
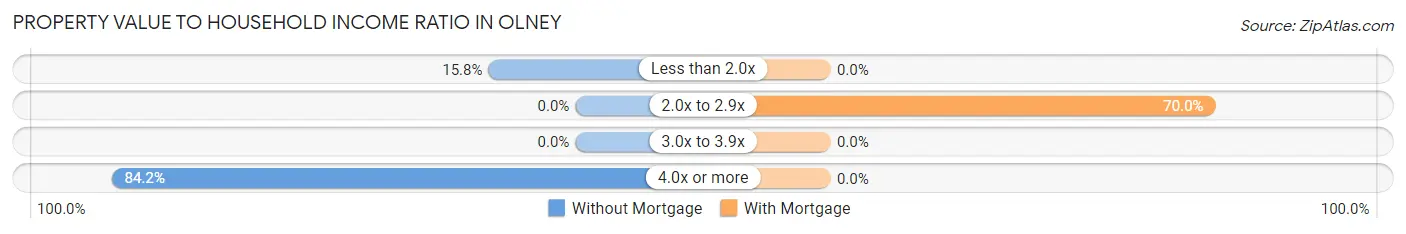
| Value-to-Income Ratio | Without Mortgage | With Mortgage |
| Less than 2.0x | 3 (15.8%) | 0 (0.0%) |
| 2.0x to 2.9x | 0 (0.0%) | 7 (70.0%) |
| 3.0x to 3.9x | 0 (0.0%) | 0 (0.0%) |
| 4.0x or more | 16 (84.2%) | 0 (0.0%) |
| Total | 19 (100.0%) | 10 (100.0%) |
Real Estate Taxes by Mortgage Status in Olney
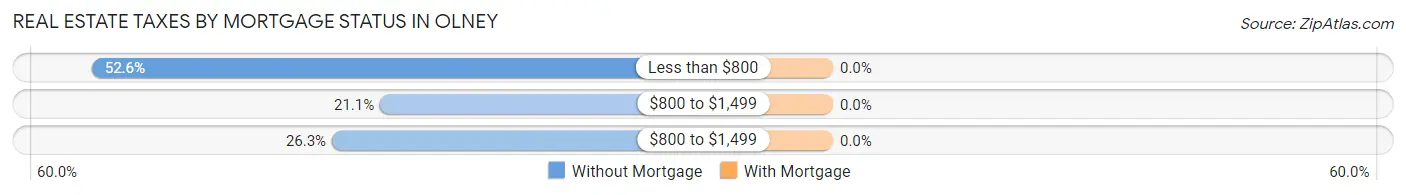
| Property Taxes | Without Mortgage | With Mortgage |
| Less than $800 | 10 (52.6%) | 0 (0.0%) |
| $800 to $1,499 | 4 (21.0%) | 0 (0.0%) |
| $800 to $1,499 | 5 (26.3%) | 0 (0.0%) |
| Total | 19 (100.0%) | 10 (100.0%) |
Health & Disability in Olney
Health Insurance Coverage by Age in Olney
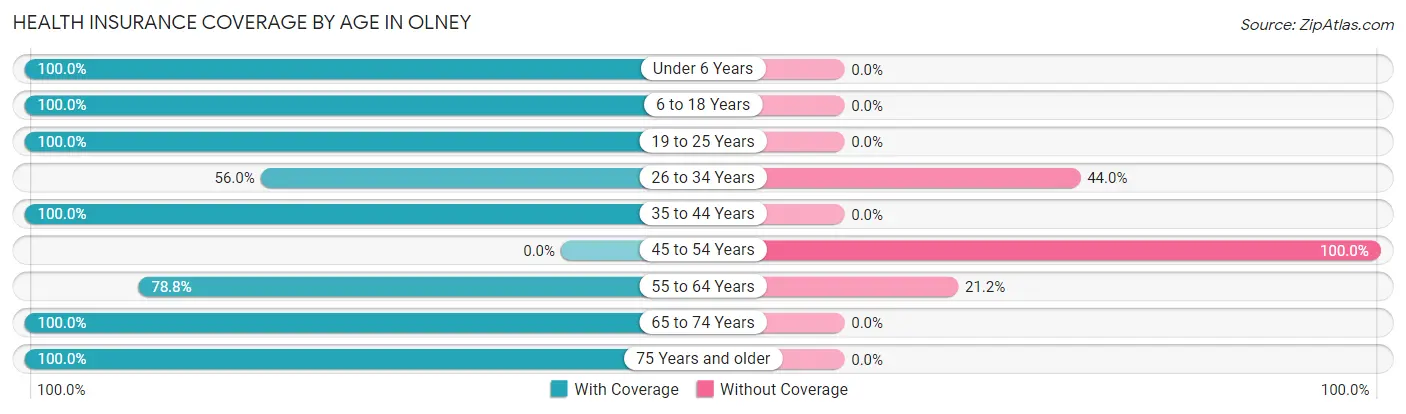
| Age Bracket | With Coverage | Without Coverage |
| Under 6 Years | 8 (100.0%) | 0 (0.0%) |
| 6 to 18 Years | 4 (100.0%) | 0 (0.0%) |
| 19 to 25 Years | 18 (100.0%) | 0 (0.0%) |
| 26 to 34 Years | 14 (56.0%) | 11 (44.0%) |
| 35 to 44 Years | 11 (100.0%) | 0 (0.0%) |
| 45 to 54 Years | 0 (0.0%) | 7 (100.0%) |
| 55 to 64 Years | 26 (78.8%) | 7 (21.2%) |
| 65 to 74 Years | 16 (100.0%) | 0 (0.0%) |
| 75 Years and older | 10 (100.0%) | 0 (0.0%) |
| Total | 107 (81.1%) | 25 (18.9%) |
Health Insurance Coverage by Citizenship Status in Olney
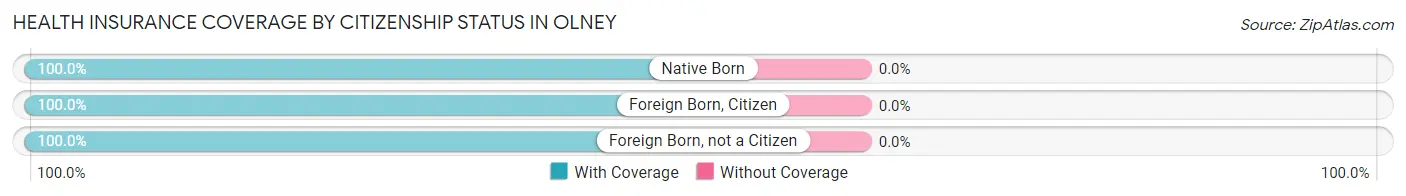
| Citizenship Status | With Coverage | Without Coverage |
| Native Born | 8 (100.0%) | 0 (0.0%) |
| Foreign Born, Citizen | 4 (100.0%) | 0 (0.0%) |
| Foreign Born, not a Citizen | 18 (100.0%) | 0 (0.0%) |
Health Insurance Coverage by Household Income in Olney
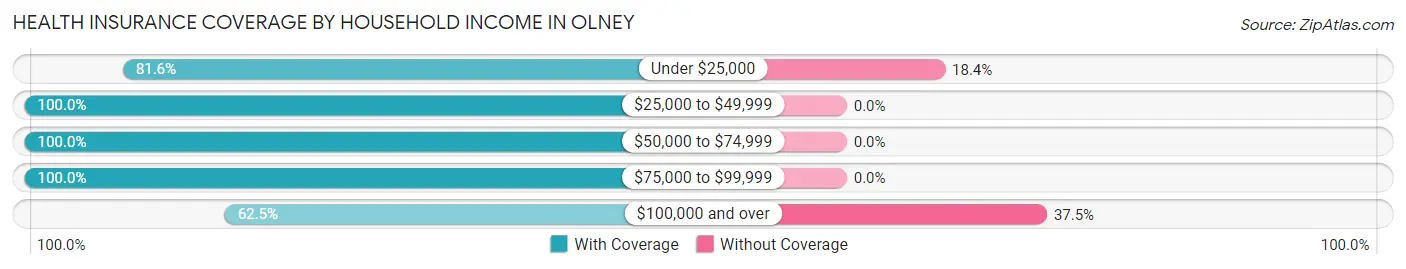
| Household Income | With Coverage | Without Coverage |
| Under $25,000 | 31 (81.6%) | 7 (18.4%) |
| $25,000 to $49,999 | 11 (100.0%) | 0 (0.0%) |
| $50,000 to $74,999 | 14 (100.0%) | 0 (0.0%) |
| $75,000 to $99,999 | 21 (100.0%) | 0 (0.0%) |
| $100,000 and over | 30 (62.5%) | 18 (37.5%) |
Public vs Private Health Insurance Coverage by Age in Olney
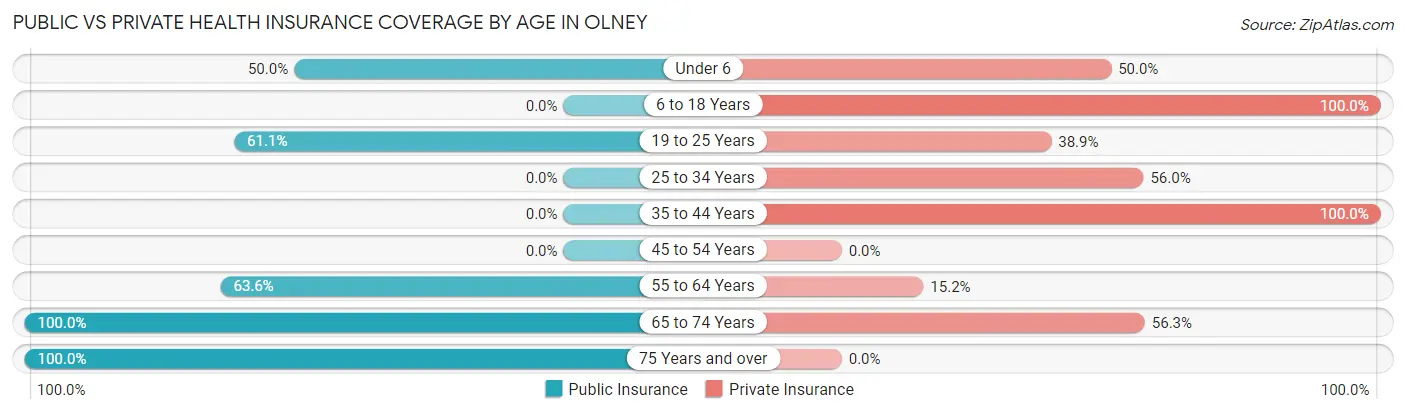
| Age Bracket | Public Insurance | Private Insurance |
| Under 6 | 4 (50.0%) | 4 (50.0%) |
| 6 to 18 Years | 0 (0.0%) | 4 (100.0%) |
| 19 to 25 Years | 11 (61.1%) | 7 (38.9%) |
| 25 to 34 Years | 0 (0.0%) | 14 (56.0%) |
| 35 to 44 Years | 0 (0.0%) | 11 (100.0%) |
| 45 to 54 Years | 0 (0.0%) | 0 (0.0%) |
| 55 to 64 Years | 21 (63.6%) | 5 (15.1%) |
| 65 to 74 Years | 16 (100.0%) | 9 (56.2%) |
| 75 Years and over | 10 (100.0%) | 0 (0.0%) |
| Total | 62 (47.0%) | 54 (40.9%) |
Disability Status by Sex by Age in Olney
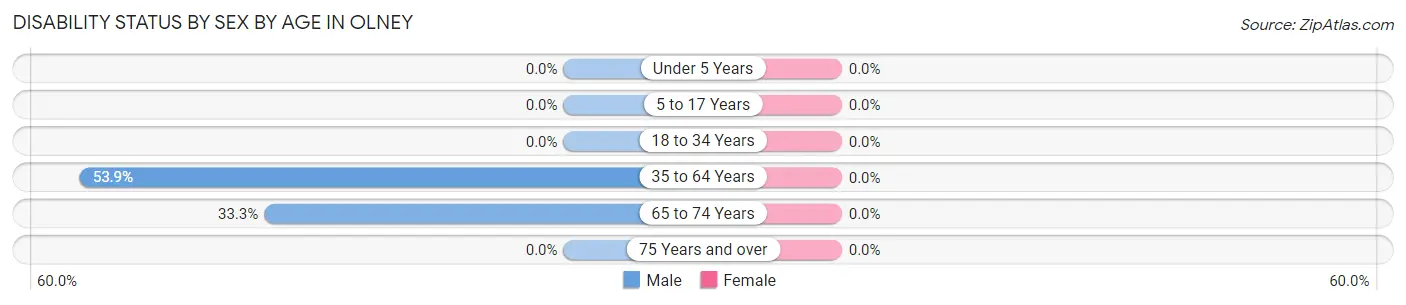
| Age Bracket | Male | Female |
| Under 5 Years | 0 (0.0%) | 0 (0.0%) |
| 5 to 17 Years | 0 (0.0%) | 0 (0.0%) |
| 18 to 34 Years | 0 (0.0%) | 0 (0.0%) |
| 35 to 64 Years | 21 (53.8%) | 0 (0.0%) |
| 65 to 74 Years | 3 (33.3%) | 0 (0.0%) |
| 75 Years and over | 0 (0.0%) | 0 (0.0%) |
Disability Class by Sex by Age in Olney
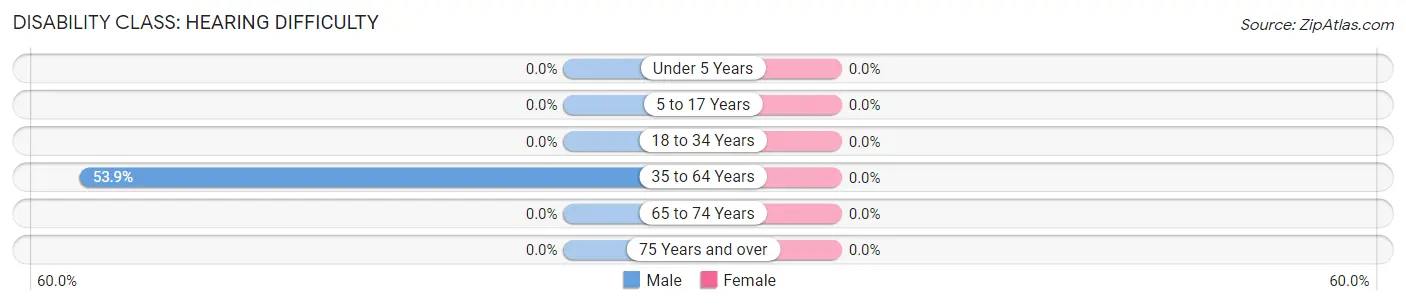
Disability Class: Hearing Difficulty
| Age Bracket | Male | Female |
| Under 5 Years | 0 (0.0%) | 0 (0.0%) |
| 5 to 17 Years | 0 (0.0%) | 0 (0.0%) |
| 18 to 34 Years | 0 (0.0%) | 0 (0.0%) |
| 35 to 64 Years | 21 (53.8%) | 0 (0.0%) |
| 65 to 74 Years | 0 (0.0%) | 0 (0.0%) |
| 75 Years and over | 0 (0.0%) | 0 (0.0%) |
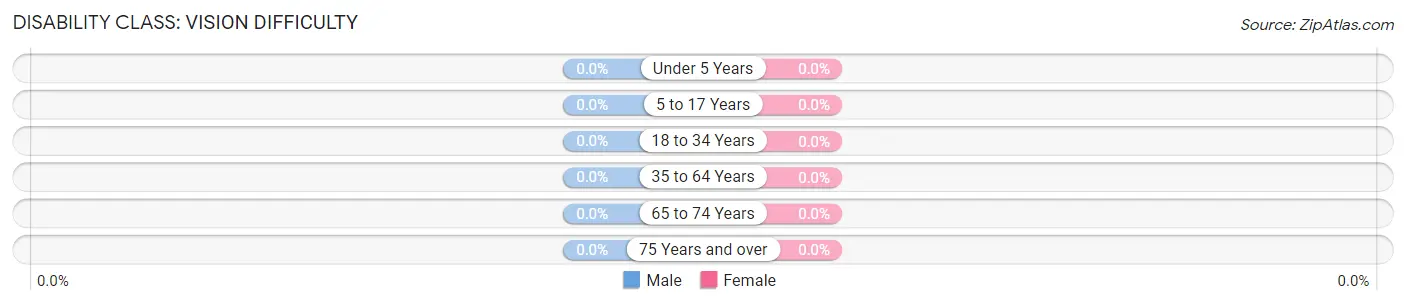
Disability Class: Vision Difficulty
| Age Bracket | Male | Female |
| Under 5 Years | 0 (0.0%) | 0 (0.0%) |
| 5 to 17 Years | 0 (0.0%) | 0 (0.0%) |
| 18 to 34 Years | 0 (0.0%) | 0 (0.0%) |
| 35 to 64 Years | 0 (0.0%) | 0 (0.0%) |
| 65 to 74 Years | 0 (0.0%) | 0 (0.0%) |
| 75 Years and over | 0 (0.0%) | 0 (0.0%) |
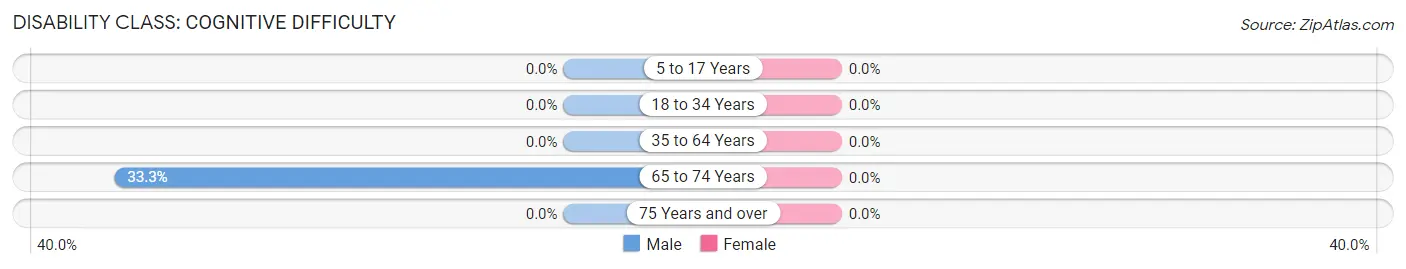
Disability Class: Cognitive Difficulty
| Age Bracket | Male | Female |
| 5 to 17 Years | 0 (0.0%) | 0 (0.0%) |
| 18 to 34 Years | 0 (0.0%) | 0 (0.0%) |
| 35 to 64 Years | 0 (0.0%) | 0 (0.0%) |
| 65 to 74 Years | 3 (33.3%) | 0 (0.0%) |
| 75 Years and over | 0 (0.0%) | 0 (0.0%) |
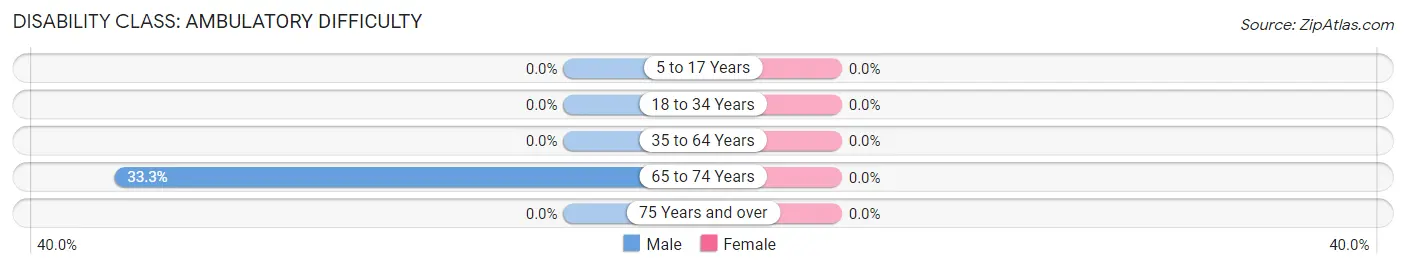
Disability Class: Ambulatory Difficulty
| Age Bracket | Male | Female |
| 5 to 17 Years | 0 (0.0%) | 0 (0.0%) |
| 18 to 34 Years | 0 (0.0%) | 0 (0.0%) |
| 35 to 64 Years | 0 (0.0%) | 0 (0.0%) |
| 65 to 74 Years | 3 (33.3%) | 0 (0.0%) |
| 75 Years and over | 0 (0.0%) | 0 (0.0%) |
Disability Class: Self-Care Difficulty
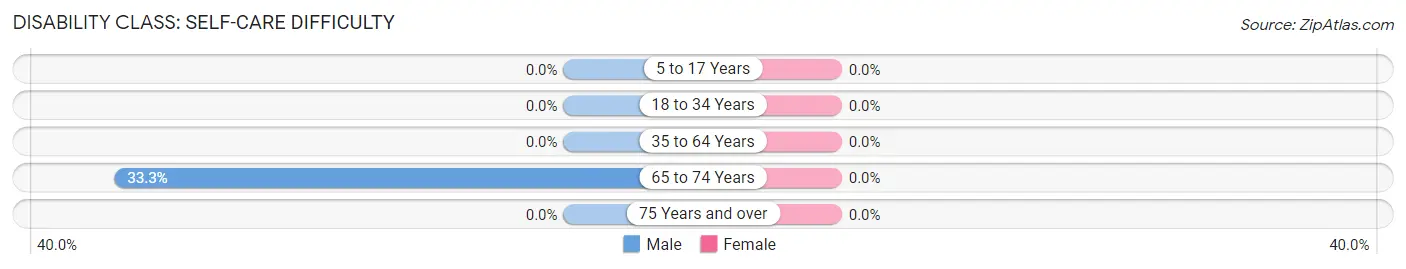
| Age Bracket | Male | Female |
| 5 to 17 Years | 0 (0.0%) | 0 (0.0%) |
| 18 to 34 Years | 0 (0.0%) | 0 (0.0%) |
| 35 to 64 Years | 0 (0.0%) | 0 (0.0%) |
| 65 to 74 Years | 3 (33.3%) | 0 (0.0%) |
| 75 Years and over | 0 (0.0%) | 0 (0.0%) |
Technology Access in Olney
Computing Device Access in Olney
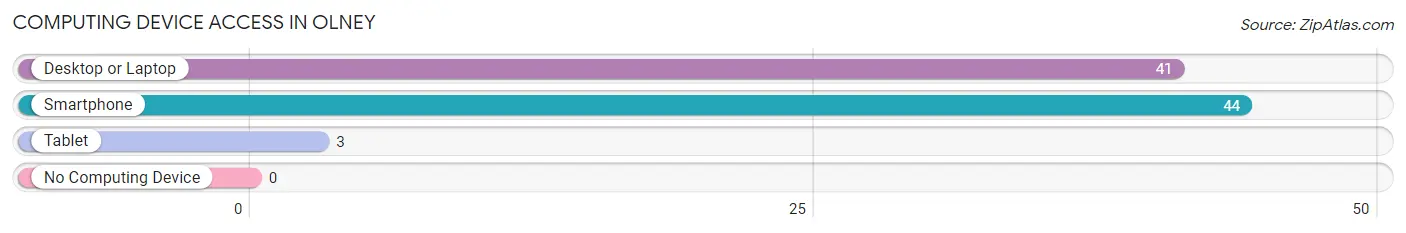
| Device Type | # Households | % Households |
| Desktop or Laptop | 41 | 80.4% |
| Smartphone | 44 | 86.3% |
| Tablet | 3 | 5.9% |
| No Computing Device | 0 | 0.0% |
| Total | 51 | 100.0% |
Internet Access in Olney
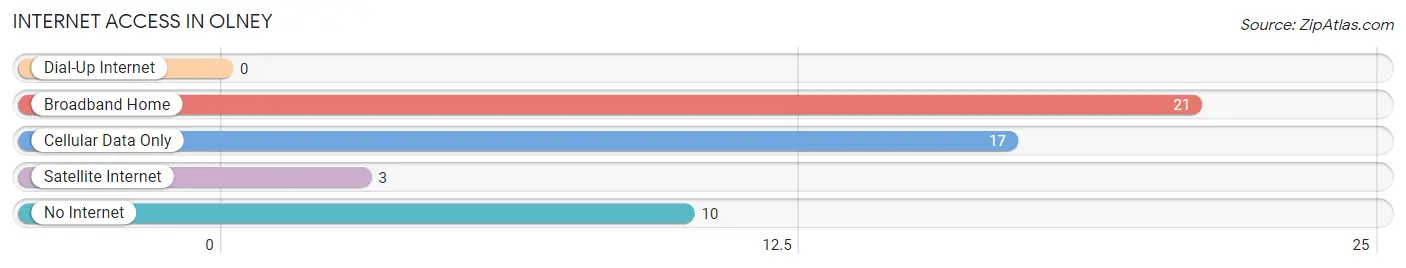
| Internet Type | # Households | % Households |
| Dial-Up Internet | 0 | 0.0% |
| Broadband Home | 21 | 41.2% |
| Cellular Data Only | 17 | 33.3% |
| Satellite Internet | 3 | 5.9% |
| No Internet | 10 | 19.6% |
| Total | 51 | 100.0% |
Olney Summary
Olney, Montana is a small town located in the southeastern corner of the state, near the border with Wyoming. It is situated in the foothills of the Beartooth Mountains, and is surrounded by rolling hills and grasslands. The town has a population of just over 500 people, and is the county seat of Carbon County.
History
The area around Olney was first settled in the late 1800s by ranchers and homesteaders. The town was officially founded in 1887, when the Northern Pacific Railroad built a station there. The town was named after the nearby Olney Creek, which was named after a local rancher, William Olney.
In the early 1900s, Olney was a bustling town, with a variety of businesses, including a hotel, a bank, a newspaper, and several stores. The town also had a school, a post office, and a jail.
In the 1920s, the town began to decline, as the railroad stopped running through Olney. The Great Depression further hurt the town, and by the 1940s, the population had dropped to just over 200 people.
In the 1950s, the town began to revive, as the nearby coal mines began to open. The town also benefited from the construction of the nearby Yellowtail Dam, which provided irrigation for the surrounding area.
Geography
Olney is located in the southeastern corner of Montana, near the border with Wyoming. It is situated in the foothills of the Beartooth Mountains, and is surrounded by rolling hills and grasslands. The town is located at an elevation of 4,400 feet, and has a total area of 0.7 square miles.
The climate in Olney is semi-arid, with hot summers and cold winters. The average annual temperature is 45 degrees Fahrenheit, and the average annual precipitation is 12 inches.
Economy
The economy of Olney is largely based on agriculture and tourism. The town is home to several farms, which produce hay, wheat, and other crops. The nearby coal mines also provide employment for many of the town’s residents.
Tourism is also an important part of the local economy. The town is home to several attractions, including the Beartooth Mountains, the Yellowtail Dam, and the nearby Yellowstone National Park.
Demographics
As of the 2010 census, the population of Olney was 514 people. The racial makeup of the town was 97.3% White, 0.6% Native American, 0.2% Asian, 0.2% from other races, and 1.7% from two or more races.
The median household income in Olney was $37,500, and the median family income was $41,250. The per capita income was $17,500. About 11.3% of the population was below the poverty line.
Conclusion
Olney, Montana is a small town located in the southeastern corner of the state, near the border with Wyoming. It is situated in the foothills of the Beartooth Mountains, and is surrounded by rolling hills and grasslands. The town has a population of just over 500 people, and is the county seat of Carbon County. The economy of Olney is largely based on agriculture and tourism, and the town is home to several attractions, including the Beartooth Mountains, the Yellowtail Dam, and the nearby Yellowstone National Park.
Common Questions
What is the Total Population of Olney?
Total Population of Olney is 132.
What is the Total Male Population of Olney?
Total Male Population of Olney is 85.
What is the Total Female Population of Olney?
Total Female Population of Olney is 47.
What is the Ratio of Males per 100 Females in Olney?
There are 180.85 Males per 100 Females in Olney.
What is the Ratio of Females per 100 Males in Olney?
There are 55.29 Females per 100 Males in Olney.
What is the Median Population Age in Olney?
Median Population Age in Olney is 46.5 Years.
What is the Average Family Size in Olney
Average Family Size in Olney is 4.7 People.
What is the Average Household Size in Olney
Average Household Size in Olney is 2.6 People.
What is Per Capita Income in Olney?
Per Capita income in Olney is $29,094.
What is Income or Wage Gap in Olney?
Income or Wage Gap in Olney is 28.0%.
Women in Olney earn 72.0 cents for every dollar earned by a man.
What is Inequality or Gini Index in Olney?
Inequality or Gini Index in Olney is 0.52.
How Large is the Labor Force in Olney?
There are 70 People in the Labor Forcein in Olney.
What is the Percentage of People in the Labor Force in Olney?
58.3% of People are in the Labor Force in Olney.