Zip Codes with the Highest Percentage of Population Employed in Sales & Related in Butte, MT
RELATED REPORTS & OPTIONS
Sales & Related
Butte
Compare Zip Codes
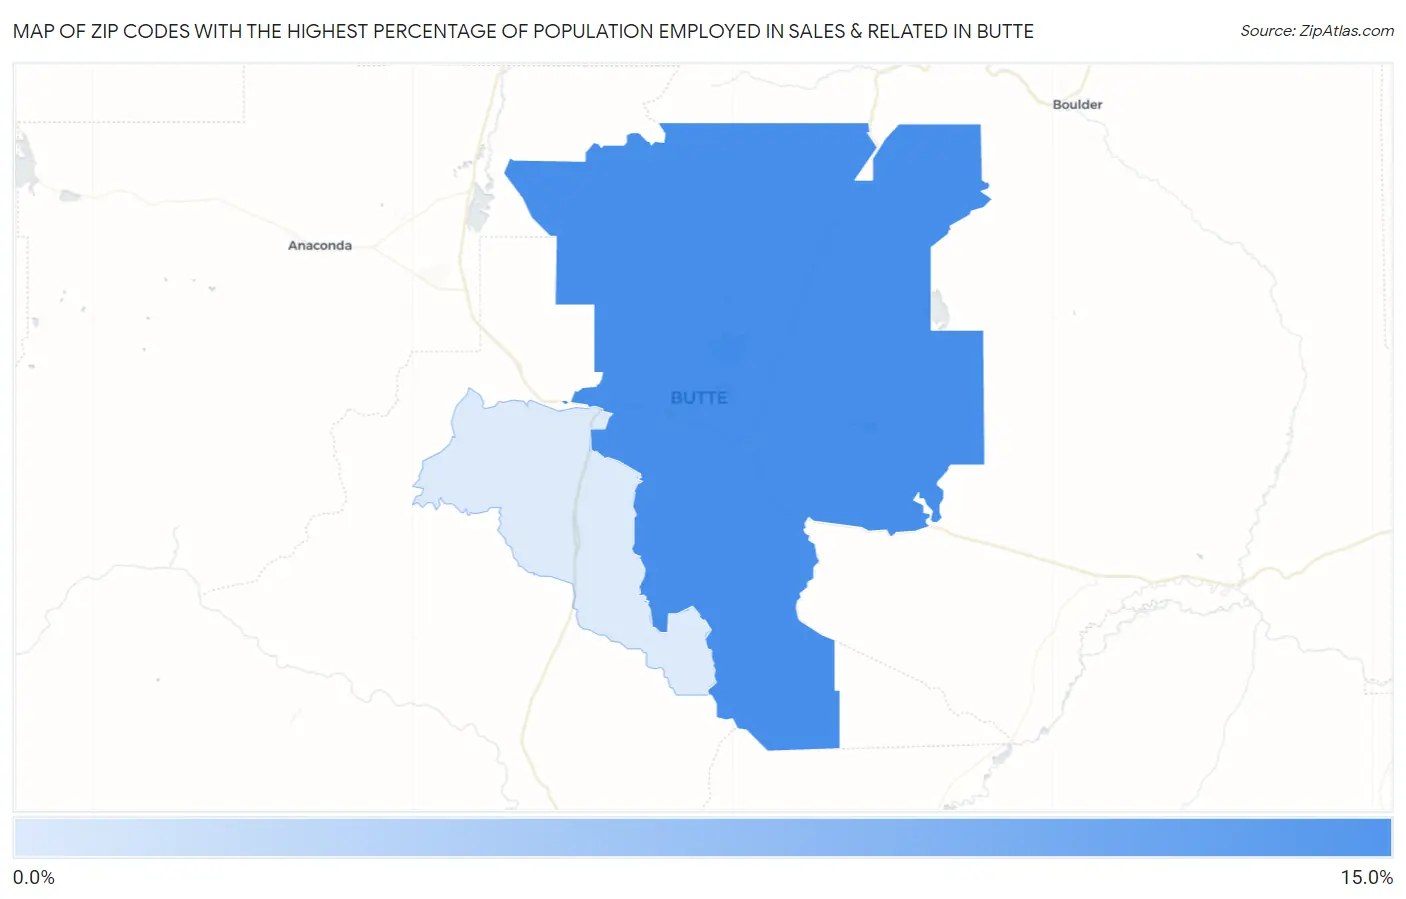
Map of Zip Codes with the Highest Percentage of Population Employed in Sales & Related in Butte
0.0%
15.0%
Zip Codes with the Highest Percentage of Population Employed in Sales & Related in Butte, MT
| Zip Code | % Employed | vs State | vs National | |
| 1. | 59701 | 10.8% | 9.6%(+1.18)#72 | 9.6%(+1.16)#8,832 |
| 2. | 59750 | 2.0% | 9.6%(-7.54)#264 | 9.6%(-7.56)#28,945 |
1
Common Questions
What are the Top Zip Codes with the Highest Percentage of Population Employed in Sales & Related in Butte, MT?
Top Zip Codes with the Highest Percentage of Population Employed in Sales & Related in Butte, MT are:
What zip code has the Highest Percentage of Population Employed in Sales & Related in Butte, MT?
59701 has the Highest Percentage of Population Employed in Sales & Related in Butte, MT with 10.8%.
What is the Percentage of Population Employed in Sales & Related in Montana?
Percentage of Population Employed in Sales & Related in Montana is 9.6%.
What is the Percentage of Population Employed in Sales & Related in the United States?
Percentage of Population Employed in Sales & Related in the United States is 9.6%.