Zip Codes with the Highest Percentage of Black / African American Population in Michigan
RELATED REPORTS & OPTIONS
Black / African American
Michigan
Compare Zip Codes
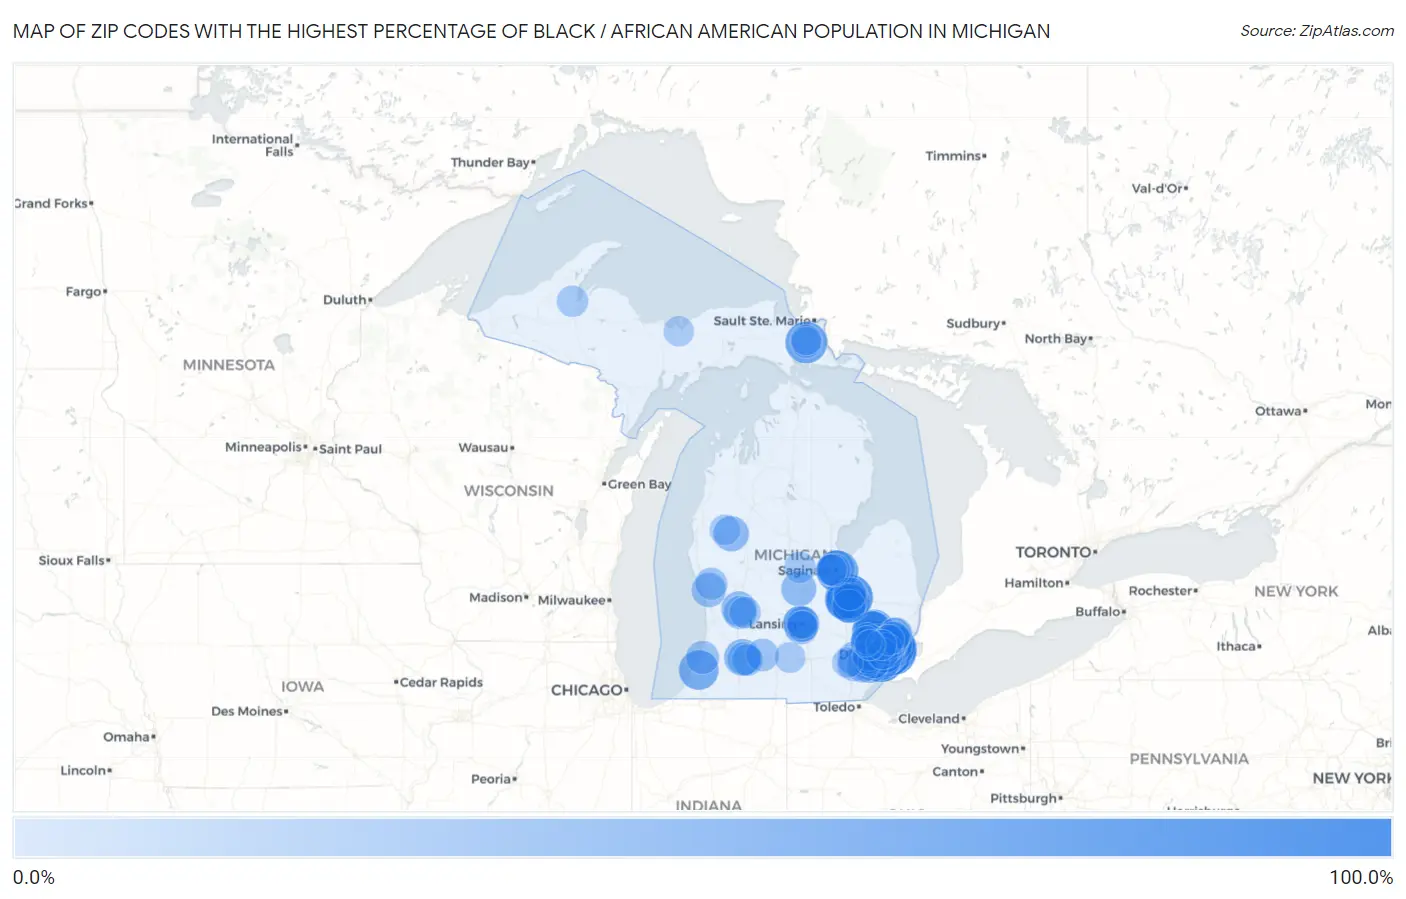
Map of Zip Codes with the Highest Percentage of Black / African American Population in Michigan
0.0%
100.0%
Zip Codes with the Highest Percentage of Black / African American Population in Michigan
| Zip Code | Black / African American | vs State | vs National | |
| 1. | 48227 | 95.7% | 13.6%(+82.2)#1 | 12.5%(+83.2)#73 |
| 2. | 48234 | 95.3% | 13.6%(+81.7)#2 | 12.5%(+82.8)#76 |
| 3. | 48213 | 94.9% | 13.6%(+81.3)#3 | 12.5%(+82.4)#79 |
| 4. | 48235 | 94.5% | 13.6%(+80.9)#4 | 12.5%(+82.0)#83 |
| 5. | 48205 | 94.5% | 13.6%(+80.9)#5 | 12.5%(+82.0)#84 |
| 6. | 48238 | 93.2% | 13.6%(+79.6)#6 | 12.5%(+80.7)#103 |
| 7. | 48215 | 89.1% | 13.6%(+75.6)#7 | 12.5%(+76.7)#161 |
| 8. | 48224 | 89.1% | 13.6%(+75.5)#8 | 12.5%(+76.6)#165 |
| 9. | 48204 | 88.6% | 13.6%(+75.0)#9 | 12.5%(+76.1)#175 |
| 10. | 48219 | 88.4% | 13.6%(+74.9)#10 | 12.5%(+76.0)#178 |
| 11. | 48223 | 87.9% | 13.6%(+74.4)#11 | 12.5%(+75.4)#185 |
| 12. | 48203 | 86.8% | 13.6%(+73.2)#12 | 12.5%(+74.3)#208 |
| 13. | 48221 | 86.7% | 13.6%(+73.1)#13 | 12.5%(+74.2)#210 |
| 14. | 48206 | 85.2% | 13.6%(+71.6)#14 | 12.5%(+72.7)#237 |
| 15. | 48217 | 83.2% | 13.6%(+69.7)#15 | 12.5%(+70.8)#261 |
| 16. | 48214 | 80.2% | 13.6%(+66.6)#16 | 12.5%(+67.7)#319 |
| 17. | 48505 | 79.2% | 13.6%(+65.7)#17 | 12.5%(+66.8)#343 |
| 18. | 48207 | 76.2% | 13.6%(+62.6)#18 | 12.5%(+63.7)#405 |
| 19. | 48141 | 74.7% | 13.6%(+61.2)#19 | 12.5%(+62.2)#434 |
| 20. | 48228 | 74.4% | 13.6%(+60.8)#20 | 12.5%(+61.9)#443 |
| 21. | 48033 | 68.8% | 13.6%(+55.3)#21 | 12.5%(+56.4)#573 |
| 22. | 48034 | 68.8% | 13.6%(+55.2)#22 | 12.5%(+56.3)#575 |
| 23. | 48208 | 67.9% | 13.6%(+54.3)#23 | 12.5%(+55.4)#602 |
| 24. | 48075 | 67.6% | 13.6%(+54.0)#24 | 12.5%(+55.1)#610 |
| 25. | 48504 | 65.2% | 13.6%(+51.7)#25 | 12.5%(+52.7)#676 |
| 26. | 48225 | 65.1% | 13.6%(+51.6)#26 | 12.5%(+52.7)#678 |
| 27. | 49784 | 62.4% | 13.6%(+48.8)#27 | 12.5%(+49.9)#774 |
| 28. | 48202 | 62.3% | 13.6%(+48.8)#28 | 12.5%(+49.9)#776 |
| 29. | 48201 | 62.3% | 13.6%(+48.8)#29 | 12.5%(+49.9)#777 |
| 30. | 48601 | 62.0% | 13.6%(+48.4)#30 | 12.5%(+49.5)#795 |
| 31. | 48342 | 60.2% | 13.6%(+46.6)#31 | 12.5%(+47.7)#862 |
| 32. | 48076 | 58.5% | 13.6%(+44.9)#32 | 12.5%(+46.0)#921 |
| 33. | 48341 | 58.1% | 13.6%(+44.5)#33 | 12.5%(+45.6)#930 |
| 34. | 48239 | 57.3% | 13.6%(+43.7)#34 | 12.5%(+44.8)#956 |
| 35. | 48503 | 55.6% | 13.6%(+42.0)#35 | 12.5%(+43.1)#1,021 |
| 36. | 49022 | 53.3% | 13.6%(+39.8)#36 | 12.5%(+40.9)#1,103 |
| 37. | 48237 | 53.3% | 13.6%(+39.7)#37 | 12.5%(+40.8)#1,107 |
| 38. | 48021 | 53.1% | 13.6%(+39.6)#38 | 12.5%(+40.6)#1,111 |
| 39. | 48218 | 46.2% | 13.6%(+32.7)#39 | 12.5%(+33.8)#1,438 |
| 40. | 48226 | 44.7% | 13.6%(+31.2)#40 | 12.5%(+32.2)#1,536 |
| 41. | 48229 | 43.7% | 13.6%(+30.1)#41 | 12.5%(+31.2)#1,591 |
| 42. | 48240 | 43.4% | 13.6%(+29.8)#42 | 12.5%(+30.9)#1,610 |
| 43. | 48607 | 42.1% | 13.6%(+28.5)#43 | 12.5%(+29.6)#1,689 |
| 44. | 49007 | 41.5% | 13.6%(+28.0)#44 | 12.5%(+29.1)#1,732 |
| 45. | 48211 | 39.7% | 13.6%(+26.1)#45 | 12.5%(+27.2)#1,871 |
| 46. | 48532 | 39.5% | 13.6%(+25.9)#46 | 12.5%(+27.0)#1,883 |
| 47. | 48933 | 39.0% | 13.6%(+25.5)#47 | 12.5%(+26.6)#1,919 |
| 48. | 48174 | 38.1% | 13.6%(+24.5)#48 | 12.5%(+25.6)#1,990 |
| 49. | 48216 | 37.1% | 13.6%(+23.6)#49 | 12.5%(+24.6)#2,058 |
| 50. | 49642 | 35.8% | 13.6%(+22.3)#50 | 12.5%(+23.4)#2,140 |
| 51. | 48340 | 34.9% | 13.6%(+21.4)#51 | 12.5%(+22.5)#2,231 |
| 52. | 48874 | 34.6% | 13.6%(+21.0)#52 | 12.5%(+22.1)#2,258 |
| 53. | 48198 | 34.2% | 13.6%(+20.7)#53 | 12.5%(+21.7)#2,295 |
| 54. | 49507 | 33.9% | 13.6%(+20.4)#54 | 12.5%(+21.4)#2,311 |
| 55. | 48502 | 33.5% | 13.6%(+19.9)#55 | 12.5%(+21.0)#2,341 |
| 56. | 49444 | 31.5% | 13.6%(+18.0)#56 | 12.5%(+19.1)#2,511 |
| 57. | 48015 | 30.9% | 13.6%(+17.4)#57 | 12.5%(+18.5)#2,563 |
| 58. | 48089 | 29.6% | 13.6%(+16.1)#58 | 12.5%(+17.2)#2,682 |
| 59. | 48507 | 28.6% | 13.6%(+15.0)#59 | 12.5%(+16.1)#2,803 |
| 60. | 48911 | 27.6% | 13.6%(+14.0)#60 | 12.5%(+15.1)#2,892 |
| 61. | 49508 | 27.0% | 13.6%(+13.5)#61 | 12.5%(+14.6)#2,957 |
| 62. | 49043 | 26.9% | 13.6%(+13.3)#62 | 12.5%(+14.4)#2,989 |
| 63. | 48915 | 26.6% | 13.6%(+13.0)#63 | 12.5%(+14.1)#3,023 |
| 64. | 49001 | 26.0% | 13.6%(+12.5)#64 | 12.5%(+13.5)#3,086 |
| 65. | 48458 | 25.6% | 13.6%(+12.0)#65 | 12.5%(+13.1)#3,144 |
| 66. | 48602 | 25.4% | 13.6%(+11.8)#66 | 12.5%(+12.9)#3,170 |
| 67. | 48091 | 24.7% | 13.6%(+11.1)#67 | 12.5%(+12.2)#3,248 |
| 68. | 49037 | 24.1% | 13.6%(+10.6)#68 | 12.5%(+11.7)#3,334 |
| 69. | 48043 | 24.1% | 13.6%(+10.5)#69 | 12.5%(+11.6)#3,346 |
| 70. | 48334 | 23.8% | 13.6%(+10.2)#70 | 12.5%(+11.3)#3,392 |
| 71. | 48197 | 23.7% | 13.6%(+10.2)#71 | 12.5%(+11.3)#3,395 |
| 72. | 48111 | 23.4% | 13.6%(+9.82)#72 | 12.5%(+10.9)#3,440 |
| 73. | 48184 | 23.1% | 13.6%(+9.56)#73 | 12.5%(+10.6)#3,470 |
| 74. | 48066 | 22.8% | 13.6%(+9.26)#74 | 12.5%(+10.3)#3,511 |
| 75. | 49442 | 22.7% | 13.6%(+9.10)#75 | 12.5%(+10.2)#3,543 |
| 76. | 48186 | 22.5% | 13.6%(+8.94)#76 | 12.5%(+10.0)#3,560 |
| 77. | 48185 | 22.1% | 13.6%(+8.54)#77 | 12.5%(+9.63)#3,620 |
| 78. | 48036 | 22.0% | 13.6%(+8.48)#78 | 12.5%(+9.57)#3,629 |
| 79. | 48912 | 22.0% | 13.6%(+8.44)#79 | 12.5%(+9.52)#3,637 |
| 80. | 48035 | 21.4% | 13.6%(+7.87)#80 | 12.5%(+8.96)#3,727 |
| 81. | 48212 | 20.9% | 13.6%(+7.30)#81 | 12.5%(+8.39)#3,813 |
| 82. | 48180 | 20.3% | 13.6%(+6.77)#82 | 12.5%(+7.86)#3,894 |
| 83. | 49048 | 20.3% | 13.6%(+6.76)#83 | 12.5%(+7.85)#3,897 |
| 84. | 48322 | 19.8% | 13.6%(+6.29)#84 | 12.5%(+7.37)#3,985 |
| 85. | 48880 | 19.7% | 13.6%(+6.10)#85 | 12.5%(+7.19)#4,016 |
| 86. | 49512 | 19.5% | 13.6%(+5.95)#86 | 12.5%(+7.04)#4,045 |
| 87. | 49908 | 19.4% | 13.6%(+5.87)#87 | 12.5%(+6.96)#4,054 |
| 88. | 48210 | 19.2% | 13.6%(+5.63)#88 | 12.5%(+6.72)#4,098 |
| 89. | 48638 | 18.5% | 13.6%(+4.93)#89 | 12.5%(+6.01)#4,224 |
| 90. | 49788 | 17.5% | 13.6%(+3.92)#90 | 12.5%(+5.00)#4,415 |
| 91. | 49224 | 17.3% | 13.6%(+3.76)#91 | 12.5%(+4.85)#4,444 |
| 92. | 48910 | 17.3% | 13.6%(+3.75)#92 | 12.5%(+4.84)#4,445 |
| 93. | 49304 | 17.2% | 13.6%(+3.67)#93 | 12.5%(+4.76)#4,462 |
| 94. | 48093 | 17.0% | 13.6%(+3.46)#94 | 12.5%(+4.54)#4,505 |
| 95. | 48108 | 16.0% | 13.6%(+2.42)#95 | 12.5%(+3.50)#4,745 |
| 96. | 48220 | 15.8% | 13.6%(+2.28)#96 | 12.5%(+3.37)#4,773 |
| 97. | 49752 | 15.8% | 13.6%(+2.26)#97 | 12.5%(+3.35)#4,778 |
| 98. | 48331 | 15.4% | 13.6%(+1.82)#98 | 12.5%(+2.91)#4,862 |
| 99. | 48336 | 15.2% | 13.6%(+1.67)#99 | 12.5%(+2.75)#4,905 |
| 100. | 49862 | 15.1% | 13.6%(+1.58)#100 | 12.5%(+2.67)#4,922 |
Common Questions
What are the Top 10 Zip Codes with the Highest Percentage of Black / African American Population in Michigan?
Top 10 Zip Codes with the Highest Percentage of Black / African American Population in Michigan are:
What zip code has the Highest Percentage of Black / African American Population in Michigan?
48227 has the Highest Percentage of Black / African American Population in Michigan with 95.7%.
What is the Percentage of Black / African American Population in the State of Michigan?
Percentage of Black / African American Population in Michigan is 13.6%.
What is the Percentage of Black / African American Population in the United States?
Percentage of Black / African American Population in the United States is 12.5%.