Waterville, ME
Waterville Map
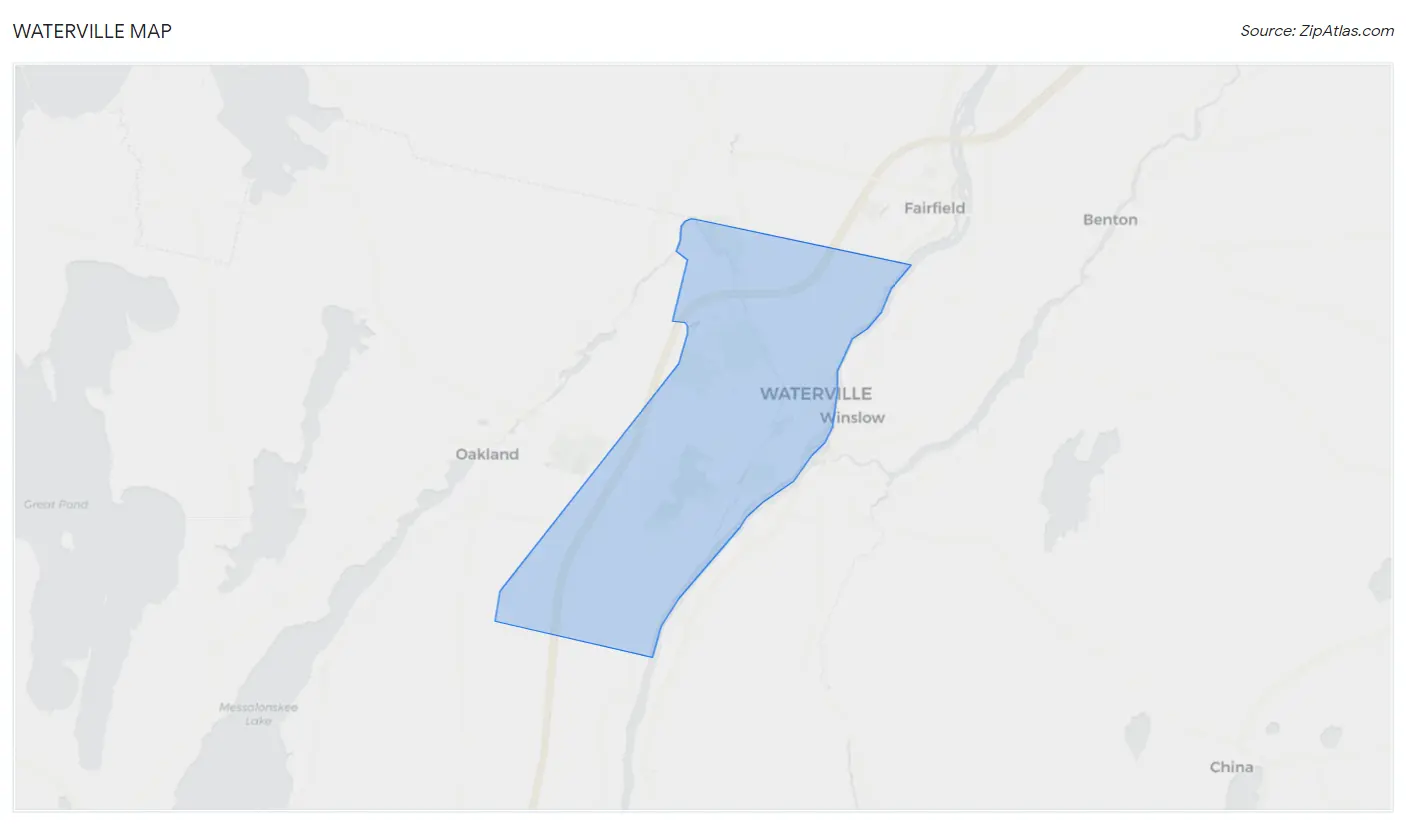
Waterville Overview
15,785
TOTAL POPULATION
7,608
MALE POPULATION
8,177
FEMALE POPULATION
93.04
MALES / 100 FEMALES
107.48
FEMALES / 100 MALES
35.2
MEDIAN AGE
2.9
AVG FAMILY SIZE
2.1
AVG HOUSEHOLD SIZE
$28,484
PER CAPITA INCOME
$57,351
AVG FAMILY INCOME
$45,208
AVG HOUSEHOLD INCOME
35.1%
WAGE / INCOME GAP [ % ]
64.9¢/ $1
WAGE / INCOME GAP [ $ ]
$11,664
FAMILY INCOME DEFICIT
0.51
INEQUALITY / GINI INDEX
7,249
LABOR FORCE [ PEOPLE ]
56.0%
PERCENT IN LABOR FORCE
4.5%
UNEMPLOYMENT RATE
Waterville Zip Codes
Waterville Area Codes
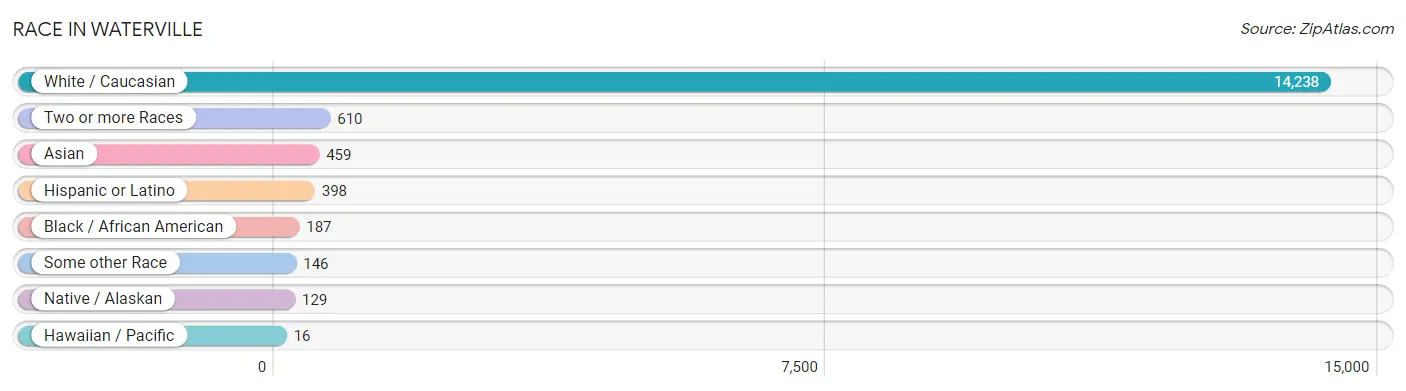
Race in Waterville
The most populous races in Waterville are White / Caucasian (14,238 | 90.2%), Two or more Races (610 | 3.9%), and Asian (459 | 2.9%).
| Race | # Population | % Population |
| Asian | 459 | 2.9% |
| Black / African American | 187 | 1.2% |
| Hawaiian / Pacific | 16 | 0.1% |
| Hispanic or Latino | 398 | 2.5% |
| Native / Alaskan | 129 | 0.8% |
| White / Caucasian | 14,238 | 90.2% |
| Two or more Races | 610 | 3.9% |
| Some other Race | 146 | 0.9% |
| Total | 15,785 | 100.0% |
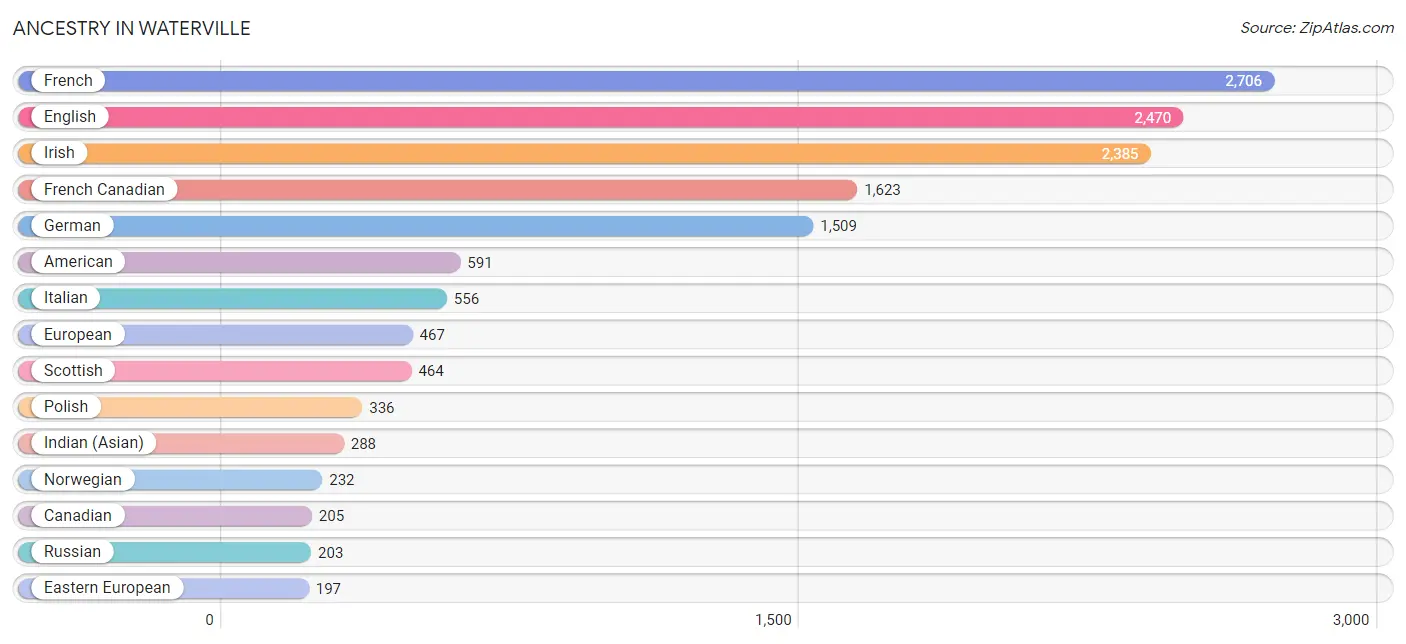
Ancestry in Waterville
The most populous ancestries reported in Waterville are French (2,706 | 17.1%), English (2,470 | 15.7%), Irish (2,385 | 15.1%), French Canadian (1,623 | 10.3%), and German (1,509 | 9.6%), together accounting for 67.7% of all Waterville residents.
| Ancestry | # Population | % Population |
| African | 4 | 0.0% |
| American | 591 | 3.7% |
| Arab | 48 | 0.3% |
| Armenian | 25 | 0.2% |
| Austrian | 11 | 0.1% |
| Barbadian | 19 | 0.1% |
| Bhutanese | 24 | 0.2% |
| Blackfeet | 10 | 0.1% |
| British | 27 | 0.2% |
| Burmese | 94 | 0.6% |
| Canadian | 205 | 1.3% |
| Central American | 54 | 0.3% |
| Cherokee | 34 | 0.2% |
| Chippewa | 14 | 0.1% |
| Colombian | 7 | 0.0% |
| Cree | 52 | 0.3% |
| Croatian | 7 | 0.0% |
| Cuban | 32 | 0.2% |
| Czech | 29 | 0.2% |
| Czechoslovakian | 9 | 0.1% |
| Dominican | 52 | 0.3% |
| Dutch | 125 | 0.8% |
| Eastern European | 197 | 1.3% |
| Ecuadorian | 15 | 0.1% |
| English | 2,470 | 15.7% |
| European | 467 | 3.0% |
| Filipino | 54 | 0.3% |
| Finnish | 20 | 0.1% |
| French | 2,706 | 17.1% |
| French American Indian | 15 | 0.1% |
| French Canadian | 1,623 | 10.3% |
| German | 1,509 | 9.6% |
| Greek | 8 | 0.1% |
| Hungarian | 194 | 1.2% |
| Icelander | 82 | 0.5% |
| Indian (Asian) | 288 | 1.8% |
| Irish | 2,385 | 15.1% |
| Italian | 556 | 3.5% |
| Jamaican | 25 | 0.2% |
| Korean | 54 | 0.3% |
| Lebanese | 48 | 0.3% |
| Lithuanian | 62 | 0.4% |
| Mexican | 118 | 0.7% |
| Northern European | 60 | 0.4% |
| Norwegian | 232 | 1.5% |
| Pakistani | 34 | 0.2% |
| Panamanian | 40 | 0.3% |
| Polish | 336 | 2.1% |
| Portuguese | 20 | 0.1% |
| Puerto Rican | 33 | 0.2% |
| Romanian | 7 | 0.0% |
| Russian | 203 | 1.3% |
| Salvadoran | 14 | 0.1% |
| Scandinavian | 35 | 0.2% |
| Scotch-Irish | 84 | 0.5% |
| Scottish | 464 | 2.9% |
| Slovak | 22 | 0.1% |
| Somali | 14 | 0.1% |
| South American | 22 | 0.1% |
| Spaniard | 18 | 0.1% |
| Spanish | 15 | 0.1% |
| Sri Lankan | 49 | 0.3% |
| Subsaharan African | 18 | 0.1% |
| Swedish | 57 | 0.4% |
| Swiss | 25 | 0.2% |
| Thai | 45 | 0.3% |
| Turkish | 37 | 0.2% |
| Ukrainian | 93 | 0.6% |
| Welsh | 69 | 0.4% | View All 69 Rows |
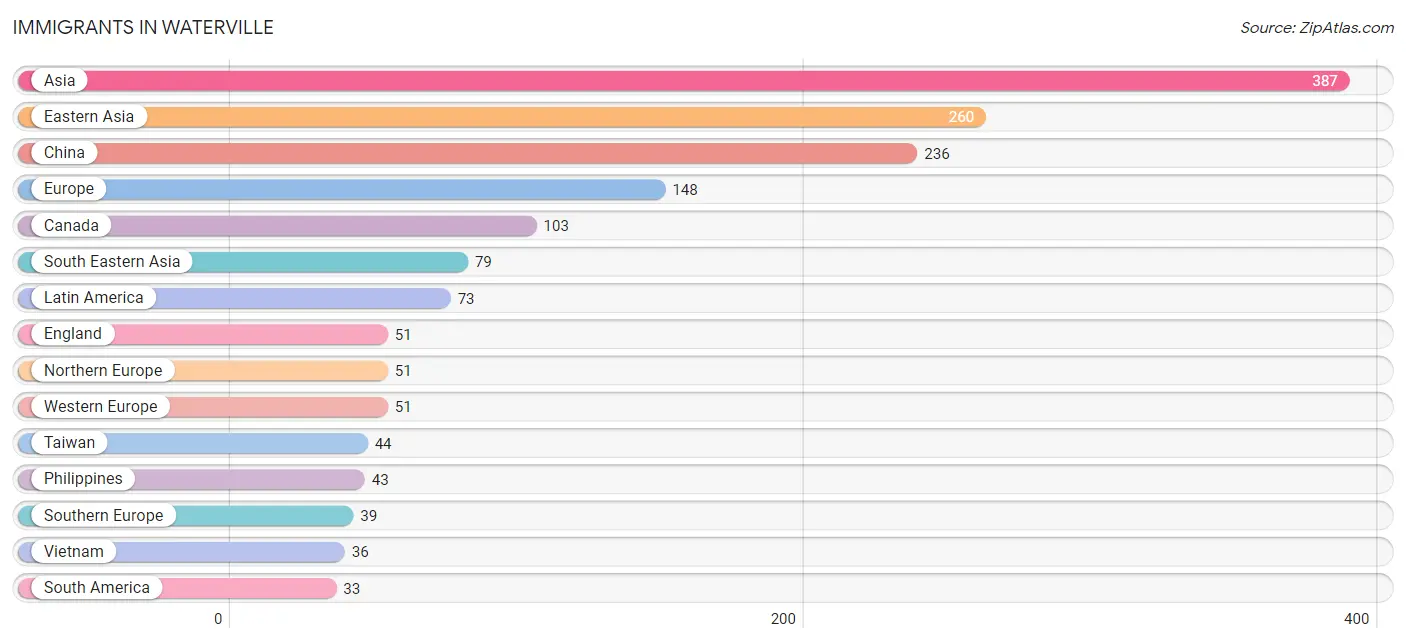
Immigrants in Waterville
The most numerous immigrant groups reported in Waterville came from Asia (387 | 2.5%), Eastern Asia (260 | 1.7%), China (236 | 1.5%), Europe (148 | 0.9%), and Canada (103 | 0.6%), together accounting for 7.2% of all Waterville residents.
| Immigration Origin | # Population | % Population |
| Africa | 17 | 0.1% |
| Armenia | 11 | 0.1% |
| Asia | 387 | 2.5% |
| Bolivia | 8 | 0.1% |
| Brazil | 18 | 0.1% |
| Canada | 103 | 0.6% |
| Caribbean | 12 | 0.1% |
| Central America | 28 | 0.2% |
| China | 236 | 1.5% |
| Colombia | 7 | 0.0% |
| Eastern Africa | 12 | 0.1% |
| Eastern Asia | 260 | 1.7% |
| Eastern Europe | 7 | 0.0% |
| El Salvador | 14 | 0.1% |
| England | 51 | 0.3% |
| Ethiopia | 4 | 0.0% |
| Europe | 148 | 0.9% |
| France | 10 | 0.1% |
| Germany | 26 | 0.2% |
| India | 20 | 0.1% |
| Italy | 29 | 0.2% |
| Jamaica | 12 | 0.1% |
| Korea | 24 | 0.2% |
| Latin America | 73 | 0.5% |
| Mexico | 14 | 0.1% |
| Moldova | 7 | 0.0% |
| Netherlands | 15 | 0.1% |
| Northern Europe | 51 | 0.3% |
| Philippines | 43 | 0.3% |
| Somalia | 8 | 0.1% |
| South America | 33 | 0.2% |
| South Central Asia | 20 | 0.1% |
| South Eastern Asia | 79 | 0.5% |
| Southern Europe | 39 | 0.3% |
| Spain | 10 | 0.1% |
| Taiwan | 44 | 0.3% |
| Turkey | 17 | 0.1% |
| Vietnam | 36 | 0.2% |
| Western Asia | 28 | 0.2% |
| Western Europe | 51 | 0.3% | View All 40 Rows |
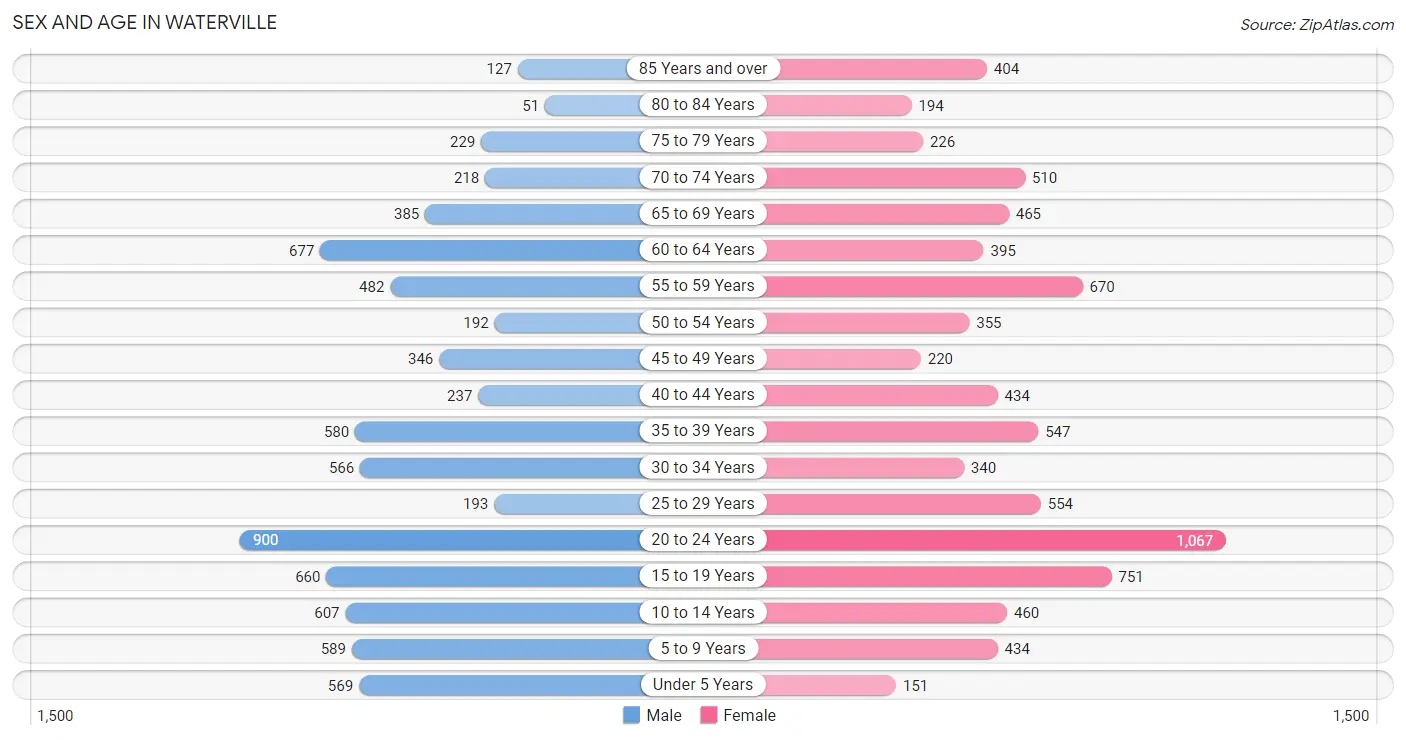
Sex and Age in Waterville
Sex and Age in Waterville
The most populous age groups in Waterville are 20 to 24 Years (900 | 11.8%) for men and 20 to 24 Years (1,067 | 13.1%) for women.
| Age Bracket | Male | Female |
| Under 5 Years | 569 (7.5%) | 151 (1.8%) |
| 5 to 9 Years | 589 (7.7%) | 434 (5.3%) |
| 10 to 14 Years | 607 (8.0%) | 460 (5.6%) |
| 15 to 19 Years | 660 (8.7%) | 751 (9.2%) |
| 20 to 24 Years | 900 (11.8%) | 1,067 (13.1%) |
| 25 to 29 Years | 193 (2.5%) | 554 (6.8%) |
| 30 to 34 Years | 566 (7.4%) | 340 (4.2%) |
| 35 to 39 Years | 580 (7.6%) | 547 (6.7%) |
| 40 to 44 Years | 237 (3.1%) | 434 (5.3%) |
| 45 to 49 Years | 346 (4.5%) | 220 (2.7%) |
| 50 to 54 Years | 192 (2.5%) | 355 (4.3%) |
| 55 to 59 Years | 482 (6.3%) | 670 (8.2%) |
| 60 to 64 Years | 677 (8.9%) | 395 (4.8%) |
| 65 to 69 Years | 385 (5.1%) | 465 (5.7%) |
| 70 to 74 Years | 218 (2.9%) | 510 (6.2%) |
| 75 to 79 Years | 229 (3.0%) | 226 (2.8%) |
| 80 to 84 Years | 51 (0.7%) | 194 (2.4%) |
| 85 Years and over | 127 (1.7%) | 404 (4.9%) |
| Total | 7,608 (100.0%) | 8,177 (100.0%) |
Families and Households in Waterville
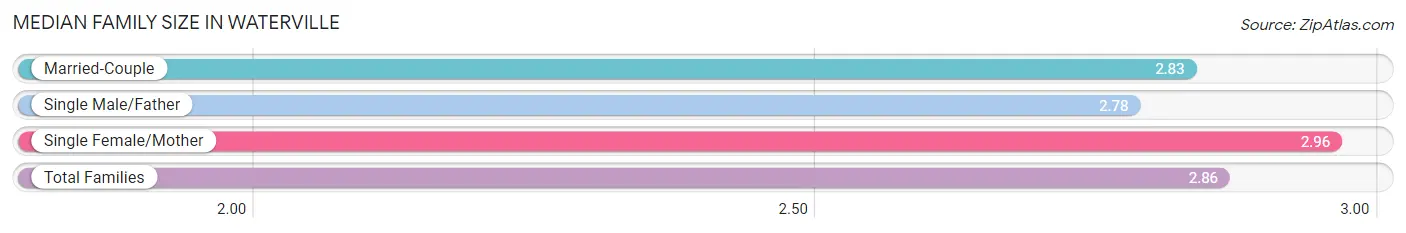
Median Family Size in Waterville
The median family size in Waterville is 2.86 persons per family, with single female/mother families (774 | 24.1%) accounting for the largest median family size of 2.96 persons per family. On the other hand, single male/father families (398 | 12.4%) represent the smallest median family size with 2.78 persons per family.
| Family Type | # Families | Family Size |
| Married-Couple | 2,045 (63.6%) | 2.83 |
| Single Male/Father | 398 (12.4%) | 2.78 |
| Single Female/Mother | 774 (24.1%) | 2.96 |
| Total Families | 3,217 (100.0%) | 2.86 |
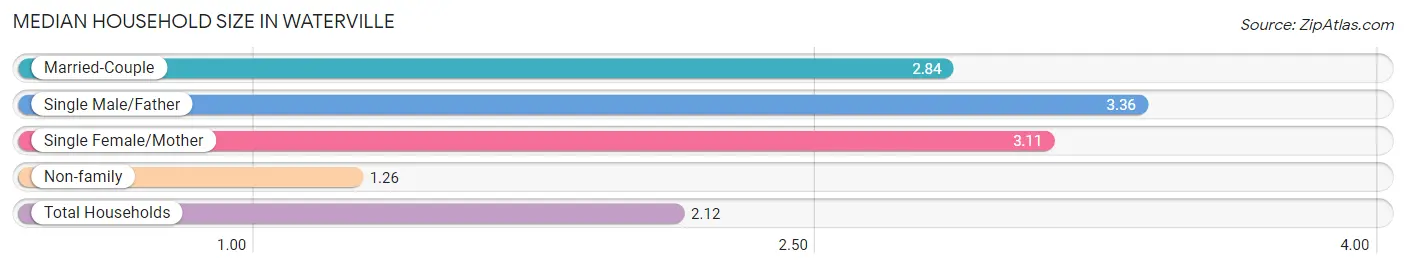
Median Household Size in Waterville
The median household size in Waterville is 2.12 persons per household, with single male/father households (398 | 6.2%) accounting for the largest median household size of 3.36 persons per household. non-family households (3,149 | 49.5%) represent the smallest median household size with 1.26 persons per household.
| Household Type | # Households | Household Size |
| Married-Couple | 2,045 (32.1%) | 2.84 |
| Single Male/Father | 398 (6.2%) | 3.36 |
| Single Female/Mother | 774 (12.2%) | 3.11 |
| Non-family | 3,149 (49.5%) | 1.26 |
| Total Households | 6,366 (100.0%) | 2.12 |
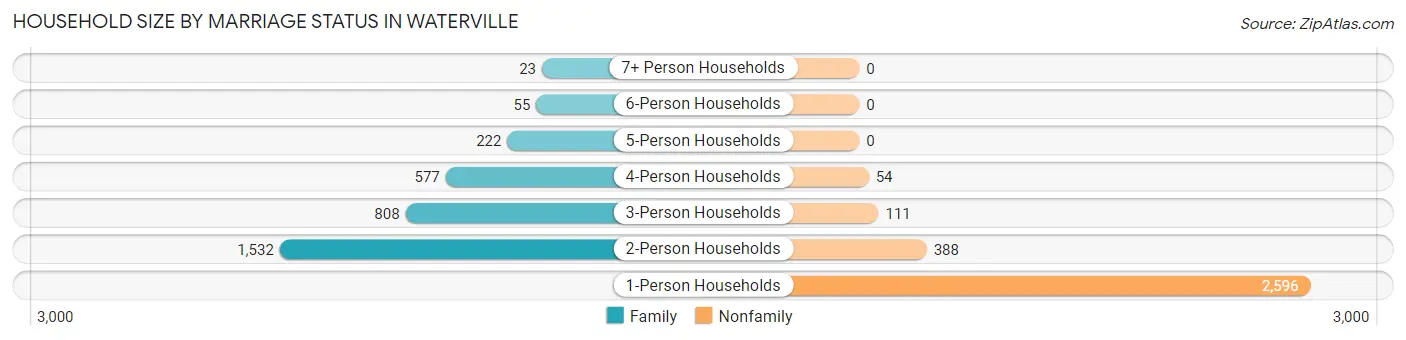
Household Size by Marriage Status in Waterville
Out of a total of 6,366 households in Waterville, 3,217 (50.5%) are family households, while 3,149 (49.5%) are nonfamily households. The most numerous type of family households are 2-person households, comprising 1,532, and the most common type of nonfamily households are 1-person households, comprising 2,596.
| Household Size | Family Households | Nonfamily Households |
| 1-Person Households | - | 2,596 (40.8%) |
| 2-Person Households | 1,532 (24.1%) | 388 (6.1%) |
| 3-Person Households | 808 (12.7%) | 111 (1.7%) |
| 4-Person Households | 577 (9.1%) | 54 (0.9%) |
| 5-Person Households | 222 (3.5%) | 0 (0.0%) |
| 6-Person Households | 55 (0.9%) | 0 (0.0%) |
| 7+ Person Households | 23 (0.4%) | 0 (0.0%) |
| Total | 3,217 (50.5%) | 3,149 (49.5%) |
Female Fertility in Waterville
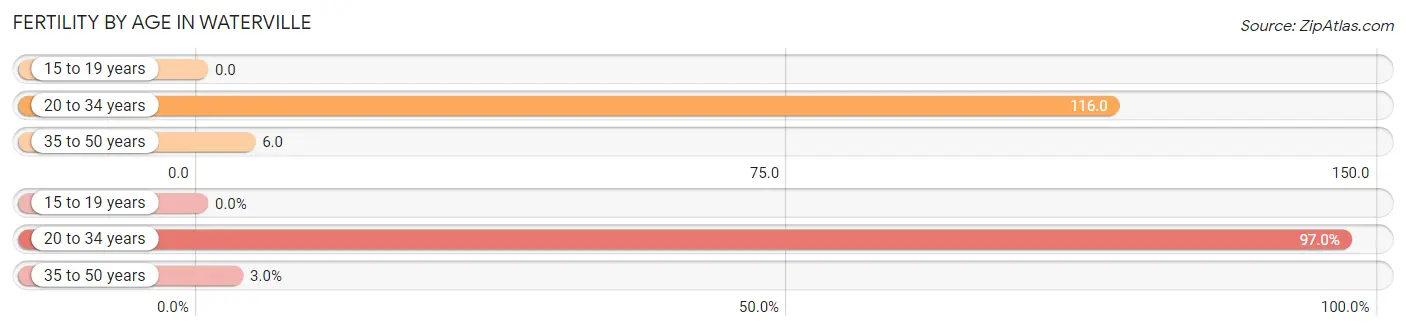
Fertility by Age in Waterville
Average fertility rate in Waterville is 59.0 births per 1,000 women. Women in the age bracket of 20 to 34 years have the highest fertility rate with 116.0 births per 1,000 women. Women in the age bracket of 20 to 34 years acount for 97.0% of all women with births.
| Age Bracket | Women with Births | Births / 1,000 Women |
| 15 to 19 years | 0 (0.0%) | 0.0 |
| 20 to 34 years | 228 (97.0%) | 116.0 |
| 35 to 50 years | 7 (3.0%) | 6.0 |
| Total | 235 (100.0%) | 59.0 |
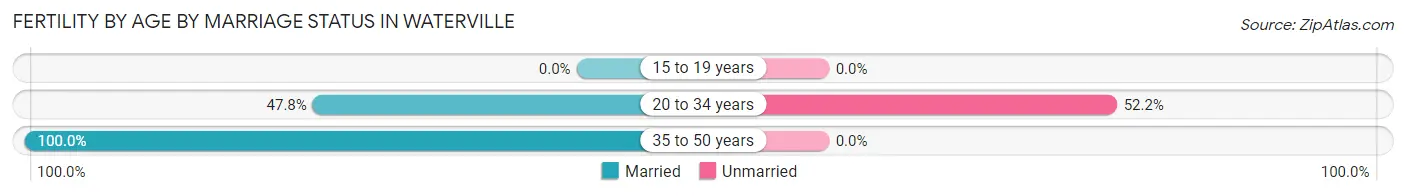
Fertility by Age by Marriage Status in Waterville
49.4% of women with births (235) in Waterville are married. The highest percentage of unmarried women with births falls into 20 to 34 years age bracket with 52.2% of them unmarried at the time of birth, while the lowest percentage of unmarried women with births belong to 35 to 50 years age bracket with 0.0% of them unmarried.
| Age Bracket | Married | Unmarried |
| 15 to 19 years | 0 (0.0%) | 0 (0.0%) |
| 20 to 34 years | 109 (47.8%) | 119 (52.2%) |
| 35 to 50 years | 7 (100.0%) | 0 (0.0%) |
| Total | 116 (49.4%) | 119 (50.6%) |
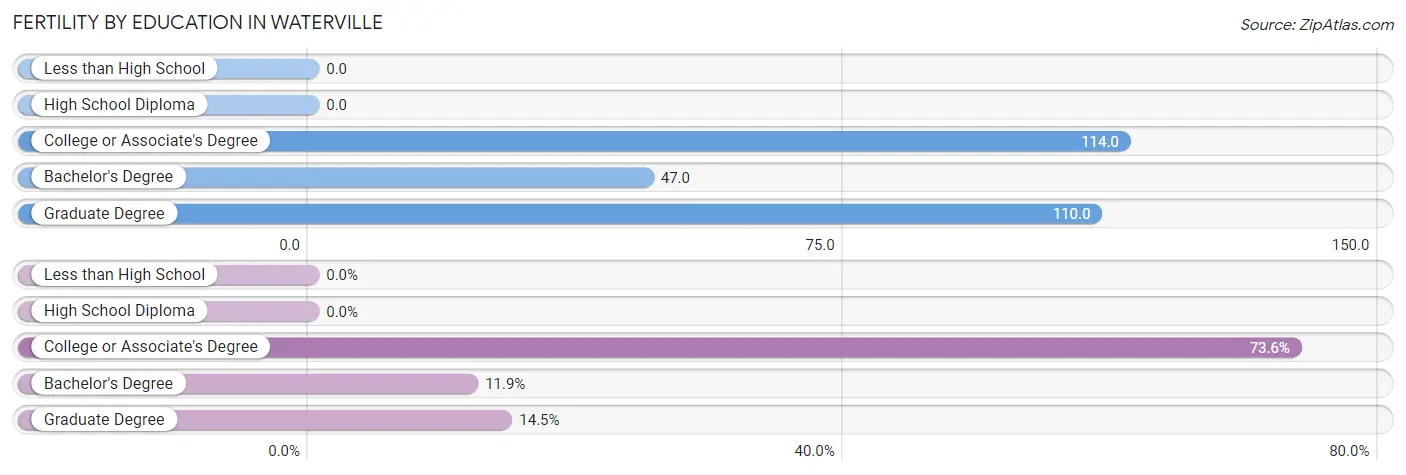
Fertility by Education in Waterville
| Educational Attainment | Women with Births | Births / 1,000 Women |
| Less than High School | 0 (0.0%) | 0.0 |
| High School Diploma | 0 (0.0%) | 0.0 |
| College or Associate's Degree | 173 (73.6%) | 114.0 |
| Bachelor's Degree | 28 (11.9%) | 47.0 |
| Graduate Degree | 34 (14.5%) | 110.0 |
| Total | 235 (100.0%) | 59.0 |
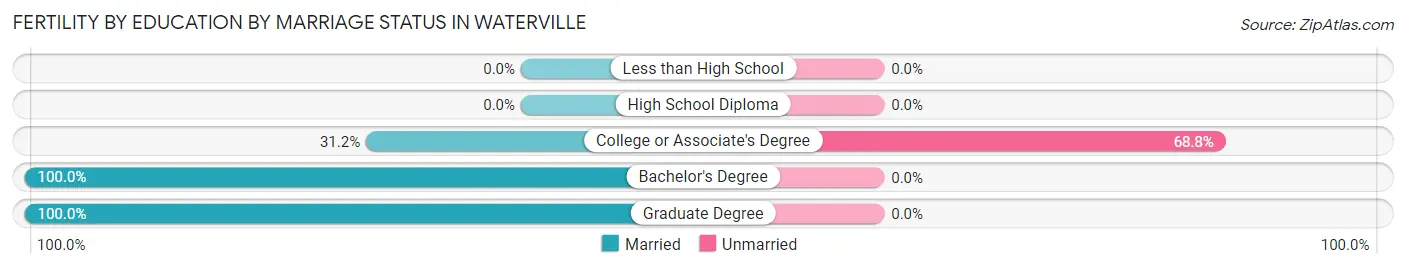
Fertility by Education by Marriage Status in Waterville
50.6% of women with births in Waterville are unmarried. Women with the educational attainment of bachelor's degree are most likely to be married with 100.0% of them married at childbirth, while women with the educational attainment of college or associate's degree are least likely to be married with 68.8% of them unmarried at childbirth.
| Educational Attainment | Married | Unmarried |
| Less than High School | 0 (0.0%) | 0 (0.0%) |
| High School Diploma | 0 (0.0%) | 0 (0.0%) |
| College or Associate's Degree | 54 (31.2%) | 119 (68.8%) |
| Bachelor's Degree | 28 (100.0%) | 0 (0.0%) |
| Graduate Degree | 34 (100.0%) | 0 (0.0%) |
| Total | 116 (49.4%) | 119 (50.6%) |
Income in Waterville
Income Overview in Waterville
Per Capita Income in Waterville is $28,484, while median incomes of families and households are $57,351 and $45,208 respectively.
| Characteristic | Number | Measure |
| Per Capita Income | 15,785 | $28,484 |
| Median Family Income | 3,217 | $57,351 |
| Mean Family Income | 3,217 | $83,788 |
| Median Household Income | 6,366 | $45,208 |
| Mean Household Income | 6,366 | $66,353 |
| Income Deficit | 3,217 | $11,664 |
| Wage / Income Gap (%) | 15,785 | 35.06% |
| Wage / Income Gap ($) | 15,785 | 64.94¢ per $1 |
| Gini / Inequality Index | 15,785 | 0.51 |
Earnings by Sex in Waterville
Average Earnings in Waterville are $28,585, $35,804 for men and $23,251 for women, a difference of 35.1%.
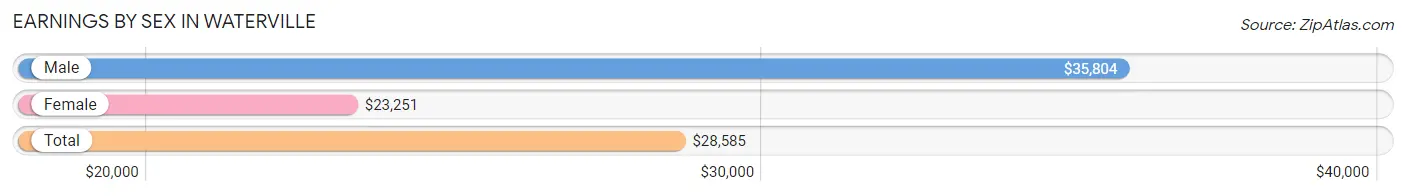
| Sex | Number | Average Earnings |
| Male | 3,701 (46.5%) | $35,804 |
| Female | 4,254 (53.5%) | $23,251 |
| Total | 7,955 (100.0%) | $28,585 |
Earnings by Sex by Income Bracket in Waterville
The most common earnings brackets in Waterville are $75,000 to $99,999 for men (395 | 10.7%) and $2,500 to $4,999 for women (652 | 15.3%).
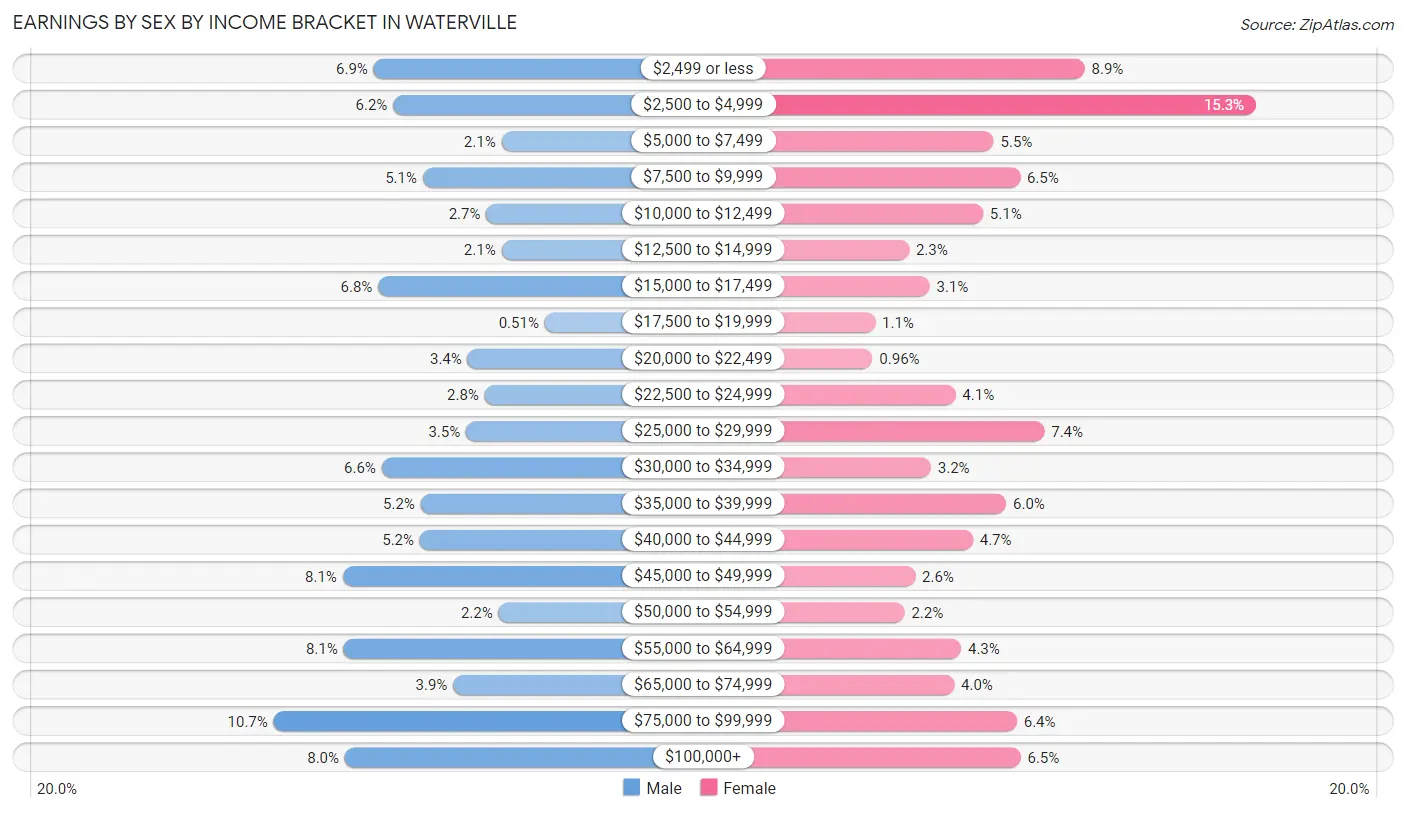
| Income | Male | Female |
| $2,499 or less | 256 (6.9%) | 379 (8.9%) |
| $2,500 to $4,999 | 229 (6.2%) | 652 (15.3%) |
| $5,000 to $7,499 | 79 (2.1%) | 234 (5.5%) |
| $7,500 to $9,999 | 188 (5.1%) | 276 (6.5%) |
| $10,000 to $12,499 | 100 (2.7%) | 217 (5.1%) |
| $12,500 to $14,999 | 79 (2.1%) | 99 (2.3%) |
| $15,000 to $17,499 | 250 (6.8%) | 132 (3.1%) |
| $17,500 to $19,999 | 19 (0.5%) | 45 (1.1%) |
| $20,000 to $22,499 | 126 (3.4%) | 41 (1.0%) |
| $22,500 to $24,999 | 102 (2.8%) | 173 (4.1%) |
| $25,000 to $29,999 | 128 (3.5%) | 315 (7.4%) |
| $30,000 to $34,999 | 245 (6.6%) | 134 (3.2%) |
| $35,000 to $39,999 | 191 (5.2%) | 254 (6.0%) |
| $40,000 to $44,999 | 192 (5.2%) | 201 (4.7%) |
| $45,000 to $49,999 | 299 (8.1%) | 109 (2.6%) |
| $50,000 to $54,999 | 83 (2.2%) | 92 (2.2%) |
| $55,000 to $64,999 | 298 (8.1%) | 182 (4.3%) |
| $65,000 to $74,999 | 146 (3.9%) | 171 (4.0%) |
| $75,000 to $99,999 | 395 (10.7%) | 271 (6.4%) |
| $100,000+ | 296 (8.0%) | 277 (6.5%) |
| Total | 3,701 (100.0%) | 4,254 (100.0%) |
Earnings by Sex by Educational Attainment in Waterville
Average earnings in Waterville are $48,557 for men and $36,682 for women, a difference of 24.5%. Men with an educational attainment of graduate degree enjoy the highest average annual earnings of $82,069, while those with college or associate's degree education earn the least with $39,539. Women with an educational attainment of graduate degree earn the most with the average annual earnings of $78,514, while those with less than high school education have the smallest earnings of $14,506.
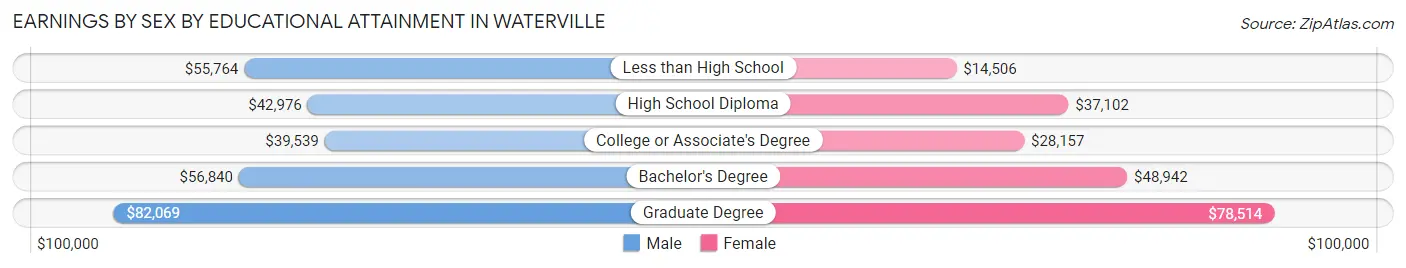
| Educational Attainment | Male Income | Female Income |
| Less than High School | $55,764 | $14,506 |
| High School Diploma | $42,976 | $37,102 |
| College or Associate's Degree | $39,539 | $28,157 |
| Bachelor's Degree | $56,840 | $48,942 |
| Graduate Degree | $82,069 | $78,514 |
| Total | $48,557 | $36,682 |
Family Income in Waterville
Family Income Brackets in Waterville
According to the Waterville family income data, there are 611 families falling into the $35,000 to $49,999 income range, which is the most common income bracket and makes up 19.0% of all families. Conversely, the $10,000 to $14,999 income bracket is the least frequent group with only 106 families (3.3%) belonging to this category.
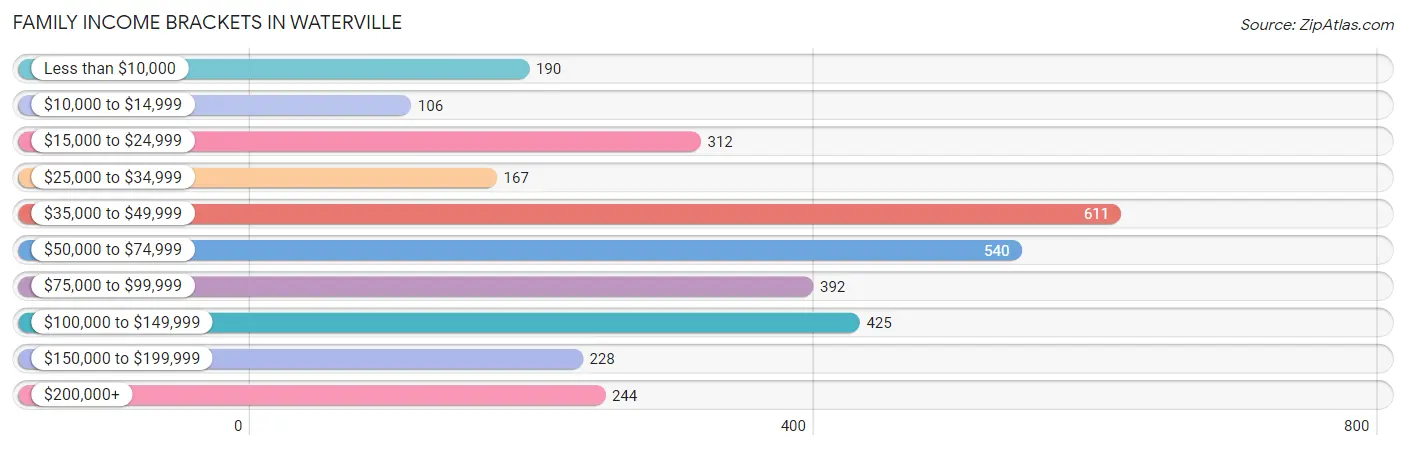
| Income Bracket | # Families | % Families |
| Less than $10,000 | 190 | 5.9% |
| $10,000 to $14,999 | 106 | 3.3% |
| $15,000 to $24,999 | 312 | 9.7% |
| $25,000 to $34,999 | 167 | 5.2% |
| $35,000 to $49,999 | 611 | 19.0% |
| $50,000 to $74,999 | 540 | 16.8% |
| $75,000 to $99,999 | 392 | 12.2% |
| $100,000 to $149,999 | 425 | 13.2% |
| $150,000 to $199,999 | 228 | 7.1% |
| $200,000+ | 244 | 7.6% |
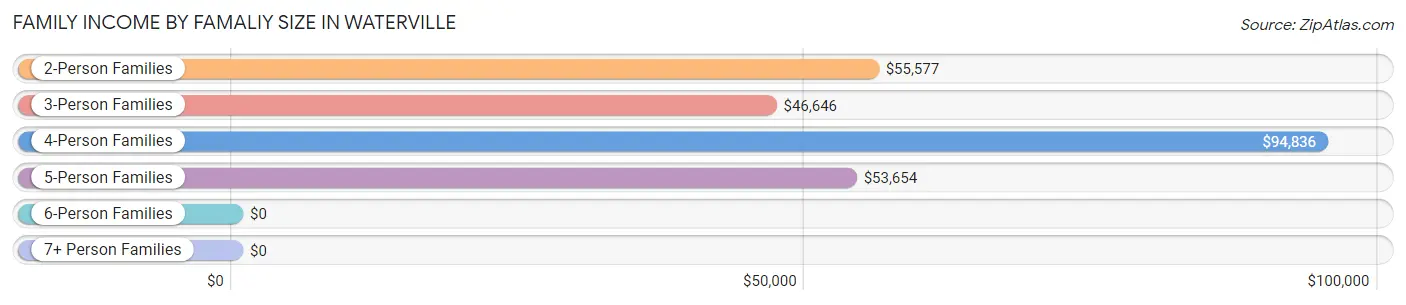
Family Income by Famaliy Size in Waterville
4-person families (504 | 15.7%) account for the highest median family income in Waterville with $94,836 per family, while 2-person families (1,626 | 50.5%) have the highest median income of $27,788 per family member.
| Income Bracket | # Families | Median Income |
| 2-Person Families | 1,626 (50.5%) | $55,577 |
| 3-Person Families | 860 (26.7%) | $46,646 |
| 4-Person Families | 504 (15.7%) | $94,836 |
| 5-Person Families | 178 (5.5%) | $53,654 |
| 6-Person Families | 42 (1.3%) | $0 |
| 7+ Person Families | 7 (0.2%) | $0 |
| Total | 3,217 (100.0%) | $57,351 |
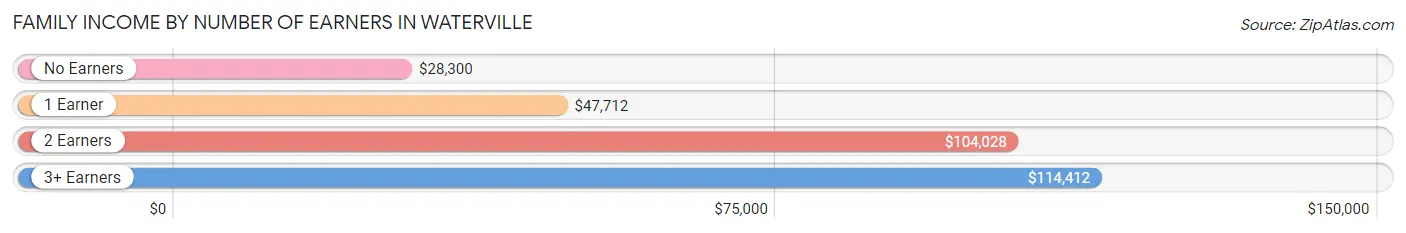
Family Income by Number of Earners in Waterville
The median family income in Waterville is $57,351, with families comprising 3+ earners (186) having the highest median family income of $114,412, while families with no earners (768) have the lowest median family income of $28,300, accounting for 5.8% and 23.9% of families, respectively.
| Number of Earners | # Families | Median Income |
| No Earners | 768 (23.9%) | $28,300 |
| 1 Earner | 1,228 (38.2%) | $47,712 |
| 2 Earners | 1,035 (32.2%) | $104,028 |
| 3+ Earners | 186 (5.8%) | $114,412 |
| Total | 3,217 (100.0%) | $57,351 |
Household Income in Waterville
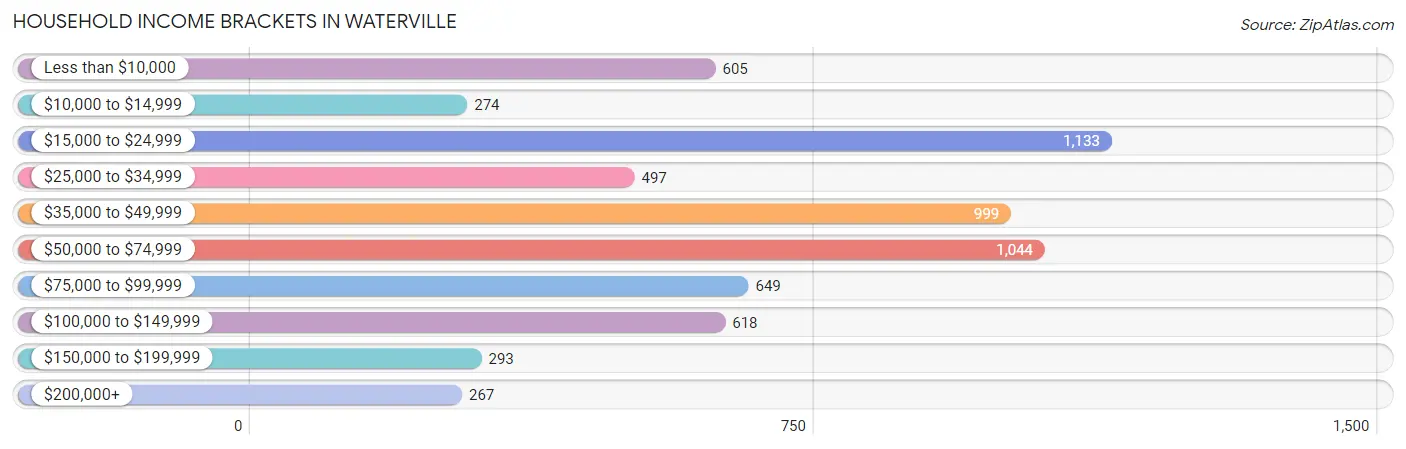
Household Income Brackets in Waterville
With 1,133 households falling in the category, the $15,000 to $24,999 income range is the most frequent in Waterville, accounting for 17.8% of all households. In contrast, only 267 households (4.2%) fall into the $200,000+ income bracket, making it the least populous group.
| Income Bracket | # Households | % Households |
| Less than $10,000 | 605 | 9.5% |
| $10,000 to $14,999 | 274 | 4.3% |
| $15,000 to $24,999 | 1,133 | 17.8% |
| $25,000 to $34,999 | 497 | 7.8% |
| $35,000 to $49,999 | 999 | 15.7% |
| $50,000 to $74,999 | 1,044 | 16.4% |
| $75,000 to $99,999 | 649 | 10.2% |
| $100,000 to $149,999 | 618 | 9.7% |
| $150,000 to $199,999 | 293 | 4.6% |
| $200,000+ | 267 | 4.2% |
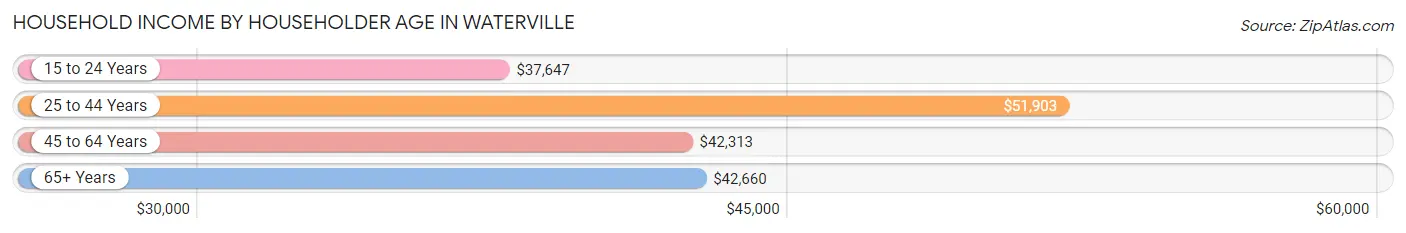
Household Income by Householder Age in Waterville
The median household income in Waterville is $45,208, with the highest median household income of $51,903 found in the 25 to 44 years age bracket for the primary householder. A total of 1,987 households (31.2%) fall into this category. Meanwhile, the 15 to 24 years age bracket for the primary householder has the lowest median household income of $37,647, with 584 households (9.2%) in this group.
| Income Bracket | # Households | Median Income |
| 15 to 24 Years | 584 (9.2%) | $37,647 |
| 25 to 44 Years | 1,987 (31.2%) | $51,903 |
| 45 to 64 Years | 2,168 (34.1%) | $42,313 |
| 65+ Years | 1,627 (25.6%) | $42,660 |
| Total | 6,366 (100.0%) | $45,208 |
Poverty in Waterville
Income Below Poverty by Sex and Age in Waterville
With 20.9% poverty level for males and 25.2% for females among the residents of Waterville, 5 year old males and 18 to 24 year old females are the most vulnerable to poverty, with 53 males (32.3%) and 397 females (58.6%) in their respective age groups living below the poverty level.
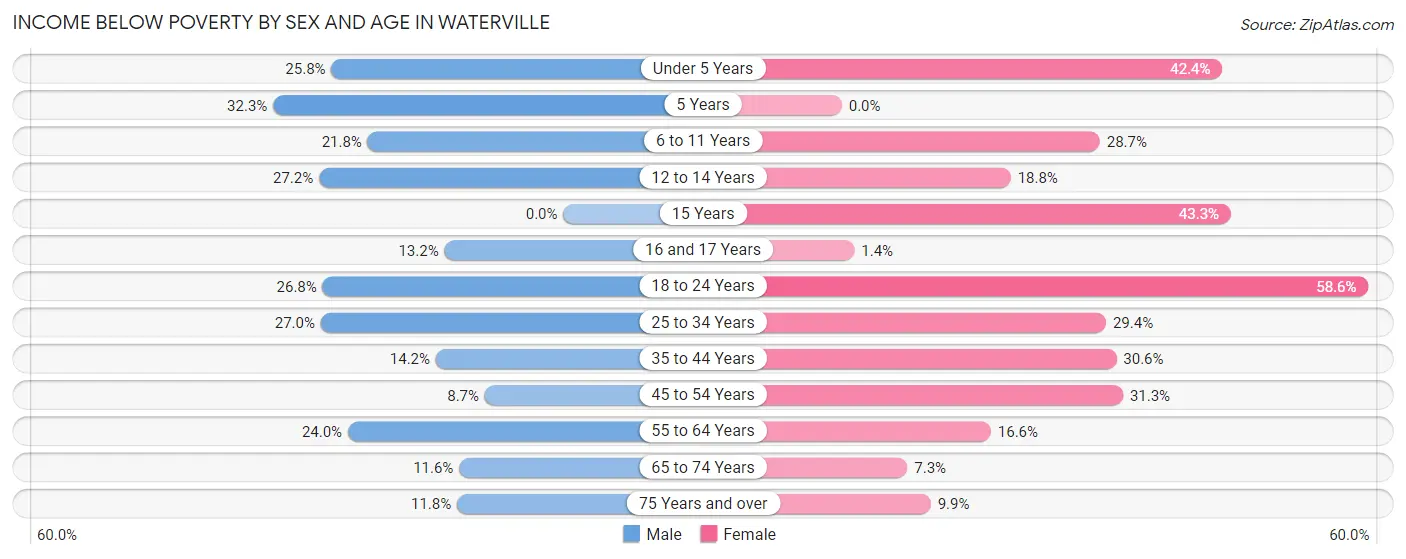
| Age Bracket | Male | Female |
| Under 5 Years | 147 (25.8%) | 64 (42.4%) |
| 5 Years | 53 (32.3%) | 0 (0.0%) |
| 6 to 11 Years | 124 (21.8%) | 156 (28.7%) |
| 12 to 14 Years | 123 (27.2%) | 60 (18.8%) |
| 15 Years | 0 (0.0%) | 13 (43.3%) |
| 16 and 17 Years | 9 (13.2%) | 2 (1.4%) |
| 18 to 24 Years | 204 (26.8%) | 397 (58.6%) |
| 25 to 34 Years | 205 (27.0%) | 263 (29.4%) |
| 35 to 44 Years | 116 (14.2%) | 300 (30.6%) |
| 45 to 54 Years | 47 (8.7%) | 175 (31.3%) |
| 55 to 64 Years | 278 (24.0%) | 174 (16.6%) |
| 65 to 74 Years | 68 (11.6%) | 70 (7.3%) |
| 75 Years and over | 36 (11.8%) | 52 (9.9%) |
| Total | 1,410 (20.9%) | 1,726 (25.2%) |
Income Above Poverty by Sex and Age in Waterville
According to the poverty statistics in Waterville, males aged 45 to 54 years and females aged 5 years are the age groups that are most secure financially, with 91.3% of males and 100.0% of females in these age groups living above the poverty line.
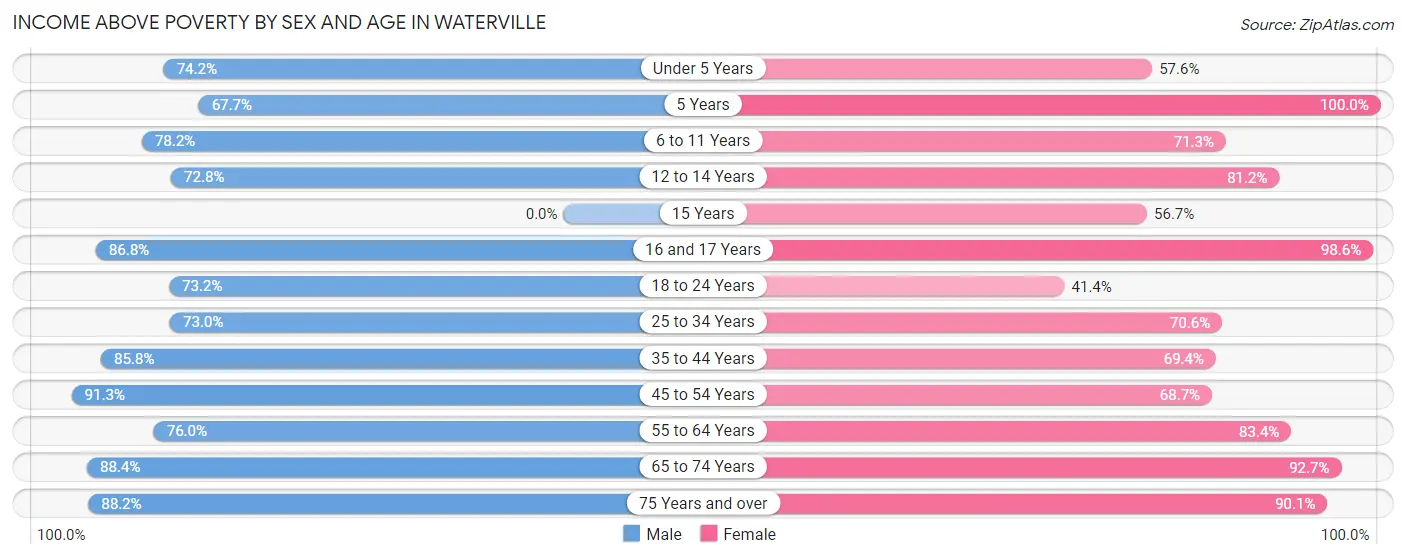
| Age Bracket | Male | Female |
| Under 5 Years | 422 (74.2%) | 87 (57.6%) |
| 5 Years | 111 (67.7%) | 32 (100.0%) |
| 6 to 11 Years | 445 (78.2%) | 387 (71.3%) |
| 12 to 14 Years | 329 (72.8%) | 259 (81.2%) |
| 15 Years | 0 (0.0%) | 17 (56.7%) |
| 16 and 17 Years | 59 (86.8%) | 141 (98.6%) |
| 18 to 24 Years | 557 (73.2%) | 280 (41.4%) |
| 25 to 34 Years | 554 (73.0%) | 631 (70.6%) |
| 35 to 44 Years | 701 (85.8%) | 681 (69.4%) |
| 45 to 54 Years | 491 (91.3%) | 384 (68.7%) |
| 55 to 64 Years | 881 (76.0%) | 874 (83.4%) |
| 65 to 74 Years | 518 (88.4%) | 889 (92.7%) |
| 75 Years and over | 268 (88.2%) | 473 (90.1%) |
| Total | 5,336 (79.1%) | 5,135 (74.8%) |
Income Below Poverty Among Married-Couple Families in Waterville
The poverty statistics for married-couple families in Waterville show that 7.0% or 143 of the total 2,045 families live below the poverty line. Families with 3 or 4 children have the highest poverty rate of 28.2%, comprising of 31 families. On the other hand, families with 1 or 2 children have the lowest poverty rate of 0.0%, which includes 0 families.
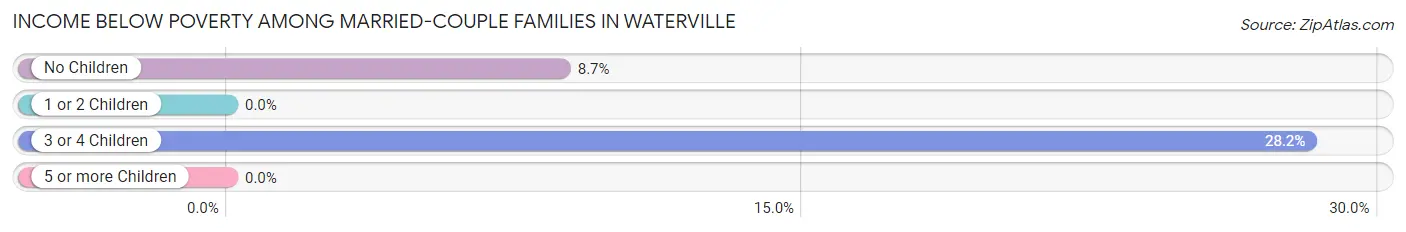
| Children | Above Poverty | Below Poverty |
| No Children | 1,177 (91.3%) | 112 (8.7%) |
| 1 or 2 Children | 639 (100.0%) | 0 (0.0%) |
| 3 or 4 Children | 79 (71.8%) | 31 (28.2%) |
| 5 or more Children | 7 (100.0%) | 0 (0.0%) |
| Total | 1,902 (93.0%) | 143 (7.0%) |
Income Below Poverty Among Single-Parent Households in Waterville
According to the poverty data in Waterville, 16.8% or 67 single-father households and 37.3% or 289 single-mother households are living below the poverty line. Among single-father households, those with 1 or 2 children have the highest poverty rate, with 46 households (20.7%) experiencing poverty. Likewise, among single-mother households, those with 5 or more children have the highest poverty rate, with 16 households (100.0%) falling below the poverty line.
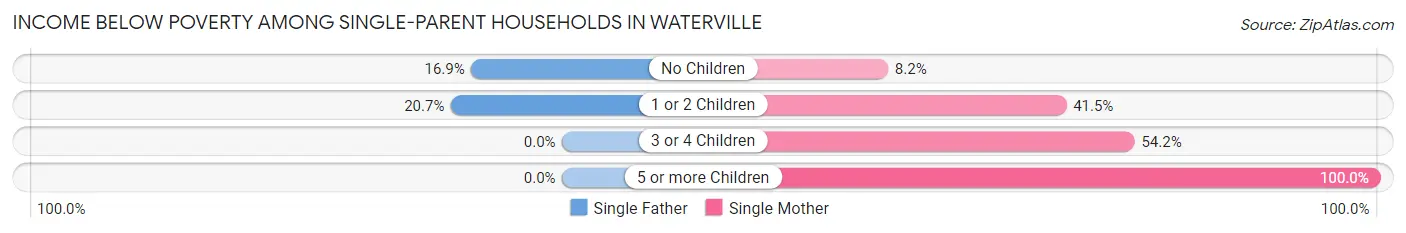
| Children | Single Father | Single Mother |
| No Children | 21 (16.9%) | 14 (8.2%) |
| 1 or 2 Children | 46 (20.7%) | 194 (41.4%) |
| 3 or 4 Children | 0 (0.0%) | 65 (54.2%) |
| 5 or more Children | 0 (0.0%) | 16 (100.0%) |
| Total | 67 (16.8%) | 289 (37.3%) |
Income Below Poverty Among Married-Couple vs Single-Parent Households in Waterville
The poverty data for Waterville shows that 143 of the married-couple family households (7.0%) and 356 of the single-parent households (30.4%) are living below the poverty level. Within the married-couple family households, those with 3 or 4 children have the highest poverty rate, with 31 households (28.2%) falling below the poverty line. Among the single-parent households, those with 5 or more children have the highest poverty rate, with 16 household (100.0%) living below poverty.
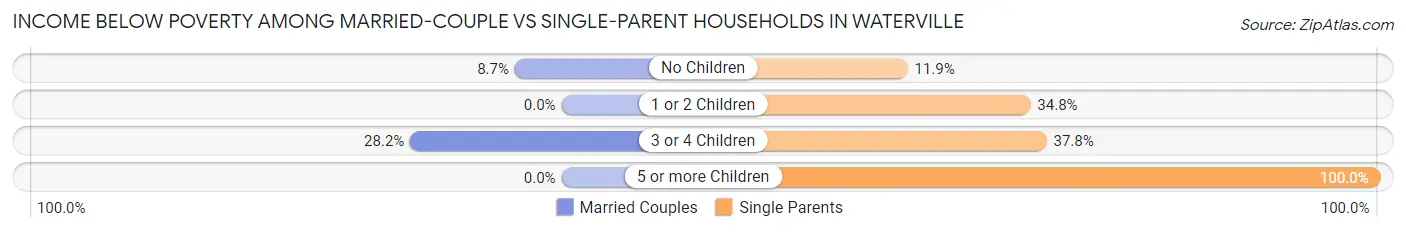
| Children | Married-Couple Families | Single-Parent Households |
| No Children | 112 (8.7%) | 35 (11.9%) |
| 1 or 2 Children | 0 (0.0%) | 240 (34.8%) |
| 3 or 4 Children | 31 (28.2%) | 65 (37.8%) |
| 5 or more Children | 0 (0.0%) | 16 (100.0%) |
| Total | 143 (7.0%) | 356 (30.4%) |
Employment Characteristics in Waterville
Employment by Class of Employer in Waterville
Among the 6,695 employed individuals in Waterville, private company employees (3,710 | 55.4%), not-for-profit organizations (1,562 | 23.3%), and local government employees (452 | 6.8%) make up the most common classes of employment.
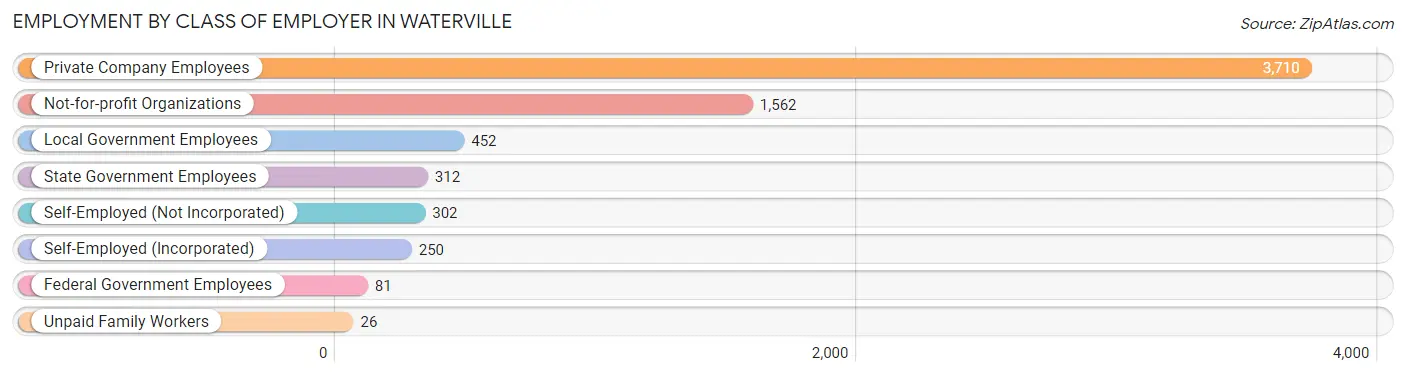
| Employer Class | # Employees | % Employees |
| Private Company Employees | 3,710 | 55.4% |
| Self-Employed (Incorporated) | 250 | 3.7% |
| Self-Employed (Not Incorporated) | 302 | 4.5% |
| Not-for-profit Organizations | 1,562 | 23.3% |
| Local Government Employees | 452 | 6.8% |
| State Government Employees | 312 | 4.7% |
| Federal Government Employees | 81 | 1.2% |
| Unpaid Family Workers | 26 | 0.4% |
| Total | 6,695 | 100.0% |
Employment Status by Age in Waterville
According to the labor force statistics for Waterville, out of the total population over 16 years of age (12,944), 56.0% or 7,249 individuals are in the labor force, with 4.5% or 326 of them unemployed. The age group with the highest labor force participation rate is 30 to 34 years, with 90.9% or 824 individuals in the labor force. Within the labor force, the 16 to 19 years age range has the highest percentage of unemployed individuals, with 9.5% or 63 of them being unemployed.
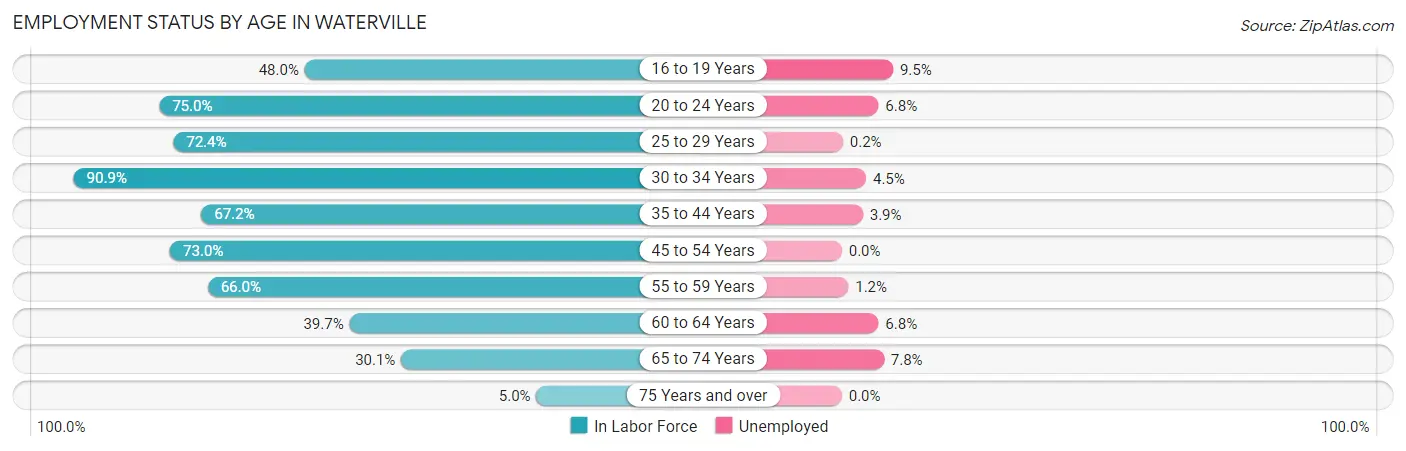
| Age Bracket | In Labor Force | Unemployed |
| 16 to 19 Years | 662 (48.0%) | 63 (9.5%) |
| 20 to 24 Years | 1,475 (75.0%) | 100 (6.8%) |
| 25 to 29 Years | 541 (72.4%) | 1 (0.2%) |
| 30 to 34 Years | 824 (90.9%) | 37 (4.5%) |
| 35 to 44 Years | 1,208 (67.2%) | 47 (3.9%) |
| 45 to 54 Years | 812 (73.0%) | 0 (0.0%) |
| 55 to 59 Years | 760 (66.0%) | 9 (1.2%) |
| 60 to 64 Years | 426 (39.7%) | 29 (6.8%) |
| 65 to 74 Years | 475 (30.1%) | 37 (7.8%) |
| 75 Years and over | 62 (5.0%) | 0 (0.0%) |
| Total | 7,249 (56.0%) | 326 (4.5%) |
Employment Status by Educational Attainment in Waterville
According to labor force statistics for Waterville, 67.3% of individuals (4,568) out of the total population between 25 and 64 years of age (6,788) are in the labor force, with 2.7% or 123 of them being unemployed. The group with the highest labor force participation rate are those with the educational attainment of bachelor's degree or higher, with 87.1% or 1,984 individuals in the labor force. Within the labor force, individuals with less than high school education have the highest percentage of unemployment, with 10.6% or 18 of them being unemployed.
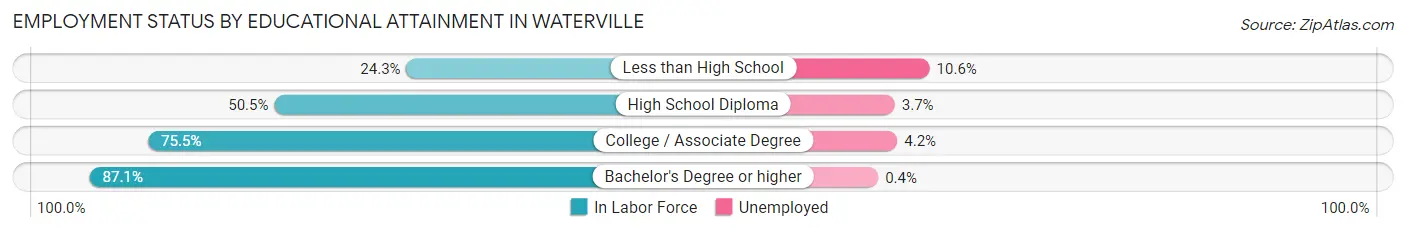
| Educational Attainment | In Labor Force | Unemployed |
| Less than High School | 170 (24.3%) | 74 (10.6%) |
| High School Diploma | 928 (50.5%) | 68 (3.7%) |
| College / Associate Degree | 1,490 (75.5%) | 83 (4.2%) |
| Bachelor's Degree or higher | 1,984 (87.1%) | 9 (0.4%) |
| Total | 4,568 (67.3%) | 183 (2.7%) |
Employment Occupations by Sex in Waterville
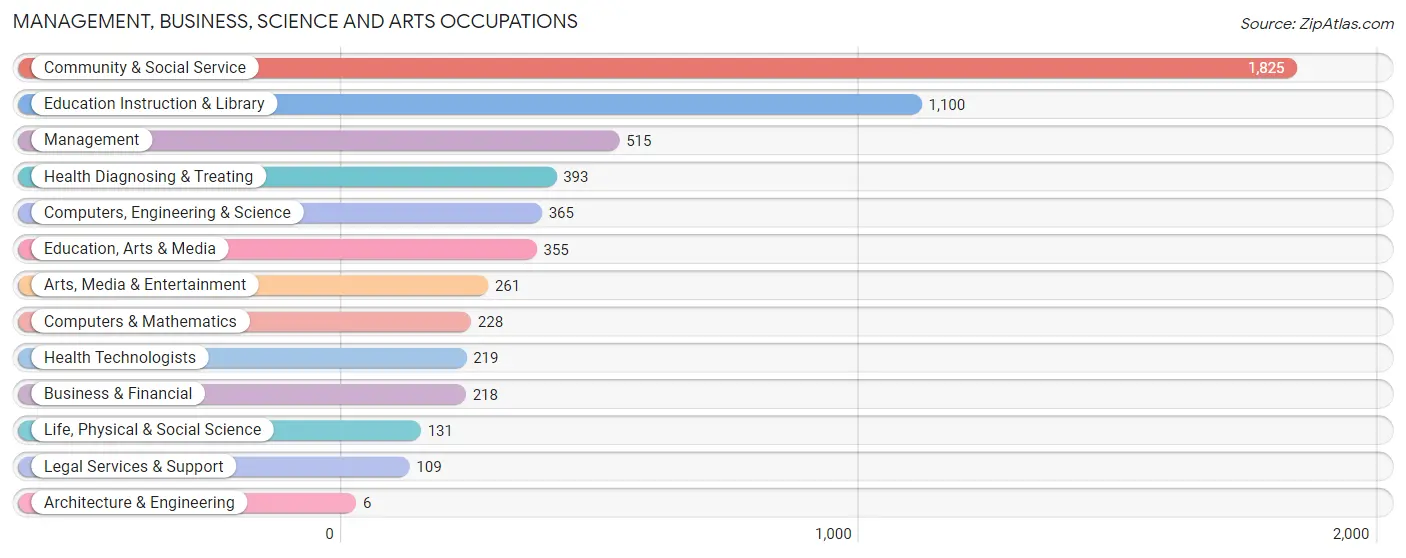
Management, Business, Science and Arts Occupations
The most common Management, Business, Science and Arts occupations in Waterville are Community & Social Service (1,825 | 26.4%), Education Instruction & Library (1,100 | 15.9%), Management (515 | 7.4%), Health Diagnosing & Treating (393 | 5.7%), and Computers, Engineering & Science (365 | 5.3%).
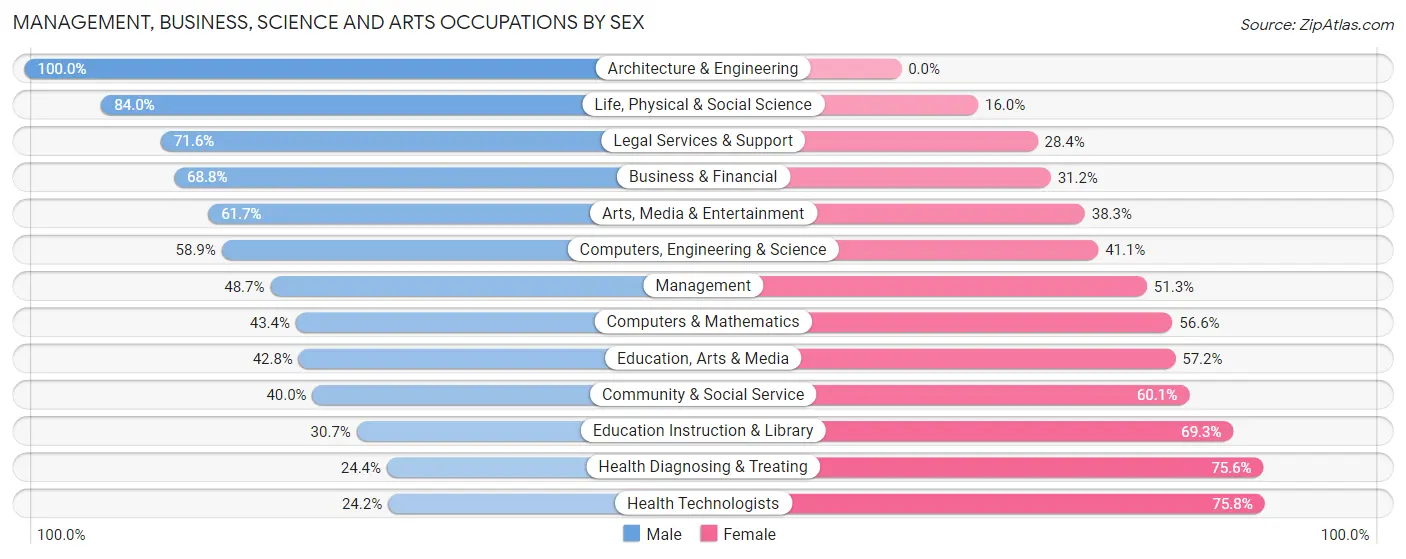
Management, Business, Science and Arts Occupations by Sex
Within the Management, Business, Science and Arts occupations in Waterville, the most male-oriented occupations are Architecture & Engineering (100.0%), Life, Physical & Social Science (84.0%), and Legal Services & Support (71.6%), while the most female-oriented occupations are Health Technologists (75.8%), Health Diagnosing & Treating (75.6%), and Education Instruction & Library (69.3%).
| Occupation | Male | Female |
| Management | 251 (48.7%) | 264 (51.3%) |
| Business & Financial | 150 (68.8%) | 68 (31.2%) |
| Computers, Engineering & Science | 215 (58.9%) | 150 (41.1%) |
| Computers & Mathematics | 99 (43.4%) | 129 (56.6%) |
| Architecture & Engineering | 6 (100.0%) | 0 (0.0%) |
| Life, Physical & Social Science | 110 (84.0%) | 21 (16.0%) |
| Community & Social Service | 729 (40.0%) | 1,096 (60.1%) |
| Education, Arts & Media | 152 (42.8%) | 203 (57.2%) |
| Legal Services & Support | 78 (71.6%) | 31 (28.4%) |
| Education Instruction & Library | 338 (30.7%) | 762 (69.3%) |
| Arts, Media & Entertainment | 161 (61.7%) | 100 (38.3%) |
| Health Diagnosing & Treating | 96 (24.4%) | 297 (75.6%) |
| Health Technologists | 53 (24.2%) | 166 (75.8%) |
| Total (Category) | 1,441 (43.5%) | 1,875 (56.5%) |
| Total (Overall) | 3,303 (47.7%) | 3,619 (52.3%) |
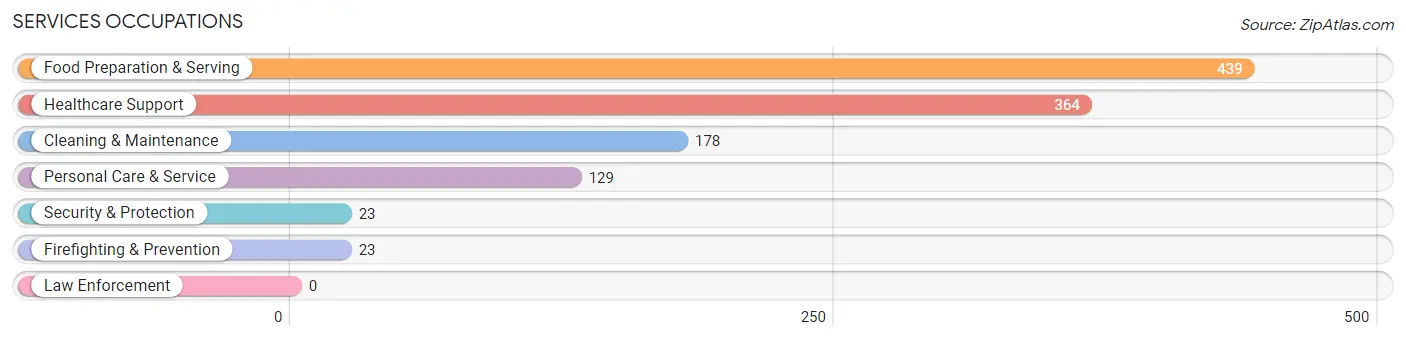
Services Occupations
The most common Services occupations in Waterville are Food Preparation & Serving (439 | 6.3%), Healthcare Support (364 | 5.3%), Cleaning & Maintenance (178 | 2.6%), Personal Care & Service (129 | 1.9%), and Security & Protection (23 | 0.3%).
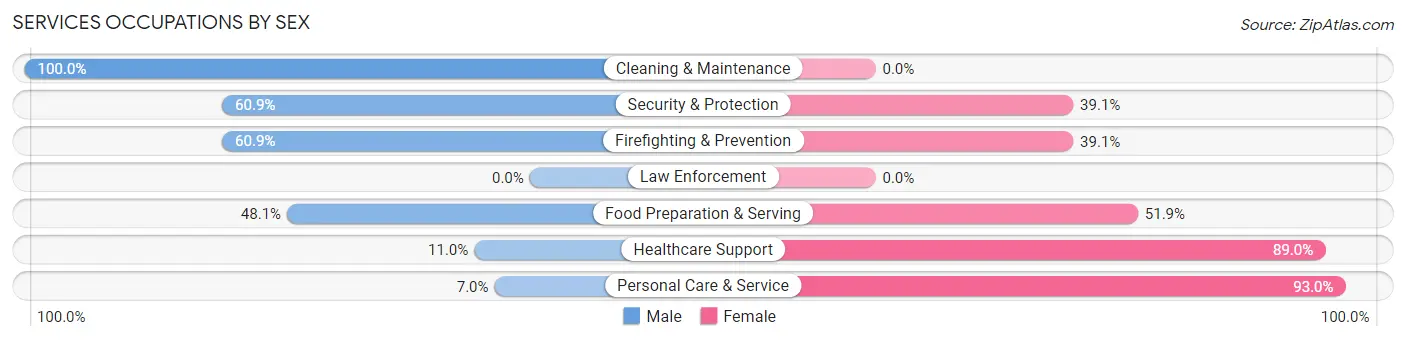
Services Occupations by Sex
Within the Services occupations in Waterville, the most male-oriented occupations are Cleaning & Maintenance (100.0%), Security & Protection (60.9%), and Firefighting & Prevention (60.9%), while the most female-oriented occupations are Personal Care & Service (93.0%), Healthcare Support (89.0%), and Food Preparation & Serving (51.9%).
| Occupation | Male | Female |
| Healthcare Support | 40 (11.0%) | 324 (89.0%) |
| Security & Protection | 14 (60.9%) | 9 (39.1%) |
| Firefighting & Prevention | 14 (60.9%) | 9 (39.1%) |
| Law Enforcement | 0 (0.0%) | 0 (0.0%) |
| Food Preparation & Serving | 211 (48.1%) | 228 (51.9%) |
| Cleaning & Maintenance | 178 (100.0%) | 0 (0.0%) |
| Personal Care & Service | 9 (7.0%) | 120 (93.0%) |
| Total (Category) | 452 (39.9%) | 681 (60.1%) |
| Total (Overall) | 3,303 (47.7%) | 3,619 (52.3%) |
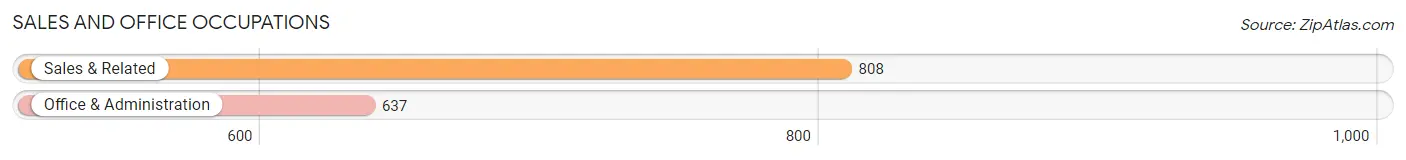
Sales and Office Occupations
The most common Sales and Office occupations in Waterville are Sales & Related (808 | 11.7%), and Office & Administration (637 | 9.2%).
Sales and Office Occupations by Sex
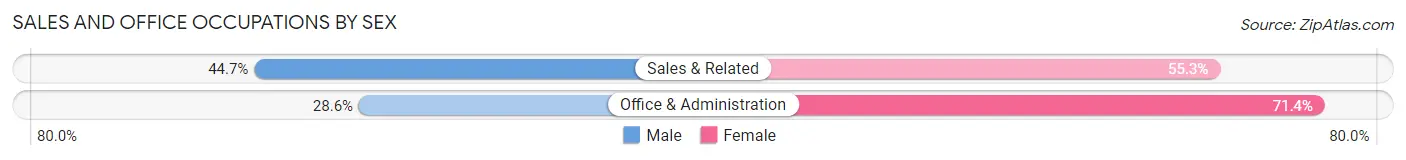
| Occupation | Male | Female |
| Sales & Related | 361 (44.7%) | 447 (55.3%) |
| Office & Administration | 182 (28.6%) | 455 (71.4%) |
| Total (Category) | 543 (37.6%) | 902 (62.4%) |
| Total (Overall) | 3,303 (47.7%) | 3,619 (52.3%) |
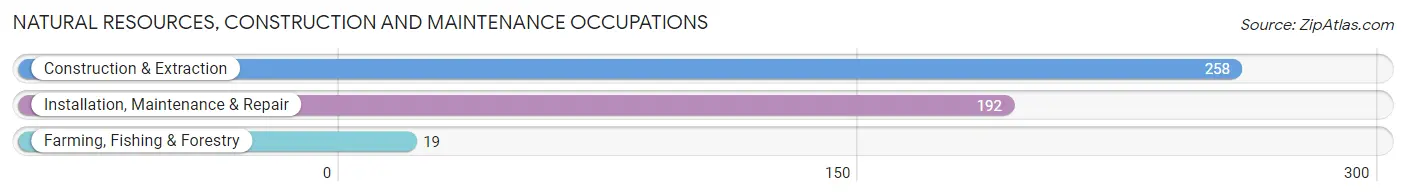
Natural Resources, Construction and Maintenance Occupations
The most common Natural Resources, Construction and Maintenance occupations in Waterville are Construction & Extraction (258 | 3.7%), Installation, Maintenance & Repair (192 | 2.8%), and Farming, Fishing & Forestry (19 | 0.3%).
Natural Resources, Construction and Maintenance Occupations by Sex
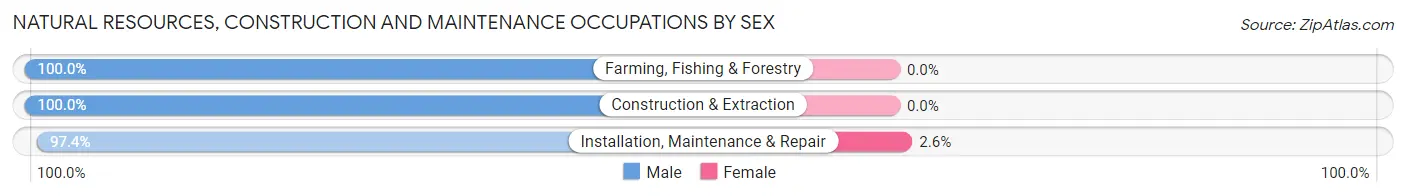
| Occupation | Male | Female |
| Farming, Fishing & Forestry | 19 (100.0%) | 0 (0.0%) |
| Construction & Extraction | 258 (100.0%) | 0 (0.0%) |
| Installation, Maintenance & Repair | 187 (97.4%) | 5 (2.6%) |
| Total (Category) | 464 (98.9%) | 5 (1.1%) |
| Total (Overall) | 3,303 (47.7%) | 3,619 (52.3%) |
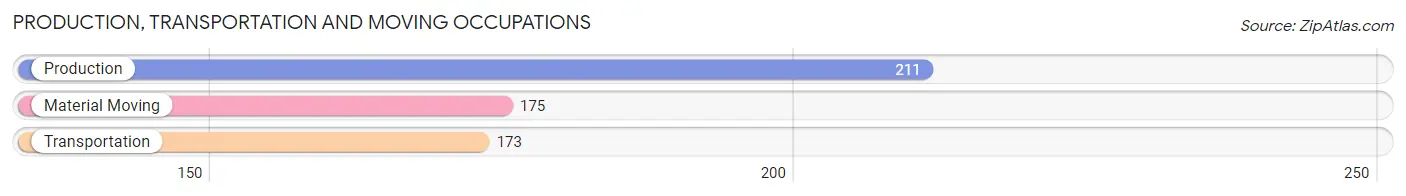
Production, Transportation and Moving Occupations
The most common Production, Transportation and Moving occupations in Waterville are Production (211 | 3.0%), Material Moving (175 | 2.5%), and Transportation (173 | 2.5%).
Production, Transportation and Moving Occupations by Sex
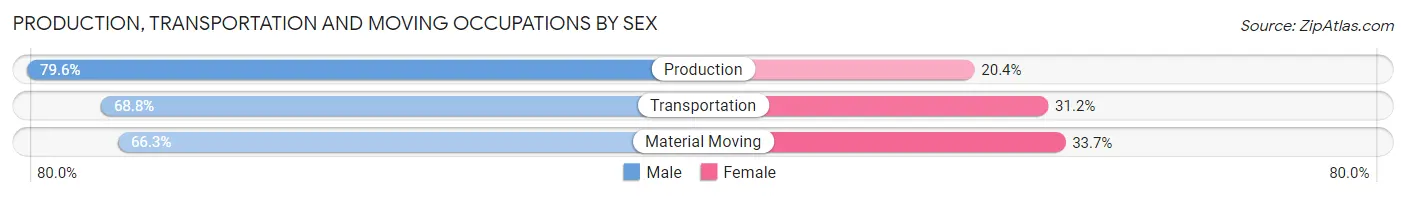
| Occupation | Male | Female |
| Production | 168 (79.6%) | 43 (20.4%) |
| Transportation | 119 (68.8%) | 54 (31.2%) |
| Material Moving | 116 (66.3%) | 59 (33.7%) |
| Total (Category) | 403 (72.1%) | 156 (27.9%) |
| Total (Overall) | 3,303 (47.7%) | 3,619 (52.3%) |
Employment Industries by Sex in Waterville
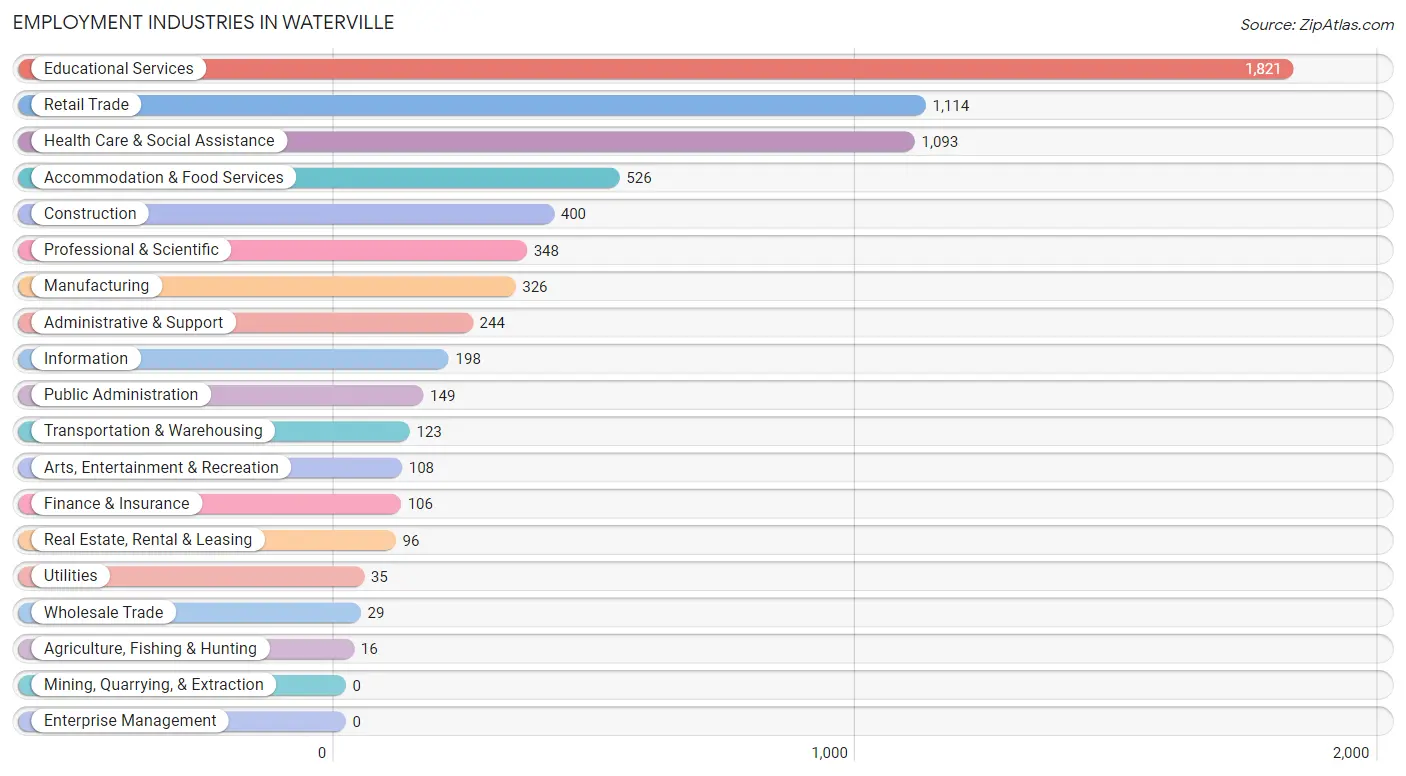
Employment Industries in Waterville
The major employment industries in Waterville include Educational Services (1,821 | 26.3%), Retail Trade (1,114 | 16.1%), Health Care & Social Assistance (1,093 | 15.8%), Accommodation & Food Services (526 | 7.6%), and Construction (400 | 5.8%).
Employment Industries by Sex in Waterville
The Waterville industries that see more men than women are Agriculture, Fishing & Hunting (100.0%), Utilities (100.0%), and Construction (94.8%), whereas the industries that tend to have a higher number of women are Wholesale Trade (100.0%), Finance & Insurance (83.0%), and Health Care & Social Assistance (77.2%).
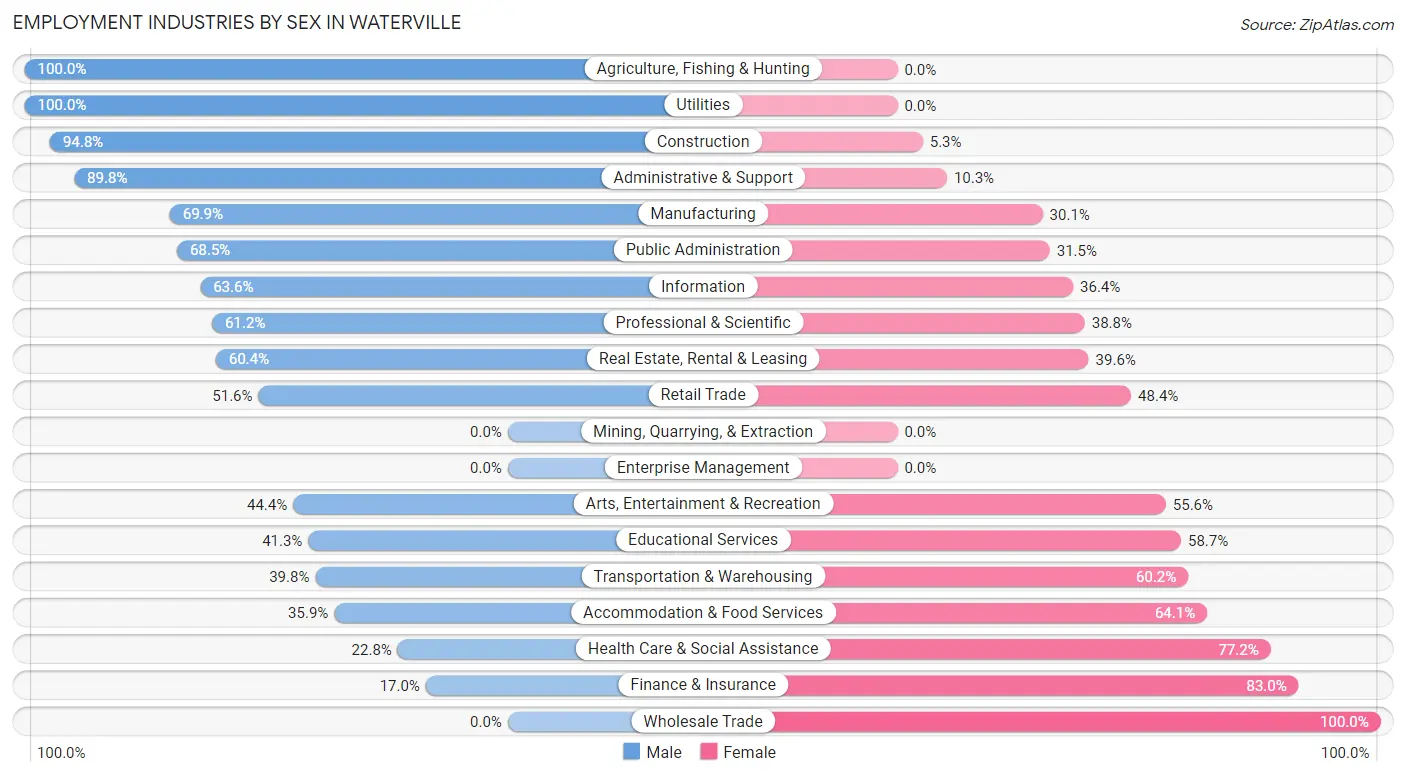
| Industry | Male | Female |
| Agriculture, Fishing & Hunting | 16 (100.0%) | 0 (0.0%) |
| Mining, Quarrying, & Extraction | 0 (0.0%) | 0 (0.0%) |
| Construction | 379 (94.8%) | 21 (5.2%) |
| Manufacturing | 228 (69.9%) | 98 (30.1%) |
| Wholesale Trade | 0 (0.0%) | 29 (100.0%) |
| Retail Trade | 575 (51.6%) | 539 (48.4%) |
| Transportation & Warehousing | 49 (39.8%) | 74 (60.2%) |
| Utilities | 35 (100.0%) | 0 (0.0%) |
| Information | 126 (63.6%) | 72 (36.4%) |
| Finance & Insurance | 18 (17.0%) | 88 (83.0%) |
| Real Estate, Rental & Leasing | 58 (60.4%) | 38 (39.6%) |
| Professional & Scientific | 213 (61.2%) | 135 (38.8%) |
| Enterprise Management | 0 (0.0%) | 0 (0.0%) |
| Administrative & Support | 219 (89.7%) | 25 (10.2%) |
| Educational Services | 752 (41.3%) | 1,069 (58.7%) |
| Health Care & Social Assistance | 249 (22.8%) | 844 (77.2%) |
| Arts, Entertainment & Recreation | 48 (44.4%) | 60 (55.6%) |
| Accommodation & Food Services | 189 (35.9%) | 337 (64.1%) |
| Public Administration | 102 (68.5%) | 47 (31.5%) |
| Total | 3,303 (47.7%) | 3,619 (52.3%) |
Education in Waterville
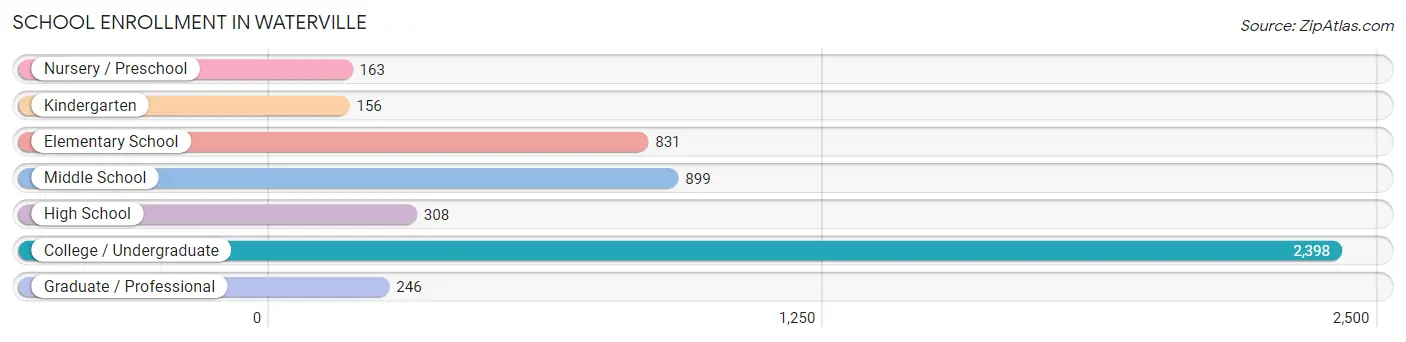
School Enrollment in Waterville
The most common levels of schooling among the 5,001 students in Waterville are college / undergraduate (2,398 | 47.9%), middle school (899 | 18.0%), and elementary school (831 | 16.6%).
| School Level | # Students | % Students |
| Nursery / Preschool | 163 | 3.3% |
| Kindergarten | 156 | 3.1% |
| Elementary School | 831 | 16.6% |
| Middle School | 899 | 18.0% |
| High School | 308 | 6.2% |
| College / Undergraduate | 2,398 | 47.9% |
| Graduate / Professional | 246 | 4.9% |
| Total | 5,001 | 100.0% |
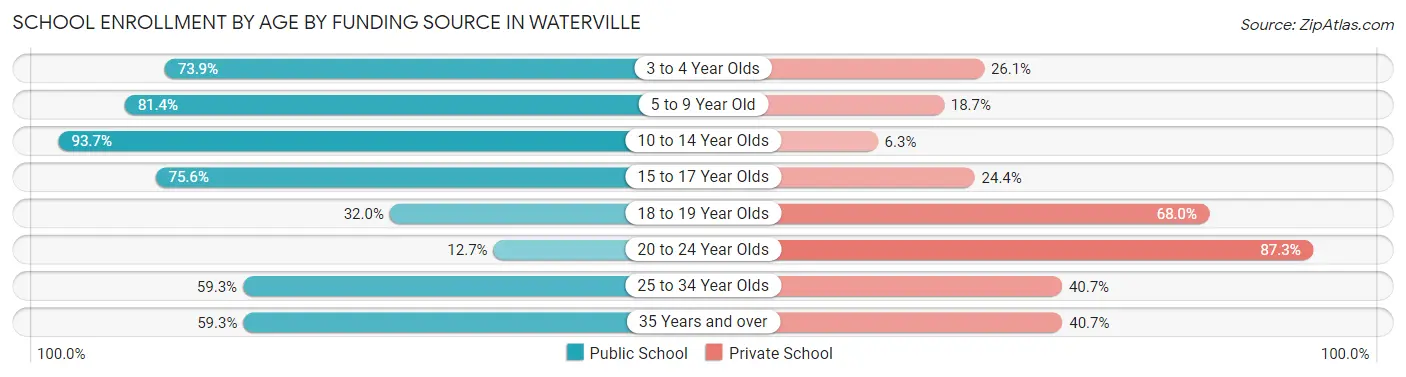
School Enrollment by Age by Funding Source in Waterville
Out of a total of 5,001 students who are enrolled in schools in Waterville, 2,230 (44.6%) attend a private institution, while the remaining 2,771 (55.4%) are enrolled in public schools. The age group of 20 to 24 year olds has the highest likelihood of being enrolled in private schools, with 1,019 (87.3% in the age bracket) enrolled. Conversely, the age group of 10 to 14 year olds has the lowest likelihood of being enrolled in a private school, with 991 (93.7% in the age bracket) attending a public institution.
| Age Bracket | Public School | Private School |
| 3 to 4 Year Olds | 82 (73.9%) | 29 (26.1%) |
| 5 to 9 Year Old | 759 (81.4%) | 174 (18.6%) |
| 10 to 14 Year Olds | 991 (93.7%) | 67 (6.3%) |
| 15 to 17 Year Olds | 186 (75.6%) | 60 (24.4%) |
| 18 to 19 Year Olds | 326 (32.0%) | 693 (68.0%) |
| 20 to 24 Year Olds | 148 (12.7%) | 1,019 (87.3%) |
| 25 to 34 Year Olds | 162 (59.3%) | 111 (40.7%) |
| 35 Years and over | 115 (59.3%) | 79 (40.7%) |
| Total | 2,771 (55.4%) | 2,230 (44.6%) |
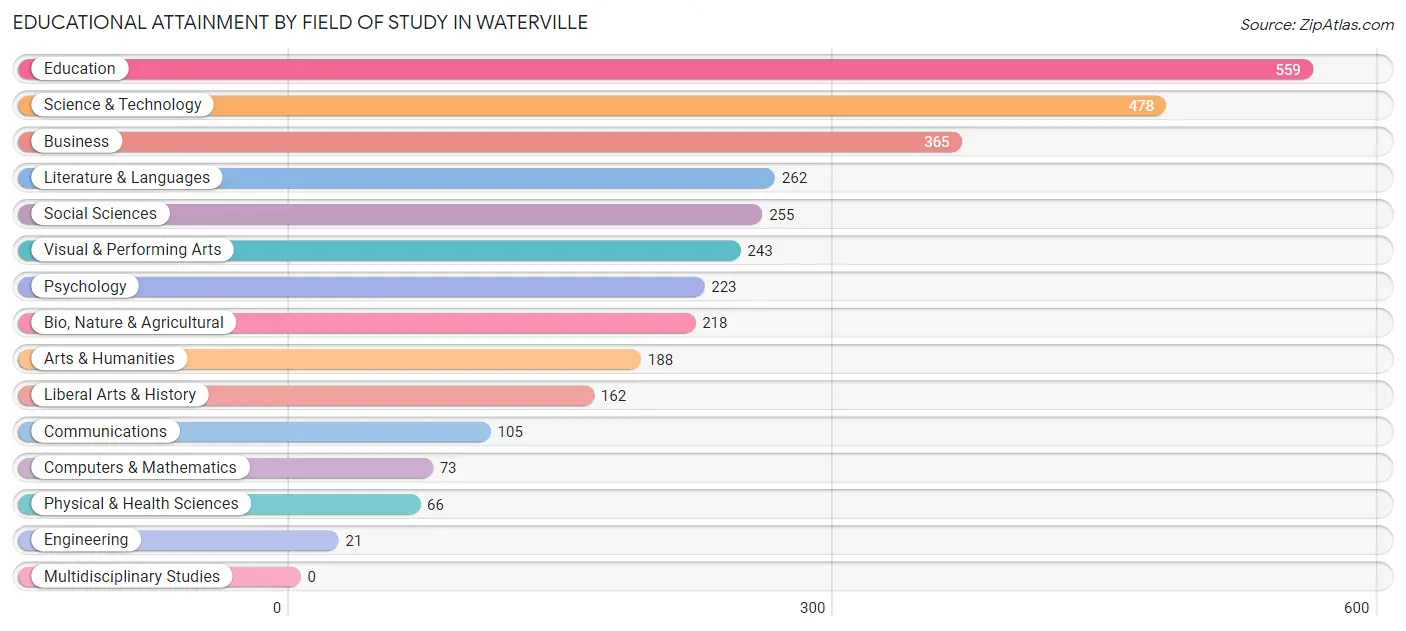
Educational Attainment by Field of Study in Waterville
Education (559 | 17.4%), science & technology (478 | 14.8%), business (365 | 11.3%), literature & languages (262 | 8.1%), and social sciences (255 | 7.9%) are the most common fields of study among 3,218 individuals in Waterville who have obtained a bachelor's degree or higher.
| Field of Study | # Graduates | % Graduates |
| Computers & Mathematics | 73 | 2.3% |
| Bio, Nature & Agricultural | 218 | 6.8% |
| Physical & Health Sciences | 66 | 2.1% |
| Psychology | 223 | 6.9% |
| Social Sciences | 255 | 7.9% |
| Engineering | 21 | 0.6% |
| Multidisciplinary Studies | 0 | 0.0% |
| Science & Technology | 478 | 14.8% |
| Business | 365 | 11.3% |
| Education | 559 | 17.4% |
| Literature & Languages | 262 | 8.1% |
| Liberal Arts & History | 162 | 5.0% |
| Visual & Performing Arts | 243 | 7.5% |
| Communications | 105 | 3.3% |
| Arts & Humanities | 188 | 5.8% |
| Total | 3,218 | 100.0% |
Transportation & Commute in Waterville
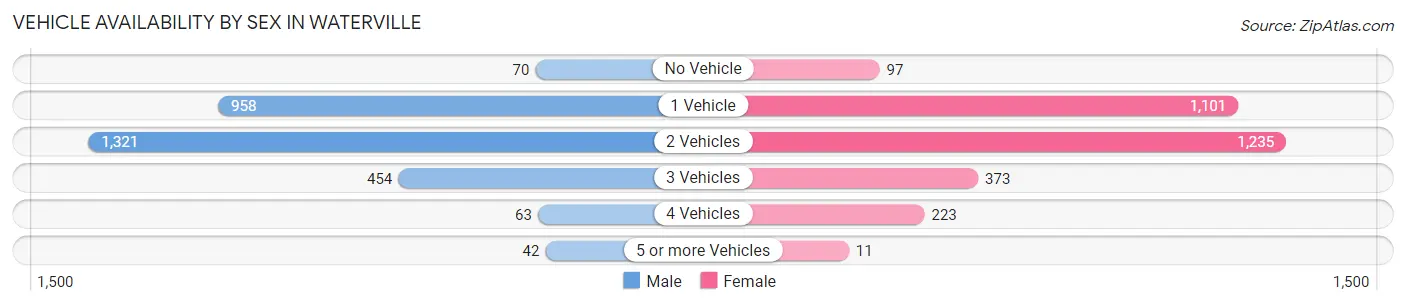
Vehicle Availability by Sex in Waterville
The most prevalent vehicle ownership categories in Waterville are males with 2 vehicles (1,321, accounting for 45.4%) and females with 2 vehicles (1,235, making up 43.4%).
| Vehicles Available | Male | Female |
| No Vehicle | 70 (2.4%) | 97 (3.2%) |
| 1 Vehicle | 958 (32.9%) | 1,101 (36.2%) |
| 2 Vehicles | 1,321 (45.4%) | 1,235 (40.6%) |
| 3 Vehicles | 454 (15.6%) | 373 (12.3%) |
| 4 Vehicles | 63 (2.2%) | 223 (7.3%) |
| 5 or more Vehicles | 42 (1.4%) | 11 (0.4%) |
| Total | 2,908 (100.0%) | 3,040 (100.0%) |
Commute Time in Waterville
The most frequently occuring commute durations in Waterville are 5 to 9 minutes (1,816 commuters, 30.8%), 10 to 14 minutes (1,294 commuters, 21.9%), and 15 to 19 minutes (542 commuters, 9.2%).
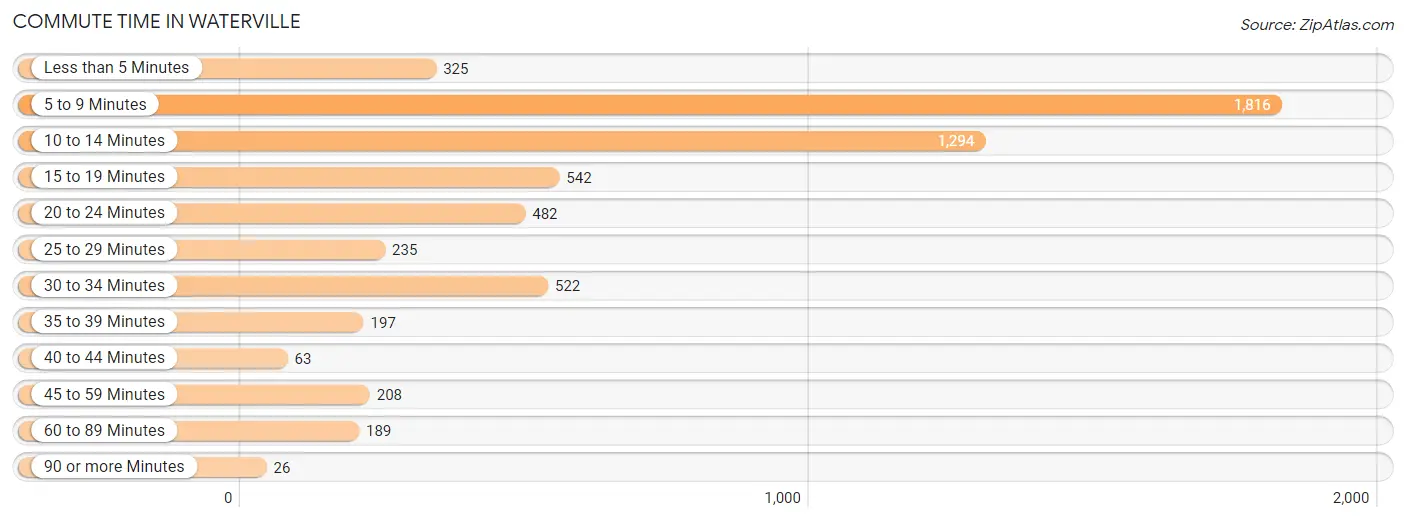
| Commute Time | # Commuters | % Commuters |
| Less than 5 Minutes | 325 | 5.5% |
| 5 to 9 Minutes | 1,816 | 30.8% |
| 10 to 14 Minutes | 1,294 | 21.9% |
| 15 to 19 Minutes | 542 | 9.2% |
| 20 to 24 Minutes | 482 | 8.2% |
| 25 to 29 Minutes | 235 | 4.0% |
| 30 to 34 Minutes | 522 | 8.8% |
| 35 to 39 Minutes | 197 | 3.3% |
| 40 to 44 Minutes | 63 | 1.1% |
| 45 to 59 Minutes | 208 | 3.5% |
| 60 to 89 Minutes | 189 | 3.2% |
| 90 or more Minutes | 26 | 0.4% |
Commute Time by Sex in Waterville
The most common commute times in Waterville are 5 to 9 minutes (824 commuters, 29.6%) for males and 5 to 9 minutes (992 commuters, 31.9%) for females.
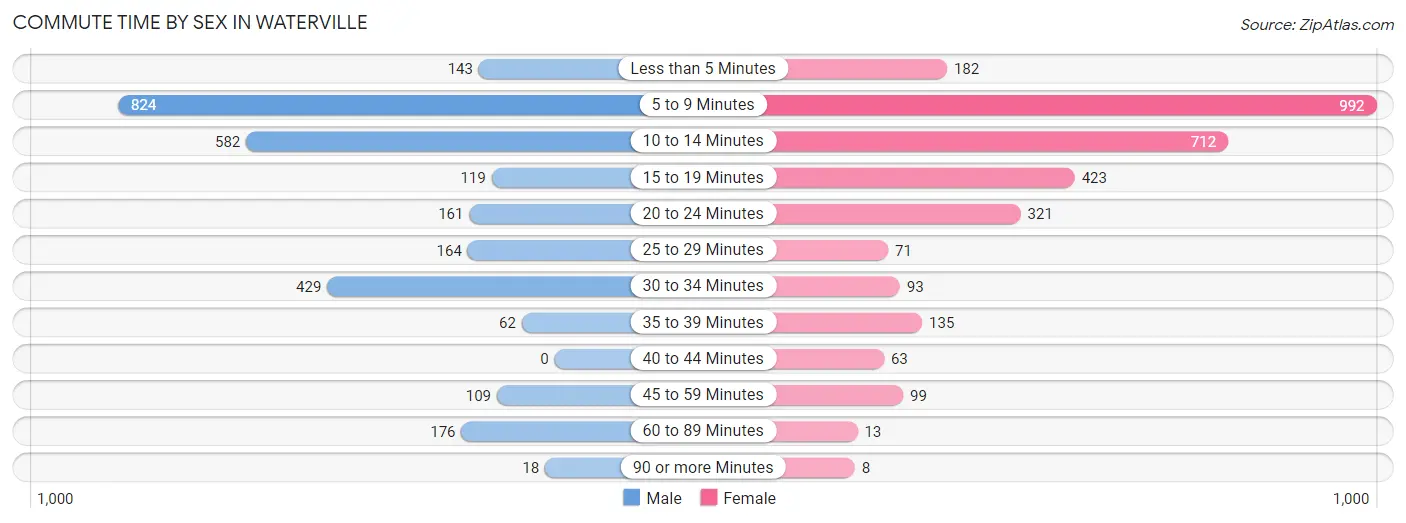
| Commute Time | Male | Female |
| Less than 5 Minutes | 143 (5.1%) | 182 (5.9%) |
| 5 to 9 Minutes | 824 (29.6%) | 992 (31.9%) |
| 10 to 14 Minutes | 582 (20.9%) | 712 (22.9%) |
| 15 to 19 Minutes | 119 (4.3%) | 423 (13.6%) |
| 20 to 24 Minutes | 161 (5.8%) | 321 (10.3%) |
| 25 to 29 Minutes | 164 (5.9%) | 71 (2.3%) |
| 30 to 34 Minutes | 429 (15.4%) | 93 (3.0%) |
| 35 to 39 Minutes | 62 (2.2%) | 135 (4.3%) |
| 40 to 44 Minutes | 0 (0.0%) | 63 (2.0%) |
| 45 to 59 Minutes | 109 (3.9%) | 99 (3.2%) |
| 60 to 89 Minutes | 176 (6.3%) | 13 (0.4%) |
| 90 or more Minutes | 18 (0.6%) | 8 (0.3%) |
Time of Departure to Work by Sex in Waterville
The most frequent times of departure to work in Waterville are 12:00 PM to 3:59 PM (364, 13.1%) for males and 6:30 AM to 6:59 AM (458, 14.7%) for females.
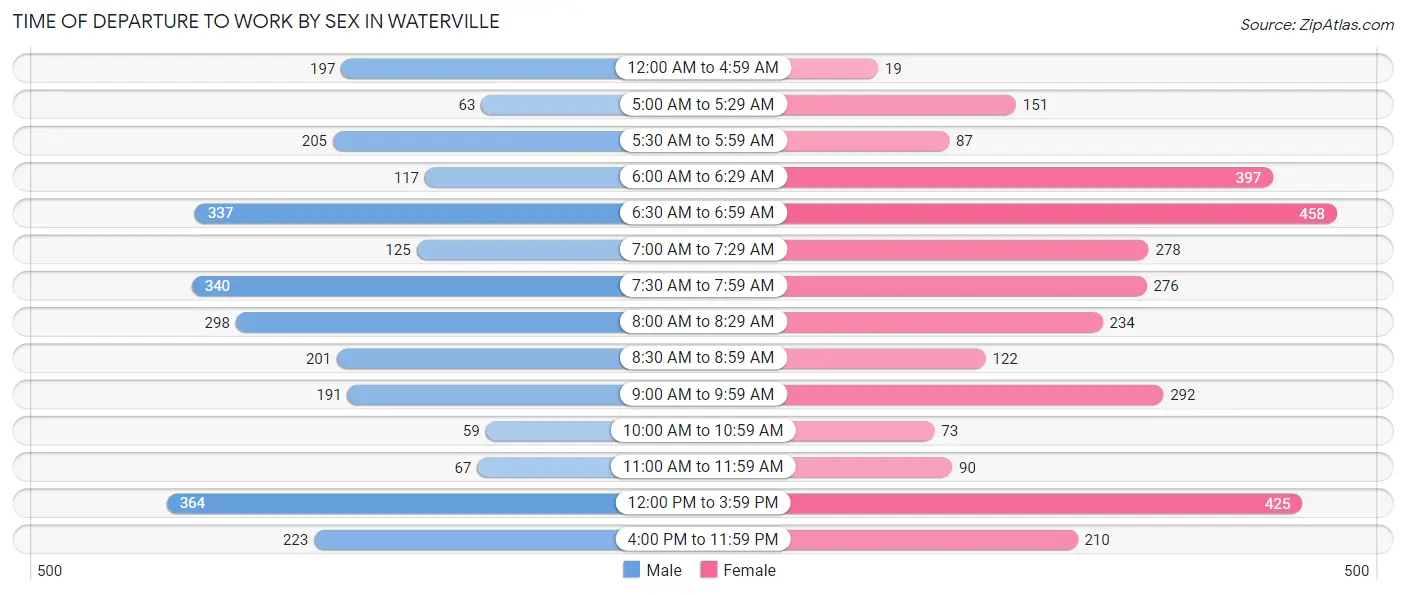
| Time of Departure | Male | Female |
| 12:00 AM to 4:59 AM | 197 (7.1%) | 19 (0.6%) |
| 5:00 AM to 5:29 AM | 63 (2.3%) | 151 (4.9%) |
| 5:30 AM to 5:59 AM | 205 (7.4%) | 87 (2.8%) |
| 6:00 AM to 6:29 AM | 117 (4.2%) | 397 (12.8%) |
| 6:30 AM to 6:59 AM | 337 (12.1%) | 458 (14.7%) |
| 7:00 AM to 7:29 AM | 125 (4.5%) | 278 (8.9%) |
| 7:30 AM to 7:59 AM | 340 (12.2%) | 276 (8.9%) |
| 8:00 AM to 8:29 AM | 298 (10.7%) | 234 (7.5%) |
| 8:30 AM to 8:59 AM | 201 (7.2%) | 122 (3.9%) |
| 9:00 AM to 9:59 AM | 191 (6.9%) | 292 (9.4%) |
| 10:00 AM to 10:59 AM | 59 (2.1%) | 73 (2.4%) |
| 11:00 AM to 11:59 AM | 67 (2.4%) | 90 (2.9%) |
| 12:00 PM to 3:59 PM | 364 (13.1%) | 425 (13.7%) |
| 4:00 PM to 11:59 PM | 223 (8.0%) | 210 (6.8%) |
| Total | 2,787 (100.0%) | 3,112 (100.0%) |
Housing Occupancy in Waterville
Occupancy by Ownership in Waterville
Of the total 6,366 dwellings in Waterville, owner-occupied units account for 2,941 (46.2%), while renter-occupied units make up 3,425 (53.8%).
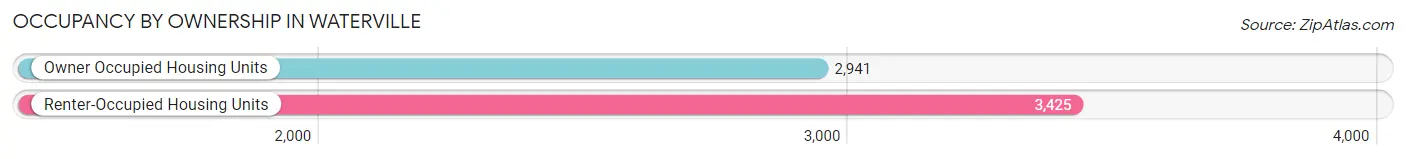
| Occupancy | # Housing Units | % Housing Units |
| Owner Occupied Housing Units | 2,941 | 46.2% |
| Renter-Occupied Housing Units | 3,425 | 53.8% |
| Total Occupied Housing Units | 6,366 | 100.0% |
Occupancy by Household Size in Waterville
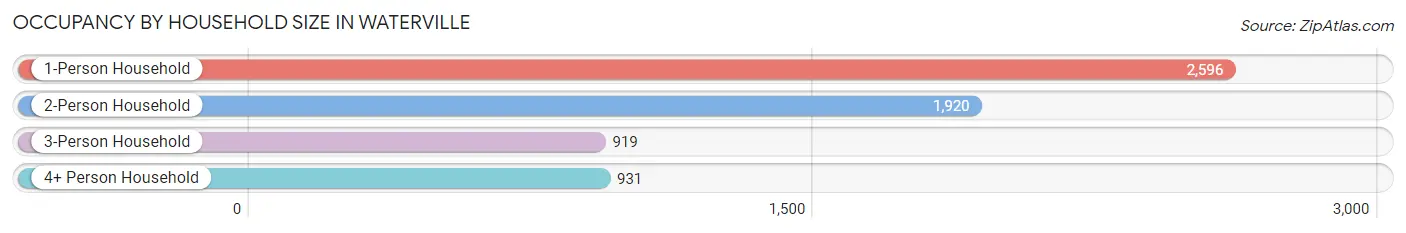
| Household Size | # Housing Units | % Housing Units |
| 1-Person Household | 2,596 | 40.8% |
| 2-Person Household | 1,920 | 30.2% |
| 3-Person Household | 919 | 14.4% |
| 4+ Person Household | 931 | 14.6% |
| Total Housing Units | 6,366 | 100.0% |
Occupancy by Ownership by Household Size in Waterville
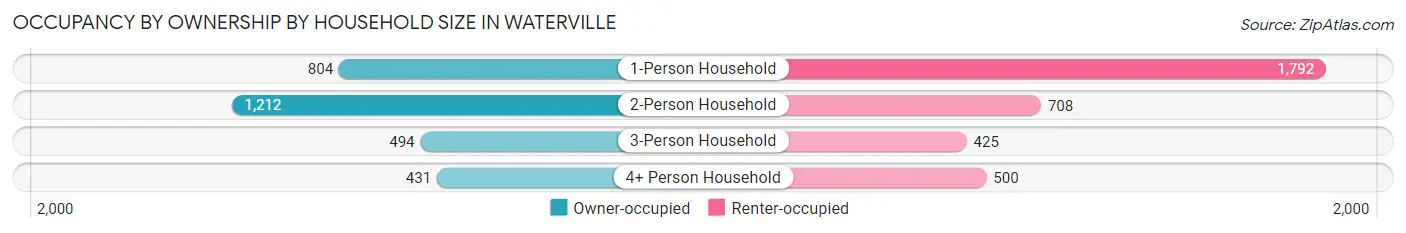
| Household Size | Owner-occupied | Renter-occupied |
| 1-Person Household | 804 (31.0%) | 1,792 (69.0%) |
| 2-Person Household | 1,212 (63.1%) | 708 (36.9%) |
| 3-Person Household | 494 (53.7%) | 425 (46.3%) |
| 4+ Person Household | 431 (46.3%) | 500 (53.7%) |
| Total Housing Units | 2,941 (46.2%) | 3,425 (53.8%) |
Occupancy by Educational Attainment in Waterville
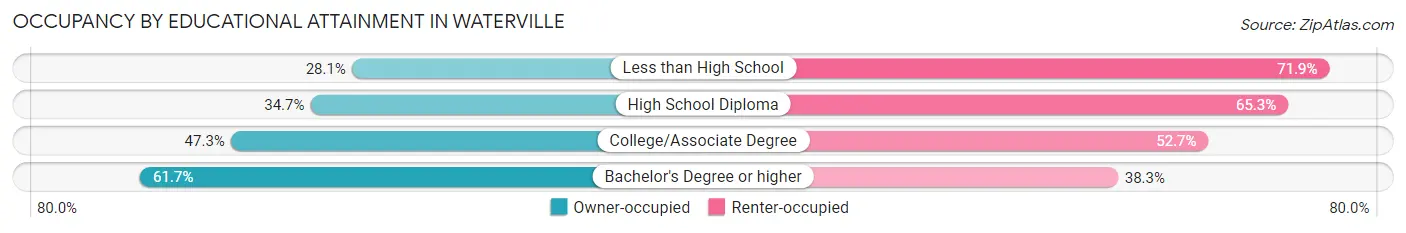
| Household Size | Owner-occupied | Renter-occupied |
| Less than High School | 180 (28.1%) | 460 (71.9%) |
| High School Diploma | 625 (34.7%) | 1,177 (65.3%) |
| College/Associate Degree | 937 (47.3%) | 1,043 (52.7%) |
| Bachelor's Degree or higher | 1,199 (61.7%) | 745 (38.3%) |
Occupancy by Age of Householder in Waterville
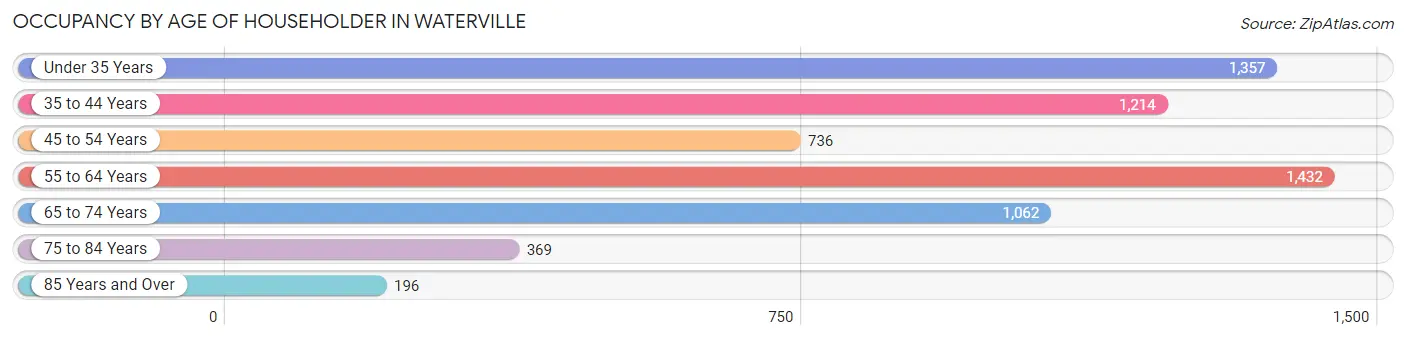
| Age Bracket | # Households | % Households |
| Under 35 Years | 1,357 | 21.3% |
| 35 to 44 Years | 1,214 | 19.1% |
| 45 to 54 Years | 736 | 11.6% |
| 55 to 64 Years | 1,432 | 22.5% |
| 65 to 74 Years | 1,062 | 16.7% |
| 75 to 84 Years | 369 | 5.8% |
| 85 Years and Over | 196 | 3.1% |
| Total | 6,366 | 100.0% |
Housing Finances in Waterville
Median Income by Occupancy in Waterville
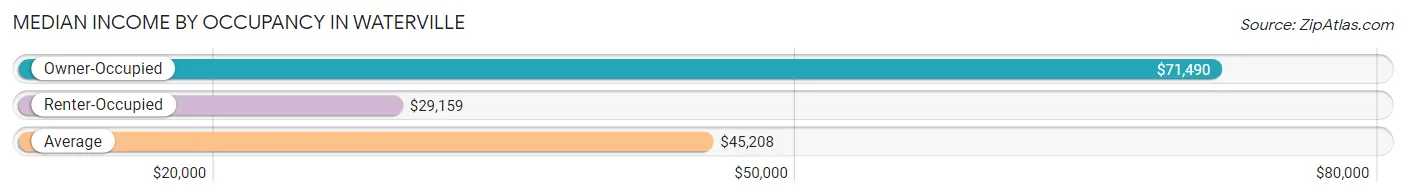
| Occupancy Type | # Households | Median Income |
| Owner-Occupied | 2,941 (46.2%) | $71,490 |
| Renter-Occupied | 3,425 (53.8%) | $29,159 |
| Average | 6,366 (100.0%) | $45,208 |
Occupancy by Householder Income Bracket in Waterville
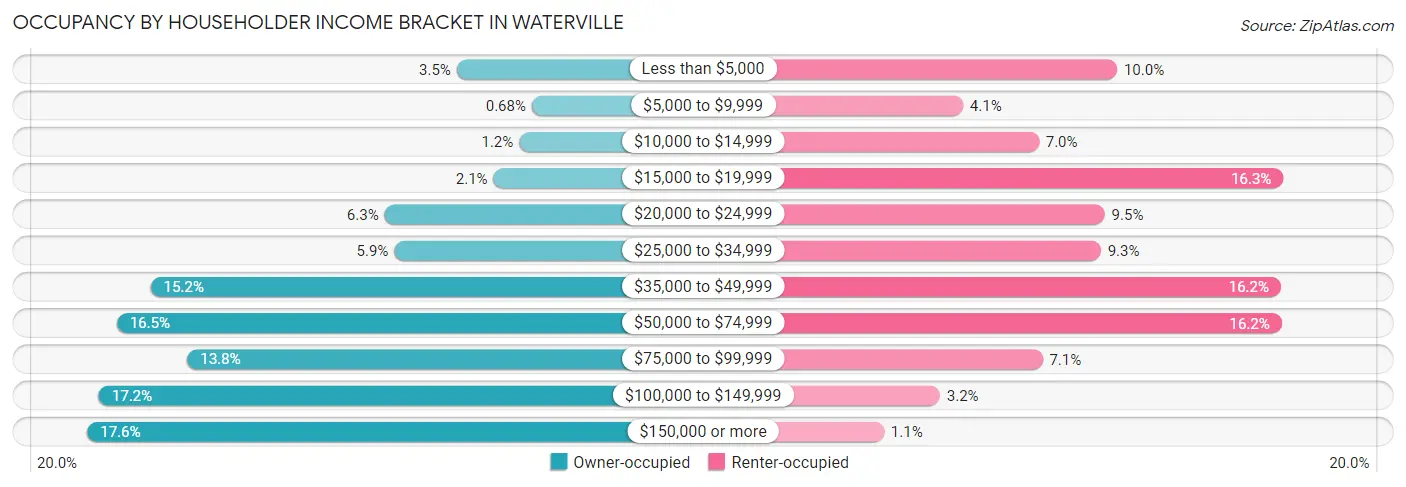
| Income Bracket | Owner-occupied | Renter-occupied |
| Less than $5,000 | 104 (3.5%) | 341 (10.0%) |
| $5,000 to $9,999 | 20 (0.7%) | 140 (4.1%) |
| $10,000 to $14,999 | 34 (1.2%) | 239 (7.0%) |
| $15,000 to $19,999 | 63 (2.1%) | 558 (16.3%) |
| $20,000 to $24,999 | 185 (6.3%) | 325 (9.5%) |
| $25,000 to $34,999 | 174 (5.9%) | 320 (9.3%) |
| $35,000 to $49,999 | 447 (15.2%) | 555 (16.2%) |
| $50,000 to $74,999 | 485 (16.5%) | 556 (16.2%) |
| $75,000 to $99,999 | 406 (13.8%) | 244 (7.1%) |
| $100,000 to $149,999 | 505 (17.2%) | 110 (3.2%) |
| $150,000 or more | 518 (17.6%) | 37 (1.1%) |
| Total | 2,941 (100.0%) | 3,425 (100.0%) |
Monthly Housing Cost Tiers in Waterville
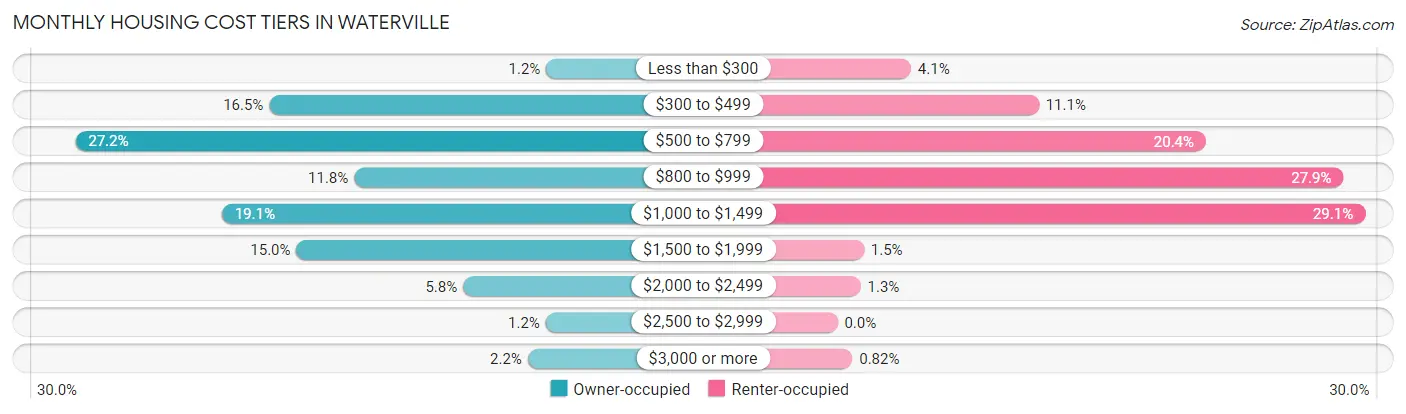
| Monthly Cost | Owner-occupied | Renter-occupied |
| Less than $300 | 35 (1.2%) | 139 (4.1%) |
| $300 to $499 | 485 (16.5%) | 381 (11.1%) |
| $500 to $799 | 800 (27.2%) | 697 (20.3%) |
| $800 to $999 | 347 (11.8%) | 957 (27.9%) |
| $1,000 to $1,499 | 562 (19.1%) | 998 (29.1%) |
| $1,500 to $1,999 | 441 (15.0%) | 50 (1.5%) |
| $2,000 to $2,499 | 170 (5.8%) | 44 (1.3%) |
| $2,500 to $2,999 | 36 (1.2%) | 0 (0.0%) |
| $3,000 or more | 65 (2.2%) | 28 (0.8%) |
| Total | 2,941 (100.0%) | 3,425 (100.0%) |
Physical Housing Characteristics in Waterville
Housing Structures in Waterville
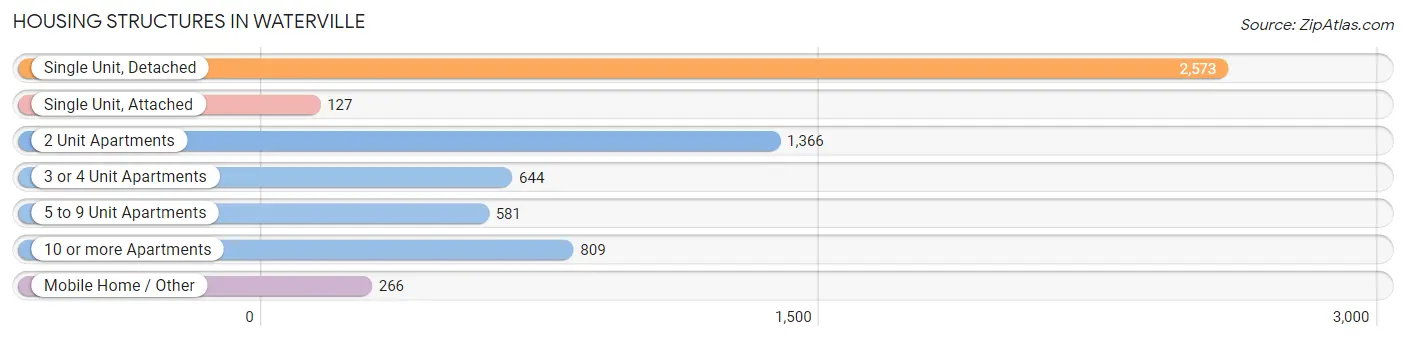
| Structure Type | # Housing Units | % Housing Units |
| Single Unit, Detached | 2,573 | 40.4% |
| Single Unit, Attached | 127 | 2.0% |
| 2 Unit Apartments | 1,366 | 21.5% |
| 3 or 4 Unit Apartments | 644 | 10.1% |
| 5 to 9 Unit Apartments | 581 | 9.1% |
| 10 or more Apartments | 809 | 12.7% |
| Mobile Home / Other | 266 | 4.2% |
| Total | 6,366 | 100.0% |
Housing Structures by Occupancy in Waterville
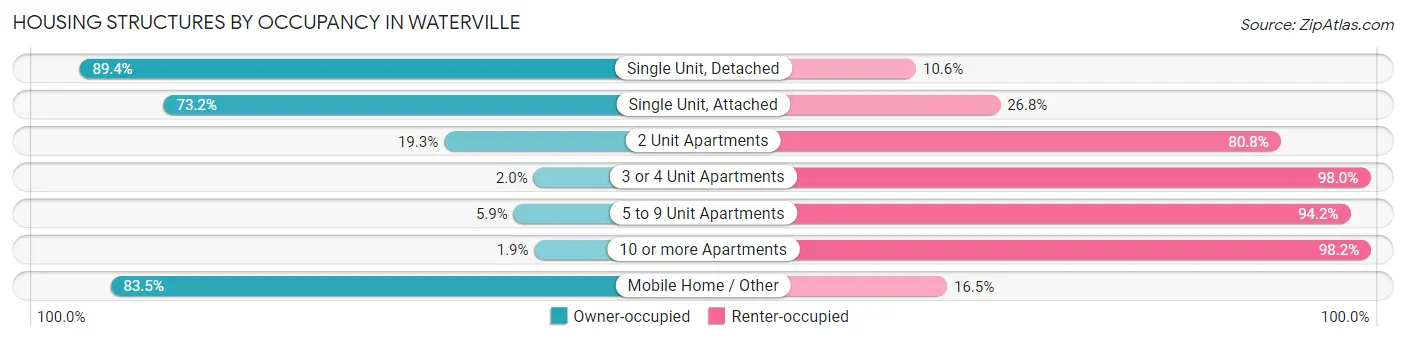
| Structure Type | Owner-occupied | Renter-occupied |
| Single Unit, Detached | 2,301 (89.4%) | 272 (10.6%) |
| Single Unit, Attached | 93 (73.2%) | 34 (26.8%) |
| 2 Unit Apartments | 263 (19.3%) | 1,103 (80.7%) |
| 3 or 4 Unit Apartments | 13 (2.0%) | 631 (98.0%) |
| 5 to 9 Unit Apartments | 34 (5.9%) | 547 (94.2%) |
| 10 or more Apartments | 15 (1.8%) | 794 (98.2%) |
| Mobile Home / Other | 222 (83.5%) | 44 (16.5%) |
| Total | 2,941 (46.2%) | 3,425 (53.8%) |
Housing Structures by Number of Rooms in Waterville
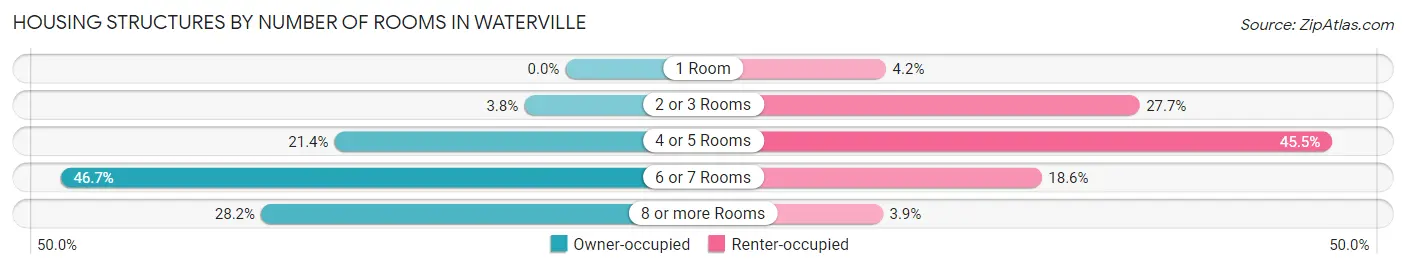
| Number of Rooms | Owner-occupied | Renter-occupied |
| 1 Room | 0 (0.0%) | 145 (4.2%) |
| 2 or 3 Rooms | 112 (3.8%) | 948 (27.7%) |
| 4 or 5 Rooms | 628 (21.3%) | 1,559 (45.5%) |
| 6 or 7 Rooms | 1,373 (46.7%) | 638 (18.6%) |
| 8 or more Rooms | 828 (28.1%) | 135 (3.9%) |
| Total | 2,941 (100.0%) | 3,425 (100.0%) |
Housing Structure by Heating Type in Waterville
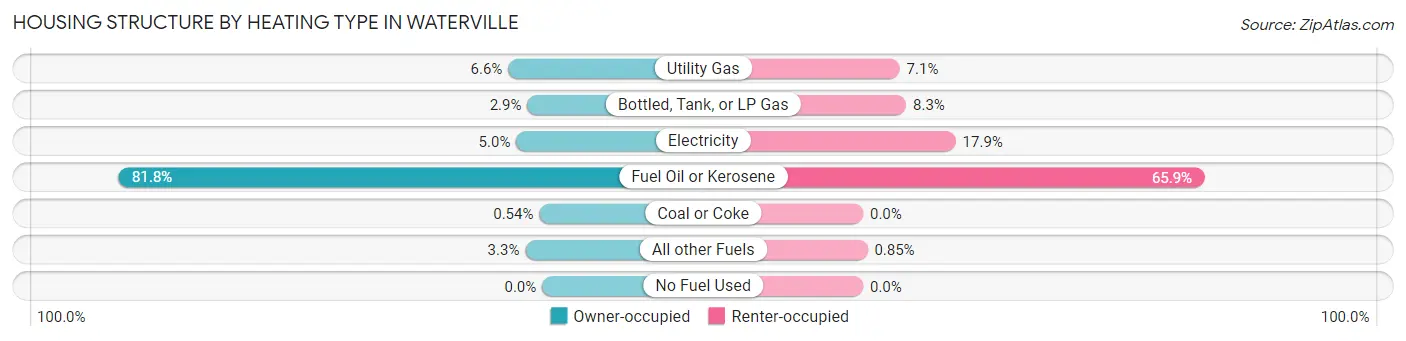
| Heating Type | Owner-occupied | Renter-occupied |
| Utility Gas | 193 (6.6%) | 242 (7.1%) |
| Bottled, Tank, or LP Gas | 84 (2.9%) | 285 (8.3%) |
| Electricity | 147 (5.0%) | 613 (17.9%) |
| Fuel Oil or Kerosene | 2,405 (81.8%) | 2,256 (65.9%) |
| Coal or Coke | 16 (0.5%) | 0 (0.0%) |
| All other Fuels | 96 (3.3%) | 29 (0.9%) |
| No Fuel Used | 0 (0.0%) | 0 (0.0%) |
| Total | 2,941 (100.0%) | 3,425 (100.0%) |
Household Vehicle Usage in Waterville
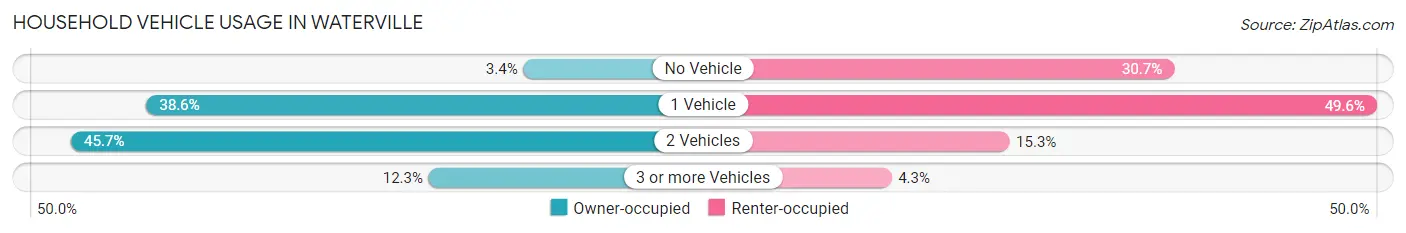
| Vehicles per Household | Owner-occupied | Renter-occupied |
| No Vehicle | 101 (3.4%) | 1,052 (30.7%) |
| 1 Vehicle | 1,136 (38.6%) | 1,700 (49.6%) |
| 2 Vehicles | 1,343 (45.7%) | 525 (15.3%) |
| 3 or more Vehicles | 361 (12.3%) | 148 (4.3%) |
| Total | 2,941 (100.0%) | 3,425 (100.0%) |
Real Estate & Mortgages in Waterville
Real Estate and Mortgage Overview in Waterville
| Characteristic | Without Mortgage | With Mortgage |
| Housing Units | 1,245 | 1,696 |
| Median Property Value | $132,700 | $177,400 |
| Median Household Income | $53,460 | $424 |
| Monthly Housing Costs | $542 | $65 |
| Real Estate Taxes | $2,087 | $37 |
Property Value by Mortgage Status in Waterville
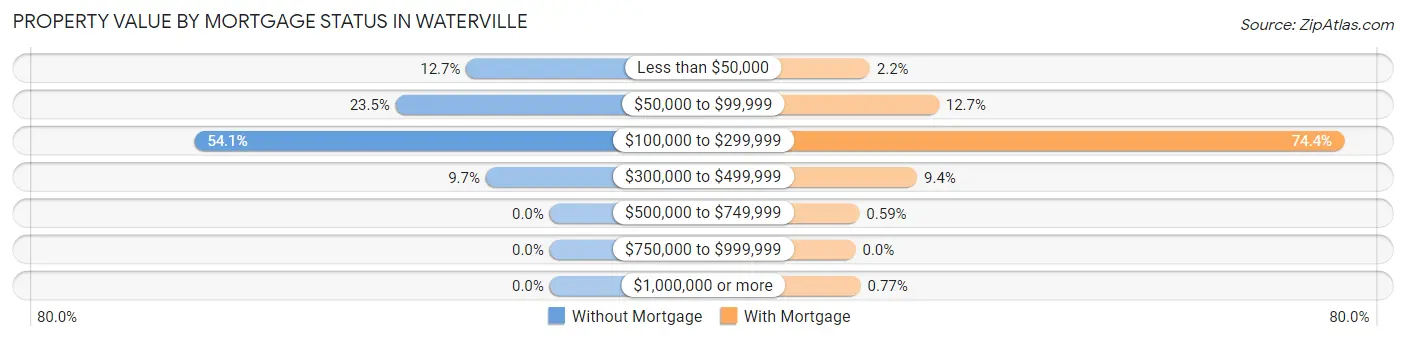
| Property Value | Without Mortgage | With Mortgage |
| Less than $50,000 | 158 (12.7%) | 37 (2.2%) |
| $50,000 to $99,999 | 292 (23.4%) | 215 (12.7%) |
| $100,000 to $299,999 | 674 (54.1%) | 1,262 (74.4%) |
| $300,000 to $499,999 | 121 (9.7%) | 159 (9.4%) |
| $500,000 to $749,999 | 0 (0.0%) | 10 (0.6%) |
| $750,000 to $999,999 | 0 (0.0%) | 0 (0.0%) |
| $1,000,000 or more | 0 (0.0%) | 13 (0.8%) |
| Total | 1,245 (100.0%) | 1,696 (100.0%) |
Household Income by Mortgage Status in Waterville
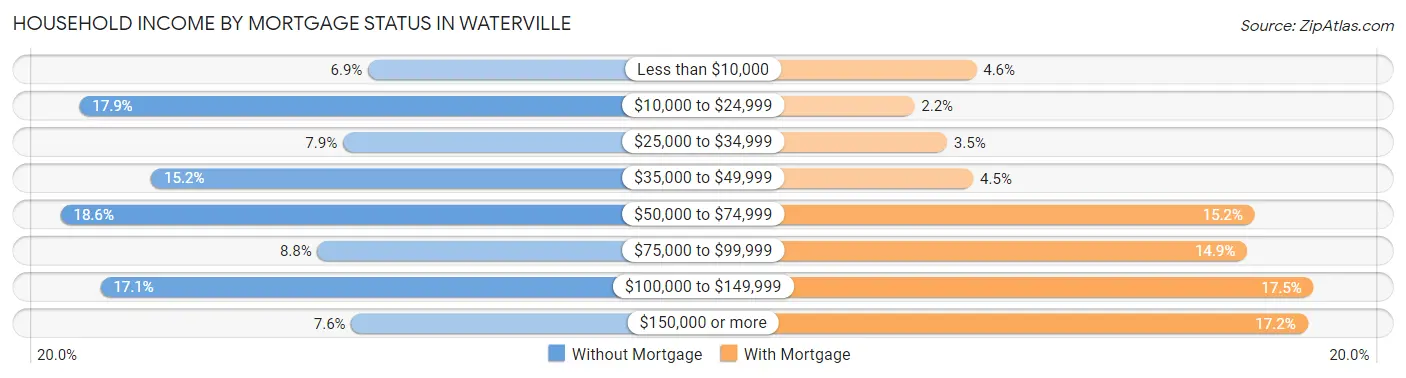
| Household Income | Without Mortgage | With Mortgage |
| Less than $10,000 | 86 (6.9%) | 78 (4.6%) |
| $10,000 to $24,999 | 223 (17.9%) | 38 (2.2%) |
| $25,000 to $34,999 | 98 (7.9%) | 59 (3.5%) |
| $35,000 to $49,999 | 189 (15.2%) | 76 (4.5%) |
| $50,000 to $74,999 | 232 (18.6%) | 258 (15.2%) |
| $75,000 to $99,999 | 110 (8.8%) | 253 (14.9%) |
| $100,000 to $149,999 | 213 (17.1%) | 296 (17.4%) |
| $150,000 or more | 94 (7.5%) | 292 (17.2%) |
| Total | 1,245 (100.0%) | 1,696 (100.0%) |
Property Value to Household Income Ratio in Waterville
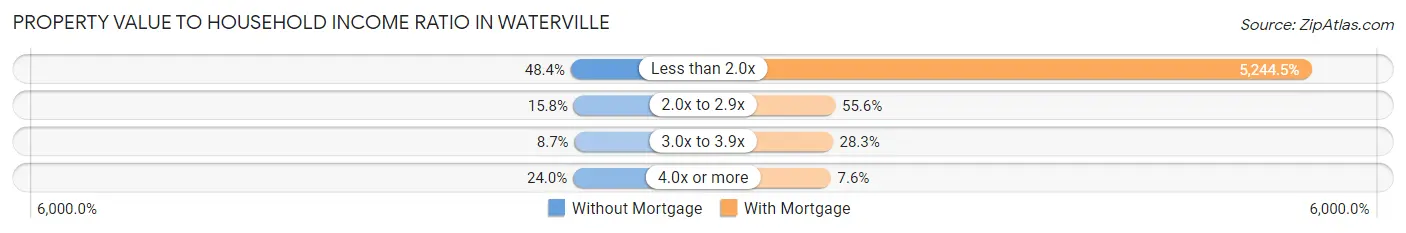
| Value-to-Income Ratio | Without Mortgage | With Mortgage |
| Less than 2.0x | 602 (48.3%) | 88,947 (5,244.5%) |
| 2.0x to 2.9x | 197 (15.8%) | 943 (55.6%) |
| 3.0x to 3.9x | 108 (8.7%) | 480 (28.3%) |
| 4.0x or more | 299 (24.0%) | 128 (7.5%) |
| Total | 1,245 (100.0%) | 1,696 (100.0%) |
Real Estate Taxes by Mortgage Status in Waterville
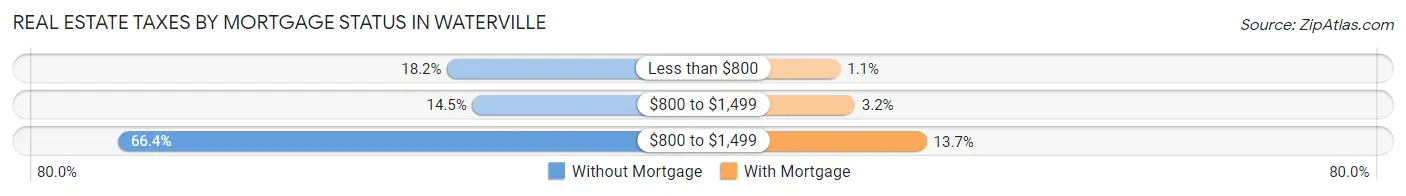
| Property Taxes | Without Mortgage | With Mortgage |
| Less than $800 | 227 (18.2%) | 18 (1.1%) |
| $800 to $1,499 | 181 (14.5%) | 54 (3.2%) |
| $800 to $1,499 | 826 (66.3%) | 232 (13.7%) |
| Total | 1,245 (100.0%) | 1,696 (100.0%) |
Health & Disability in Waterville
Health Insurance Coverage by Age in Waterville
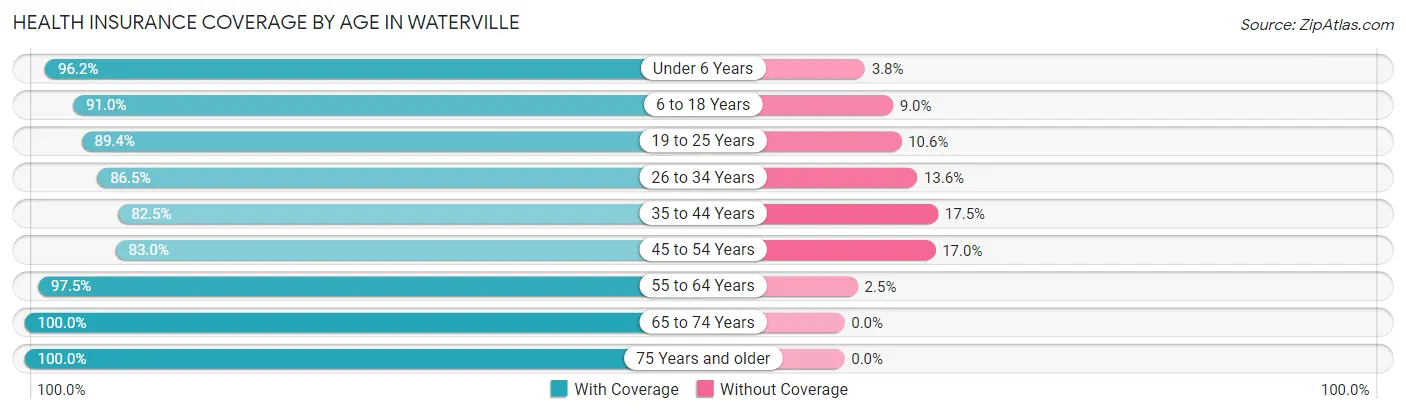
| Age Bracket | With Coverage | Without Coverage |
| Under 6 Years | 881 (96.2%) | 35 (3.8%) |
| 6 to 18 Years | 2,303 (91.0%) | 229 (9.0%) |
| 19 to 25 Years | 2,508 (89.4%) | 298 (10.6%) |
| 26 to 34 Years | 1,333 (86.5%) | 209 (13.6%) |
| 35 to 44 Years | 1,484 (82.5%) | 314 (17.5%) |
| 45 to 54 Years | 911 (83.0%) | 186 (17.0%) |
| 55 to 64 Years | 2,152 (97.5%) | 55 (2.5%) |
| 65 to 74 Years | 1,545 (100.0%) | 0 (0.0%) |
| 75 Years and older | 829 (100.0%) | 0 (0.0%) |
| Total | 13,946 (91.3%) | 1,326 (8.7%) |
Health Insurance Coverage by Citizenship Status in Waterville
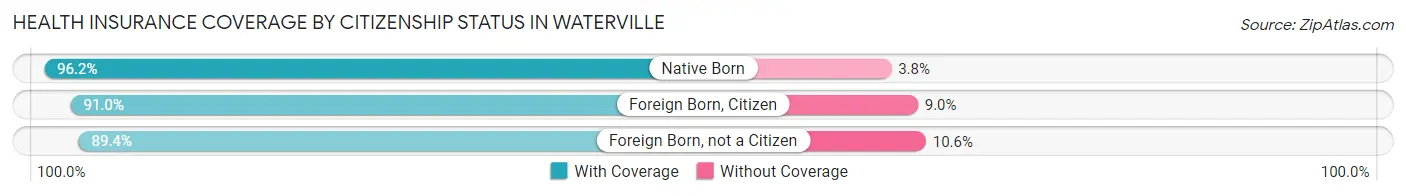
| Citizenship Status | With Coverage | Without Coverage |
| Native Born | 881 (96.2%) | 35 (3.8%) |
| Foreign Born, Citizen | 2,303 (91.0%) | 229 (9.0%) |
| Foreign Born, not a Citizen | 2,508 (89.4%) | 298 (10.6%) |
Health Insurance Coverage by Household Income in Waterville
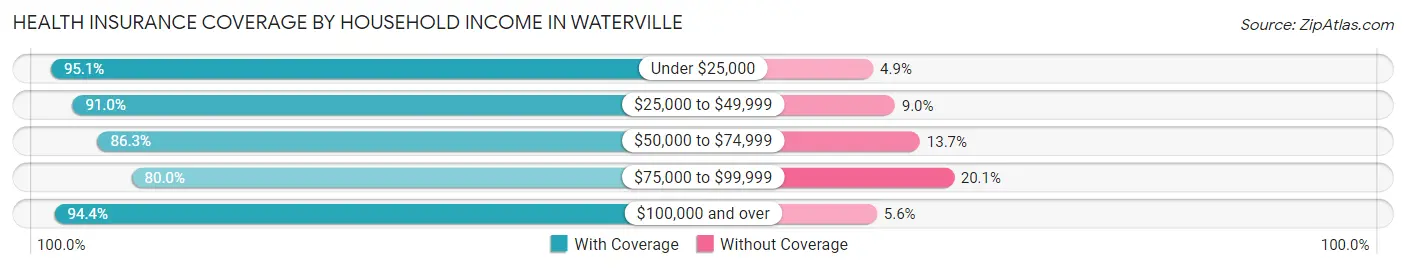
| Household Income | With Coverage | Without Coverage |
| Under $25,000 | 3,234 (95.1%) | 168 (4.9%) |
| $25,000 to $49,999 | 2,318 (91.0%) | 229 (9.0%) |
| $50,000 to $74,999 | 2,440 (86.3%) | 387 (13.7%) |
| $75,000 to $99,999 | 1,188 (79.9%) | 298 (20.1%) |
| $100,000 and over | 3,069 (94.4%) | 183 (5.6%) |
Public vs Private Health Insurance Coverage by Age in Waterville
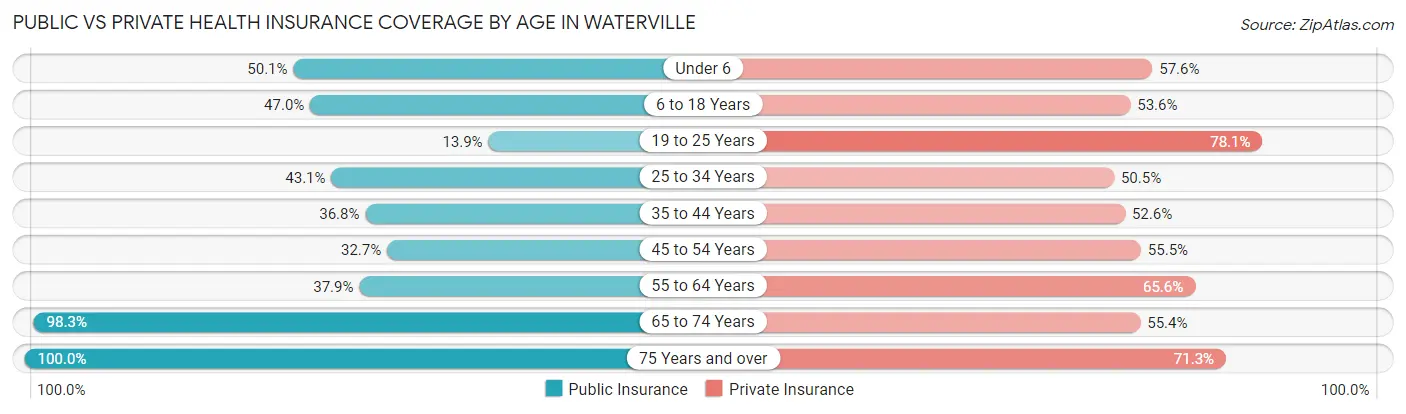
| Age Bracket | Public Insurance | Private Insurance |
| Under 6 | 459 (50.1%) | 528 (57.6%) |
| 6 to 18 Years | 1,190 (47.0%) | 1,356 (53.5%) |
| 19 to 25 Years | 390 (13.9%) | 2,190 (78.0%) |
| 25 to 34 Years | 664 (43.1%) | 779 (50.5%) |
| 35 to 44 Years | 661 (36.8%) | 945 (52.6%) |
| 45 to 54 Years | 359 (32.7%) | 609 (55.5%) |
| 55 to 64 Years | 836 (37.9%) | 1,447 (65.6%) |
| 65 to 74 Years | 1,519 (98.3%) | 856 (55.4%) |
| 75 Years and over | 829 (100.0%) | 591 (71.3%) |
| Total | 6,907 (45.2%) | 9,301 (60.9%) |
Disability Status by Sex by Age in Waterville
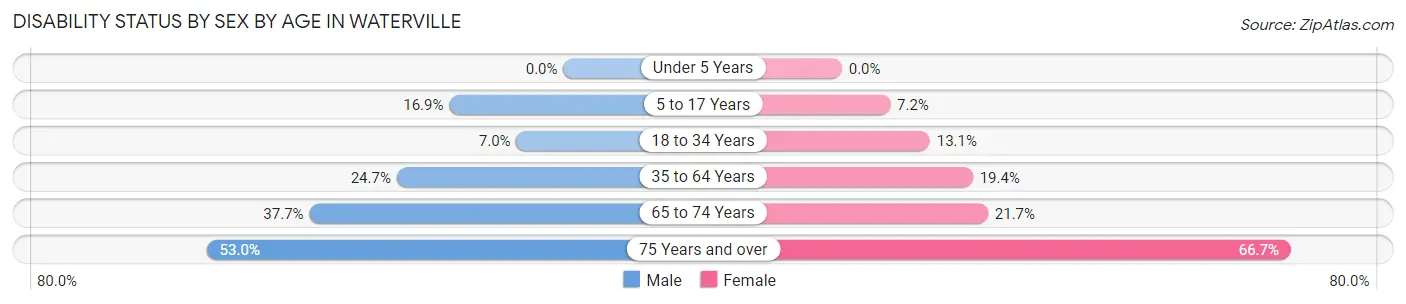
| Age Bracket | Male | Female |
| Under 5 Years | 0 (0.0%) | 0 (0.0%) |
| 5 to 17 Years | 215 (16.9%) | 77 (7.2%) |
| 18 to 34 Years | 154 (7.0%) | 330 (13.1%) |
| 35 to 64 Years | 622 (24.7%) | 503 (19.4%) |
| 65 to 74 Years | 221 (37.7%) | 208 (21.7%) |
| 75 Years and over | 161 (53.0%) | 350 (66.7%) |
Disability Class by Sex by Age in Waterville
Disability Class: Hearing Difficulty
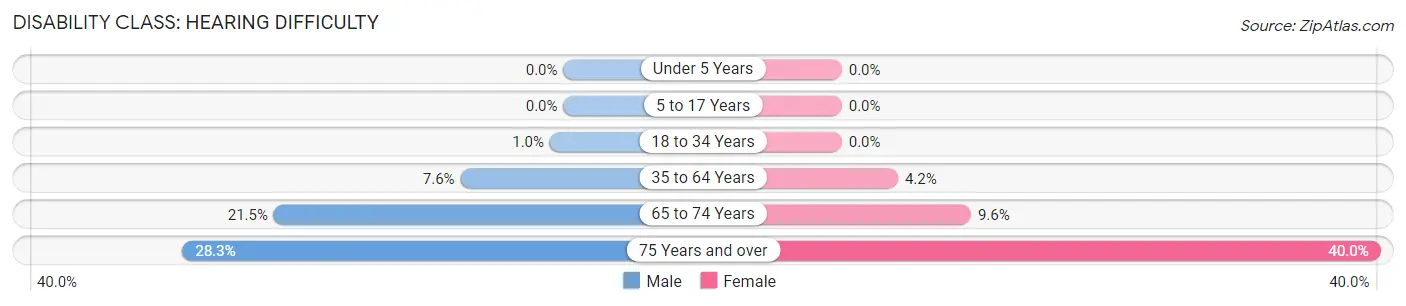
| Age Bracket | Male | Female |
| Under 5 Years | 0 (0.0%) | 0 (0.0%) |
| 5 to 17 Years | 0 (0.0%) | 0 (0.0%) |
| 18 to 34 Years | 22 (1.0%) | 0 (0.0%) |
| 35 to 64 Years | 192 (7.6%) | 108 (4.2%) |
| 65 to 74 Years | 126 (21.5%) | 92 (9.6%) |
| 75 Years and over | 86 (28.3%) | 210 (40.0%) |
Disability Class: Vision Difficulty
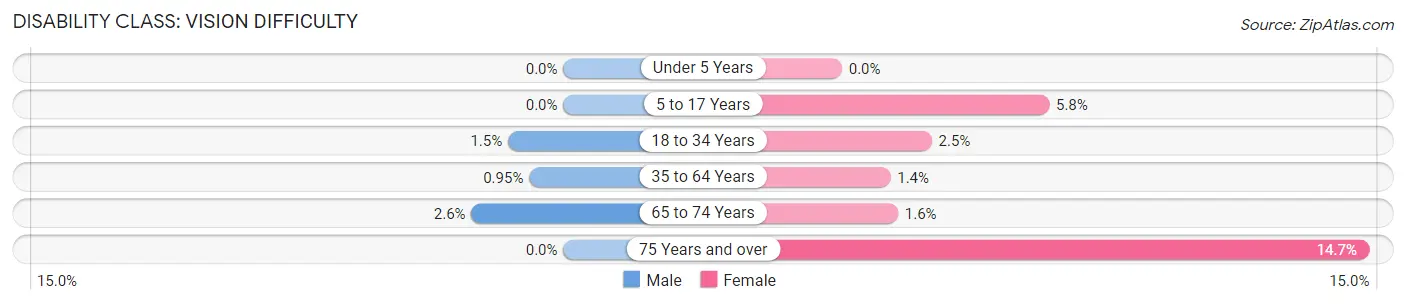
| Age Bracket | Male | Female |
| Under 5 Years | 0 (0.0%) | 0 (0.0%) |
| 5 to 17 Years | 0 (0.0%) | 62 (5.8%) |
| 18 to 34 Years | 34 (1.5%) | 63 (2.5%) |
| 35 to 64 Years | 24 (0.9%) | 35 (1.3%) |
| 65 to 74 Years | 15 (2.6%) | 15 (1.6%) |
| 75 Years and over | 0 (0.0%) | 77 (14.7%) |
Disability Class: Cognitive Difficulty
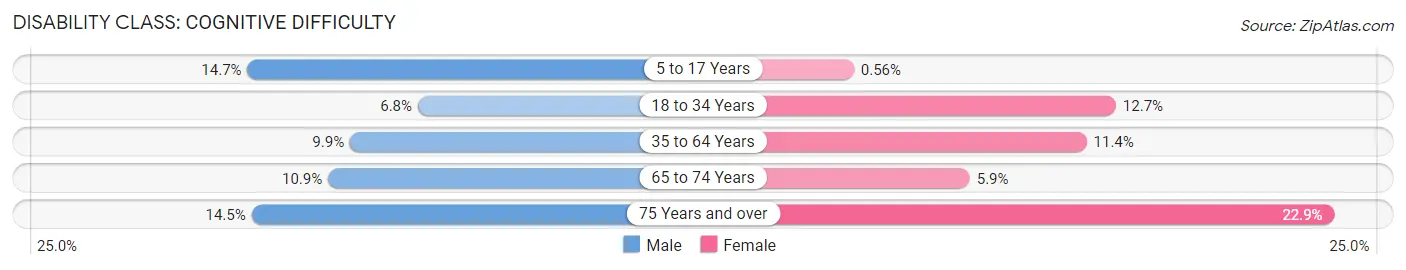
| Age Bracket | Male | Female |
| 5 to 17 Years | 186 (14.7%) | 6 (0.6%) |
| 18 to 34 Years | 149 (6.8%) | 321 (12.7%) |
| 35 to 64 Years | 249 (9.9%) | 294 (11.4%) |
| 65 to 74 Years | 64 (10.9%) | 57 (5.9%) |
| 75 Years and over | 44 (14.5%) | 120 (22.9%) |
Disability Class: Ambulatory Difficulty
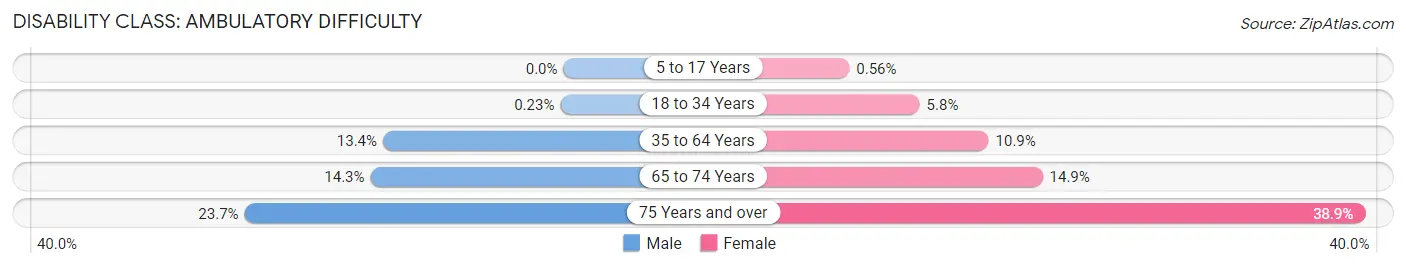
| Age Bracket | Male | Female |
| 5 to 17 Years | 0 (0.0%) | 6 (0.6%) |
| 18 to 34 Years | 5 (0.2%) | 146 (5.8%) |
| 35 to 64 Years | 337 (13.4%) | 282 (10.9%) |
| 65 to 74 Years | 84 (14.3%) | 143 (14.9%) |
| 75 Years and over | 72 (23.7%) | 204 (38.9%) |
Disability Class: Self-Care Difficulty
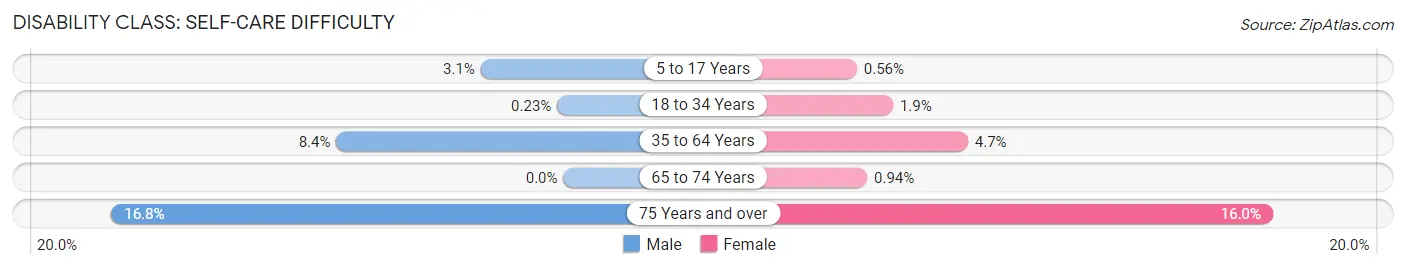
| Age Bracket | Male | Female |
| 5 to 17 Years | 39 (3.1%) | 6 (0.6%) |
| 18 to 34 Years | 5 (0.2%) | 48 (1.9%) |
| 35 to 64 Years | 212 (8.4%) | 121 (4.7%) |
| 65 to 74 Years | 0 (0.0%) | 9 (0.9%) |
| 75 Years and over | 51 (16.8%) | 84 (16.0%) |
Technology Access in Waterville
Computing Device Access in Waterville
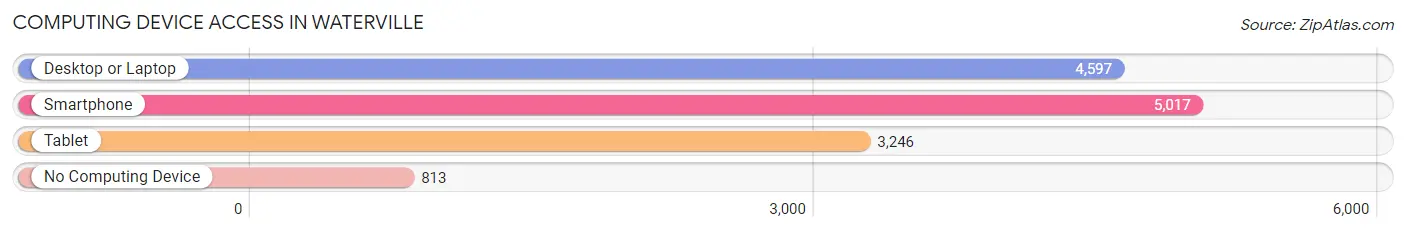
| Device Type | # Households | % Households |
| Desktop or Laptop | 4,597 | 72.2% |
| Smartphone | 5,017 | 78.8% |
| Tablet | 3,246 | 51.0% |
| No Computing Device | 813 | 12.8% |
| Total | 6,366 | 100.0% |
Internet Access in Waterville
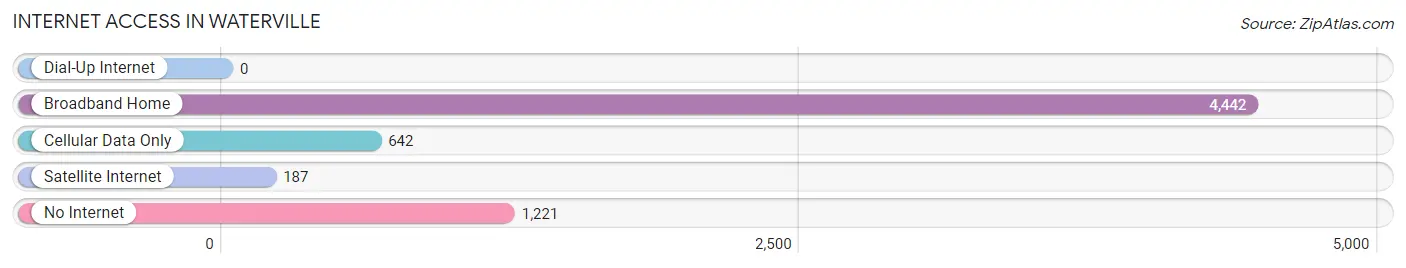
| Internet Type | # Households | % Households |
| Dial-Up Internet | 0 | 0.0% |
| Broadband Home | 4,442 | 69.8% |
| Cellular Data Only | 642 | 10.1% |
| Satellite Internet | 187 | 2.9% |
| No Internet | 1,221 | 19.2% |
| Total | 6,366 | 100.0% |
Waterville Summary
Waterville, Maine is a city located in Kennebec County, in the state of Maine. It is situated on the banks of the Kennebec River, and is the county seat of Kennebec County. The city has a population of 15,722, according to the 2010 census.
History
Waterville was first settled in 1771 by settlers from Massachusetts. The town was originally called "Watertown" and was incorporated in 1802. The name was changed to Waterville in 1824.
The city was an important industrial center in the 19th century, with several mills and factories located along the Kennebec River. Waterville was also the site of the first paper mill in the United States, which was built in 1803.
In the 20th century, Waterville became a center for education, with the establishment of Colby College in 1813 and Thomas College in 1894. The city is also home to the Maine State Museum, which was founded in 1820.
Geography
Waterville is located in central Maine, on the banks of the Kennebec River. The city is situated at the intersection of Interstate 95 and US Route 201. The city is bordered by the towns of Winslow, Oakland, Fairfield, and Sidney.
The city has a total area of 16.2 square miles, of which 15.9 square miles is land and 0.3 square miles is water. The city is located in a hilly region, with the highest point being the summit of Mount Tom, which is located just outside of the city limits.
Economy
Waterville is a major economic center in central Maine. The city is home to several large employers, including Colby College, Thomas College, and the Maine State Museum. The city is also home to several manufacturing companies, including Huhtamaki, a paper products manufacturer, and the Maine Machine Company, which produces industrial machinery.
The city is also home to several retail stores, including the Waterville Mall, which is the largest shopping center in the city.
Demographics
As of the 2010 census, Waterville had a population of 15,722. The racial makeup of the city was 94.2% White, 1.3% African American, 0.5% Native American, 1.2% Asian, 0.1% Pacific Islander, 0.7% from other races, and 1.9% from two or more races. Hispanic or Latino of any race were 2.2% of the population.
The median income for a household in the city was $37,945, and the median income for a family was $50,945. The per capita income for the city was $21,845. About 11.2% of families and 16.2% of the population were below the poverty line, including 22.2% of those under age 18 and 8.2% of those age 65 or over.
Common Questions
What is the Total Population of Waterville?
Total Population of Waterville is 15,785.
What is the Total Male Population of Waterville?
Total Male Population of Waterville is 7,608.
What is the Total Female Population of Waterville?
Total Female Population of Waterville is 8,177.
What is the Ratio of Males per 100 Females in Waterville?
There are 93.04 Males per 100 Females in Waterville.
What is the Ratio of Females per 100 Males in Waterville?
There are 107.48 Females per 100 Males in Waterville.
What is the Median Population Age in Waterville?
Median Population Age in Waterville is 35.2 Years.
What is the Average Family Size in Waterville
Average Family Size in Waterville is 2.9 People.
What is the Average Household Size in Waterville
Average Household Size in Waterville is 2.1 People.
What is Per Capita Income in Waterville?
Per Capita income in Waterville is $28,484.
What is the Median Family Income in Waterville?
Median Family Income in Waterville is $57,351.
What is the Median Household income in Waterville?
Median Household Income in Waterville is $45,208.
What is Income or Wage Gap in Waterville?
Income or Wage Gap in Waterville is 35.1%.
Women in Waterville earn 64.9 cents for every dollar earned by a man.
What is Family Income Deficit in Waterville?
Family Income Deficit in Waterville is $11,664.
Families that are below poverty line in Waterville earn $11,664 less on average than the poverty threshold level.
What is Inequality or Gini Index in Waterville?
Inequality or Gini Index in Waterville is 0.51.
How Large is the Labor Force in Waterville?
There are 7,249 People in the Labor Forcein in Waterville.
What is the Percentage of People in the Labor Force in Waterville?
56.0% of People are in the Labor Force in Waterville.
What is the Unemployment Rate in Waterville?
Unemployment Rate in Waterville is 4.5%.