Livermore Falls, ME
Livermore Falls Map
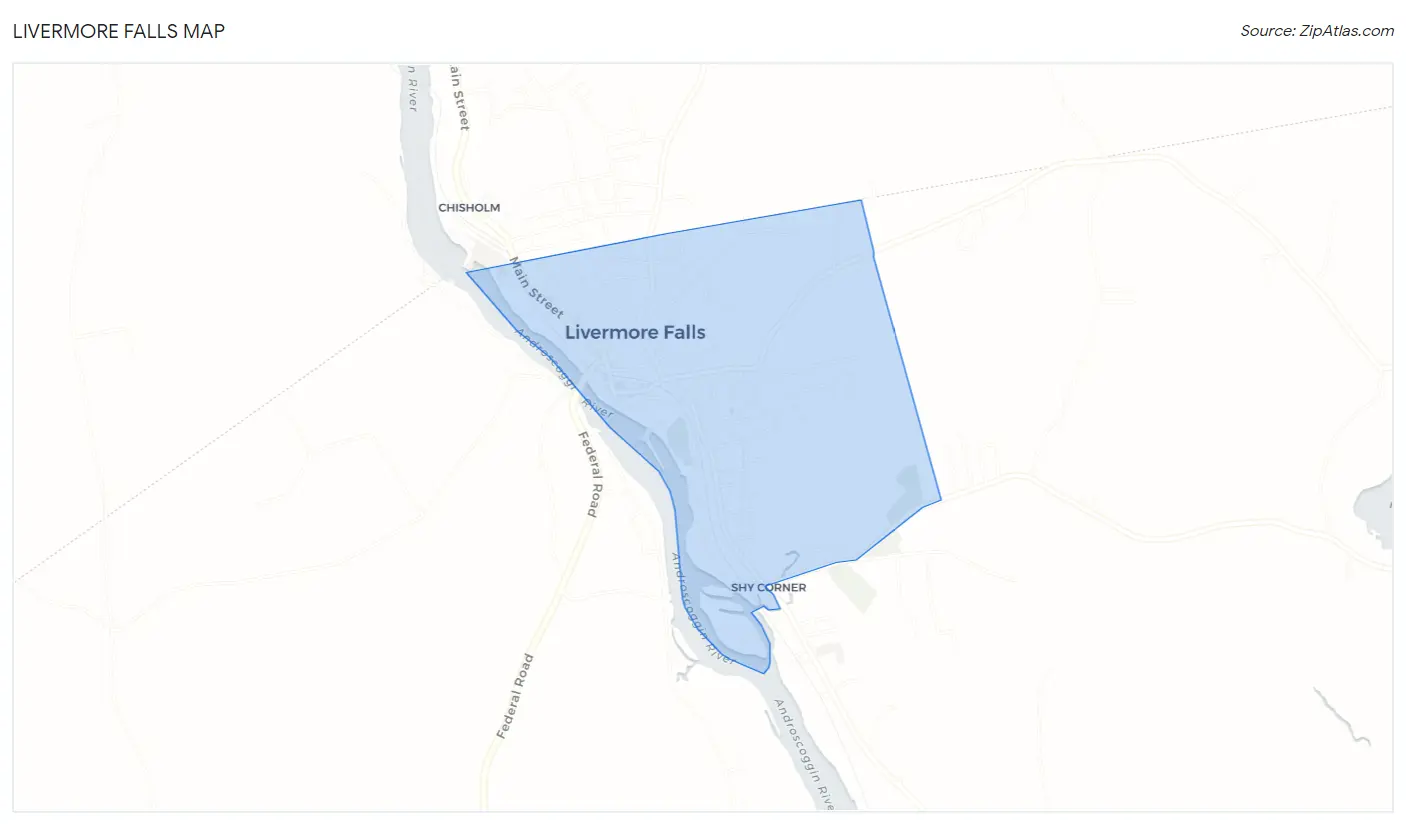
Livermore Falls Overview
1,765
TOTAL POPULATION
849
MALE POPULATION
916
FEMALE POPULATION
92.69
MALES / 100 FEMALES
107.89
FEMALES / 100 MALES
30.8
MEDIAN AGE
3.3
AVG FAMILY SIZE
2.1
AVG HOUSEHOLD SIZE
$20,947
PER CAPITA INCOME
$47,212
AVG FAMILY INCOME
$44,864
AVG HOUSEHOLD INCOME
10.6%
WAGE / INCOME GAP [ % ]
89.4¢/ $1
WAGE / INCOME GAP [ $ ]
0.34
INEQUALITY / GINI INDEX
846
LABOR FORCE [ PEOPLE ]
62.4%
PERCENT IN LABOR FORCE
3.9%
UNEMPLOYMENT RATE
Livermore Falls Zip Codes
Livermore Falls Area Codes
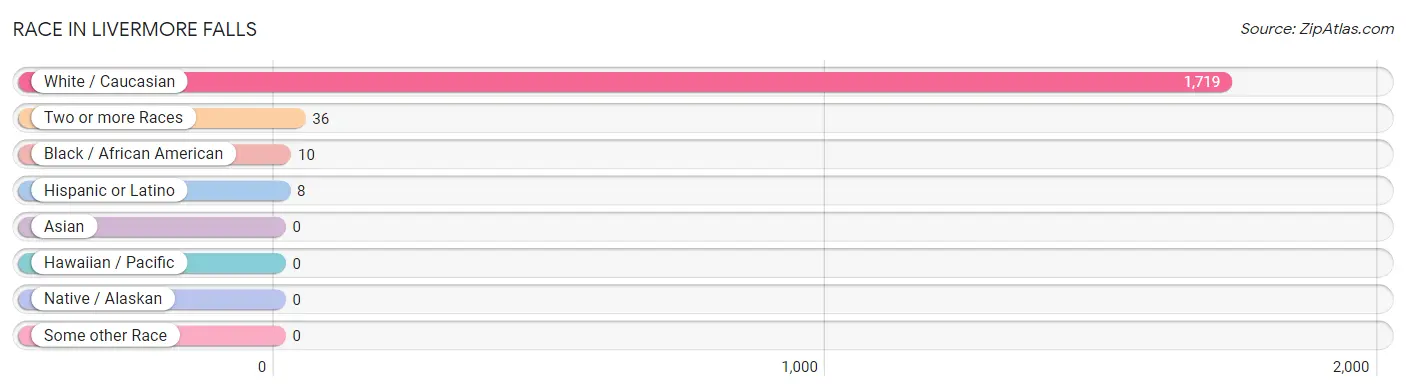
Race in Livermore Falls
The most populous races in Livermore Falls are White / Caucasian (1,719 | 97.4%), Two or more Races (36 | 2.0%), and Black / African American (10 | 0.6%).
| Race | # Population | % Population |
| Asian | 0 | 0.0% |
| Black / African American | 10 | 0.6% |
| Hawaiian / Pacific | 0 | 0.0% |
| Hispanic or Latino | 8 | 0.4% |
| Native / Alaskan | 0 | 0.0% |
| White / Caucasian | 1,719 | 97.4% |
| Two or more Races | 36 | 2.0% |
| Some other Race | 0 | 0.0% |
| Total | 1,765 | 100.0% |
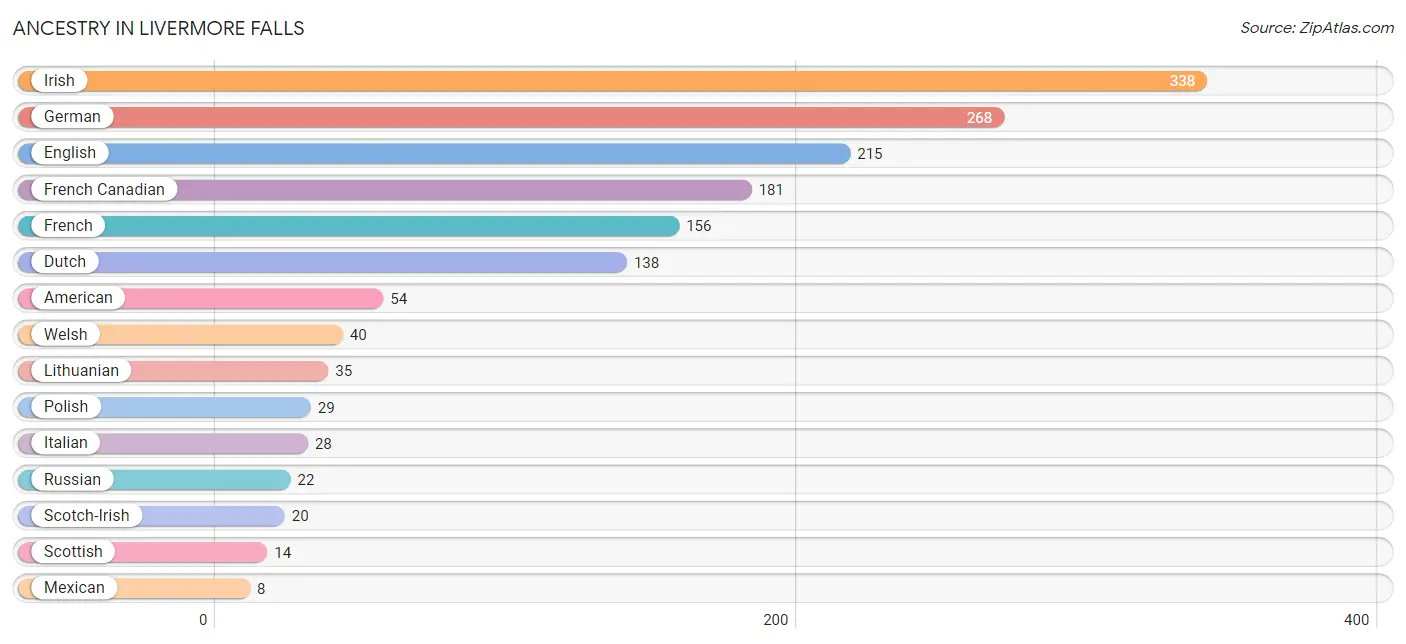
Ancestry in Livermore Falls
The most populous ancestries reported in Livermore Falls are Irish (338 | 19.2%), German (268 | 15.2%), English (215 | 12.2%), French Canadian (181 | 10.2%), and French (156 | 8.8%), together accounting for 65.6% of all Livermore Falls residents.
| Ancestry | # Population | % Population |
| American | 54 | 3.1% |
| Dutch | 138 | 7.8% |
| English | 215 | 12.2% |
| French | 156 | 8.8% |
| French Canadian | 181 | 10.2% |
| German | 268 | 15.2% |
| Irish | 338 | 19.2% |
| Italian | 28 | 1.6% |
| Lithuanian | 35 | 2.0% |
| Mexican | 8 | 0.4% |
| Polish | 29 | 1.6% |
| Russian | 22 | 1.3% |
| Scotch-Irish | 20 | 1.1% |
| Scottish | 14 | 0.8% |
| Welsh | 40 | 2.3% | View All 15 Rows |
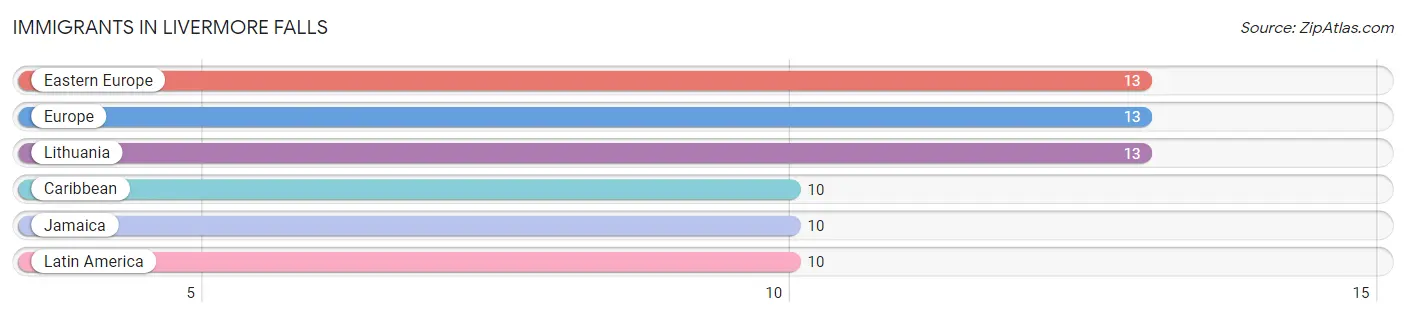
Immigrants in Livermore Falls
The most numerous immigrant groups reported in Livermore Falls came from Eastern Europe (13 | 0.7%), Europe (13 | 0.7%), Lithuania (13 | 0.7%), Caribbean (10 | 0.6%), and Jamaica (10 | 0.6%), together accounting for 3.4% of all Livermore Falls residents.
| Immigration Origin | # Population | % Population |
| Caribbean | 10 | 0.6% |
| Eastern Europe | 13 | 0.7% |
| Europe | 13 | 0.7% |
| Jamaica | 10 | 0.6% |
| Latin America | 10 | 0.6% |
| Lithuania | 13 | 0.7% | View All 6 Rows |
Sex and Age in Livermore Falls
Sex and Age in Livermore Falls
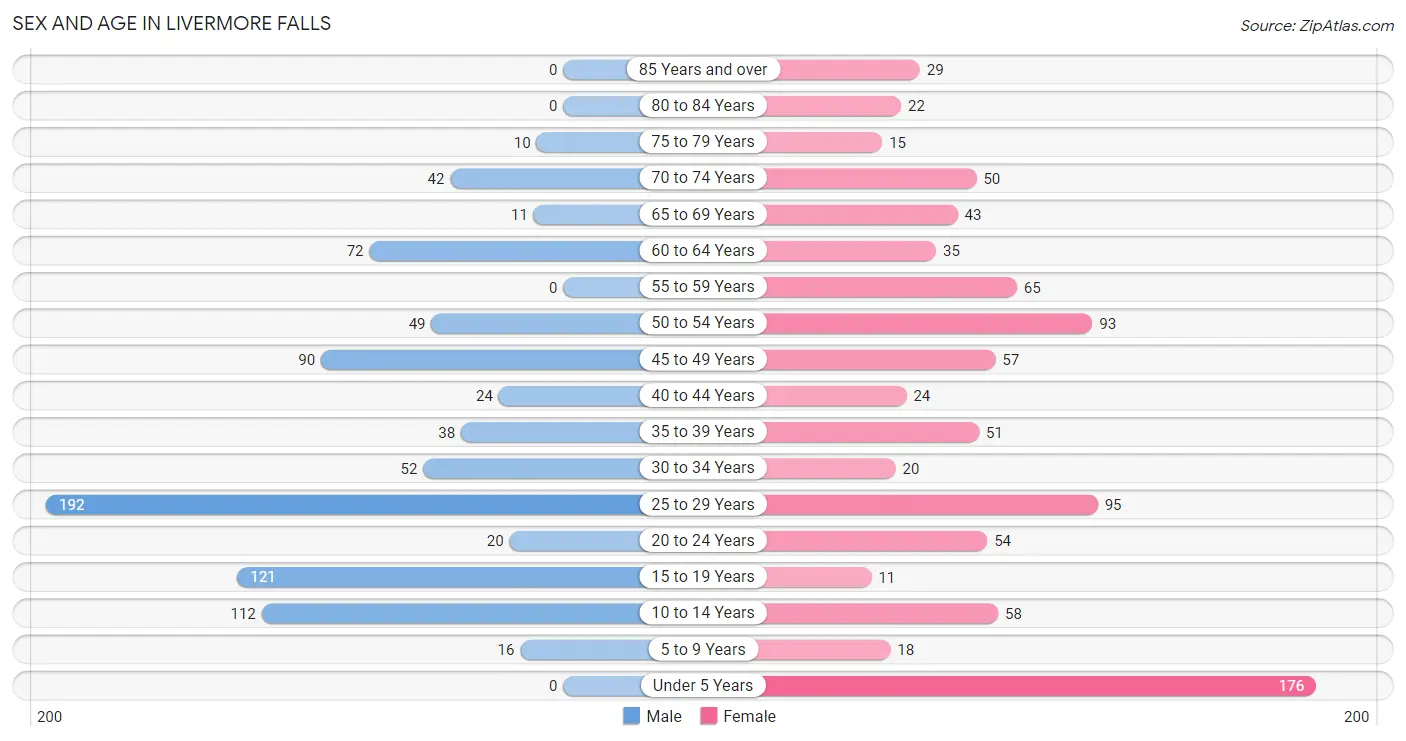
The most populous age groups in Livermore Falls are 25 to 29 Years (192 | 22.6%) for men and Under 5 Years (176 | 19.2%) for women.
| Age Bracket | Male | Female |
| Under 5 Years | 0 (0.0%) | 176 (19.2%) |
| 5 to 9 Years | 16 (1.9%) | 18 (2.0%) |
| 10 to 14 Years | 112 (13.2%) | 58 (6.3%) |
| 15 to 19 Years | 121 (14.2%) | 11 (1.2%) |
| 20 to 24 Years | 20 (2.4%) | 54 (5.9%) |
| 25 to 29 Years | 192 (22.6%) | 95 (10.4%) |
| 30 to 34 Years | 52 (6.1%) | 20 (2.2%) |
| 35 to 39 Years | 38 (4.5%) | 51 (5.6%) |
| 40 to 44 Years | 24 (2.8%) | 24 (2.6%) |
| 45 to 49 Years | 90 (10.6%) | 57 (6.2%) |
| 50 to 54 Years | 49 (5.8%) | 93 (10.2%) |
| 55 to 59 Years | 0 (0.0%) | 65 (7.1%) |
| 60 to 64 Years | 72 (8.5%) | 35 (3.8%) |
| 65 to 69 Years | 11 (1.3%) | 43 (4.7%) |
| 70 to 74 Years | 42 (5.0%) | 50 (5.5%) |
| 75 to 79 Years | 10 (1.2%) | 15 (1.6%) |
| 80 to 84 Years | 0 (0.0%) | 22 (2.4%) |
| 85 Years and over | 0 (0.0%) | 29 (3.2%) |
| Total | 849 (100.0%) | 916 (100.0%) |
Families and Households in Livermore Falls
Median Family Size in Livermore Falls
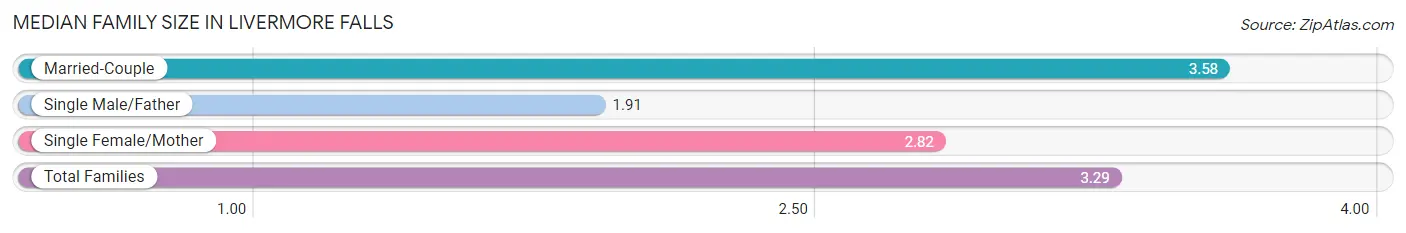
The median family size in Livermore Falls is 3.29 persons per family, with married-couple families (218 | 65.7%) accounting for the largest median family size of 3.58 persons per family. On the other hand, single male/father families (11 | 3.3%) represent the smallest median family size with 1.91 persons per family.
| Family Type | # Families | Family Size |
| Married-Couple | 218 (65.7%) | 3.58 |
| Single Male/Father | 11 (3.3%) | 1.91 |
| Single Female/Mother | 103 (31.0%) | 2.82 |
| Total Families | 332 (100.0%) | 3.29 |
Median Household Size in Livermore Falls
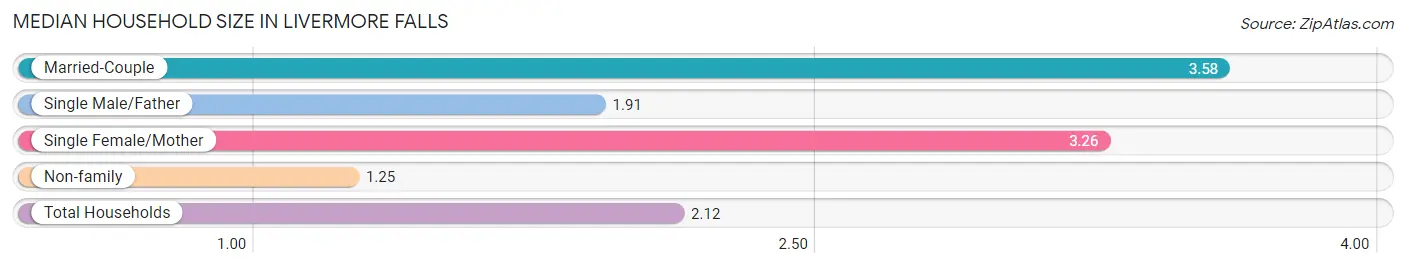
The median household size in Livermore Falls is 2.12 persons per household, with married-couple households (218 | 26.2%) accounting for the largest median household size of 3.58 persons per household. non-family households (501 | 60.1%) represent the smallest median household size with 1.25 persons per household.
| Household Type | # Households | Household Size |
| Married-Couple | 218 (26.2%) | 3.58 |
| Single Male/Father | 11 (1.3%) | 1.91 |
| Single Female/Mother | 103 (12.4%) | 3.26 |
| Non-family | 501 (60.1%) | 1.25 |
| Total Households | 833 (100.0%) | 2.12 |
Household Size by Marriage Status in Livermore Falls
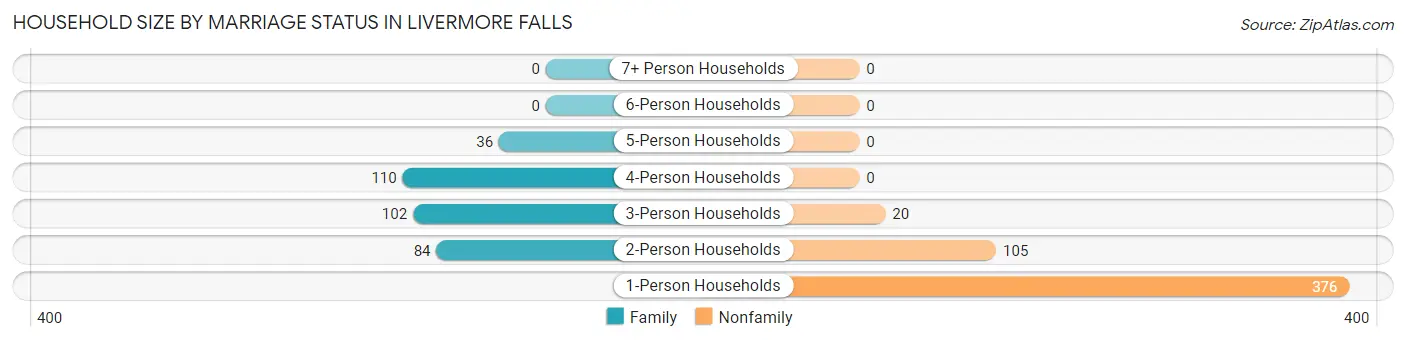
Out of a total of 833 households in Livermore Falls, 332 (39.9%) are family households, while 501 (60.1%) are nonfamily households. The most numerous type of family households are 4-person households, comprising 110, and the most common type of nonfamily households are 1-person households, comprising 376.
| Household Size | Family Households | Nonfamily Households |
| 1-Person Households | - | 376 (45.1%) |
| 2-Person Households | 84 (10.1%) | 105 (12.6%) |
| 3-Person Households | 102 (12.2%) | 20 (2.4%) |
| 4-Person Households | 110 (13.2%) | 0 (0.0%) |
| 5-Person Households | 36 (4.3%) | 0 (0.0%) |
| 6-Person Households | 0 (0.0%) | 0 (0.0%) |
| 7+ Person Households | 0 (0.0%) | 0 (0.0%) |
| Total | 332 (39.9%) | 501 (60.1%) |
Female Fertility in Livermore Falls
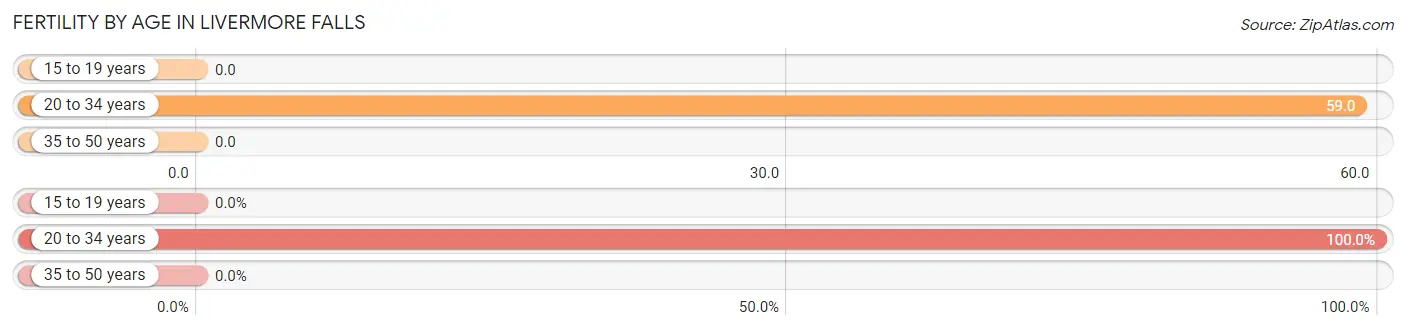
Fertility by Age in Livermore Falls
Average fertility rate in Livermore Falls is 30.0 births per 1,000 women. Women in the age bracket of 20 to 34 years have the highest fertility rate with 59.0 births per 1,000 women. Women in the age bracket of 20 to 34 years acount for 100.0% of all women with births.
| Age Bracket | Women with Births | Births / 1,000 Women |
| 15 to 19 years | 0 (0.0%) | 0.0 |
| 20 to 34 years | 10 (100.0%) | 59.0 |
| 35 to 50 years | 0 (0.0%) | 0.0 |
| Total | 10 (100.0%) | 30.0 |
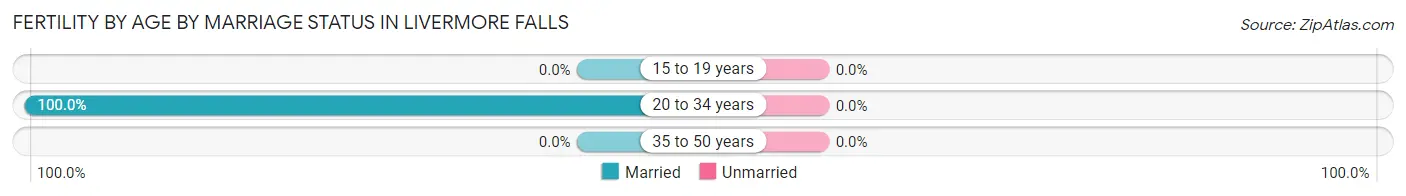
Fertility by Age by Marriage Status in Livermore Falls
| Age Bracket | Married | Unmarried |
| 15 to 19 years | 0 (0.0%) | 0 (0.0%) |
| 20 to 34 years | 10 (100.0%) | 0 (0.0%) |
| 35 to 50 years | 0 (0.0%) | 0 (0.0%) |
| Total | 10 (100.0%) | 0 (0.0%) |
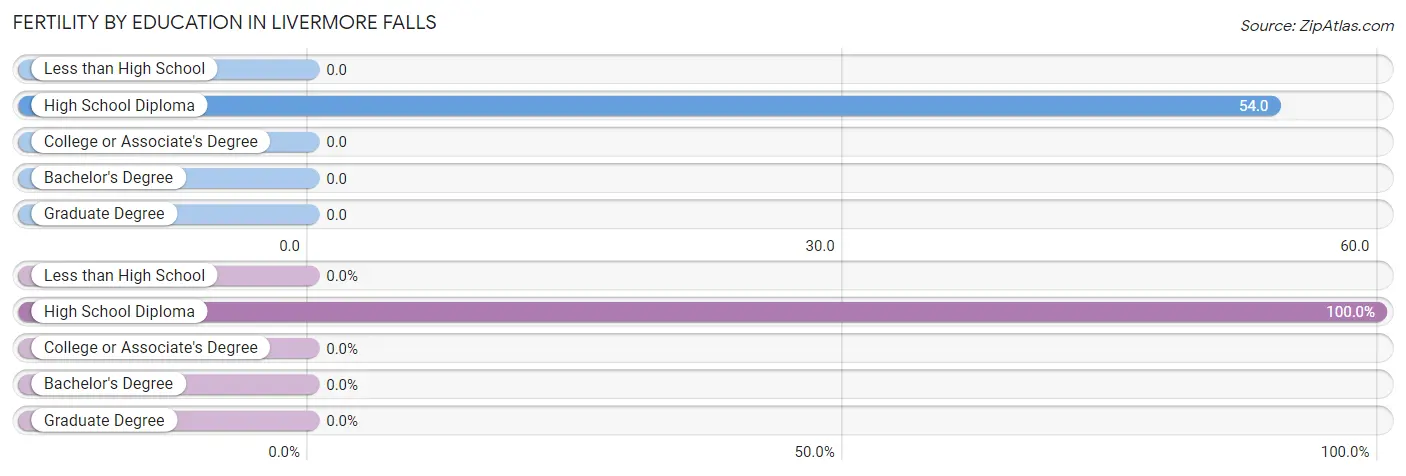
Fertility by Education in Livermore Falls
| Educational Attainment | Women with Births | Births / 1,000 Women |
| Less than High School | 0 (0.0%) | 0.0 |
| High School Diploma | 10 (100.0%) | 54.0 |
| College or Associate's Degree | 0 (0.0%) | 0.0 |
| Bachelor's Degree | 0 (0.0%) | 0.0 |
| Graduate Degree | 0 (0.0%) | 0.0 |
| Total | 10 (100.0%) | 30.0 |
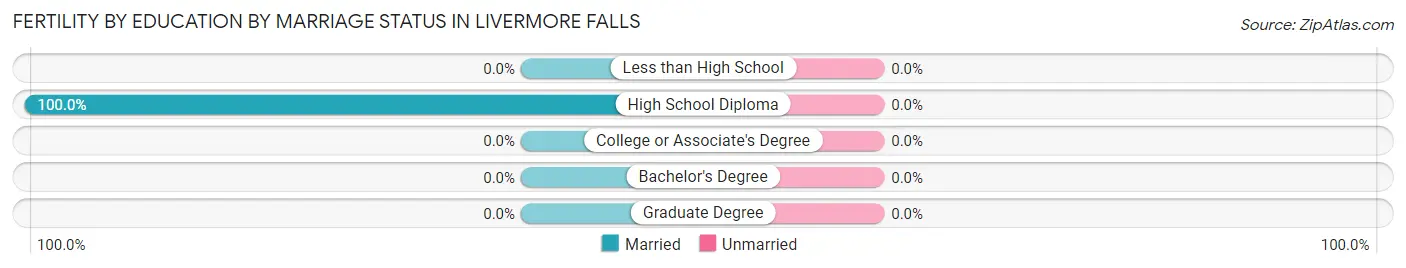
Fertility by Education by Marriage Status in Livermore Falls
| Educational Attainment | Married | Unmarried |
| Less than High School | 0 (0.0%) | 0 (0.0%) |
| High School Diploma | 10 (100.0%) | 0 (0.0%) |
| College or Associate's Degree | 0 (0.0%) | 0 (0.0%) |
| Bachelor's Degree | 0 (0.0%) | 0 (0.0%) |
| Graduate Degree | 0 (0.0%) | 0 (0.0%) |
| Total | 10 (100.0%) | 0 (0.0%) |
Income in Livermore Falls
Income Overview in Livermore Falls
Per Capita Income in Livermore Falls is $20,947, while median incomes of families and households are $47,212 and $44,864 respectively.
| Characteristic | Number | Measure |
| Per Capita Income | 1,765 | $20,947 |
| Median Family Income | 332 | $47,212 |
| Mean Family Income | 332 | $54,472 |
| Median Household Income | 833 | $44,864 |
| Mean Household Income | 833 | $45,148 |
| Income Deficit | 332 | $0 |
| Wage / Income Gap (%) | 1,765 | 10.59% |
| Wage / Income Gap ($) | 1,765 | 89.41¢ per $1 |
| Gini / Inequality Index | 1,765 | 0.34 |
Earnings by Sex in Livermore Falls
Average Earnings in Livermore Falls are $29,437, $26,926 for men and $30,114 for women, a difference of 10.6%.
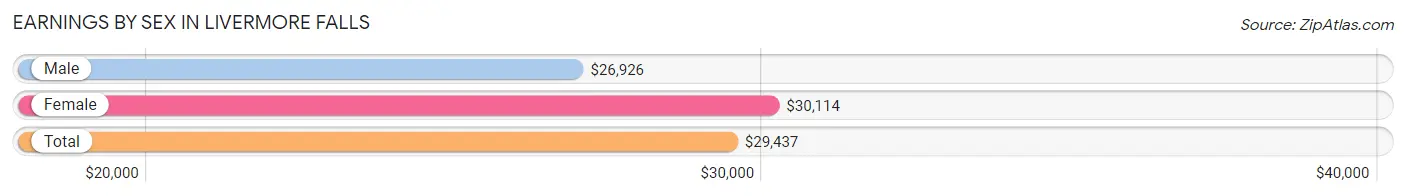
| Sex | Number | Average Earnings |
| Male | 510 (58.9%) | $26,926 |
| Female | 356 (41.1%) | $30,114 |
| Total | 866 (100.0%) | $29,437 |
Earnings by Sex by Income Bracket in Livermore Falls
The most common earnings brackets in Livermore Falls are $40,000 to $44,999 for men (101 | 19.8%) and $35,000 to $39,999 for women (92 | 25.8%).
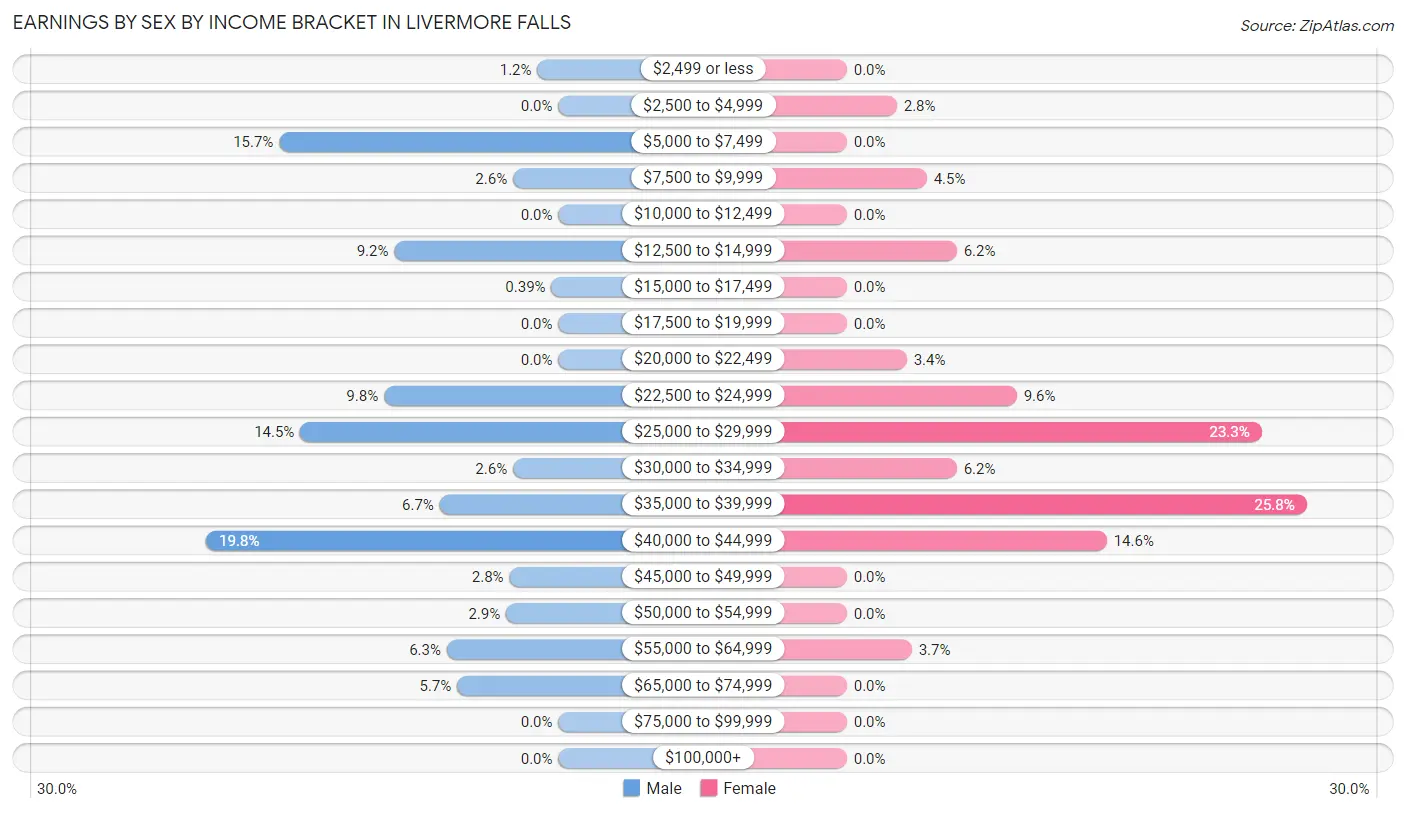
| Income | Male | Female |
| $2,499 or less | 6 (1.2%) | 0 (0.0%) |
| $2,500 to $4,999 | 0 (0.0%) | 10 (2.8%) |
| $5,000 to $7,499 | 80 (15.7%) | 0 (0.0%) |
| $7,500 to $9,999 | 13 (2.5%) | 16 (4.5%) |
| $10,000 to $12,499 | 0 (0.0%) | 0 (0.0%) |
| $12,500 to $14,999 | 47 (9.2%) | 22 (6.2%) |
| $15,000 to $17,499 | 2 (0.4%) | 0 (0.0%) |
| $17,500 to $19,999 | 0 (0.0%) | 0 (0.0%) |
| $20,000 to $22,499 | 0 (0.0%) | 12 (3.4%) |
| $22,500 to $24,999 | 50 (9.8%) | 34 (9.6%) |
| $25,000 to $29,999 | 74 (14.5%) | 83 (23.3%) |
| $30,000 to $34,999 | 13 (2.5%) | 22 (6.2%) |
| $35,000 to $39,999 | 34 (6.7%) | 92 (25.8%) |
| $40,000 to $44,999 | 101 (19.8%) | 52 (14.6%) |
| $45,000 to $49,999 | 14 (2.8%) | 0 (0.0%) |
| $50,000 to $54,999 | 15 (2.9%) | 0 (0.0%) |
| $55,000 to $64,999 | 32 (6.3%) | 13 (3.6%) |
| $65,000 to $74,999 | 29 (5.7%) | 0 (0.0%) |
| $75,000 to $99,999 | 0 (0.0%) | 0 (0.0%) |
| $100,000+ | 0 (0.0%) | 0 (0.0%) |
| Total | 510 (100.0%) | 356 (100.0%) |
Earnings by Sex by Educational Attainment in Livermore Falls
Average earnings in Livermore Falls are $27,399 for men and $35,294 for women, a difference of 22.4%. Men with an educational attainment of bachelor's degree enjoy the highest average annual earnings of $44,250, while those with college or associate's degree education earn the least with $26,585. Women with an educational attainment of high school diploma earn the most with the average annual earnings of $35,196, while those with college or associate's degree education have the smallest earnings of $22,813.
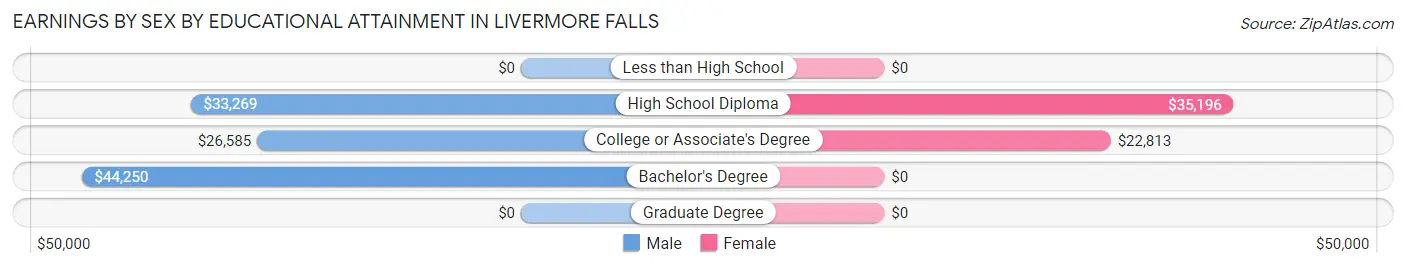
| Educational Attainment | Male Income | Female Income |
| Less than High School | - | - |
| High School Diploma | $33,269 | $35,196 |
| College or Associate's Degree | $26,585 | $22,813 |
| Bachelor's Degree | $44,250 | $0 |
| Graduate Degree | - | - |
| Total | $27,399 | $35,294 |
Family Income in Livermore Falls
Family Income Brackets in Livermore Falls
According to the Livermore Falls family income data, there are 99 families falling into the $35,000 to $49,999 income range, which is the most common income bracket and makes up 29.8% of all families.
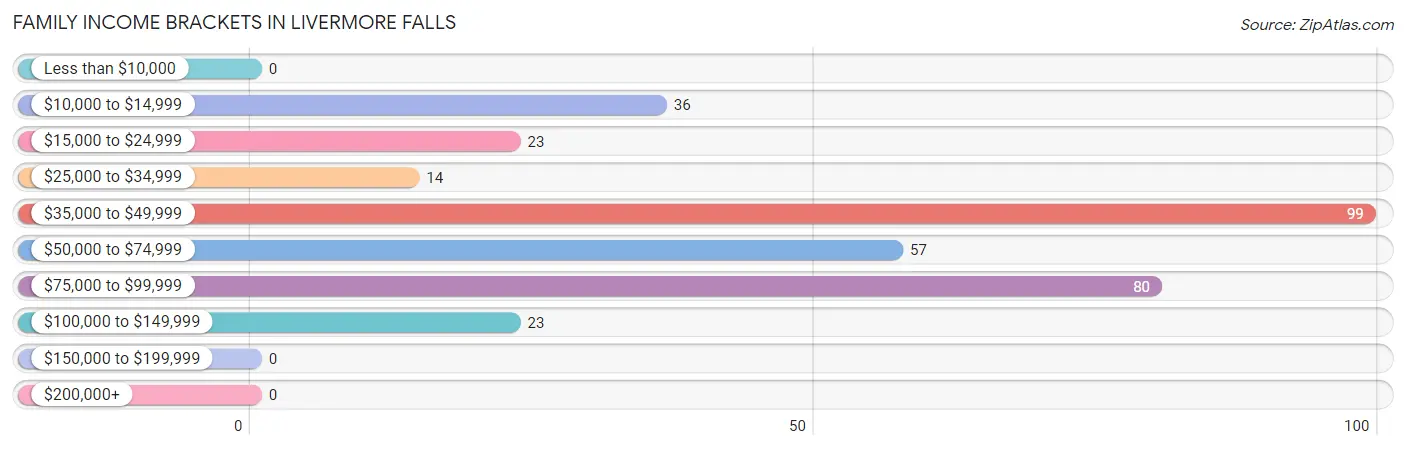
| Income Bracket | # Families | % Families |
| Less than $10,000 | 0 | 0.0% |
| $10,000 to $14,999 | 36 | 10.8% |
| $15,000 to $24,999 | 23 | 6.9% |
| $25,000 to $34,999 | 14 | 4.2% |
| $35,000 to $49,999 | 99 | 29.8% |
| $50,000 to $74,999 | 57 | 17.2% |
| $75,000 to $99,999 | 80 | 24.1% |
| $100,000 to $149,999 | 23 | 6.9% |
| $150,000 to $199,999 | 0 | 0.0% |
| $200,000+ | 0 | 0.0% |
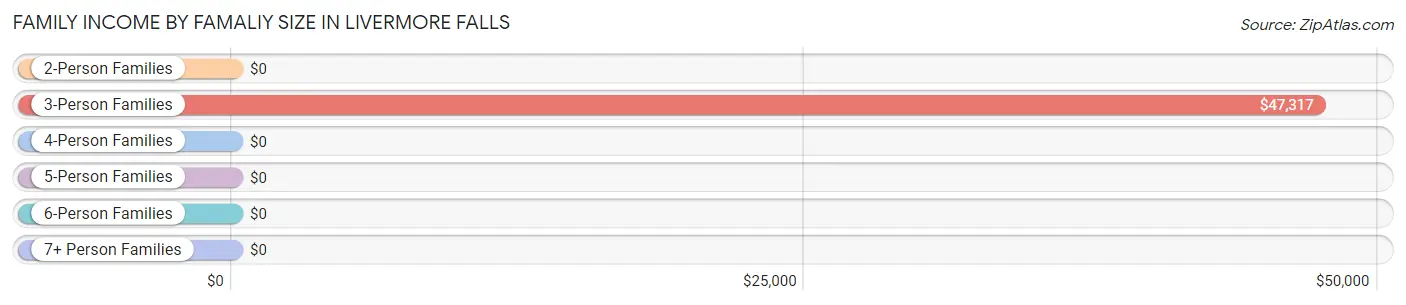
Family Income by Famaliy Size in Livermore Falls
3-person families (100 | 30.1%) account for the highest median family income in Livermore Falls with $47,317 per family, while 3-person families (100 | 30.1%) have the highest median income of $15,772 per family member.
| Income Bracket | # Families | Median Income |
| 2-Person Families | 98 (29.5%) | $0 |
| 3-Person Families | 100 (30.1%) | $47,317 |
| 4-Person Families | 98 (29.5%) | $0 |
| 5-Person Families | 36 (10.8%) | $0 |
| 6-Person Families | 0 (0.0%) | $0 |
| 7+ Person Families | 0 (0.0%) | $0 |
| Total | 332 (100.0%) | $47,212 |
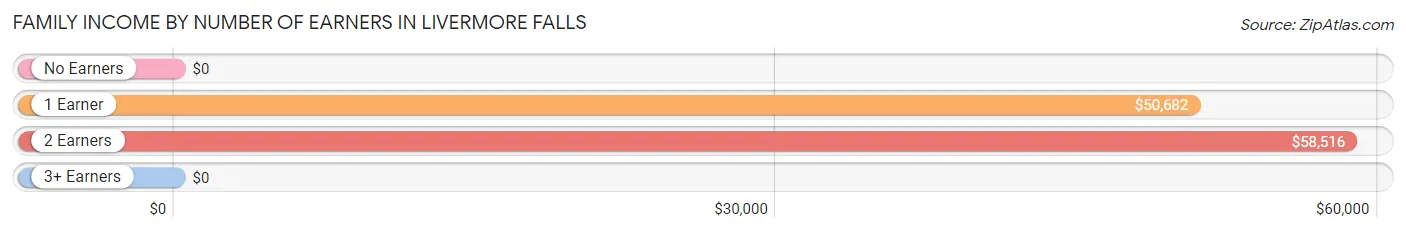
Family Income by Number of Earners in Livermore Falls
| Number of Earners | # Families | Median Income |
| No Earners | 58 (17.5%) | $0 |
| 1 Earner | 58 (17.5%) | $50,682 |
| 2 Earners | 202 (60.8%) | $58,516 |
| 3+ Earners | 14 (4.2%) | $0 |
| Total | 332 (100.0%) | $47,212 |
Household Income in Livermore Falls
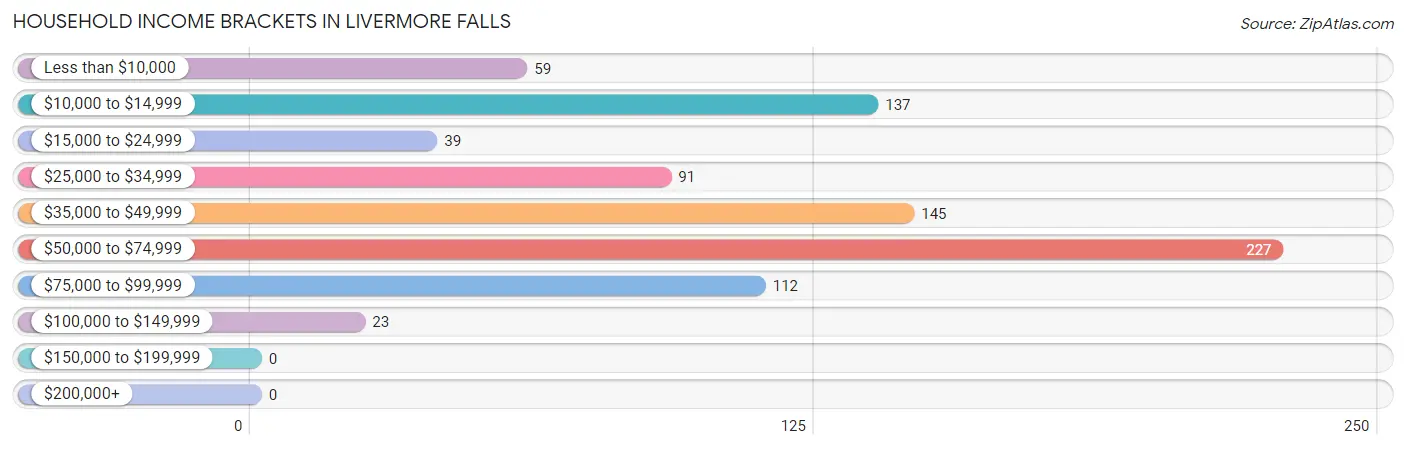
Household Income Brackets in Livermore Falls
With 227 households falling in the category, the $50,000 to $74,999 income range is the most frequent in Livermore Falls, accounting for 27.3% of all households.
| Income Bracket | # Households | % Households |
| Less than $10,000 | 59 | 7.1% |
| $10,000 to $14,999 | 137 | 16.4% |
| $15,000 to $24,999 | 39 | 4.7% |
| $25,000 to $34,999 | 91 | 10.9% |
| $35,000 to $49,999 | 145 | 17.4% |
| $50,000 to $74,999 | 227 | 27.3% |
| $75,000 to $99,999 | 112 | 13.4% |
| $100,000 to $149,999 | 23 | 2.8% |
| $150,000 to $199,999 | 0 | 0.0% |
| $200,000+ | 0 | 0.0% |
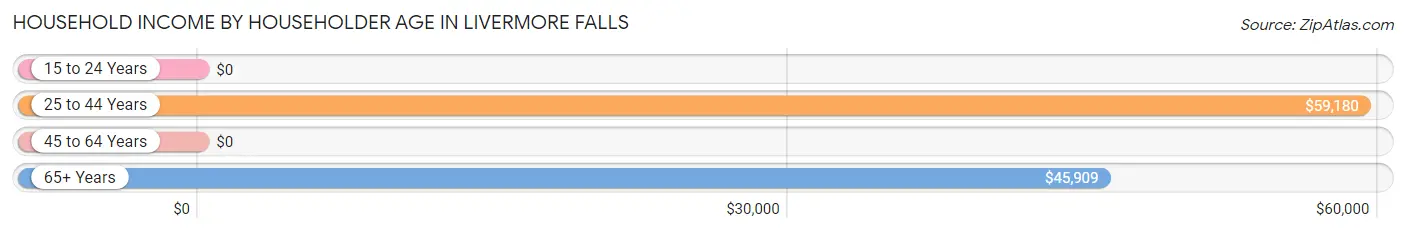
Household Income by Householder Age in Livermore Falls
The median household income in Livermore Falls is $44,864, with the highest median household income of $59,180 found in the 25 to 44 years age bracket for the primary householder. A total of 295 households (35.4%) fall into this category. Meanwhile, the 15 to 24 years age bracket for the primary householder has the lowest median household income of $0, with 42 households (5.0%) in this group.
| Income Bracket | # Households | Median Income |
| 15 to 24 Years | 42 (5.0%) | $0 |
| 25 to 44 Years | 295 (35.4%) | $59,180 |
| 45 to 64 Years | 308 (37.0%) | $0 |
| 65+ Years | 188 (22.6%) | $45,909 |
| Total | 833 (100.0%) | $44,864 |
Poverty in Livermore Falls
Income Below Poverty by Sex and Age in Livermore Falls
With 13.9% poverty level for males and 23.1% for females among the residents of Livermore Falls, 55 to 64 year old males and 16 and 17 year old females are the most vulnerable to poverty, with 57 males (79.2%) and 11 females (100.0%) in their respective age groups living below the poverty level.
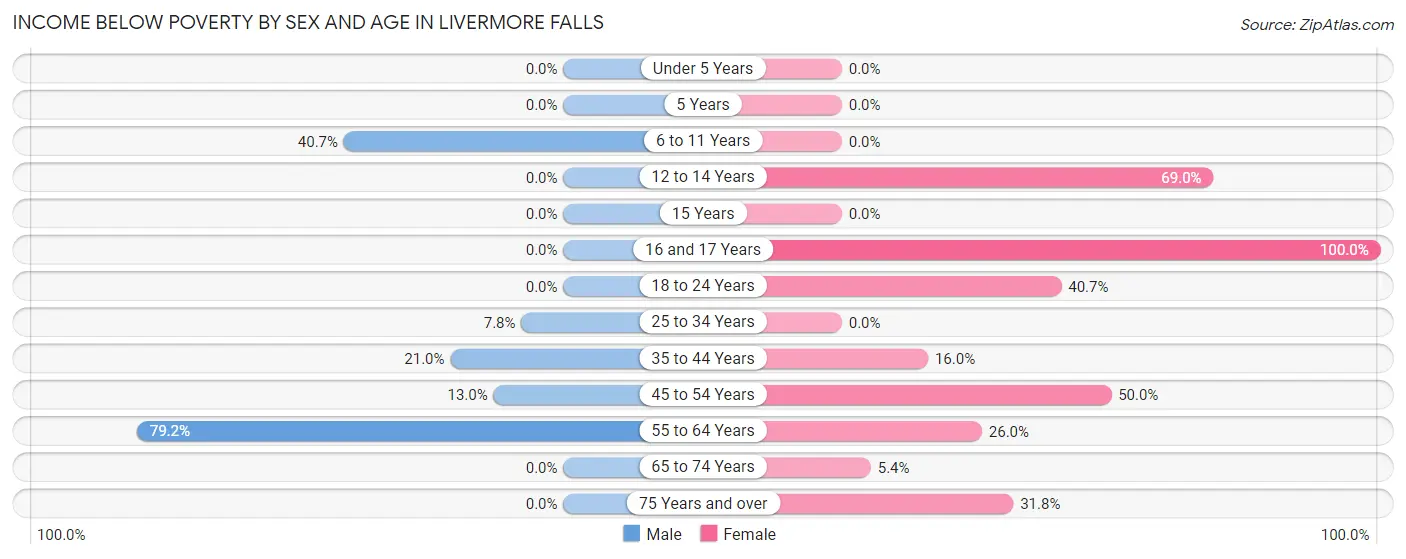
| Age Bracket | Male | Female |
| Under 5 Years | 0 (0.0%) | 0 (0.0%) |
| 5 Years | 0 (0.0%) | 0 (0.0%) |
| 6 to 11 Years | 11 (40.7%) | 0 (0.0%) |
| 12 to 14 Years | 0 (0.0%) | 40 (69.0%) |
| 15 Years | 0 (0.0%) | 0 (0.0%) |
| 16 and 17 Years | 0 (0.0%) | 11 (100.0%) |
| 18 to 24 Years | 0 (0.0%) | 22 (40.7%) |
| 25 to 34 Years | 19 (7.8%) | 0 (0.0%) |
| 35 to 44 Years | 13 (21.0%) | 12 (16.0%) |
| 45 to 54 Years | 18 (13.0%) | 75 (50.0%) |
| 55 to 64 Years | 57 (79.2%) | 26 (26.0%) |
| 65 to 74 Years | 0 (0.0%) | 5 (5.4%) |
| 75 Years and over | 0 (0.0%) | 21 (31.8%) |
| Total | 118 (13.9%) | 212 (23.1%) |
Income Above Poverty by Sex and Age in Livermore Falls
According to the poverty statistics in Livermore Falls, males aged 12 to 14 years and females aged under 5 years are the age groups that are most secure financially, with 100.0% of males and 100.0% of females in these age groups living above the poverty line.
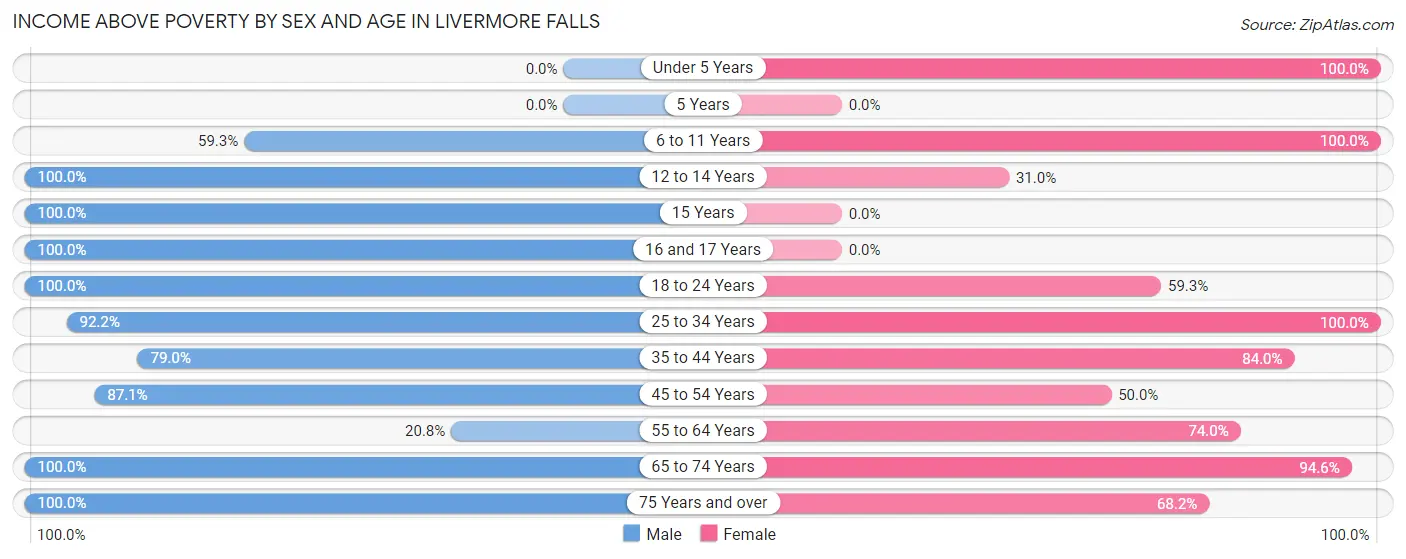
| Age Bracket | Male | Female |
| Under 5 Years | 0 (0.0%) | 176 (100.0%) |
| 5 Years | 0 (0.0%) | 0 (0.0%) |
| 6 to 11 Years | 16 (59.3%) | 18 (100.0%) |
| 12 to 14 Years | 101 (100.0%) | 18 (31.0%) |
| 15 Years | 30 (100.0%) | 0 (0.0%) |
| 16 and 17 Years | 43 (100.0%) | 0 (0.0%) |
| 18 to 24 Years | 68 (100.0%) | 32 (59.3%) |
| 25 to 34 Years | 225 (92.2%) | 115 (100.0%) |
| 35 to 44 Years | 49 (79.0%) | 63 (84.0%) |
| 45 to 54 Years | 121 (87.1%) | 75 (50.0%) |
| 55 to 64 Years | 15 (20.8%) | 74 (74.0%) |
| 65 to 74 Years | 53 (100.0%) | 88 (94.6%) |
| 75 Years and over | 10 (100.0%) | 45 (68.2%) |
| Total | 731 (86.1%) | 704 (76.9%) |
Income Below Poverty Among Married-Couple Families in Livermore Falls
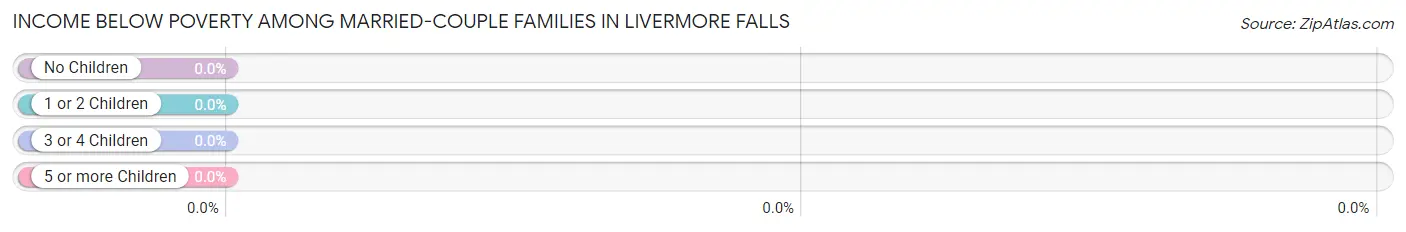
| Children | Above Poverty | Below Poverty |
| No Children | 72 (100.0%) | 0 (0.0%) |
| 1 or 2 Children | 110 (100.0%) | 0 (0.0%) |
| 3 or 4 Children | 36 (100.0%) | 0 (0.0%) |
| 5 or more Children | 0 (0.0%) | 0 (0.0%) |
| Total | 218 (100.0%) | 0 (0.0%) |
Income Below Poverty Among Single-Parent Households in Livermore Falls
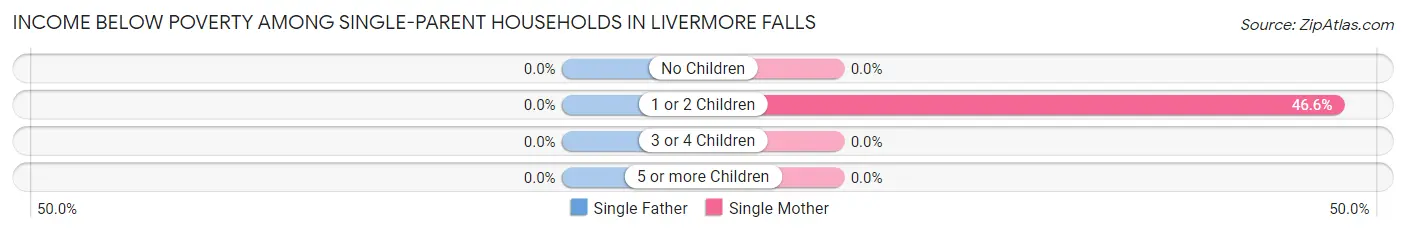
| Children | Single Father | Single Mother |
| No Children | 0 (0.0%) | 0 (0.0%) |
| 1 or 2 Children | 0 (0.0%) | 48 (46.6%) |
| 3 or 4 Children | 0 (0.0%) | 0 (0.0%) |
| 5 or more Children | 0 (0.0%) | 0 (0.0%) |
| Total | 0 (0.0%) | 48 (46.6%) |
Income Below Poverty Among Married-Couple vs Single-Parent Households in Livermore Falls
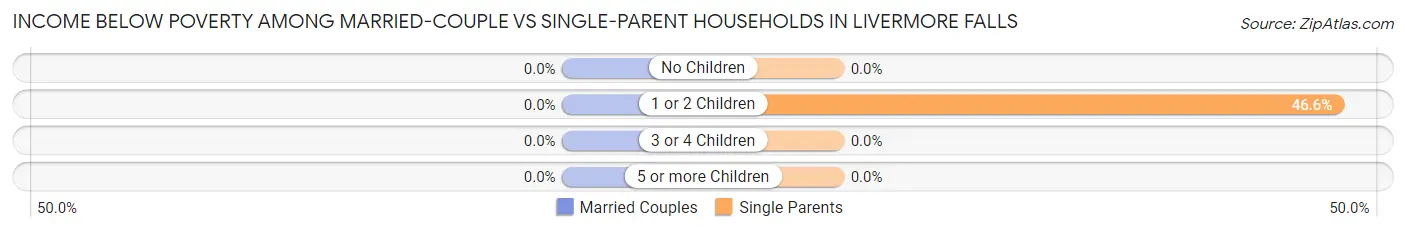
| Children | Married-Couple Families | Single-Parent Households |
| No Children | 0 (0.0%) | 0 (0.0%) |
| 1 or 2 Children | 0 (0.0%) | 48 (46.6%) |
| 3 or 4 Children | 0 (0.0%) | 0 (0.0%) |
| 5 or more Children | 0 (0.0%) | 0 (0.0%) |
| Total | 0 (0.0%) | 48 (42.1%) |
Employment Characteristics in Livermore Falls
Employment by Class of Employer in Livermore Falls
Among the 796 employed individuals in Livermore Falls, private company employees (613 | 77.0%), not-for-profit organizations (108 | 13.6%), and state government employees (40 | 5.0%) make up the most common classes of employment.
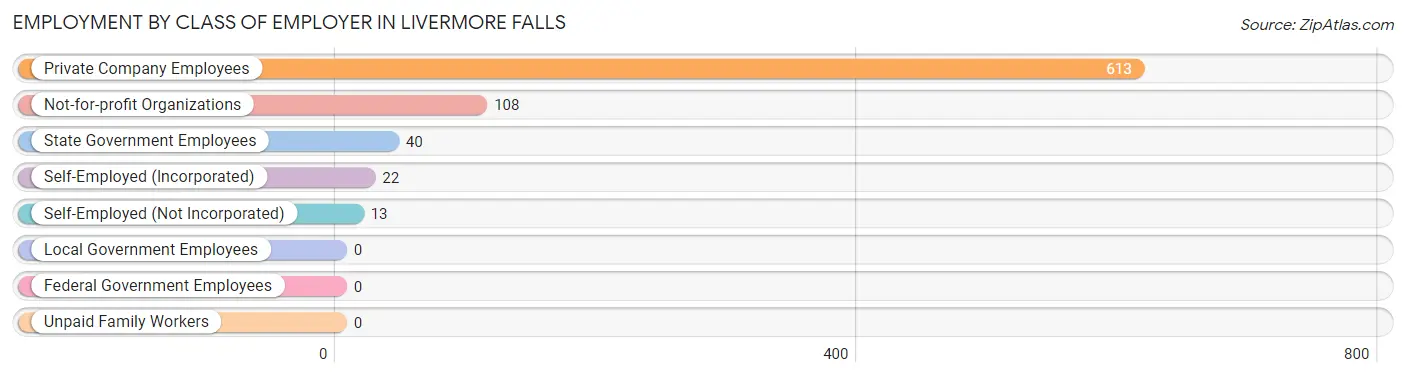
| Employer Class | # Employees | % Employees |
| Private Company Employees | 613 | 77.0% |
| Self-Employed (Incorporated) | 22 | 2.8% |
| Self-Employed (Not Incorporated) | 13 | 1.6% |
| Not-for-profit Organizations | 108 | 13.6% |
| Local Government Employees | 0 | 0.0% |
| State Government Employees | 40 | 5.0% |
| Federal Government Employees | 0 | 0.0% |
| Unpaid Family Workers | 0 | 0.0% |
| Total | 796 | 100.0% |
Employment Status by Age in Livermore Falls
According to the labor force statistics for Livermore Falls, out of the total population over 16 years of age (1,355), 62.4% or 846 individuals are in the labor force, with 3.9% or 33 of them unemployed. The age group with the highest labor force participation rate is 30 to 34 years, with 100.0% or 72 individuals in the labor force. Within the labor force, the 25 to 29 years age range has the highest percentage of unemployed individuals, with 11.6% or 33 of them being unemployed.
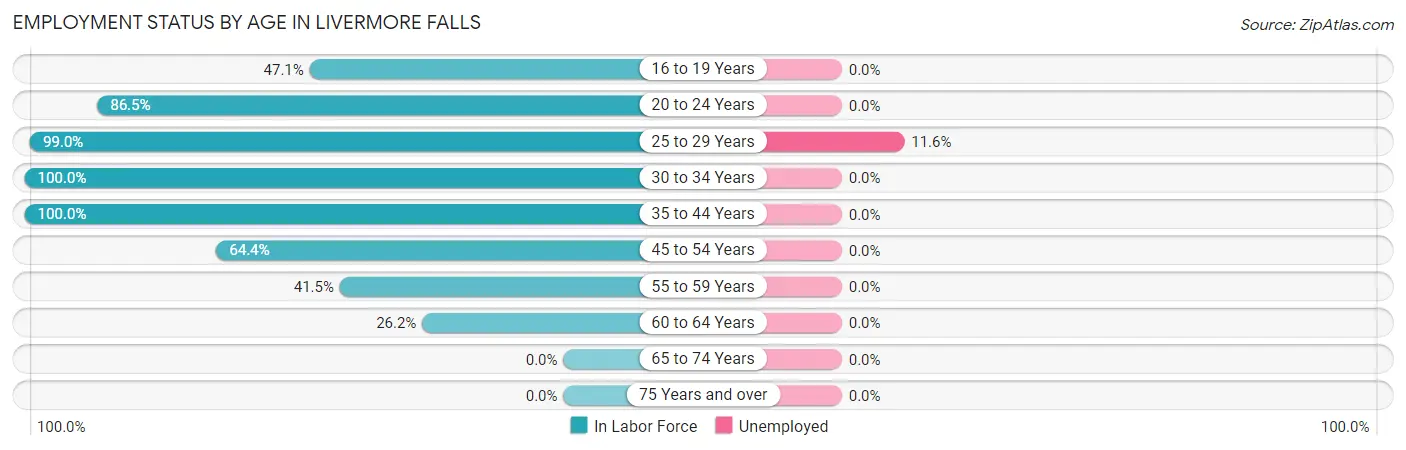
| Age Bracket | In Labor Force | Unemployed |
| 16 to 19 Years | 48 (47.1%) | 0 (0.0%) |
| 20 to 24 Years | 64 (86.5%) | 0 (0.0%) |
| 25 to 29 Years | 284 (99.0%) | 33 (11.6%) |
| 30 to 34 Years | 72 (100.0%) | 0 (0.0%) |
| 35 to 44 Years | 137 (100.0%) | 0 (0.0%) |
| 45 to 54 Years | 186 (64.4%) | 0 (0.0%) |
| 55 to 59 Years | 27 (41.5%) | 0 (0.0%) |
| 60 to 64 Years | 28 (26.2%) | 0 (0.0%) |
| 65 to 74 Years | 0 (0.0%) | 0 (0.0%) |
| 75 Years and over | 0 (0.0%) | 0 (0.0%) |
| Total | 846 (62.4%) | 33 (3.9%) |
Employment Status by Educational Attainment in Livermore Falls
According to labor force statistics for Livermore Falls, 76.7% of individuals (734) out of the total population between 25 and 64 years of age (957) are in the labor force, with 4.5% or 33 of them being unemployed. The group with the highest labor force participation rate are those with the educational attainment of bachelor's degree or higher, with 100.0% or 121 individuals in the labor force. Within the labor force, individuals with high school diploma education have the highest percentage of unemployment, with 8.6% or 33 of them being unemployed.
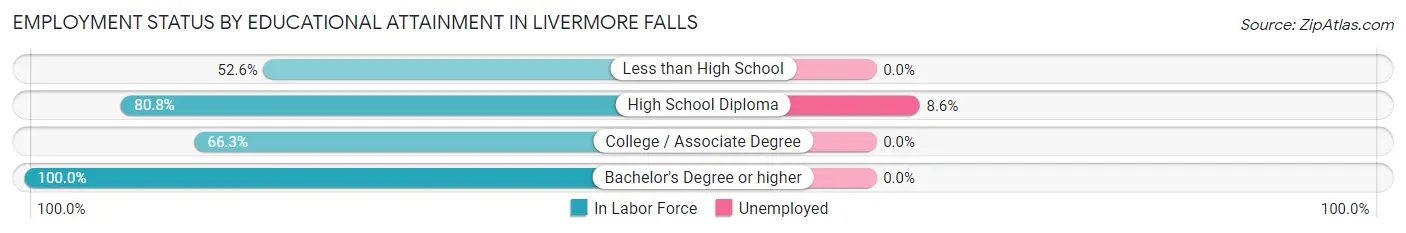
| Educational Attainment | In Labor Force | Unemployed |
| Less than High School | 40 (52.6%) | 0 (0.0%) |
| High School Diploma | 384 (80.8%) | 41 (8.6%) |
| College / Associate Degree | 189 (66.3%) | 0 (0.0%) |
| Bachelor's Degree or higher | 121 (100.0%) | 0 (0.0%) |
| Total | 734 (76.7%) | 43 (4.5%) |
Employment Occupations by Sex in Livermore Falls
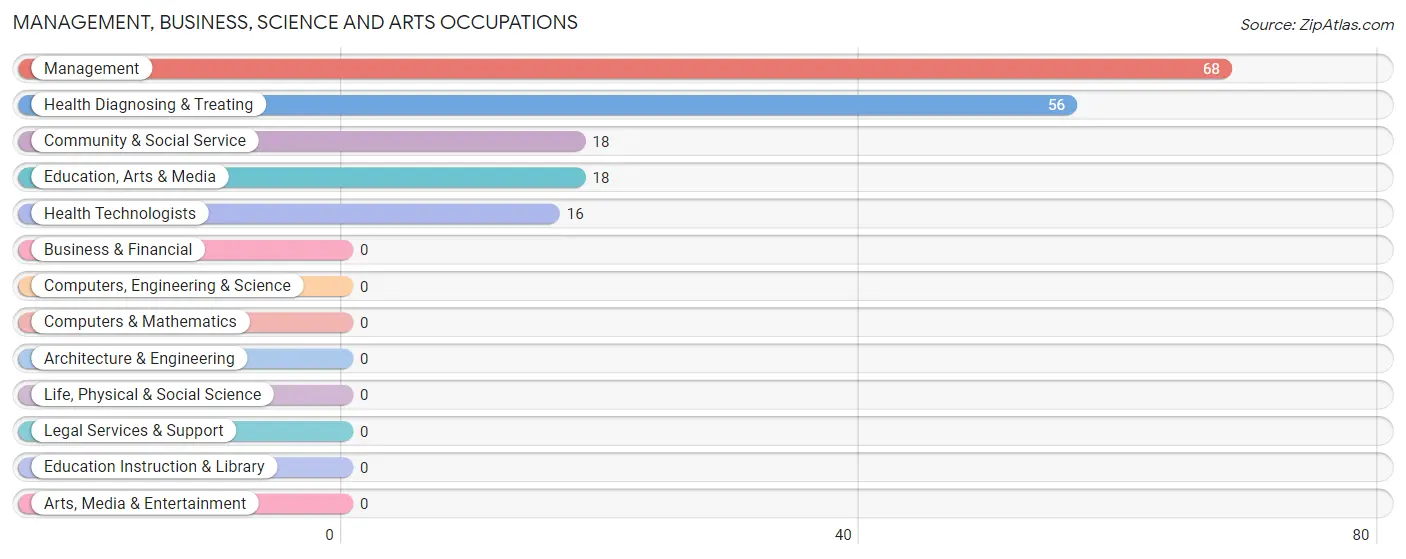
Management, Business, Science and Arts Occupations
The most common Management, Business, Science and Arts occupations in Livermore Falls are Management (68 | 8.4%), Health Diagnosing & Treating (56 | 6.9%), Community & Social Service (18 | 2.2%), Education, Arts & Media (18 | 2.2%), and Health Technologists (16 | 2.0%).
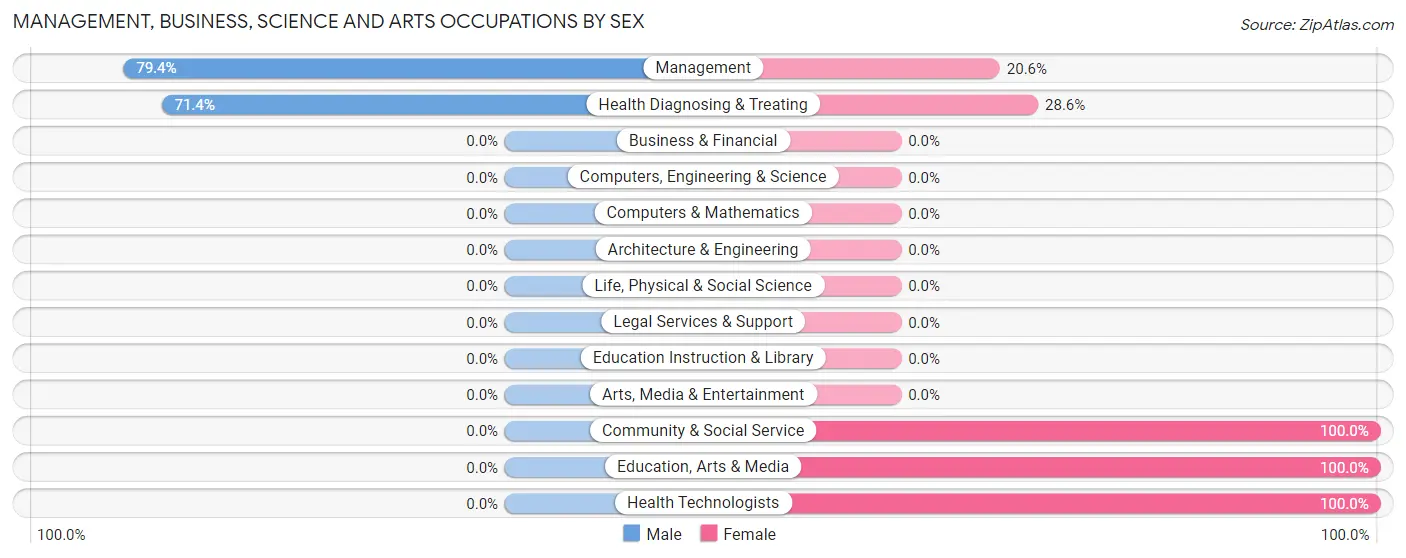
Management, Business, Science and Arts Occupations by Sex
Within the Management, Business, Science and Arts occupations in Livermore Falls, the most male-oriented occupations are Management (79.4%), and Health Diagnosing & Treating (71.4%), while the most female-oriented occupations are Community & Social Service (100.0%), Education, Arts & Media (100.0%), and Health Technologists (100.0%).
| Occupation | Male | Female |
| Management | 54 (79.4%) | 14 (20.6%) |
| Business & Financial | 0 (0.0%) | 0 (0.0%) |
| Computers, Engineering & Science | 0 (0.0%) | 0 (0.0%) |
| Computers & Mathematics | 0 (0.0%) | 0 (0.0%) |
| Architecture & Engineering | 0 (0.0%) | 0 (0.0%) |
| Life, Physical & Social Science | 0 (0.0%) | 0 (0.0%) |
| Community & Social Service | 0 (0.0%) | 18 (100.0%) |
| Education, Arts & Media | 0 (0.0%) | 18 (100.0%) |
| Legal Services & Support | 0 (0.0%) | 0 (0.0%) |
| Education Instruction & Library | 0 (0.0%) | 0 (0.0%) |
| Arts, Media & Entertainment | 0 (0.0%) | 0 (0.0%) |
| Health Diagnosing & Treating | 40 (71.4%) | 16 (28.6%) |
| Health Technologists | 0 (0.0%) | 16 (100.0%) |
| Total (Category) | 94 (66.2%) | 48 (33.8%) |
| Total (Overall) | 467 (57.4%) | 346 (42.6%) |
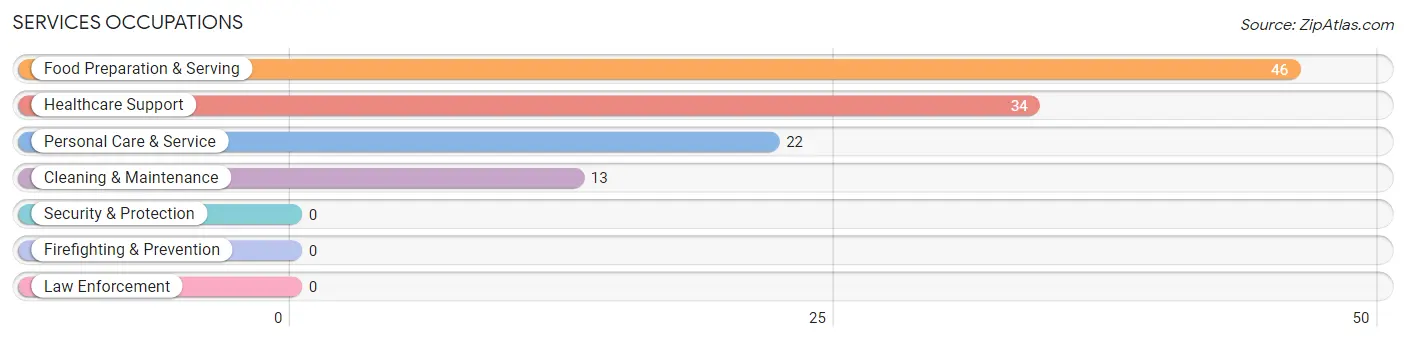
Services Occupations
The most common Services occupations in Livermore Falls are Food Preparation & Serving (46 | 5.7%), Healthcare Support (34 | 4.2%), Personal Care & Service (22 | 2.7%), and Cleaning & Maintenance (13 | 1.6%).
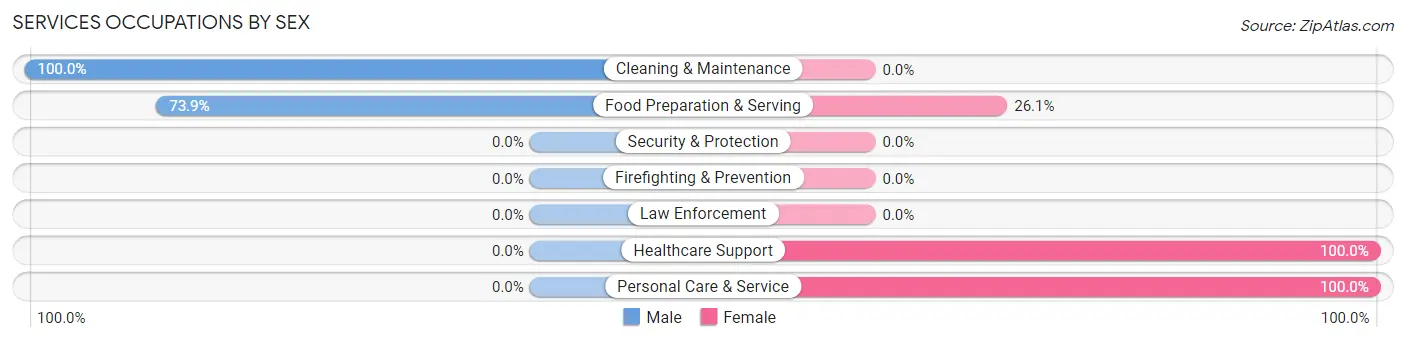
Services Occupations by Sex
Within the Services occupations in Livermore Falls, the most male-oriented occupations are Cleaning & Maintenance (100.0%), and Food Preparation & Serving (73.9%), while the most female-oriented occupations are Healthcare Support (100.0%), Personal Care & Service (100.0%), and Food Preparation & Serving (26.1%).
| Occupation | Male | Female |
| Healthcare Support | 0 (0.0%) | 34 (100.0%) |
| Security & Protection | 0 (0.0%) | 0 (0.0%) |
| Firefighting & Prevention | 0 (0.0%) | 0 (0.0%) |
| Law Enforcement | 0 (0.0%) | 0 (0.0%) |
| Food Preparation & Serving | 34 (73.9%) | 12 (26.1%) |
| Cleaning & Maintenance | 13 (100.0%) | 0 (0.0%) |
| Personal Care & Service | 0 (0.0%) | 22 (100.0%) |
| Total (Category) | 47 (40.9%) | 68 (59.1%) |
| Total (Overall) | 467 (57.4%) | 346 (42.6%) |
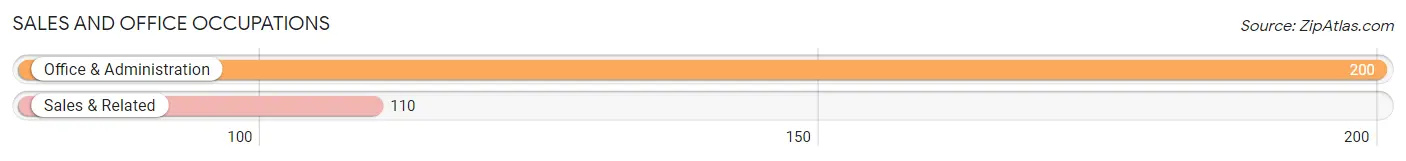
Sales and Office Occupations
The most common Sales and Office occupations in Livermore Falls are Office & Administration (200 | 24.6%), and Sales & Related (110 | 13.5%).
Sales and Office Occupations by Sex
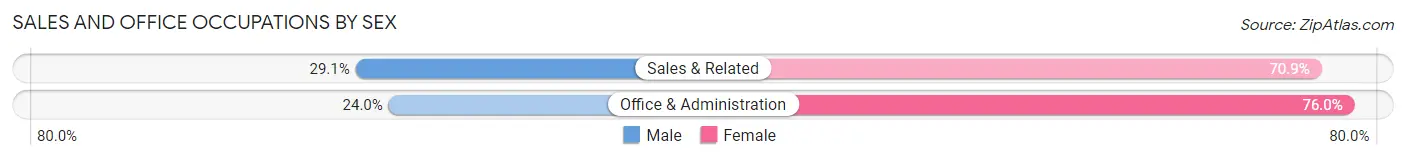
| Occupation | Male | Female |
| Sales & Related | 32 (29.1%) | 78 (70.9%) |
| Office & Administration | 48 (24.0%) | 152 (76.0%) |
| Total (Category) | 80 (25.8%) | 230 (74.2%) |
| Total (Overall) | 467 (57.4%) | 346 (42.6%) |
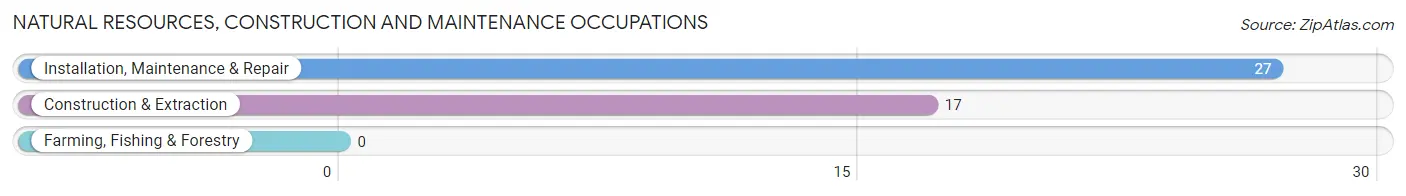
Natural Resources, Construction and Maintenance Occupations
The most common Natural Resources, Construction and Maintenance occupations in Livermore Falls are Installation, Maintenance & Repair (27 | 3.3%), and Construction & Extraction (17 | 2.1%).
Natural Resources, Construction and Maintenance Occupations by Sex
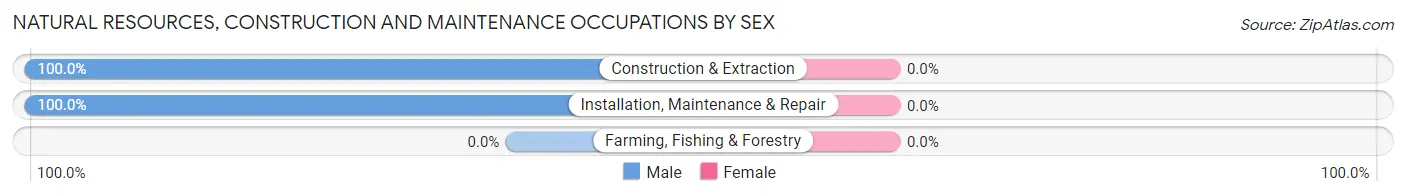
| Occupation | Male | Female |
| Farming, Fishing & Forestry | 0 (0.0%) | 0 (0.0%) |
| Construction & Extraction | 17 (100.0%) | 0 (0.0%) |
| Installation, Maintenance & Repair | 27 (100.0%) | 0 (0.0%) |
| Total (Category) | 44 (100.0%) | 0 (0.0%) |
| Total (Overall) | 467 (57.4%) | 346 (42.6%) |
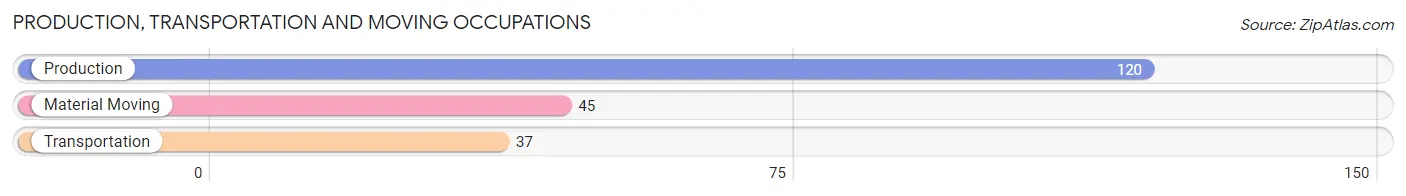
Production, Transportation and Moving Occupations
The most common Production, Transportation and Moving occupations in Livermore Falls are Production (120 | 14.8%), Material Moving (45 | 5.5%), and Transportation (37 | 4.5%).
Production, Transportation and Moving Occupations by Sex
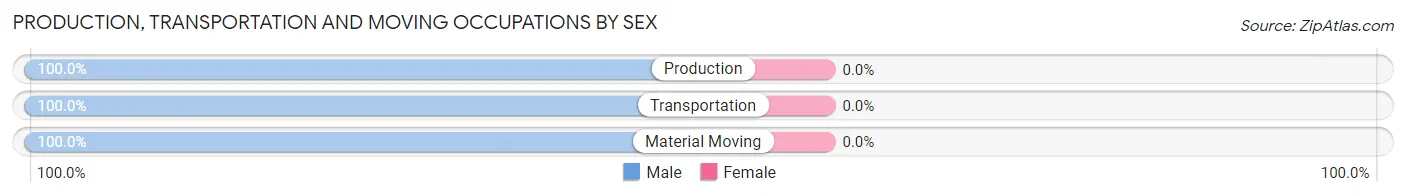
| Occupation | Male | Female |
| Production | 120 (100.0%) | 0 (0.0%) |
| Transportation | 37 (100.0%) | 0 (0.0%) |
| Material Moving | 45 (100.0%) | 0 (0.0%) |
| Total (Category) | 202 (100.0%) | 0 (0.0%) |
| Total (Overall) | 467 (57.4%) | 346 (42.6%) |
Employment Industries by Sex in Livermore Falls
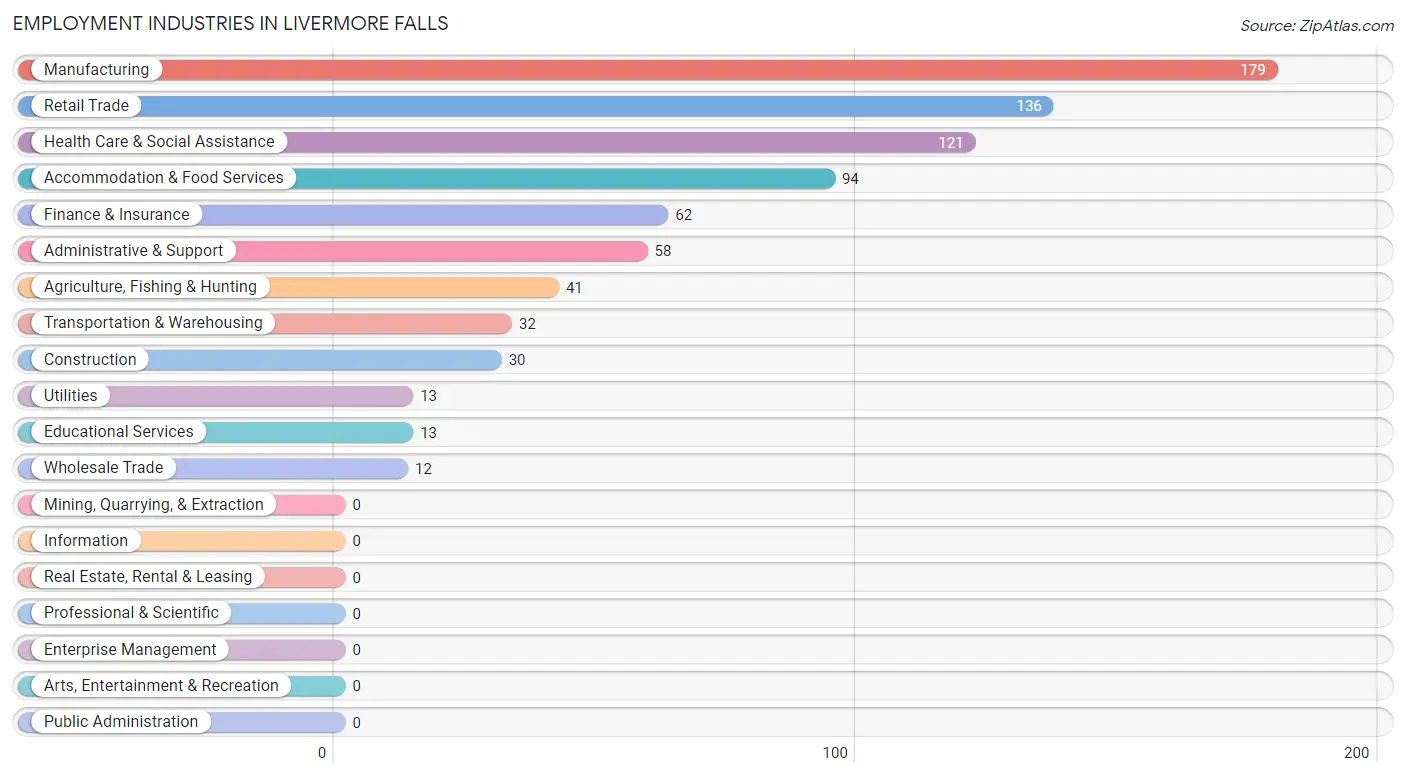
Employment Industries in Livermore Falls
The major employment industries in Livermore Falls include Manufacturing (179 | 22.0%), Retail Trade (136 | 16.7%), Health Care & Social Assistance (121 | 14.9%), Accommodation & Food Services (94 | 11.6%), and Finance & Insurance (62 | 7.6%).
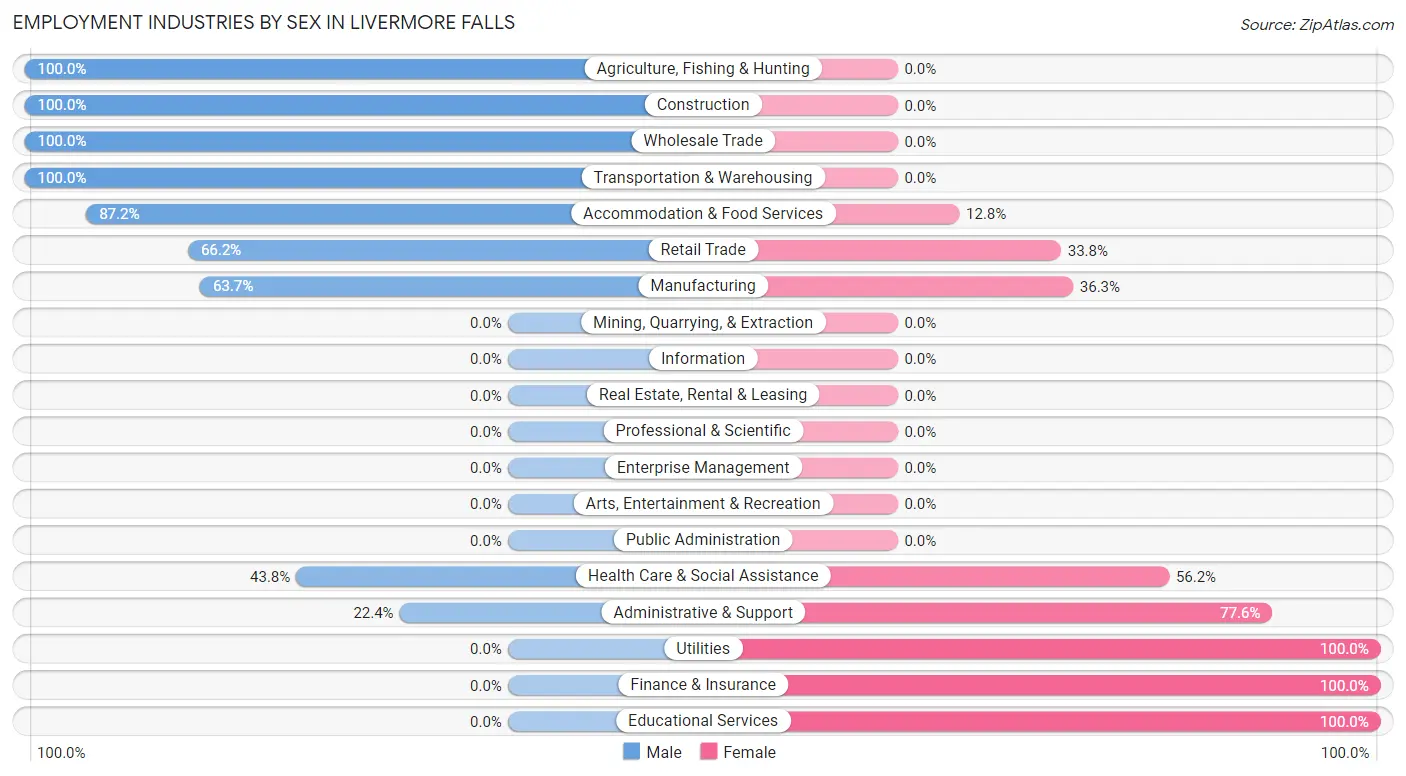
Employment Industries by Sex in Livermore Falls
The Livermore Falls industries that see more men than women are Agriculture, Fishing & Hunting (100.0%), Construction (100.0%), and Wholesale Trade (100.0%), whereas the industries that tend to have a higher number of women are Utilities (100.0%), Finance & Insurance (100.0%), and Educational Services (100.0%).
| Industry | Male | Female |
| Agriculture, Fishing & Hunting | 41 (100.0%) | 0 (0.0%) |
| Mining, Quarrying, & Extraction | 0 (0.0%) | 0 (0.0%) |
| Construction | 30 (100.0%) | 0 (0.0%) |
| Manufacturing | 114 (63.7%) | 65 (36.3%) |
| Wholesale Trade | 12 (100.0%) | 0 (0.0%) |
| Retail Trade | 90 (66.2%) | 46 (33.8%) |
| Transportation & Warehousing | 32 (100.0%) | 0 (0.0%) |
| Utilities | 0 (0.0%) | 13 (100.0%) |
| Information | 0 (0.0%) | 0 (0.0%) |
| Finance & Insurance | 0 (0.0%) | 62 (100.0%) |
| Real Estate, Rental & Leasing | 0 (0.0%) | 0 (0.0%) |
| Professional & Scientific | 0 (0.0%) | 0 (0.0%) |
| Enterprise Management | 0 (0.0%) | 0 (0.0%) |
| Administrative & Support | 13 (22.4%) | 45 (77.6%) |
| Educational Services | 0 (0.0%) | 13 (100.0%) |
| Health Care & Social Assistance | 53 (43.8%) | 68 (56.2%) |
| Arts, Entertainment & Recreation | 0 (0.0%) | 0 (0.0%) |
| Accommodation & Food Services | 82 (87.2%) | 12 (12.8%) |
| Public Administration | 0 (0.0%) | 0 (0.0%) |
| Total | 467 (57.4%) | 346 (42.6%) |
Education in Livermore Falls
School Enrollment in Livermore Falls
The most common levels of schooling among the 370 students in Livermore Falls are middle school (170 | 46.0%), high school (84 | 22.7%), and kindergarten (62 | 16.8%).
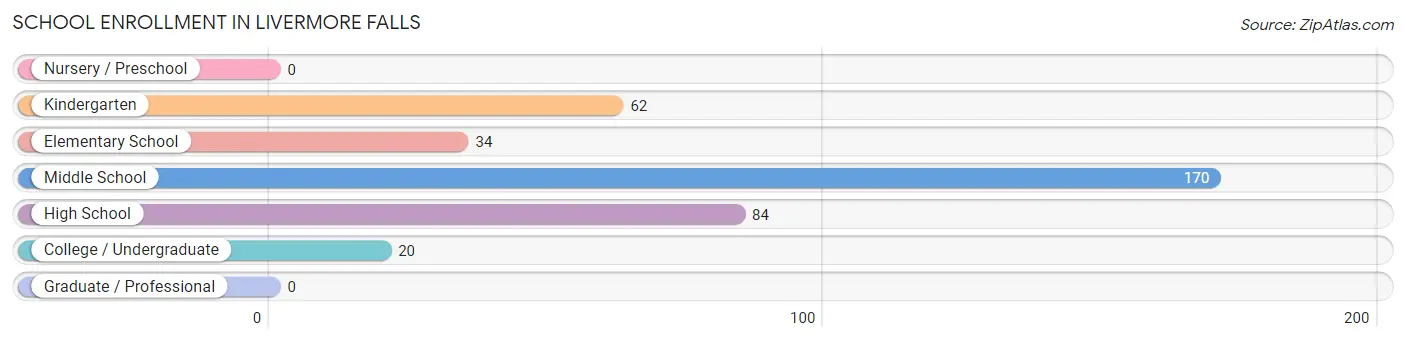
| School Level | # Students | % Students |
| Nursery / Preschool | 0 | 0.0% |
| Kindergarten | 62 | 16.8% |
| Elementary School | 34 | 9.2% |
| Middle School | 170 | 46.0% |
| High School | 84 | 22.7% |
| College / Undergraduate | 20 | 5.4% |
| Graduate / Professional | 0 | 0.0% |
| Total | 370 | 100.0% |
School Enrollment by Age by Funding Source in Livermore Falls
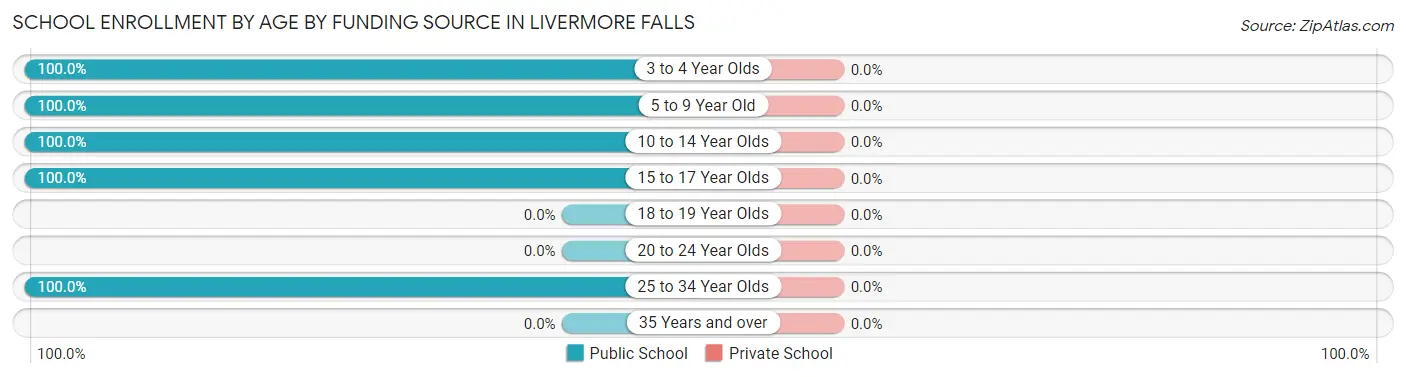
| Age Bracket | Public School | Private School |
| 3 to 4 Year Olds | 62 (100.0%) | 0 (0.0%) |
| 5 to 9 Year Old | 34 (100.0%) | 0 (0.0%) |
| 10 to 14 Year Olds | 170 (100.0%) | 0 (0.0%) |
| 15 to 17 Year Olds | 84 (100.0%) | 0 (0.0%) |
| 18 to 19 Year Olds | 0 (0.0%) | 0 (0.0%) |
| 20 to 24 Year Olds | 0 (0.0%) | 0 (0.0%) |
| 25 to 34 Year Olds | 20 (100.0%) | 0 (0.0%) |
| 35 Years and over | 0 (0.0%) | 0 (0.0%) |
| Total | 370 (100.0%) | 0 (0.0%) |
Educational Attainment by Field of Study in Livermore Falls
Business (52 | 26.9%), education (39 | 20.2%), science & technology (31 | 16.1%), psychology (21 | 10.9%), and engineering (20 | 10.4%) are the most common fields of study among 193 individuals in Livermore Falls who have obtained a bachelor's degree or higher.
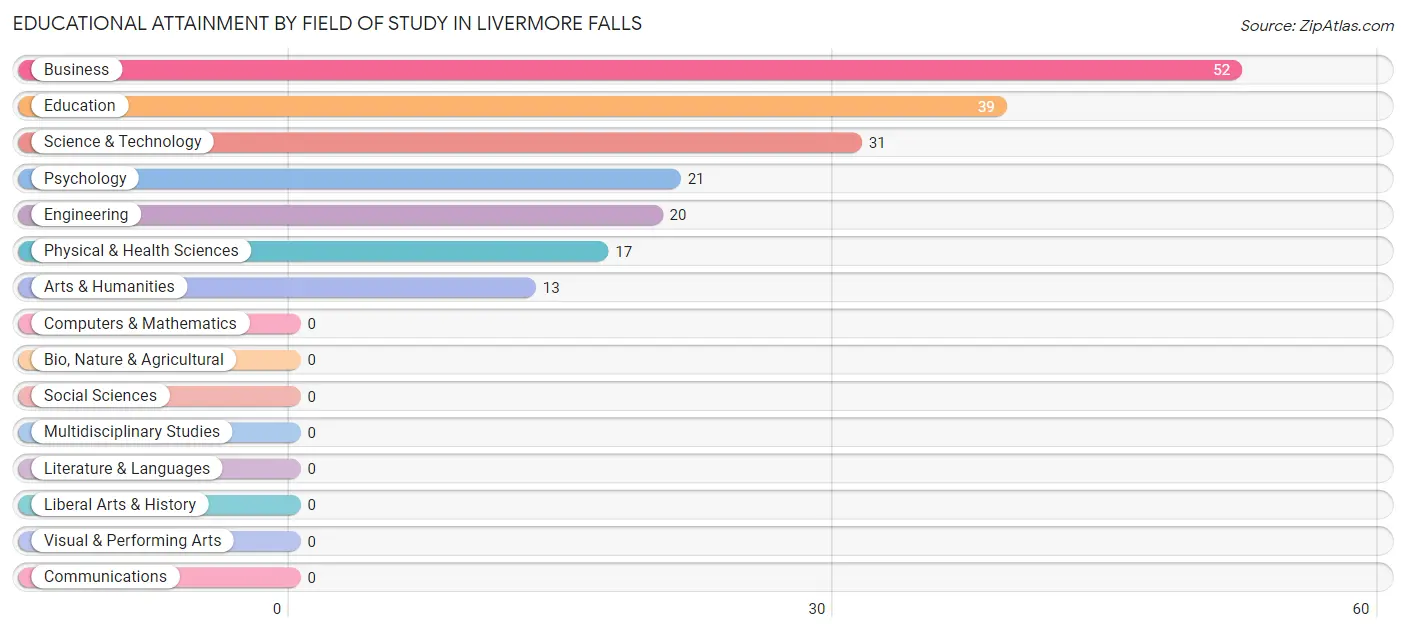
| Field of Study | # Graduates | % Graduates |
| Computers & Mathematics | 0 | 0.0% |
| Bio, Nature & Agricultural | 0 | 0.0% |
| Physical & Health Sciences | 17 | 8.8% |
| Psychology | 21 | 10.9% |
| Social Sciences | 0 | 0.0% |
| Engineering | 20 | 10.4% |
| Multidisciplinary Studies | 0 | 0.0% |
| Science & Technology | 31 | 16.1% |
| Business | 52 | 26.9% |
| Education | 39 | 20.2% |
| Literature & Languages | 0 | 0.0% |
| Liberal Arts & History | 0 | 0.0% |
| Visual & Performing Arts | 0 | 0.0% |
| Communications | 0 | 0.0% |
| Arts & Humanities | 13 | 6.7% |
| Total | 193 | 100.0% |
Transportation & Commute in Livermore Falls
Vehicle Availability by Sex in Livermore Falls
The most prevalent vehicle ownership categories in Livermore Falls are males with 2 vehicles (279, accounting for 62.0%) and females with 2 vehicles (284, making up 80.6%).
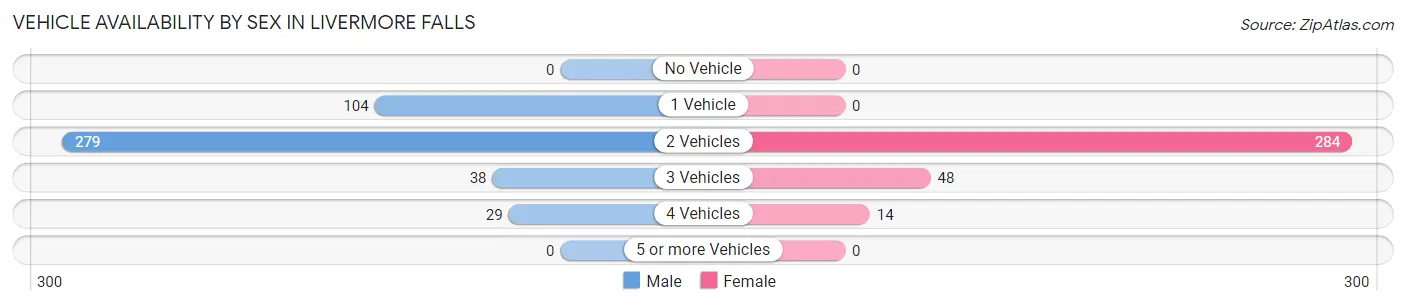
| Vehicles Available | Male | Female |
| No Vehicle | 0 (0.0%) | 0 (0.0%) |
| 1 Vehicle | 104 (23.1%) | 0 (0.0%) |
| 2 Vehicles | 279 (62.0%) | 284 (82.1%) |
| 3 Vehicles | 38 (8.4%) | 48 (13.9%) |
| 4 Vehicles | 29 (6.4%) | 14 (4.1%) |
| 5 or more Vehicles | 0 (0.0%) | 0 (0.0%) |
| Total | 450 (100.0%) | 346 (100.0%) |
Commute Time in Livermore Falls
The most frequently occuring commute durations in Livermore Falls are 45 to 59 minutes (291 commuters, 36.6%), 10 to 14 minutes (113 commuters, 14.2%), and 15 to 19 minutes (95 commuters, 11.9%).
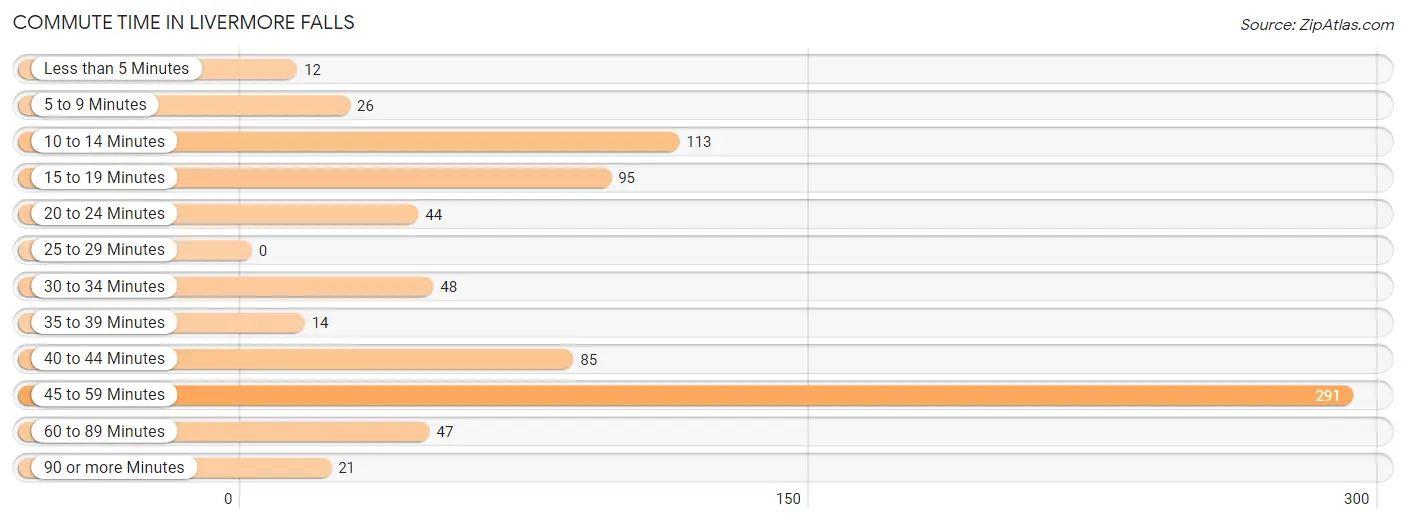
| Commute Time | # Commuters | % Commuters |
| Less than 5 Minutes | 12 | 1.5% |
| 5 to 9 Minutes | 26 | 3.3% |
| 10 to 14 Minutes | 113 | 14.2% |
| 15 to 19 Minutes | 95 | 11.9% |
| 20 to 24 Minutes | 44 | 5.5% |
| 25 to 29 Minutes | 0 | 0.0% |
| 30 to 34 Minutes | 48 | 6.0% |
| 35 to 39 Minutes | 14 | 1.8% |
| 40 to 44 Minutes | 85 | 10.7% |
| 45 to 59 Minutes | 291 | 36.6% |
| 60 to 89 Minutes | 47 | 5.9% |
| 90 or more Minutes | 21 | 2.6% |
Commute Time by Sex in Livermore Falls
The most common commute times in Livermore Falls are 45 to 59 minutes (160 commuters, 35.6%) for males and 45 to 59 minutes (131 commuters, 37.9%) for females.
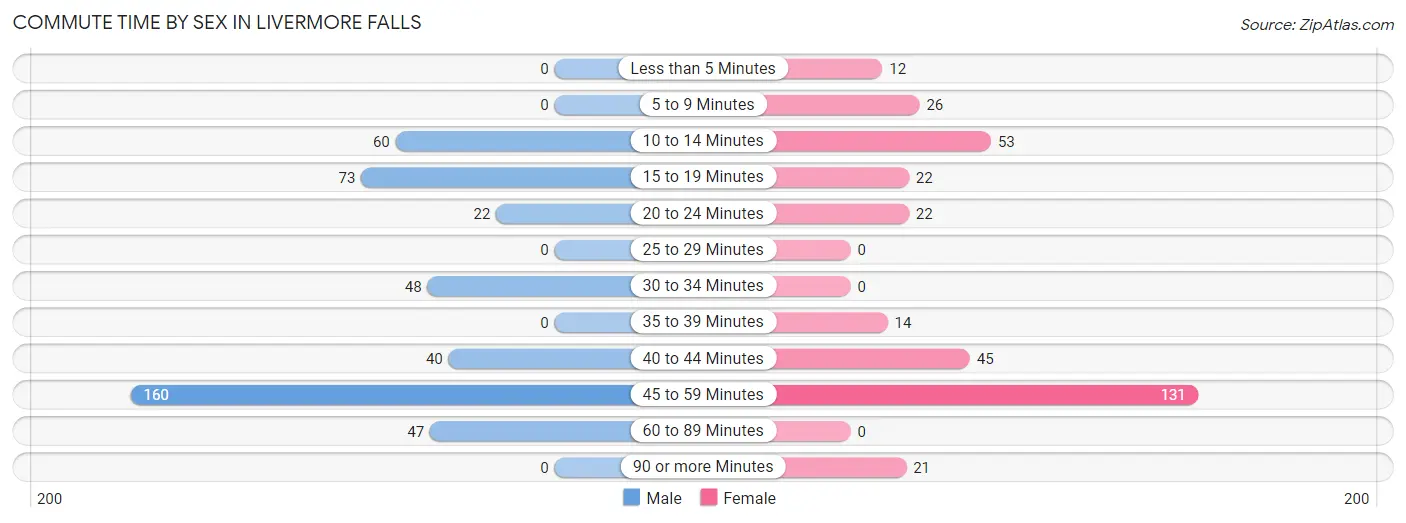
| Commute Time | Male | Female |
| Less than 5 Minutes | 0 (0.0%) | 12 (3.5%) |
| 5 to 9 Minutes | 0 (0.0%) | 26 (7.5%) |
| 10 to 14 Minutes | 60 (13.3%) | 53 (15.3%) |
| 15 to 19 Minutes | 73 (16.2%) | 22 (6.4%) |
| 20 to 24 Minutes | 22 (4.9%) | 22 (6.4%) |
| 25 to 29 Minutes | 0 (0.0%) | 0 (0.0%) |
| 30 to 34 Minutes | 48 (10.7%) | 0 (0.0%) |
| 35 to 39 Minutes | 0 (0.0%) | 14 (4.1%) |
| 40 to 44 Minutes | 40 (8.9%) | 45 (13.0%) |
| 45 to 59 Minutes | 160 (35.6%) | 131 (37.9%) |
| 60 to 89 Minutes | 47 (10.4%) | 0 (0.0%) |
| 90 or more Minutes | 0 (0.0%) | 21 (6.1%) |
Time of Departure to Work by Sex in Livermore Falls
The most frequent times of departure to work in Livermore Falls are 12:00 PM to 3:59 PM (88, 19.6%) for males and 8:00 AM to 8:29 AM (108, 31.2%) for females.
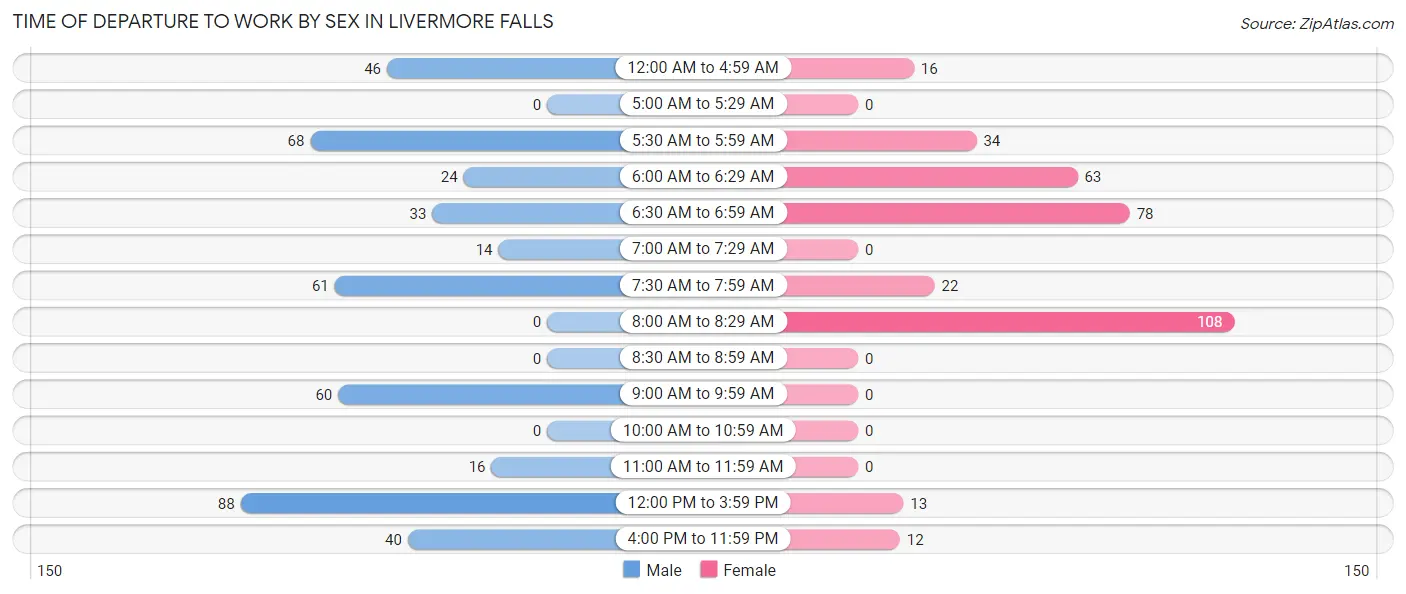
| Time of Departure | Male | Female |
| 12:00 AM to 4:59 AM | 46 (10.2%) | 16 (4.6%) |
| 5:00 AM to 5:29 AM | 0 (0.0%) | 0 (0.0%) |
| 5:30 AM to 5:59 AM | 68 (15.1%) | 34 (9.8%) |
| 6:00 AM to 6:29 AM | 24 (5.3%) | 63 (18.2%) |
| 6:30 AM to 6:59 AM | 33 (7.3%) | 78 (22.5%) |
| 7:00 AM to 7:29 AM | 14 (3.1%) | 0 (0.0%) |
| 7:30 AM to 7:59 AM | 61 (13.6%) | 22 (6.4%) |
| 8:00 AM to 8:29 AM | 0 (0.0%) | 108 (31.2%) |
| 8:30 AM to 8:59 AM | 0 (0.0%) | 0 (0.0%) |
| 9:00 AM to 9:59 AM | 60 (13.3%) | 0 (0.0%) |
| 10:00 AM to 10:59 AM | 0 (0.0%) | 0 (0.0%) |
| 11:00 AM to 11:59 AM | 16 (3.6%) | 0 (0.0%) |
| 12:00 PM to 3:59 PM | 88 (19.6%) | 13 (3.8%) |
| 4:00 PM to 11:59 PM | 40 (8.9%) | 12 (3.5%) |
| Total | 450 (100.0%) | 346 (100.0%) |
Housing Occupancy in Livermore Falls
Occupancy by Ownership in Livermore Falls
Of the total 833 dwellings in Livermore Falls, owner-occupied units account for 421 (50.5%), while renter-occupied units make up 412 (49.5%).
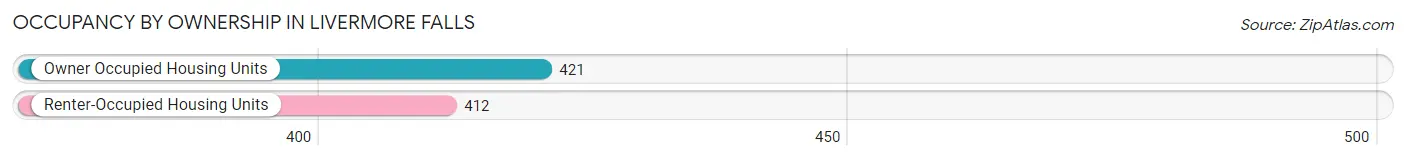
| Occupancy | # Housing Units | % Housing Units |
| Owner Occupied Housing Units | 421 | 50.5% |
| Renter-Occupied Housing Units | 412 | 49.5% |
| Total Occupied Housing Units | 833 | 100.0% |
Occupancy by Household Size in Livermore Falls
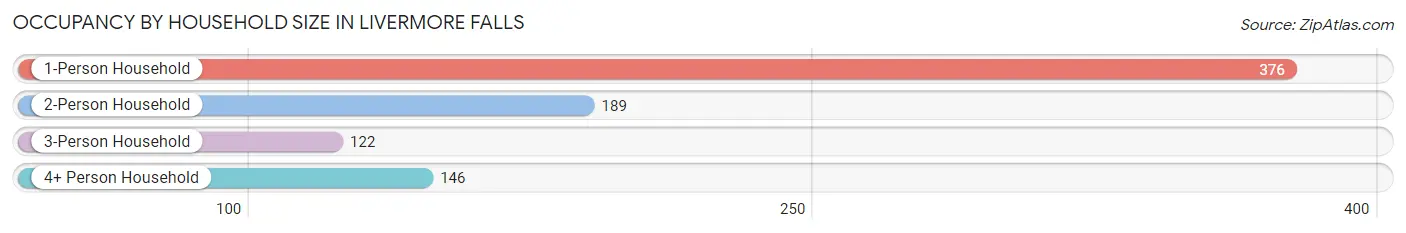
| Household Size | # Housing Units | % Housing Units |
| 1-Person Household | 376 | 45.1% |
| 2-Person Household | 189 | 22.7% |
| 3-Person Household | 122 | 14.6% |
| 4+ Person Household | 146 | 17.5% |
| Total Housing Units | 833 | 100.0% |
Occupancy by Ownership by Household Size in Livermore Falls
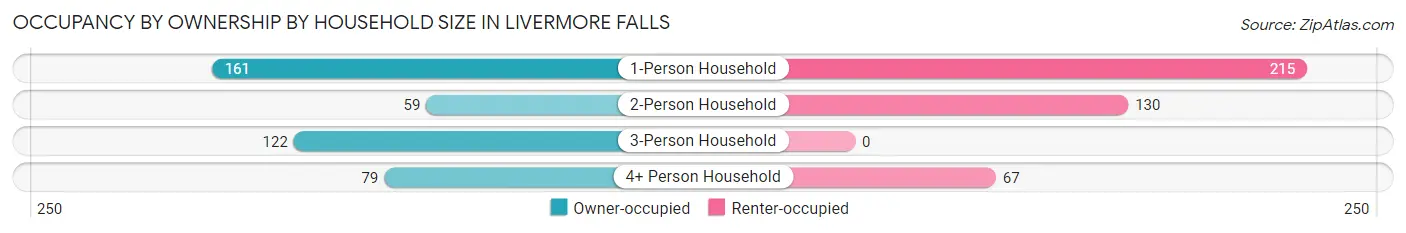
| Household Size | Owner-occupied | Renter-occupied |
| 1-Person Household | 161 (42.8%) | 215 (57.2%) |
| 2-Person Household | 59 (31.2%) | 130 (68.8%) |
| 3-Person Household | 122 (100.0%) | 0 (0.0%) |
| 4+ Person Household | 79 (54.1%) | 67 (45.9%) |
| Total Housing Units | 421 (50.5%) | 412 (49.5%) |
Occupancy by Educational Attainment in Livermore Falls
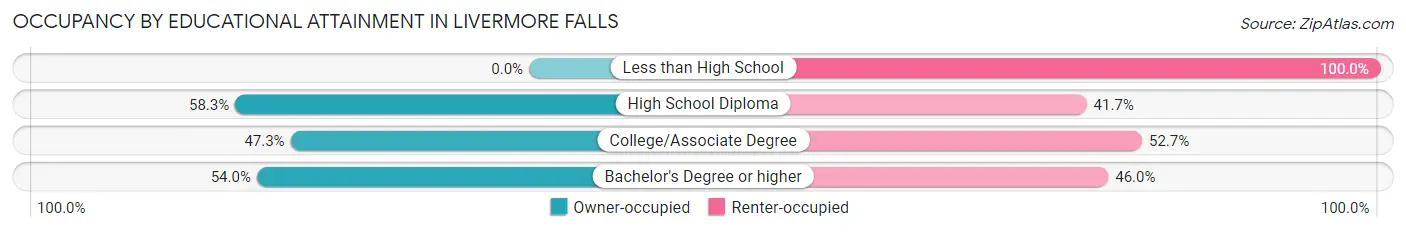
| Household Size | Owner-occupied | Renter-occupied |
| Less than High School | 0 (0.0%) | 50 (100.0%) |
| High School Diploma | 229 (58.3%) | 164 (41.7%) |
| College/Associate Degree | 131 (47.3%) | 146 (52.7%) |
| Bachelor's Degree or higher | 61 (54.0%) | 52 (46.0%) |
Occupancy by Age of Householder in Livermore Falls
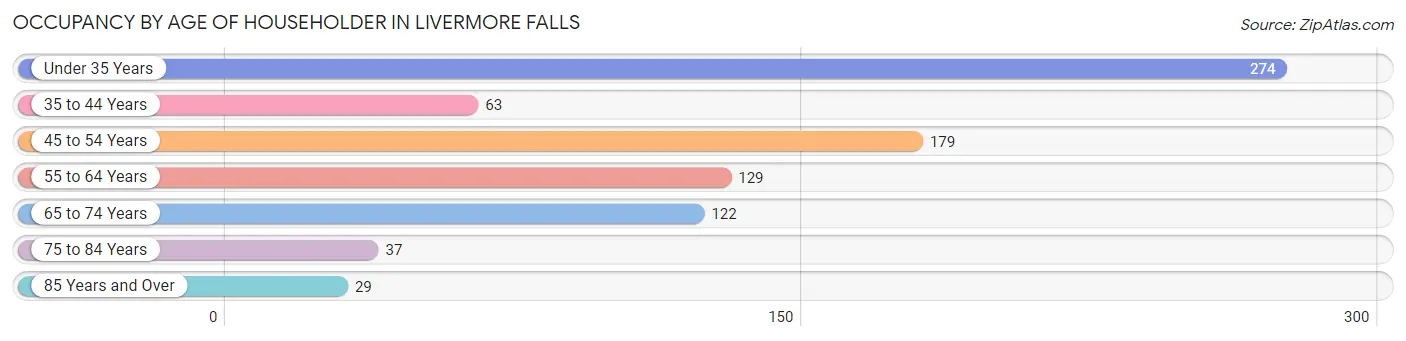
| Age Bracket | # Households | % Households |
| Under 35 Years | 274 | 32.9% |
| 35 to 44 Years | 63 | 7.6% |
| 45 to 54 Years | 179 | 21.5% |
| 55 to 64 Years | 129 | 15.5% |
| 65 to 74 Years | 122 | 14.6% |
| 75 to 84 Years | 37 | 4.4% |
| 85 Years and Over | 29 | 3.5% |
| Total | 833 | 100.0% |
Housing Finances in Livermore Falls
Median Income by Occupancy in Livermore Falls
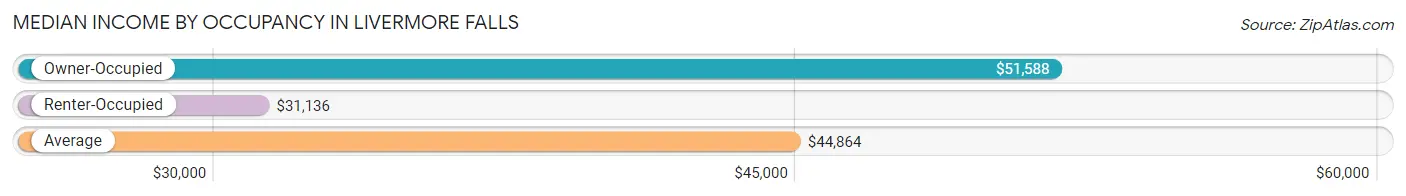
| Occupancy Type | # Households | Median Income |
| Owner-Occupied | 421 (50.5%) | $51,588 |
| Renter-Occupied | 412 (49.5%) | $31,136 |
| Average | 833 (100.0%) | $44,864 |
Occupancy by Householder Income Bracket in Livermore Falls
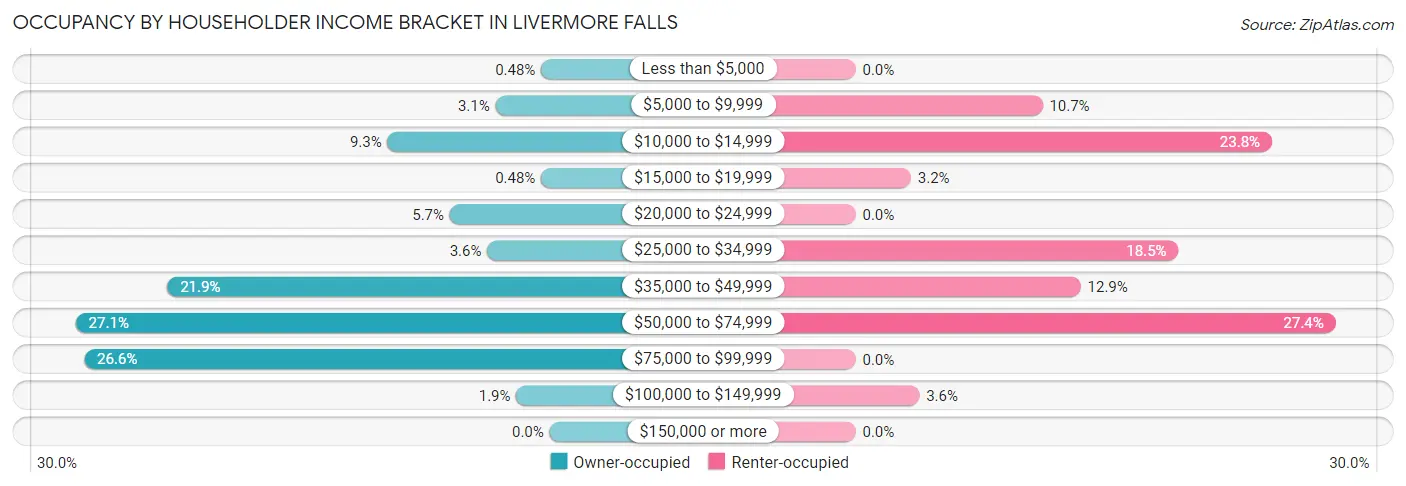
| Income Bracket | Owner-occupied | Renter-occupied |
| Less than $5,000 | 2 (0.5%) | 0 (0.0%) |
| $5,000 to $9,999 | 13 (3.1%) | 44 (10.7%) |
| $10,000 to $14,999 | 39 (9.3%) | 98 (23.8%) |
| $15,000 to $19,999 | 2 (0.5%) | 13 (3.2%) |
| $20,000 to $24,999 | 24 (5.7%) | 0 (0.0%) |
| $25,000 to $34,999 | 15 (3.6%) | 76 (18.4%) |
| $35,000 to $49,999 | 92 (21.8%) | 53 (12.9%) |
| $50,000 to $74,999 | 114 (27.1%) | 113 (27.4%) |
| $75,000 to $99,999 | 112 (26.6%) | 0 (0.0%) |
| $100,000 to $149,999 | 8 (1.9%) | 15 (3.6%) |
| $150,000 or more | 0 (0.0%) | 0 (0.0%) |
| Total | 421 (100.0%) | 412 (100.0%) |
Monthly Housing Cost Tiers in Livermore Falls
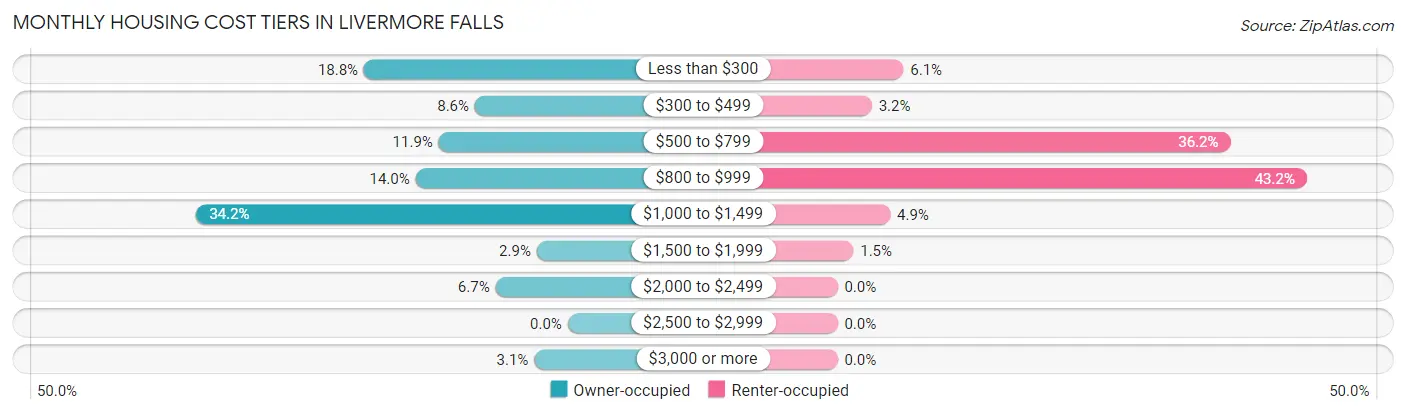
| Monthly Cost | Owner-occupied | Renter-occupied |
| Less than $300 | 79 (18.8%) | 25 (6.1%) |
| $300 to $499 | 36 (8.6%) | 13 (3.2%) |
| $500 to $799 | 50 (11.9%) | 149 (36.2%) |
| $800 to $999 | 59 (14.0%) | 178 (43.2%) |
| $1,000 to $1,499 | 144 (34.2%) | 20 (4.9%) |
| $1,500 to $1,999 | 12 (2.9%) | 6 (1.5%) |
| $2,000 to $2,499 | 28 (6.7%) | 0 (0.0%) |
| $2,500 to $2,999 | 0 (0.0%) | 0 (0.0%) |
| $3,000 or more | 13 (3.1%) | 0 (0.0%) |
| Total | 421 (100.0%) | 412 (100.0%) |
Physical Housing Characteristics in Livermore Falls
Housing Structures in Livermore Falls
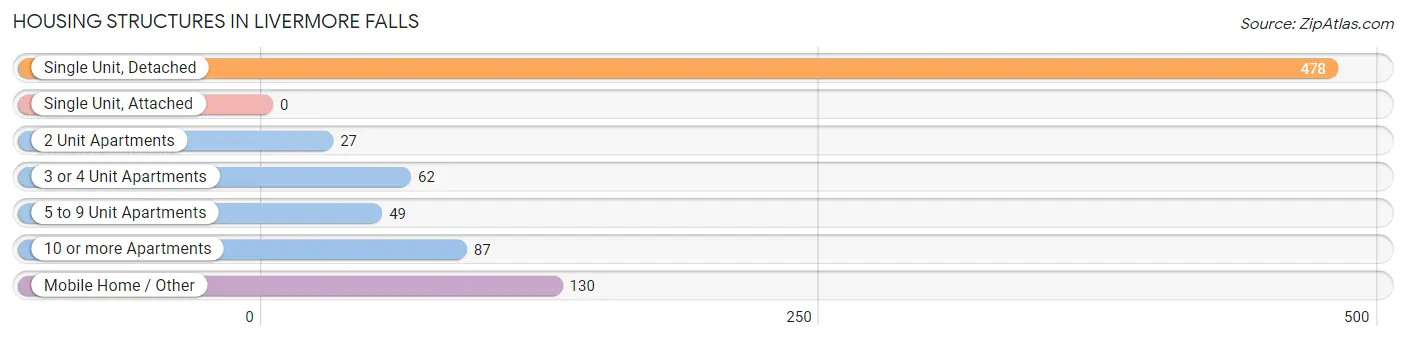
| Structure Type | # Housing Units | % Housing Units |
| Single Unit, Detached | 478 | 57.4% |
| Single Unit, Attached | 0 | 0.0% |
| 2 Unit Apartments | 27 | 3.2% |
| 3 or 4 Unit Apartments | 62 | 7.4% |
| 5 to 9 Unit Apartments | 49 | 5.9% |
| 10 or more Apartments | 87 | 10.4% |
| Mobile Home / Other | 130 | 15.6% |
| Total | 833 | 100.0% |
Housing Structures by Occupancy in Livermore Falls
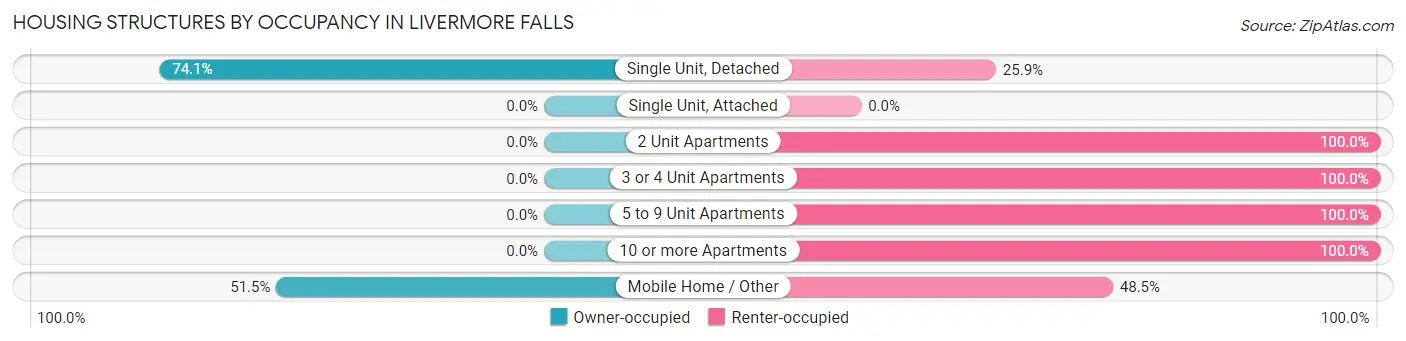
| Structure Type | Owner-occupied | Renter-occupied |
| Single Unit, Detached | 354 (74.1%) | 124 (25.9%) |
| Single Unit, Attached | 0 (0.0%) | 0 (0.0%) |
| 2 Unit Apartments | 0 (0.0%) | 27 (100.0%) |
| 3 or 4 Unit Apartments | 0 (0.0%) | 62 (100.0%) |
| 5 to 9 Unit Apartments | 0 (0.0%) | 49 (100.0%) |
| 10 or more Apartments | 0 (0.0%) | 87 (100.0%) |
| Mobile Home / Other | 67 (51.5%) | 63 (48.5%) |
| Total | 421 (50.5%) | 412 (49.5%) |
Housing Structures by Number of Rooms in Livermore Falls
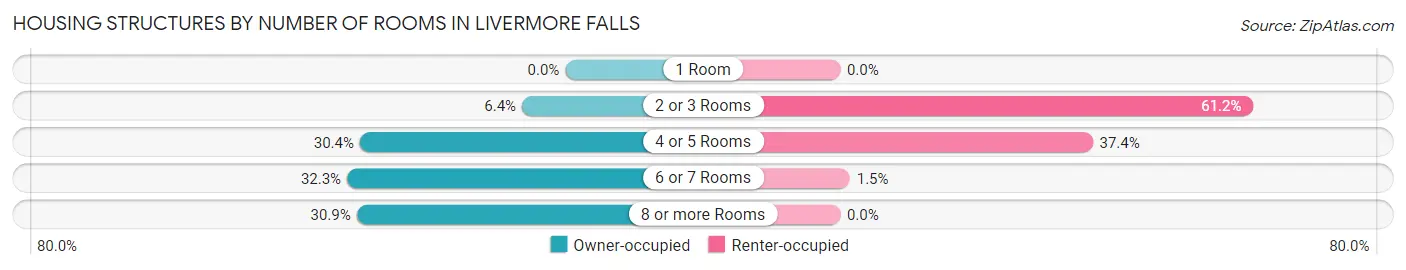
| Number of Rooms | Owner-occupied | Renter-occupied |
| 1 Room | 0 (0.0%) | 0 (0.0%) |
| 2 or 3 Rooms | 27 (6.4%) | 252 (61.2%) |
| 4 or 5 Rooms | 128 (30.4%) | 154 (37.4%) |
| 6 or 7 Rooms | 136 (32.3%) | 6 (1.5%) |
| 8 or more Rooms | 130 (30.9%) | 0 (0.0%) |
| Total | 421 (100.0%) | 412 (100.0%) |
Housing Structure by Heating Type in Livermore Falls
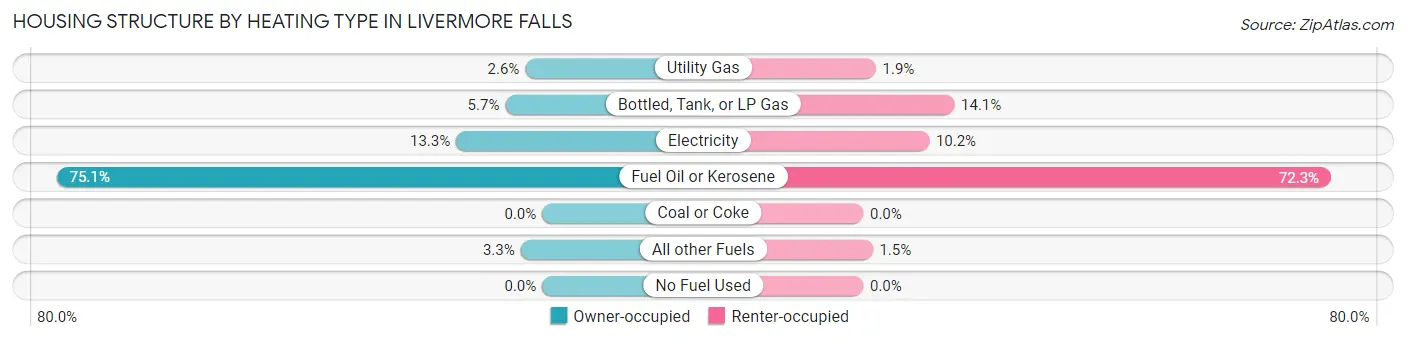
| Heating Type | Owner-occupied | Renter-occupied |
| Utility Gas | 11 (2.6%) | 8 (1.9%) |
| Bottled, Tank, or LP Gas | 24 (5.7%) | 58 (14.1%) |
| Electricity | 56 (13.3%) | 42 (10.2%) |
| Fuel Oil or Kerosene | 316 (75.1%) | 298 (72.3%) |
| Coal or Coke | 0 (0.0%) | 0 (0.0%) |
| All other Fuels | 14 (3.3%) | 6 (1.5%) |
| No Fuel Used | 0 (0.0%) | 0 (0.0%) |
| Total | 421 (100.0%) | 412 (100.0%) |
Household Vehicle Usage in Livermore Falls
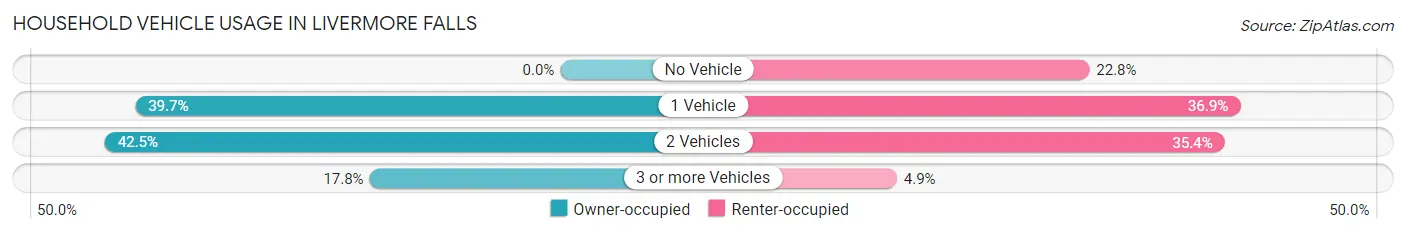
| Vehicles per Household | Owner-occupied | Renter-occupied |
| No Vehicle | 0 (0.0%) | 94 (22.8%) |
| 1 Vehicle | 167 (39.7%) | 152 (36.9%) |
| 2 Vehicles | 179 (42.5%) | 146 (35.4%) |
| 3 or more Vehicles | 75 (17.8%) | 20 (4.9%) |
| Total | 421 (100.0%) | 412 (100.0%) |
Real Estate & Mortgages in Livermore Falls
Real Estate and Mortgage Overview in Livermore Falls
| Characteristic | Without Mortgage | With Mortgage |
| Housing Units | 165 | 256 |
| Median Property Value | $71,100 | $113,300 |
| Median Household Income | $50,341 | $0 |
| Monthly Housing Costs | $404 | $13 |
| Real Estate Taxes | $1,069 | $0 |
Property Value by Mortgage Status in Livermore Falls
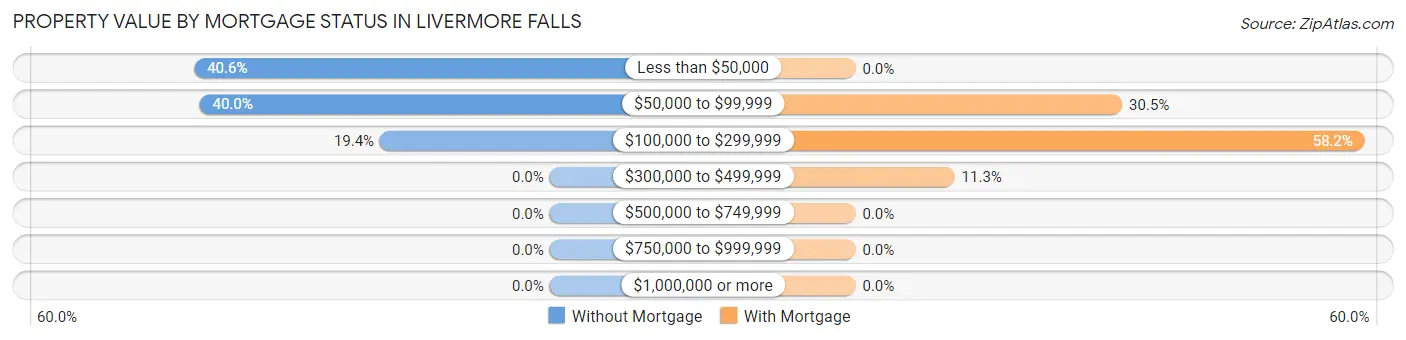
| Property Value | Without Mortgage | With Mortgage |
| Less than $50,000 | 67 (40.6%) | 0 (0.0%) |
| $50,000 to $99,999 | 66 (40.0%) | 78 (30.5%) |
| $100,000 to $299,999 | 32 (19.4%) | 149 (58.2%) |
| $300,000 to $499,999 | 0 (0.0%) | 29 (11.3%) |
| $500,000 to $749,999 | 0 (0.0%) | 0 (0.0%) |
| $750,000 to $999,999 | 0 (0.0%) | 0 (0.0%) |
| $1,000,000 or more | 0 (0.0%) | 0 (0.0%) |
| Total | 165 (100.0%) | 256 (100.0%) |
Household Income by Mortgage Status in Livermore Falls
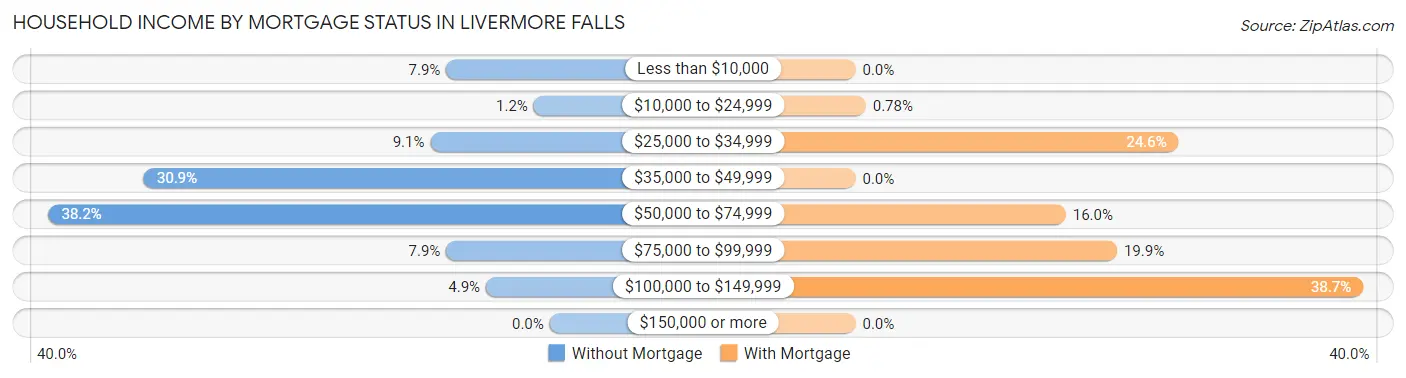
| Household Income | Without Mortgage | With Mortgage |
| Less than $10,000 | 13 (7.9%) | 0 (0.0%) |
| $10,000 to $24,999 | 2 (1.2%) | 2 (0.8%) |
| $25,000 to $34,999 | 15 (9.1%) | 63 (24.6%) |
| $35,000 to $49,999 | 51 (30.9%) | 0 (0.0%) |
| $50,000 to $74,999 | 63 (38.2%) | 41 (16.0%) |
| $75,000 to $99,999 | 13 (7.9%) | 51 (19.9%) |
| $100,000 to $149,999 | 8 (4.9%) | 99 (38.7%) |
| $150,000 or more | 0 (0.0%) | 0 (0.0%) |
| Total | 165 (100.0%) | 256 (100.0%) |
Property Value to Household Income Ratio in Livermore Falls
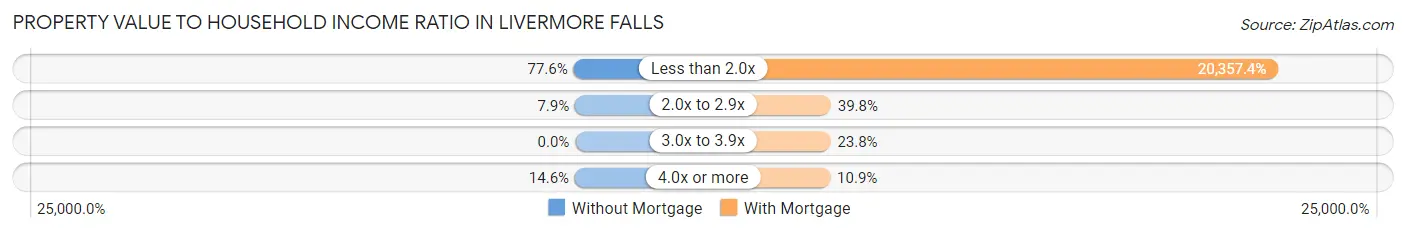
| Value-to-Income Ratio | Without Mortgage | With Mortgage |
| Less than 2.0x | 128 (77.6%) | 52,115 (20,357.4%) |
| 2.0x to 2.9x | 13 (7.9%) | 102 (39.8%) |
| 3.0x to 3.9x | 0 (0.0%) | 61 (23.8%) |
| 4.0x or more | 24 (14.5%) | 28 (10.9%) |
| Total | 165 (100.0%) | 256 (100.0%) |
Real Estate Taxes by Mortgage Status in Livermore Falls
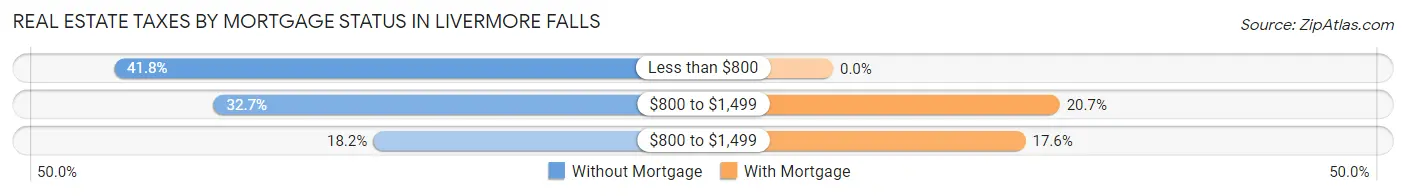
| Property Taxes | Without Mortgage | With Mortgage |
| Less than $800 | 69 (41.8%) | 0 (0.0%) |
| $800 to $1,499 | 54 (32.7%) | 53 (20.7%) |
| $800 to $1,499 | 30 (18.2%) | 45 (17.6%) |
| Total | 165 (100.0%) | 256 (100.0%) |
Health & Disability in Livermore Falls
Health Insurance Coverage by Age in Livermore Falls
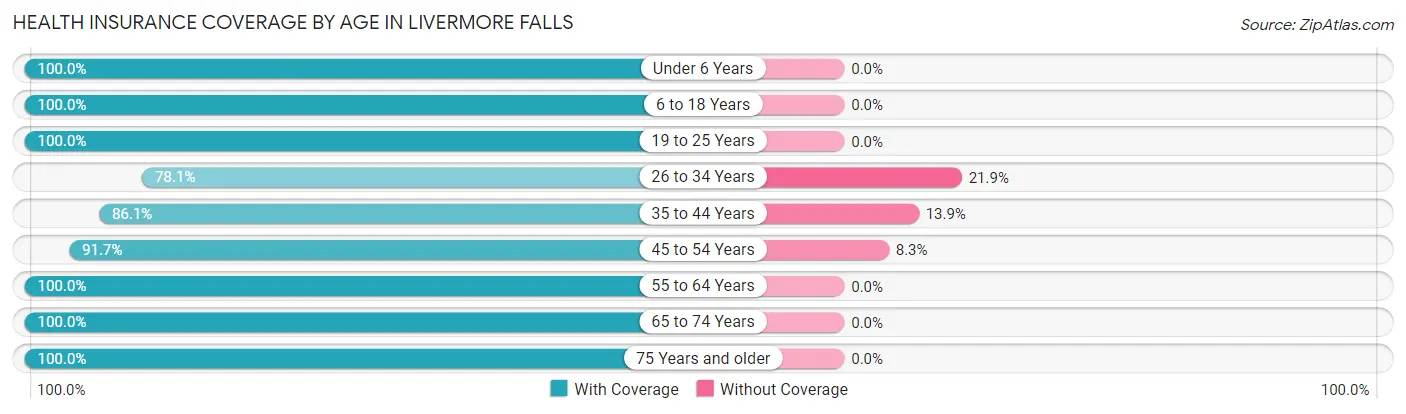
| Age Bracket | With Coverage | Without Coverage |
| Under 6 Years | 176 (100.0%) | 0 (0.0%) |
| 6 to 18 Years | 288 (100.0%) | 0 (0.0%) |
| 19 to 25 Years | 134 (100.0%) | 0 (0.0%) |
| 26 to 34 Years | 271 (78.1%) | 76 (21.9%) |
| 35 to 44 Years | 118 (86.1%) | 19 (13.9%) |
| 45 to 54 Years | 265 (91.7%) | 24 (8.3%) |
| 55 to 64 Years | 172 (100.0%) | 0 (0.0%) |
| 65 to 74 Years | 146 (100.0%) | 0 (0.0%) |
| 75 Years and older | 76 (100.0%) | 0 (0.0%) |
| Total | 1,646 (93.3%) | 119 (6.7%) |
Health Insurance Coverage by Citizenship Status in Livermore Falls
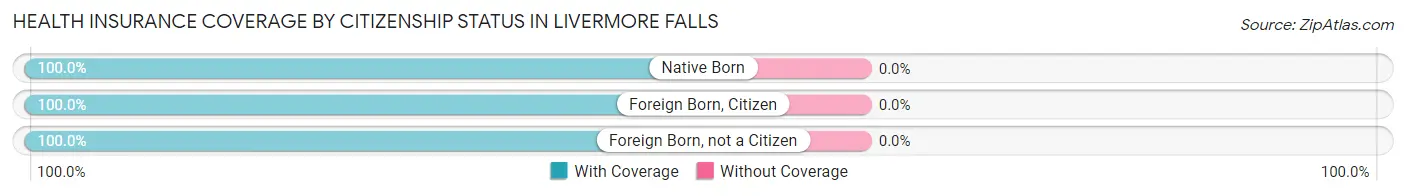
| Citizenship Status | With Coverage | Without Coverage |
| Native Born | 176 (100.0%) | 0 (0.0%) |
| Foreign Born, Citizen | 288 (100.0%) | 0 (0.0%) |
| Foreign Born, not a Citizen | 134 (100.0%) | 0 (0.0%) |
Health Insurance Coverage by Household Income in Livermore Falls
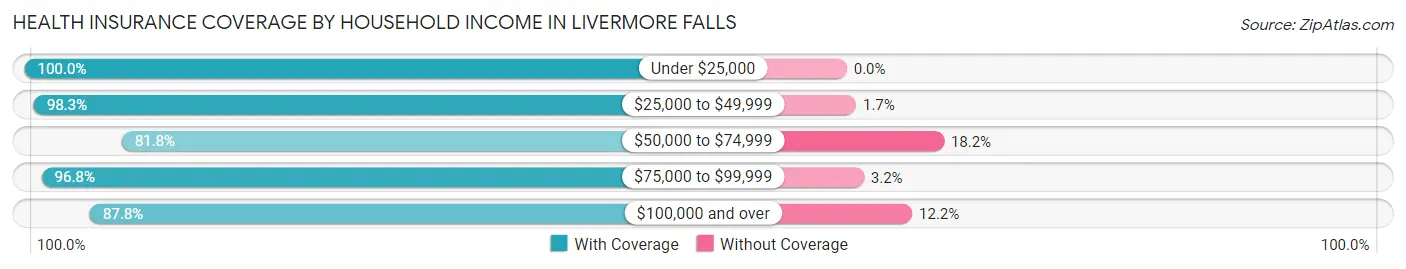
| Household Income | With Coverage | Without Coverage |
| Under $25,000 | 290 (100.0%) | 0 (0.0%) |
| $25,000 to $49,999 | 510 (98.3%) | 9 (1.7%) |
| $50,000 to $74,999 | 409 (81.8%) | 91 (18.2%) |
| $75,000 to $99,999 | 394 (96.8%) | 13 (3.2%) |
| $100,000 and over | 43 (87.8%) | 6 (12.2%) |
Public vs Private Health Insurance Coverage by Age in Livermore Falls
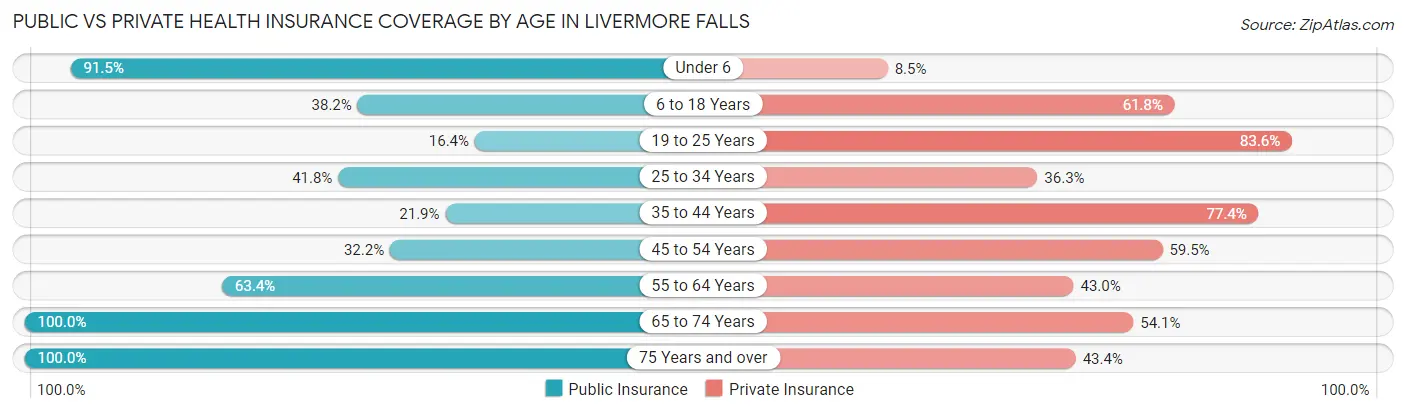
| Age Bracket | Public Insurance | Private Insurance |
| Under 6 | 161 (91.5%) | 15 (8.5%) |
| 6 to 18 Years | 110 (38.2%) | 178 (61.8%) |
| 19 to 25 Years | 22 (16.4%) | 112 (83.6%) |
| 25 to 34 Years | 145 (41.8%) | 126 (36.3%) |
| 35 to 44 Years | 30 (21.9%) | 106 (77.4%) |
| 45 to 54 Years | 93 (32.2%) | 172 (59.5%) |
| 55 to 64 Years | 109 (63.4%) | 74 (43.0%) |
| 65 to 74 Years | 146 (100.0%) | 79 (54.1%) |
| 75 Years and over | 76 (100.0%) | 33 (43.4%) |
| Total | 892 (50.5%) | 895 (50.7%) |
Disability Status by Sex by Age in Livermore Falls
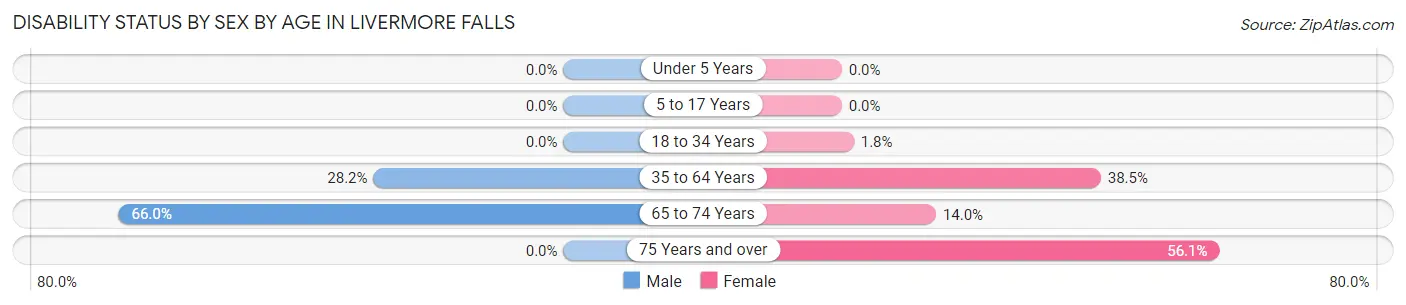
| Age Bracket | Male | Female |
| Under 5 Years | 0 (0.0%) | 0 (0.0%) |
| 5 to 17 Years | 0 (0.0%) | 0 (0.0%) |
| 18 to 34 Years | 0 (0.0%) | 3 (1.8%) |
| 35 to 64 Years | 77 (28.2%) | 125 (38.5%) |
| 65 to 74 Years | 35 (66.0%) | 13 (14.0%) |
| 75 Years and over | 0 (0.0%) | 37 (56.1%) |
Disability Class by Sex by Age in Livermore Falls
Disability Class: Hearing Difficulty
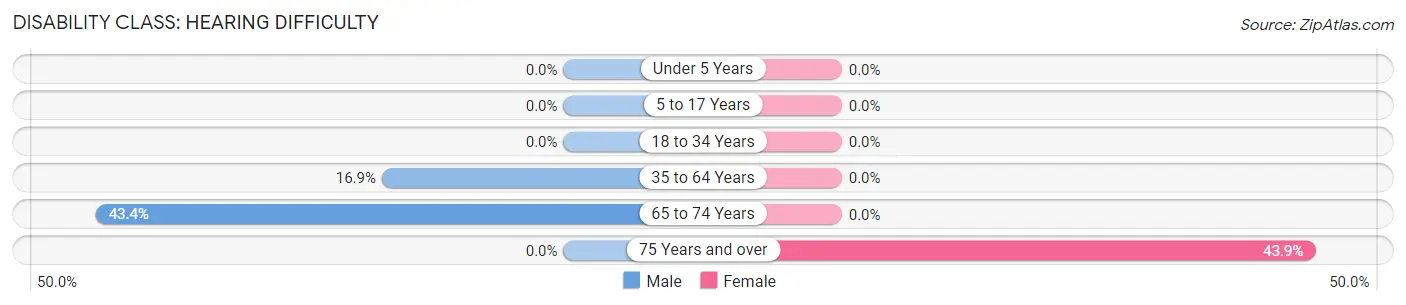
| Age Bracket | Male | Female |
| Under 5 Years | 0 (0.0%) | 0 (0.0%) |
| 5 to 17 Years | 0 (0.0%) | 0 (0.0%) |
| 18 to 34 Years | 0 (0.0%) | 0 (0.0%) |
| 35 to 64 Years | 46 (16.9%) | 0 (0.0%) |
| 65 to 74 Years | 23 (43.4%) | 0 (0.0%) |
| 75 Years and over | 0 (0.0%) | 29 (43.9%) |
Disability Class: Vision Difficulty
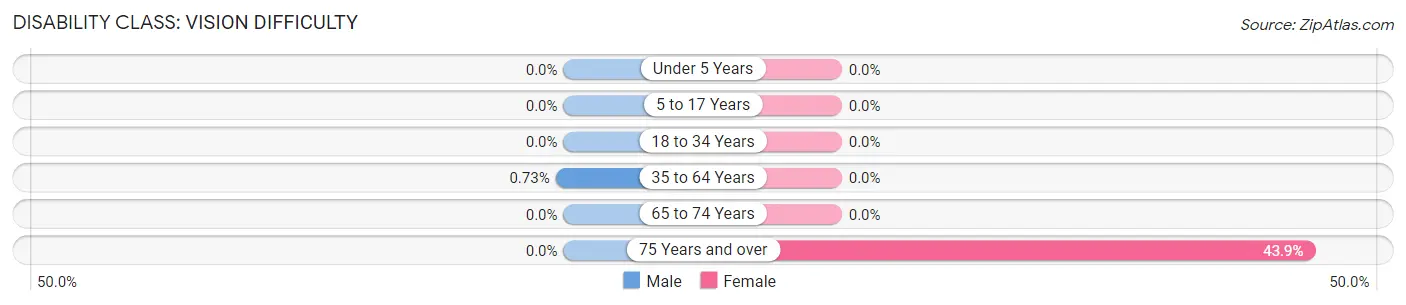
| Age Bracket | Male | Female |
| Under 5 Years | 0 (0.0%) | 0 (0.0%) |
| 5 to 17 Years | 0 (0.0%) | 0 (0.0%) |
| 18 to 34 Years | 0 (0.0%) | 0 (0.0%) |
| 35 to 64 Years | 2 (0.7%) | 0 (0.0%) |
| 65 to 74 Years | 0 (0.0%) | 0 (0.0%) |
| 75 Years and over | 0 (0.0%) | 29 (43.9%) |
Disability Class: Cognitive Difficulty
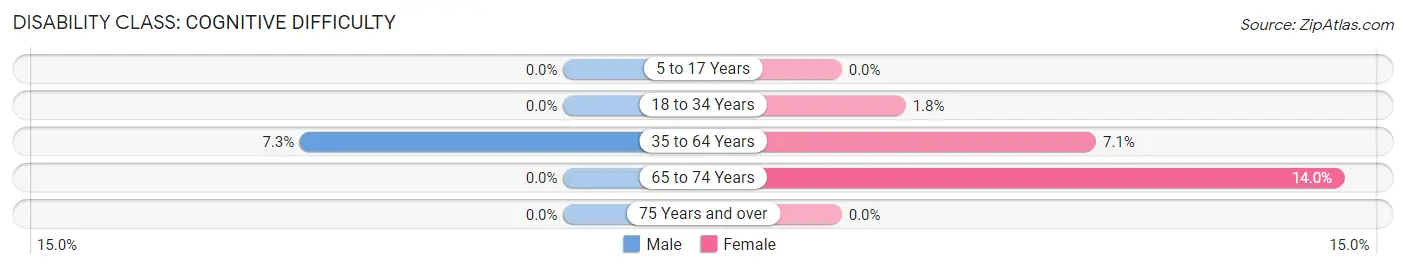
| Age Bracket | Male | Female |
| 5 to 17 Years | 0 (0.0%) | 0 (0.0%) |
| 18 to 34 Years | 0 (0.0%) | 3 (1.8%) |
| 35 to 64 Years | 20 (7.3%) | 23 (7.1%) |
| 65 to 74 Years | 0 (0.0%) | 13 (14.0%) |
| 75 Years and over | 0 (0.0%) | 0 (0.0%) |
Disability Class: Ambulatory Difficulty
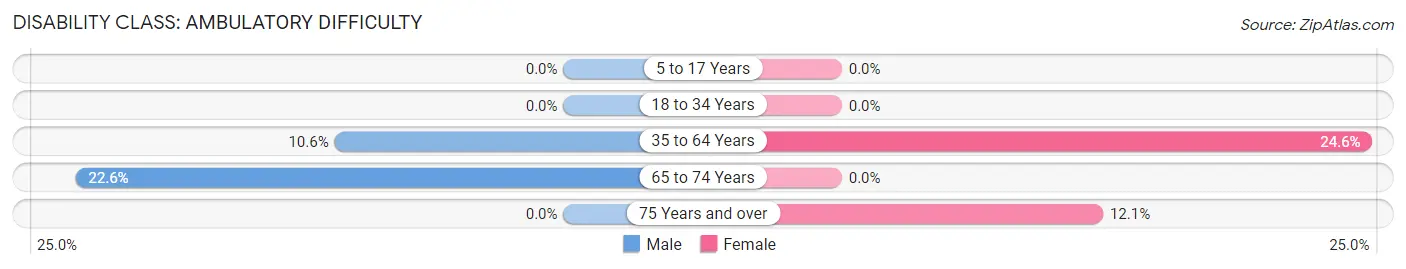
| Age Bracket | Male | Female |
| 5 to 17 Years | 0 (0.0%) | 0 (0.0%) |
| 18 to 34 Years | 0 (0.0%) | 0 (0.0%) |
| 35 to 64 Years | 29 (10.6%) | 80 (24.6%) |
| 65 to 74 Years | 12 (22.6%) | 0 (0.0%) |
| 75 Years and over | 0 (0.0%) | 8 (12.1%) |
Disability Class: Self-Care Difficulty
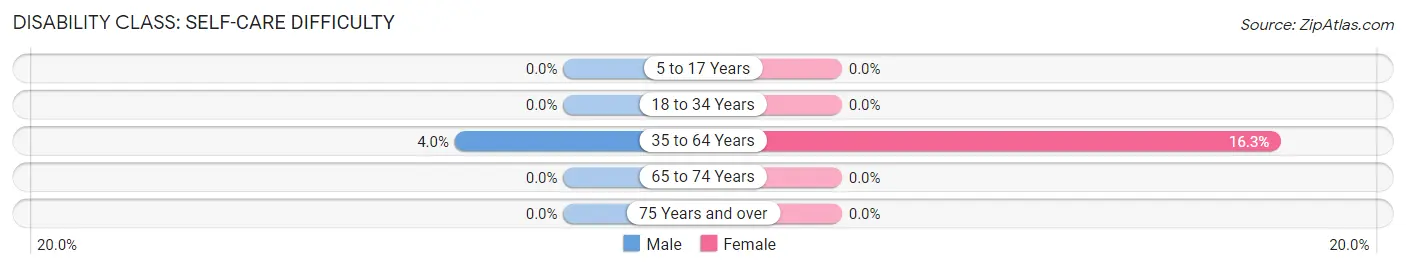
| Age Bracket | Male | Female |
| 5 to 17 Years | 0 (0.0%) | 0 (0.0%) |
| 18 to 34 Years | 0 (0.0%) | 0 (0.0%) |
| 35 to 64 Years | 11 (4.0%) | 53 (16.3%) |
| 65 to 74 Years | 0 (0.0%) | 0 (0.0%) |
| 75 Years and over | 0 (0.0%) | 0 (0.0%) |
Technology Access in Livermore Falls
Computing Device Access in Livermore Falls
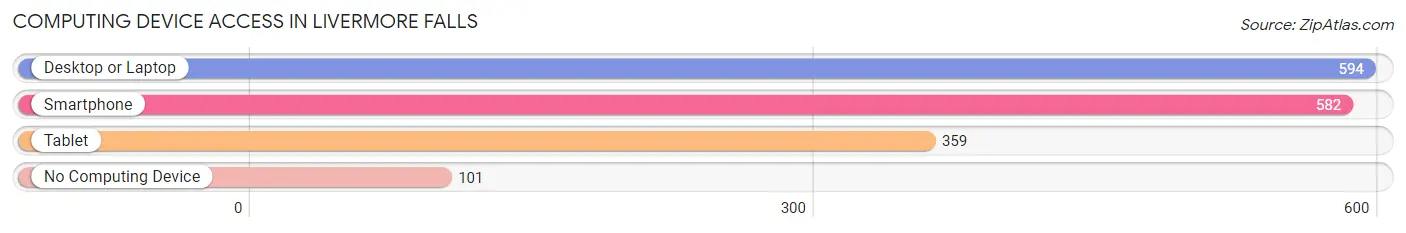
| Device Type | # Households | % Households |
| Desktop or Laptop | 594 | 71.3% |
| Smartphone | 582 | 69.9% |
| Tablet | 359 | 43.1% |
| No Computing Device | 101 | 12.1% |
| Total | 833 | 100.0% |
Internet Access in Livermore Falls
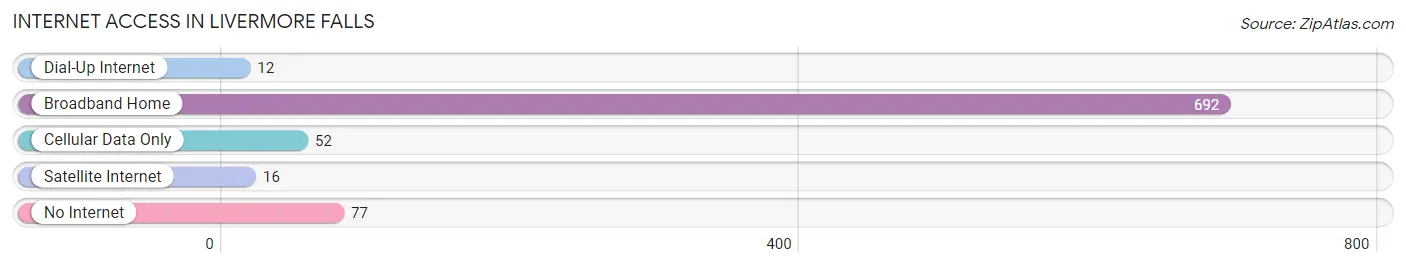
| Internet Type | # Households | % Households |
| Dial-Up Internet | 12 | 1.4% |
| Broadband Home | 692 | 83.1% |
| Cellular Data Only | 52 | 6.2% |
| Satellite Internet | 16 | 1.9% |
| No Internet | 77 | 9.2% |
| Total | 833 | 100.0% |
Livermore Falls Summary
Livermore Falls is a town located in Androscoggin County, Maine, United States. The population was 2,087 at the 2010 census. It is part of the Lewiston-Auburn, Maine metropolitan statistical area.
History
The area that is now Livermore Falls was first settled in 1790 by a group of settlers from Livermore, Massachusetts. The town was incorporated in 1802 and named after the original settlement.
In the 19th century, the town was a major lumbering center. The town was home to several sawmills, gristmills, and a paper mill. The paper mill, which was built in 1845, was the first in the state of Maine.
Geography
Livermore Falls is located at 44°37′N 70°14′W (44.619, -70.233). According to the United States Census Bureau, the town has a total area of 24.2 square miles (62.7 km2), of which, 23.9 square miles (61.8 km2) of it is land and 0.3 square miles (0.8 km2) of it (1.17%) is water.
Demographics
As of the census of 2000, there were 2,093 people, 845 households, and 571 families residing in the town. The population density was 87.3 people per square mile (33.7/km2). There were 902 housing units at an average density of 37.7 per square mile (14.6/km2). The racial makeup of the town was 97.86% White, 0.19% African American, 0.19% Native American, 0.19% Asian, 0.19% from other races, and 1.48% from two or more races. Hispanic or Latino of any race were 0.86% of the population.
Economy
Livermore Falls is a small rural town with a population of just over 2,000 people. The town is home to several small businesses, including a few restaurants, a grocery store, a hardware store, and a few other small shops. The town is also home to a paper mill, which is the largest employer in the area. The mill employs over 200 people and produces paper products for the local and regional markets.
The town is also home to several farms, which produce a variety of crops, including potatoes, corn, and hay. The town is also home to several apple orchards, which produce apples for the local and regional markets.
Conclusion
Livermore Falls is a small rural town located in Androscoggin County, Maine. The town has a population of just over 2,000 people and is home to several small businesses, a paper mill, and several farms. The town has a rich history, with the first settlers arriving in 1790, and the first paper mill being built in 1845. The town is a great place to live, work, and raise a family, and is a great example of rural Maine life.
Common Questions
What is the Total Population of Livermore Falls?
Total Population of Livermore Falls is 1,765.
What is the Total Male Population of Livermore Falls?
Total Male Population of Livermore Falls is 849.
What is the Total Female Population of Livermore Falls?
Total Female Population of Livermore Falls is 916.
What is the Ratio of Males per 100 Females in Livermore Falls?
There are 92.69 Males per 100 Females in Livermore Falls.
What is the Ratio of Females per 100 Males in Livermore Falls?
There are 107.89 Females per 100 Males in Livermore Falls.
What is the Median Population Age in Livermore Falls?
Median Population Age in Livermore Falls is 30.8 Years.
What is the Average Family Size in Livermore Falls
Average Family Size in Livermore Falls is 3.3 People.
What is the Average Household Size in Livermore Falls
Average Household Size in Livermore Falls is 2.1 People.
What is Per Capita Income in Livermore Falls?
Per Capita income in Livermore Falls is $20,947.
What is the Median Family Income in Livermore Falls?
Median Family Income in Livermore Falls is $47,212.
What is the Median Household income in Livermore Falls?
Median Household Income in Livermore Falls is $44,864.
What is Income or Wage Gap in Livermore Falls?
Income or Wage Gap in Livermore Falls is 10.6%.
Women in Livermore Falls earn 89.4 cents for every dollar earned by a man.
What is Inequality or Gini Index in Livermore Falls?
Inequality or Gini Index in Livermore Falls is 0.34.
How Large is the Labor Force in Livermore Falls?
There are 846 People in the Labor Forcein in Livermore Falls.
What is the Percentage of People in the Labor Force in Livermore Falls?
62.4% of People are in the Labor Force in Livermore Falls.
What is the Unemployment Rate in Livermore Falls?
Unemployment Rate in Livermore Falls is 3.9%.