Gray, ME
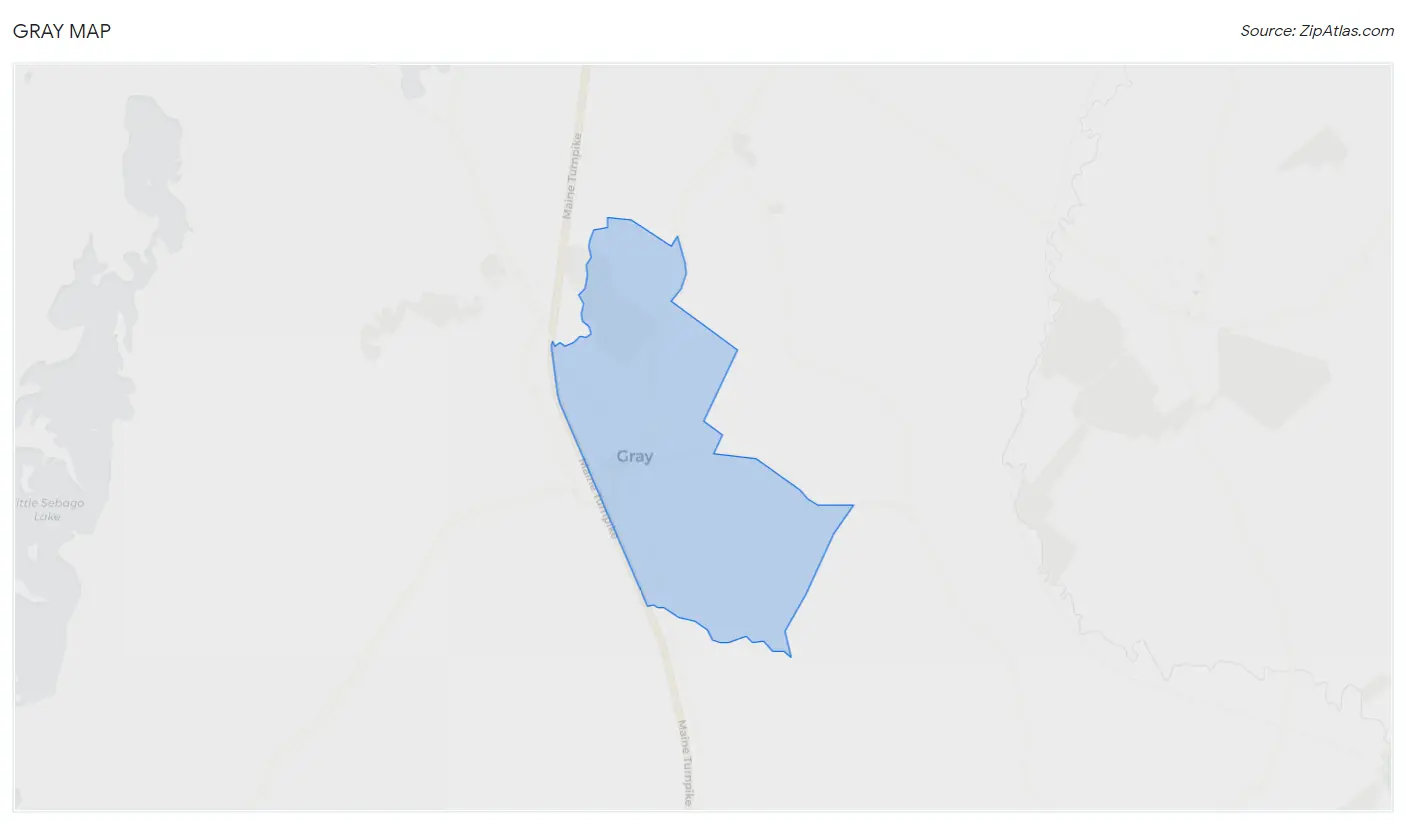
Gray Map
Gray Overview
786
TOTAL POPULATION
309
MALE POPULATION
477
FEMALE POPULATION
64.78
MALES / 100 FEMALES
154.37
FEMALES / 100 MALES
40.1
MEDIAN AGE
2.7
AVG FAMILY SIZE
2.1
AVG HOUSEHOLD SIZE
$58,275
PER CAPITA INCOME
$121,422
AVG FAMILY INCOME
49.7%
WAGE / INCOME GAP [ % ]
50.3¢/ $1
WAGE / INCOME GAP [ $ ]
0.57
INEQUALITY / GINI INDEX
504
LABOR FORCE [ PEOPLE ]
76.4%
PERCENT IN LABOR FORCE
Gray Zip Codes
Gray Area Codes
Race in Gray
The most populous races in Gray are White / Caucasian (741 | 94.3%), Black / African American (34 | 4.3%), and Two or more Races (11 | 1.4%).
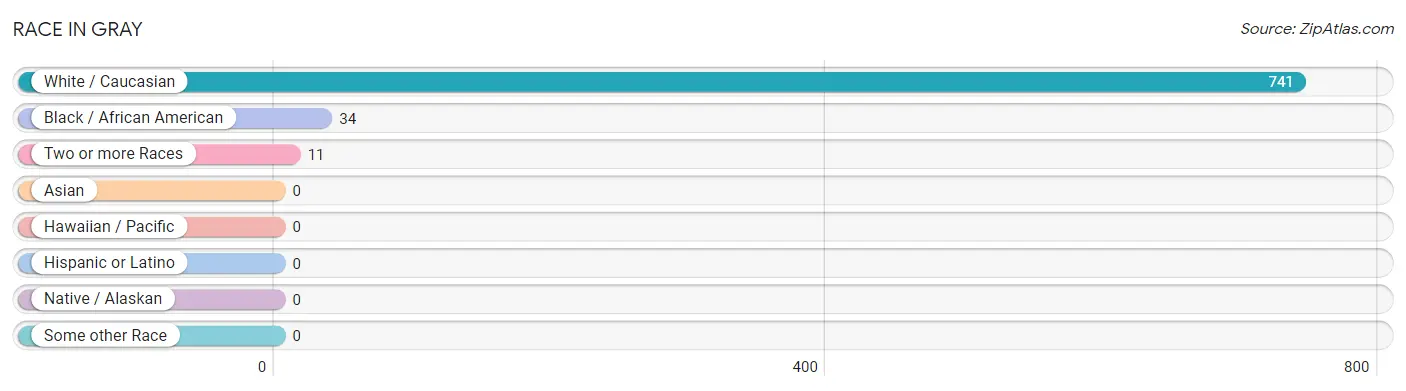
| Race | # Population | % Population |
| Asian | 0 | 0.0% |
| Black / African American | 34 | 4.3% |
| Hawaiian / Pacific | 0 | 0.0% |
| Hispanic or Latino | 0 | 0.0% |
| Native / Alaskan | 0 | 0.0% |
| White / Caucasian | 741 | 94.3% |
| Two or more Races | 11 | 1.4% |
| Some other Race | 0 | 0.0% |
| Total | 786 | 100.0% |
Ancestry in Gray
The most populous ancestries reported in Gray are Irish (244 | 31.0%), English (236 | 30.0%), French Canadian (156 | 19.9%), German (115 | 14.6%), and Scotch-Irish (70 | 8.9%), together accounting for 104.5% of all Gray residents.
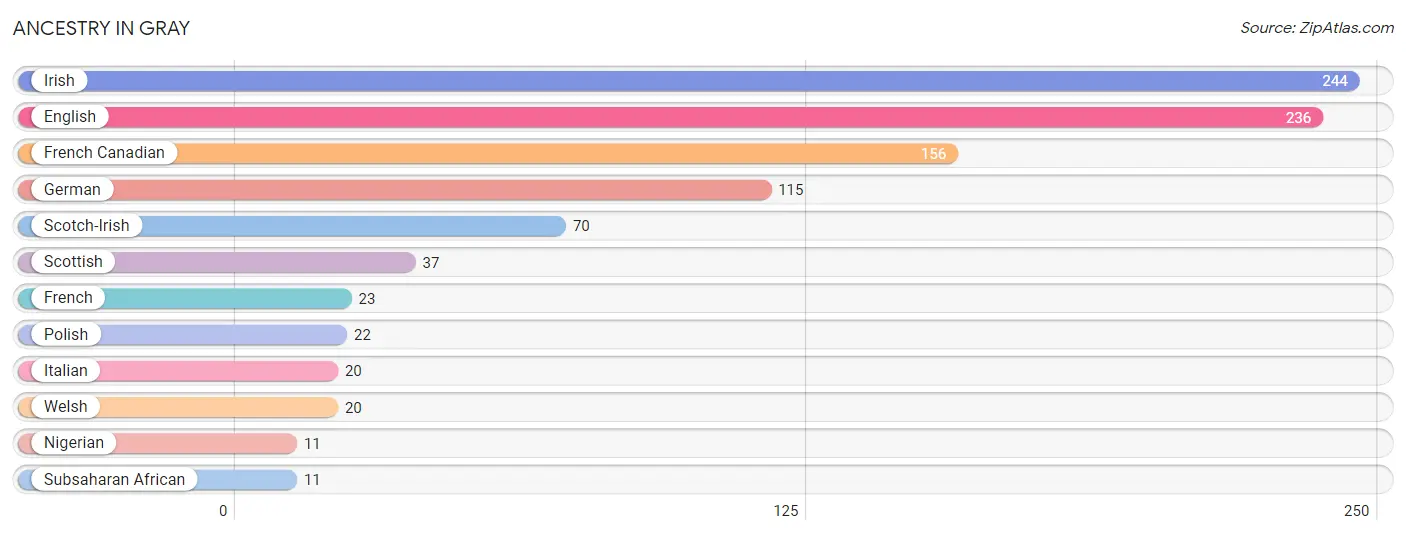
| Ancestry | # Population | % Population |
| English | 236 | 30.0% |
| French | 23 | 2.9% |
| French Canadian | 156 | 19.9% |
| German | 115 | 14.6% |
| Irish | 244 | 31.0% |
| Italian | 20 | 2.5% |
| Nigerian | 11 | 1.4% |
| Polish | 22 | 2.8% |
| Scotch-Irish | 70 | 8.9% |
| Scottish | 37 | 4.7% |
| Subsaharan African | 11 | 1.4% |
| Welsh | 20 | 2.5% | View All 12 Rows |
Immigrants in Gray
The most numerous immigrant groups reported in Gray came from , and Canada (32 | 4.1%), together accounting for 4.1% of all Gray residents.

| Immigration Origin | # Population | % Population |
| Canada | 32 | 4.1% | View All 1 Rows |
Sex and Age in Gray
Sex and Age in Gray
The most populous age groups in Gray are 60 to 64 Years (74 | 23.9%) for men and 15 to 19 Years (133 | 27.9%) for women.
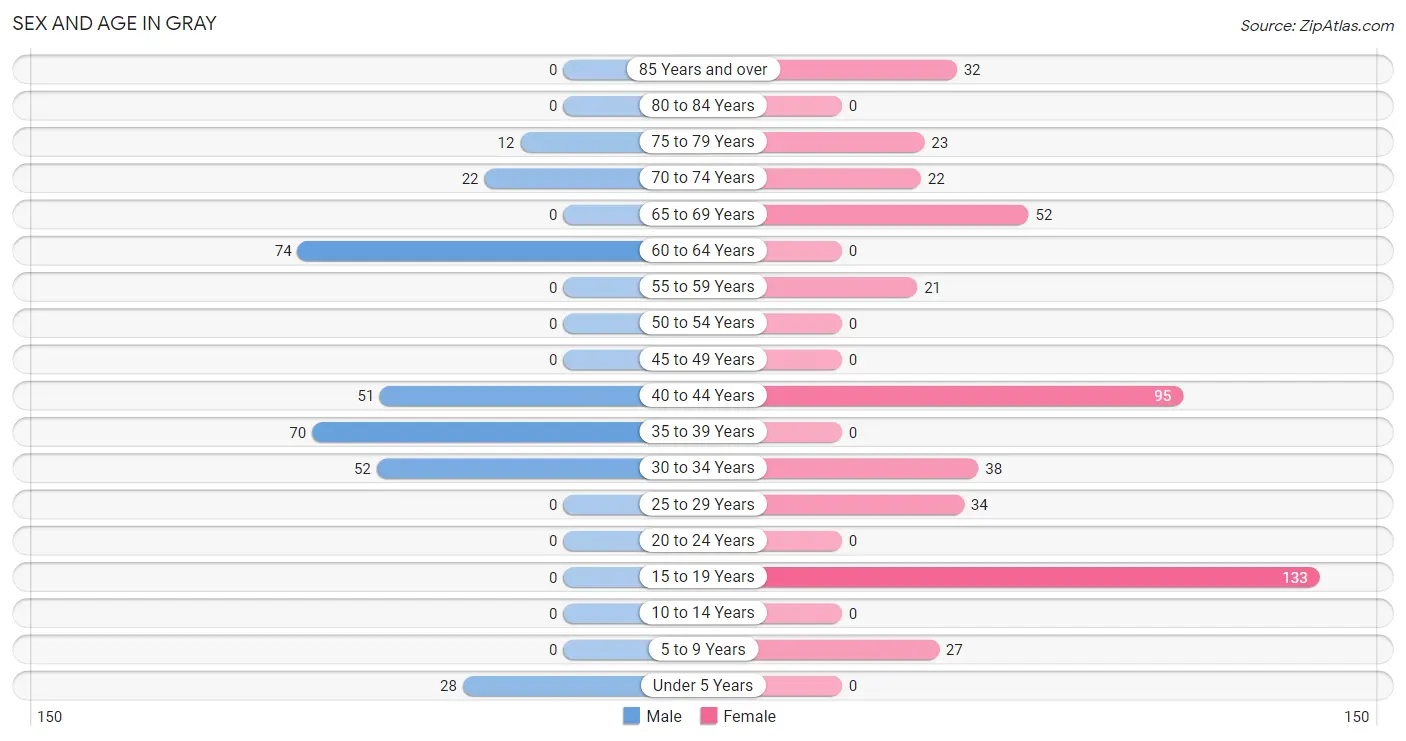
| Age Bracket | Male | Female |
| Under 5 Years | 28 (9.1%) | 0 (0.0%) |
| 5 to 9 Years | 0 (0.0%) | 27 (5.7%) |
| 10 to 14 Years | 0 (0.0%) | 0 (0.0%) |
| 15 to 19 Years | 0 (0.0%) | 133 (27.9%) |
| 20 to 24 Years | 0 (0.0%) | 0 (0.0%) |
| 25 to 29 Years | 0 (0.0%) | 34 (7.1%) |
| 30 to 34 Years | 52 (16.8%) | 38 (8.0%) |
| 35 to 39 Years | 70 (22.7%) | 0 (0.0%) |
| 40 to 44 Years | 51 (16.5%) | 95 (19.9%) |
| 45 to 49 Years | 0 (0.0%) | 0 (0.0%) |
| 50 to 54 Years | 0 (0.0%) | 0 (0.0%) |
| 55 to 59 Years | 0 (0.0%) | 21 (4.4%) |
| 60 to 64 Years | 74 (23.9%) | 0 (0.0%) |
| 65 to 69 Years | 0 (0.0%) | 52 (10.9%) |
| 70 to 74 Years | 22 (7.1%) | 22 (4.6%) |
| 75 to 79 Years | 12 (3.9%) | 23 (4.8%) |
| 80 to 84 Years | 0 (0.0%) | 0 (0.0%) |
| 85 Years and over | 0 (0.0%) | 32 (6.7%) |
| Total | 309 (100.0%) | 477 (100.0%) |
Families and Households in Gray
Median Family Size in Gray
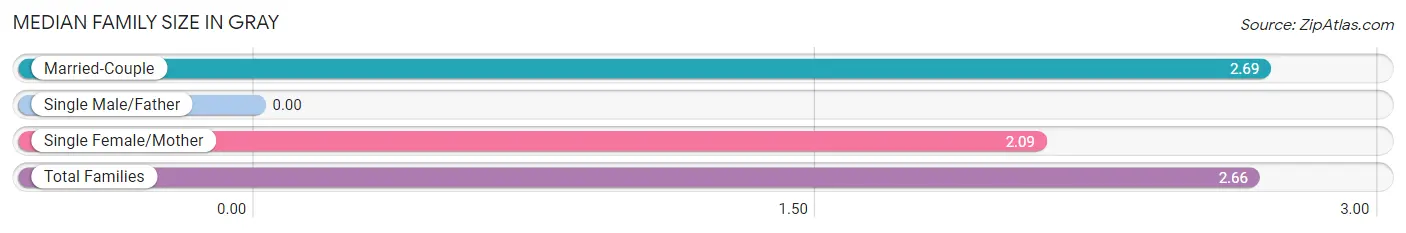
| Family Type | # Families | Family Size |
| Married-Couple | 226 (95.4%) | 2.69 |
| Single Male/Father | 0 (0.0%) | - |
| Single Female/Mother | 11 (4.6%) | 2.09 |
| Total Families | 237 (100.0%) | 2.66 |
Median Household Size in Gray
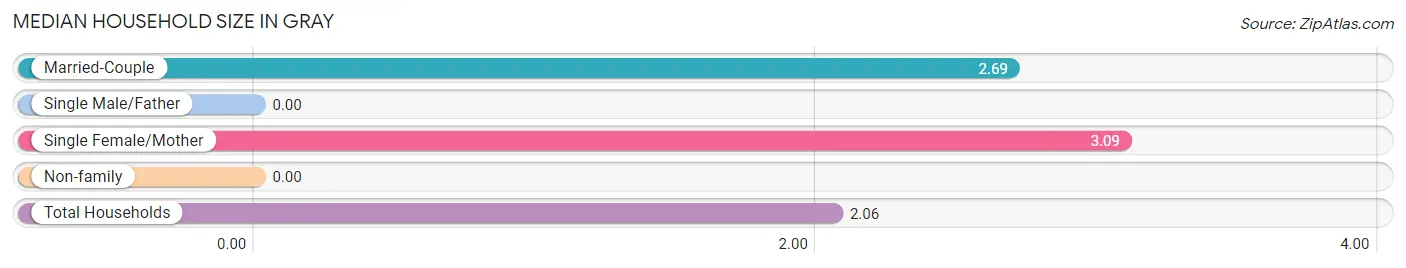
| Household Type | # Households | Household Size |
| Married-Couple | 226 (59.2%) | 2.69 |
| Single Male/Father | 0 (0.0%) | - |
| Single Female/Mother | 11 (2.9%) | 3.09 |
| Non-family | 145 (38.0%) | - |
| Total Households | 382 (100.0%) | 2.06 |
Household Size by Marriage Status in Gray
Out of a total of 382 households in Gray, 237 (62.0%) are family households, while 145 (38.0%) are nonfamily households. The most numerous type of family households are 2-person households, comprising 127, and the most common type of nonfamily households are 1-person households, comprising 145.
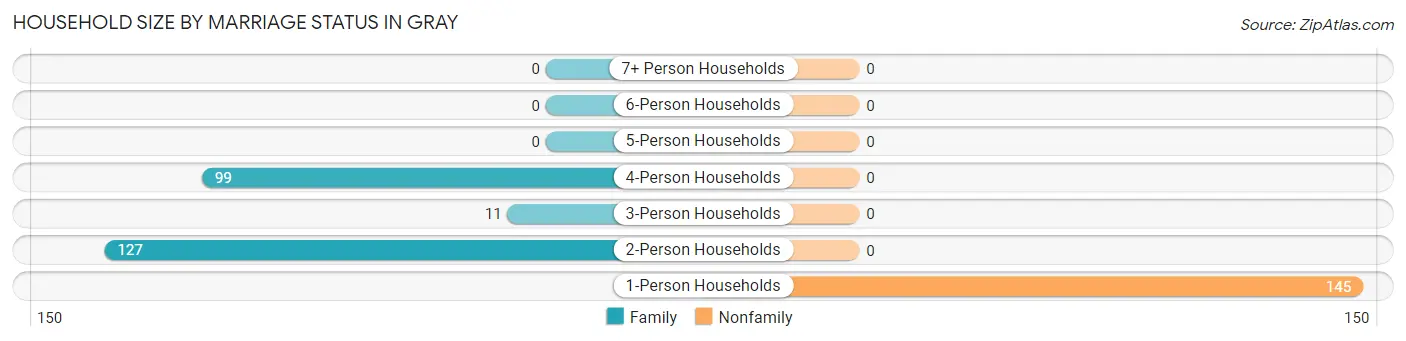
| Household Size | Family Households | Nonfamily Households |
| 1-Person Households | - | 145 (38.0%) |
| 2-Person Households | 127 (33.3%) | 0 (0.0%) |
| 3-Person Households | 11 (2.9%) | 0 (0.0%) |
| 4-Person Households | 99 (25.9%) | 0 (0.0%) |
| 5-Person Households | 0 (0.0%) | 0 (0.0%) |
| 6-Person Households | 0 (0.0%) | 0 (0.0%) |
| 7+ Person Households | 0 (0.0%) | 0 (0.0%) |
| Total | 237 (62.0%) | 145 (38.0%) |
Female Fertility in Gray
Fertility by Age in Gray
| Age Bracket | Women with Births | Births / 1,000 Women |
| 15 to 19 years | 0 (0.0%) | 0.0 |
| 20 to 34 years | 0 (0.0%) | 0.0 |
| 35 to 50 years | 0 (0.0%) | 0.0 |
| Total | 0 (0.0%) | 0.0 |
Fertility by Age by Marriage Status in Gray
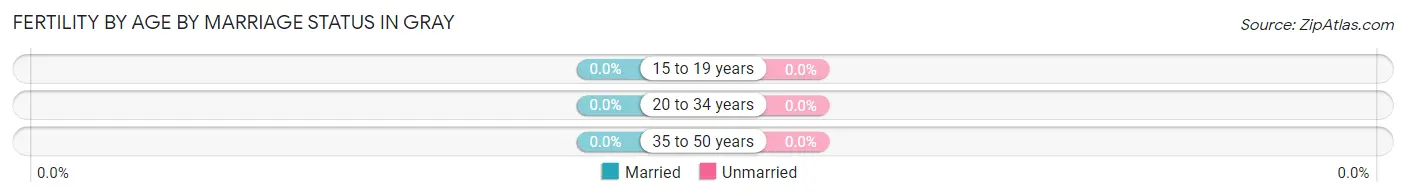
| Age Bracket | Married | Unmarried |
| 15 to 19 years | 0 (0.0%) | 0 (0.0%) |
| 20 to 34 years | 0 (0.0%) | 0 (0.0%) |
| 35 to 50 years | 0 (0.0%) | 0 (0.0%) |
| Total | 0 (0.0%) | 0 (0.0%) |
Fertility by Education in Gray
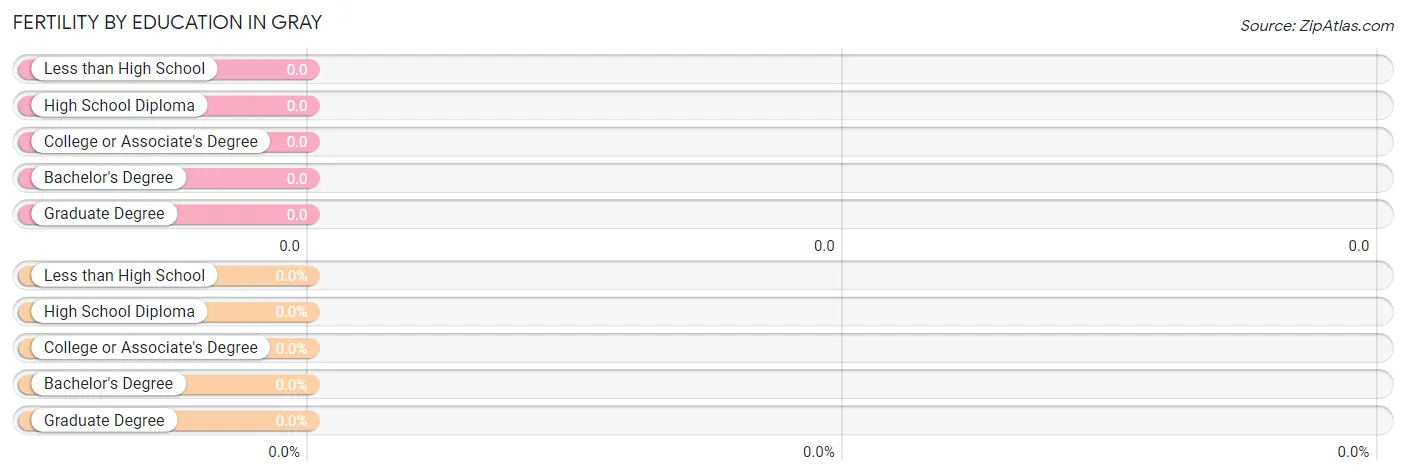
| Educational Attainment | Women with Births | Births / 1,000 Women |
| Less than High School | 0 (0.0%) | 0.0 |
| High School Diploma | 0 (0.0%) | 0.0 |
| College or Associate's Degree | 0 (0.0%) | 0.0 |
| Bachelor's Degree | 0 (0.0%) | 0.0 |
| Graduate Degree | 0 (0.0%) | 0.0 |
| Total | 0 (0.0%) | 0.0 |
Fertility by Education by Marriage Status in Gray
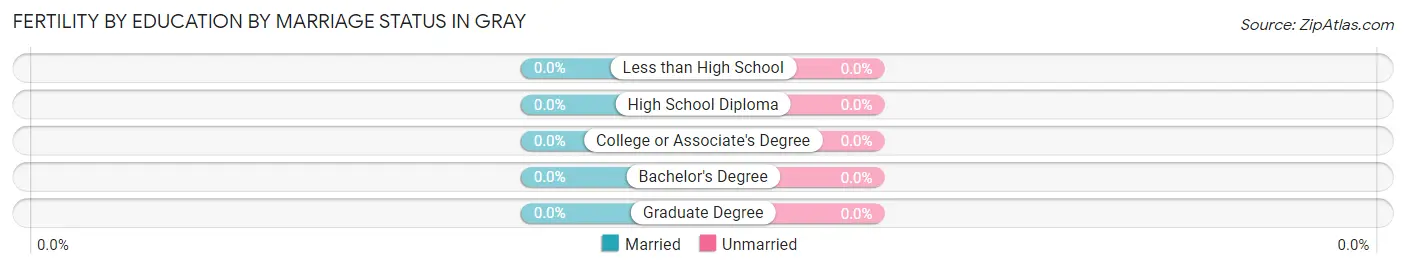
| Educational Attainment | Married | Unmarried |
| Less than High School | 0 (0.0%) | 0 (0.0%) |
| High School Diploma | 0 (0.0%) | 0 (0.0%) |
| College or Associate's Degree | 0 (0.0%) | 0 (0.0%) |
| Bachelor's Degree | 0 (0.0%) | 0 (0.0%) |
| Graduate Degree | 0 (0.0%) | 0 (0.0%) |
| Total | 0 (0.0%) | 0 (0.0%) |
Income in Gray
Income Overview in Gray
| Characteristic | Number | Measure |
| Per Capita Income | 786 | $58,275 |
| Median Family Income | 237 | $121,422 |
| Mean Family Income | 237 | $179,519 |
| Median Household Income | 382 | $0 |
| Mean Household Income | 382 | $123,127 |
| Income Deficit | 237 | $0 |
| Wage / Income Gap (%) | 786 | 49.72% |
| Wage / Income Gap ($) | 786 | 50.28¢ per $1 |
| Gini / Inequality Index | 786 | 0.57 |
Earnings by Sex in Gray
Average Earnings in Gray are $42,255, $80,049 for men and $40,245 for women, a difference of 49.7%.
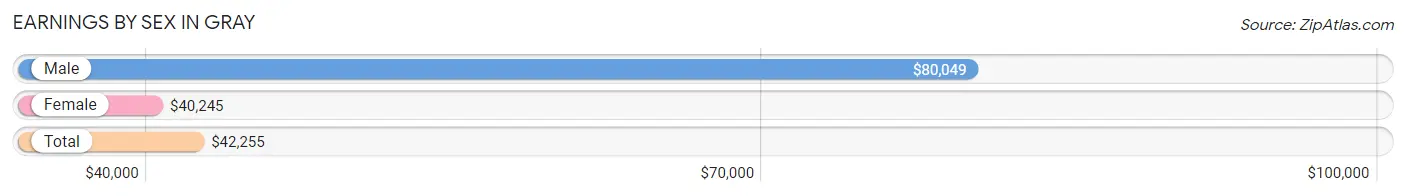
| Sex | Number | Average Earnings |
| Male | 240 (47.6%) | $80,049 |
| Female | 264 (52.4%) | $40,245 |
| Total | 504 (100.0%) | $42,255 |
Earnings by Sex by Income Bracket in Gray
The most common earnings brackets in Gray are $75,000 to $99,999 for men (121 | 50.4%) and $2,500 to $4,999 for women (62 | 23.5%).
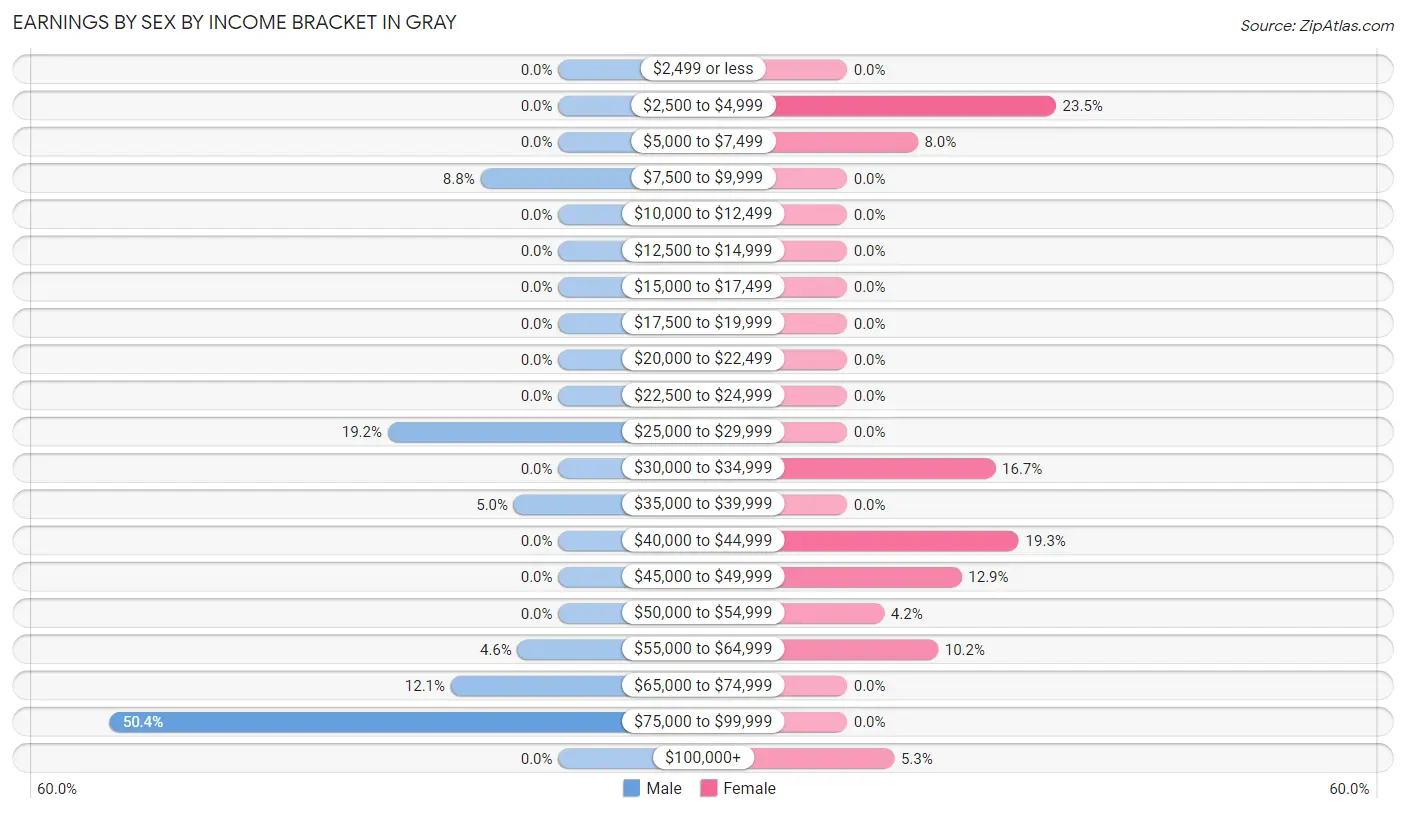
| Income | Male | Female |
| $2,499 or less | 0 (0.0%) | 0 (0.0%) |
| $2,500 to $4,999 | 0 (0.0%) | 62 (23.5%) |
| $5,000 to $7,499 | 0 (0.0%) | 21 (8.0%) |
| $7,500 to $9,999 | 21 (8.7%) | 0 (0.0%) |
| $10,000 to $12,499 | 0 (0.0%) | 0 (0.0%) |
| $12,500 to $14,999 | 0 (0.0%) | 0 (0.0%) |
| $15,000 to $17,499 | 0 (0.0%) | 0 (0.0%) |
| $17,500 to $19,999 | 0 (0.0%) | 0 (0.0%) |
| $20,000 to $22,499 | 0 (0.0%) | 0 (0.0%) |
| $22,500 to $24,999 | 0 (0.0%) | 0 (0.0%) |
| $25,000 to $29,999 | 46 (19.2%) | 0 (0.0%) |
| $30,000 to $34,999 | 0 (0.0%) | 44 (16.7%) |
| $35,000 to $39,999 | 12 (5.0%) | 0 (0.0%) |
| $40,000 to $44,999 | 0 (0.0%) | 51 (19.3%) |
| $45,000 to $49,999 | 0 (0.0%) | 34 (12.9%) |
| $50,000 to $54,999 | 0 (0.0%) | 11 (4.2%) |
| $55,000 to $64,999 | 11 (4.6%) | 27 (10.2%) |
| $65,000 to $74,999 | 29 (12.1%) | 0 (0.0%) |
| $75,000 to $99,999 | 121 (50.4%) | 0 (0.0%) |
| $100,000+ | 0 (0.0%) | 14 (5.3%) |
| Total | 240 (100.0%) | 264 (100.0%) |
Earnings by Sex by Educational Attainment in Gray
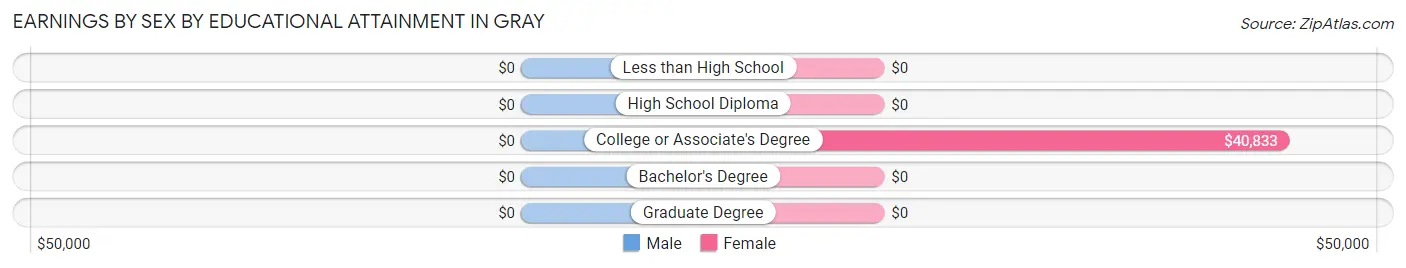
| Educational Attainment | Male Income | Female Income |
| Less than High School | - | - |
| High School Diploma | - | - |
| College or Associate's Degree | - | - |
| Bachelor's Degree | - | - |
| Graduate Degree | - | - |
| Total | $80,049 | $41,765 |
Family Income in Gray
Family Income Brackets in Gray
According to the Gray family income data, there are 150 families falling into the $100,000 to $149,999 income range, which is the most common income bracket and makes up 63.3% of all families.
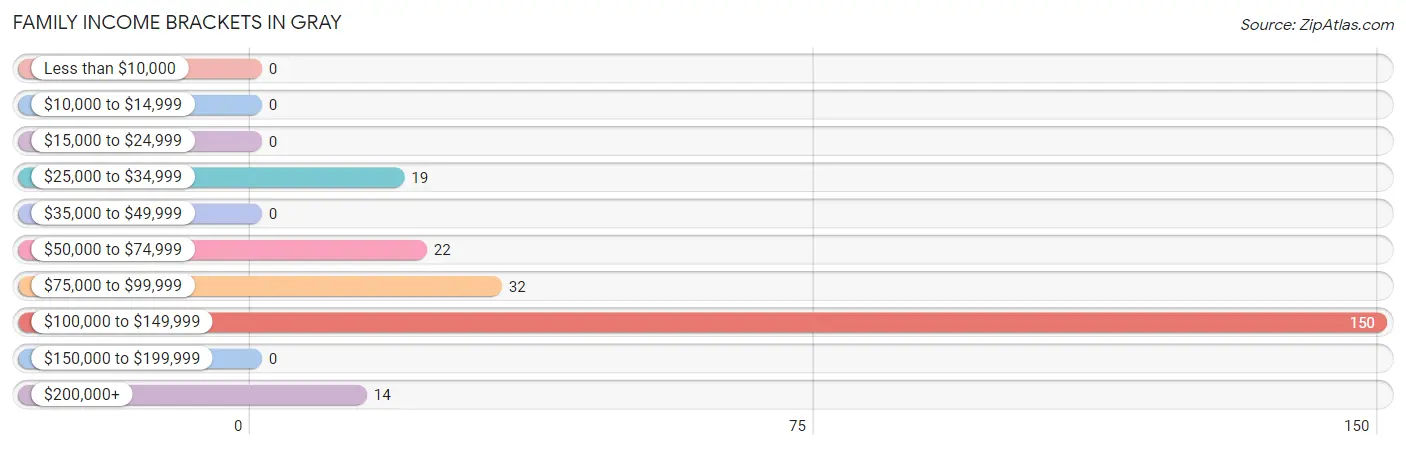
| Income Bracket | # Families | % Families |
| Less than $10,000 | 0 | 0.0% |
| $10,000 to $14,999 | 0 | 0.0% |
| $15,000 to $24,999 | 0 | 0.0% |
| $25,000 to $34,999 | 19 | 8.0% |
| $35,000 to $49,999 | 0 | 0.0% |
| $50,000 to $74,999 | 22 | 9.3% |
| $75,000 to $99,999 | 32 | 13.5% |
| $100,000 to $149,999 | 150 | 63.3% |
| $150,000 to $199,999 | 0 | 0.0% |
| $200,000+ | 14 | 5.9% |
Family Income by Famaliy Size in Gray
2-person families (138 | 58.2%) account for the highest median family income in Gray with $91,591 per family, while 2-person families (138 | 58.2%) have the highest median income of $45,796 per family member.
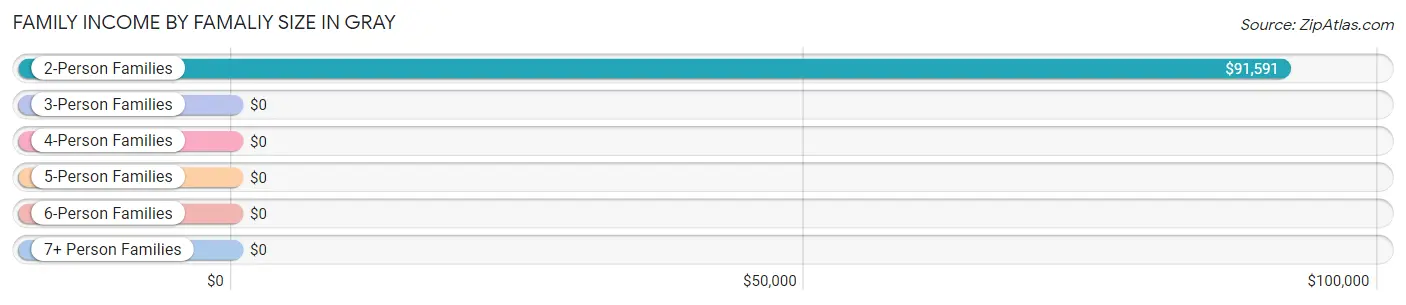
| Income Bracket | # Families | Median Income |
| 2-Person Families | 138 (58.2%) | $91,591 |
| 3-Person Families | 0 (0.0%) | $0 |
| 4-Person Families | 99 (41.8%) | $0 |
| 5-Person Families | 0 (0.0%) | $0 |
| 6-Person Families | 0 (0.0%) | $0 |
| 7+ Person Families | 0 (0.0%) | $0 |
| Total | 237 (100.0%) | $121,422 |
Family Income by Number of Earners in Gray
| Number of Earners | # Families | Median Income |
| No Earners | 41 (17.3%) | $0 |
| 1 Earner | 0 (0.0%) | $0 |
| 2 Earners | 126 (53.2%) | $120,969 |
| 3+ Earners | 70 (29.5%) | $0 |
| Total | 237 (100.0%) | $121,422 |
Household Income in Gray
Household Income Brackets in Gray
With 161 households falling in the category, the $100,000 to $149,999 income range is the most frequent in Gray, accounting for 42.1% of all households.
| Income Bracket | # Households | % Households |
| Less than $10,000 | 0 | 0.0% |
| $10,000 to $14,999 | 22 | 5.8% |
| $15,000 to $24,999 | 55 | 14.4% |
| $25,000 to $34,999 | 53 | 13.9% |
| $35,000 to $49,999 | 34 | 8.9% |
| $50,000 to $74,999 | 22 | 5.8% |
| $75,000 to $99,999 | 21 | 5.5% |
| $100,000 to $149,999 | 161 | 42.1% |
| $150,000 to $199,999 | 0 | 0.0% |
| $200,000+ | 14 | 3.7% |
Household Income by Householder Age in Gray
The median household income in Gray is $0, with the highest median household income of $121,984 found in the 25 to 44 years age bracket for the primary householder. A total of 195 households (51.0%) fall into this category.
| Income Bracket | # Households | Median Income |
| 15 to 24 Years | 0 (0.0%) | $0 |
| 25 to 44 Years | 195 (51.0%) | $121,984 |
| 45 to 64 Years | 74 (19.4%) | $0 |
| 65+ Years | 113 (29.6%) | $0 |
| Total | 382 (100.0%) | $0 |
Poverty in Gray
Income Below Poverty by Sex and Age in Gray
| Age Bracket | Male | Female |
| Under 5 Years | 0 (0.0%) | 0 (0.0%) |
| 5 Years | 0 (0.0%) | 0 (0.0%) |
| 6 to 11 Years | 0 (0.0%) | 0 (0.0%) |
| 12 to 14 Years | 0 (0.0%) | 0 (0.0%) |
| 15 Years | 0 (0.0%) | 0 (0.0%) |
| 16 and 17 Years | 0 (0.0%) | 0 (0.0%) |
| 18 to 24 Years | 0 (0.0%) | 0 (0.0%) |
| 25 to 34 Years | 0 (0.0%) | 0 (0.0%) |
| 35 to 44 Years | 0 (0.0%) | 0 (0.0%) |
| 45 to 54 Years | 0 (0.0%) | 0 (0.0%) |
| 55 to 64 Years | 0 (0.0%) | 0 (0.0%) |
| 65 to 74 Years | 0 (0.0%) | 22 (29.7%) |
| 75 Years and over | 0 (0.0%) | 0 (0.0%) |
| Total | 0 (0.0%) | 22 (4.6%) |
Income Above Poverty by Sex and Age in Gray
According to the poverty statistics in Gray, males aged under 5 years and females aged 6 to 11 years are the age groups that are most secure financially, with 100.0% of males and 100.0% of females in these age groups living above the poverty line.
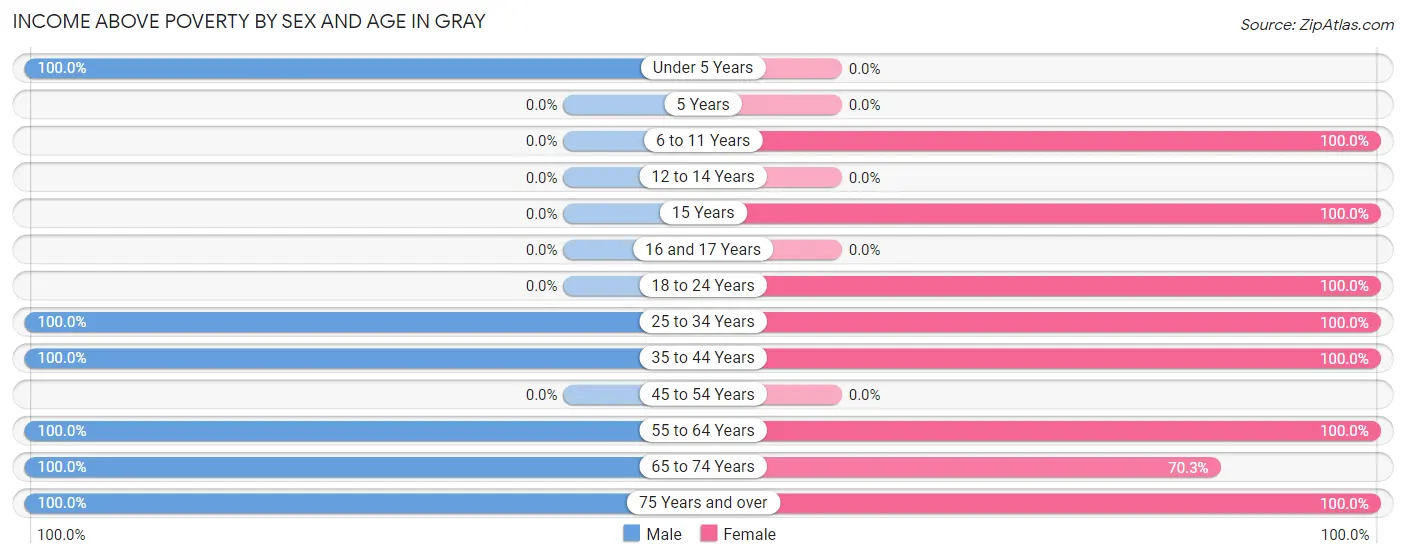
| Age Bracket | Male | Female |
| Under 5 Years | 28 (100.0%) | 0 (0.0%) |
| 5 Years | 0 (0.0%) | 0 (0.0%) |
| 6 to 11 Years | 0 (0.0%) | 27 (100.0%) |
| 12 to 14 Years | 0 (0.0%) | 0 (0.0%) |
| 15 Years | 0 (0.0%) | 71 (100.0%) |
| 16 and 17 Years | 0 (0.0%) | 0 (0.0%) |
| 18 to 24 Years | 0 (0.0%) | 62 (100.0%) |
| 25 to 34 Years | 52 (100.0%) | 72 (100.0%) |
| 35 to 44 Years | 121 (100.0%) | 95 (100.0%) |
| 45 to 54 Years | 0 (0.0%) | 0 (0.0%) |
| 55 to 64 Years | 74 (100.0%) | 21 (100.0%) |
| 65 to 74 Years | 22 (100.0%) | 52 (70.3%) |
| 75 Years and over | 12 (100.0%) | 55 (100.0%) |
| Total | 309 (100.0%) | 455 (95.4%) |
Income Below Poverty Among Married-Couple Families in Gray
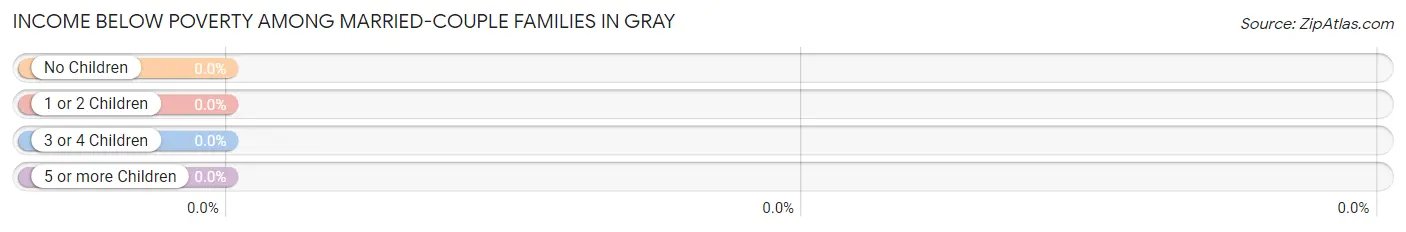
| Children | Above Poverty | Below Poverty |
| No Children | 127 (100.0%) | 0 (0.0%) |
| 1 or 2 Children | 99 (100.0%) | 0 (0.0%) |
| 3 or 4 Children | 0 (0.0%) | 0 (0.0%) |
| 5 or more Children | 0 (0.0%) | 0 (0.0%) |
| Total | 226 (100.0%) | 0 (0.0%) |
Income Below Poverty Among Single-Parent Households in Gray
| Children | Single Father | Single Mother |
| No Children | 0 (0.0%) | 0 (0.0%) |
| 1 or 2 Children | 0 (0.0%) | 0 (0.0%) |
| 3 or 4 Children | 0 (0.0%) | 0 (0.0%) |
| 5 or more Children | 0 (0.0%) | 0 (0.0%) |
| Total | 0 (0.0%) | 0 (0.0%) |
Income Below Poverty Among Married-Couple vs Single-Parent Households in Gray
| Children | Married-Couple Families | Single-Parent Households |
| No Children | 0 (0.0%) | 0 (0.0%) |
| 1 or 2 Children | 0 (0.0%) | 0 (0.0%) |
| 3 or 4 Children | 0 (0.0%) | 0 (0.0%) |
| 5 or more Children | 0 (0.0%) | 0 (0.0%) |
| Total | 0 (0.0%) | 0 (0.0%) |
Employment Characteristics in Gray
Employment by Class of Employer in Gray
Among the 504 employed individuals in Gray, private company employees (422 | 83.7%), not-for-profit organizations (57 | 11.3%), and self-employed (not incorporated) (14 | 2.8%) make up the most common classes of employment.
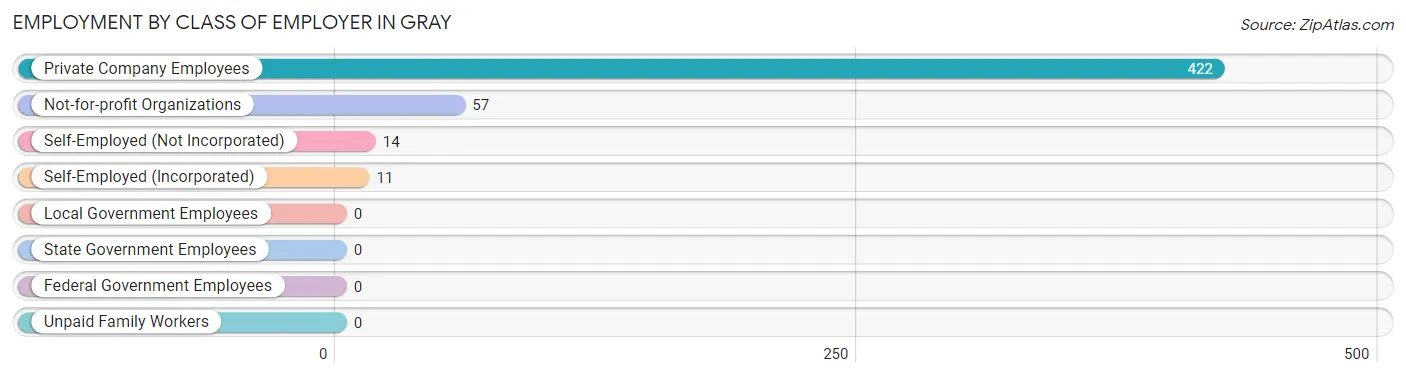
| Employer Class | # Employees | % Employees |
| Private Company Employees | 422 | 83.7% |
| Self-Employed (Incorporated) | 11 | 2.2% |
| Self-Employed (Not Incorporated) | 14 | 2.8% |
| Not-for-profit Organizations | 57 | 11.3% |
| Local Government Employees | 0 | 0.0% |
| State Government Employees | 0 | 0.0% |
| Federal Government Employees | 0 | 0.0% |
| Unpaid Family Workers | 0 | 0.0% |
| Total | 504 | 100.0% |
Employment Status by Age in Gray
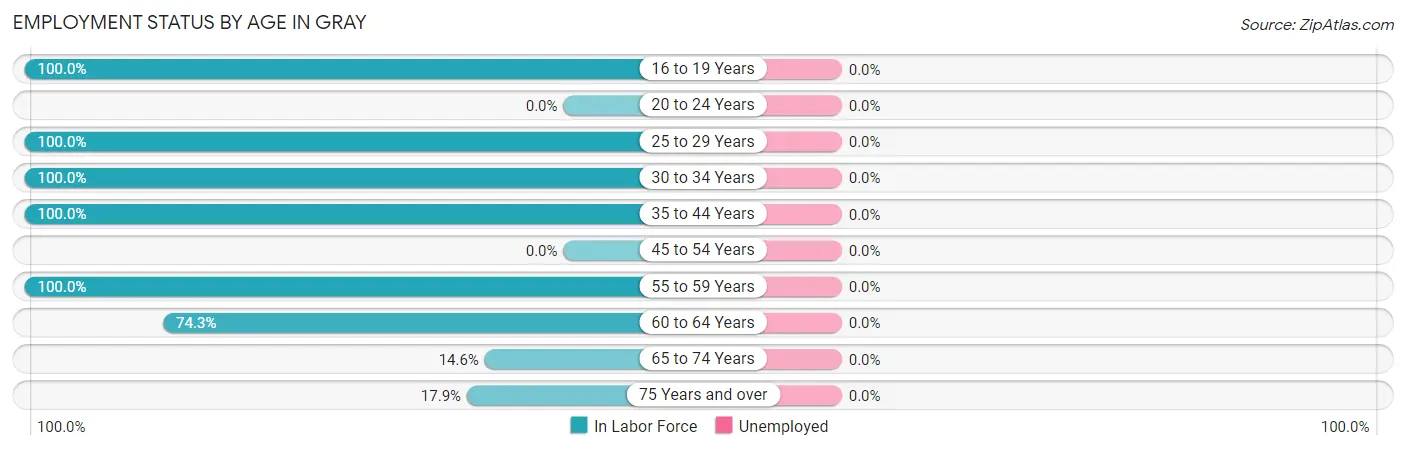
| Age Bracket | In Labor Force | Unemployed |
| 16 to 19 Years | 62 (100.0%) | 0 (0.0%) |
| 20 to 24 Years | 0 (0.0%) | 0 (0.0%) |
| 25 to 29 Years | 34 (100.0%) | 0 (0.0%) |
| 30 to 34 Years | 90 (100.0%) | 0 (0.0%) |
| 35 to 44 Years | 216 (100.0%) | 0 (0.0%) |
| 45 to 54 Years | 0 (0.0%) | 0 (0.0%) |
| 55 to 59 Years | 21 (100.0%) | 0 (0.0%) |
| 60 to 64 Years | 55 (74.3%) | 0 (0.0%) |
| 65 to 74 Years | 14 (14.6%) | 0 (0.0%) |
| 75 Years and over | 12 (17.9%) | 0 (0.0%) |
| Total | 504 (76.4%) | 0 (0.0%) |
Employment Status by Educational Attainment in Gray
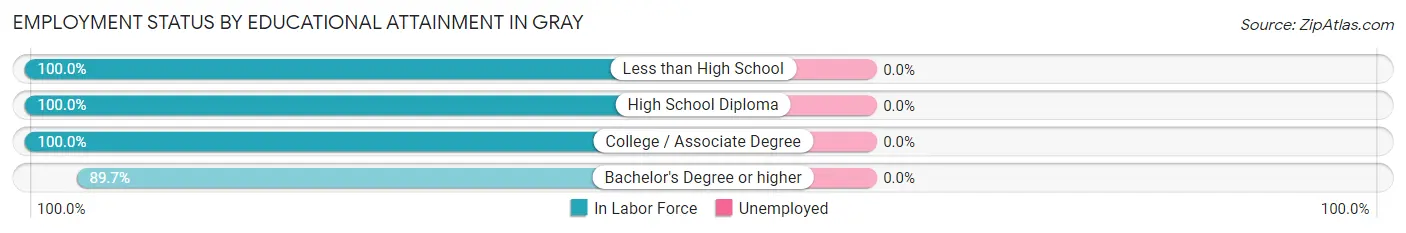
| Educational Attainment | In Labor Force | Unemployed |
| Less than High School | 12 (100.0%) | 0 (0.0%) |
| High School Diploma | 53 (100.0%) | 0 (0.0%) |
| College / Associate Degree | 185 (100.0%) | 0 (0.0%) |
| Bachelor's Degree or higher | 166 (89.7%) | 0 (0.0%) |
| Total | 416 (95.6%) | 0 (0.0%) |
Employment Occupations by Sex in Gray
Management, Business, Science and Arts Occupations
The most common Management, Business, Science and Arts occupations in Gray are Computers, Engineering & Science (85 | 16.9%), Architecture & Engineering (85 | 16.9%), Health Diagnosing & Treating (82 | 16.3%), Management (70 | 13.9%), and Business & Financial (51 | 10.1%).
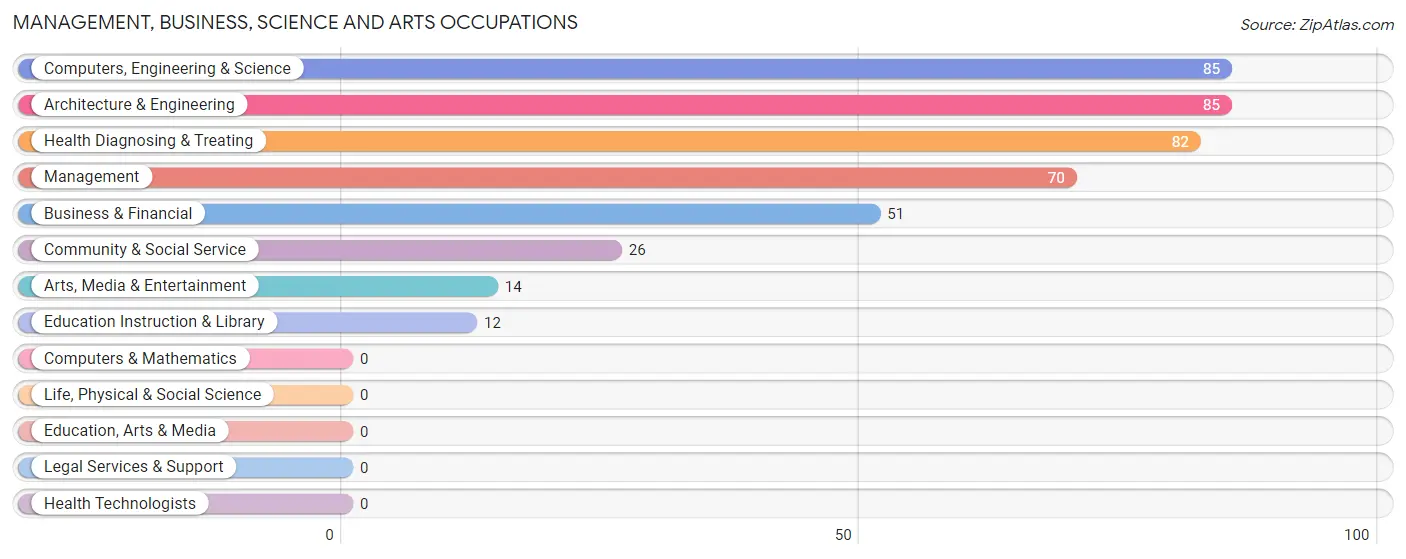
Management, Business, Science and Arts Occupations by Sex
Within the Management, Business, Science and Arts occupations in Gray, the most male-oriented occupations are Management (100.0%), Computers, Engineering & Science (100.0%), and Architecture & Engineering (100.0%), while the most female-oriented occupations are Business & Financial (100.0%), Arts, Media & Entertainment (100.0%), and Health Diagnosing & Treating (100.0%).
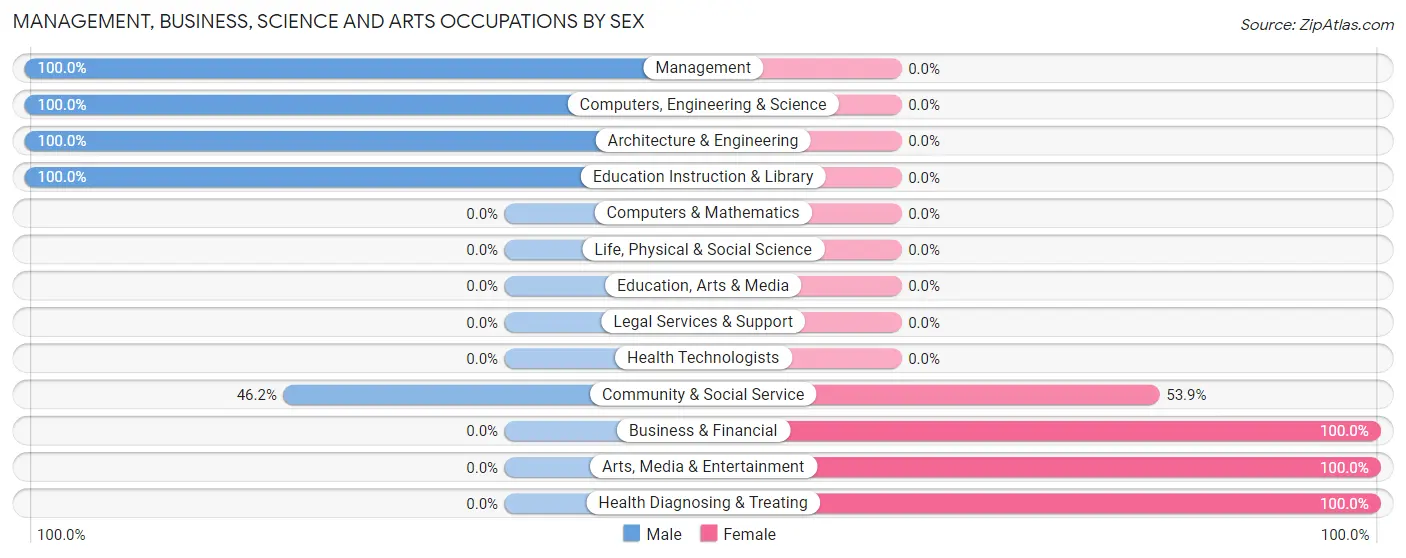
| Occupation | Male | Female |
| Management | 70 (100.0%) | 0 (0.0%) |
| Business & Financial | 0 (0.0%) | 51 (100.0%) |
| Computers, Engineering & Science | 85 (100.0%) | 0 (0.0%) |
| Computers & Mathematics | 0 (0.0%) | 0 (0.0%) |
| Architecture & Engineering | 85 (100.0%) | 0 (0.0%) |
| Life, Physical & Social Science | 0 (0.0%) | 0 (0.0%) |
| Community & Social Service | 12 (46.2%) | 14 (53.8%) |
| Education, Arts & Media | 0 (0.0%) | 0 (0.0%) |
| Legal Services & Support | 0 (0.0%) | 0 (0.0%) |
| Education Instruction & Library | 12 (100.0%) | 0 (0.0%) |
| Arts, Media & Entertainment | 0 (0.0%) | 14 (100.0%) |
| Health Diagnosing & Treating | 0 (0.0%) | 82 (100.0%) |
| Health Technologists | 0 (0.0%) | 0 (0.0%) |
| Total (Category) | 167 (53.2%) | 147 (46.8%) |
| Total (Overall) | 240 (47.6%) | 264 (52.4%) |
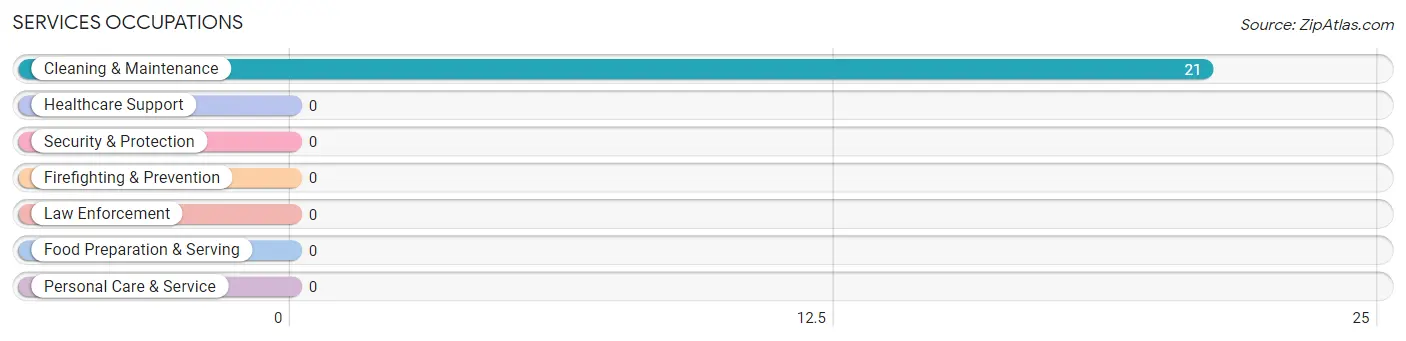
Services Occupations
The most common Services occupations in Gray are , and Cleaning & Maintenance (21 | 4.2%).
Services Occupations by Sex
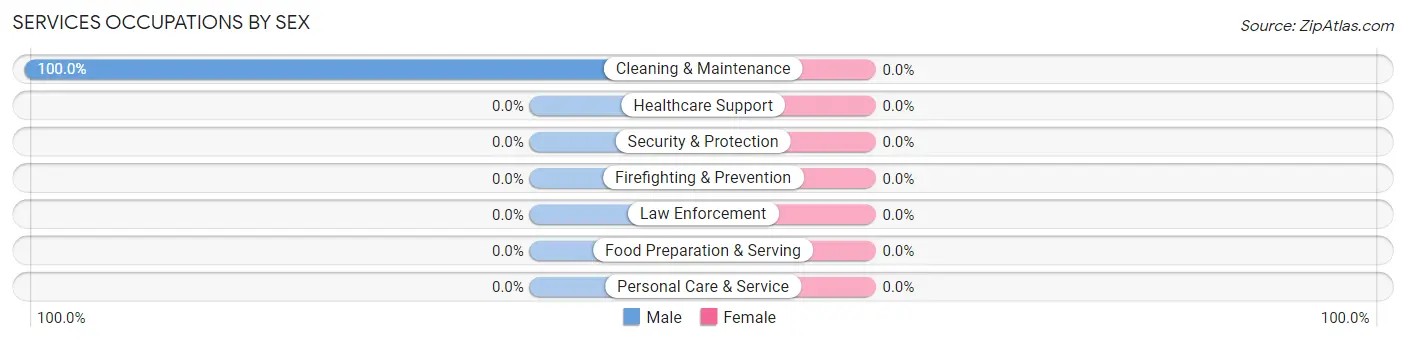
| Occupation | Male | Female |
| Healthcare Support | 0 (0.0%) | 0 (0.0%) |
| Security & Protection | 0 (0.0%) | 0 (0.0%) |
| Firefighting & Prevention | 0 (0.0%) | 0 (0.0%) |
| Law Enforcement | 0 (0.0%) | 0 (0.0%) |
| Food Preparation & Serving | 0 (0.0%) | 0 (0.0%) |
| Cleaning & Maintenance | 21 (100.0%) | 0 (0.0%) |
| Personal Care & Service | 0 (0.0%) | 0 (0.0%) |
| Total (Category) | 21 (100.0%) | 0 (0.0%) |
| Total (Overall) | 240 (47.6%) | 264 (52.4%) |
Sales and Office Occupations
The most common Sales and Office occupations in Gray are Sales & Related (62 | 12.3%), and Office & Administration (55 | 10.9%).
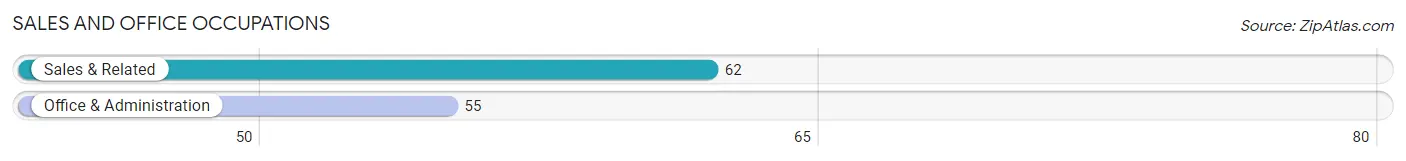
Sales and Office Occupations by Sex
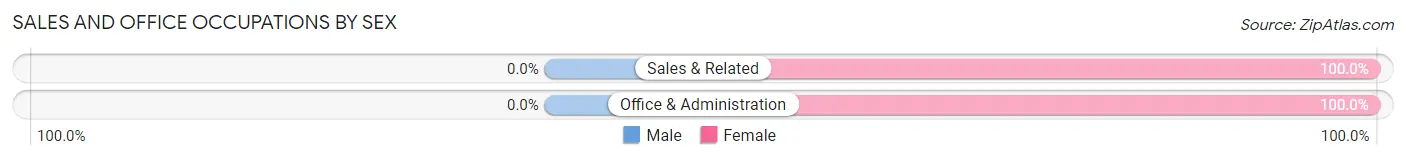
| Occupation | Male | Female |
| Sales & Related | 0 (0.0%) | 62 (100.0%) |
| Office & Administration | 0 (0.0%) | 55 (100.0%) |
| Total (Category) | 0 (0.0%) | 117 (100.0%) |
| Total (Overall) | 240 (47.6%) | 264 (52.4%) |
Natural Resources, Construction and Maintenance Occupations
The most common Natural Resources, Construction and Maintenance occupations in Gray are , and Construction & Extraction (23 | 4.6%).
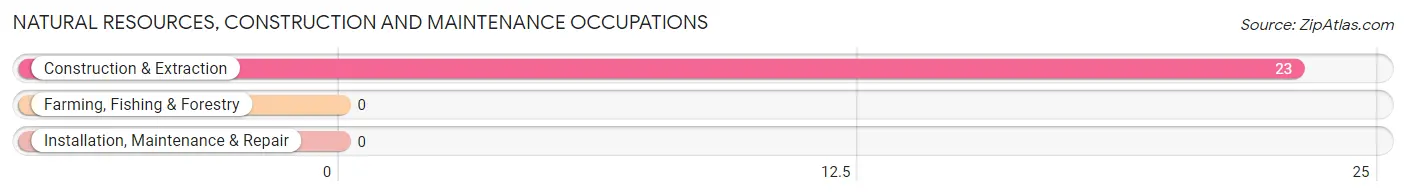
Natural Resources, Construction and Maintenance Occupations by Sex
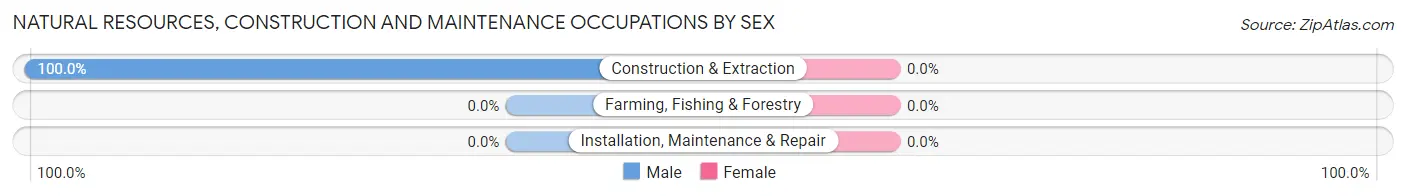
| Occupation | Male | Female |
| Farming, Fishing & Forestry | 0 (0.0%) | 0 (0.0%) |
| Construction & Extraction | 23 (100.0%) | 0 (0.0%) |
| Installation, Maintenance & Repair | 0 (0.0%) | 0 (0.0%) |
| Total (Category) | 23 (100.0%) | 0 (0.0%) |
| Total (Overall) | 240 (47.6%) | 264 (52.4%) |
Production, Transportation and Moving Occupations
The most common Production, Transportation and Moving occupations in Gray are , and Transportation (29 | 5.8%).
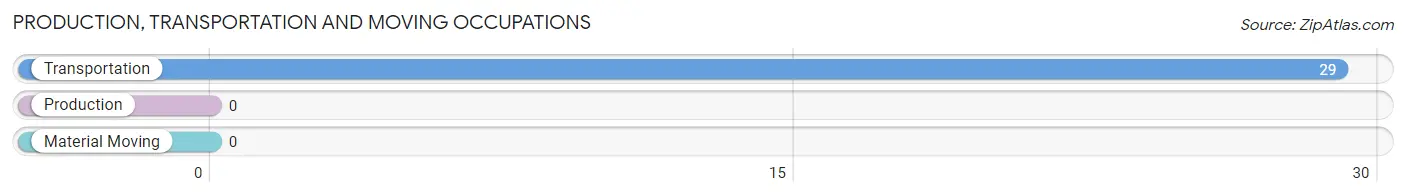
Production, Transportation and Moving Occupations by Sex
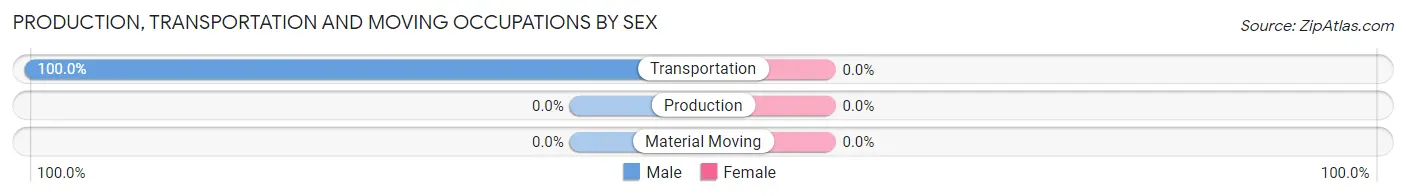
| Occupation | Male | Female |
| Production | 0 (0.0%) | 0 (0.0%) |
| Transportation | 29 (100.0%) | 0 (0.0%) |
| Material Moving | 0 (0.0%) | 0 (0.0%) |
| Total (Category) | 29 (100.0%) | 0 (0.0%) |
| Total (Overall) | 240 (47.6%) | 264 (52.4%) |
Employment Industries by Sex in Gray
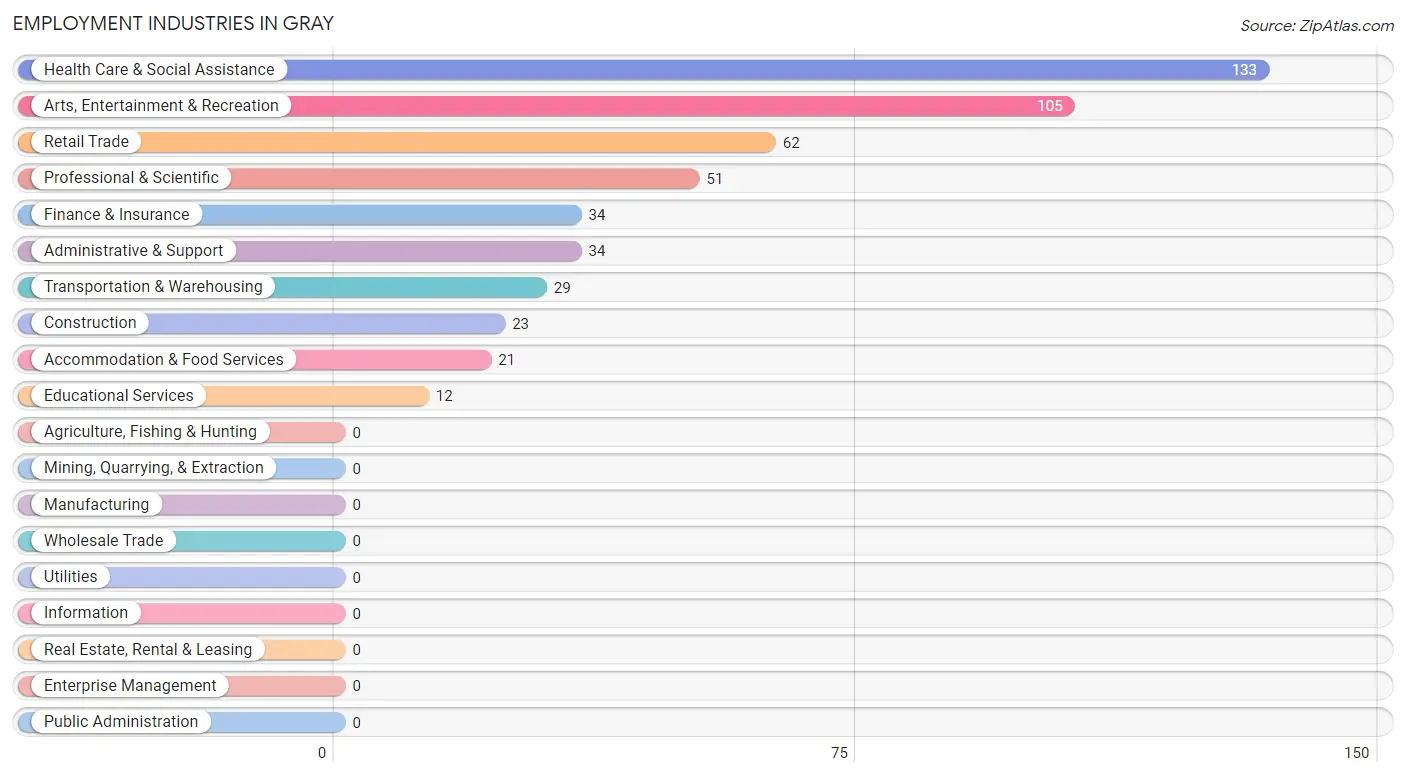
Employment Industries in Gray
The major employment industries in Gray include Health Care & Social Assistance (133 | 26.4%), Arts, Entertainment & Recreation (105 | 20.8%), Retail Trade (62 | 12.3%), Professional & Scientific (51 | 10.1%), and Finance & Insurance (34 | 6.8%).
Employment Industries by Sex in Gray
The Gray industries that see more men than women are Construction (100.0%), Transportation & Warehousing (100.0%), and Professional & Scientific (100.0%), whereas the industries that tend to have a higher number of women are Retail Trade (100.0%), Finance & Insurance (100.0%), and Health Care & Social Assistance (100.0%).
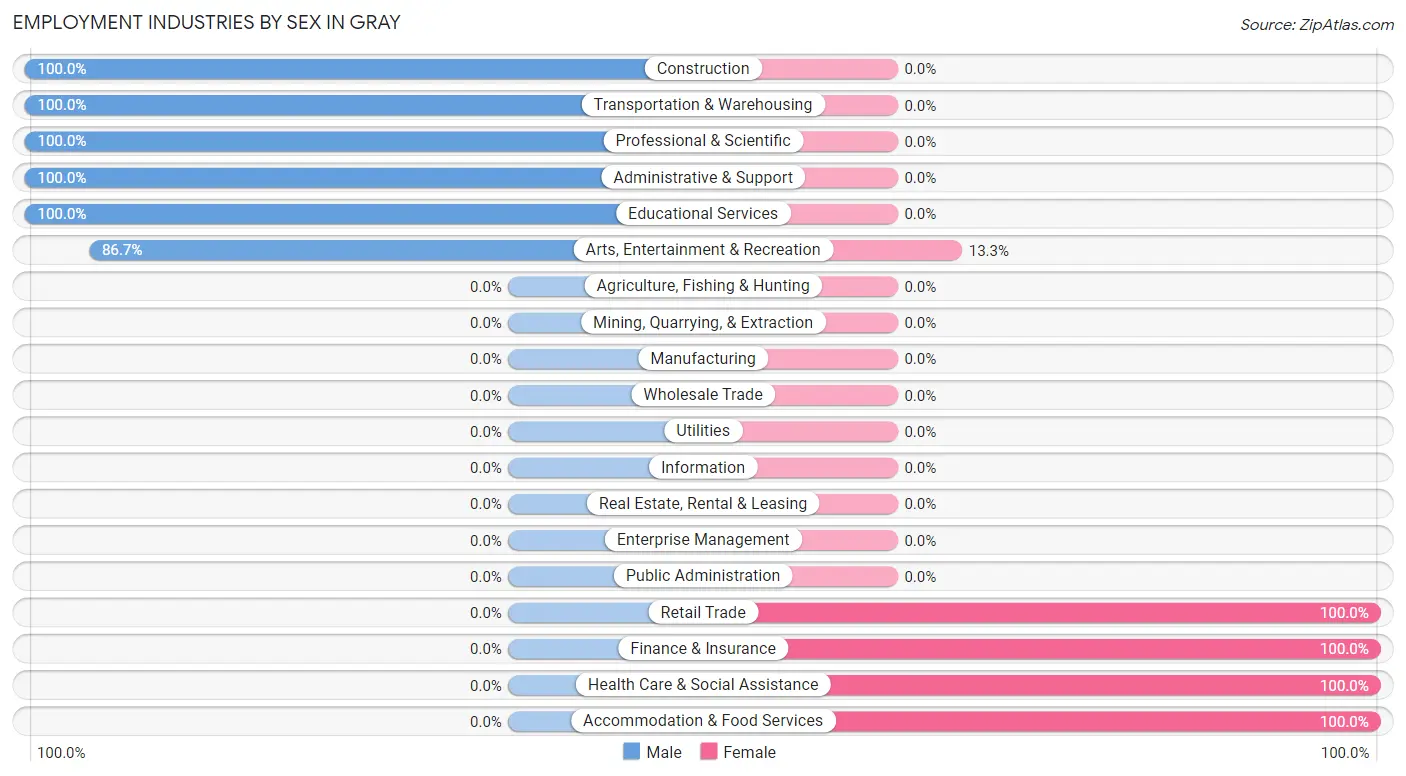
| Industry | Male | Female |
| Agriculture, Fishing & Hunting | 0 (0.0%) | 0 (0.0%) |
| Mining, Quarrying, & Extraction | 0 (0.0%) | 0 (0.0%) |
| Construction | 23 (100.0%) | 0 (0.0%) |
| Manufacturing | 0 (0.0%) | 0 (0.0%) |
| Wholesale Trade | 0 (0.0%) | 0 (0.0%) |
| Retail Trade | 0 (0.0%) | 62 (100.0%) |
| Transportation & Warehousing | 29 (100.0%) | 0 (0.0%) |
| Utilities | 0 (0.0%) | 0 (0.0%) |
| Information | 0 (0.0%) | 0 (0.0%) |
| Finance & Insurance | 0 (0.0%) | 34 (100.0%) |
| Real Estate, Rental & Leasing | 0 (0.0%) | 0 (0.0%) |
| Professional & Scientific | 51 (100.0%) | 0 (0.0%) |
| Enterprise Management | 0 (0.0%) | 0 (0.0%) |
| Administrative & Support | 34 (100.0%) | 0 (0.0%) |
| Educational Services | 12 (100.0%) | 0 (0.0%) |
| Health Care & Social Assistance | 0 (0.0%) | 133 (100.0%) |
| Arts, Entertainment & Recreation | 91 (86.7%) | 14 (13.3%) |
| Accommodation & Food Services | 0 (0.0%) | 21 (100.0%) |
| Public Administration | 0 (0.0%) | 0 (0.0%) |
| Total | 240 (47.6%) | 264 (52.4%) |
Education in Gray
School Enrollment in Gray
The most common levels of schooling among the 194 students in Gray are high school (133 | 68.6%), college / undergraduate (34 | 17.5%), and elementary school (27 | 13.9%).
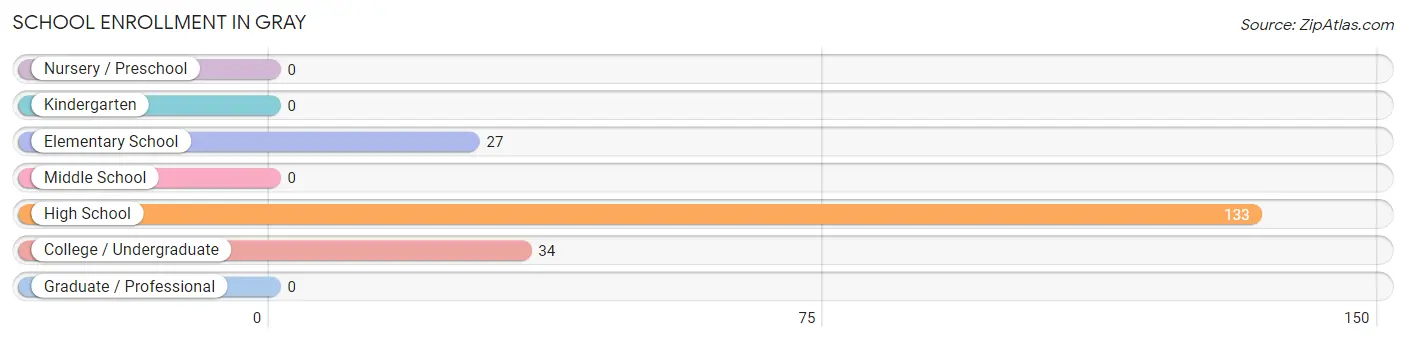
| School Level | # Students | % Students |
| Nursery / Preschool | 0 | 0.0% |
| Kindergarten | 0 | 0.0% |
| Elementary School | 27 | 13.9% |
| Middle School | 0 | 0.0% |
| High School | 133 | 68.6% |
| College / Undergraduate | 34 | 17.5% |
| Graduate / Professional | 0 | 0.0% |
| Total | 194 | 100.0% |
School Enrollment by Age by Funding Source in Gray
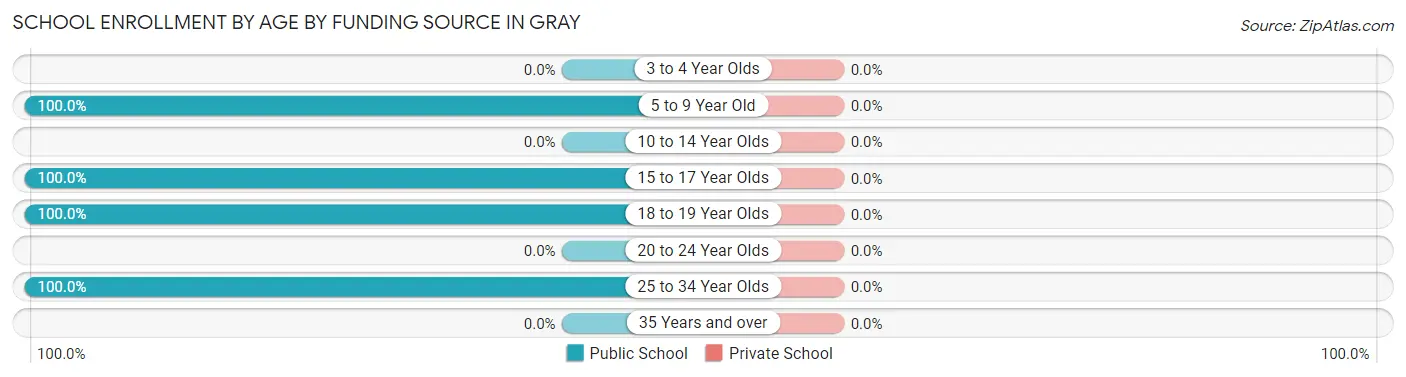
| Age Bracket | Public School | Private School |
| 3 to 4 Year Olds | 0 (0.0%) | 0 (0.0%) |
| 5 to 9 Year Old | 27 (100.0%) | 0 (0.0%) |
| 10 to 14 Year Olds | 0 (0.0%) | 0 (0.0%) |
| 15 to 17 Year Olds | 71 (100.0%) | 0 (0.0%) |
| 18 to 19 Year Olds | 62 (100.0%) | 0 (0.0%) |
| 20 to 24 Year Olds | 0 (0.0%) | 0 (0.0%) |
| 25 to 34 Year Olds | 34 (100.0%) | 0 (0.0%) |
| 35 Years and over | 0 (0.0%) | 0 (0.0%) |
| Total | 194 (100.0%) | 0 (0.0%) |
Educational Attainment by Field of Study in Gray
Business (104 | 45.4%), social sciences (63 | 27.5%), science & technology (30 | 13.1%), education (18 | 7.9%), and literature & languages (14 | 6.1%) are the most common fields of study among 229 individuals in Gray who have obtained a bachelor's degree or higher.
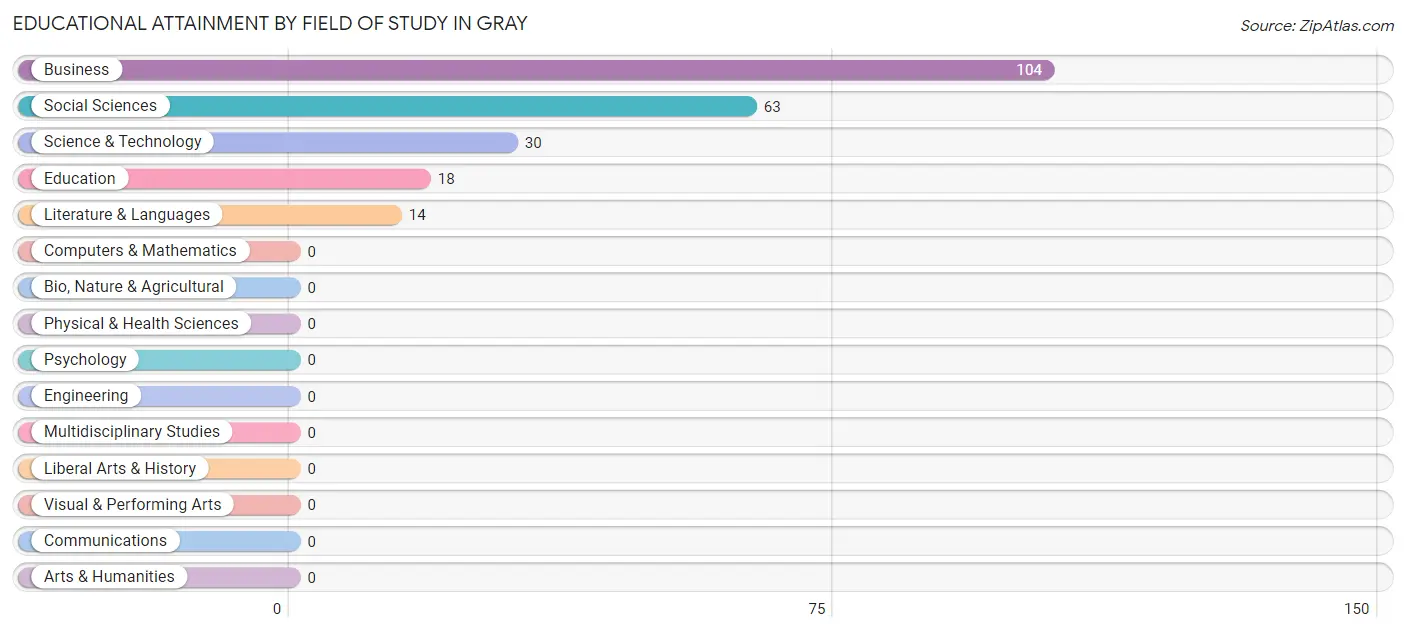
| Field of Study | # Graduates | % Graduates |
| Computers & Mathematics | 0 | 0.0% |
| Bio, Nature & Agricultural | 0 | 0.0% |
| Physical & Health Sciences | 0 | 0.0% |
| Psychology | 0 | 0.0% |
| Social Sciences | 63 | 27.5% |
| Engineering | 0 | 0.0% |
| Multidisciplinary Studies | 0 | 0.0% |
| Science & Technology | 30 | 13.1% |
| Business | 104 | 45.4% |
| Education | 18 | 7.9% |
| Literature & Languages | 14 | 6.1% |
| Liberal Arts & History | 0 | 0.0% |
| Visual & Performing Arts | 0 | 0.0% |
| Communications | 0 | 0.0% |
| Arts & Humanities | 0 | 0.0% |
| Total | 229 | 100.0% |
Transportation & Commute in Gray
Vehicle Availability by Sex in Gray
The most prevalent vehicle ownership categories in Gray are males with 2 vehicles (101, accounting for 42.1%) and females with 2 vehicles (99, making up 38.3%).
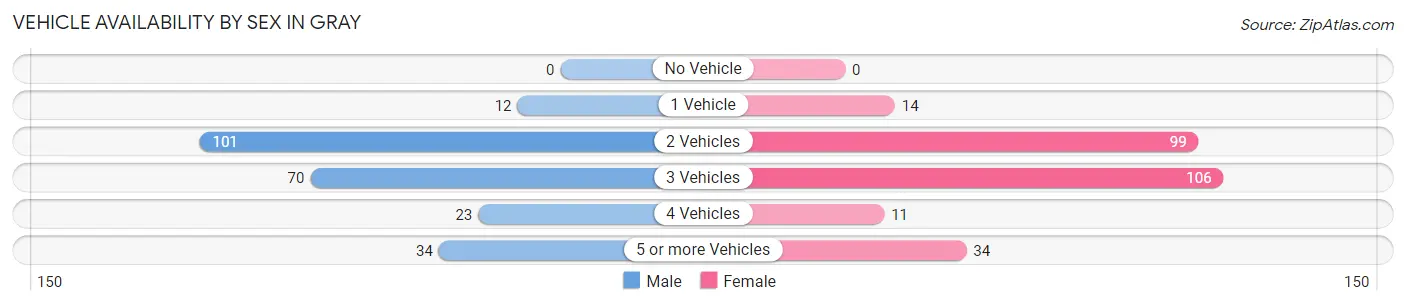
| Vehicles Available | Male | Female |
| No Vehicle | 0 (0.0%) | 0 (0.0%) |
| 1 Vehicle | 12 (5.0%) | 14 (5.3%) |
| 2 Vehicles | 101 (42.1%) | 99 (37.5%) |
| 3 Vehicles | 70 (29.2%) | 106 (40.2%) |
| 4 Vehicles | 23 (9.6%) | 11 (4.2%) |
| 5 or more Vehicles | 34 (14.2%) | 34 (12.9%) |
| Total | 240 (100.0%) | 264 (100.0%) |
Commute Time in Gray
The most frequently occuring commute durations in Gray are 10 to 14 minutes (113 commuters, 23.6%), 35 to 39 minutes (96 commuters, 20.1%), and 40 to 44 minutes (85 commuters, 17.8%).
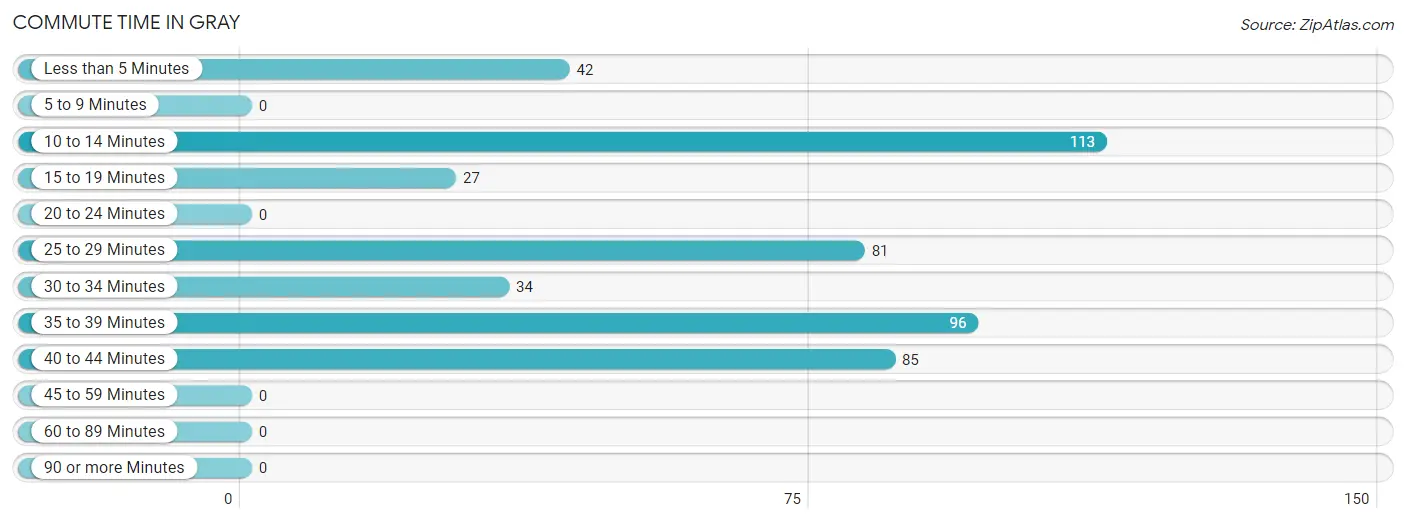
| Commute Time | # Commuters | % Commuters |
| Less than 5 Minutes | 42 | 8.8% |
| 5 to 9 Minutes | 0 | 0.0% |
| 10 to 14 Minutes | 113 | 23.6% |
| 15 to 19 Minutes | 27 | 5.7% |
| 20 to 24 Minutes | 0 | 0.0% |
| 25 to 29 Minutes | 81 | 17.0% |
| 30 to 34 Minutes | 34 | 7.1% |
| 35 to 39 Minutes | 96 | 20.1% |
| 40 to 44 Minutes | 85 | 17.8% |
| 45 to 59 Minutes | 0 | 0.0% |
| 60 to 89 Minutes | 0 | 0.0% |
| 90 or more Minutes | 0 | 0.0% |
Commute Time by Sex in Gray
The most common commute times in Gray are 40 to 44 minutes (85 commuters, 37.3%) for males and 10 to 14 minutes (113 commuters, 45.2%) for females.
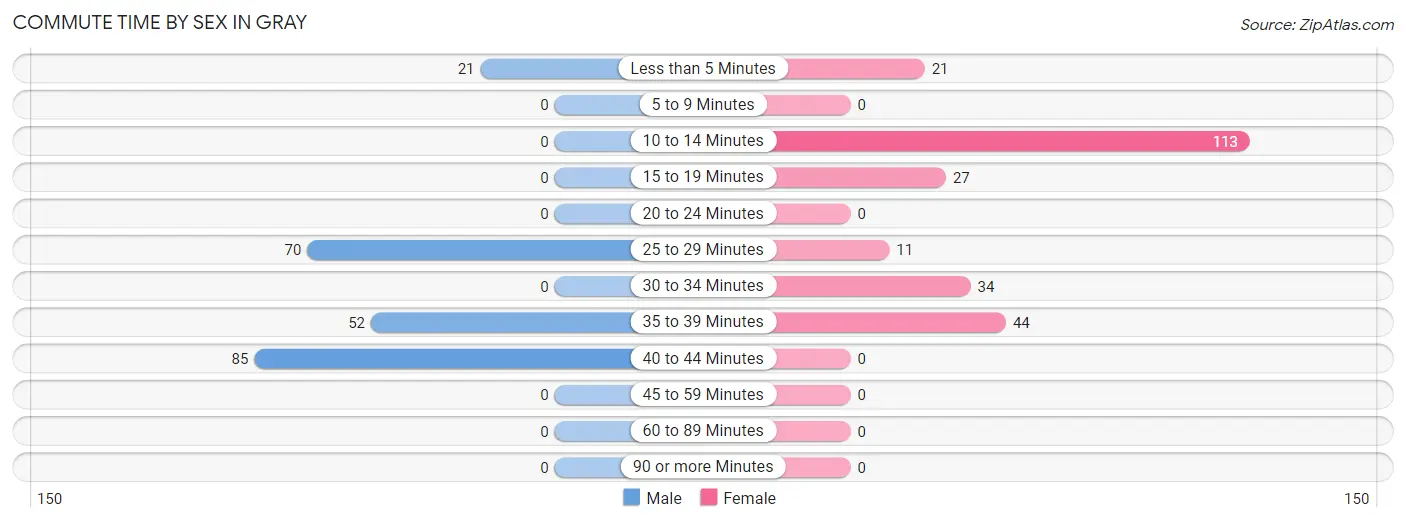
| Commute Time | Male | Female |
| Less than 5 Minutes | 21 (9.2%) | 21 (8.4%) |
| 5 to 9 Minutes | 0 (0.0%) | 0 (0.0%) |
| 10 to 14 Minutes | 0 (0.0%) | 113 (45.2%) |
| 15 to 19 Minutes | 0 (0.0%) | 27 (10.8%) |
| 20 to 24 Minutes | 0 (0.0%) | 0 (0.0%) |
| 25 to 29 Minutes | 70 (30.7%) | 11 (4.4%) |
| 30 to 34 Minutes | 0 (0.0%) | 34 (13.6%) |
| 35 to 39 Minutes | 52 (22.8%) | 44 (17.6%) |
| 40 to 44 Minutes | 85 (37.3%) | 0 (0.0%) |
| 45 to 59 Minutes | 0 (0.0%) | 0 (0.0%) |
| 60 to 89 Minutes | 0 (0.0%) | 0 (0.0%) |
| 90 or more Minutes | 0 (0.0%) | 0 (0.0%) |
Time of Departure to Work by Sex in Gray
The most frequent times of departure to work in Gray are 6:00 AM to 6:29 AM (91, 39.9%) for males and 7:30 AM to 7:59 AM (78, 31.2%) for females.
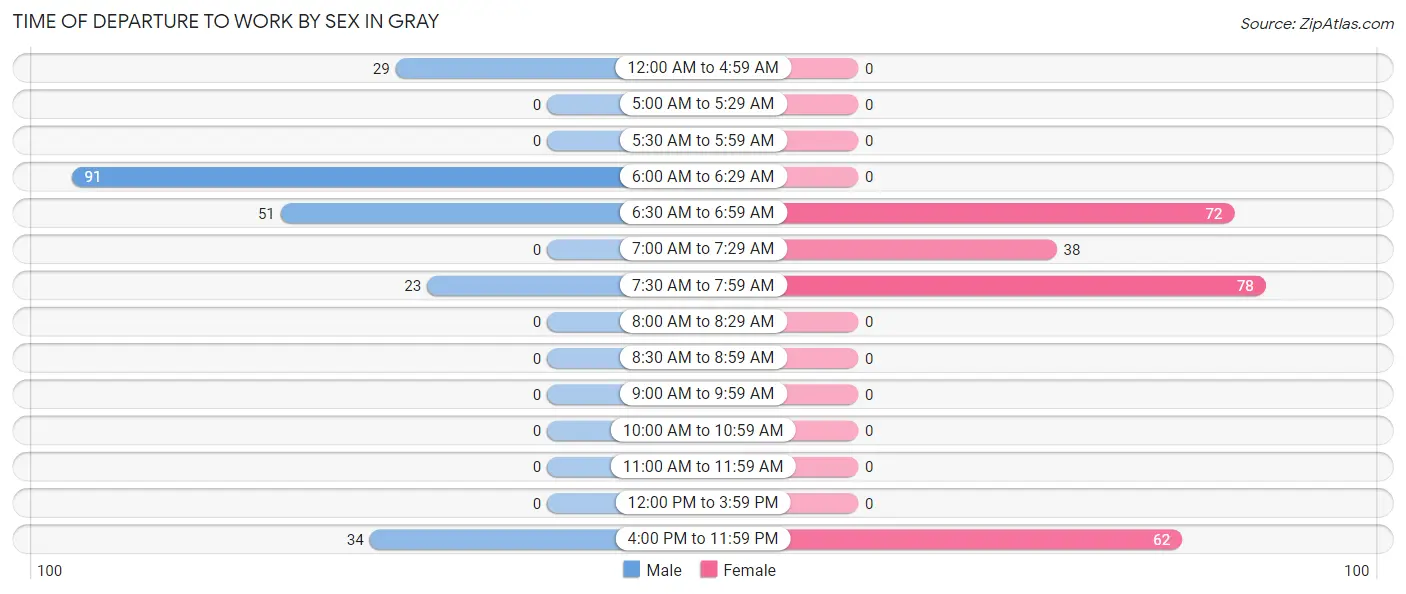
| Time of Departure | Male | Female |
| 12:00 AM to 4:59 AM | 29 (12.7%) | 0 (0.0%) |
| 5:00 AM to 5:29 AM | 0 (0.0%) | 0 (0.0%) |
| 5:30 AM to 5:59 AM | 0 (0.0%) | 0 (0.0%) |
| 6:00 AM to 6:29 AM | 91 (39.9%) | 0 (0.0%) |
| 6:30 AM to 6:59 AM | 51 (22.4%) | 72 (28.8%) |
| 7:00 AM to 7:29 AM | 0 (0.0%) | 38 (15.2%) |
| 7:30 AM to 7:59 AM | 23 (10.1%) | 78 (31.2%) |
| 8:00 AM to 8:29 AM | 0 (0.0%) | 0 (0.0%) |
| 8:30 AM to 8:59 AM | 0 (0.0%) | 0 (0.0%) |
| 9:00 AM to 9:59 AM | 0 (0.0%) | 0 (0.0%) |
| 10:00 AM to 10:59 AM | 0 (0.0%) | 0 (0.0%) |
| 11:00 AM to 11:59 AM | 0 (0.0%) | 0 (0.0%) |
| 12:00 PM to 3:59 PM | 0 (0.0%) | 0 (0.0%) |
| 4:00 PM to 11:59 PM | 34 (14.9%) | 62 (24.8%) |
| Total | 228 (100.0%) | 250 (100.0%) |
Housing Occupancy in Gray
Occupancy by Ownership in Gray
Of the total 382 dwellings in Gray, owner-occupied units account for 179 (46.9%), while renter-occupied units make up 203 (53.1%).
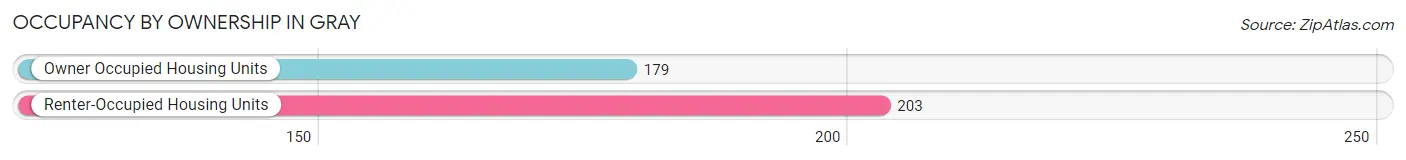
| Occupancy | # Housing Units | % Housing Units |
| Owner Occupied Housing Units | 179 | 46.9% |
| Renter-Occupied Housing Units | 203 | 53.1% |
| Total Occupied Housing Units | 382 | 100.0% |
Occupancy by Household Size in Gray
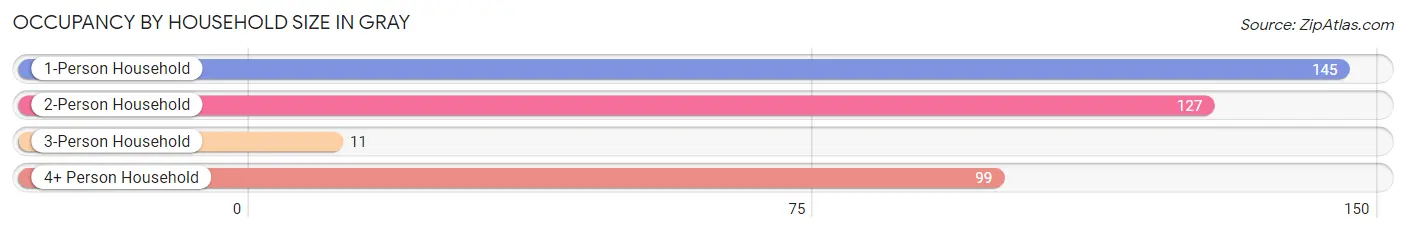
| Household Size | # Housing Units | % Housing Units |
| 1-Person Household | 145 | 38.0% |
| 2-Person Household | 127 | 33.3% |
| 3-Person Household | 11 | 2.9% |
| 4+ Person Household | 99 | 25.9% |
| Total Housing Units | 382 | 100.0% |
Occupancy by Ownership by Household Size in Gray
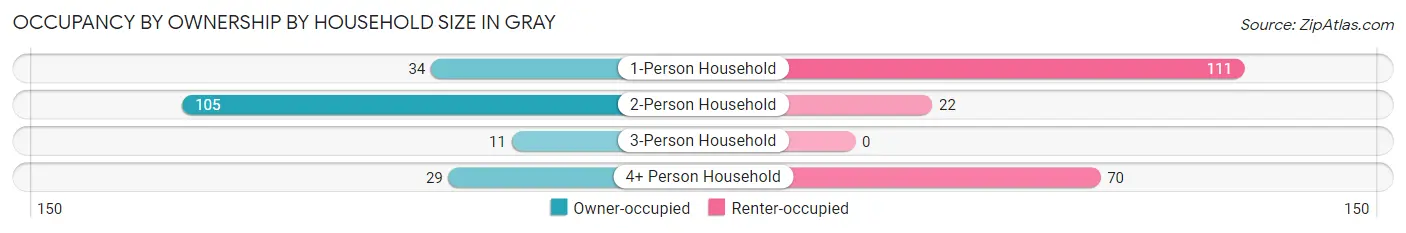
| Household Size | Owner-occupied | Renter-occupied |
| 1-Person Household | 34 (23.4%) | 111 (76.5%) |
| 2-Person Household | 105 (82.7%) | 22 (17.3%) |
| 3-Person Household | 11 (100.0%) | 0 (0.0%) |
| 4+ Person Household | 29 (29.3%) | 70 (70.7%) |
| Total Housing Units | 179 (46.9%) | 203 (53.1%) |
Occupancy by Educational Attainment in Gray
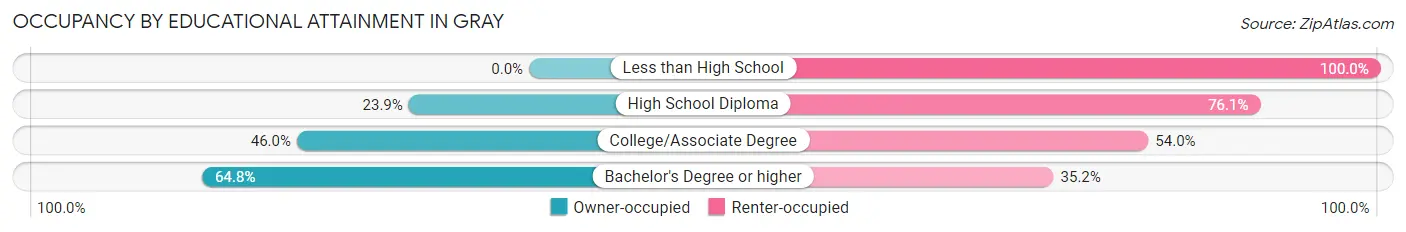
| Household Size | Owner-occupied | Renter-occupied |
| Less than High School | 0 (0.0%) | 32 (100.0%) |
| High School Diploma | 21 (23.9%) | 67 (76.1%) |
| College/Associate Degree | 29 (46.0%) | 34 (54.0%) |
| Bachelor's Degree or higher | 129 (64.8%) | 70 (35.2%) |
Occupancy by Age of Householder in Gray
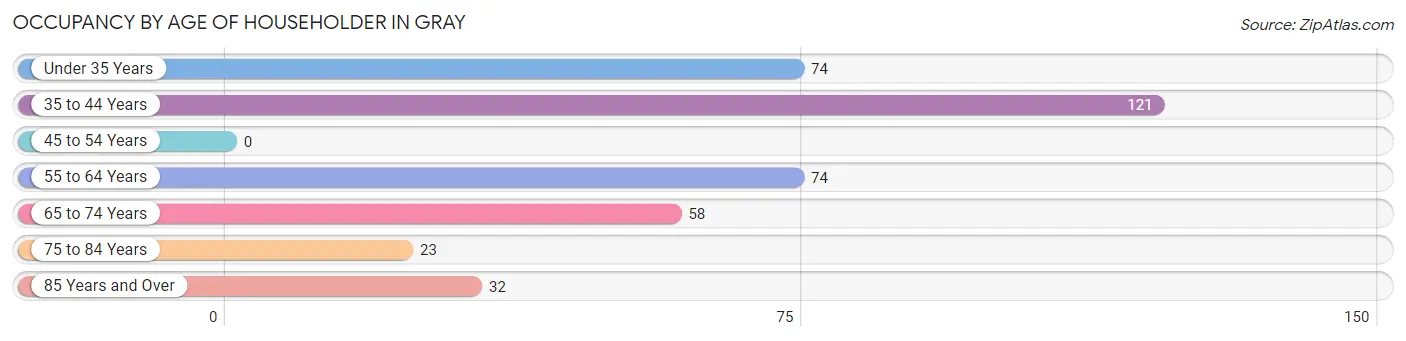
| Age Bracket | # Households | % Households |
| Under 35 Years | 74 | 19.4% |
| 35 to 44 Years | 121 | 31.7% |
| 45 to 54 Years | 0 | 0.0% |
| 55 to 64 Years | 74 | 19.4% |
| 65 to 74 Years | 58 | 15.2% |
| 75 to 84 Years | 23 | 6.0% |
| 85 Years and Over | 32 | 8.4% |
| Total | 382 | 100.0% |
Housing Finances in Gray
Median Income by Occupancy in Gray
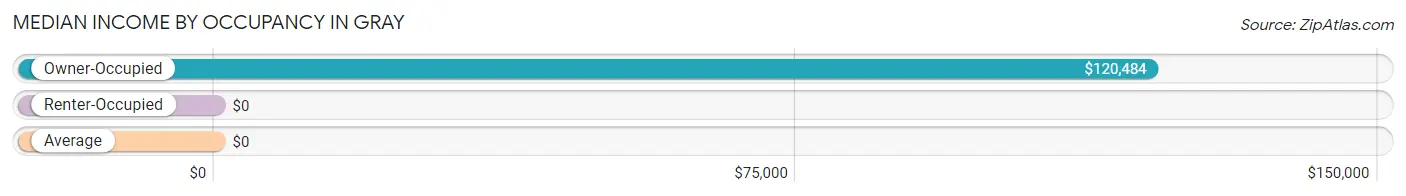
| Occupancy Type | # Households | Median Income |
| Owner-Occupied | 179 (46.9%) | $120,484 |
| Renter-Occupied | 203 (53.1%) | $0 |
| Average | 382 (100.0%) | $0 |
Occupancy by Householder Income Bracket in Gray
| Income Bracket | Owner-occupied | Renter-occupied |
| Less than $5,000 | 0 (0.0%) | 0 (0.0%) |
| $5,000 to $9,999 | 0 (0.0%) | 0 (0.0%) |
| $10,000 to $14,999 | 0 (0.0%) | 22 (10.8%) |
| $15,000 to $19,999 | 0 (0.0%) | 32 (15.8%) |
| $20,000 to $24,999 | 0 (0.0%) | 23 (11.3%) |
| $25,000 to $34,999 | 19 (10.6%) | 34 (16.8%) |
| $35,000 to $49,999 | 34 (19.0%) | 0 (0.0%) |
| $50,000 to $74,999 | 0 (0.0%) | 22 (10.8%) |
| $75,000 to $99,999 | 21 (11.7%) | 0 (0.0%) |
| $100,000 to $149,999 | 91 (50.8%) | 70 (34.5%) |
| $150,000 or more | 14 (7.8%) | 0 (0.0%) |
| Total | 179 (100.0%) | 203 (100.0%) |
Monthly Housing Cost Tiers in Gray
| Monthly Cost | Owner-occupied | Renter-occupied |
| Less than $300 | 34 (19.0%) | 22 (10.8%) |
| $300 to $499 | 70 (39.1%) | 32 (15.8%) |
| $500 to $799 | 0 (0.0%) | 23 (11.3%) |
| $800 to $999 | 0 (0.0%) | 34 (16.8%) |
| $1,000 to $1,499 | 35 (19.6%) | 22 (10.8%) |
| $1,500 to $1,999 | 40 (22.4%) | 70 (34.5%) |
| $2,000 to $2,499 | 0 (0.0%) | 0 (0.0%) |
| $2,500 to $2,999 | 0 (0.0%) | 0 (0.0%) |
| $3,000 or more | 0 (0.0%) | 0 (0.0%) |
| Total | 179 (100.0%) | 203 (100.0%) |
Physical Housing Characteristics in Gray
Housing Structures in Gray
| Structure Type | # Housing Units | % Housing Units |
| Single Unit, Detached | 131 | 34.3% |
| Single Unit, Attached | 0 | 0.0% |
| 2 Unit Apartments | 14 | 3.7% |
| 3 or 4 Unit Apartments | 104 | 27.2% |
| 5 to 9 Unit Apartments | 22 | 5.8% |
| 10 or more Apartments | 111 | 29.1% |
| Mobile Home / Other | 0 | 0.0% |
| Total | 382 | 100.0% |
Housing Structures by Occupancy in Gray
| Structure Type | Owner-occupied | Renter-occupied |
| Single Unit, Detached | 131 (100.0%) | 0 (0.0%) |
| Single Unit, Attached | 0 (0.0%) | 0 (0.0%) |
| 2 Unit Apartments | 14 (100.0%) | 0 (0.0%) |
| 3 or 4 Unit Apartments | 34 (32.7%) | 70 (67.3%) |
| 5 to 9 Unit Apartments | 0 (0.0%) | 22 (100.0%) |
| 10 or more Apartments | 0 (0.0%) | 111 (100.0%) |
| Mobile Home / Other | 0 (0.0%) | 0 (0.0%) |
| Total | 179 (46.9%) | 203 (53.1%) |
Housing Structures by Number of Rooms in Gray
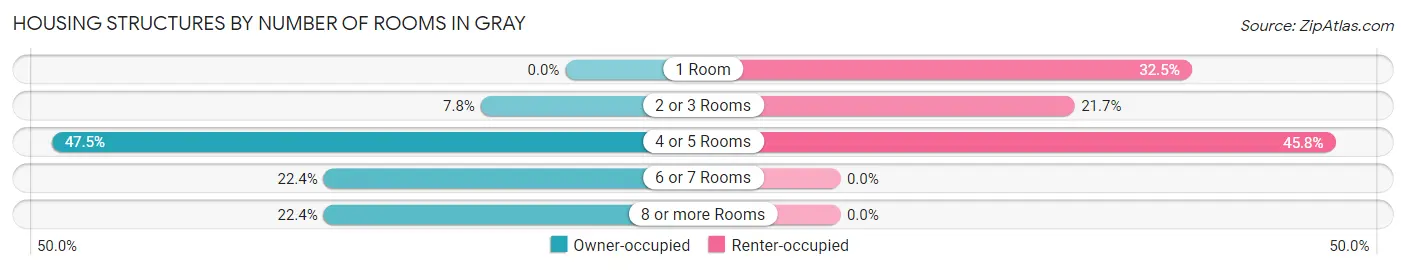
| Number of Rooms | Owner-occupied | Renter-occupied |
| 1 Room | 0 (0.0%) | 66 (32.5%) |
| 2 or 3 Rooms | 14 (7.8%) | 44 (21.7%) |
| 4 or 5 Rooms | 85 (47.5%) | 93 (45.8%) |
| 6 or 7 Rooms | 40 (22.4%) | 0 (0.0%) |
| 8 or more Rooms | 40 (22.4%) | 0 (0.0%) |
| Total | 179 (100.0%) | 203 (100.0%) |
Housing Structure by Heating Type in Gray
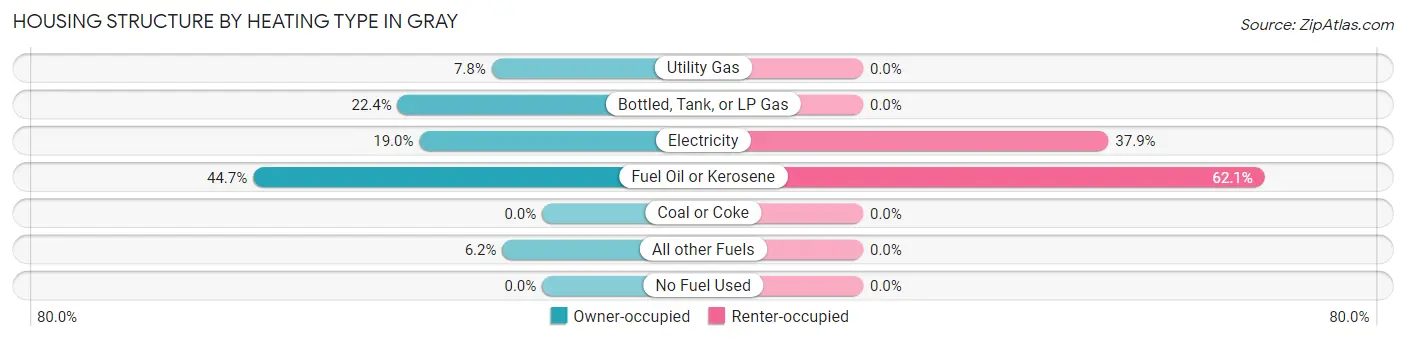
| Heating Type | Owner-occupied | Renter-occupied |
| Utility Gas | 14 (7.8%) | 0 (0.0%) |
| Bottled, Tank, or LP Gas | 40 (22.4%) | 0 (0.0%) |
| Electricity | 34 (19.0%) | 77 (37.9%) |
| Fuel Oil or Kerosene | 80 (44.7%) | 126 (62.1%) |
| Coal or Coke | 0 (0.0%) | 0 (0.0%) |
| All other Fuels | 11 (6.1%) | 0 (0.0%) |
| No Fuel Used | 0 (0.0%) | 0 (0.0%) |
| Total | 179 (100.0%) | 203 (100.0%) |
Household Vehicle Usage in Gray
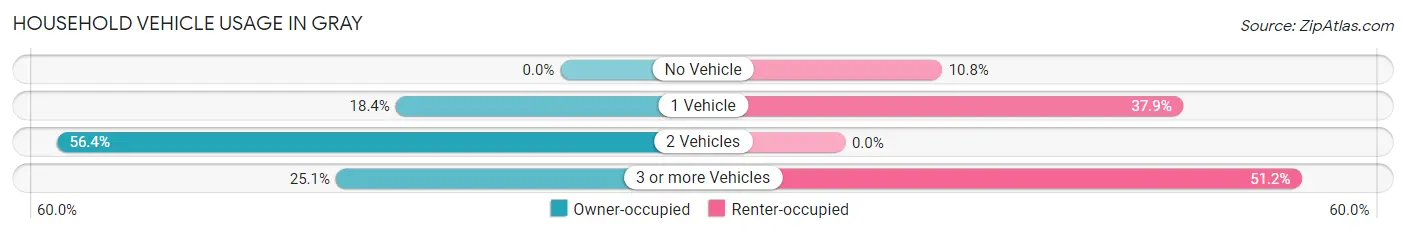
| Vehicles per Household | Owner-occupied | Renter-occupied |
| No Vehicle | 0 (0.0%) | 22 (10.8%) |
| 1 Vehicle | 33 (18.4%) | 77 (37.9%) |
| 2 Vehicles | 101 (56.4%) | 0 (0.0%) |
| 3 or more Vehicles | 45 (25.1%) | 104 (51.2%) |
| Total | 179 (100.0%) | 203 (100.0%) |
Real Estate & Mortgages in Gray
Real Estate and Mortgage Overview in Gray
| Characteristic | Without Mortgage | With Mortgage |
| Housing Units | 118 | 61 |
| Median Property Value | $155,900 | $367,200 |
| Median Household Income | - | - |
| Monthly Housing Costs | $412 | $0 |
| Real Estate Taxes | $1,912 | $0 |
Property Value by Mortgage Status in Gray
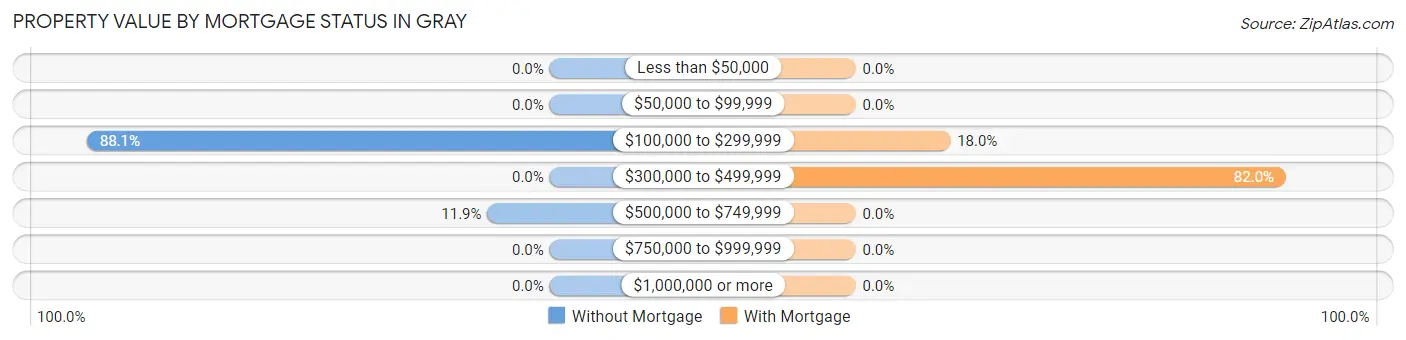
| Property Value | Without Mortgage | With Mortgage |
| Less than $50,000 | 0 (0.0%) | 0 (0.0%) |
| $50,000 to $99,999 | 0 (0.0%) | 0 (0.0%) |
| $100,000 to $299,999 | 104 (88.1%) | 11 (18.0%) |
| $300,000 to $499,999 | 0 (0.0%) | 50 (82.0%) |
| $500,000 to $749,999 | 14 (11.9%) | 0 (0.0%) |
| $750,000 to $999,999 | 0 (0.0%) | 0 (0.0%) |
| $1,000,000 or more | 0 (0.0%) | 0 (0.0%) |
| Total | 118 (100.0%) | 61 (100.0%) |
Household Income by Mortgage Status in Gray
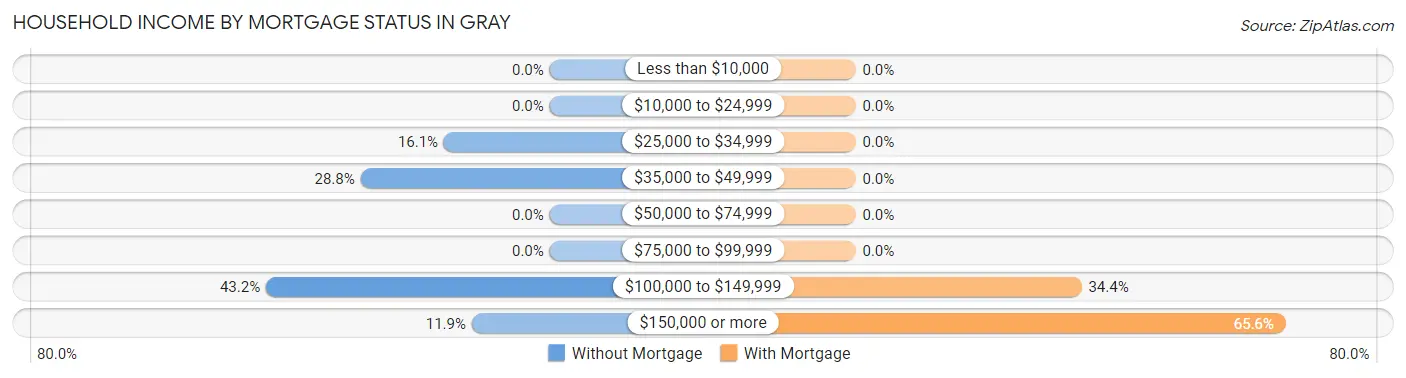
| Household Income | Without Mortgage | With Mortgage |
| Less than $10,000 | 0 (0.0%) | 0 (0.0%) |
| $10,000 to $24,999 | 0 (0.0%) | 0 (0.0%) |
| $25,000 to $34,999 | 19 (16.1%) | 0 (0.0%) |
| $35,000 to $49,999 | 34 (28.8%) | 0 (0.0%) |
| $50,000 to $74,999 | 0 (0.0%) | 0 (0.0%) |
| $75,000 to $99,999 | 0 (0.0%) | 0 (0.0%) |
| $100,000 to $149,999 | 51 (43.2%) | 21 (34.4%) |
| $150,000 or more | 14 (11.9%) | 40 (65.6%) |
| Total | 118 (100.0%) | 61 (100.0%) |
Property Value to Household Income Ratio in Gray
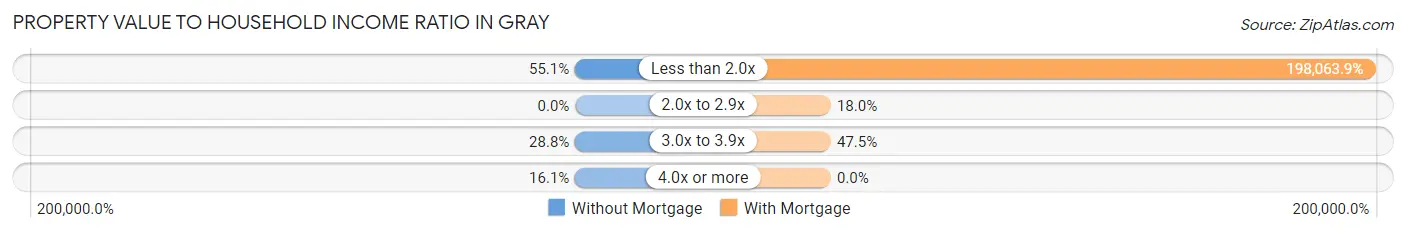
| Value-to-Income Ratio | Without Mortgage | With Mortgage |
| Less than 2.0x | 65 (55.1%) | 120,819 (198,063.9%) |
| 2.0x to 2.9x | 0 (0.0%) | 11 (18.0%) |
| 3.0x to 3.9x | 34 (28.8%) | 29 (47.5%) |
| 4.0x or more | 19 (16.1%) | 0 (0.0%) |
| Total | 118 (100.0%) | 61 (100.0%) |
Real Estate Taxes by Mortgage Status in Gray
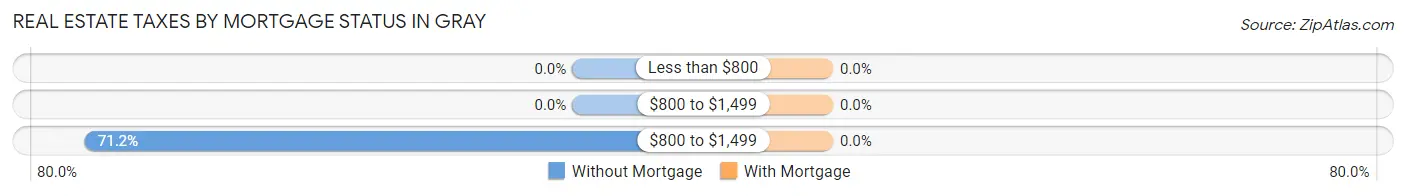
| Property Taxes | Without Mortgage | With Mortgage |
| Less than $800 | 0 (0.0%) | 0 (0.0%) |
| $800 to $1,499 | 0 (0.0%) | 0 (0.0%) |
| $800 to $1,499 | 84 (71.2%) | 0 (0.0%) |
| Total | 118 (100.0%) | 61 (100.0%) |
Health & Disability in Gray
Health Insurance Coverage by Age in Gray
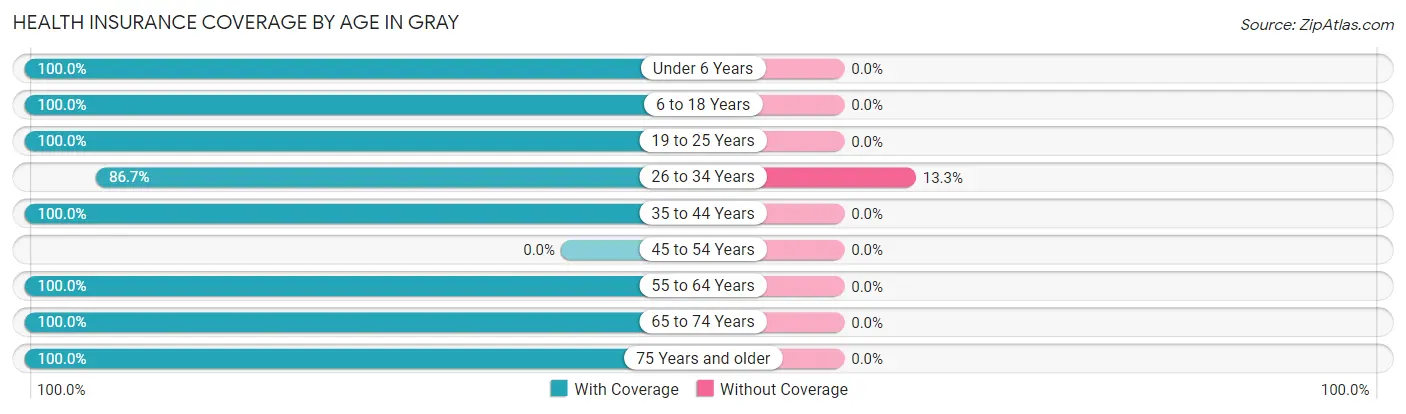
| Age Bracket | With Coverage | Without Coverage |
| Under 6 Years | 28 (100.0%) | 0 (0.0%) |
| 6 to 18 Years | 160 (100.0%) | 0 (0.0%) |
| 19 to 25 Years | 34 (100.0%) | 0 (0.0%) |
| 26 to 34 Years | 78 (86.7%) | 12 (13.3%) |
| 35 to 44 Years | 216 (100.0%) | 0 (0.0%) |
| 45 to 54 Years | 0 (0.0%) | 0 (0.0%) |
| 55 to 64 Years | 95 (100.0%) | 0 (0.0%) |
| 65 to 74 Years | 96 (100.0%) | 0 (0.0%) |
| 75 Years and older | 67 (100.0%) | 0 (0.0%) |
| Total | 774 (98.5%) | 12 (1.5%) |
Health Insurance Coverage by Citizenship Status in Gray
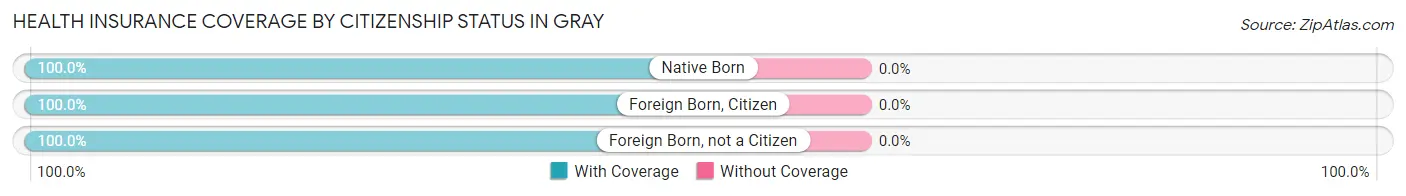
| Citizenship Status | With Coverage | Without Coverage |
| Native Born | 28 (100.0%) | 0 (0.0%) |
| Foreign Born, Citizen | 160 (100.0%) | 0 (0.0%) |
| Foreign Born, not a Citizen | 34 (100.0%) | 0 (0.0%) |
Health Insurance Coverage by Household Income in Gray
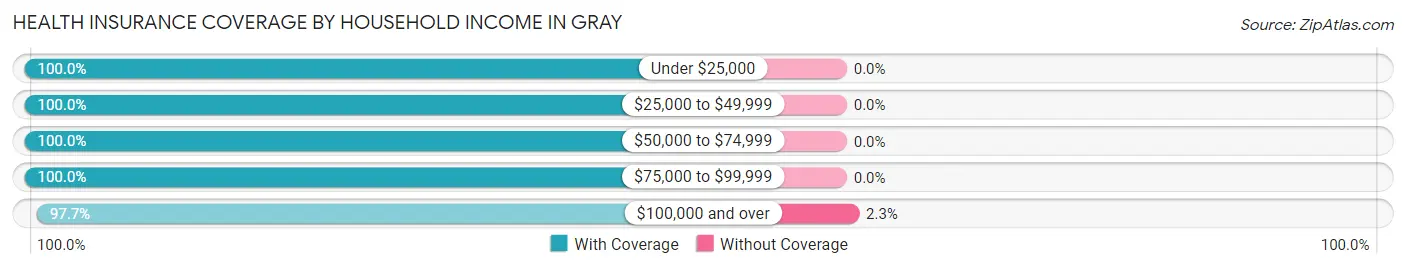
| Household Income | With Coverage | Without Coverage |
| Under $25,000 | 77 (100.0%) | 0 (0.0%) |
| $25,000 to $49,999 | 105 (100.0%) | 0 (0.0%) |
| $50,000 to $74,999 | 42 (100.0%) | 0 (0.0%) |
| $75,000 to $99,999 | 42 (100.0%) | 0 (0.0%) |
| $100,000 and over | 508 (97.7%) | 12 (2.3%) |
Public vs Private Health Insurance Coverage by Age in Gray
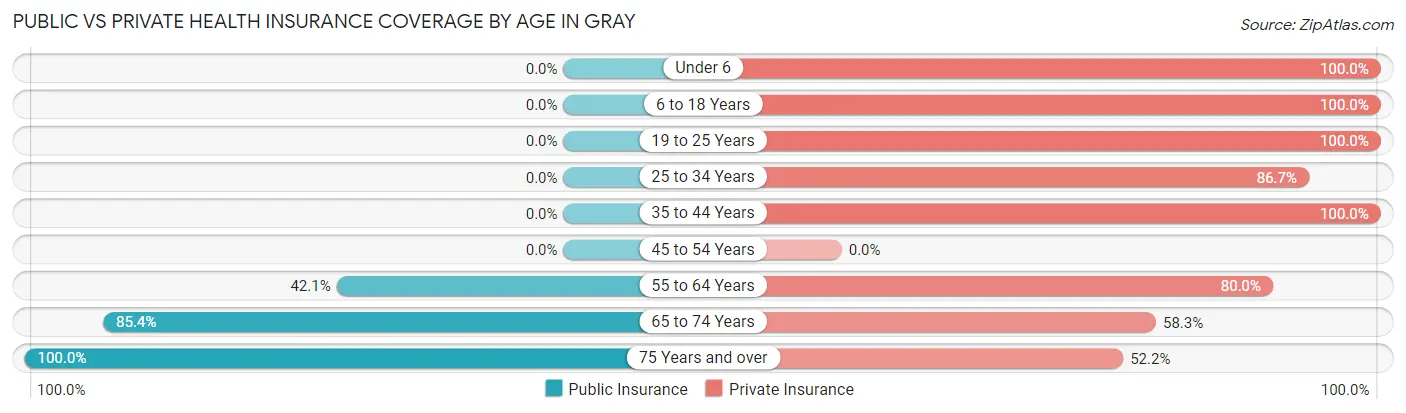
| Age Bracket | Public Insurance | Private Insurance |
| Under 6 | 0 (0.0%) | 28 (100.0%) |
| 6 to 18 Years | 0 (0.0%) | 160 (100.0%) |
| 19 to 25 Years | 0 (0.0%) | 34 (100.0%) |
| 25 to 34 Years | 0 (0.0%) | 78 (86.7%) |
| 35 to 44 Years | 0 (0.0%) | 216 (100.0%) |
| 45 to 54 Years | 0 (0.0%) | 0 (0.0%) |
| 55 to 64 Years | 40 (42.1%) | 76 (80.0%) |
| 65 to 74 Years | 82 (85.4%) | 56 (58.3%) |
| 75 Years and over | 67 (100.0%) | 35 (52.2%) |
| Total | 189 (24.0%) | 683 (86.9%) |
Disability Status by Sex by Age in Gray
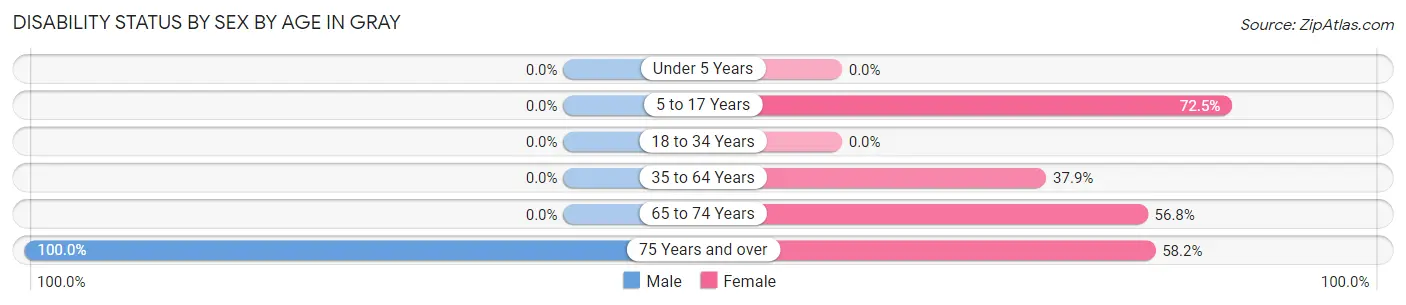
| Age Bracket | Male | Female |
| Under 5 Years | 0 (0.0%) | 0 (0.0%) |
| 5 to 17 Years | 0 (0.0%) | 71 (72.5%) |
| 18 to 34 Years | 0 (0.0%) | 0 (0.0%) |
| 35 to 64 Years | 0 (0.0%) | 44 (37.9%) |
| 65 to 74 Years | 0 (0.0%) | 42 (56.8%) |
| 75 Years and over | 12 (100.0%) | 32 (58.2%) |
Disability Class by Sex by Age in Gray
Disability Class: Hearing Difficulty
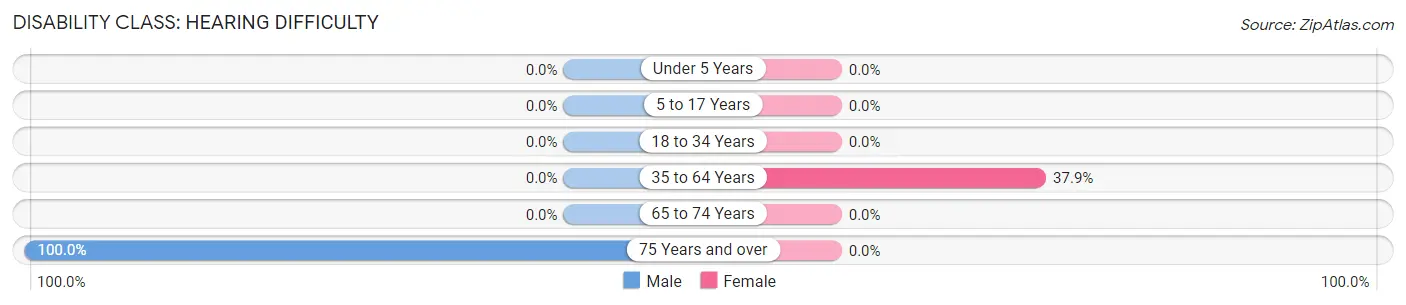
| Age Bracket | Male | Female |
| Under 5 Years | 0 (0.0%) | 0 (0.0%) |
| 5 to 17 Years | 0 (0.0%) | 0 (0.0%) |
| 18 to 34 Years | 0 (0.0%) | 0 (0.0%) |
| 35 to 64 Years | 0 (0.0%) | 44 (37.9%) |
| 65 to 74 Years | 0 (0.0%) | 0 (0.0%) |
| 75 Years and over | 12 (100.0%) | 0 (0.0%) |
Disability Class: Vision Difficulty
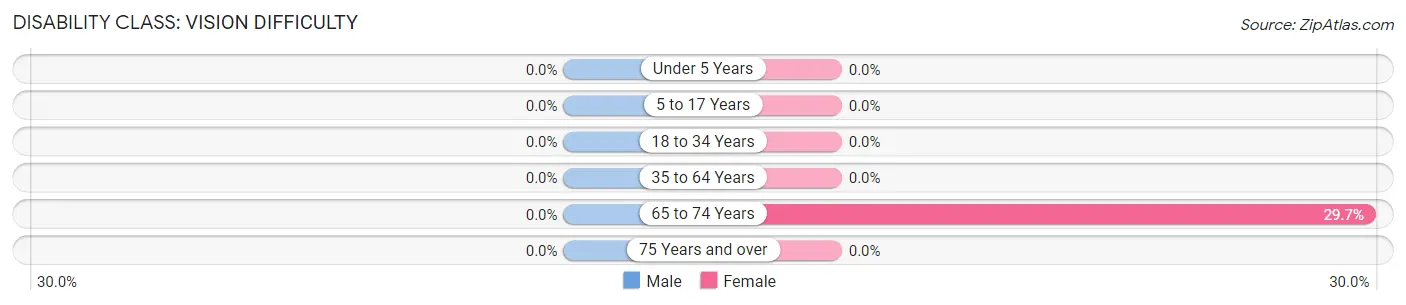
| Age Bracket | Male | Female |
| Under 5 Years | 0 (0.0%) | 0 (0.0%) |
| 5 to 17 Years | 0 (0.0%) | 0 (0.0%) |
| 18 to 34 Years | 0 (0.0%) | 0 (0.0%) |
| 35 to 64 Years | 0 (0.0%) | 0 (0.0%) |
| 65 to 74 Years | 0 (0.0%) | 22 (29.7%) |
| 75 Years and over | 0 (0.0%) | 0 (0.0%) |
Disability Class: Cognitive Difficulty
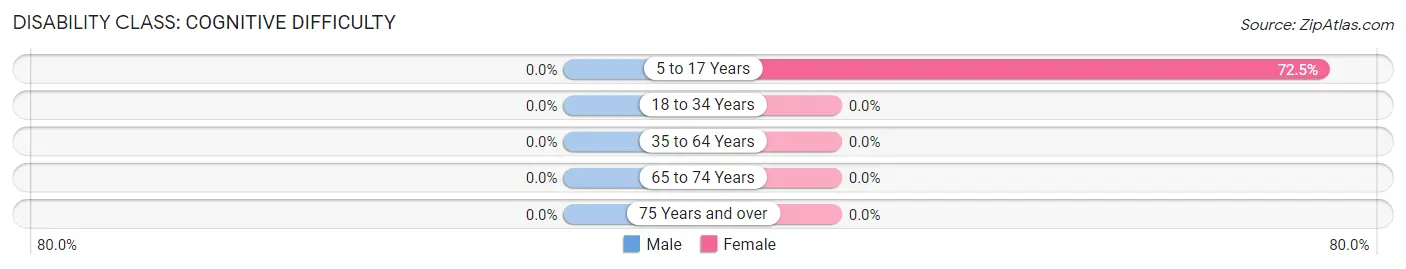
| Age Bracket | Male | Female |
| 5 to 17 Years | 0 (0.0%) | 71 (72.5%) |
| 18 to 34 Years | 0 (0.0%) | 0 (0.0%) |
| 35 to 64 Years | 0 (0.0%) | 0 (0.0%) |
| 65 to 74 Years | 0 (0.0%) | 0 (0.0%) |
| 75 Years and over | 0 (0.0%) | 0 (0.0%) |
Disability Class: Ambulatory Difficulty
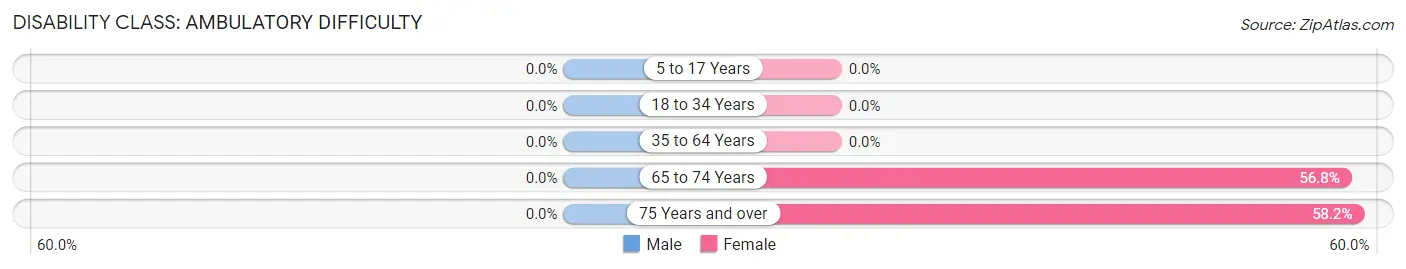
| Age Bracket | Male | Female |
| 5 to 17 Years | 0 (0.0%) | 0 (0.0%) |
| 18 to 34 Years | 0 (0.0%) | 0 (0.0%) |
| 35 to 64 Years | 0 (0.0%) | 0 (0.0%) |
| 65 to 74 Years | 0 (0.0%) | 42 (56.8%) |
| 75 Years and over | 0 (0.0%) | 32 (58.2%) |
Disability Class: Self-Care Difficulty
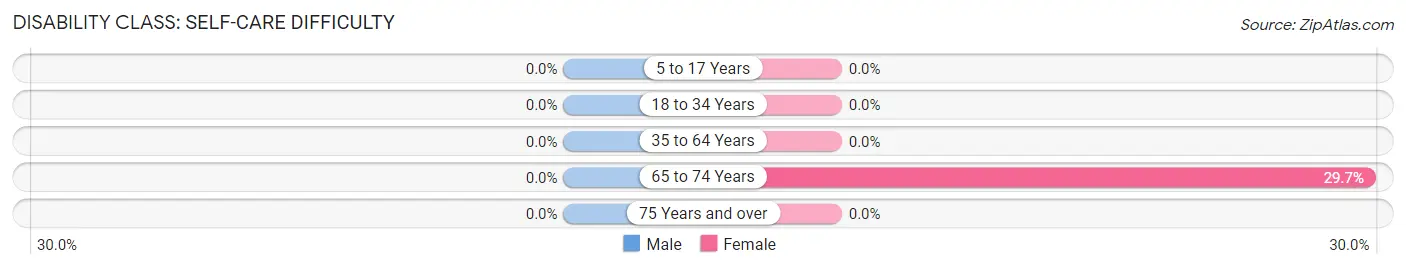
| Age Bracket | Male | Female |
| 5 to 17 Years | 0 (0.0%) | 0 (0.0%) |
| 18 to 34 Years | 0 (0.0%) | 0 (0.0%) |
| 35 to 64 Years | 0 (0.0%) | 0 (0.0%) |
| 65 to 74 Years | 0 (0.0%) | 22 (29.7%) |
| 75 Years and over | 0 (0.0%) | 0 (0.0%) |
Technology Access in Gray
Computing Device Access in Gray
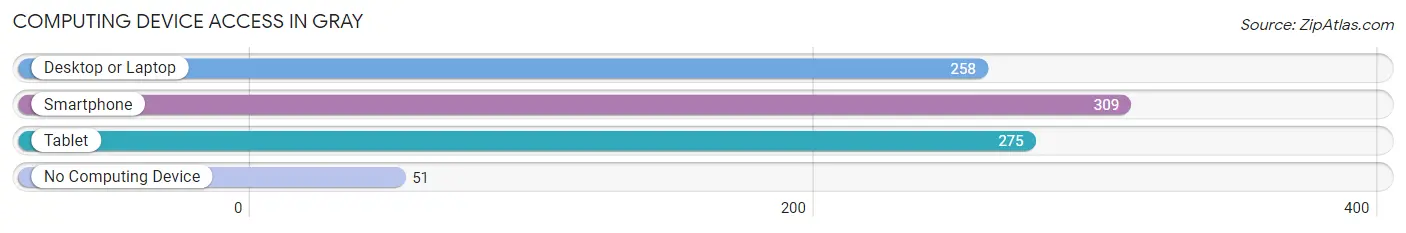
| Device Type | # Households | % Households |
| Desktop or Laptop | 258 | 67.5% |
| Smartphone | 309 | 80.9% |
| Tablet | 275 | 72.0% |
| No Computing Device | 51 | 13.4% |
| Total | 382 | 100.0% |
Internet Access in Gray
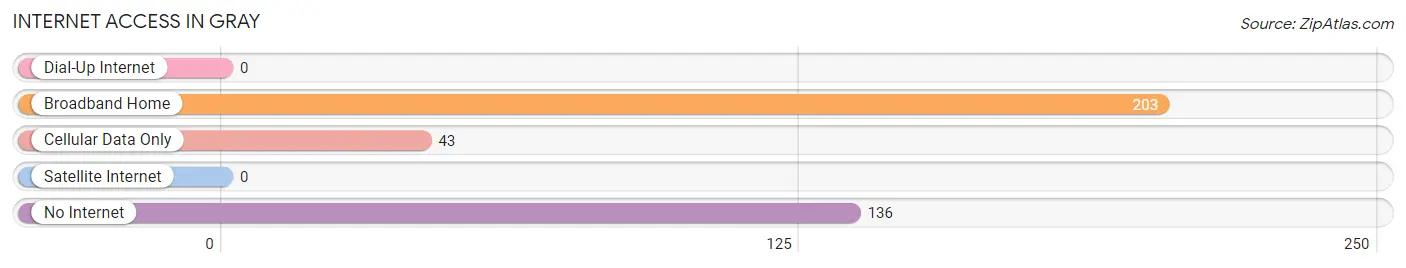
| Internet Type | # Households | % Households |
| Dial-Up Internet | 0 | 0.0% |
| Broadband Home | 203 | 53.1% |
| Cellular Data Only | 43 | 11.3% |
| Satellite Internet | 0 | 0.0% |
| No Internet | 136 | 35.6% |
| Total | 382 | 100.0% |
Gray Summary
Gray, Maine is a small town located in Cumberland County, in the southern part of the state. It is situated on the banks of the Royal River, and is bordered by the towns of New Gloucester, Windham, and North Yarmouth. The town has a population of approximately 8,000 people, and is home to a variety of businesses, including a paper mill, a sawmill, and a number of small businesses.
Geography
Gray is located in the foothills of the White Mountains, and is surrounded by rolling hills and forests. The town is situated on the banks of the Royal River, which flows through the center of town. The town is also home to several small lakes, including Crystal Lake, which is located in the center of town. The town is located approximately 25 miles north of Portland, and is accessible by Interstate 95.
Economy
Gray is home to a variety of businesses, including a paper mill, a sawmill, and a number of small businesses. The paper mill is the largest employer in the town, and provides jobs for many of the town's residents. The sawmill is also a major employer, and provides jobs for many of the town's residents. The town also has a number of small businesses, including restaurants, retail stores, and service businesses.
Demographics
As of the 2010 census, the population of Gray was 8,034. The population is predominantly white, with a small percentage of African Americans, Hispanics, and Asians. The median household income in Gray is $50,945, and the median home value is $179,000. The town has a high rate of homeownership, with approximately 75% of the population owning their own homes.
Education
Gray is served by the Gray-New Gloucester School District, which includes two elementary schools, one middle school, and one high school. The town also has a number of private schools, including a Catholic school and a Montessori school. The town is also home to a number of higher education institutions, including the University of Southern Maine, the University of Maine at Portland, and the Maine College of Art.
Conclusion
Gray, Maine is a small town located in Cumberland County, in the southern part of the state. It is situated on the banks of the Royal River, and is bordered by the towns of New Gloucester, Windham, and North Yarmouth. The town has a population of approximately 8,000 people, and is home to a variety of businesses, including a paper mill, a sawmill, and a number of small businesses. The town has a high rate of homeownership, and is served by the Gray-New Gloucester School District. The town is also home to a number of higher education institutions, including the University of Southern Maine, the University of Maine at Portland, and the Maine College of Art.
Common Questions
What is the Total Population of Gray?
Total Population of Gray is 786.
What is the Total Male Population of Gray?
Total Male Population of Gray is 309.
What is the Total Female Population of Gray?
Total Female Population of Gray is 477.
What is the Ratio of Males per 100 Females in Gray?
There are 64.78 Males per 100 Females in Gray.
What is the Ratio of Females per 100 Males in Gray?
There are 154.37 Females per 100 Males in Gray.
What is the Median Population Age in Gray?
Median Population Age in Gray is 40.1 Years.
What is the Average Family Size in Gray
Average Family Size in Gray is 2.7 People.
What is the Average Household Size in Gray
Average Household Size in Gray is 2.1 People.
What is Per Capita Income in Gray?
Per Capita income in Gray is $58,275.
What is the Median Family Income in Gray?
Median Family Income in Gray is $121,422.
What is Income or Wage Gap in Gray?
Income or Wage Gap in Gray is 49.7%.
Women in Gray earn 50.3 cents for every dollar earned by a man.
What is Inequality or Gini Index in Gray?
Inequality or Gini Index in Gray is 0.57.
How Large is the Labor Force in Gray?
There are 504 People in the Labor Forcein in Gray.
What is the Percentage of People in the Labor Force in Gray?
76.4% of People are in the Labor Force in Gray.