Eastport, ME
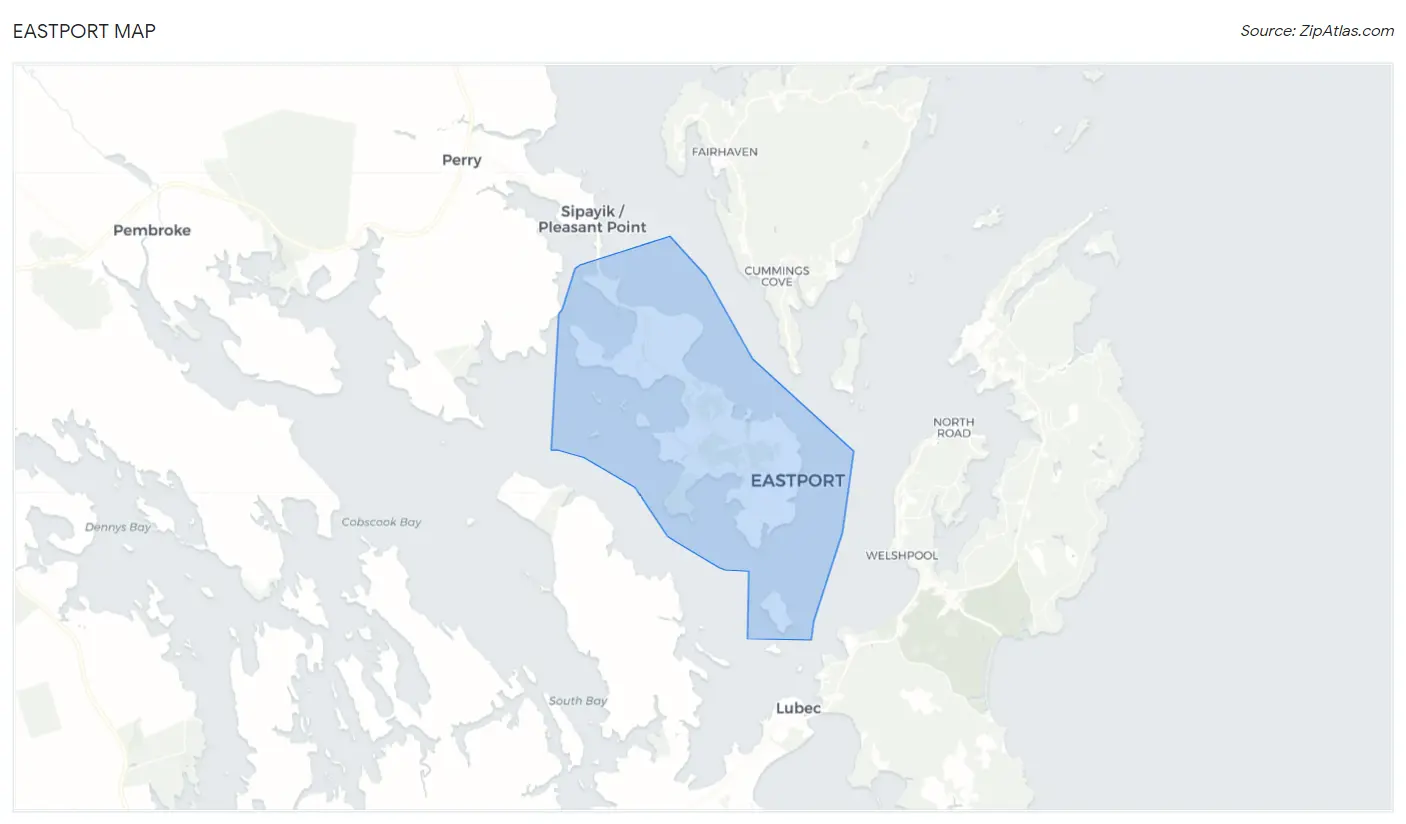
Eastport Map
Eastport Overview
1,211
TOTAL POPULATION
531
MALE POPULATION
680
FEMALE POPULATION
78.09
MALES / 100 FEMALES
128.06
FEMALES / 100 MALES
63.9
MEDIAN AGE
2.5
AVG FAMILY SIZE
1.9
AVG HOUSEHOLD SIZE
$34,609
PER CAPITA INCOME
$83,289
AVG FAMILY INCOME
$44,919
AVG HOUSEHOLD INCOME
18.7%
WAGE / INCOME GAP [ % ]
81.3¢/ $1
WAGE / INCOME GAP [ $ ]
0.46
INEQUALITY / GINI INDEX
475
LABOR FORCE [ PEOPLE ]
43.8%
PERCENT IN LABOR FORCE
2.8%
UNEMPLOYMENT RATE
Eastport Zip Codes
Eastport Area Codes
Race in Eastport
The most populous races in Eastport are White / Caucasian (1,116 | 92.2%), Two or more Races (43 | 3.5%), and Native / Alaskan (40 | 3.3%).
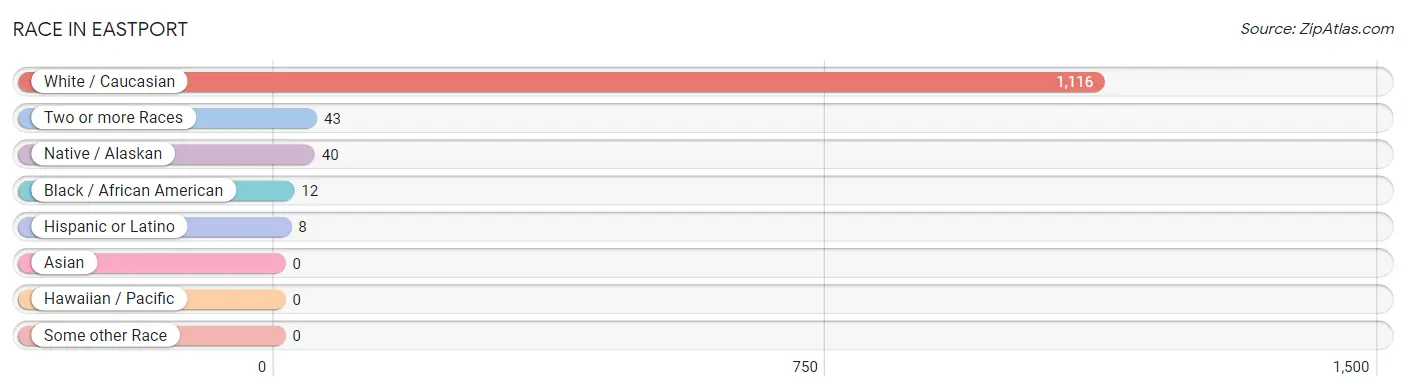
| Race | # Population | % Population |
| Asian | 0 | 0.0% |
| Black / African American | 12 | 1.0% |
| Hawaiian / Pacific | 0 | 0.0% |
| Hispanic or Latino | 8 | 0.7% |
| Native / Alaskan | 40 | 3.3% |
| White / Caucasian | 1,116 | 92.2% |
| Two or more Races | 43 | 3.5% |
| Some other Race | 0 | 0.0% |
| Total | 1,211 | 100.0% |
Ancestry in Eastport
The most populous ancestries reported in Eastport are English (220 | 18.2%), Irish (188 | 15.5%), German (178 | 14.7%), American (137 | 11.3%), and Italian (70 | 5.8%), together accounting for 65.5% of all Eastport residents.
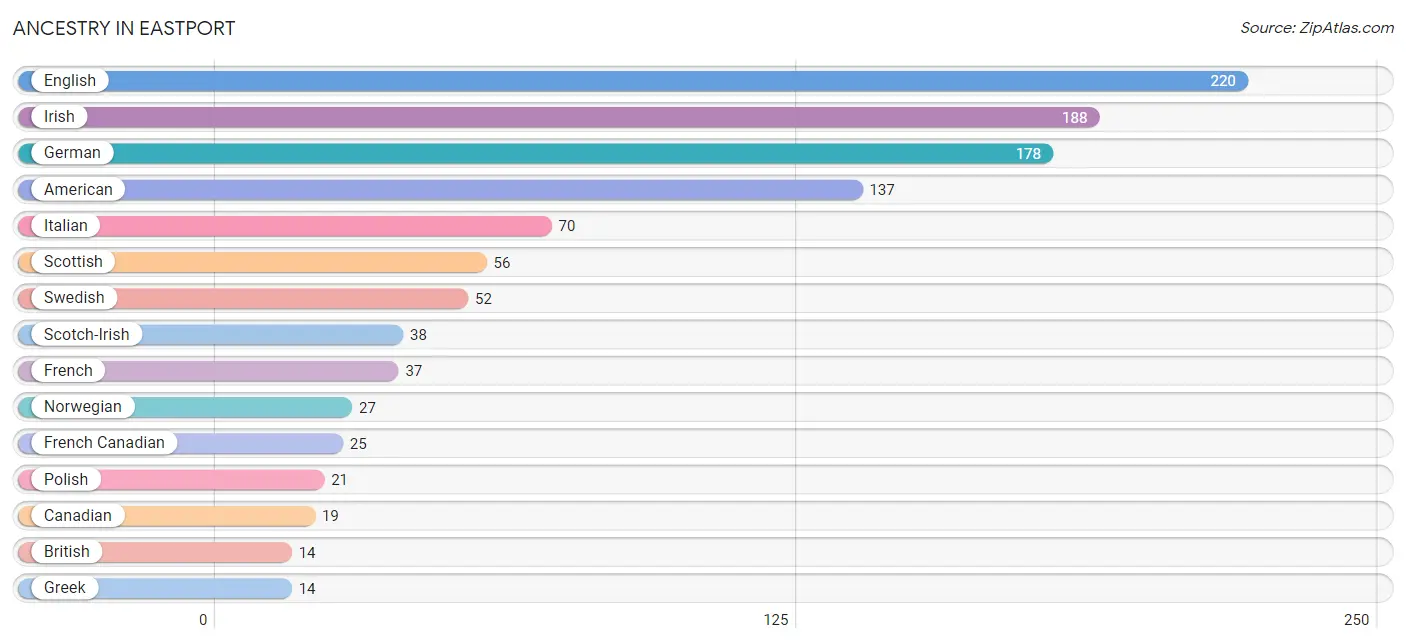
| Ancestry | # Population | % Population |
| American | 137 | 11.3% |
| Apache | 5 | 0.4% |
| Arab | 8 | 0.7% |
| Blackfeet | 3 | 0.3% |
| British | 14 | 1.2% |
| Canadian | 19 | 1.6% |
| Celtic | 2 | 0.2% |
| Cherokee | 1 | 0.1% |
| Choctaw | 5 | 0.4% |
| Czech | 3 | 0.3% |
| Danish | 3 | 0.3% |
| Dutch | 4 | 0.3% |
| Eastern European | 9 | 0.7% |
| English | 220 | 18.2% |
| European | 8 | 0.7% |
| Finnish | 10 | 0.8% |
| French | 37 | 3.1% |
| French Canadian | 25 | 2.1% |
| German | 178 | 14.7% |
| Greek | 14 | 1.2% |
| Hungarian | 6 | 0.5% |
| Irish | 188 | 15.5% |
| Italian | 70 | 5.8% |
| Lebanese | 7 | 0.6% |
| Lithuanian | 6 | 0.5% |
| Mexican | 6 | 0.5% |
| Norwegian | 27 | 2.2% |
| Polish | 21 | 1.7% |
| Portuguese | 3 | 0.3% |
| Puerto Rican | 2 | 0.2% |
| Russian | 2 | 0.2% |
| Scandinavian | 4 | 0.3% |
| Scotch-Irish | 38 | 3.1% |
| Scottish | 56 | 4.6% |
| Slovak | 3 | 0.3% |
| Sri Lankan | 6 | 0.5% |
| Swedish | 52 | 4.3% |
| Syrian | 1 | 0.1% |
| Ukrainian | 3 | 0.3% |
| Welsh | 5 | 0.4% | View All 40 Rows |
Immigrants in Eastport
The most numerous immigrant groups reported in Eastport came from Canada (18 | 1.5%), Asia (5 | 0.4%), Europe (3 | 0.3%), Germany (3 | 0.3%), and Turkey (3 | 0.3%), together accounting for 2.6% of all Eastport residents.
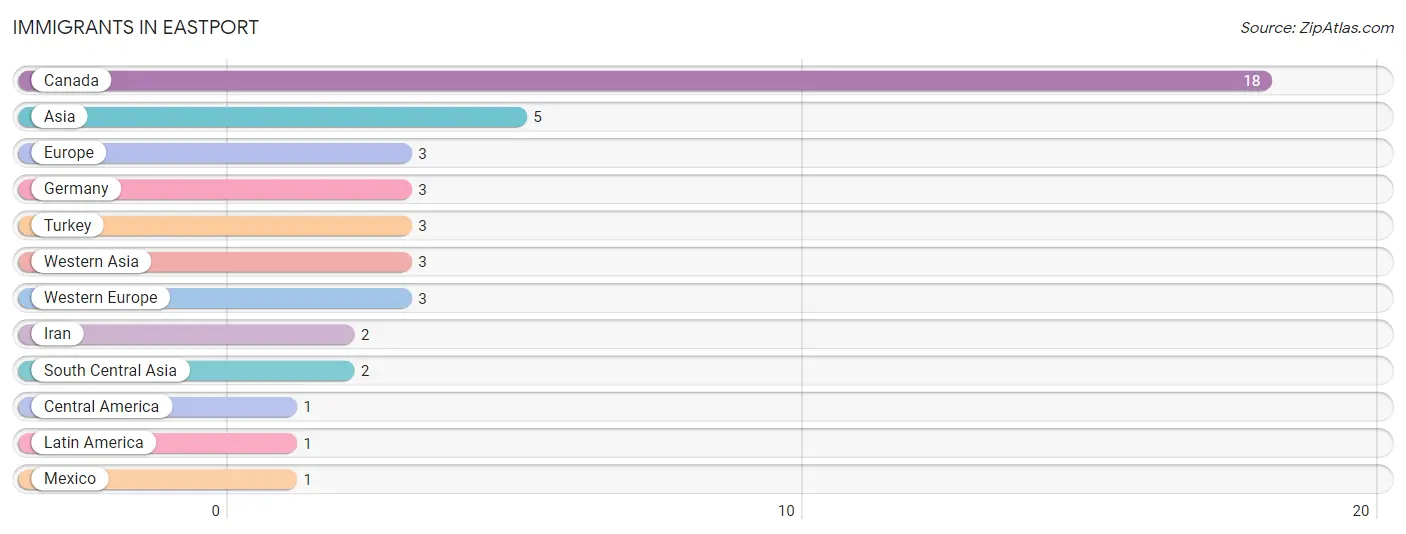
| Immigration Origin | # Population | % Population |
| Asia | 5 | 0.4% |
| Canada | 18 | 1.5% |
| Central America | 1 | 0.1% |
| Europe | 3 | 0.3% |
| Germany | 3 | 0.3% |
| Iran | 2 | 0.2% |
| Latin America | 1 | 0.1% |
| Mexico | 1 | 0.1% |
| South Central Asia | 2 | 0.2% |
| Turkey | 3 | 0.3% |
| Western Asia | 3 | 0.3% |
| Western Europe | 3 | 0.3% | View All 12 Rows |
Sex and Age in Eastport
Sex and Age in Eastport
The most populous age groups in Eastport are 65 to 69 Years (93 | 17.5%) for men and 65 to 69 Years (91 | 13.4%) for women.
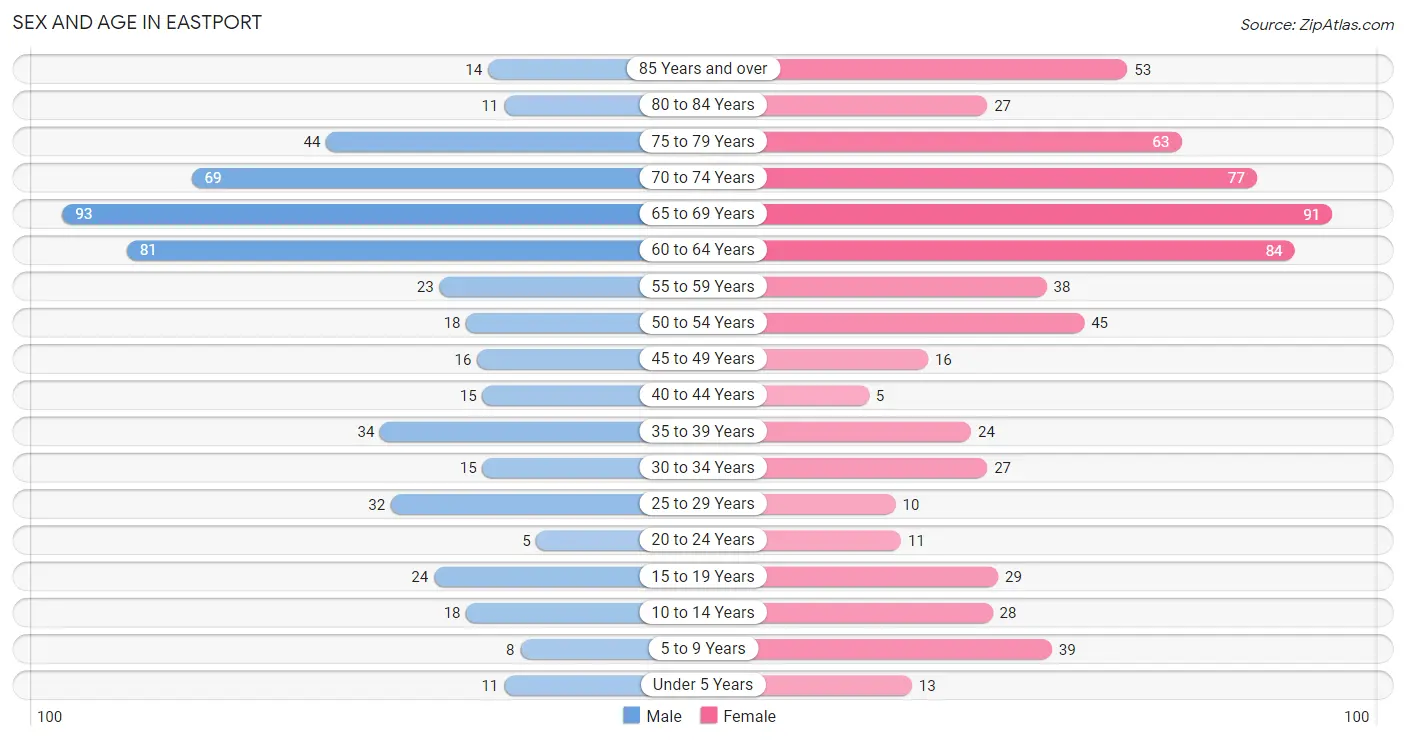
| Age Bracket | Male | Female |
| Under 5 Years | 11 (2.1%) | 13 (1.9%) |
| 5 to 9 Years | 8 (1.5%) | 39 (5.7%) |
| 10 to 14 Years | 18 (3.4%) | 28 (4.1%) |
| 15 to 19 Years | 24 (4.5%) | 29 (4.3%) |
| 20 to 24 Years | 5 (0.9%) | 11 (1.6%) |
| 25 to 29 Years | 32 (6.0%) | 10 (1.5%) |
| 30 to 34 Years | 15 (2.8%) | 27 (4.0%) |
| 35 to 39 Years | 34 (6.4%) | 24 (3.5%) |
| 40 to 44 Years | 15 (2.8%) | 5 (0.7%) |
| 45 to 49 Years | 16 (3.0%) | 16 (2.4%) |
| 50 to 54 Years | 18 (3.4%) | 45 (6.6%) |
| 55 to 59 Years | 23 (4.3%) | 38 (5.6%) |
| 60 to 64 Years | 81 (15.2%) | 84 (12.3%) |
| 65 to 69 Years | 93 (17.5%) | 91 (13.4%) |
| 70 to 74 Years | 69 (13.0%) | 77 (11.3%) |
| 75 to 79 Years | 44 (8.3%) | 63 (9.3%) |
| 80 to 84 Years | 11 (2.1%) | 27 (4.0%) |
| 85 Years and over | 14 (2.6%) | 53 (7.8%) |
| Total | 531 (100.0%) | 680 (100.0%) |
Families and Households in Eastport
Median Family Size in Eastport
The median family size in Eastport is 2.48 persons per family, with single female/mother families (25 | 7.2%) accounting for the largest median family size of 2.96 persons per family. On the other hand, single male/father families (25 | 7.2%) represent the smallest median family size with 1.92 persons per family.
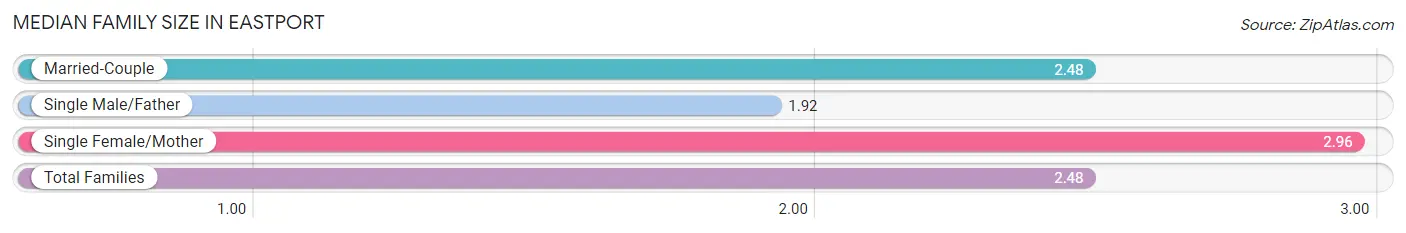
| Family Type | # Families | Family Size |
| Married-Couple | 296 (85.6%) | 2.48 |
| Single Male/Father | 25 (7.2%) | 1.92 |
| Single Female/Mother | 25 (7.2%) | 2.96 |
| Total Families | 346 (100.0%) | 2.48 |
Median Household Size in Eastport
The median household size in Eastport is 1.90 persons per household, with single female/mother households (25 | 4.1%) accounting for the largest median household size of 2.96 persons per household. non-family households (266 | 43.5%) represent the smallest median household size with 1.07 persons per household.
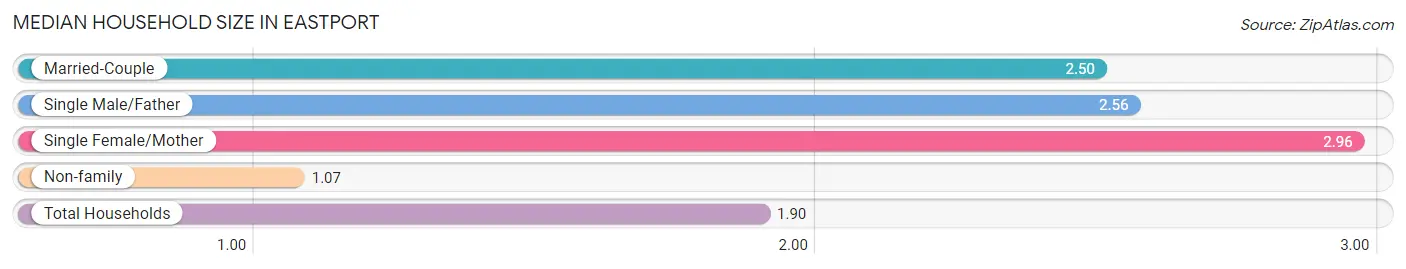
| Household Type | # Households | Household Size |
| Married-Couple | 296 (48.4%) | 2.50 |
| Single Male/Father | 25 (4.1%) | 2.56 |
| Single Female/Mother | 25 (4.1%) | 2.96 |
| Non-family | 266 (43.5%) | 1.07 |
| Total Households | 612 (100.0%) | 1.90 |
Household Size by Marriage Status in Eastport
Out of a total of 612 households in Eastport, 346 (56.5%) are family households, while 266 (43.5%) are nonfamily households. The most numerous type of family households are 2-person households, comprising 259, and the most common type of nonfamily households are 1-person households, comprising 247.
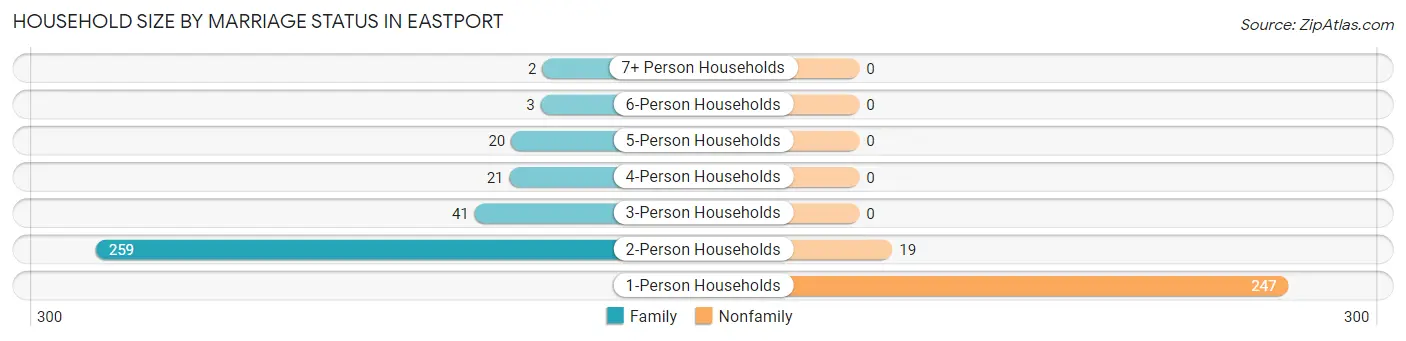
| Household Size | Family Households | Nonfamily Households |
| 1-Person Households | - | 247 (40.4%) |
| 2-Person Households | 259 (42.3%) | 19 (3.1%) |
| 3-Person Households | 41 (6.7%) | 0 (0.0%) |
| 4-Person Households | 21 (3.4%) | 0 (0.0%) |
| 5-Person Households | 20 (3.3%) | 0 (0.0%) |
| 6-Person Households | 3 (0.5%) | 0 (0.0%) |
| 7+ Person Households | 2 (0.3%) | 0 (0.0%) |
| Total | 346 (56.5%) | 266 (43.5%) |
Female Fertility in Eastport
Fertility by Age in Eastport
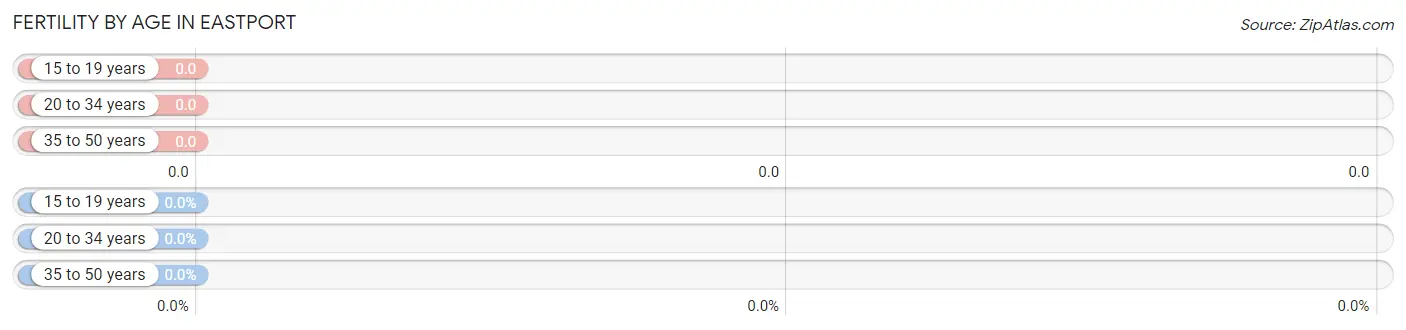
| Age Bracket | Women with Births | Births / 1,000 Women |
| 15 to 19 years | 0 (0.0%) | 0.0 |
| 20 to 34 years | 0 (0.0%) | 0.0 |
| 35 to 50 years | 0 (0.0%) | 0.0 |
| Total | 0 (0.0%) | 0.0 |
Fertility by Age by Marriage Status in Eastport
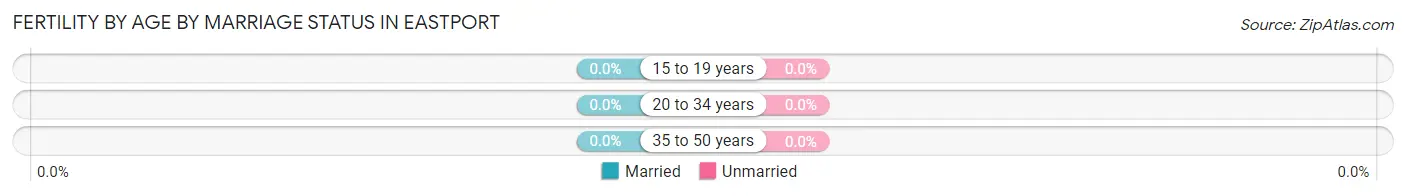
| Age Bracket | Married | Unmarried |
| 15 to 19 years | 0 (0.0%) | 0 (0.0%) |
| 20 to 34 years | 0 (0.0%) | 0 (0.0%) |
| 35 to 50 years | 0 (0.0%) | 0 (0.0%) |
| Total | 0 (0.0%) | 0 (0.0%) |
Fertility by Education in Eastport
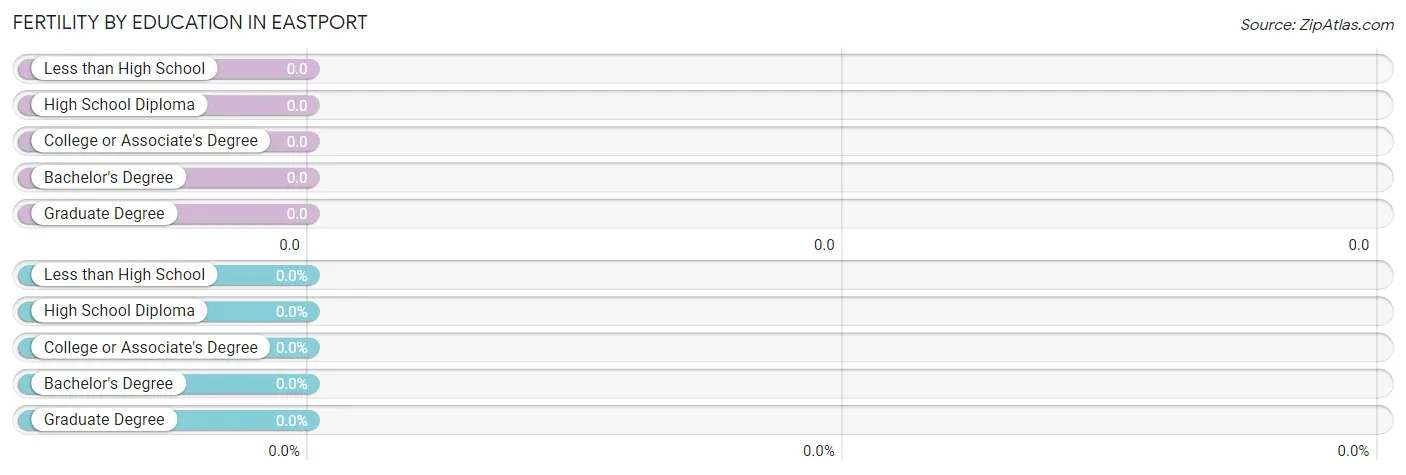
| Educational Attainment | Women with Births | Births / 1,000 Women |
| Less than High School | 0 (0.0%) | 0.0 |
| High School Diploma | 0 (0.0%) | 0.0 |
| College or Associate's Degree | 0 (0.0%) | 0.0 |
| Bachelor's Degree | 0 (0.0%) | 0.0 |
| Graduate Degree | 0 (0.0%) | 0.0 |
| Total | 0 (0.0%) | 0.0 |
Fertility by Education by Marriage Status in Eastport
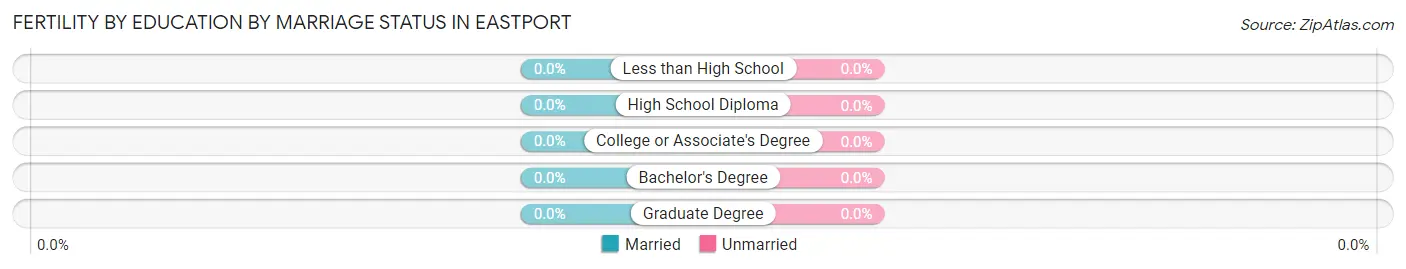
| Educational Attainment | Married | Unmarried |
| Less than High School | 0 (0.0%) | 0 (0.0%) |
| High School Diploma | 0 (0.0%) | 0 (0.0%) |
| College or Associate's Degree | 0 (0.0%) | 0 (0.0%) |
| Bachelor's Degree | 0 (0.0%) | 0 (0.0%) |
| Graduate Degree | 0 (0.0%) | 0 (0.0%) |
| Total | 0 (0.0%) | 0 (0.0%) |
Income in Eastport
Income Overview in Eastport
Per Capita Income in Eastport is $34,609, while median incomes of families and households are $83,289 and $44,919 respectively.
| Characteristic | Number | Measure |
| Per Capita Income | 1,211 | $34,609 |
| Median Family Income | 346 | $83,289 |
| Mean Family Income | 346 | $94,800 |
| Median Household Income | 612 | $44,919 |
| Mean Household Income | 612 | $67,188 |
| Income Deficit | 346 | $0 |
| Wage / Income Gap (%) | 1,211 | 18.71% |
| Wage / Income Gap ($) | 1,211 | 81.29¢ per $1 |
| Gini / Inequality Index | 1,211 | 0.46 |
Earnings by Sex in Eastport
Average Earnings in Eastport are $29,450, $31,522 for men and $25,625 for women, a difference of 18.7%.
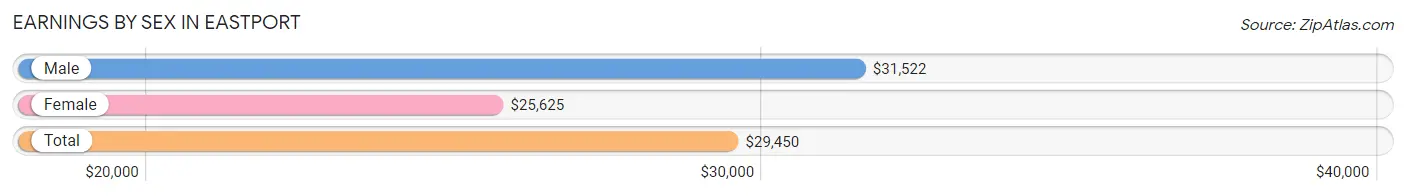
| Sex | Number | Average Earnings |
| Male | 300 (53.3%) | $31,522 |
| Female | 263 (46.7%) | $25,625 |
| Total | 563 (100.0%) | $29,450 |
Earnings by Sex by Income Bracket in Eastport
The most common earnings brackets in Eastport are $2,499 or less for men (54 | 18.0%) and $12,500 to $14,999 for women (35 | 13.3%).
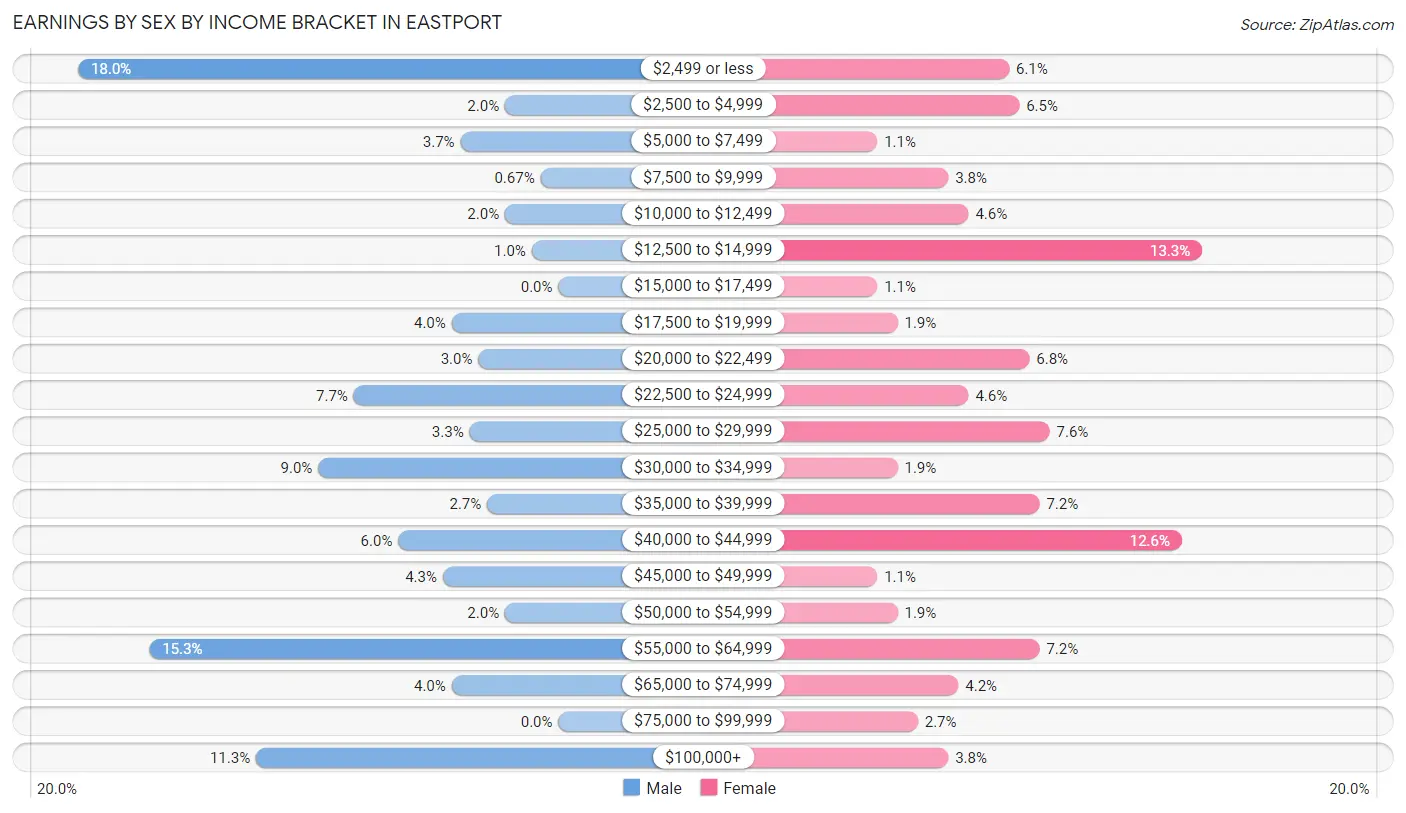
| Income | Male | Female |
| $2,499 or less | 54 (18.0%) | 16 (6.1%) |
| $2,500 to $4,999 | 6 (2.0%) | 17 (6.5%) |
| $5,000 to $7,499 | 11 (3.7%) | 3 (1.1%) |
| $7,500 to $9,999 | 2 (0.7%) | 10 (3.8%) |
| $10,000 to $12,499 | 6 (2.0%) | 12 (4.6%) |
| $12,500 to $14,999 | 3 (1.0%) | 35 (13.3%) |
| $15,000 to $17,499 | 0 (0.0%) | 3 (1.1%) |
| $17,500 to $19,999 | 12 (4.0%) | 5 (1.9%) |
| $20,000 to $22,499 | 9 (3.0%) | 18 (6.8%) |
| $22,500 to $24,999 | 23 (7.7%) | 12 (4.6%) |
| $25,000 to $29,999 | 10 (3.3%) | 20 (7.6%) |
| $30,000 to $34,999 | 27 (9.0%) | 5 (1.9%) |
| $35,000 to $39,999 | 8 (2.7%) | 19 (7.2%) |
| $40,000 to $44,999 | 18 (6.0%) | 33 (12.6%) |
| $45,000 to $49,999 | 13 (4.3%) | 3 (1.1%) |
| $50,000 to $54,999 | 6 (2.0%) | 5 (1.9%) |
| $55,000 to $64,999 | 46 (15.3%) | 19 (7.2%) |
| $65,000 to $74,999 | 12 (4.0%) | 11 (4.2%) |
| $75,000 to $99,999 | 0 (0.0%) | 7 (2.7%) |
| $100,000+ | 34 (11.3%) | 10 (3.8%) |
| Total | 300 (100.0%) | 263 (100.0%) |
Earnings by Sex by Educational Attainment in Eastport
Average earnings in Eastport are $34,375 for men and $29,097 for women, a difference of 15.3%. Men with an educational attainment of graduate degree enjoy the highest average annual earnings of $61,250, while those with college or associate's degree education earn the least with $19,063. Women with an educational attainment of graduate degree earn the most with the average annual earnings of $58,750, while those with college or associate's degree education have the smallest earnings of $27,500.
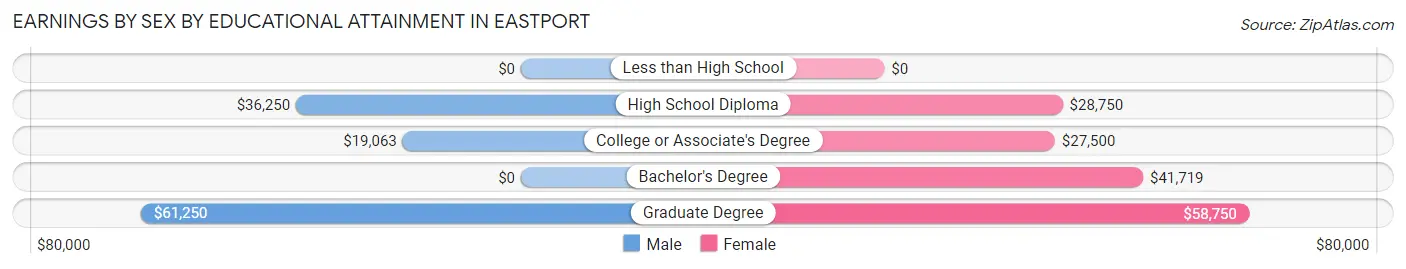
| Educational Attainment | Male Income | Female Income |
| Less than High School | - | - |
| High School Diploma | $36,250 | $28,750 |
| College or Associate's Degree | $19,063 | $27,500 |
| Bachelor's Degree | - | - |
| Graduate Degree | $61,250 | $58,750 |
| Total | $34,375 | $29,097 |
Family Income in Eastport
Family Income Brackets in Eastport
According to the Eastport family income data, there are 79 families falling into the $100,000 to $149,999 income range, which is the most common income bracket and makes up 22.8% of all families. Conversely, the less than $10,000 income bracket is the least frequent group with only 7 families (2.0%) belonging to this category.
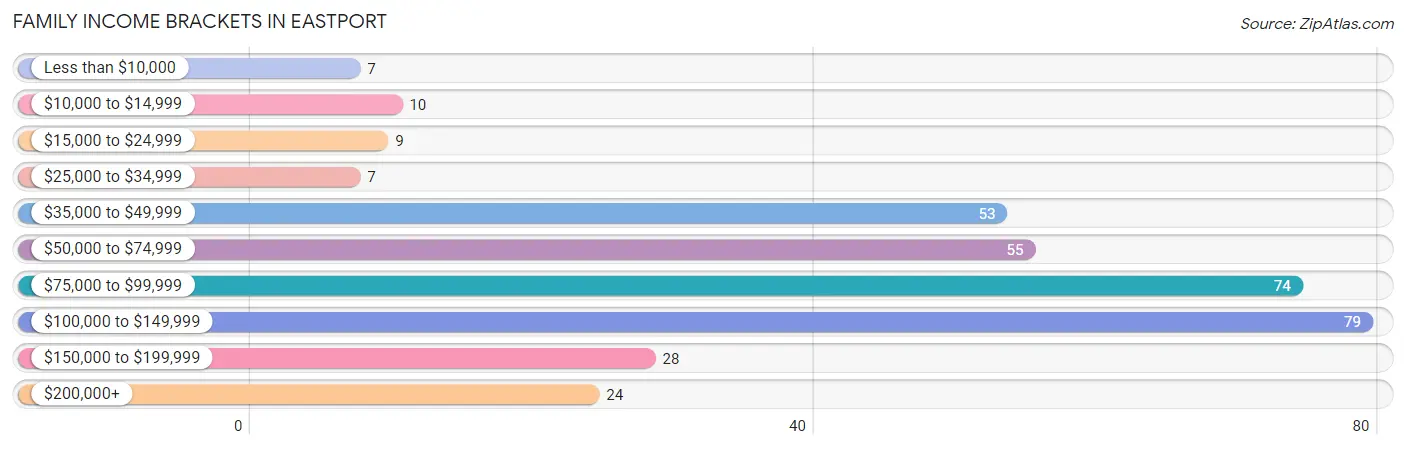
| Income Bracket | # Families | % Families |
| Less than $10,000 | 7 | 2.0% |
| $10,000 to $14,999 | 10 | 2.9% |
| $15,000 to $24,999 | 9 | 2.6% |
| $25,000 to $34,999 | 7 | 2.0% |
| $35,000 to $49,999 | 53 | 15.3% |
| $50,000 to $74,999 | 55 | 15.9% |
| $75,000 to $99,999 | 74 | 21.4% |
| $100,000 to $149,999 | 79 | 22.8% |
| $150,000 to $199,999 | 28 | 8.1% |
| $200,000+ | 24 | 6.9% |
Family Income by Famaliy Size in Eastport
2-person families (270 | 78.0%) account for the highest median family income in Eastport with $84,474 per family, while 2-person families (270 | 78.0%) have the highest median income of $42,237 per family member.
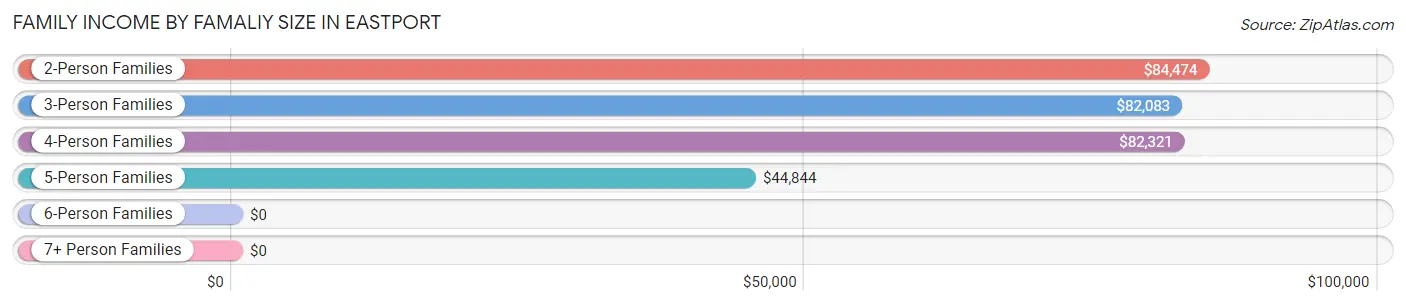
| Income Bracket | # Families | Median Income |
| 2-Person Families | 270 (78.0%) | $84,474 |
| 3-Person Families | 33 (9.5%) | $82,083 |
| 4-Person Families | 21 (6.1%) | $82,321 |
| 5-Person Families | 17 (4.9%) | $44,844 |
| 6-Person Families | 5 (1.5%) | $0 |
| 7+ Person Families | 0 (0.0%) | $0 |
| Total | 346 (100.0%) | $83,289 |
Family Income by Number of Earners in Eastport
The median family income in Eastport is $83,289, with families comprising 3+ earners (23) having the highest median family income of $92,813, while families with no earners (97) have the lowest median family income of $71,458, accounting for 6.7% and 28.0% of families, respectively.
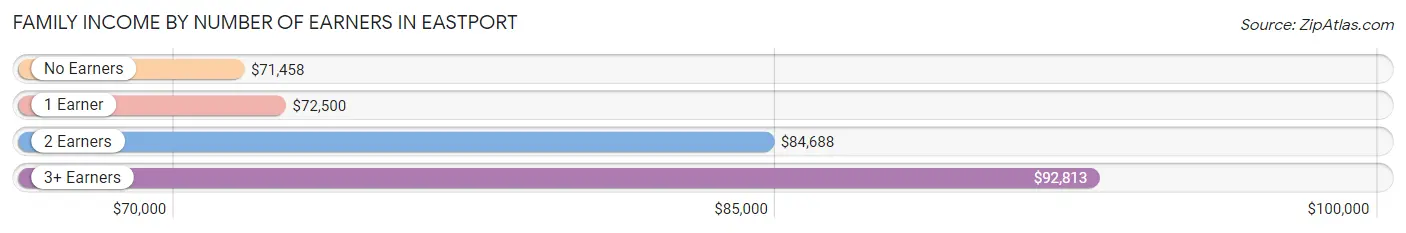
| Number of Earners | # Families | Median Income |
| No Earners | 97 (28.0%) | $71,458 |
| 1 Earner | 106 (30.6%) | $72,500 |
| 2 Earners | 120 (34.7%) | $84,688 |
| 3+ Earners | 23 (6.7%) | $92,813 |
| Total | 346 (100.0%) | $83,289 |
Household Income in Eastport
Household Income Brackets in Eastport
With 92 households falling in the category, the $35,000 to $49,999 income range is the most frequent in Eastport, accounting for 15.0% of all households. In contrast, only 24 households (3.9%) fall into the $200,000+ income bracket, making it the least populous group.
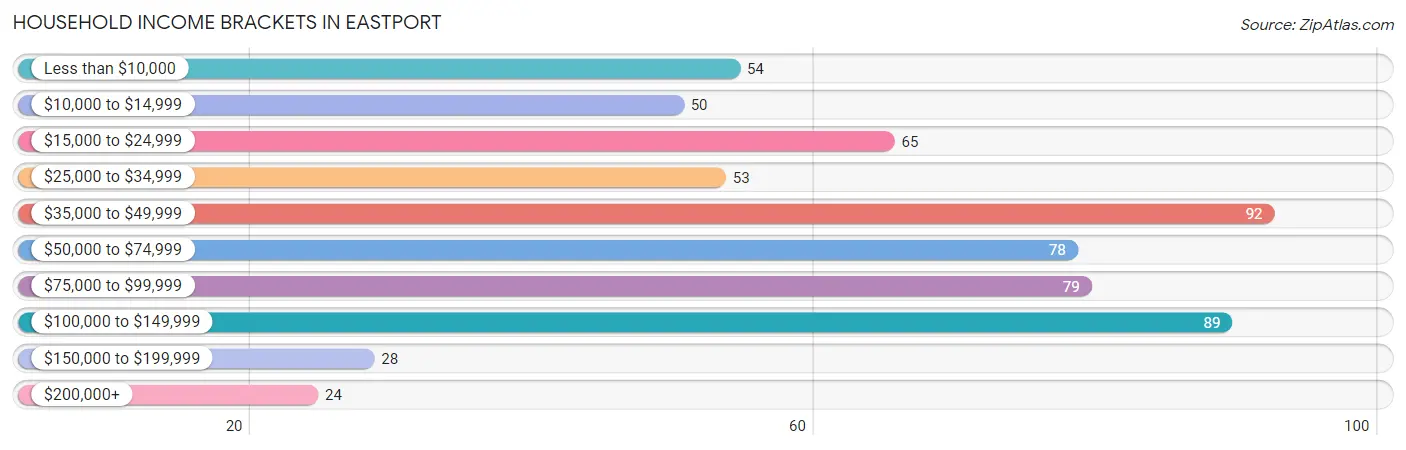
| Income Bracket | # Households | % Households |
| Less than $10,000 | 54 | 8.8% |
| $10,000 to $14,999 | 50 | 8.2% |
| $15,000 to $24,999 | 65 | 10.6% |
| $25,000 to $34,999 | 53 | 8.7% |
| $35,000 to $49,999 | 92 | 15.0% |
| $50,000 to $74,999 | 78 | 12.7% |
| $75,000 to $99,999 | 79 | 12.9% |
| $100,000 to $149,999 | 89 | 14.5% |
| $150,000 to $199,999 | 28 | 4.6% |
| $200,000+ | 24 | 3.9% |
Household Income by Householder Age in Eastport
The median household income in Eastport is $44,919, with the highest median household income of $62,000 found in the 45 to 64 years age bracket for the primary householder. A total of 200 households (32.7%) fall into this category. Meanwhile, the 25 to 44 years age bracket for the primary householder has the lowest median household income of $0, with 81 households (13.2%) in this group.
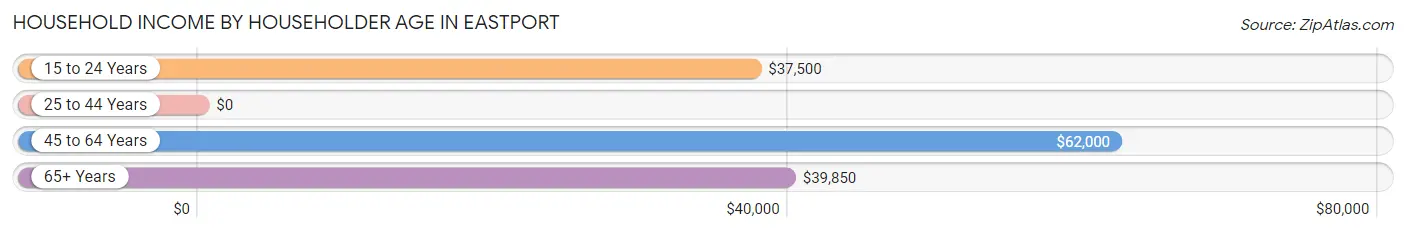
| Income Bracket | # Households | Median Income |
| 15 to 24 Years | 16 (2.6%) | $37,500 |
| 25 to 44 Years | 81 (13.2%) | $0 |
| 45 to 64 Years | 200 (32.7%) | $62,000 |
| 65+ Years | 315 (51.5%) | $39,850 |
| Total | 612 (100.0%) | $44,919 |
Poverty in Eastport
Income Below Poverty by Sex and Age in Eastport
With 13.4% poverty level for males and 10.9% for females among the residents of Eastport, 25 to 34 year old males and 75 year old and over females are the most vulnerable to poverty, with 12 males (25.5%) and 21 females (19.1%) in their respective age groups living below the poverty level.
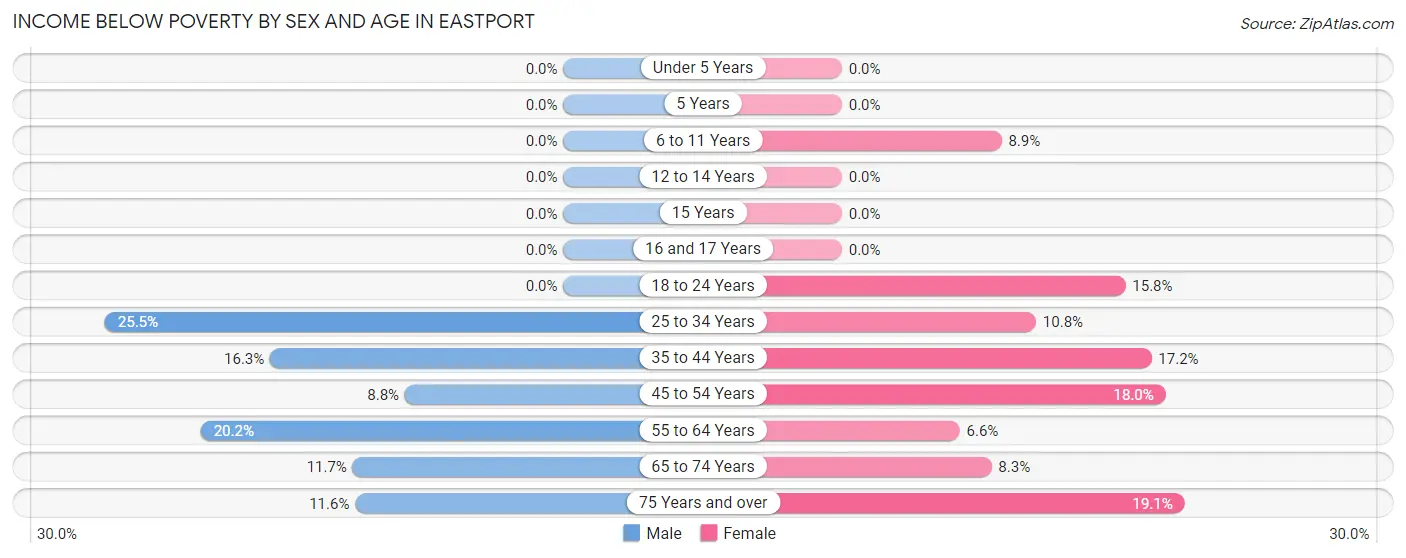
| Age Bracket | Male | Female |
| Under 5 Years | 0 (0.0%) | 0 (0.0%) |
| 5 Years | 0 (0.0%) | 0 (0.0%) |
| 6 to 11 Years | 0 (0.0%) | 4 (8.9%) |
| 12 to 14 Years | 0 (0.0%) | 0 (0.0%) |
| 15 Years | 0 (0.0%) | 0 (0.0%) |
| 16 and 17 Years | 0 (0.0%) | 0 (0.0%) |
| 18 to 24 Years | 0 (0.0%) | 3 (15.8%) |
| 25 to 34 Years | 12 (25.5%) | 4 (10.8%) |
| 35 to 44 Years | 8 (16.3%) | 5 (17.2%) |
| 45 to 54 Years | 3 (8.8%) | 11 (18.0%) |
| 55 to 64 Years | 21 (20.2%) | 8 (6.6%) |
| 65 to 74 Years | 19 (11.7%) | 14 (8.3%) |
| 75 Years and over | 8 (11.6%) | 21 (19.1%) |
| Total | 71 (13.4%) | 70 (10.9%) |
Income Above Poverty by Sex and Age in Eastport
According to the poverty statistics in Eastport, males aged under 5 years and females aged under 5 years are the age groups that are most secure financially, with 100.0% of males and 100.0% of females in these age groups living above the poverty line.
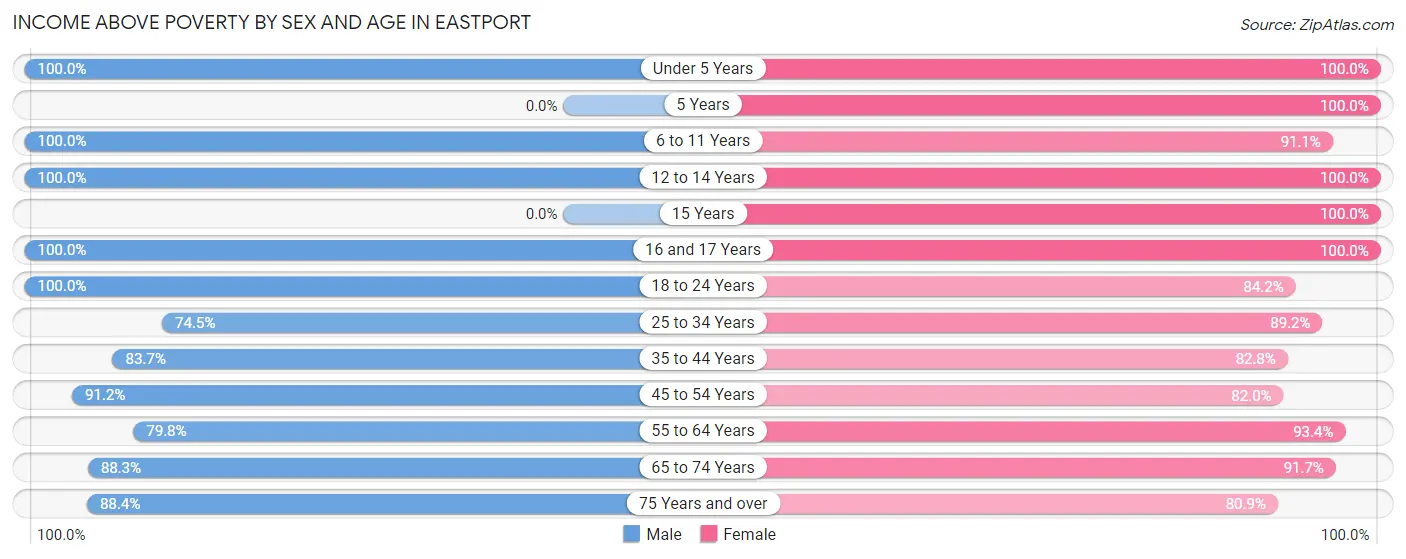
| Age Bracket | Male | Female |
| Under 5 Years | 11 (100.0%) | 13 (100.0%) |
| 5 Years | 0 (0.0%) | 7 (100.0%) |
| 6 to 11 Years | 23 (100.0%) | 41 (91.1%) |
| 12 to 14 Years | 3 (100.0%) | 12 (100.0%) |
| 15 Years | 0 (0.0%) | 10 (100.0%) |
| 16 and 17 Years | 14 (100.0%) | 11 (100.0%) |
| 18 to 24 Years | 15 (100.0%) | 16 (84.2%) |
| 25 to 34 Years | 35 (74.5%) | 33 (89.2%) |
| 35 to 44 Years | 41 (83.7%) | 24 (82.8%) |
| 45 to 54 Years | 31 (91.2%) | 50 (82.0%) |
| 55 to 64 Years | 83 (79.8%) | 114 (93.4%) |
| 65 to 74 Years | 143 (88.3%) | 154 (91.7%) |
| 75 Years and over | 61 (88.4%) | 89 (80.9%) |
| Total | 460 (86.6%) | 574 (89.1%) |
Income Below Poverty Among Married-Couple Families in Eastport
The poverty statistics for married-couple families in Eastport show that 3.0% or 9 of the total 296 families live below the poverty line. Families with no children have the highest poverty rate of 3.6%, comprising of 9 families. On the other hand, families with 1 or 2 children have the lowest poverty rate of 0.0%, which includes 0 families.
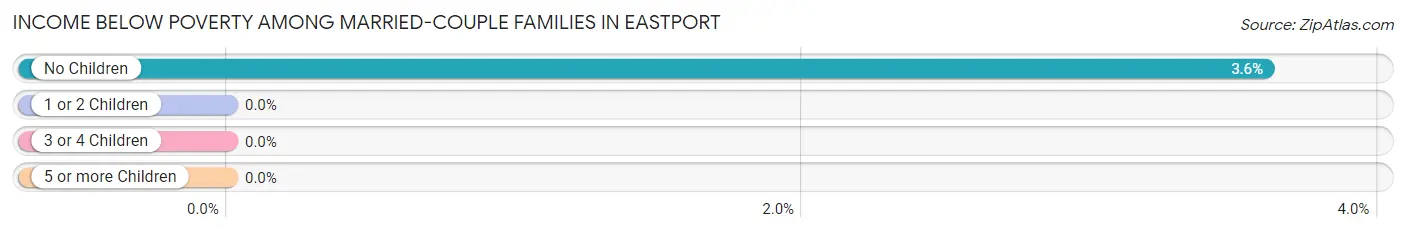
| Children | Above Poverty | Below Poverty |
| No Children | 240 (96.4%) | 9 (3.6%) |
| 1 or 2 Children | 31 (100.0%) | 0 (0.0%) |
| 3 or 4 Children | 16 (100.0%) | 0 (0.0%) |
| 5 or more Children | 0 (0.0%) | 0 (0.0%) |
| Total | 287 (97.0%) | 9 (3.0%) |
Income Below Poverty Among Single-Parent Households in Eastport
According to the poverty data in Eastport, 32.0% or 8 single-father households and 16.0% or 4 single-mother households are living below the poverty line. Among single-father households, those with no children have the highest poverty rate, with 8 households (72.7%) experiencing poverty. Likewise, among single-mother households, those with 1 or 2 children have the highest poverty rate, with 4 households (22.2%) falling below the poverty line.
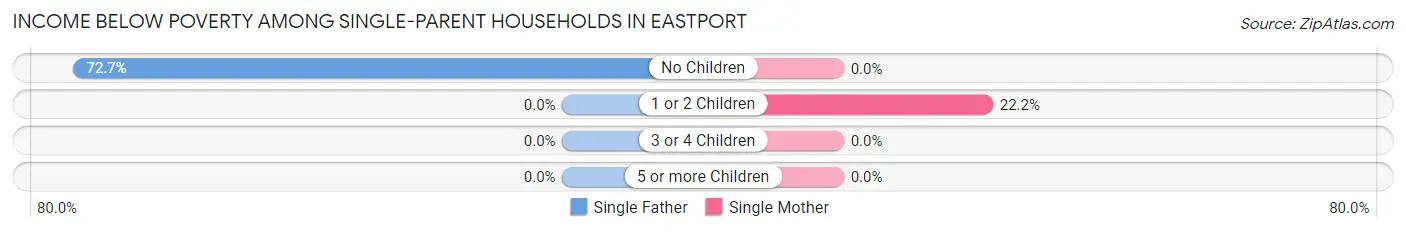
| Children | Single Father | Single Mother |
| No Children | 8 (72.7%) | 0 (0.0%) |
| 1 or 2 Children | 0 (0.0%) | 4 (22.2%) |
| 3 or 4 Children | 0 (0.0%) | 0 (0.0%) |
| 5 or more Children | 0 (0.0%) | 0 (0.0%) |
| Total | 8 (32.0%) | 4 (16.0%) |
Income Below Poverty Among Married-Couple vs Single-Parent Households in Eastport
The poverty data for Eastport shows that 9 of the married-couple family households (3.0%) and 12 of the single-parent households (24.0%) are living below the poverty level. Within the married-couple family households, those with no children have the highest poverty rate, with 9 households (3.6%) falling below the poverty line. Among the single-parent households, those with no children have the highest poverty rate, with 8 household (44.4%) living below poverty.
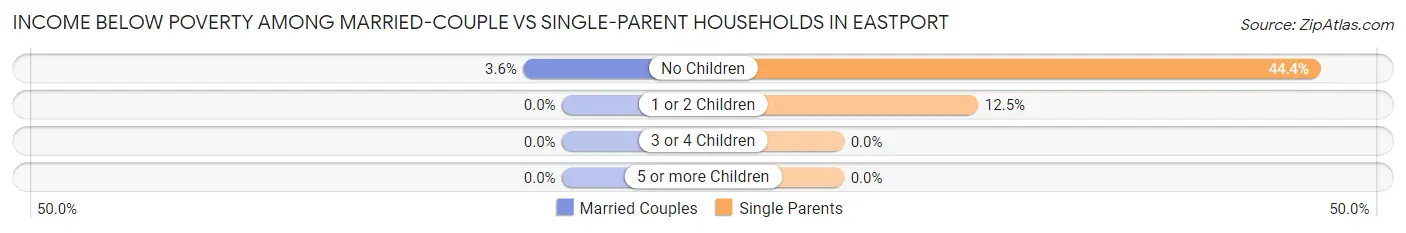
| Children | Married-Couple Families | Single-Parent Households |
| No Children | 9 (3.6%) | 8 (44.4%) |
| 1 or 2 Children | 0 (0.0%) | 4 (12.5%) |
| 3 or 4 Children | 0 (0.0%) | 0 (0.0%) |
| 5 or more Children | 0 (0.0%) | 0 (0.0%) |
| Total | 9 (3.0%) | 12 (24.0%) |
Employment Characteristics in Eastport
Employment by Class of Employer in Eastport
Among the 458 employed individuals in Eastport, private company employees (217 | 47.4%), not-for-profit organizations (82 | 17.9%), and self-employed (not incorporated) (70 | 15.3%) make up the most common classes of employment.
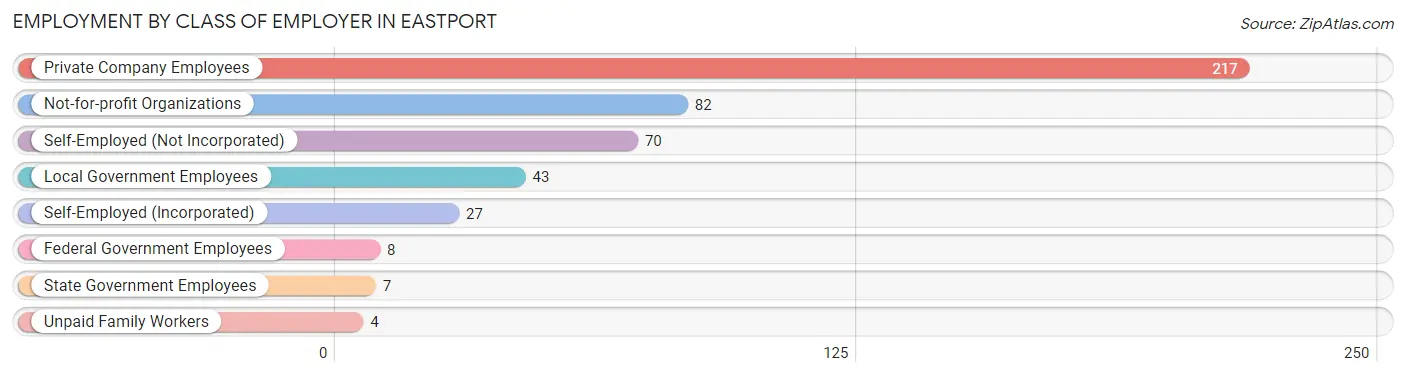
| Employer Class | # Employees | % Employees |
| Private Company Employees | 217 | 47.4% |
| Self-Employed (Incorporated) | 27 | 5.9% |
| Self-Employed (Not Incorporated) | 70 | 15.3% |
| Not-for-profit Organizations | 82 | 17.9% |
| Local Government Employees | 43 | 9.4% |
| State Government Employees | 7 | 1.5% |
| Federal Government Employees | 8 | 1.8% |
| Unpaid Family Workers | 4 | 0.9% |
| Total | 458 | 100.0% |
Employment Status by Age in Eastport
According to the labor force statistics for Eastport, out of the total population over 16 years of age (1,084), 43.8% or 475 individuals are in the labor force, with 2.8% or 13 of them unemployed. The age group with the highest labor force participation rate is 20 to 24 years, with 100.0% or 16 individuals in the labor force. Within the labor force, the 25 to 29 years age range has the highest percentage of unemployed individuals, with 13.3% or 4 of them being unemployed.
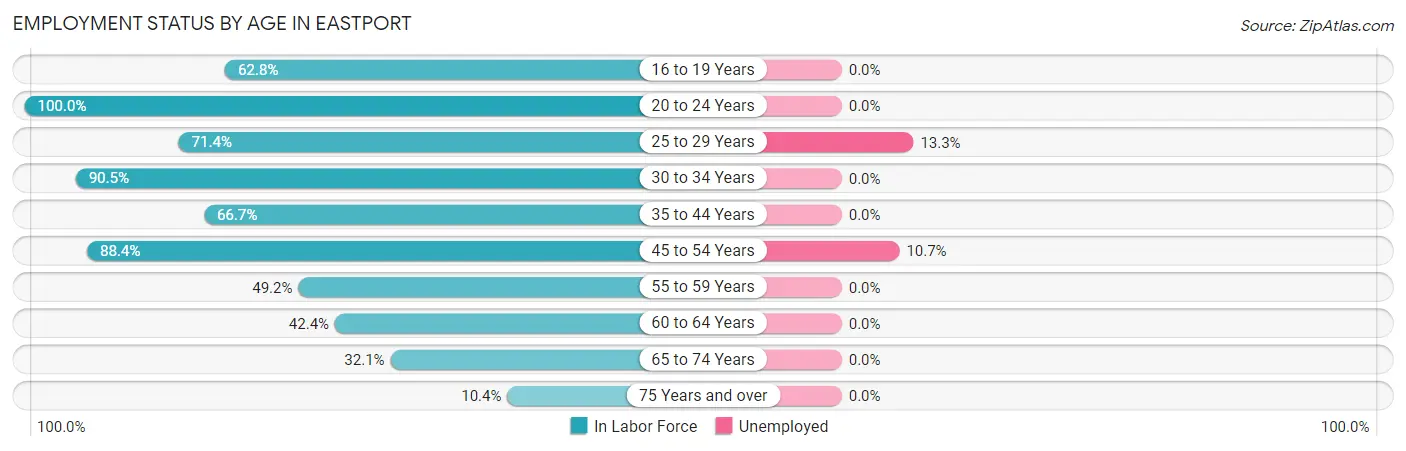
| Age Bracket | In Labor Force | Unemployed |
| 16 to 19 Years | 27 (62.8%) | 0 (0.0%) |
| 20 to 24 Years | 16 (100.0%) | 0 (0.0%) |
| 25 to 29 Years | 30 (71.4%) | 4 (13.3%) |
| 30 to 34 Years | 38 (90.5%) | 0 (0.0%) |
| 35 to 44 Years | 52 (66.7%) | 0 (0.0%) |
| 45 to 54 Years | 84 (88.4%) | 9 (10.7%) |
| 55 to 59 Years | 30 (49.2%) | 0 (0.0%) |
| 60 to 64 Years | 70 (42.4%) | 0 (0.0%) |
| 65 to 74 Years | 106 (32.1%) | 0 (0.0%) |
| 75 Years and over | 22 (10.4%) | 0 (0.0%) |
| Total | 475 (43.8%) | 13 (2.8%) |
Employment Status by Educational Attainment in Eastport
According to labor force statistics for Eastport, 62.9% of individuals (304) out of the total population between 25 and 64 years of age (483) are in the labor force, with 4.3% or 13 of them being unemployed. The group with the highest labor force participation rate are those with the educational attainment of high school diploma, with 70.3% or 102 individuals in the labor force. Within the labor force, individuals with less than high school education have the highest percentage of unemployment, with 85.7% or 6 of them being unemployed.
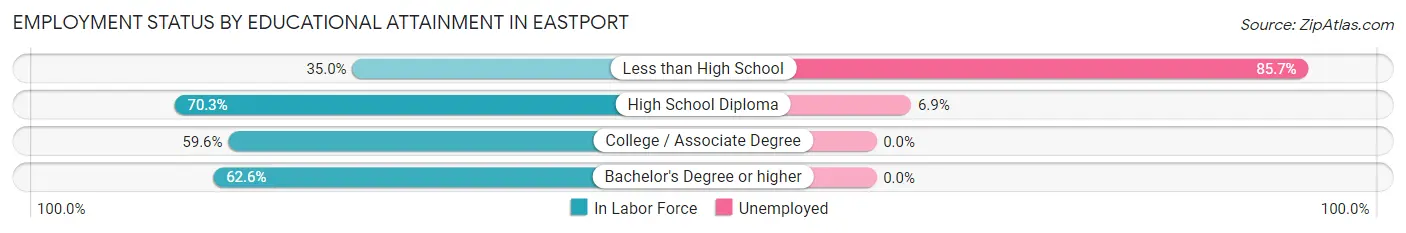
| Educational Attainment | In Labor Force | Unemployed |
| Less than High School | 7 (35.0%) | 17 (85.7%) |
| High School Diploma | 102 (70.3%) | 10 (6.9%) |
| College / Associate Degree | 81 (59.6%) | 0 (0.0%) |
| Bachelor's Degree or higher | 114 (62.6%) | 0 (0.0%) |
| Total | 304 (62.9%) | 21 (4.3%) |
Employment Occupations by Sex in Eastport
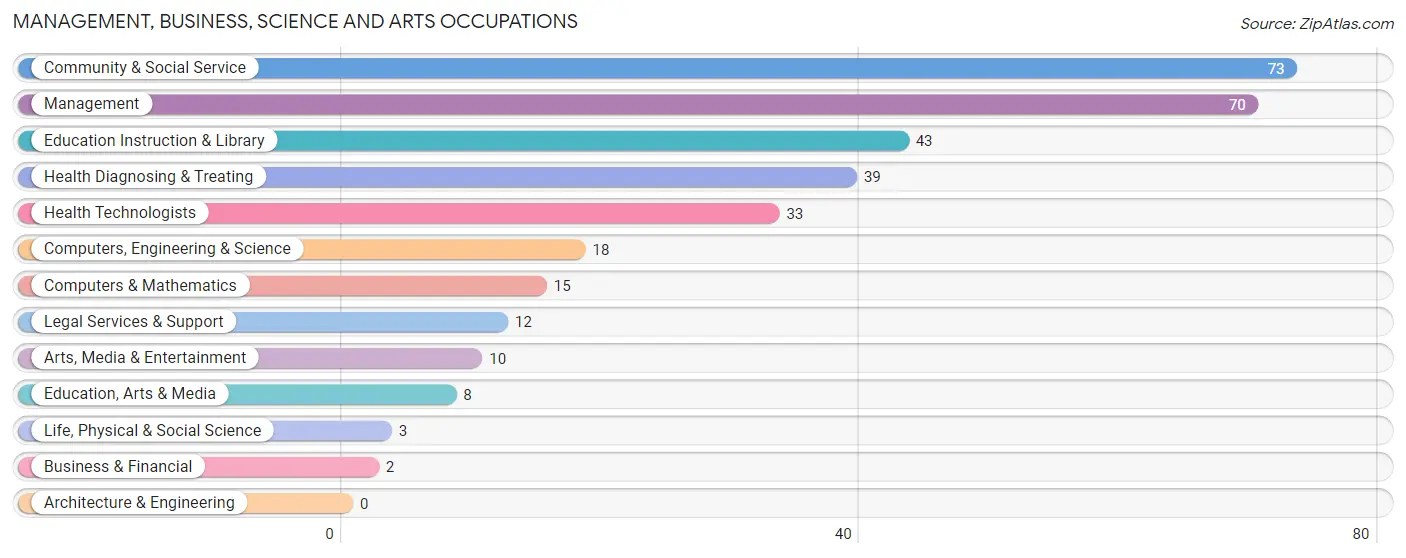
Management, Business, Science and Arts Occupations
The most common Management, Business, Science and Arts occupations in Eastport are Community & Social Service (73 | 16.0%), Management (70 | 15.3%), Education Instruction & Library (43 | 9.4%), Health Diagnosing & Treating (39 | 8.5%), and Health Technologists (33 | 7.2%).
Management, Business, Science and Arts Occupations by Sex
Within the Management, Business, Science and Arts occupations in Eastport, the most male-oriented occupations are Life, Physical & Social Science (100.0%), Legal Services & Support (100.0%), and Computers, Engineering & Science (66.7%), while the most female-oriented occupations are Business & Financial (100.0%), Education, Arts & Media (100.0%), and Health Diagnosing & Treating (76.9%).
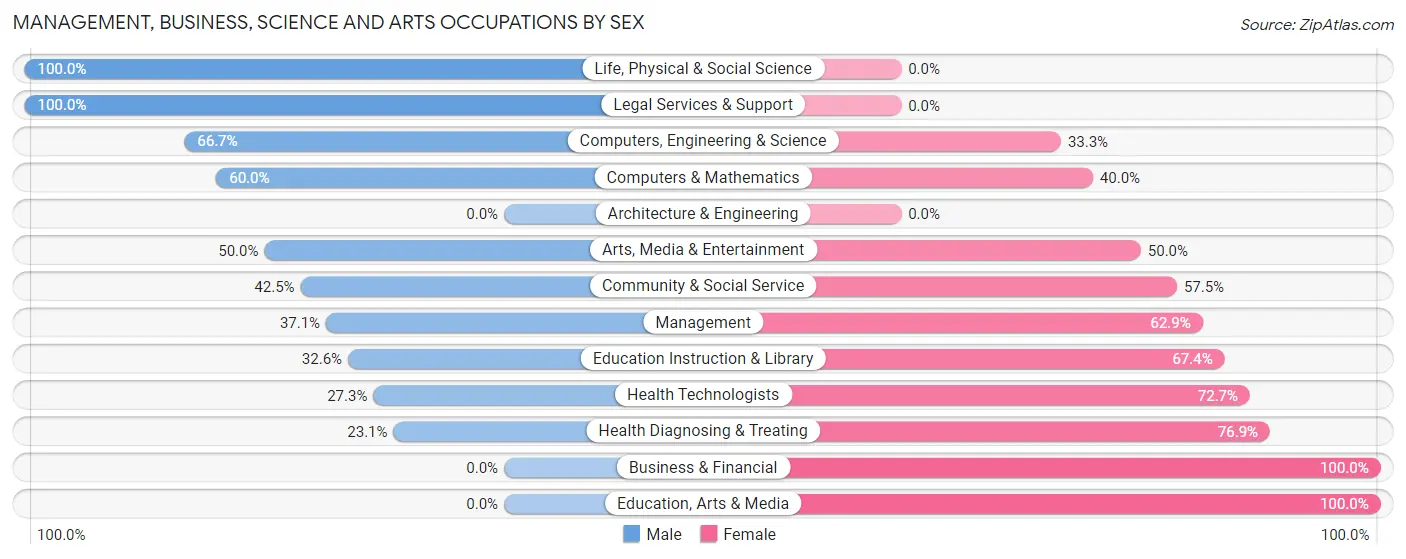
| Occupation | Male | Female |
| Management | 26 (37.1%) | 44 (62.9%) |
| Business & Financial | 0 (0.0%) | 2 (100.0%) |
| Computers, Engineering & Science | 12 (66.7%) | 6 (33.3%) |
| Computers & Mathematics | 9 (60.0%) | 6 (40.0%) |
| Architecture & Engineering | 0 (0.0%) | 0 (0.0%) |
| Life, Physical & Social Science | 3 (100.0%) | 0 (0.0%) |
| Community & Social Service | 31 (42.5%) | 42 (57.5%) |
| Education, Arts & Media | 0 (0.0%) | 8 (100.0%) |
| Legal Services & Support | 12 (100.0%) | 0 (0.0%) |
| Education Instruction & Library | 14 (32.6%) | 29 (67.4%) |
| Arts, Media & Entertainment | 5 (50.0%) | 5 (50.0%) |
| Health Diagnosing & Treating | 9 (23.1%) | 30 (76.9%) |
| Health Technologists | 9 (27.3%) | 24 (72.7%) |
| Total (Category) | 78 (38.6%) | 124 (61.4%) |
| Total (Overall) | 245 (53.6%) | 212 (46.4%) |
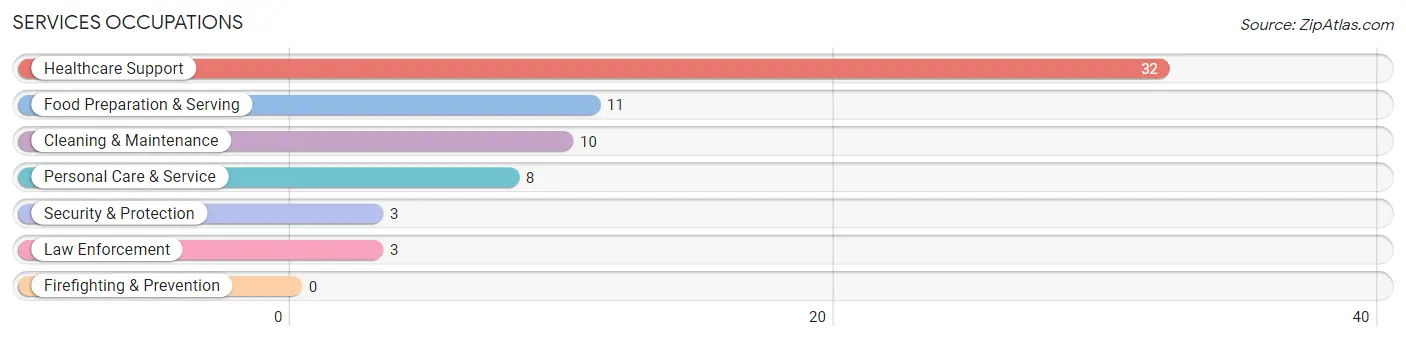
Services Occupations
The most common Services occupations in Eastport are Healthcare Support (32 | 7.0%), Food Preparation & Serving (11 | 2.4%), Cleaning & Maintenance (10 | 2.2%), Personal Care & Service (8 | 1.8%), and Security & Protection (3 | 0.7%).
Services Occupations by Sex
Within the Services occupations in Eastport, the most male-oriented occupations are Security & Protection (100.0%), Law Enforcement (100.0%), and Cleaning & Maintenance (100.0%), while the most female-oriented occupations are Personal Care & Service (100.0%), Food Preparation & Serving (81.8%), and Healthcare Support (68.8%).
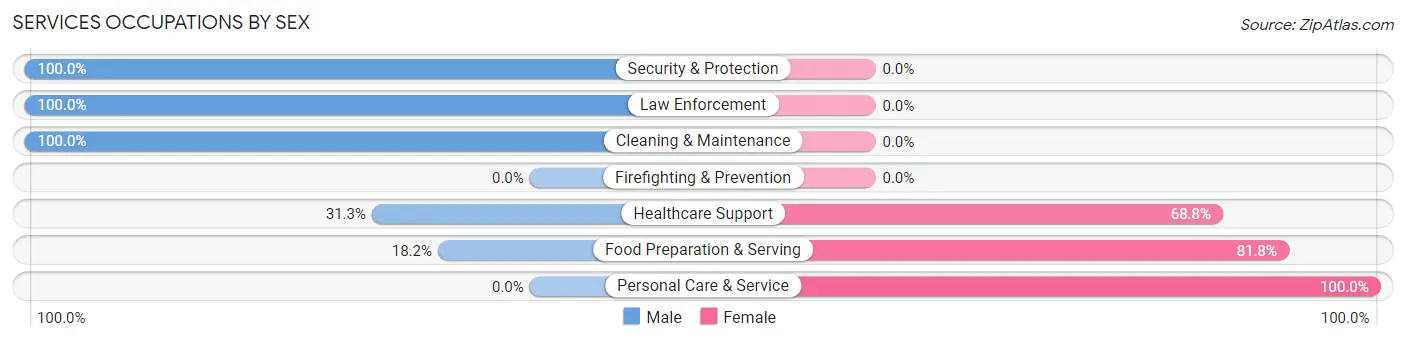
| Occupation | Male | Female |
| Healthcare Support | 10 (31.2%) | 22 (68.8%) |
| Security & Protection | 3 (100.0%) | 0 (0.0%) |
| Firefighting & Prevention | 0 (0.0%) | 0 (0.0%) |
| Law Enforcement | 3 (100.0%) | 0 (0.0%) |
| Food Preparation & Serving | 2 (18.2%) | 9 (81.8%) |
| Cleaning & Maintenance | 10 (100.0%) | 0 (0.0%) |
| Personal Care & Service | 0 (0.0%) | 8 (100.0%) |
| Total (Category) | 25 (39.1%) | 39 (60.9%) |
| Total (Overall) | 245 (53.6%) | 212 (46.4%) |
Sales and Office Occupations
The most common Sales and Office occupations in Eastport are Office & Administration (42 | 9.2%), and Sales & Related (28 | 6.1%).
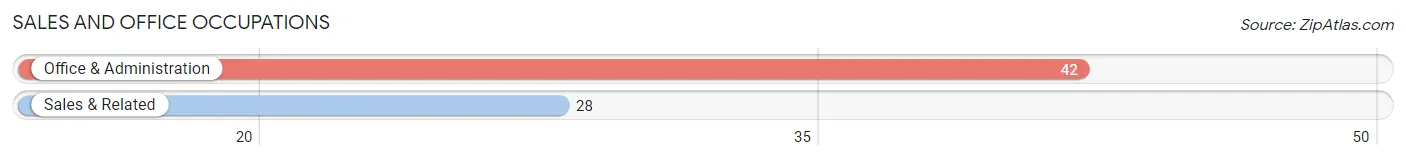
Sales and Office Occupations by Sex
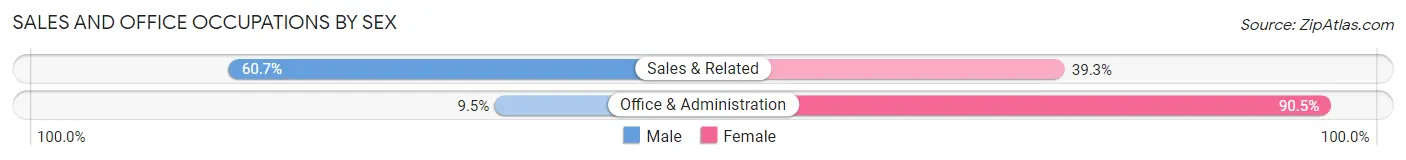
| Occupation | Male | Female |
| Sales & Related | 17 (60.7%) | 11 (39.3%) |
| Office & Administration | 4 (9.5%) | 38 (90.5%) |
| Total (Category) | 21 (30.0%) | 49 (70.0%) |
| Total (Overall) | 245 (53.6%) | 212 (46.4%) |
Natural Resources, Construction and Maintenance Occupations
The most common Natural Resources, Construction and Maintenance occupations in Eastport are Construction & Extraction (28 | 6.1%), Farming, Fishing & Forestry (23 | 5.0%), and Installation, Maintenance & Repair (8 | 1.8%).
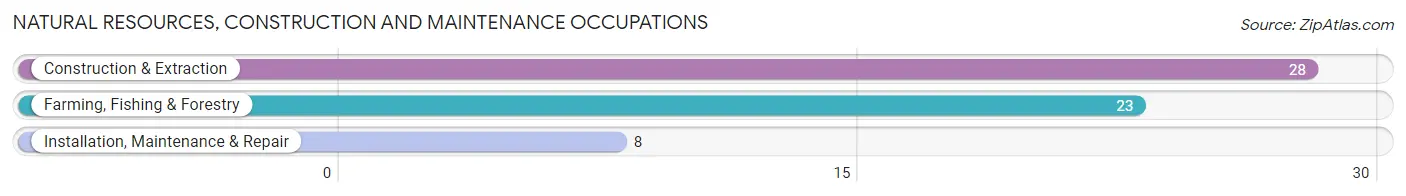
Natural Resources, Construction and Maintenance Occupations by Sex

| Occupation | Male | Female |
| Farming, Fishing & Forestry | 23 (100.0%) | 0 (0.0%) |
| Construction & Extraction | 28 (100.0%) | 0 (0.0%) |
| Installation, Maintenance & Repair | 8 (100.0%) | 0 (0.0%) |
| Total (Category) | 59 (100.0%) | 0 (0.0%) |
| Total (Overall) | 245 (53.6%) | 212 (46.4%) |
Production, Transportation and Moving Occupations
The most common Production, Transportation and Moving occupations in Eastport are Material Moving (24 | 5.2%), Production (22 | 4.8%), and Transportation (16 | 3.5%).
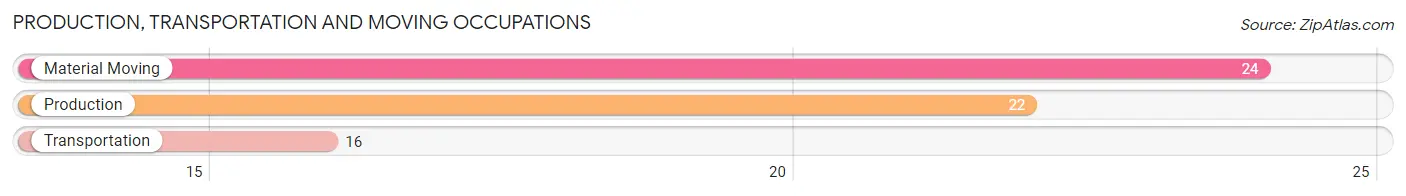
Production, Transportation and Moving Occupations by Sex
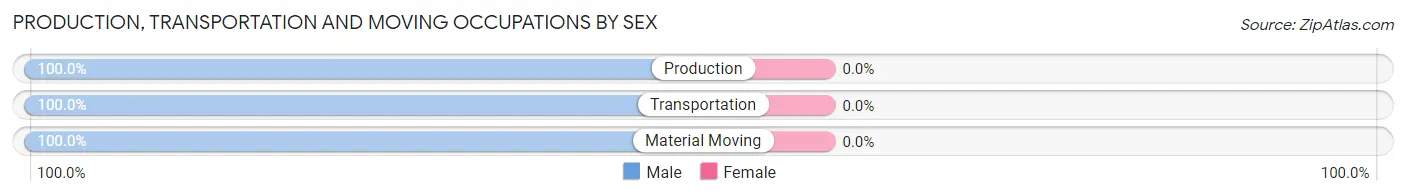
| Occupation | Male | Female |
| Production | 22 (100.0%) | 0 (0.0%) |
| Transportation | 16 (100.0%) | 0 (0.0%) |
| Material Moving | 24 (100.0%) | 0 (0.0%) |
| Total (Category) | 62 (100.0%) | 0 (0.0%) |
| Total (Overall) | 245 (53.6%) | 212 (46.4%) |
Employment Industries by Sex in Eastport
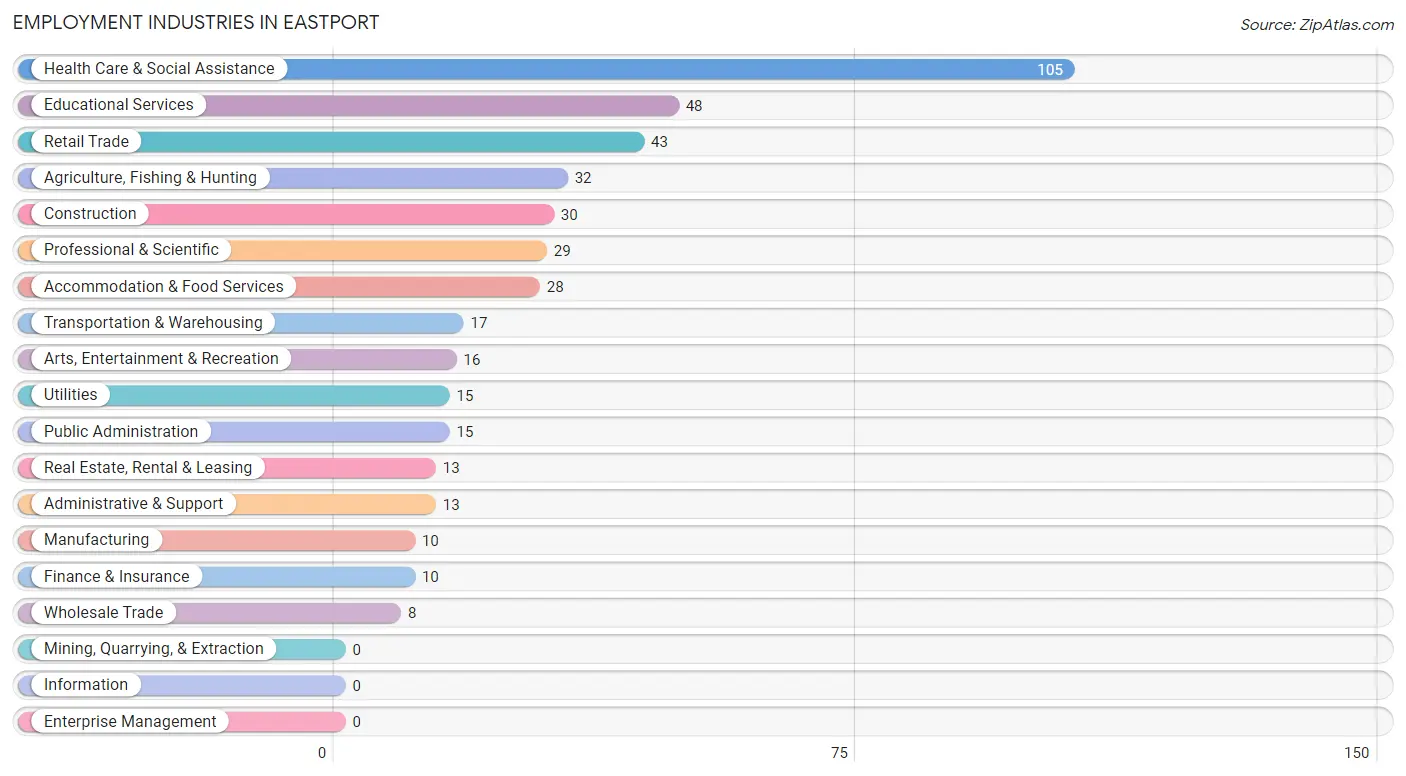
Employment Industries in Eastport
The major employment industries in Eastport include Health Care & Social Assistance (105 | 23.0%), Educational Services (48 | 10.5%), Retail Trade (43 | 9.4%), Agriculture, Fishing & Hunting (32 | 7.0%), and Construction (30 | 6.6%).
Employment Industries by Sex in Eastport
The Eastport industries that see more men than women are Agriculture, Fishing & Hunting (100.0%), Wholesale Trade (100.0%), and Utilities (100.0%), whereas the industries that tend to have a higher number of women are Health Care & Social Assistance (84.8%), Finance & Insurance (80.0%), and Accommodation & Food Services (67.9%).
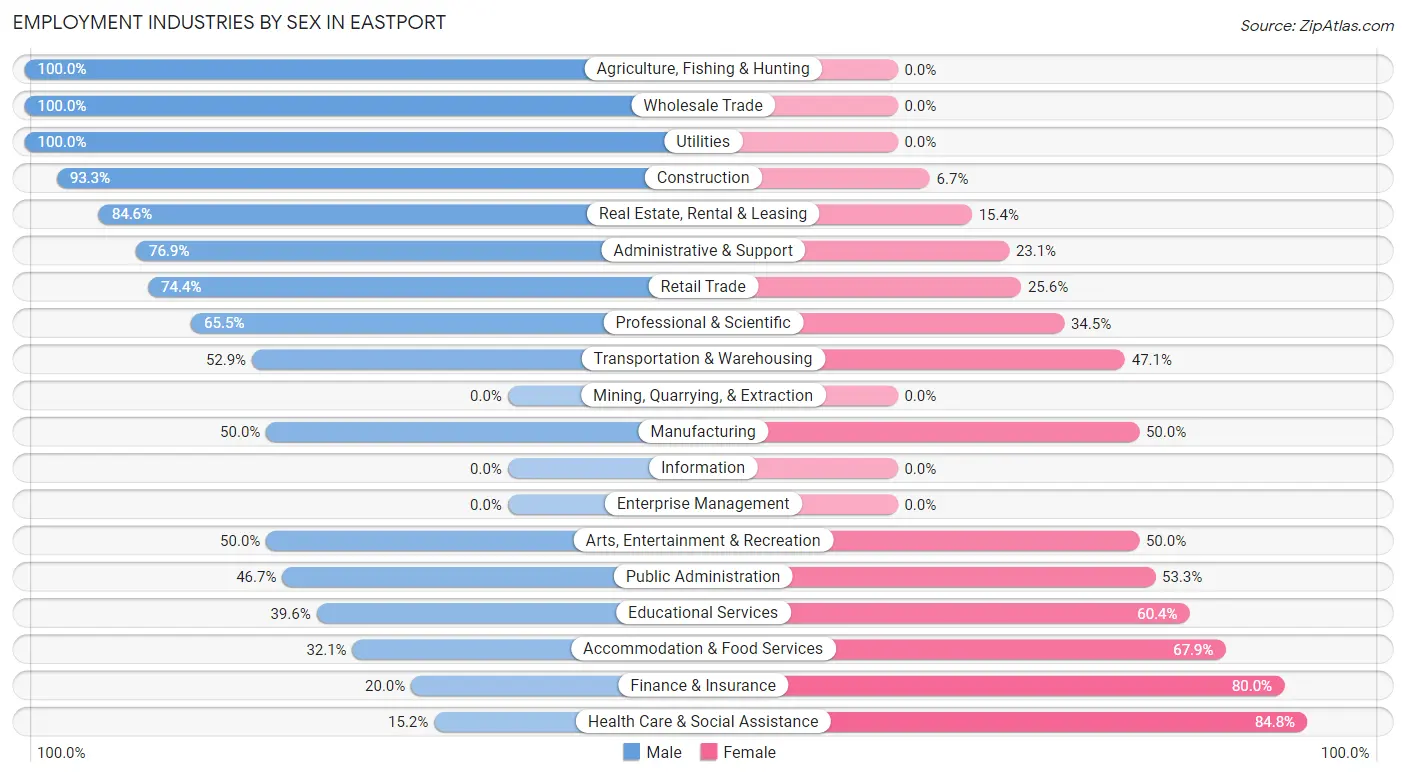
| Industry | Male | Female |
| Agriculture, Fishing & Hunting | 32 (100.0%) | 0 (0.0%) |
| Mining, Quarrying, & Extraction | 0 (0.0%) | 0 (0.0%) |
| Construction | 28 (93.3%) | 2 (6.7%) |
| Manufacturing | 5 (50.0%) | 5 (50.0%) |
| Wholesale Trade | 8 (100.0%) | 0 (0.0%) |
| Retail Trade | 32 (74.4%) | 11 (25.6%) |
| Transportation & Warehousing | 9 (52.9%) | 8 (47.1%) |
| Utilities | 15 (100.0%) | 0 (0.0%) |
| Information | 0 (0.0%) | 0 (0.0%) |
| Finance & Insurance | 2 (20.0%) | 8 (80.0%) |
| Real Estate, Rental & Leasing | 11 (84.6%) | 2 (15.4%) |
| Professional & Scientific | 19 (65.5%) | 10 (34.5%) |
| Enterprise Management | 0 (0.0%) | 0 (0.0%) |
| Administrative & Support | 10 (76.9%) | 3 (23.1%) |
| Educational Services | 19 (39.6%) | 29 (60.4%) |
| Health Care & Social Assistance | 16 (15.2%) | 89 (84.8%) |
| Arts, Entertainment & Recreation | 8 (50.0%) | 8 (50.0%) |
| Accommodation & Food Services | 9 (32.1%) | 19 (67.9%) |
| Public Administration | 7 (46.7%) | 8 (53.3%) |
| Total | 245 (53.6%) | 212 (46.4%) |
Education in Eastport
School Enrollment in Eastport
The most common levels of schooling among the 168 students in Eastport are elementary school (49 | 29.2%), high school (42 | 25.0%), and middle school (40 | 23.8%).
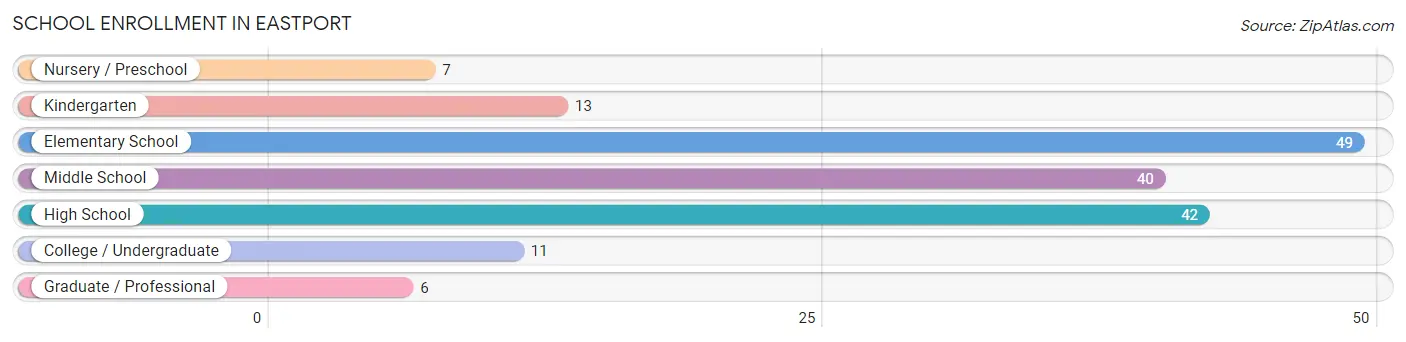
| School Level | # Students | % Students |
| Nursery / Preschool | 7 | 4.2% |
| Kindergarten | 13 | 7.7% |
| Elementary School | 49 | 29.2% |
| Middle School | 40 | 23.8% |
| High School | 42 | 25.0% |
| College / Undergraduate | 11 | 6.6% |
| Graduate / Professional | 6 | 3.6% |
| Total | 168 | 100.0% |
School Enrollment by Age by Funding Source in Eastport
Out of a total of 168 students who are enrolled in schools in Eastport, 28 (16.7%) attend a private institution, while the remaining 140 (83.3%) are enrolled in public schools. The age group of 25 to 34 year olds has the highest likelihood of being enrolled in private schools, with 6 (100.0% in the age bracket) enrolled. Conversely, the age group of 3 to 4 year olds has the lowest likelihood of being enrolled in a private school, with 13 (100.0% in the age bracket) attending a public institution.
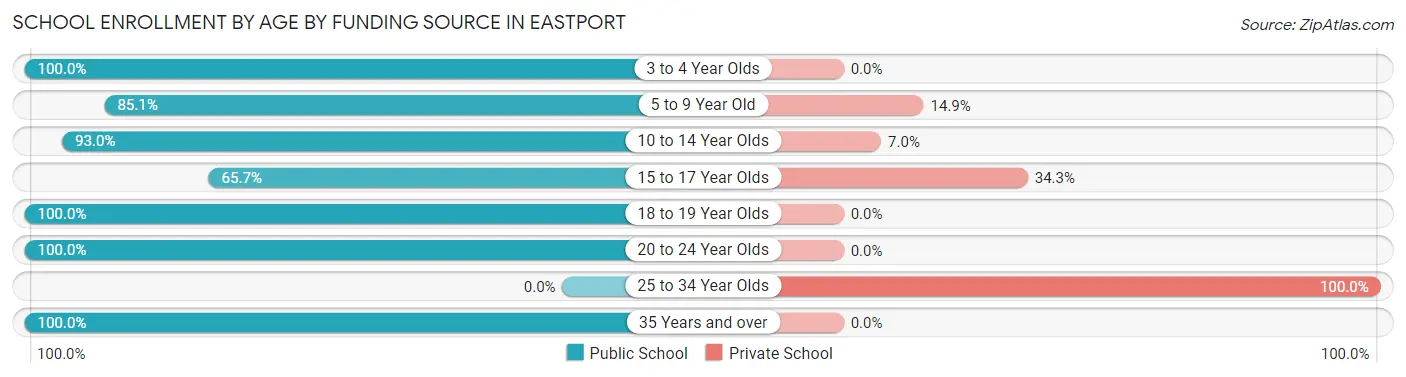
| Age Bracket | Public School | Private School |
| 3 to 4 Year Olds | 13 (100.0%) | 0 (0.0%) |
| 5 to 9 Year Old | 40 (85.1%) | 7 (14.9%) |
| 10 to 14 Year Olds | 40 (93.0%) | 3 (7.0%) |
| 15 to 17 Year Olds | 23 (65.7%) | 12 (34.3%) |
| 18 to 19 Year Olds | 16 (100.0%) | 0 (0.0%) |
| 20 to 24 Year Olds | 3 (100.0%) | 0 (0.0%) |
| 25 to 34 Year Olds | 0 (0.0%) | 6 (100.0%) |
| 35 Years and over | 5 (100.0%) | 0 (0.0%) |
| Total | 140 (83.3%) | 28 (16.7%) |
Educational Attainment by Field of Study in Eastport
Science & technology (51 | 13.2%), bio, nature & agricultural (42 | 10.8%), education (42 | 10.8%), liberal arts & history (37 | 9.6%), and business (36 | 9.3%) are the most common fields of study among 387 individuals in Eastport who have obtained a bachelor's degree or higher.
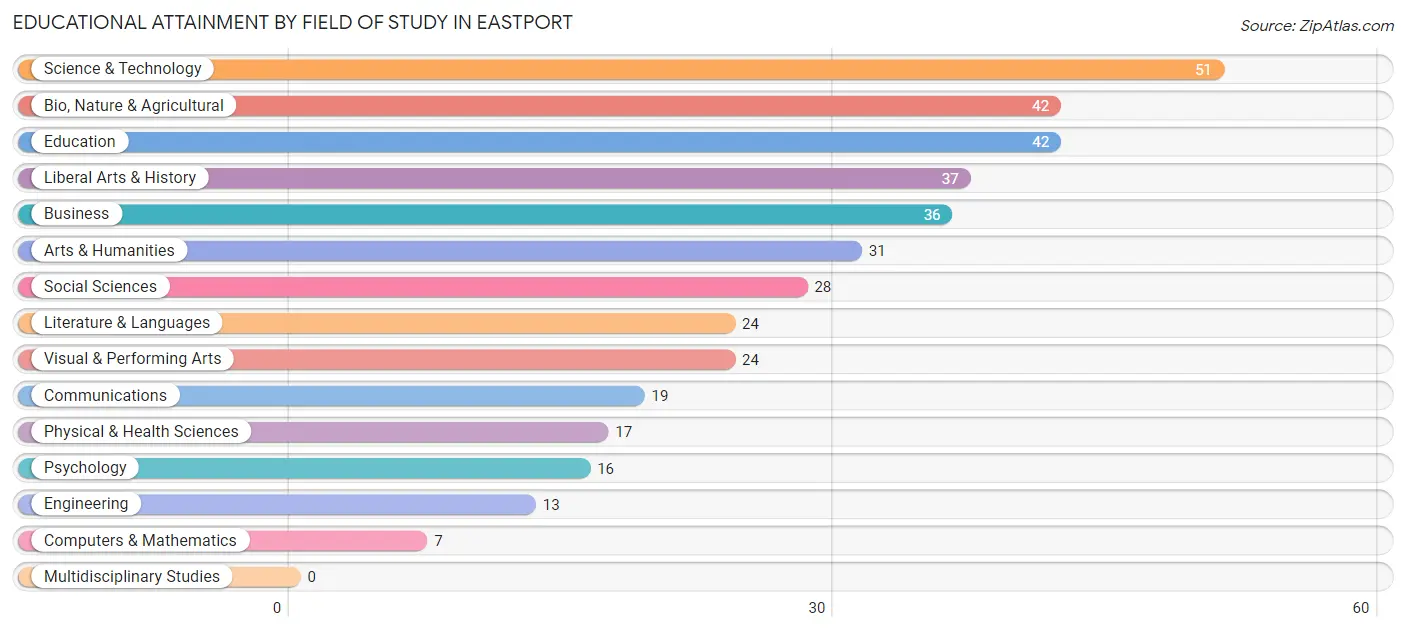
| Field of Study | # Graduates | % Graduates |
| Computers & Mathematics | 7 | 1.8% |
| Bio, Nature & Agricultural | 42 | 10.8% |
| Physical & Health Sciences | 17 | 4.4% |
| Psychology | 16 | 4.1% |
| Social Sciences | 28 | 7.2% |
| Engineering | 13 | 3.4% |
| Multidisciplinary Studies | 0 | 0.0% |
| Science & Technology | 51 | 13.2% |
| Business | 36 | 9.3% |
| Education | 42 | 10.8% |
| Literature & Languages | 24 | 6.2% |
| Liberal Arts & History | 37 | 9.6% |
| Visual & Performing Arts | 24 | 6.2% |
| Communications | 19 | 4.9% |
| Arts & Humanities | 31 | 8.0% |
| Total | 387 | 100.0% |
Transportation & Commute in Eastport
Vehicle Availability by Sex in Eastport
The most prevalent vehicle ownership categories in Eastport are males with 1 vehicle (89, accounting for 35.6%) and females with 1 vehicle (77, making up 42.8%).
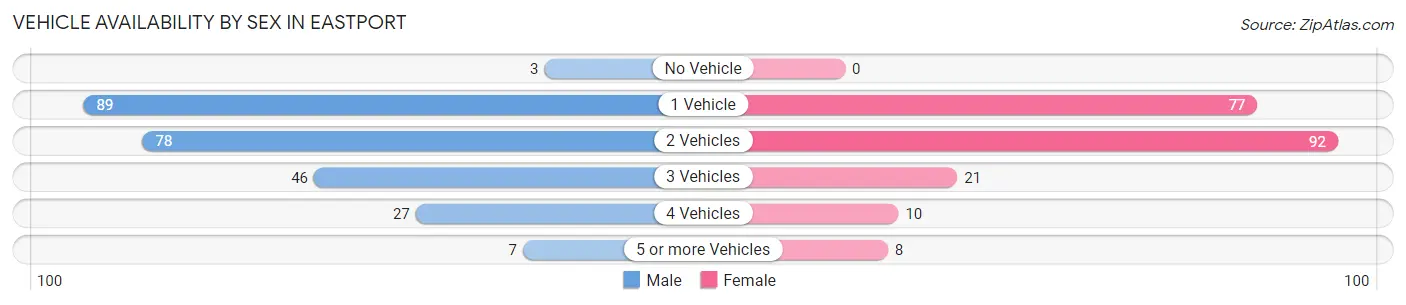
| Vehicles Available | Male | Female |
| No Vehicle | 3 (1.2%) | 0 (0.0%) |
| 1 Vehicle | 89 (35.6%) | 77 (37.0%) |
| 2 Vehicles | 78 (31.2%) | 92 (44.2%) |
| 3 Vehicles | 46 (18.4%) | 21 (10.1%) |
| 4 Vehicles | 27 (10.8%) | 10 (4.8%) |
| 5 or more Vehicles | 7 (2.8%) | 8 (3.8%) |
| Total | 250 (100.0%) | 208 (100.0%) |
Commute Time in Eastport
The most frequently occuring commute durations in Eastport are less than 5 minutes (113 commuters, 30.7%), 5 to 9 minutes (75 commuters, 20.4%), and 10 to 14 minutes (55 commuters, 14.9%).
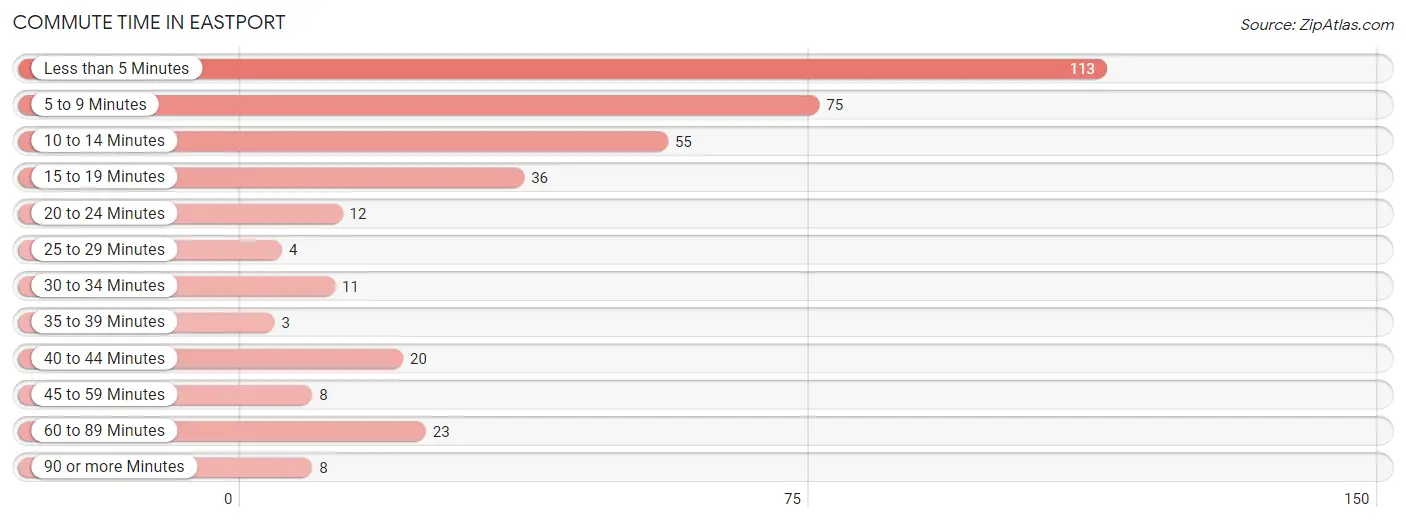
| Commute Time | # Commuters | % Commuters |
| Less than 5 Minutes | 113 | 30.7% |
| 5 to 9 Minutes | 75 | 20.4% |
| 10 to 14 Minutes | 55 | 14.9% |
| 15 to 19 Minutes | 36 | 9.8% |
| 20 to 24 Minutes | 12 | 3.3% |
| 25 to 29 Minutes | 4 | 1.1% |
| 30 to 34 Minutes | 11 | 3.0% |
| 35 to 39 Minutes | 3 | 0.8% |
| 40 to 44 Minutes | 20 | 5.4% |
| 45 to 59 Minutes | 8 | 2.2% |
| 60 to 89 Minutes | 23 | 6.2% |
| 90 or more Minutes | 8 | 2.2% |
Commute Time by Sex in Eastport
The most common commute times in Eastport are less than 5 minutes (56 commuters, 29.9%) for males and less than 5 minutes (57 commuters, 31.5%) for females.
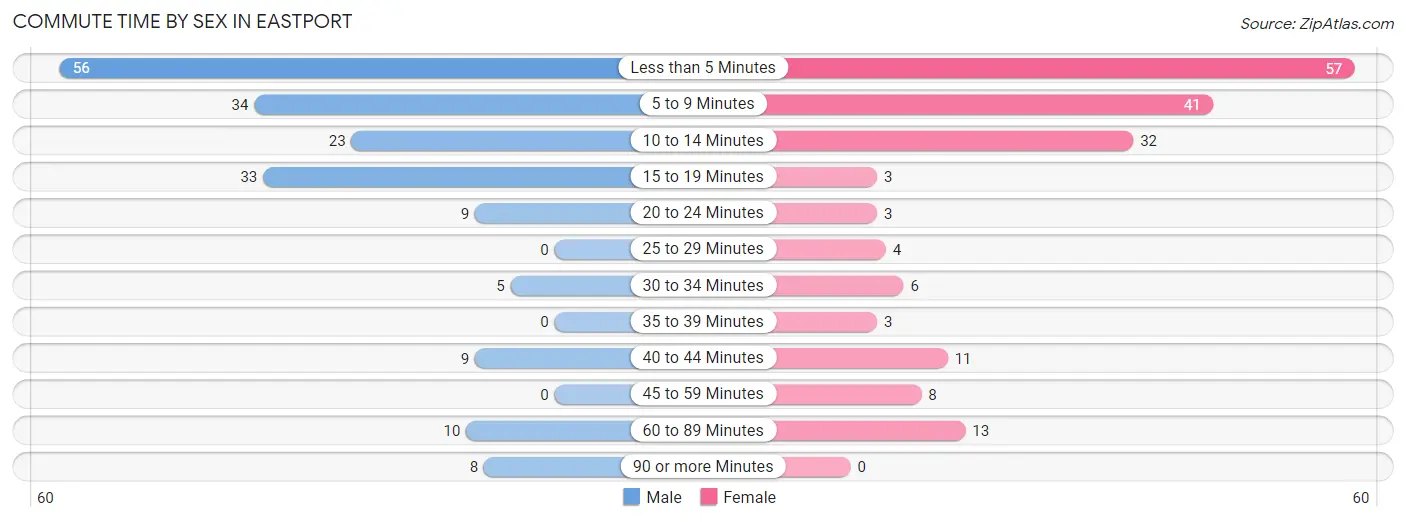
| Commute Time | Male | Female |
| Less than 5 Minutes | 56 (29.9%) | 57 (31.5%) |
| 5 to 9 Minutes | 34 (18.2%) | 41 (22.7%) |
| 10 to 14 Minutes | 23 (12.3%) | 32 (17.7%) |
| 15 to 19 Minutes | 33 (17.6%) | 3 (1.7%) |
| 20 to 24 Minutes | 9 (4.8%) | 3 (1.7%) |
| 25 to 29 Minutes | 0 (0.0%) | 4 (2.2%) |
| 30 to 34 Minutes | 5 (2.7%) | 6 (3.3%) |
| 35 to 39 Minutes | 0 (0.0%) | 3 (1.7%) |
| 40 to 44 Minutes | 9 (4.8%) | 11 (6.1%) |
| 45 to 59 Minutes | 0 (0.0%) | 8 (4.4%) |
| 60 to 89 Minutes | 10 (5.3%) | 13 (7.2%) |
| 90 or more Minutes | 8 (4.3%) | 0 (0.0%) |
Time of Departure to Work by Sex in Eastport
The most frequent times of departure to work in Eastport are 7:30 AM to 7:59 AM (31, 16.6%) for males and 7:30 AM to 7:59 AM (73, 40.3%) for females.
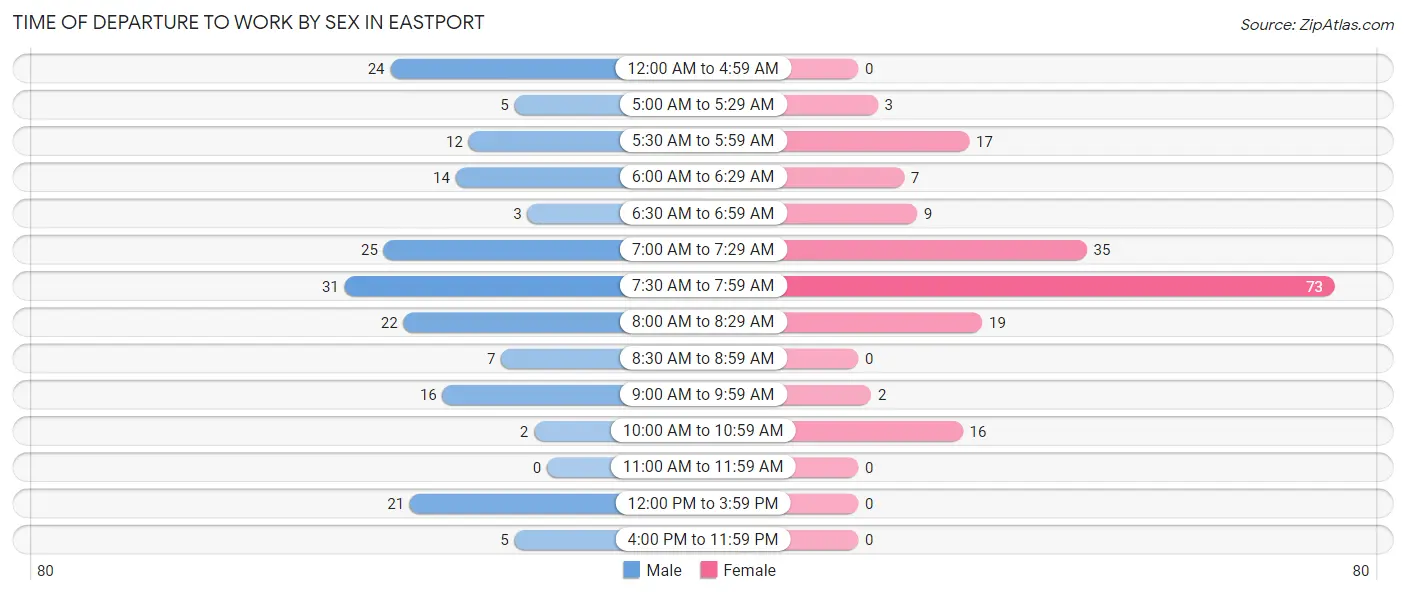
| Time of Departure | Male | Female |
| 12:00 AM to 4:59 AM | 24 (12.8%) | 0 (0.0%) |
| 5:00 AM to 5:29 AM | 5 (2.7%) | 3 (1.7%) |
| 5:30 AM to 5:59 AM | 12 (6.4%) | 17 (9.4%) |
| 6:00 AM to 6:29 AM | 14 (7.5%) | 7 (3.9%) |
| 6:30 AM to 6:59 AM | 3 (1.6%) | 9 (5.0%) |
| 7:00 AM to 7:29 AM | 25 (13.4%) | 35 (19.3%) |
| 7:30 AM to 7:59 AM | 31 (16.6%) | 73 (40.3%) |
| 8:00 AM to 8:29 AM | 22 (11.8%) | 19 (10.5%) |
| 8:30 AM to 8:59 AM | 7 (3.7%) | 0 (0.0%) |
| 9:00 AM to 9:59 AM | 16 (8.6%) | 2 (1.1%) |
| 10:00 AM to 10:59 AM | 2 (1.1%) | 16 (8.8%) |
| 11:00 AM to 11:59 AM | 0 (0.0%) | 0 (0.0%) |
| 12:00 PM to 3:59 PM | 21 (11.2%) | 0 (0.0%) |
| 4:00 PM to 11:59 PM | 5 (2.7%) | 0 (0.0%) |
| Total | 187 (100.0%) | 181 (100.0%) |
Housing Occupancy in Eastport
Occupancy by Ownership in Eastport
Of the total 612 dwellings in Eastport, owner-occupied units account for 485 (79.2%), while renter-occupied units make up 127 (20.7%).
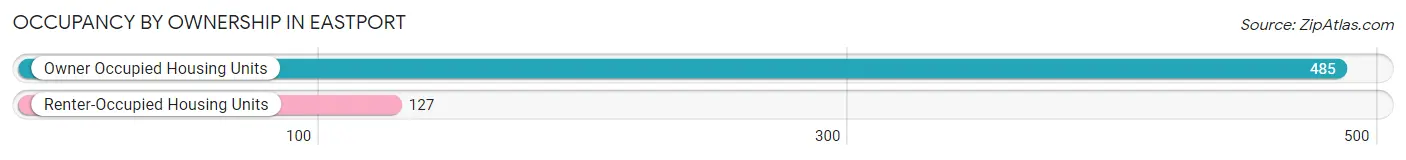
| Occupancy | # Housing Units | % Housing Units |
| Owner Occupied Housing Units | 485 | 79.2% |
| Renter-Occupied Housing Units | 127 | 20.7% |
| Total Occupied Housing Units | 612 | 100.0% |
Occupancy by Household Size in Eastport
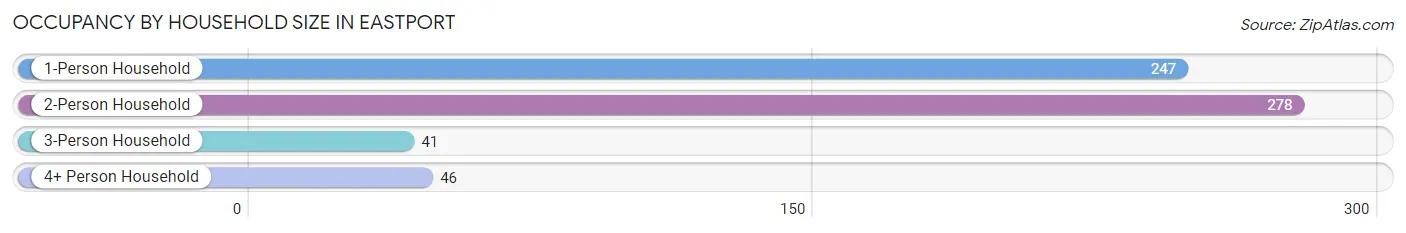
| Household Size | # Housing Units | % Housing Units |
| 1-Person Household | 247 | 40.4% |
| 2-Person Household | 278 | 45.4% |
| 3-Person Household | 41 | 6.7% |
| 4+ Person Household | 46 | 7.5% |
| Total Housing Units | 612 | 100.0% |
Occupancy by Ownership by Household Size in Eastport
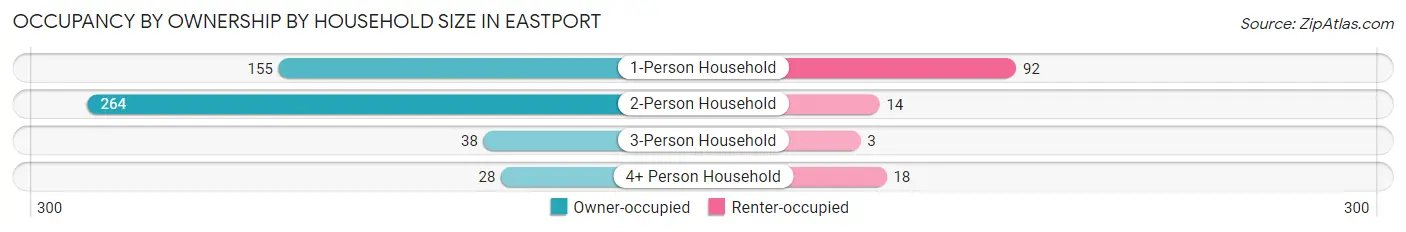
| Household Size | Owner-occupied | Renter-occupied |
| 1-Person Household | 155 (62.7%) | 92 (37.2%) |
| 2-Person Household | 264 (95.0%) | 14 (5.0%) |
| 3-Person Household | 38 (92.7%) | 3 (7.3%) |
| 4+ Person Household | 28 (60.9%) | 18 (39.1%) |
| Total Housing Units | 485 (79.2%) | 127 (20.7%) |
Occupancy by Educational Attainment in Eastport
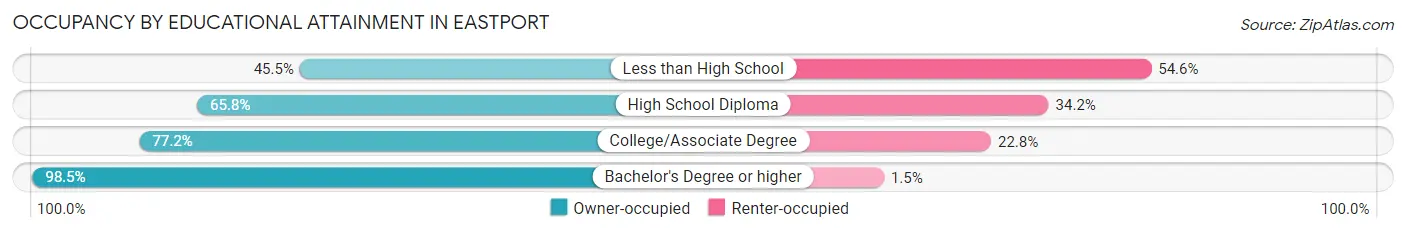
| Household Size | Owner-occupied | Renter-occupied |
| Less than High School | 10 (45.5%) | 12 (54.5%) |
| High School Diploma | 127 (65.8%) | 66 (34.2%) |
| College/Associate Degree | 156 (77.2%) | 46 (22.8%) |
| Bachelor's Degree or higher | 192 (98.5%) | 3 (1.5%) |
Occupancy by Age of Householder in Eastport
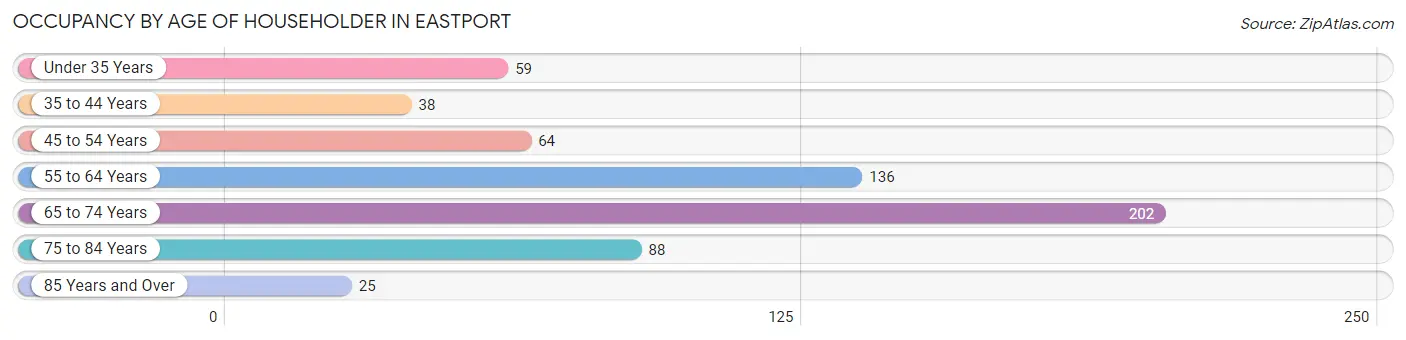
| Age Bracket | # Households | % Households |
| Under 35 Years | 59 | 9.6% |
| 35 to 44 Years | 38 | 6.2% |
| 45 to 54 Years | 64 | 10.5% |
| 55 to 64 Years | 136 | 22.2% |
| 65 to 74 Years | 202 | 33.0% |
| 75 to 84 Years | 88 | 14.4% |
| 85 Years and Over | 25 | 4.1% |
| Total | 612 | 100.0% |
Housing Finances in Eastport
Median Income by Occupancy in Eastport
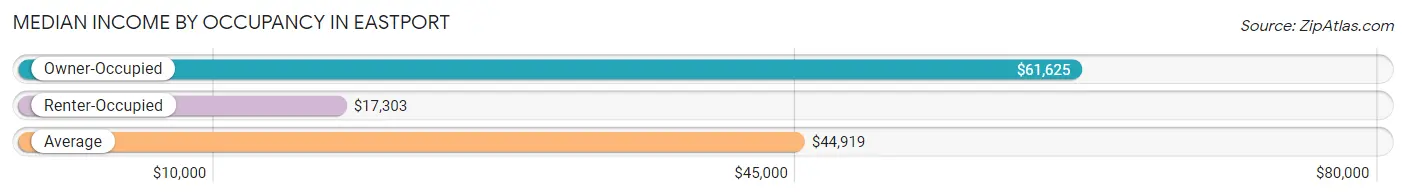
| Occupancy Type | # Households | Median Income |
| Owner-Occupied | 485 (79.2%) | $61,625 |
| Renter-Occupied | 127 (20.7%) | $17,303 |
| Average | 612 (100.0%) | $44,919 |
Occupancy by Householder Income Bracket in Eastport
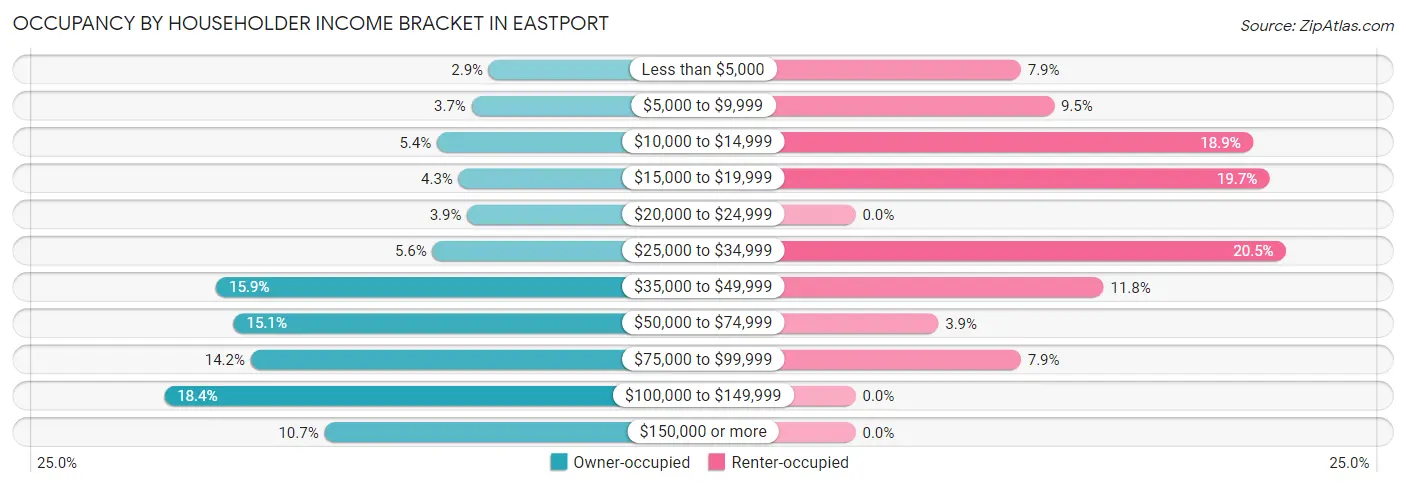
| Income Bracket | Owner-occupied | Renter-occupied |
| Less than $5,000 | 14 (2.9%) | 10 (7.9%) |
| $5,000 to $9,999 | 18 (3.7%) | 12 (9.5%) |
| $10,000 to $14,999 | 26 (5.4%) | 24 (18.9%) |
| $15,000 to $19,999 | 21 (4.3%) | 25 (19.7%) |
| $20,000 to $24,999 | 19 (3.9%) | 0 (0.0%) |
| $25,000 to $34,999 | 27 (5.6%) | 26 (20.5%) |
| $35,000 to $49,999 | 77 (15.9%) | 15 (11.8%) |
| $50,000 to $74,999 | 73 (15.0%) | 5 (3.9%) |
| $75,000 to $99,999 | 69 (14.2%) | 10 (7.9%) |
| $100,000 to $149,999 | 89 (18.3%) | 0 (0.0%) |
| $150,000 or more | 52 (10.7%) | 0 (0.0%) |
| Total | 485 (100.0%) | 127 (100.0%) |
Monthly Housing Cost Tiers in Eastport
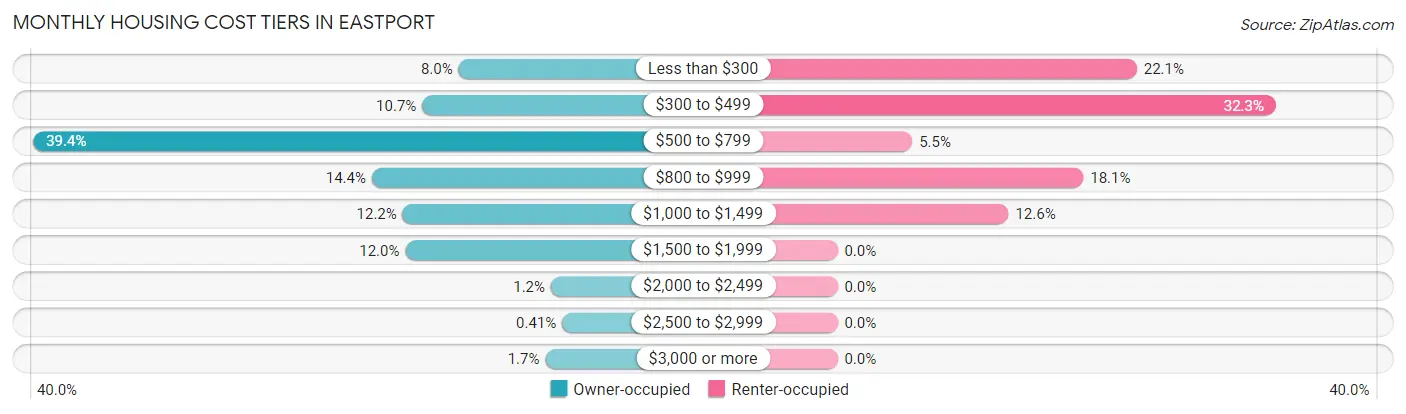
| Monthly Cost | Owner-occupied | Renter-occupied |
| Less than $300 | 39 (8.0%) | 28 (22.1%) |
| $300 to $499 | 52 (10.7%) | 41 (32.3%) |
| $500 to $799 | 191 (39.4%) | 7 (5.5%) |
| $800 to $999 | 70 (14.4%) | 23 (18.1%) |
| $1,000 to $1,499 | 59 (12.2%) | 16 (12.6%) |
| $1,500 to $1,999 | 58 (12.0%) | 0 (0.0%) |
| $2,000 to $2,499 | 6 (1.2%) | 0 (0.0%) |
| $2,500 to $2,999 | 2 (0.4%) | 0 (0.0%) |
| $3,000 or more | 8 (1.7%) | 0 (0.0%) |
| Total | 485 (100.0%) | 127 (100.0%) |
Physical Housing Characteristics in Eastport
Housing Structures in Eastport
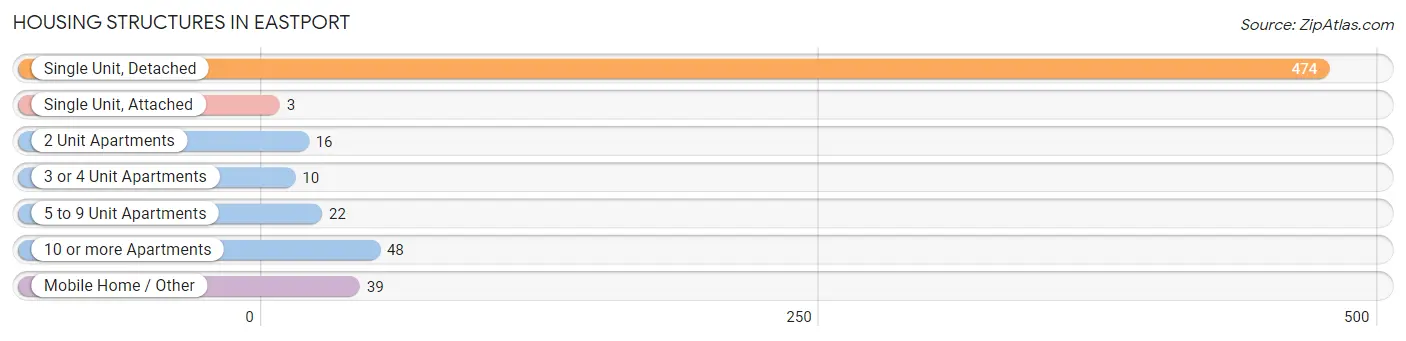
| Structure Type | # Housing Units | % Housing Units |
| Single Unit, Detached | 474 | 77.4% |
| Single Unit, Attached | 3 | 0.5% |
| 2 Unit Apartments | 16 | 2.6% |
| 3 or 4 Unit Apartments | 10 | 1.6% |
| 5 to 9 Unit Apartments | 22 | 3.6% |
| 10 or more Apartments | 48 | 7.8% |
| Mobile Home / Other | 39 | 6.4% |
| Total | 612 | 100.0% |
Housing Structures by Occupancy in Eastport
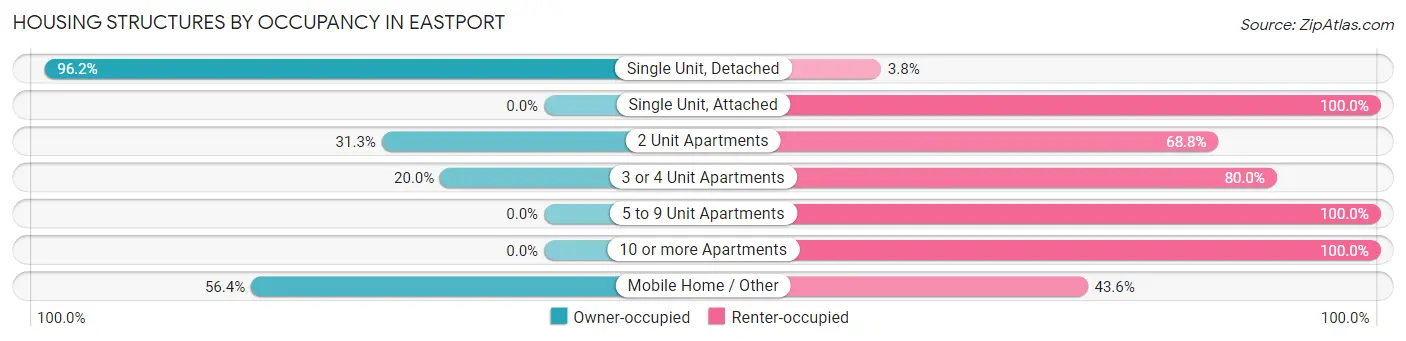
| Structure Type | Owner-occupied | Renter-occupied |
| Single Unit, Detached | 456 (96.2%) | 18 (3.8%) |
| Single Unit, Attached | 0 (0.0%) | 3 (100.0%) |
| 2 Unit Apartments | 5 (31.2%) | 11 (68.8%) |
| 3 or 4 Unit Apartments | 2 (20.0%) | 8 (80.0%) |
| 5 to 9 Unit Apartments | 0 (0.0%) | 22 (100.0%) |
| 10 or more Apartments | 0 (0.0%) | 48 (100.0%) |
| Mobile Home / Other | 22 (56.4%) | 17 (43.6%) |
| Total | 485 (79.2%) | 127 (20.7%) |
Housing Structures by Number of Rooms in Eastport
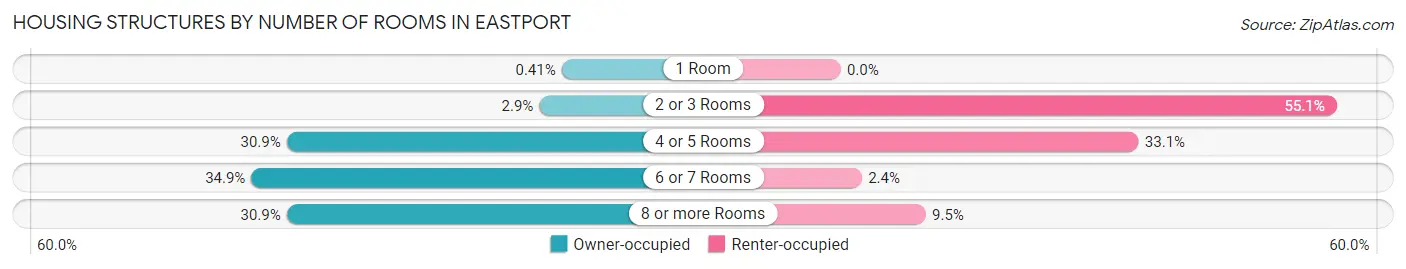
| Number of Rooms | Owner-occupied | Renter-occupied |
| 1 Room | 2 (0.4%) | 0 (0.0%) |
| 2 or 3 Rooms | 14 (2.9%) | 70 (55.1%) |
| 4 or 5 Rooms | 150 (30.9%) | 42 (33.1%) |
| 6 or 7 Rooms | 169 (34.8%) | 3 (2.4%) |
| 8 or more Rooms | 150 (30.9%) | 12 (9.5%) |
| Total | 485 (100.0%) | 127 (100.0%) |
Housing Structure by Heating Type in Eastport
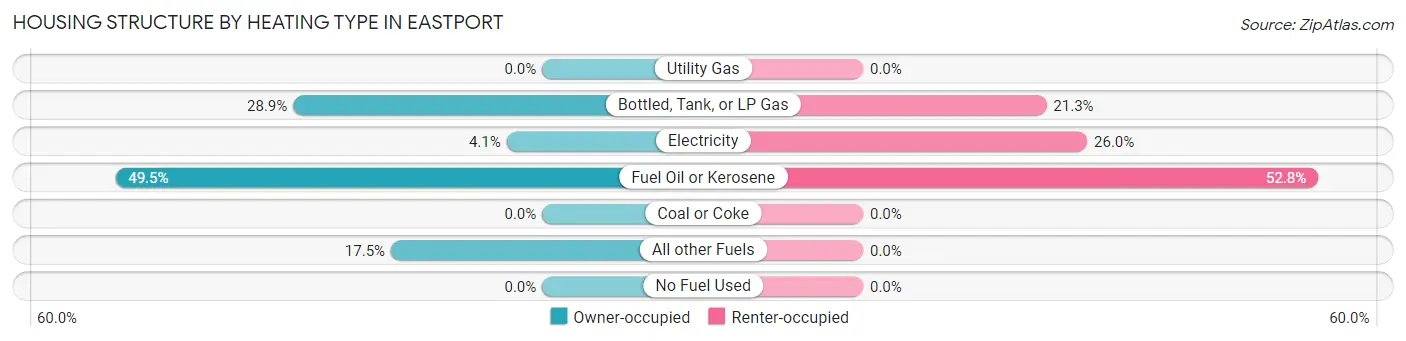
| Heating Type | Owner-occupied | Renter-occupied |
| Utility Gas | 0 (0.0%) | 0 (0.0%) |
| Bottled, Tank, or LP Gas | 140 (28.9%) | 27 (21.3%) |
| Electricity | 20 (4.1%) | 33 (26.0%) |
| Fuel Oil or Kerosene | 240 (49.5%) | 67 (52.8%) |
| Coal or Coke | 0 (0.0%) | 0 (0.0%) |
| All other Fuels | 85 (17.5%) | 0 (0.0%) |
| No Fuel Used | 0 (0.0%) | 0 (0.0%) |
| Total | 485 (100.0%) | 127 (100.0%) |
Household Vehicle Usage in Eastport
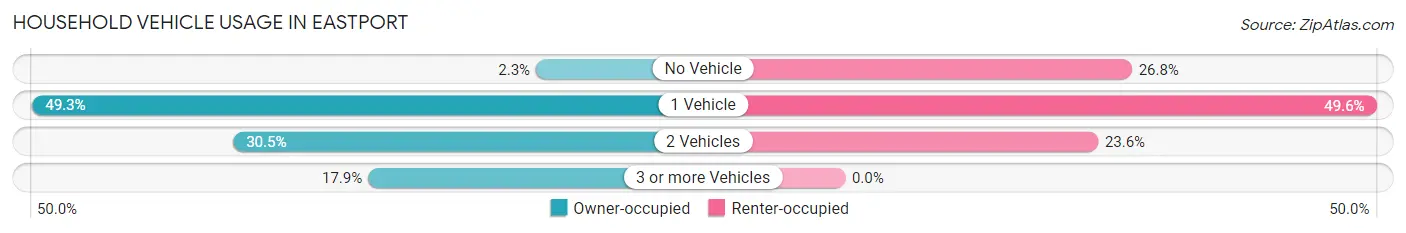
| Vehicles per Household | Owner-occupied | Renter-occupied |
| No Vehicle | 11 (2.3%) | 34 (26.8%) |
| 1 Vehicle | 239 (49.3%) | 63 (49.6%) |
| 2 Vehicles | 148 (30.5%) | 30 (23.6%) |
| 3 or more Vehicles | 87 (17.9%) | 0 (0.0%) |
| Total | 485 (100.0%) | 127 (100.0%) |
Real Estate & Mortgages in Eastport
Real Estate and Mortgage Overview in Eastport
| Characteristic | Without Mortgage | With Mortgage |
| Housing Units | 292 | 193 |
| Median Property Value | $113,400 | $143,300 |
| Median Household Income | $46,875 | $31 |
| Monthly Housing Costs | $570 | $8 |
| Real Estate Taxes | $2,295 | $4 |
Property Value by Mortgage Status in Eastport
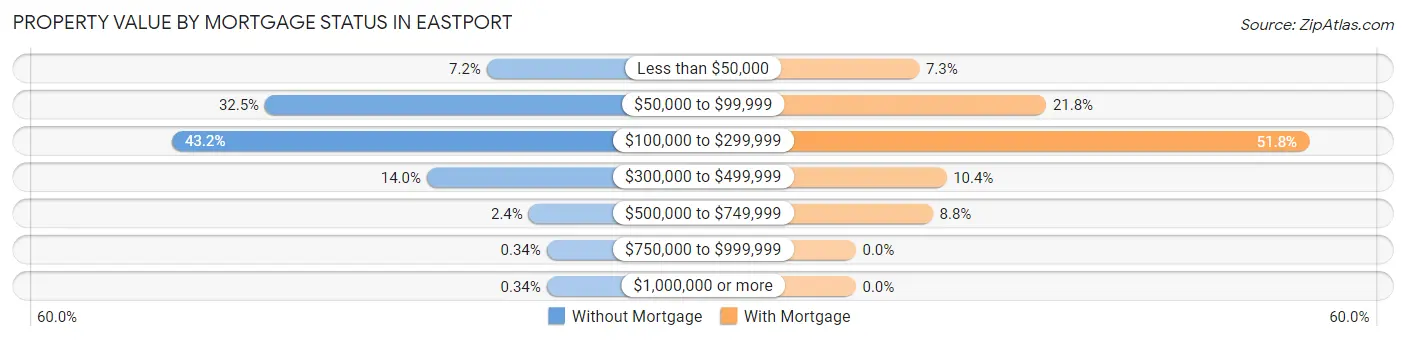
| Property Value | Without Mortgage | With Mortgage |
| Less than $50,000 | 21 (7.2%) | 14 (7.2%) |
| $50,000 to $99,999 | 95 (32.5%) | 42 (21.8%) |
| $100,000 to $299,999 | 126 (43.1%) | 100 (51.8%) |
| $300,000 to $499,999 | 41 (14.0%) | 20 (10.4%) |
| $500,000 to $749,999 | 7 (2.4%) | 17 (8.8%) |
| $750,000 to $999,999 | 1 (0.3%) | 0 (0.0%) |
| $1,000,000 or more | 1 (0.3%) | 0 (0.0%) |
| Total | 292 (100.0%) | 193 (100.0%) |
Household Income by Mortgage Status in Eastport
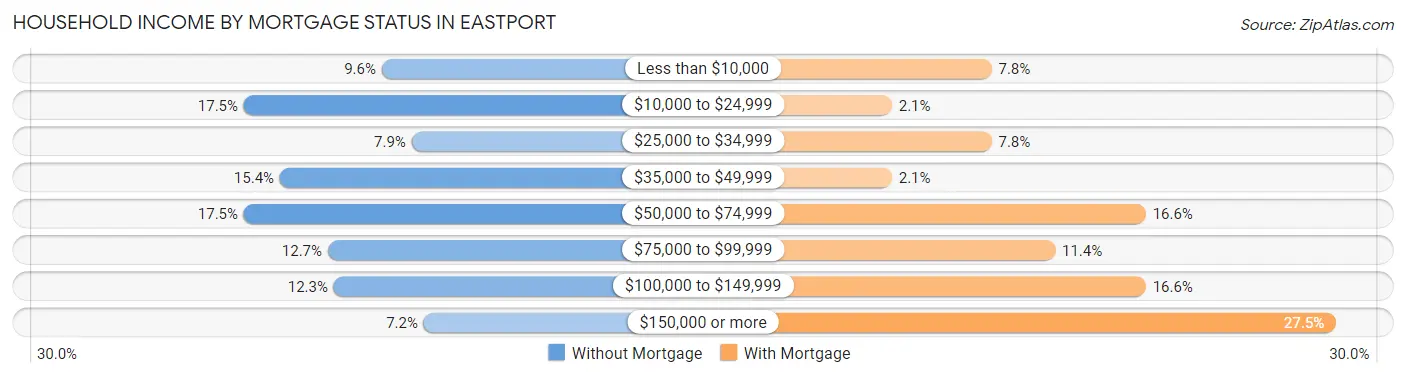
| Household Income | Without Mortgage | With Mortgage |
| Less than $10,000 | 28 (9.6%) | 15 (7.8%) |
| $10,000 to $24,999 | 51 (17.5%) | 4 (2.1%) |
| $25,000 to $34,999 | 23 (7.9%) | 15 (7.8%) |
| $35,000 to $49,999 | 45 (15.4%) | 4 (2.1%) |
| $50,000 to $74,999 | 51 (17.5%) | 32 (16.6%) |
| $75,000 to $99,999 | 37 (12.7%) | 22 (11.4%) |
| $100,000 to $149,999 | 36 (12.3%) | 32 (16.6%) |
| $150,000 or more | 21 (7.2%) | 53 (27.5%) |
| Total | 292 (100.0%) | 193 (100.0%) |
Property Value to Household Income Ratio in Eastport
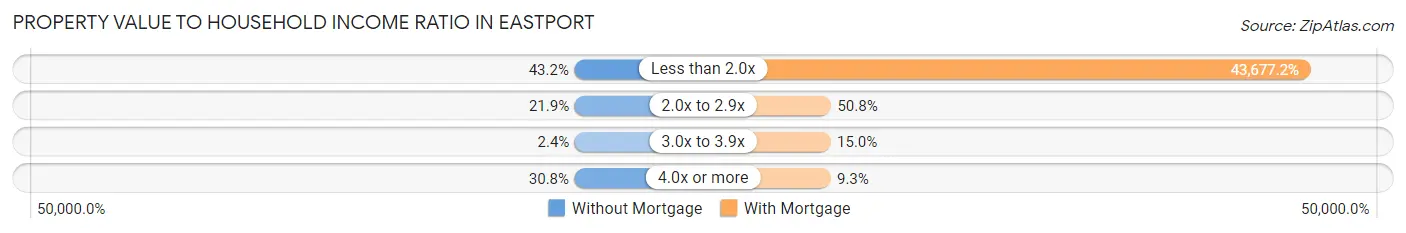
| Value-to-Income Ratio | Without Mortgage | With Mortgage |
| Less than 2.0x | 126 (43.1%) | 84,297 (43,677.2%) |
| 2.0x to 2.9x | 64 (21.9%) | 98 (50.8%) |
| 3.0x to 3.9x | 7 (2.4%) | 29 (15.0%) |
| 4.0x or more | 90 (30.8%) | 18 (9.3%) |
| Total | 292 (100.0%) | 193 (100.0%) |
Real Estate Taxes by Mortgage Status in Eastport
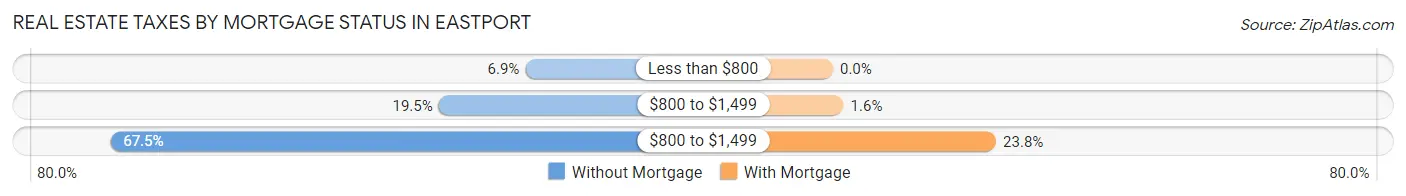
| Property Taxes | Without Mortgage | With Mortgage |
| Less than $800 | 20 (6.9%) | 0 (0.0%) |
| $800 to $1,499 | 57 (19.5%) | 3 (1.5%) |
| $800 to $1,499 | 197 (67.5%) | 46 (23.8%) |
| Total | 292 (100.0%) | 193 (100.0%) |
Health & Disability in Eastport
Health Insurance Coverage by Age in Eastport
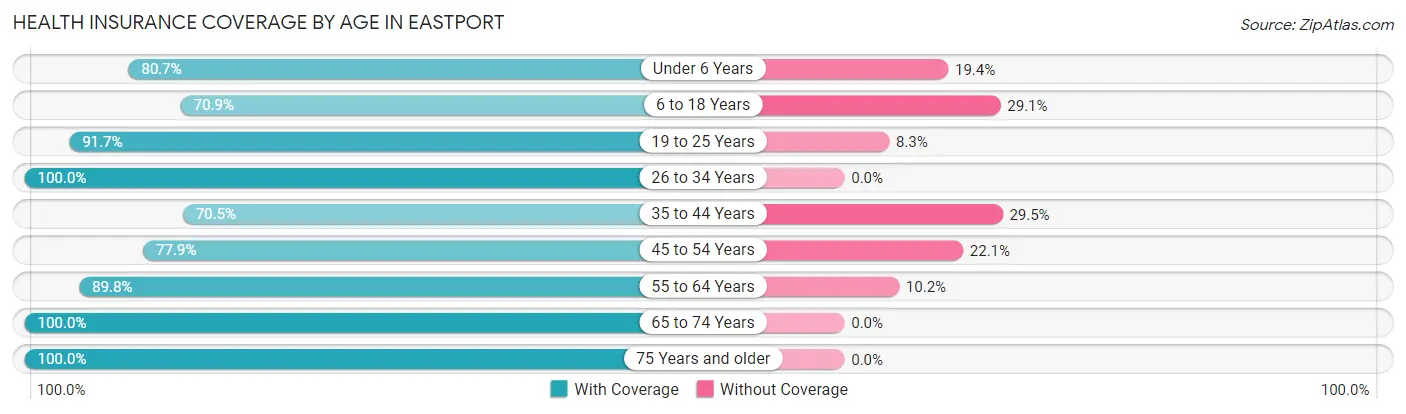
| Age Bracket | With Coverage | Without Coverage |
| Under 6 Years | 25 (80.6%) | 6 (19.4%) |
| 6 to 18 Years | 95 (70.9%) | 39 (29.1%) |
| 19 to 25 Years | 22 (91.7%) | 2 (8.3%) |
| 26 to 34 Years | 76 (100.0%) | 0 (0.0%) |
| 35 to 44 Years | 55 (70.5%) | 23 (29.5%) |
| 45 to 54 Years | 74 (77.9%) | 21 (22.1%) |
| 55 to 64 Years | 203 (89.8%) | 23 (10.2%) |
| 65 to 74 Years | 330 (100.0%) | 0 (0.0%) |
| 75 Years and older | 179 (100.0%) | 0 (0.0%) |
| Total | 1,059 (90.3%) | 114 (9.7%) |
Health Insurance Coverage by Citizenship Status in Eastport
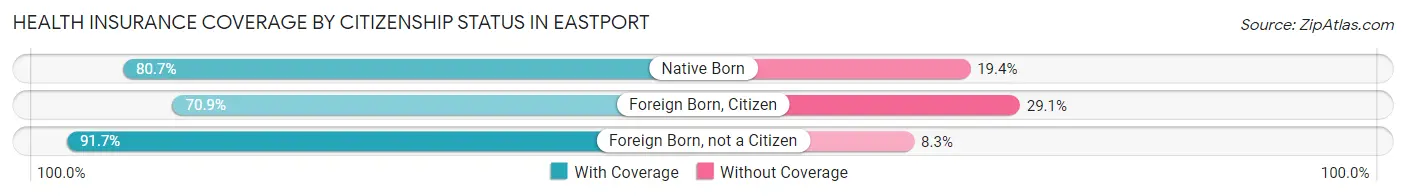
| Citizenship Status | With Coverage | Without Coverage |
| Native Born | 25 (80.6%) | 6 (19.4%) |
| Foreign Born, Citizen | 95 (70.9%) | 39 (29.1%) |
| Foreign Born, not a Citizen | 22 (91.7%) | 2 (8.3%) |
Health Insurance Coverage by Household Income in Eastport
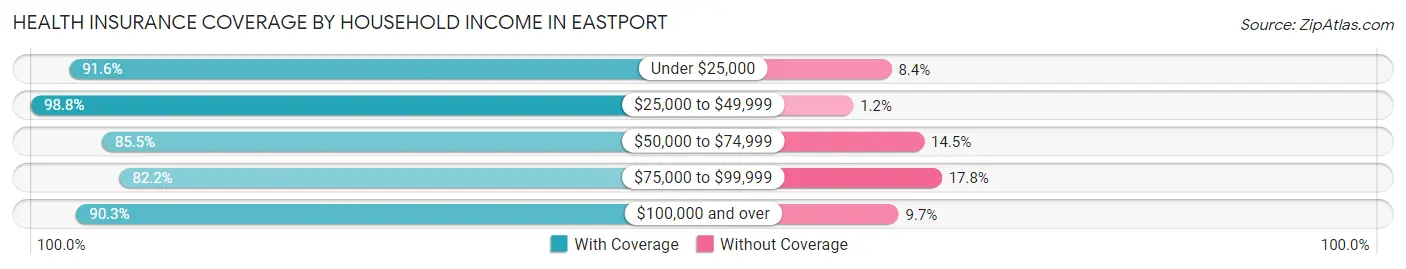
| Household Income | With Coverage | Without Coverage |
| Under $25,000 | 186 (91.6%) | 17 (8.4%) |
| $25,000 to $49,999 | 245 (98.8%) | 3 (1.2%) |
| $50,000 to $74,999 | 130 (85.5%) | 22 (14.5%) |
| $75,000 to $99,999 | 185 (82.2%) | 40 (17.8%) |
| $100,000 and over | 298 (90.3%) | 32 (9.7%) |
Public vs Private Health Insurance Coverage by Age in Eastport
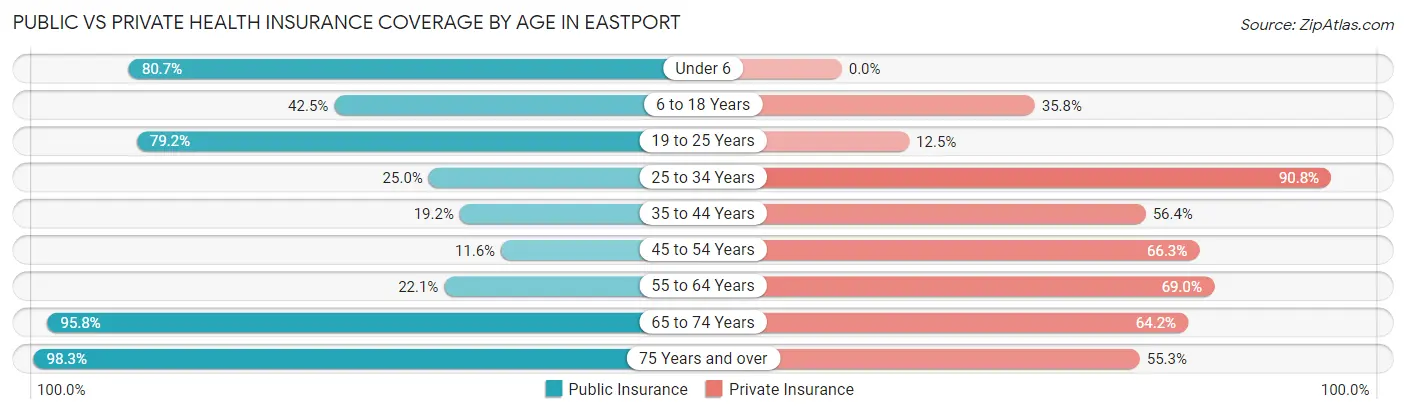
| Age Bracket | Public Insurance | Private Insurance |
| Under 6 | 25 (80.6%) | 0 (0.0%) |
| 6 to 18 Years | 57 (42.5%) | 48 (35.8%) |
| 19 to 25 Years | 19 (79.2%) | 3 (12.5%) |
| 25 to 34 Years | 19 (25.0%) | 69 (90.8%) |
| 35 to 44 Years | 15 (19.2%) | 44 (56.4%) |
| 45 to 54 Years | 11 (11.6%) | 63 (66.3%) |
| 55 to 64 Years | 50 (22.1%) | 156 (69.0%) |
| 65 to 74 Years | 316 (95.8%) | 212 (64.2%) |
| 75 Years and over | 176 (98.3%) | 99 (55.3%) |
| Total | 688 (58.7%) | 694 (59.2%) |
Disability Status by Sex by Age in Eastport
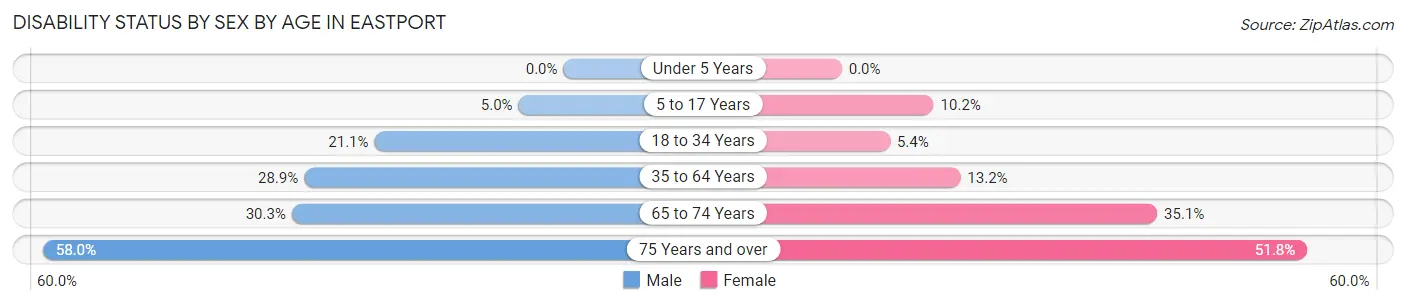
| Age Bracket | Male | Female |
| Under 5 Years | 0 (0.0%) | 0 (0.0%) |
| 5 to 17 Years | 2 (5.0%) | 9 (10.2%) |
| 18 to 34 Years | 12 (21.0%) | 3 (5.4%) |
| 35 to 64 Years | 54 (28.9%) | 28 (13.2%) |
| 65 to 74 Years | 49 (30.2%) | 59 (35.1%) |
| 75 Years and over | 40 (58.0%) | 57 (51.8%) |
Disability Class by Sex by Age in Eastport
Disability Class: Hearing Difficulty
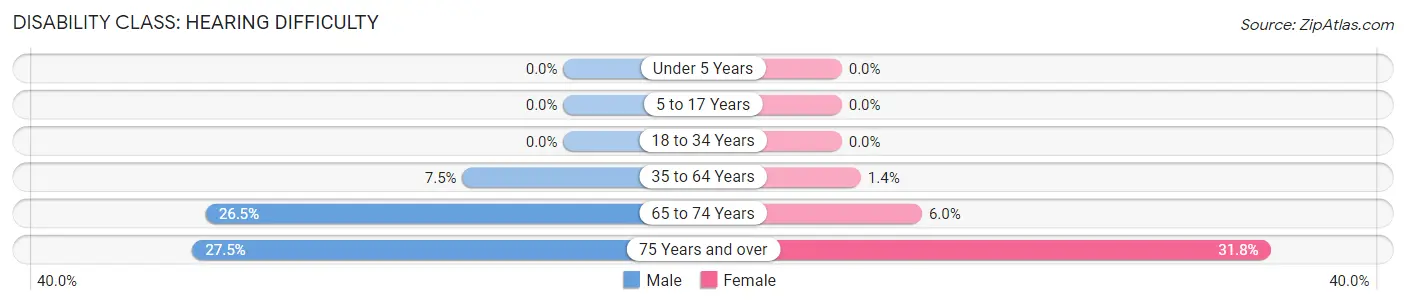
| Age Bracket | Male | Female |
| Under 5 Years | 0 (0.0%) | 0 (0.0%) |
| 5 to 17 Years | 0 (0.0%) | 0 (0.0%) |
| 18 to 34 Years | 0 (0.0%) | 0 (0.0%) |
| 35 to 64 Years | 14 (7.5%) | 3 (1.4%) |
| 65 to 74 Years | 43 (26.5%) | 10 (5.9%) |
| 75 Years and over | 19 (27.5%) | 35 (31.8%) |
Disability Class: Vision Difficulty
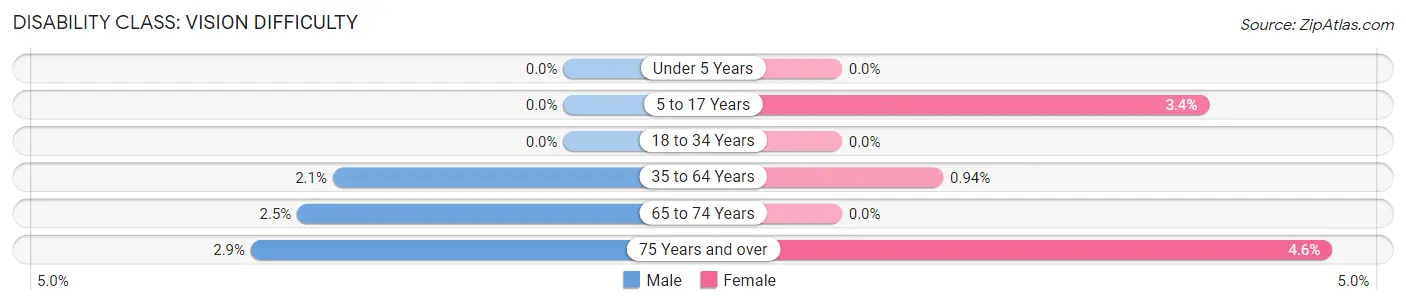
| Age Bracket | Male | Female |
| Under 5 Years | 0 (0.0%) | 0 (0.0%) |
| 5 to 17 Years | 0 (0.0%) | 3 (3.4%) |
| 18 to 34 Years | 0 (0.0%) | 0 (0.0%) |
| 35 to 64 Years | 4 (2.1%) | 2 (0.9%) |
| 65 to 74 Years | 4 (2.5%) | 0 (0.0%) |
| 75 Years and over | 2 (2.9%) | 5 (4.5%) |
Disability Class: Cognitive Difficulty
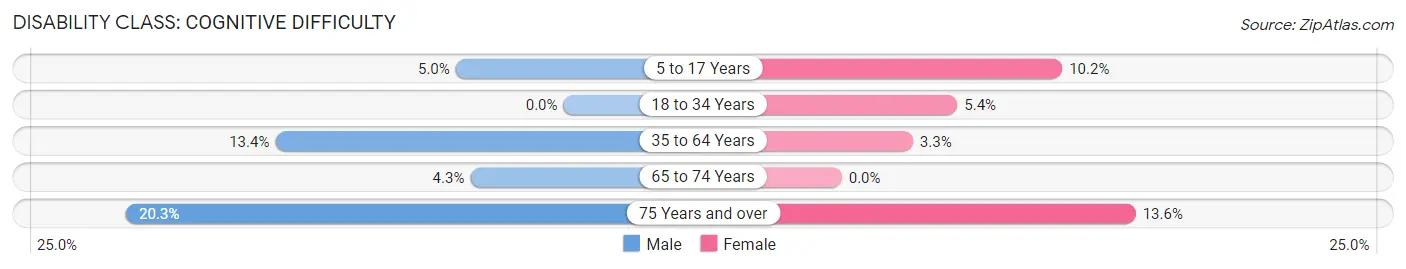
| Age Bracket | Male | Female |
| 5 to 17 Years | 2 (5.0%) | 9 (10.2%) |
| 18 to 34 Years | 0 (0.0%) | 3 (5.4%) |
| 35 to 64 Years | 25 (13.4%) | 7 (3.3%) |
| 65 to 74 Years | 7 (4.3%) | 0 (0.0%) |
| 75 Years and over | 14 (20.3%) | 15 (13.6%) |
Disability Class: Ambulatory Difficulty
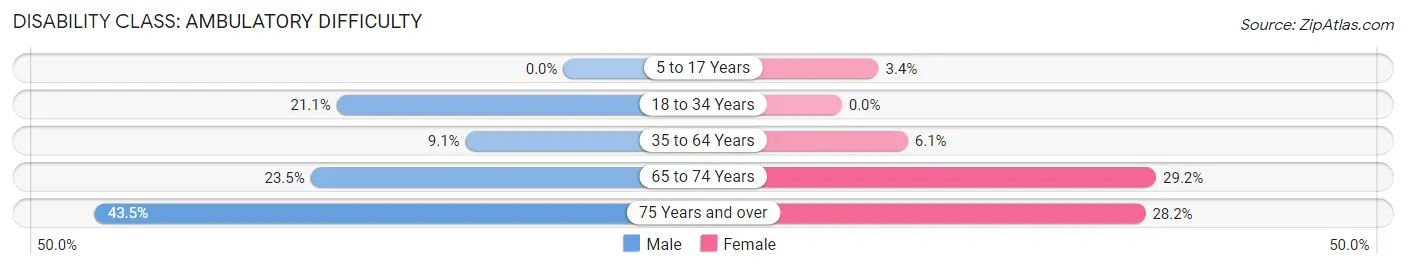
| Age Bracket | Male | Female |
| 5 to 17 Years | 0 (0.0%) | 3 (3.4%) |
| 18 to 34 Years | 12 (21.0%) | 0 (0.0%) |
| 35 to 64 Years | 17 (9.1%) | 13 (6.1%) |
| 65 to 74 Years | 38 (23.5%) | 49 (29.2%) |
| 75 Years and over | 30 (43.5%) | 31 (28.2%) |
Disability Class: Self-Care Difficulty
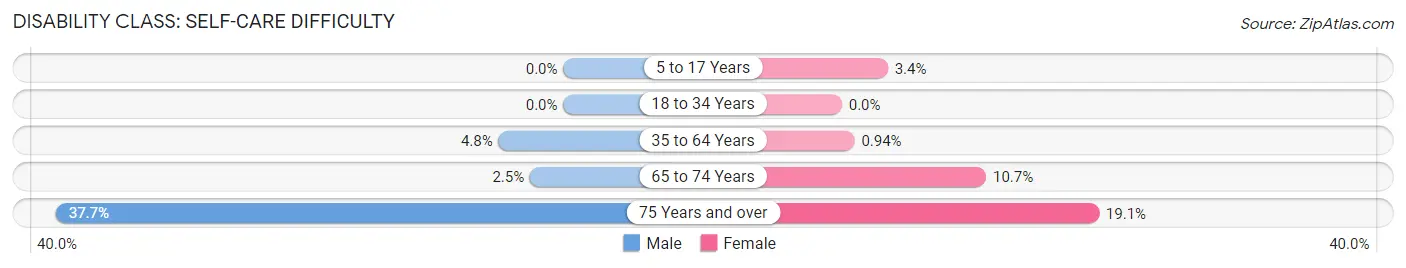
| Age Bracket | Male | Female |
| 5 to 17 Years | 0 (0.0%) | 3 (3.4%) |
| 18 to 34 Years | 0 (0.0%) | 0 (0.0%) |
| 35 to 64 Years | 9 (4.8%) | 2 (0.9%) |
| 65 to 74 Years | 4 (2.5%) | 18 (10.7%) |
| 75 Years and over | 26 (37.7%) | 21 (19.1%) |
Technology Access in Eastport
Computing Device Access in Eastport
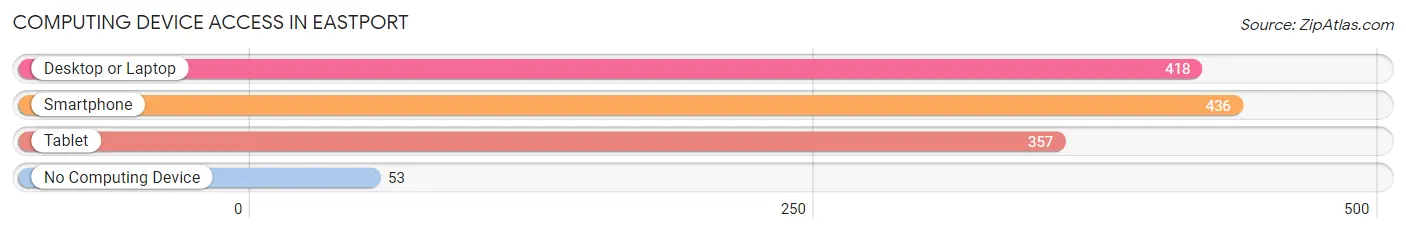
| Device Type | # Households | % Households |
| Desktop or Laptop | 418 | 68.3% |
| Smartphone | 436 | 71.2% |
| Tablet | 357 | 58.3% |
| No Computing Device | 53 | 8.7% |
| Total | 612 | 100.0% |
Internet Access in Eastport
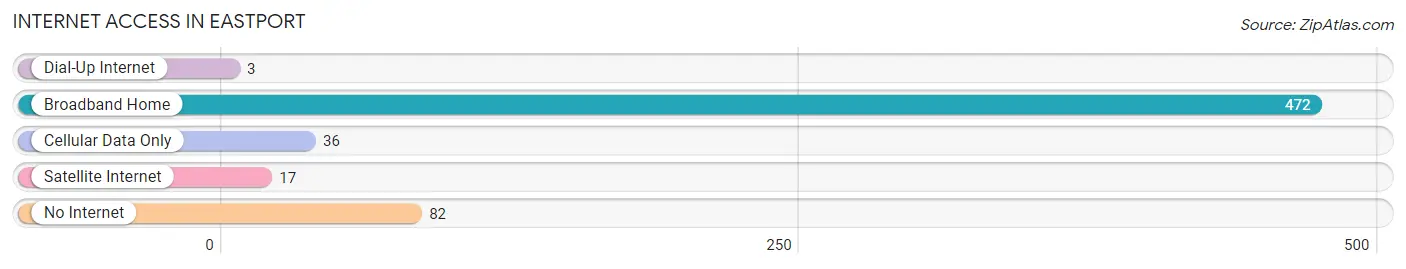
| Internet Type | # Households | % Households |
| Dial-Up Internet | 3 | 0.5% |
| Broadband Home | 472 | 77.1% |
| Cellular Data Only | 36 | 5.9% |
| Satellite Internet | 17 | 2.8% |
| No Internet | 82 | 13.4% |
| Total | 612 | 100.0% |
Eastport Summary
Eastport, Maine is a small city located in Washington County, Maine. It is situated on the easternmost point of the United States, and is the easternmost city in the contiguous United States. Eastport is a small city with a population of 1,331 as of the 2010 census.
History
Eastport was first settled in 1772 by a group of settlers from Massachusetts. The settlement was originally called Moose Island, and was part of the Passamaquoddy Bay area. The settlement was renamed Eastport in 1807, and was incorporated as a city in 1811.
Eastport was an important port for the lumber and fishing industries in the 19th century. The city was also a major shipbuilding center, and was home to several shipyards. The city was also a major center for the sardine industry, and was home to several canneries.
Eastport was also an important port during the War of 1812. The city was the site of a major naval battle between the British and American forces in 1814. The British were victorious in the battle, and Eastport was occupied by the British until the end of the war.
Geography
Eastport is located on the easternmost point of the United States, at the mouth of the Passamaquoddy Bay. The city is situated on Moose Island, which is connected to the mainland by a causeway. The city is surrounded by the waters of the bay, and is bordered by the towns of Perry, Pembroke, and Lubec.
Eastport has a total area of 4.2 square miles, of which 3.9 square miles is land and 0.3 square miles is water. The city is located at an elevation of 33 feet above sea level.
Economy
Eastport’s economy is largely based on fishing and tourism. The city is home to several seafood processing plants, and is a major center for the lobster industry. The city is also home to several marinas, and is a popular destination for recreational boaters.
Tourism is also an important part of the city’s economy. Eastport is home to several historic sites, including the Eastport Historic District, which is listed on the National Register of Historic Places. The city is also home to several museums, including the Eastport Maritime Museum and the Eastport Arts Center.
Demographics
As of the 2010 census, Eastport had a population of 1,331. The racial makeup of the city was 97.2% White, 0.2% African American, 0.2% Native American, 0.7% Asian, 0.2% from other races, and 1.7% from two or more races. Hispanic or Latino of any race were 0.9% of the population.
The median income for a household in Eastport was $35,938, and the median income for a family was $41,250. The per capita income for the city was $19,945. About 16.2% of the population was below the poverty line.
Common Questions
What is the Total Population of Eastport?
Total Population of Eastport is 1,211.
What is the Total Male Population of Eastport?
Total Male Population of Eastport is 531.
What is the Total Female Population of Eastport?
Total Female Population of Eastport is 680.
What is the Ratio of Males per 100 Females in Eastport?
There are 78.09 Males per 100 Females in Eastport.
What is the Ratio of Females per 100 Males in Eastport?
There are 128.06 Females per 100 Males in Eastport.
What is the Median Population Age in Eastport?
Median Population Age in Eastport is 63.9 Years.
What is the Average Family Size in Eastport
Average Family Size in Eastport is 2.5 People.
What is the Average Household Size in Eastport
Average Household Size in Eastport is 1.9 People.
What is Per Capita Income in Eastport?
Per Capita income in Eastport is $34,609.
What is the Median Family Income in Eastport?
Median Family Income in Eastport is $83,289.
What is the Median Household income in Eastport?
Median Household Income in Eastport is $44,919.
What is Income or Wage Gap in Eastport?
Income or Wage Gap in Eastport is 18.7%.
Women in Eastport earn 81.3 cents for every dollar earned by a man.
What is Inequality or Gini Index in Eastport?
Inequality or Gini Index in Eastport is 0.46.
How Large is the Labor Force in Eastport?
There are 475 People in the Labor Forcein in Eastport.
What is the Percentage of People in the Labor Force in Eastport?
43.8% of People are in the Labor Force in Eastport.
What is the Unemployment Rate in Eastport?
Unemployment Rate in Eastport is 2.8%.