Cities with the Highest Percentage of Households Heated by Electricity in Maryland
RELATED REPORTS & OPTIONS
Electrical Heating
Maryland
Compare Cities
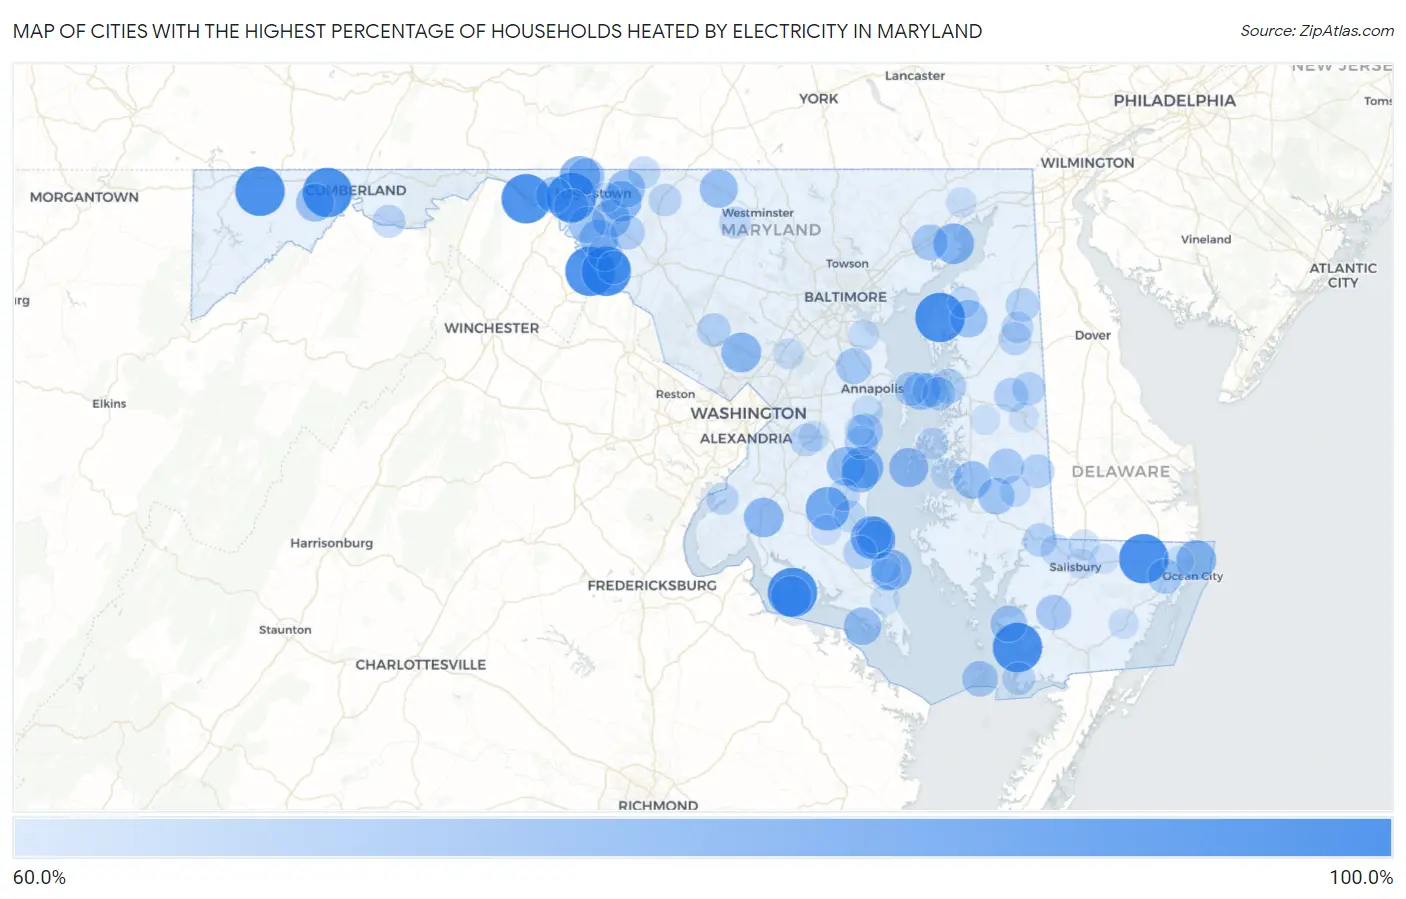
Map of Cities with the Highest Percentage of Households Heated by Electricity in Maryland
0.0%
100.0%
Cities with the Highest Percentage of Households Heated by Electricity in Maryland
| City | Electrical Heating | vs State | vs National | |
| 1. | Chesapeake Landing | 100.0% | 43.1%(+56.9)#1 | 40.2%(+59.8)#81 |
| 2. | Dargan | 100.0% | 43.1%(+56.9)#2 | 40.2%(+59.8)#212 |
| 3. | Whaleyville | 100.0% | 43.1%(+56.9)#3 | 40.2%(+59.8)#299 |
| 4. | Rock Point | 100.0% | 43.1%(+56.9)#4 | 40.2%(+59.8)#334 |
| 5. | Georgetown | 100.0% | 43.1%(+56.9)#5 | 40.2%(+59.8)#416 |
| 6. | Big Pool | 100.0% | 43.1%(+56.9)#6 | 40.2%(+59.8)#444 |
| 7. | Kemps Mill | 100.0% | 43.1%(+56.9)#7 | 40.2%(+59.8)#480 |
| 8. | Clarysville | 100.0% | 43.1%(+56.9)#8 | 40.2%(+59.8)#552 |
| 9. | Brownsville | 100.0% | 43.1%(+56.9)#9 | 40.2%(+59.8)#558 |
| 10. | Jennings | 100.0% | 43.1%(+56.9)#10 | 40.2%(+59.8)#572 |
| 11. | Frenchtown Rumbly | 100.0% | 43.1%(+56.9)#11 | 40.2%(+59.8)#580 |
| 12. | Eagle Harbor | 88.9% | 43.1%(+45.8)#12 | 40.2%(+48.7)#2,116 |
| 13. | St Leonard | 88.5% | 43.1%(+45.4)#13 | 40.2%(+48.3)#2,176 |
| 14. | North Beach | 84.9% | 43.1%(+41.8)#14 | 40.2%(+44.7)#2,693 |
| 15. | Aberdeen Proving Ground | 83.3% | 43.1%(+40.2)#15 | 40.2%(+43.1)#2,932 |
| 16. | Cobb Island | 83.3% | 43.1%(+40.2)#16 | 40.2%(+43.1)#2,939 |
| 17. | Cearfoss | 83.2% | 43.1%(+40.1)#17 | 40.2%(+43.0)#2,959 |
| 18. | Chesapeake Ranch Estates | 83.1% | 43.1%(+40.0)#18 | 40.2%(+42.9)#2,960 |
| 19. | Jugtown | 82.9% | 43.1%(+39.8)#19 | 40.2%(+42.7)#3,001 |
| 20. | Ocean City | 82.0% | 43.1%(+38.9)#20 | 40.2%(+41.8)#3,118 |
| 21. | Leisure World | 81.9% | 43.1%(+38.8)#21 | 40.2%(+41.7)#3,133 |
| 22. | La Plata | 81.4% | 43.1%(+38.3)#22 | 40.2%(+41.2)#3,207 |
| 23. | Tilghman Island | 80.8% | 43.1%(+37.7)#23 | 40.2%(+40.6)#3,312 |
| 24. | Owings | 80.2% | 43.1%(+37.1)#24 | 40.2%(+40.0)#3,396 |
| 25. | Keedysville | 79.3% | 43.1%(+36.2)#25 | 40.2%(+39.1)#3,551 |
| 26. | San Mar | 78.8% | 43.1%(+35.7)#26 | 40.2%(+38.6)#3,628 |
| 27. | Long Beach | 78.7% | 43.1%(+35.6)#27 | 40.2%(+38.5)#3,636 |
| 28. | National | 78.6% | 43.1%(+35.5)#28 | 40.2%(+38.4)#3,660 |
| 29. | Taneytown | 78.5% | 43.1%(+35.4)#29 | 40.2%(+38.3)#3,664 |
| 30. | Smithsburg | 78.0% | 43.1%(+34.9)#30 | 40.2%(+37.8)#3,733 |
| 31. | Chesapeake Beach | 77.8% | 43.1%(+34.7)#31 | 40.2%(+37.6)#3,758 |
| 32. | Callaway | 77.8% | 43.1%(+34.7)#32 | 40.2%(+37.6)#3,764 |
| 33. | Trappe | 77.8% | 43.1%(+34.7)#33 | 40.2%(+37.6)#3,766 |
| 34. | Tall Timbers | 77.7% | 43.1%(+34.6)#34 | 40.2%(+37.5)#3,793 |
| 35. | Chester | 77.5% | 43.1%(+34.4)#35 | 40.2%(+37.3)#3,821 |
| 36. | Chestertown | 77.4% | 43.1%(+34.3)#36 | 40.2%(+37.2)#3,836 |
| 37. | Fairplay | 76.1% | 43.1%(+33.0)#37 | 40.2%(+35.9)#4,045 |
| 38. | Calvert Beach | 75.8% | 43.1%(+32.7)#38 | 40.2%(+35.6)#4,089 |
| 39. | Dames Quarter | 75.8% | 43.1%(+32.7)#39 | 40.2%(+35.6)#4,096 |
| 40. | Maugansville | 75.7% | 43.1%(+32.6)#40 | 40.2%(+35.5)#4,106 |
| 41. | Secretary | 75.7% | 43.1%(+32.6)#41 | 40.2%(+35.5)#4,115 |
| 42. | Romancoke | 75.0% | 43.1%(+31.9)#42 | 40.2%(+34.8)#4,201 |
| 43. | Charlton | 75.0% | 43.1%(+31.9)#43 | 40.2%(+34.8)#4,209 |
| 44. | Riverside | 74.7% | 43.1%(+31.6)#44 | 40.2%(+34.5)#4,251 |
| 45. | Herald Harbor | 74.5% | 43.1%(+31.4)#45 | 40.2%(+34.3)#4,279 |
| 46. | Smith Island | 74.3% | 43.1%(+31.2)#46 | 40.2%(+34.1)#4,334 |
| 47. | Preston | 73.8% | 43.1%(+30.7)#47 | 40.2%(+33.6)#4,409 |
| 48. | Princess Anne | 73.7% | 43.1%(+30.6)#48 | 40.2%(+33.5)#4,416 |
| 49. | Shady Side | 73.6% | 43.1%(+30.5)#49 | 40.2%(+33.4)#4,427 |
| 50. | Berlin | 72.8% | 43.1%(+29.7)#50 | 40.2%(+32.6)#4,550 |
| 51. | Rohrersville | 72.7% | 43.1%(+29.6)#51 | 40.2%(+32.5)#4,580 |
| 52. | Queenstown | 72.5% | 43.1%(+29.4)#52 | 40.2%(+32.3)#4,601 |
| 53. | Kent Narrows | 72.4% | 43.1%(+29.3)#53 | 40.2%(+32.2)#4,621 |
| 54. | Williamsport | 72.3% | 43.1%(+29.2)#54 | 40.2%(+32.1)#4,638 |
| 55. | Myersville | 71.9% | 43.1%(+28.8)#55 | 40.2%(+31.7)#4,714 |
| 56. | Stevensville | 71.6% | 43.1%(+28.5)#56 | 40.2%(+31.4)#4,754 |
| 57. | Ridgely | 71.5% | 43.1%(+28.4)#57 | 40.2%(+31.3)#4,770 |
| 58. | Federalsburg | 70.8% | 43.1%(+27.7)#58 | 40.2%(+30.6)#4,888 |
| 59. | Broomes Island | 70.8% | 43.1%(+27.7)#59 | 40.2%(+30.6)#4,893 |
| 60. | Deale | 70.7% | 43.1%(+27.6)#60 | 40.2%(+30.5)#4,899 |
| 61. | Millington | 70.6% | 43.1%(+27.5)#61 | 40.2%(+30.4)#4,929 |
| 62. | Montgomery Village | 70.5% | 43.1%(+27.4)#62 | 40.2%(+30.3)#4,937 |
| 63. | Grasonville | 70.5% | 43.1%(+27.4)#63 | 40.2%(+30.3)#4,942 |
| 64. | Mardela Springs | 70.4% | 43.1%(+27.3)#64 | 40.2%(+30.2)#4,969 |
| 65. | Greensboro | 70.1% | 43.1%(+27.0)#65 | 40.2%(+29.9)#5,003 |
| 66. | Burkittsville | 70.0% | 43.1%(+26.9)#66 | 40.2%(+29.8)#5,032 |
| 67. | Barclay | 69.7% | 43.1%(+26.6)#67 | 40.2%(+29.5)#5,090 |
| 68. | Crisfield | 69.4% | 43.1%(+26.3)#68 | 40.2%(+29.2)#5,126 |
| 69. | Oldtown | 69.4% | 43.1%(+26.3)#69 | 40.2%(+29.2)#5,134 |
| 70. | Queensland | 69.1% | 43.1%(+26.0)#70 | 40.2%(+28.9)#5,175 |
| 71. | Thurmont | 68.8% | 43.1%(+25.7)#71 | 40.2%(+28.6)#5,223 |
| 72. | Highfield Cascade | 68.2% | 43.1%(+25.1)#72 | 40.2%(+28.0)#5,344 |
| 73. | Indian Head | 68.0% | 43.1%(+24.9)#73 | 40.2%(+27.8)#5,373 |
| 74. | Prince Frederick | 67.8% | 43.1%(+24.7)#74 | 40.2%(+27.6)#5,413 |
| 75. | New Windsor | 67.7% | 43.1%(+24.6)#75 | 40.2%(+27.5)#5,434 |
| 76. | St Michaels | 67.5% | 43.1%(+24.4)#76 | 40.2%(+27.3)#5,473 |
| 77. | Sudlersville | 67.5% | 43.1%(+24.4)#77 | 40.2%(+27.3)#5,481 |
| 78. | Huntingtown | 67.4% | 43.1%(+24.3)#78 | 40.2%(+27.2)#5,494 |
| 79. | Drum Point | 67.3% | 43.1%(+24.2)#79 | 40.2%(+27.1)#5,519 |
| 80. | Worton | 67.2% | 43.1%(+24.1)#80 | 40.2%(+27.0)#5,552 |
| 81. | Hurlock | 66.9% | 43.1%(+23.8)#81 | 40.2%(+26.7)#5,585 |
| 82. | Hebron | 66.9% | 43.1%(+23.8)#82 | 40.2%(+26.7)#5,591 |
| 83. | Mayo | 66.3% | 43.1%(+23.2)#83 | 40.2%(+26.1)#5,714 |
| 84. | Delmar | 66.0% | 43.1%(+22.9)#84 | 40.2%(+25.8)#5,767 |
| 85. | Oxford | 66.0% | 43.1%(+22.9)#85 | 40.2%(+25.8)#5,777 |
| 86. | Laurel | 65.7% | 43.1%(+22.6)#86 | 40.2%(+25.5)#5,824 |
| 87. | Riviera Beach | 65.7% | 43.1%(+22.6)#87 | 40.2%(+25.5)#5,827 |
| 88. | Upper Marlboro | 65.5% | 43.1%(+22.4)#88 | 40.2%(+25.3)#5,874 |
| 89. | Galesville | 65.3% | 43.1%(+22.2)#89 | 40.2%(+25.1)#5,909 |
| 90. | Ocean Pines | 65.1% | 43.1%(+22.0)#90 | 40.2%(+24.9)#5,941 |
| 91. | Lusby | 65.0% | 43.1%(+21.9)#91 | 40.2%(+24.8)#5,966 |
| 92. | Salisbury | 64.9% | 43.1%(+21.8)#92 | 40.2%(+24.7)#5,974 |
| 93. | Golden Beach | 64.9% | 43.1%(+21.8)#93 | 40.2%(+24.7)#5,979 |
| 94. | Snow Hill | 64.9% | 43.1%(+21.8)#94 | 40.2%(+24.7)#5,983 |
| 95. | Port Deposit | 64.9% | 43.1%(+21.8)#95 | 40.2%(+24.7)#5,989 |
| 96. | Robinwood | 64.6% | 43.1%(+21.5)#96 | 40.2%(+24.4)#6,026 |
| 97. | Cordova | 64.3% | 43.1%(+21.2)#97 | 40.2%(+24.1)#6,095 |
| 98. | Denton | 64.2% | 43.1%(+21.1)#98 | 40.2%(+24.0)#6,104 |
| 99. | Lexington Park | 64.1% | 43.1%(+21.0)#99 | 40.2%(+23.9)#6,117 |
| 100. | Parsonsburg | 64.1% | 43.1%(+21.0)#100 | 40.2%(+23.9)#6,133 |
Common Questions
What are the Top 10 Cities with the Highest Percentage of Households Heated by Electricity in Maryland?
Top 10 Cities with the Highest Percentage of Households Heated by Electricity in Maryland are:
#1
100.0%
#2
100.0%
#3
100.0%
#4
100.0%
#5
100.0%
#6
100.0%
#7
100.0%
#8
100.0%
#9
100.0%
#10
100.0%
What city has the Highest Percentage of Households Heated by Electricity in Maryland?
Dargan has the Highest Percentage of Households Heated by Electricity in Maryland with 100.0%.
What is the Percentage of Households Heated by Electricity in the State of Maryland?
Percentage of Households Heated by Electricity in Maryland is 43.1%.
What is the Percentage of Households Heated by Electricity in the United States?
Percentage of Households Heated by Electricity in the United States is 40.2%.