Cities with the Highest Percentage of White / Caucasian Population in Massachusetts
RELATED REPORTS & OPTIONS
White / Caucasian
Massachusetts
Compare Cities
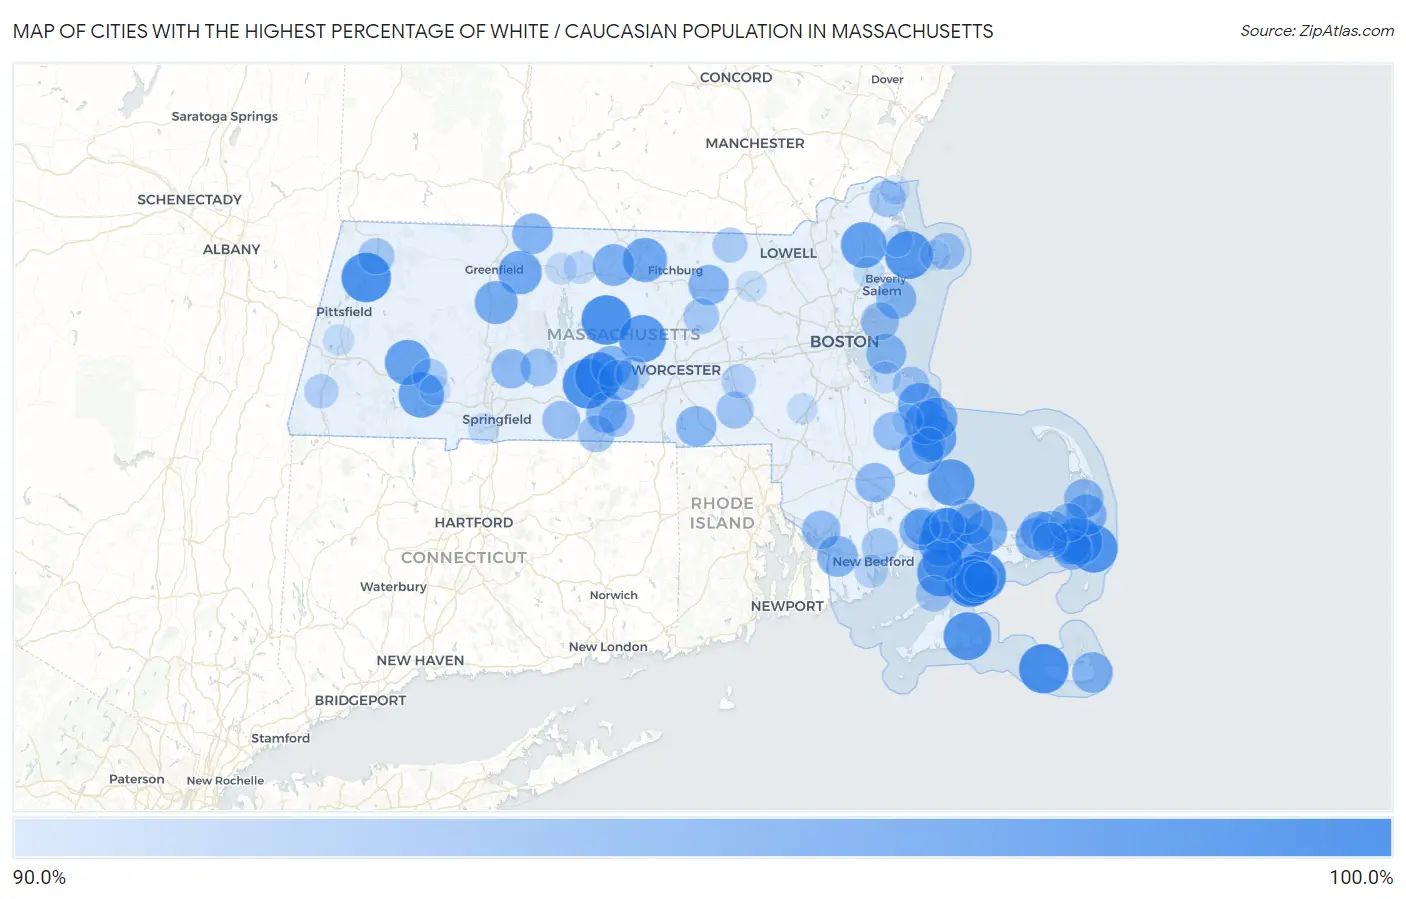
Map of Cities with the Highest Percentage of White / Caucasian Population in Massachusetts
0.0%
100.0%
Cities with the Highest Percentage of White / Caucasian Population in Massachusetts
| City | White / Caucasian | vs State | vs National | |
| 1. | Green Harbor | 100.0% | 72.7%(+27.3)#1 | 65.9%(+34.1)#41 |
| 2. | Barre | 100.0% | 72.7%(+27.3)#2 | 65.9%(+34.1)#215 |
| 3. | Warren | 100.0% | 72.7%(+27.3)#3 | 65.9%(+34.1)#236 |
| 4. | Cheshire | 100.0% | 72.7%(+27.3)#4 | 65.9%(+34.1)#247 |
| 5. | Madaket | 100.0% | 72.7%(+27.3)#5 | 65.9%(+34.1)#591 |
| 6. | Lenox Dale | 100.0% | 72.7%(+27.3)#6 | 65.9%(+34.1)#784 |
| 7. | Seconsett Island | 100.0% | 72.7%(+27.3)#7 | 65.9%(+34.1)#1,488 |
| 8. | Monomoscoy Island | 100.0% | 72.7%(+27.3)#8 | 65.9%(+34.1)#1,611 |
| 9. | Popponesset Island | 100.0% | 72.7%(+27.3)#9 | 65.9%(+34.1)#2,257 |
| 10. | Bourne | 99.8% | 72.7%(+27.1)#10 | 65.9%(+33.9)#3,583 |
| 11. | Cedar Crest | 99.4% | 72.7%(+26.7)#11 | 65.9%(+33.5)#3,800 |
| 12. | West Falmouth | 99.3% | 72.7%(+26.6)#12 | 65.9%(+33.4)#3,904 |
| 13. | Edgartown | 99.2% | 72.7%(+26.5)#13 | 65.9%(+33.3)#3,987 |
| 14. | West Brookfield | 99.2% | 72.7%(+26.5)#14 | 65.9%(+33.3)#4,011 |
| 15. | Essex | 99.1% | 72.7%(+26.5)#15 | 65.9%(+33.3)#4,016 |
| 16. | Chatham | 99.1% | 72.7%(+26.5)#16 | 65.9%(+33.3)#4,021 |
| 17. | East Harwich | 99.0% | 72.7%(+26.4)#17 | 65.9%(+33.2)#4,122 |
| 18. | Rutland | 98.9% | 72.7%(+26.2)#18 | 65.9%(+33.0)#4,275 |
| 19. | The Pinehills | 98.6% | 72.7%(+25.9)#19 | 65.9%(+32.7)#4,587 |
| 20. | Boxford | 98.1% | 72.7%(+25.4)#20 | 65.9%(+32.2)#5,027 |
| 21. | Blandford | 98.0% | 72.7%(+25.3)#21 | 65.9%(+32.1)#5,170 |
| 22. | Chester | 98.0% | 72.7%(+25.3)#22 | 65.9%(+32.1)#5,177 |
| 23. | Duxbury | 98.0% | 72.7%(+25.3)#23 | 65.9%(+32.1)#5,213 |
| 24. | Pocasset | 97.9% | 72.7%(+25.2)#24 | 65.9%(+32.0)#5,263 |
| 25. | Forestdale | 97.8% | 72.7%(+25.1)#25 | 65.9%(+31.9)#5,390 |
| 26. | Kingston | 97.6% | 72.7%(+24.9)#26 | 65.9%(+31.7)#5,653 |
| 27. | South Ashburnham | 97.3% | 72.7%(+24.7)#27 | 65.9%(+31.5)#5,928 |
| 28. | Marshfield Hills | 97.3% | 72.7%(+24.6)#28 | 65.9%(+31.4)#5,943 |
| 29. | Marshfield | 97.1% | 72.7%(+24.5)#29 | 65.9%(+31.2)#6,183 |
| 30. | Millers Falls | 97.1% | 72.7%(+24.4)#30 | 65.9%(+31.2)#6,234 |
| 31. | Seabrook | 96.8% | 72.7%(+24.1)#31 | 65.9%(+30.9)#6,542 |
| 32. | South Deerfield | 96.8% | 72.7%(+24.1)#32 | 65.9%(+30.9)#6,576 |
| 33. | Ocean Bluff Brant Rock | 96.5% | 72.7%(+23.9)#33 | 65.9%(+30.6)#6,889 |
| 34. | West Warren | 96.4% | 72.7%(+23.7)#34 | 65.9%(+30.5)#7,090 |
| 35. | New Seabury | 96.3% | 72.7%(+23.7)#35 | 65.9%(+30.5)#7,116 |
| 36. | East Sandwich | 96.2% | 72.7%(+23.5)#36 | 65.9%(+30.3)#7,278 |
| 37. | Baldwinville | 96.2% | 72.7%(+23.5)#37 | 65.9%(+30.3)#7,338 |
| 38. | Yarmouth Port | 96.1% | 72.7%(+23.5)#38 | 65.9%(+30.3)#7,340 |
| 39. | Harwich Center | 96.0% | 72.7%(+23.3)#39 | 65.9%(+30.1)#7,529 |
| 40. | Weweantic | 95.8% | 72.7%(+23.1)#40 | 65.9%(+29.9)#7,775 |
| 41. | North Falmouth | 95.8% | 72.7%(+23.1)#41 | 65.9%(+29.9)#7,800 |
| 42. | Orleans | 95.7% | 72.7%(+23.1)#42 | 65.9%(+29.9)#7,850 |
| 43. | North Brookfield | 95.7% | 72.7%(+23.1)#43 | 65.9%(+29.9)#7,853 |
| 44. | North Westport | 95.7% | 72.7%(+23.0)#44 | 65.9%(+29.8)#7,877 |
| 45. | East Dennis | 95.7% | 72.7%(+23.0)#45 | 65.9%(+29.8)#7,926 |
| 46. | Siasconset | 95.7% | 72.7%(+23.0)#46 | 65.9%(+29.8)#7,940 |
| 47. | Fiskdale | 95.6% | 72.7%(+23.0)#47 | 65.9%(+29.8)#7,942 |
| 48. | Northfield | 95.6% | 72.7%(+22.9)#48 | 65.9%(+29.7)#8,008 |
| 49. | Sandwich | 95.6% | 72.7%(+22.9)#49 | 65.9%(+29.7)#8,047 |
| 50. | Shirley | 95.5% | 72.7%(+22.8)#50 | 65.9%(+29.6)#8,120 |
| 51. | East Douglas | 95.5% | 72.7%(+22.8)#51 | 65.9%(+29.6)#8,171 |
| 52. | East Brookfield | 95.5% | 72.7%(+22.8)#52 | 65.9%(+29.6)#8,180 |
| 53. | Marblehead | 95.4% | 72.7%(+22.7)#53 | 65.9%(+29.5)#8,275 |
| 54. | Hull | 95.3% | 72.7%(+22.6)#54 | 65.9%(+29.4)#8,381 |
| 55. | Dennis | 95.3% | 72.7%(+22.6)#55 | 65.9%(+29.4)#8,432 |
| 56. | North Eastham | 95.1% | 72.7%(+22.4)#56 | 65.9%(+29.2)#8,638 |
| 57. | Harwich Port | 95.1% | 72.7%(+22.4)#57 | 65.9%(+29.2)#8,644 |
| 58. | Middleborough Center | 95.0% | 72.7%(+22.3)#58 | 65.9%(+29.1)#8,714 |
| 59. | Granby | 95.0% | 72.7%(+22.3)#59 | 65.9%(+29.1)#8,750 |
| 60. | Somerset | 94.7% | 72.7%(+22.0)#60 | 65.9%(+28.8)#9,125 |
| 61. | Brewster | 94.5% | 72.7%(+21.9)#61 | 65.9%(+28.7)#9,305 |
| 62. | Hanson | 94.5% | 72.7%(+21.8)#62 | 65.9%(+28.6)#9,362 |
| 63. | Monson Center | 94.3% | 72.7%(+21.7)#63 | 65.9%(+28.4)#9,575 |
| 64. | Nahant | 94.3% | 72.7%(+21.6)#64 | 65.9%(+28.4)#9,598 |
| 65. | Wareham Center | 94.0% | 72.7%(+21.4)#65 | 65.9%(+28.2)#9,931 |
| 66. | Belchertown | 94.0% | 72.7%(+21.3)#66 | 65.9%(+28.1)#9,982 |
| 67. | Hopedale | 93.9% | 72.7%(+21.2)#67 | 65.9%(+28.0)#10,088 |
| 68. | Holland | 93.8% | 72.7%(+21.1)#68 | 65.9%(+27.9)#10,213 |
| 69. | North Scituate | 93.7% | 72.7%(+21.1)#69 | 65.9%(+27.8)#10,288 |
| 70. | Rockport | 93.7% | 72.7%(+21.0)#70 | 65.9%(+27.8)#10,310 |
| 71. | Newburyport | 93.7% | 72.7%(+21.0)#71 | 65.9%(+27.8)#10,331 |
| 72. | Acushnet Center | 93.5% | 72.7%(+20.8)#72 | 65.9%(+27.6)#10,537 |
| 73. | Adams | 93.5% | 72.7%(+20.8)#73 | 65.9%(+27.6)#10,547 |
| 74. | Sturbridge | 93.4% | 72.7%(+20.8)#74 | 65.9%(+27.6)#10,638 |
| 75. | Woods Hole | 93.3% | 72.7%(+20.7)#75 | 65.9%(+27.5)#10,728 |
| 76. | South Lancaster | 93.3% | 72.7%(+20.6)#76 | 65.9%(+27.4)#10,769 |
| 77. | Sagamore | 93.1% | 72.7%(+20.4)#77 | 65.9%(+27.2)#10,948 |
| 78. | South Dennis | 93.1% | 72.7%(+20.4)#78 | 65.9%(+27.2)#11,004 |
| 79. | Huntington | 92.9% | 72.7%(+20.3)#79 | 65.9%(+27.1)#11,150 |
| 80. | East Pepperell | 92.8% | 72.7%(+20.2)#80 | 65.9%(+27.0)#11,275 |
| 81. | South Duxbury | 92.8% | 72.7%(+20.1)#81 | 65.9%(+26.9)#11,307 |
| 82. | Buzzards Bay | 92.5% | 72.7%(+19.8)#82 | 65.9%(+26.6)#11,647 |
| 83. | Great Barrington | 92.5% | 72.7%(+19.8)#83 | 65.9%(+26.6)#11,672 |
| 84. | Hopkinton | 92.5% | 72.7%(+19.8)#84 | 65.9%(+26.6)#11,685 |
| 85. | Spencer | 92.5% | 72.7%(+19.8)#85 | 65.9%(+26.6)#11,705 |
| 86. | Popponesset | 92.3% | 72.7%(+19.7)#86 | 65.9%(+26.5)#11,822 |
| 87. | Bliss Corner | 92.0% | 72.7%(+19.4)#87 | 65.9%(+26.2)#12,163 |
| 88. | Athol | 91.7% | 72.7%(+19.0)#88 | 65.9%(+25.8)#12,527 |
| 89. | Hingham | 91.6% | 72.7%(+18.9)#89 | 65.9%(+25.7)#12,623 |
| 90. | Orange | 91.3% | 72.7%(+18.6)#90 | 65.9%(+25.4)#12,858 |
| 91. | Agawam Town | 91.3% | 72.7%(+18.6)#91 | 65.9%(+25.4)#12,915 |
| 92. | Lenox | 91.1% | 72.7%(+18.4)#92 | 65.9%(+25.2)#13,073 |
| 93. | North Pembroke | 91.0% | 72.7%(+18.4)#93 | 65.9%(+25.1)#13,163 |
| 94. | Ipswich | 91.0% | 72.7%(+18.3)#94 | 65.9%(+25.1)#13,178 |
| 95. | Danvers | 91.0% | 72.7%(+18.3)#95 | 65.9%(+25.1)#13,227 |
| 96. | Littleton Common | 90.9% | 72.7%(+18.3)#96 | 65.9%(+25.1)#13,253 |
| 97. | Russell | 90.9% | 72.7%(+18.3)#97 | 65.9%(+25.0)#13,269 |
| 98. | Gloucester | 90.9% | 72.7%(+18.2)#98 | 65.9%(+25.0)#13,276 |
| 99. | Walpole | 90.9% | 72.7%(+18.2)#99 | 65.9%(+25.0)#13,278 |
| 100. | Salisbury | 90.5% | 72.7%(+17.8)#100 | 65.9%(+24.6)#13,658 |
Common Questions
What are the Top 10 Cities with the Highest Percentage of White / Caucasian Population in Massachusetts?
Top 10 Cities with the Highest Percentage of White / Caucasian Population in Massachusetts are:
#1
100.0%
#2
100.0%
#3
100.0%
#4
100.0%
#5
100.0%
#6
100.0%
#7
100.0%
#8
99.8%
#9
99.3%
#10
99.2%
What city has the Highest Percentage of White / Caucasian Population in Massachusetts?
Barre has the Highest Percentage of White / Caucasian Population in Massachusetts with 100.0%.
What is the Percentage of White / Caucasian Population in the State of Massachusetts?
Percentage of White / Caucasian Population in Massachusetts is 72.7%.
What is the Percentage of White / Caucasian Population in the United States?
Percentage of White / Caucasian Population in the United States is 65.9%.