Zip Codes with the Highest Percentage of Population Employed in Transportation & Warehousing in Kansas
RELATED REPORTS & OPTIONS
Transportation & Warehousing
Kansas
Compare Zip Codes
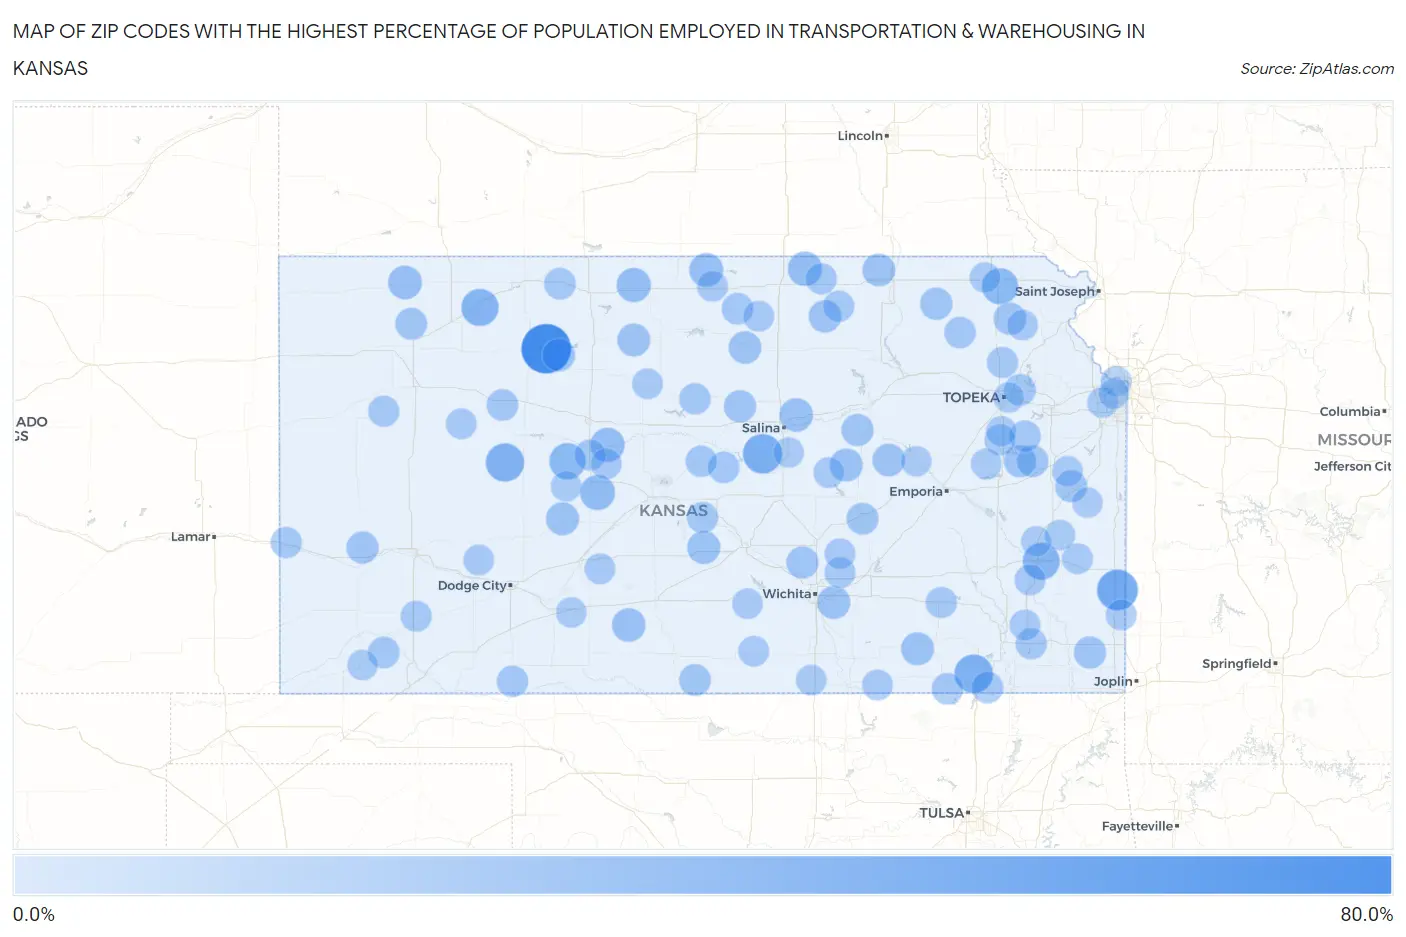
Map of Zip Codes with the Highest Percentage of Population Employed in Transportation & Warehousing in Kansas
0.0%
80.0%
Zip Codes with the Highest Percentage of Population Employed in Transportation & Warehousing in Kansas
| Zip Code | % Employed | vs State | vs National | |
| 1. | 67625 | 65.6% | 4.3%(+61.2)#1 | 4.9%(+60.6)#40 |
| 2. | 66741 | 39.1% | 4.3%(+34.8)#2 | 4.9%(+34.2)#134 |
| 3. | 67442 | 34.5% | 4.3%(+30.1)#3 | 4.9%(+29.5)#170 |
| 4. | 67347 | 32.6% | 4.3%(+28.2)#4 | 4.9%(+27.6)#193 |
| 5. | 67515 | 31.4% | 4.3%(+27.1)#5 | 4.9%(+26.5)#207 |
| 6. | 67643 | 28.2% | 4.3%(+23.8)#6 | 4.9%(+23.2)#267 |
| 7. | 66742 | 27.6% | 4.3%(+23.2)#7 | 4.9%(+22.6)#281 |
| 8. | 67556 | 25.6% | 4.3%(+21.3)#8 | 4.9%(+20.7)#320 |
| 9. | 66425 | 25.0% | 4.3%(+20.7)#9 | 4.9%(+20.1)#331 |
| 10. | 67575 | 21.7% | 4.3%(+17.3)#10 | 4.9%(+16.7)#449 |
| 11. | 66960 | 20.0% | 4.3%(+15.7)#11 | 4.9%(+15.1)#542 |
| 12. | 67660 | 20.0% | 4.3%(+15.7)#12 | 4.9%(+15.1)#544 |
| 13. | 66932 | 19.4% | 4.3%(+15.0)#13 | 4.9%(+14.4)#577 |
| 14. | 66936 | 18.5% | 4.3%(+14.1)#14 | 4.9%(+13.5)#639 |
| 15. | 67744 | 18.0% | 4.3%(+13.6)#15 | 4.9%(+13.0)#683 |
| 16. | 67470 | 17.5% | 4.3%(+13.1)#16 | 4.9%(+12.5)#724 |
| 17. | 67028 | 17.1% | 4.3%(+12.8)#17 | 4.9%(+12.1)#768 |
| 18. | 67568 | 16.1% | 4.3%(+11.7)#18 | 4.9%(+11.1)#896 |
| 19. | 67232 | 16.0% | 4.3%(+11.7)#19 | 4.9%(+11.1)#908 |
| 20. | 67523 | 15.9% | 4.3%(+11.6)#20 | 4.9%(+11.0)#917 |
| 21. | 67475 | 15.9% | 4.3%(+11.6)#21 | 4.9%(+11.0)#922 |
| 22. | 67346 | 15.9% | 4.3%(+11.5)#22 | 4.9%(+10.9)#928 |
| 23. | 67623 | 15.4% | 4.3%(+11.0)#23 | 4.9%(+10.4)#994 |
| 24. | 66873 | 15.0% | 4.3%(+10.7)#24 | 4.9%(+10.1)#1,065 |
| 25. | 67632 | 14.8% | 4.3%(+10.5)#25 | 4.9%(+9.87)#1,101 |
| 26. | 66412 | 14.8% | 4.3%(+10.4)#26 | 4.9%(+9.81)#1,111 |
| 27. | 67478 | 14.8% | 4.3%(+10.4)#27 | 4.9%(+9.81)#1,112 |
| 28. | 66937 | 14.7% | 4.3%(+10.4)#28 | 4.9%(+9.80)#1,113 |
| 29. | 66552 | 14.4% | 4.3%(+10.0)#29 | 4.9%(+9.43)#1,185 |
| 30. | 66544 | 14.2% | 4.3%(+9.85)#30 | 4.9%(+9.25)#1,242 |
| 31. | 67135 | 13.7% | 4.3%(+9.38)#31 | 4.9%(+8.77)#1,341 |
| 32. | 67860 | 13.7% | 4.3%(+9.37)#32 | 4.9%(+8.77)#1,342 |
| 33. | 67423 | 13.7% | 4.3%(+9.37)#33 | 4.9%(+8.77)#1,343 |
| 34. | 66782 | 13.6% | 4.3%(+9.22)#34 | 4.9%(+8.61)#1,378 |
| 35. | 67492 | 13.5% | 4.3%(+9.14)#35 | 4.9%(+8.54)#1,392 |
| 36. | 66528 | 13.4% | 4.3%(+9.01)#36 | 4.9%(+8.41)#1,429 |
| 37. | 66851 | 12.7% | 4.3%(+8.33)#37 | 4.9%(+7.73)#1,626 |
| 38. | 66042 | 12.5% | 4.3%(+8.16)#38 | 4.9%(+7.55)#1,674 |
| 39. | 67061 | 12.5% | 4.3%(+8.16)#39 | 4.9%(+7.55)#1,679 |
| 40. | 67734 | 12.5% | 4.3%(+8.16)#40 | 4.9%(+7.55)#1,683 |
| 41. | 66076 | 12.2% | 4.3%(+7.87)#41 | 4.9%(+7.26)#1,782 |
| 42. | 66963 | 12.1% | 4.3%(+7.75)#42 | 4.9%(+7.15)#1,811 |
| 43. | 66429 | 12.1% | 4.3%(+7.74)#43 | 4.9%(+7.13)#1,822 |
| 44. | 67664 | 12.1% | 4.3%(+7.73)#44 | 4.9%(+7.12)#1,831 |
| 45. | 67952 | 12.0% | 4.3%(+7.65)#45 | 4.9%(+7.04)#1,865 |
| 46. | 67364 | 11.8% | 4.3%(+7.50)#46 | 4.9%(+6.90)#1,924 |
| 47. | 66432 | 11.8% | 4.3%(+7.48)#47 | 4.9%(+6.88)#1,934 |
| 48. | 67631 | 11.8% | 4.3%(+7.42)#48 | 4.9%(+6.82)#1,971 |
| 49. | 67334 | 11.5% | 4.3%(+7.20)#49 | 4.9%(+6.59)#2,060 |
| 50. | 66524 | 11.4% | 4.3%(+7.10)#50 | 4.9%(+6.50)#2,095 |
| 51. | 67444 | 11.3% | 4.3%(+6.99)#51 | 4.9%(+6.38)#2,161 |
| 52. | 67459 | 11.2% | 4.3%(+6.87)#52 | 4.9%(+6.26)#2,225 |
| 53. | 67840 | 11.1% | 4.3%(+6.77)#53 | 4.9%(+6.16)#2,276 |
| 54. | 67481 | 11.1% | 4.3%(+6.72)#54 | 4.9%(+6.11)#2,298 |
| 55. | 67341 | 10.8% | 4.3%(+6.41)#55 | 4.9%(+5.81)#2,448 |
| 56. | 67836 | 10.7% | 4.3%(+6.37)#56 | 4.9%(+5.77)#2,470 |
| 57. | 67764 | 10.7% | 4.3%(+6.31)#57 | 4.9%(+5.70)#2,497 |
| 58. | 66944 | 10.6% | 4.3%(+6.23)#58 | 4.9%(+5.63)#2,536 |
| 59. | 67512 | 10.6% | 4.3%(+6.23)#59 | 4.9%(+5.63)#2,537 |
| 60. | 66953 | 10.5% | 4.3%(+6.15)#60 | 4.9%(+5.55)#2,590 |
| 61. | 67137 | 10.4% | 4.3%(+6.03)#61 | 4.9%(+5.43)#2,657 |
| 62. | 67877 | 10.3% | 4.3%(+5.95)#62 | 4.9%(+5.35)#2,710 |
| 63. | 66440 | 10.3% | 4.3%(+5.95)#63 | 4.9%(+5.34)#2,713 |
| 64. | 66537 | 10.0% | 4.3%(+5.71)#64 | 4.9%(+5.10)#2,850 |
| 65. | 67553 | 10.0% | 4.3%(+5.66)#65 | 4.9%(+5.05)#2,893 |
| 66. | 67017 | 9.8% | 4.3%(+5.49)#66 | 4.9%(+4.89)#2,998 |
| 67. | 66948 | 9.8% | 4.3%(+5.44)#67 | 4.9%(+4.84)#3,017 |
| 68. | 66956 | 9.7% | 4.3%(+5.38)#68 | 4.9%(+4.77)#3,058 |
| 69. | 66748 | 9.7% | 4.3%(+5.35)#69 | 4.9%(+4.74)#3,081 |
| 70. | 67154 | 9.7% | 4.3%(+5.32)#70 | 4.9%(+4.72)#3,105 |
| 71. | 66716 | 9.6% | 4.3%(+5.22)#71 | 4.9%(+4.62)#3,193 |
| 72. | 66756 | 9.5% | 4.3%(+5.19)#72 | 4.9%(+4.59)#3,210 |
| 73. | 67673 | 9.5% | 4.3%(+5.18)#73 | 4.9%(+4.58)#3,218 |
| 74. | 67520 | 9.4% | 4.3%(+5.11)#74 | 4.9%(+4.50)#3,276 |
| 75. | 67552 | 9.4% | 4.3%(+5.08)#75 | 4.9%(+4.47)#3,297 |
| 76. | 67483 | 9.4% | 4.3%(+5.05)#76 | 4.9%(+4.45)#3,323 |
| 77. | 66776 | 9.3% | 4.3%(+4.99)#77 | 4.9%(+4.38)#3,373 |
| 78. | 67736 | 9.3% | 4.3%(+4.94)#78 | 4.9%(+4.33)#3,420 |
| 79. | 67102 | 9.3% | 4.3%(+4.92)#79 | 4.9%(+4.31)#3,435 |
| 80. | 67835 | 9.2% | 4.3%(+4.87)#80 | 4.9%(+4.26)#3,471 |
| 81. | 67036 | 9.1% | 4.3%(+4.75)#81 | 4.9%(+4.14)#3,610 |
| 82. | 66079 | 9.1% | 4.3%(+4.72)#82 | 4.9%(+4.12)#3,633 |
| 83. | 66058 | 9.0% | 4.3%(+4.67)#83 | 4.9%(+4.06)#3,689 |
| 84. | 67111 | 9.0% | 4.3%(+4.67)#84 | 4.9%(+4.06)#3,690 |
| 85. | 67513 | 8.8% | 4.3%(+4.48)#85 | 4.9%(+3.88)#3,903 |
| 86. | 66523 | 8.8% | 4.3%(+4.47)#86 | 4.9%(+3.87)#3,911 |
| 87. | 66218 | 8.8% | 4.3%(+4.47)#87 | 4.9%(+3.87)#3,915 |
| 88. | 67109 | 8.8% | 4.3%(+4.47)#88 | 4.9%(+3.86)#3,917 |
| 89. | 67140 | 8.7% | 4.3%(+4.40)#89 | 4.9%(+3.80)#3,998 |
| 90. | 66104 | 8.7% | 4.3%(+4.33)#90 | 4.9%(+3.73)#4,076 |
| 91. | 66846 | 8.7% | 4.3%(+4.32)#91 | 4.9%(+3.71)#4,086 |
| 92. | 66039 | 8.6% | 4.3%(+4.24)#92 | 4.9%(+3.63)#4,175 |
| 93. | 66607 | 8.5% | 4.3%(+4.17)#93 | 4.9%(+3.57)#4,258 |
| 94. | 67951 | 8.4% | 4.3%(+4.09)#94 | 4.9%(+3.49)#4,342 |
| 95. | 66534 | 8.4% | 4.3%(+4.08)#95 | 4.9%(+3.48)#4,357 |
| 96. | 67416 | 8.4% | 4.3%(+4.01)#96 | 4.9%(+3.41)#4,442 |
| 97. | 66414 | 8.3% | 4.3%(+3.98)#97 | 4.9%(+3.37)#4,487 |
| 98. | 66106 | 8.3% | 4.3%(+3.95)#98 | 4.9%(+3.34)#4,526 |
| 99. | 66072 | 8.2% | 4.3%(+3.87)#99 | 4.9%(+3.27)#4,616 |
| 100. | 66015 | 8.2% | 4.3%(+3.85)#100 | 4.9%(+3.24)#4,649 |
Common Questions
What are the Top 10 Zip Codes with the Highest Percentage of Population Employed in Transportation & Warehousing in Kansas?
Top 10 Zip Codes with the Highest Percentage of Population Employed in Transportation & Warehousing in Kansas are:
What zip code has the Highest Percentage of Population Employed in Transportation & Warehousing in Kansas?
67625 has the Highest Percentage of Population Employed in Transportation & Warehousing in Kansas with 65.6%.
What is the Percentage of Population Employed in Transportation & Warehousing in the State of Kansas?
Percentage of Population Employed in Transportation & Warehousing in Kansas is 4.3%.
What is the Percentage of Population Employed in Transportation & Warehousing in the United States?
Percentage of Population Employed in Transportation & Warehousing in the United States is 4.9%.