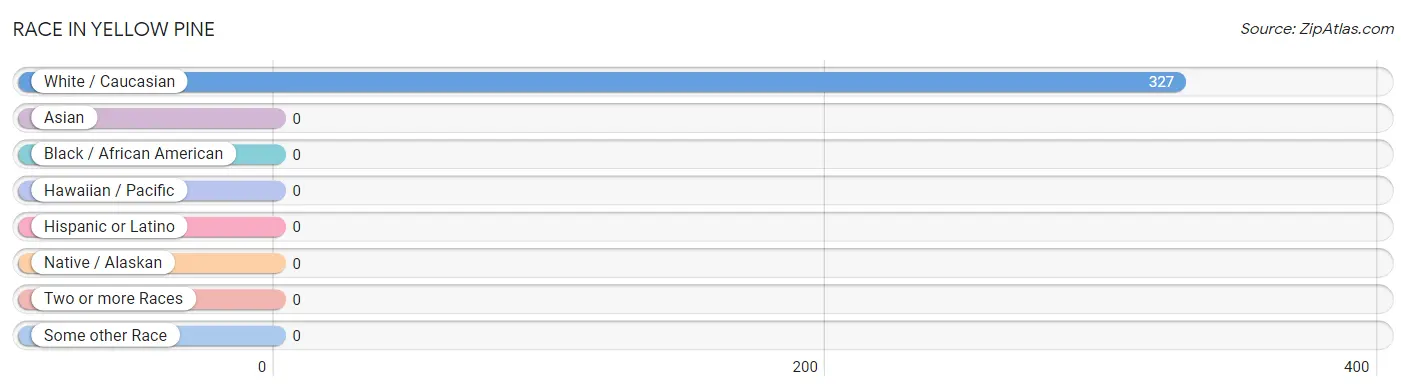
The most populous races in Yellow Pine are , and White / Caucasian (327 | 100.0%).
Race
# Population
% Population
Asian
0
0.0%
Black / African American
0
0.0%
Hawaiian / Pacific
0
0.0%
Hispanic or Latino
0
0.0%
Native / Alaskan
0
0.0%
White / Caucasian
327
100.0%
Two or more Races
0
0.0%
Some other Race
0
0.0%
Total
327
100.0%
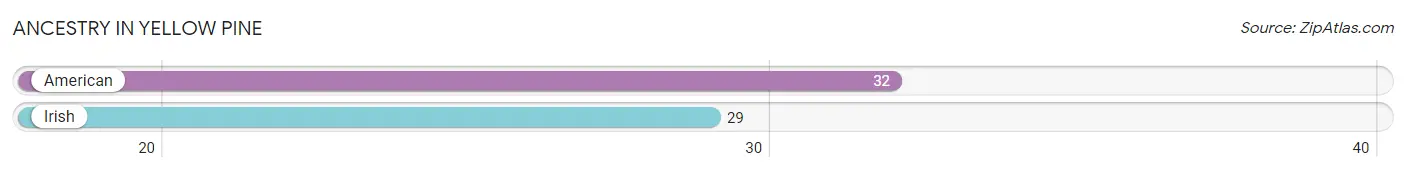
Ancestry in Yellow Pine
The most populous ancestries reported in Yellow Pine are American (32 | 9.8%), and Irish (29 | 8.9%), together accounting for 18.7% of all Yellow Pine residents.
Ancestry
# Population
% Population
American
32
9.8%
Irish
29
8.9%
View All 2 Rows
Immigrants in Yellow Pine
Immigration Origin
# Population
% Population
View All 0 Rows
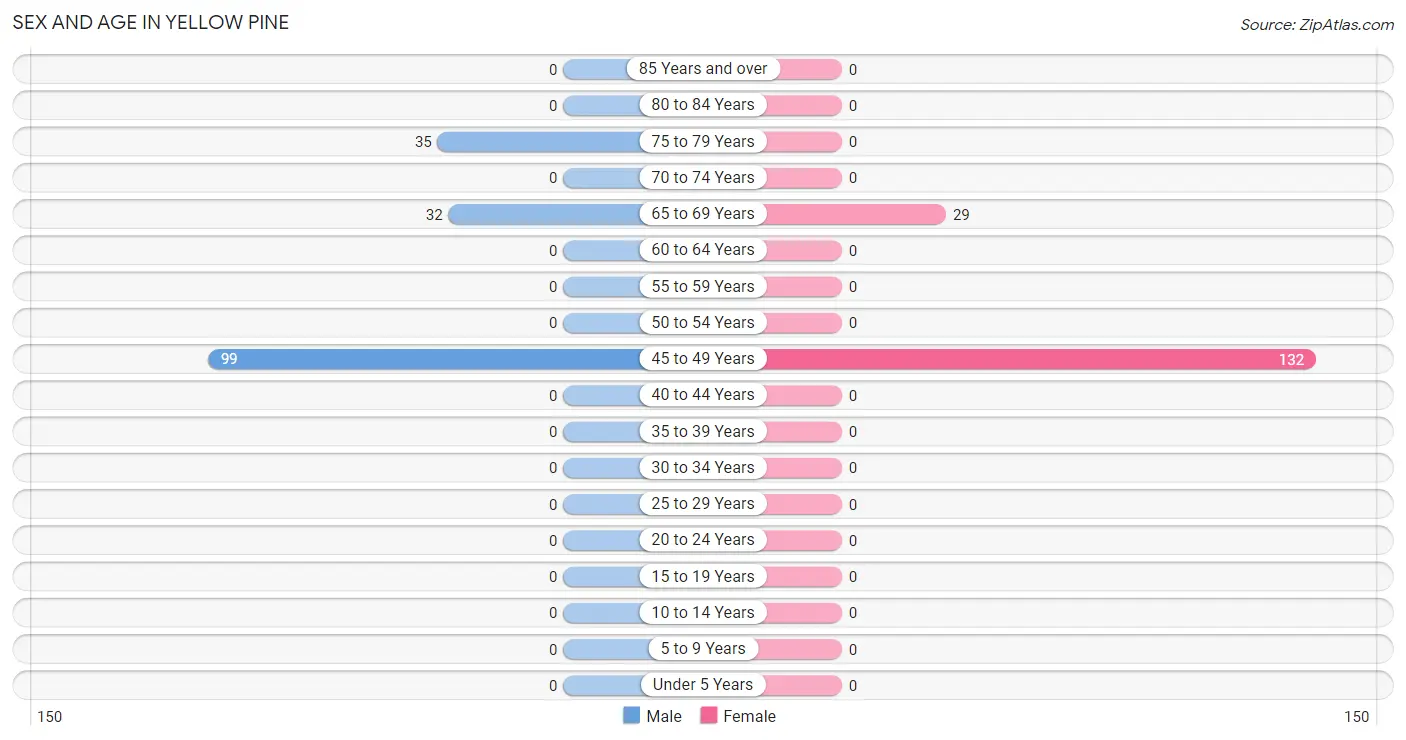
Sex and Age in Yellow Pine
Sex and Age in Yellow Pine
The most populous age groups in Yellow Pine are 45 to 49 Years (99 | 59.6%) for men and 45 to 49 Years (132 | 82.0%) for women.
Age Bracket
Male
Female
Under 5 Years
0 (0.0%)
0 (0.0%)
5 to 9 Years
0 (0.0%)
0 (0.0%)
10 to 14 Years
0 (0.0%)
0 (0.0%)
15 to 19 Years
0 (0.0%)
0 (0.0%)
20 to 24 Years
0 (0.0%)
0 (0.0%)
25 to 29 Years
0 (0.0%)
0 (0.0%)
30 to 34 Years
0 (0.0%)
0 (0.0%)
35 to 39 Years
0 (0.0%)
0 (0.0%)
40 to 44 Years
0 (0.0%)
0 (0.0%)
45 to 49 Years
99 (59.6%)
132 (82.0%)
50 to 54 Years
0 (0.0%)
0 (0.0%)
55 to 59 Years
0 (0.0%)
0 (0.0%)
60 to 64 Years
0 (0.0%)
0 (0.0%)
65 to 69 Years
32 (19.3%)
29 (18.0%)
70 to 74 Years
0 (0.0%)
0 (0.0%)
75 to 79 Years
35 (21.1%)
0 (0.0%)
80 to 84 Years
0 (0.0%)
0 (0.0%)
85 Years and over
0 (0.0%)
0 (0.0%)
Total
166 (100.0%)
161 (100.0%)
Families and Households in Yellow Pine
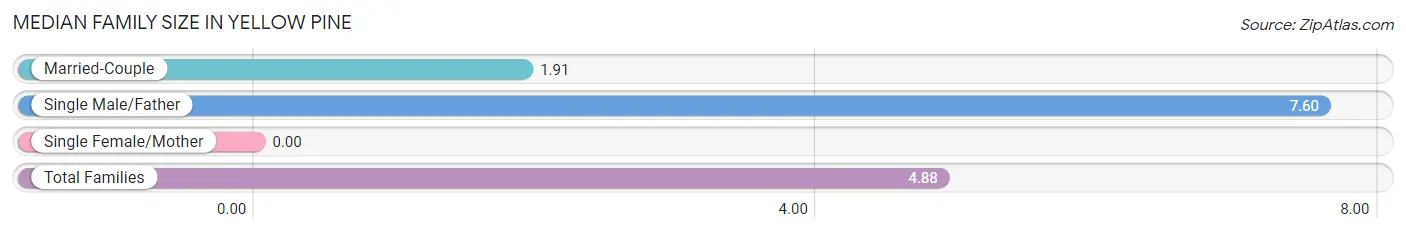
Median Family Size in Yellow Pine
Family Type
# Families
Family Size
Married-Couple
32 (47.8%)
1.91
Single Male/Father
35 (52.2%)
7.60
Single Female/Mother
0 (0.0%)
-
Total Families
67 (100.0%)
4.88
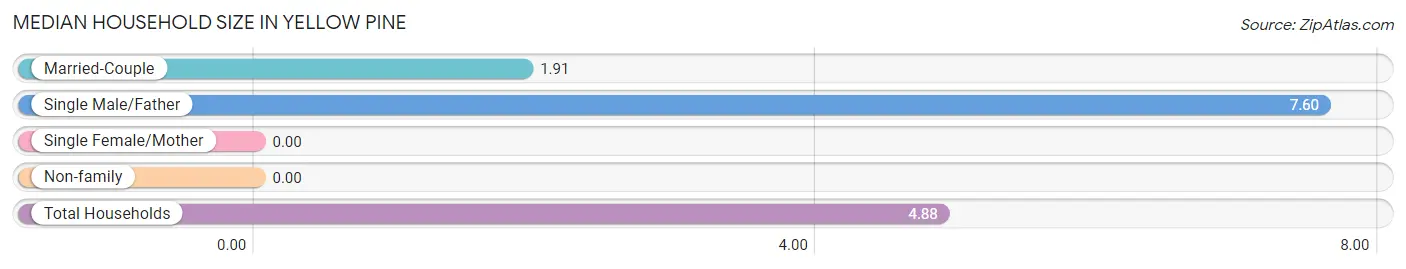
Median Household Size in Yellow Pine
Household Type
# Households
Household Size
Married-Couple
32 (47.8%)
1.91
Single Male/Father
35 (52.2%)
7.60
Single Female/Mother
0 (0.0%)
-
Non-family
0 (0.0%)
-
Total Households
67 (100.0%)
4.88
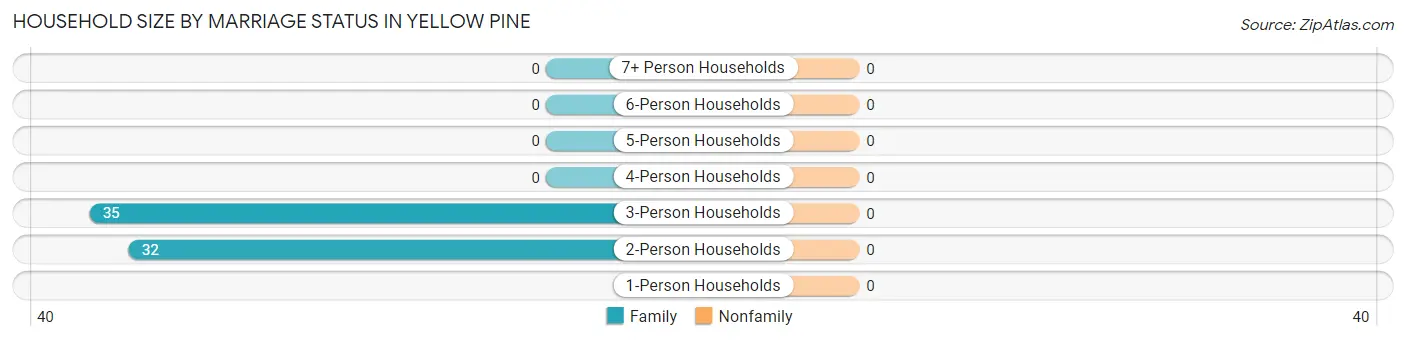
Household Size by Marriage Status in Yellow Pine
Household Size
Family Households
Nonfamily Households
1-Person Households
-
0 (0.0%)
2-Person Households
32 (47.8%)
0 (0.0%)
3-Person Households
35 (52.2%)
0 (0.0%)
4-Person Households
0 (0.0%)
0 (0.0%)
5-Person Households
0 (0.0%)
0 (0.0%)
6-Person Households
0 (0.0%)
0 (0.0%)
7+ Person Households
0 (0.0%)
0 (0.0%)
Total
67 (100.0%)
0 (0.0%)
Female Fertility in Yellow Pine
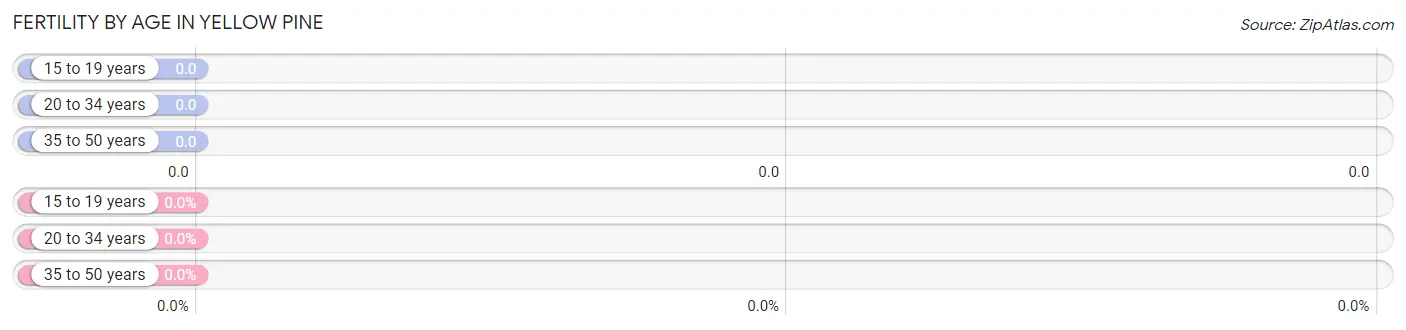
Fertility by Age in Yellow Pine
Age Bracket
Women with Births
Births / 1,000 Women
15 to 19 years
0 (0.0%)
0.0
20 to 34 years
0 (0.0%)
0.0
35 to 50 years
0 (0.0%)
0.0
Total
0 (0.0%)
0.0
Fertility by Age by Marriage Status in Yellow Pine
Age Bracket
Married
Unmarried
15 to 19 years
0 (0.0%)
0 (0.0%)
20 to 34 years
0 (0.0%)
0 (0.0%)
35 to 50 years
0 (0.0%)
0 (0.0%)
Total
0 (0.0%)
0 (0.0%)
Fertility by Education in Yellow Pine
Educational Attainment
Women with Births
Births / 1,000 Women
Less than High School
0 (0.0%)
0.0
High School Diploma
0 (0.0%)
0.0
College or Associate's Degree
0 (0.0%)
0.0
Bachelor's Degree
0 (0.0%)
0.0
Graduate Degree
0 (0.0%)
0.0
Total
0 (0.0%)
0.0
Fertility by Education by Marriage Status in Yellow Pine
Educational Attainment
Married
Unmarried
Less than High School
0 (0.0%)
0 (0.0%)
High School Diploma
0 (0.0%)
0 (0.0%)
College or Associate's Degree
0 (0.0%)
0 (0.0%)
Bachelor's Degree
0 (0.0%)
0 (0.0%)
Graduate Degree
0 (0.0%)
0 (0.0%)
Total
0 (0.0%)
0 (0.0%)
Income in Yellow Pine
Income Overview in Yellow Pine
Characteristic
Number
Measure
Per Capita Income
327
$8,872
Median Family Income
67
$0
Mean Family Income
67
$0
Median Household Income
67
$0
Mean Household Income
67
$0
Income Deficit
67
$0
Wage / Income Gap (%)
327
0.00%
Wage / Income Gap ($)
327
100.00¢ per $1
Gini / Inequality Index
327
0.03
Earnings by Sex in Yellow Pine
Sex
Number
Average Earnings
Male
99 (100.0%)
$0
Female
0 (0.0%)
$0
Total
99 (100.0%)
$0
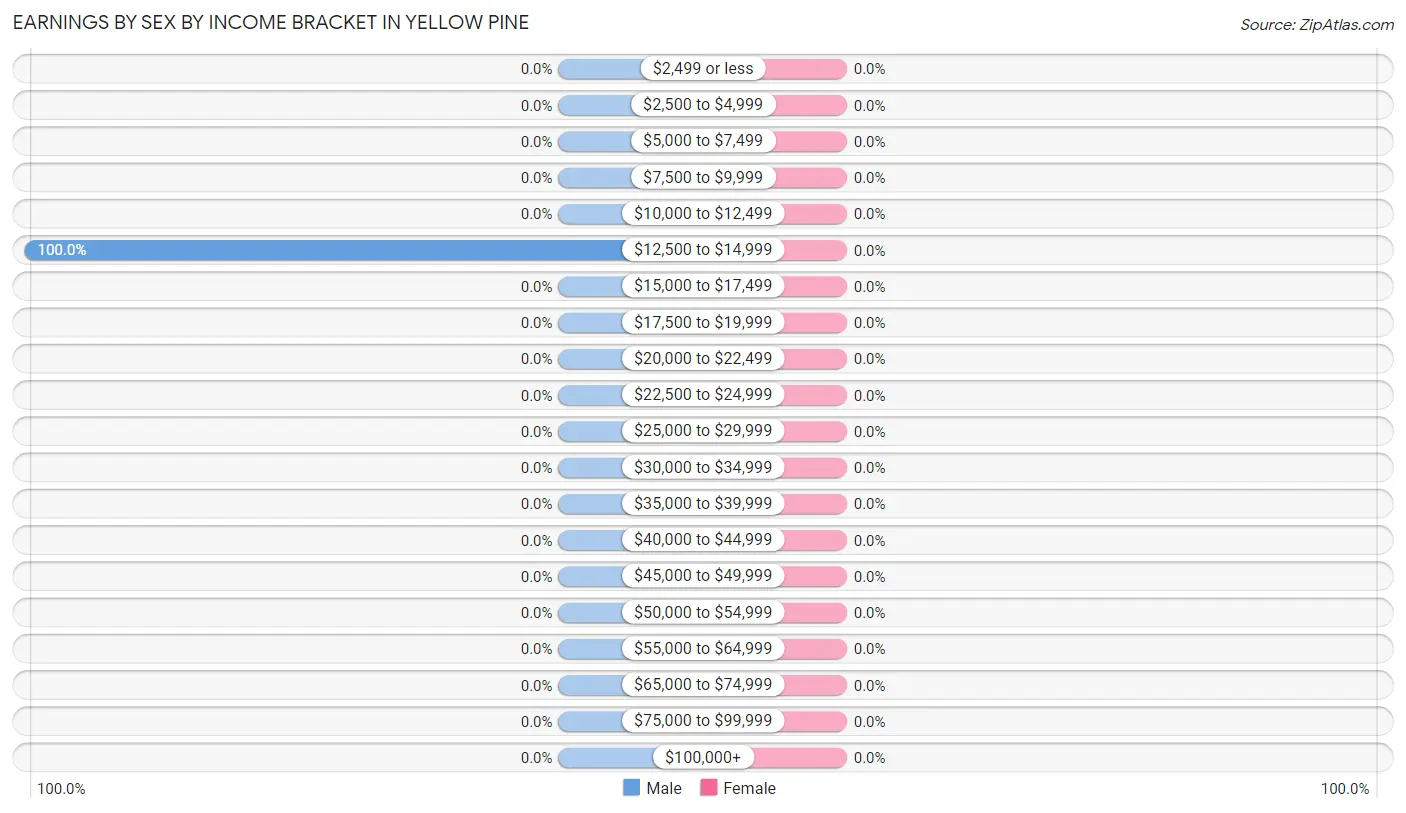
Earnings by Sex by Income Bracket in Yellow Pine
Income
Male
Female
$2,499 or less
0 (0.0%)
0 (0.0%)
$2,500 to $4,999
0 (0.0%)
0 (0.0%)
$5,000 to $7,499
0 (0.0%)
0 (0.0%)
$7,500 to $9,999
0 (0.0%)
0 (0.0%)
$10,000 to $12,499
0 (0.0%)
0 (0.0%)
$12,500 to $14,999
99 (100.0%)
0 (0.0%)
$15,000 to $17,499
0 (0.0%)
0 (0.0%)
$17,500 to $19,999
0 (0.0%)
0 (0.0%)
$20,000 to $22,499
0 (0.0%)
0 (0.0%)
$22,500 to $24,999
0 (0.0%)
0 (0.0%)
$25,000 to $29,999
0 (0.0%)
0 (0.0%)
$30,000 to $34,999
0 (0.0%)
0 (0.0%)
$35,000 to $39,999
0 (0.0%)
0 (0.0%)
$40,000 to $44,999
0 (0.0%)
0 (0.0%)
$45,000 to $49,999
0 (0.0%)
0 (0.0%)
$50,000 to $54,999
0 (0.0%)
0 (0.0%)
$55,000 to $64,999
0 (0.0%)
0 (0.0%)
$65,000 to $74,999
0 (0.0%)
0 (0.0%)
$75,000 to $99,999
0 (0.0%)
0 (0.0%)
$100,000+
0 (0.0%)
0 (0.0%)
Total
99 (100.0%)
0 (0.0%)
Earnings by Sex by Educational Attainment in Yellow Pine
Educational Attainment
Male Income
Female Income
Less than High School
-
-
High School Diploma
-
-
College or Associate's Degree
-
-
Bachelor's Degree
-
-
Graduate Degree
-
-
Total
-
-
Family Income in Yellow Pine
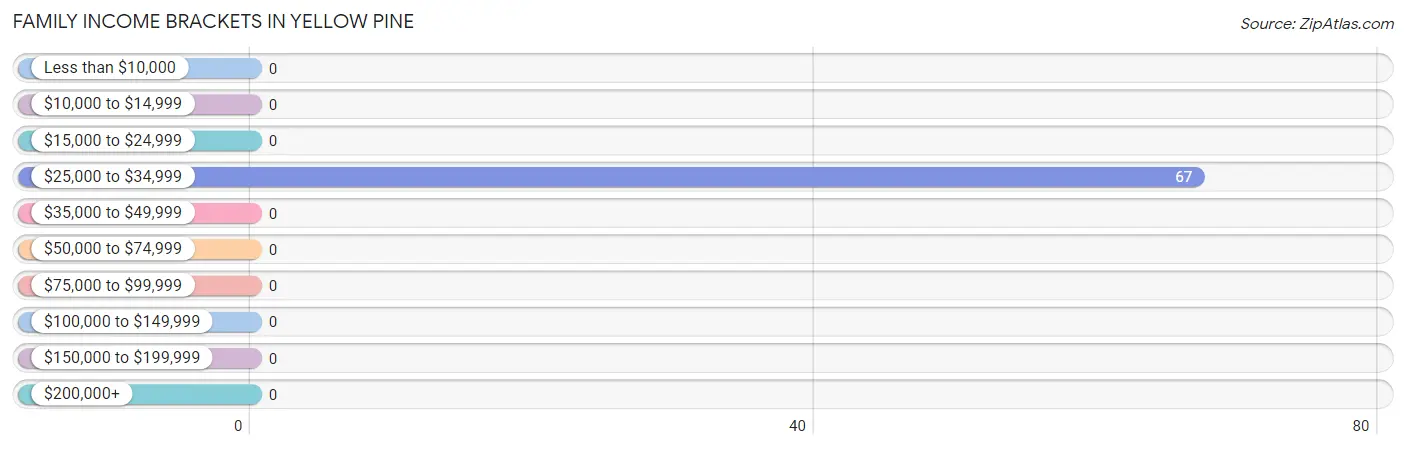
Family Income Brackets in Yellow Pine
According to the Yellow Pine family income data, there are 67 families falling into the $25,000 to $34,999 income range, which is the most common income bracket and makes up 100.0% of all families.
Income Bracket
# Families
% Families
Less than $10,000
0
0.0%
$10,000 to $14,999
0
0.0%
$15,000 to $24,999
0
0.0%
$25,000 to $34,999
67
100.0%
$35,000 to $49,999
0
0.0%
$50,000 to $74,999
0
0.0%
$75,000 to $99,999
0
0.0%
$100,000 to $149,999
0
0.0%
$150,000 to $199,999
0
0.0%
$200,000+
0
0.0%
Family Income by Famaliy Size in Yellow Pine
Income Bracket
# Families
Median Income
2-Person Families
32 (47.8%)
$0
3-Person Families
35 (52.2%)
$0
4-Person Families
0 (0.0%)
$0
5-Person Families
0 (0.0%)
$0
6-Person Families
0 (0.0%)
$0
7+ Person Families
0 (0.0%)
$0
Total
67 (100.0%)
$0
Family Income by Number of Earners in Yellow Pine
Number of Earners
# Families
Median Income
No Earners
32 (47.8%)
$0
1 Earner
35 (52.2%)
$0
2 Earners
0 (0.0%)
$0
3+ Earners
0 (0.0%)
$0
Total
67 (100.0%)
$0
Household Income in Yellow Pine
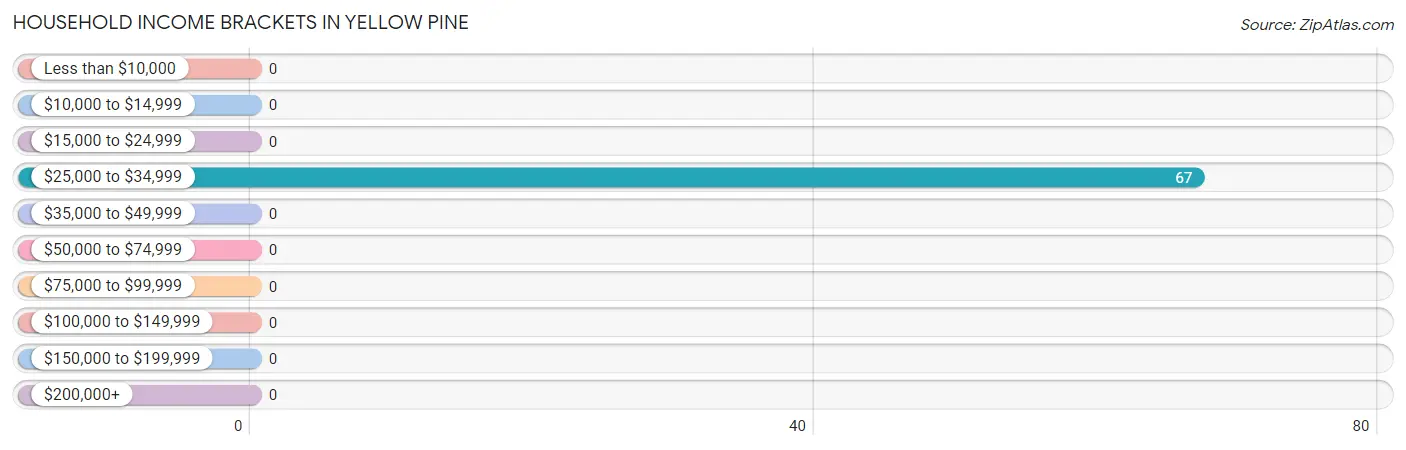
Household Income Brackets in Yellow Pine
With 67 households falling in the category, the $25,000 to $34,999 income range is the most frequent in Yellow Pine, accounting for 100.0% of all households.
Income Bracket
# Households
% Households
Less than $10,000
0
0.0%
$10,000 to $14,999
0
0.0%
$15,000 to $24,999
0
0.0%
$25,000 to $34,999
67
100.0%
$35,000 to $49,999
0
0.0%
$50,000 to $74,999
0
0.0%
$75,000 to $99,999
0
0.0%
$100,000 to $149,999
0
0.0%
$150,000 to $199,999
0
0.0%
$200,000+
0
0.0%
Household Income by Householder Age in Yellow Pine
Income Bracket
# Households
Median Income
15 to 24 Years
0 (0.0%)
$0
25 to 44 Years
0 (0.0%)
$0
45 to 64 Years
0 (0.0%)
$0
65+ Years
67 (100.0%)
$0
Total
67 (100.0%)
$0
Poverty in Yellow Pine
Income Below Poverty by Sex and Age in Yellow Pine
Age Bracket
Male
Female
Under 5 Years
0 (0.0%)
0 (0.0%)
5 Years
0 (0.0%)
0 (0.0%)
6 to 11 Years
0 (0.0%)
0 (0.0%)
12 to 14 Years
0 (0.0%)
0 (0.0%)
15 Years
0 (0.0%)
0 (0.0%)
16 and 17 Years
0 (0.0%)
0 (0.0%)
18 to 24 Years
0 (0.0%)
0 (0.0%)
25 to 34 Years
0 (0.0%)
0 (0.0%)
35 to 44 Years
0 (0.0%)
0 (0.0%)
45 to 54 Years
0 (0.0%)
0 (0.0%)
55 to 64 Years
0 (0.0%)
0 (0.0%)
65 to 74 Years
0 (0.0%)
0 (0.0%)
75 Years and over
0 (0.0%)
0 (0.0%)
Total
0 (0.0%)
0 (0.0%)
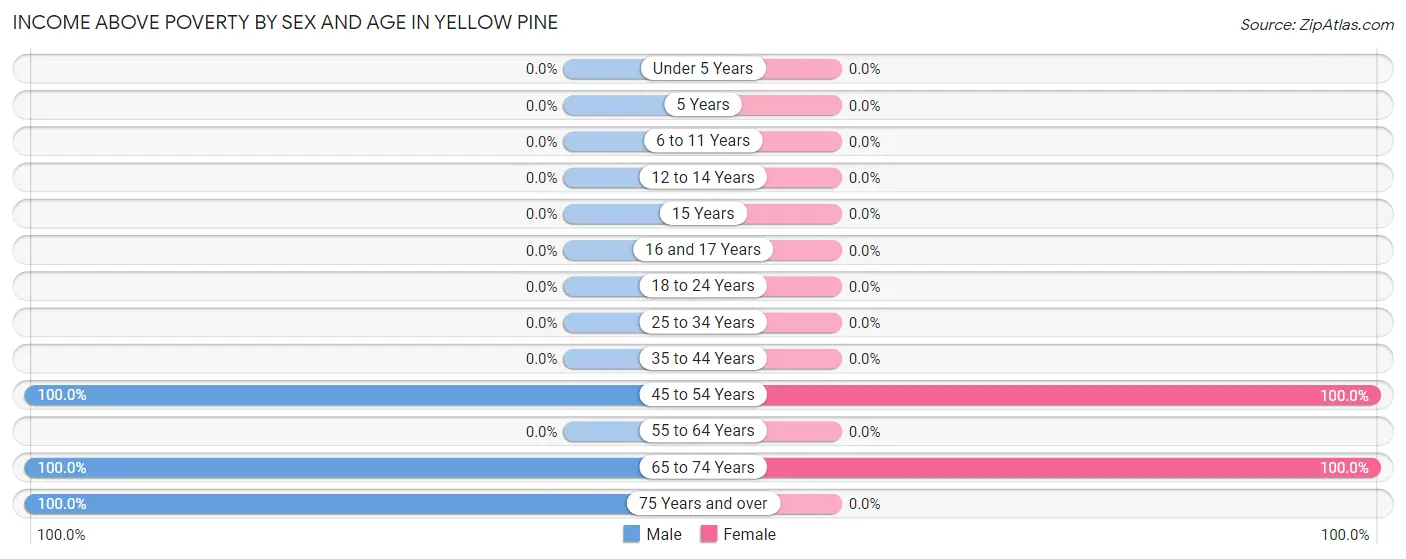
Income Above Poverty by Sex and Age in Yellow Pine
According to the poverty statistics in Yellow Pine, males aged 45 to 54 years and females aged 45 to 54 years are the age groups that are most secure financially, with 100.0% of males and 100.0% of females in these age groups living above the poverty line.
Age Bracket
Male
Female
Under 5 Years
0 (0.0%)
0 (0.0%)
5 Years
0 (0.0%)
0 (0.0%)
6 to 11 Years
0 (0.0%)
0 (0.0%)
12 to 14 Years
0 (0.0%)
0 (0.0%)
15 Years
0 (0.0%)
0 (0.0%)
16 and 17 Years
0 (0.0%)
0 (0.0%)
18 to 24 Years
0 (0.0%)
0 (0.0%)
25 to 34 Years
0 (0.0%)
0 (0.0%)
35 to 44 Years
0 (0.0%)
0 (0.0%)
45 to 54 Years
99 (100.0%)
132 (100.0%)
55 to 64 Years
0 (0.0%)
0 (0.0%)
65 to 74 Years
32 (100.0%)
29 (100.0%)
75 Years and over
35 (100.0%)
0 (0.0%)
Total
166 (100.0%)
161 (100.0%)
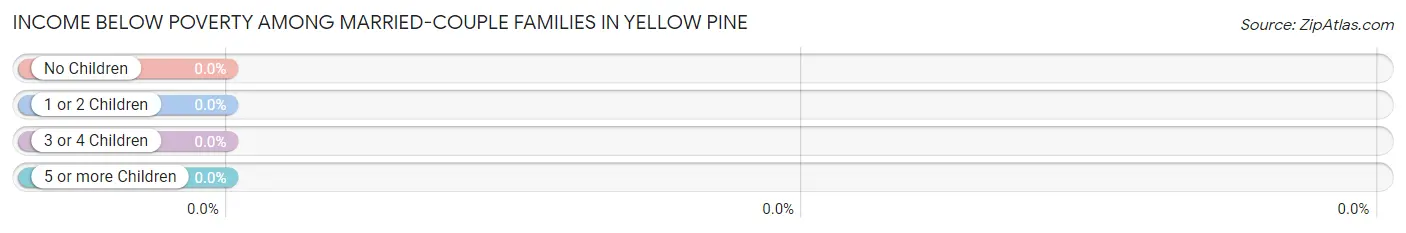
Income Below Poverty Among Married-Couple Families in Yellow Pine
Children
Above Poverty
Below Poverty
No Children
32 (100.0%)
0 (0.0%)
1 or 2 Children
0 (0.0%)
0 (0.0%)
3 or 4 Children
0 (0.0%)
0 (0.0%)
5 or more Children
0 (0.0%)
0 (0.0%)
Total
32 (100.0%)
0 (0.0%)
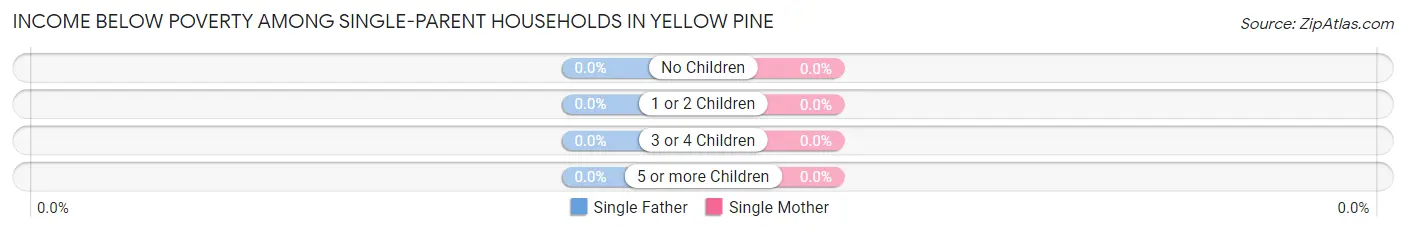
Income Below Poverty Among Single-Parent Households in Yellow Pine
Children
Single Father
Single Mother
No Children
0 (0.0%)
0 (0.0%)
1 or 2 Children
0 (0.0%)
0 (0.0%)
3 or 4 Children
0 (0.0%)
0 (0.0%)
5 or more Children
0 (0.0%)
0 (0.0%)
Total
0 (0.0%)
0 (0.0%)
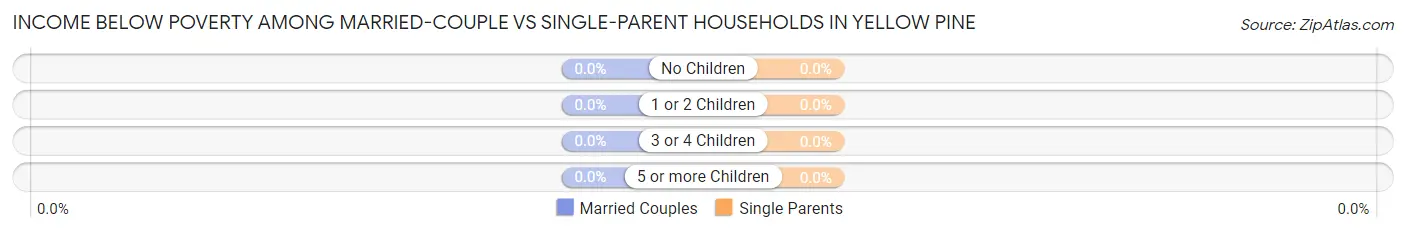
Income Below Poverty Among Married-Couple vs Single-Parent Households in Yellow Pine
Children
Married-Couple Families
Single-Parent Households
No Children
0 (0.0%)
0 (0.0%)
1 or 2 Children
0 (0.0%)
0 (0.0%)
3 or 4 Children
0 (0.0%)
0 (0.0%)
5 or more Children
0 (0.0%)
0 (0.0%)
Total
0 (0.0%)
0 (0.0%)
Employment Characteristics in Yellow Pine
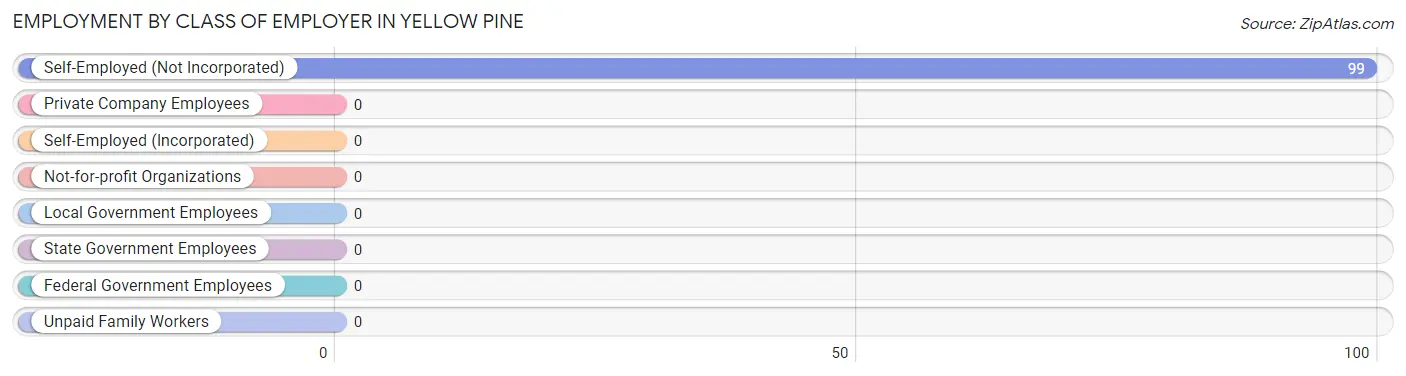
Employment by Class of Employer in Yellow Pine
Among the 99 employed individuals in Yellow Pine, , and self-employed (not incorporated) (99 | 100.0%) make up the most common classes of employment.
Employer Class
# Employees
% Employees
Private Company Employees
0
0.0%
Self-Employed (Incorporated)
0
0.0%
Self-Employed (Not Incorporated)
99
100.0%
Not-for-profit Organizations
0
0.0%
Local Government Employees
0
0.0%
State Government Employees
0
0.0%
Federal Government Employees
0
0.0%
Unpaid Family Workers
0
0.0%
Total
99
100.0%
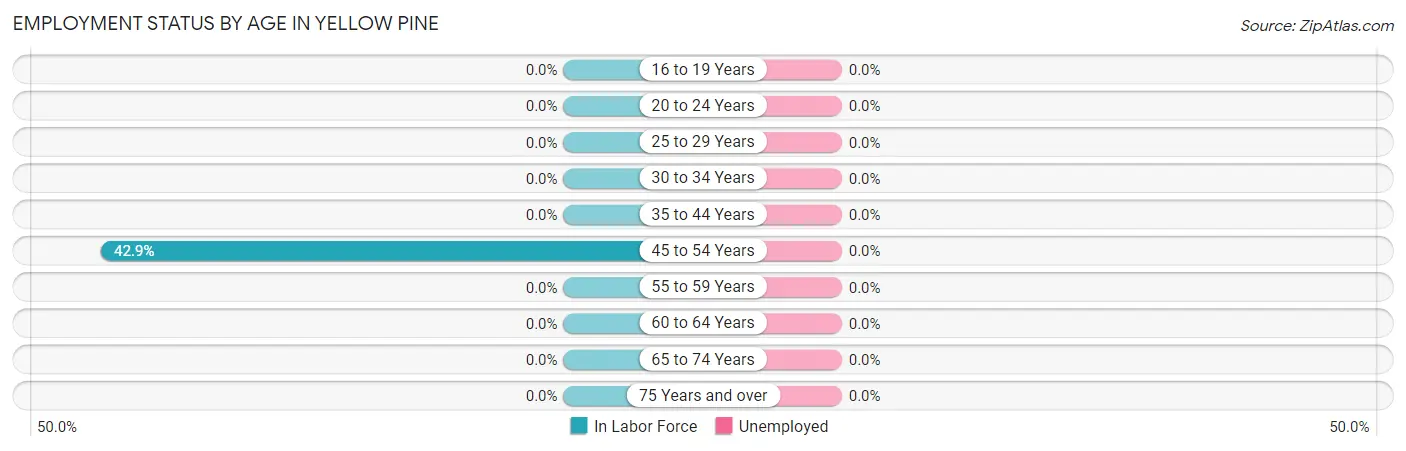
Employment Status by Age in Yellow Pine
Age Bracket
In Labor Force
Unemployed
16 to 19 Years
0 (0.0%)
0 (0.0%)
20 to 24 Years
0 (0.0%)
0 (0.0%)
25 to 29 Years
0 (0.0%)
0 (0.0%)
30 to 34 Years
0 (0.0%)
0 (0.0%)
35 to 44 Years
0 (0.0%)
0 (0.0%)
45 to 54 Years
99 (42.9%)
0 (0.0%)
55 to 59 Years
0 (0.0%)
0 (0.0%)
60 to 64 Years
0 (0.0%)
0 (0.0%)
65 to 74 Years
0 (0.0%)
0 (0.0%)
75 Years and over
0 (0.0%)
0 (0.0%)
Total
99 (30.3%)
0 (0.0%)
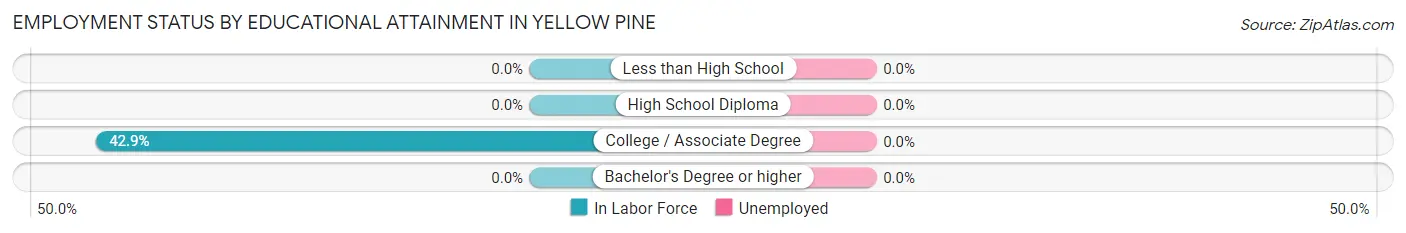
Employment Status by Educational Attainment in Yellow Pine
Educational Attainment
In Labor Force
Unemployed
Less than High School
0 (0.0%)
0 (0.0%)
High School Diploma
0 (0.0%)
0 (0.0%)
College / Associate Degree
99 (42.9%)
0 (0.0%)
Bachelor's Degree or higher
0 (0.0%)
0 (0.0%)
Total
99 (42.9%)
0 (0.0%)
Employment Occupations by Sex in Yellow Pine
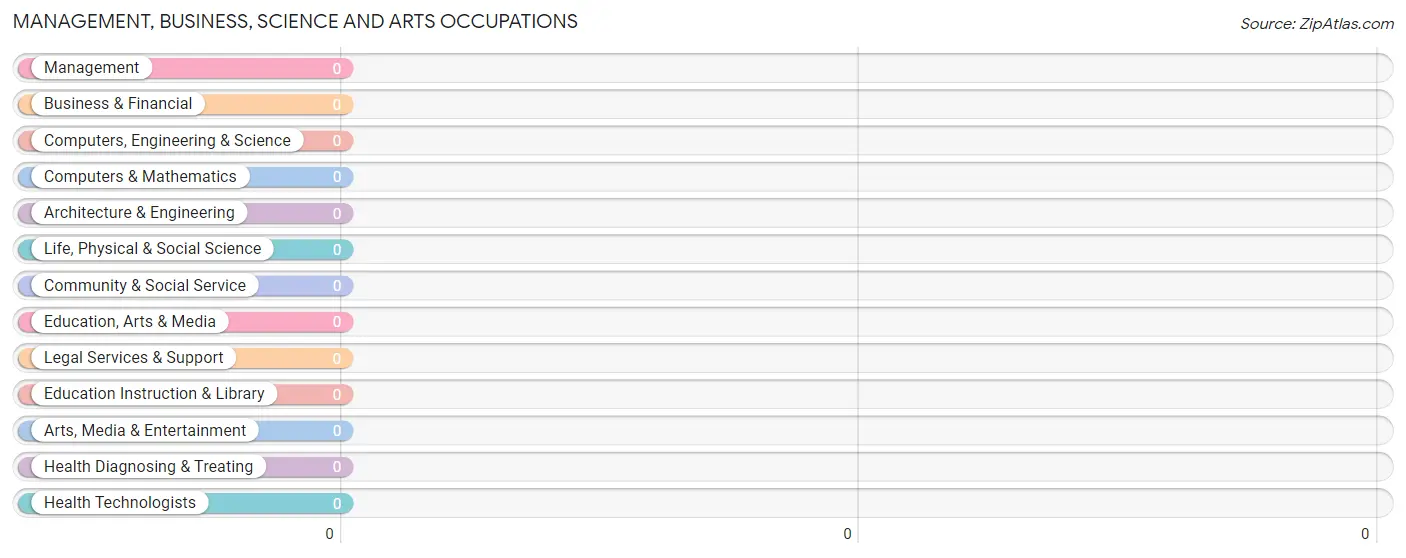
Management, Business, Science and Arts Occupations
Management, Business, Science and Arts Occupations by Sex
Occupation
Male
Female
Management
0 (0.0%)
0 (0.0%)
Business & Financial
0 (0.0%)
0 (0.0%)
Computers, Engineering & Science
0 (0.0%)
0 (0.0%)
Computers & Mathematics
0 (0.0%)
0 (0.0%)
Architecture & Engineering
0 (0.0%)
0 (0.0%)
Life, Physical & Social Science
0 (0.0%)
0 (0.0%)
Community & Social Service
0 (0.0%)
0 (0.0%)
Education, Arts & Media
0 (0.0%)
0 (0.0%)
Legal Services & Support
0 (0.0%)
0 (0.0%)
Education Instruction & Library
0 (0.0%)
0 (0.0%)
Arts, Media & Entertainment
0 (0.0%)
0 (0.0%)
Health Diagnosing & Treating
0 (0.0%)
0 (0.0%)
Health Technologists
0 (0.0%)
0 (0.0%)
Total (Category)
0 (0.0%)
0 (0.0%)
Total (Overall)
99 (100.0%)
0 (0.0%)
Services Occupations
Services Occupations by Sex
Occupation
Male
Female
Healthcare Support
0 (0.0%)
0 (0.0%)
Security & Protection
0 (0.0%)
0 (0.0%)
Firefighting & Prevention
0 (0.0%)
0 (0.0%)
Law Enforcement
0 (0.0%)
0 (0.0%)
Food Preparation & Serving
0 (0.0%)
0 (0.0%)
Cleaning & Maintenance
0 (0.0%)
0 (0.0%)
Personal Care & Service
0 (0.0%)
0 (0.0%)
Total (Category)
0 (0.0%)
0 (0.0%)
Total (Overall)
99 (100.0%)
0 (0.0%)
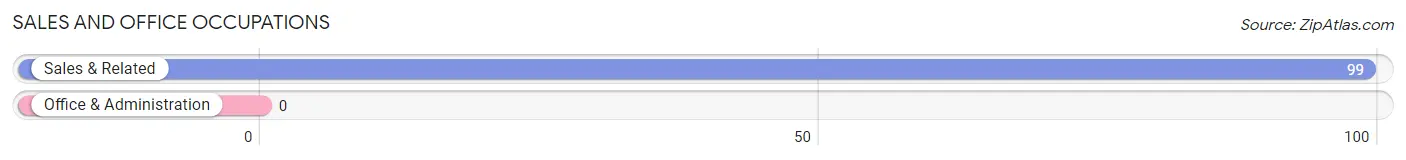
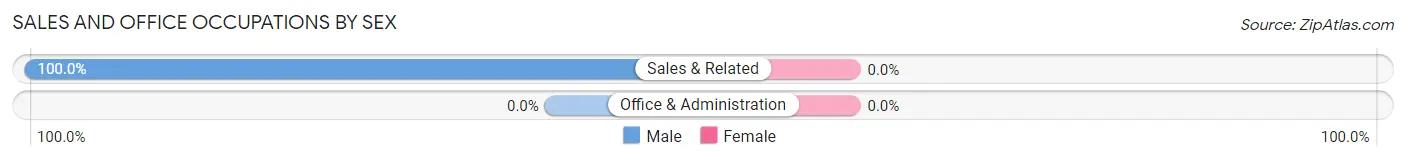
Sales and Office Occupations
The most common Sales and Office occupations in Yellow Pine are , and Sales & Related (99 | 100.0%).
Sales and Office Occupations by Sex
Occupation
Male
Female
Sales & Related
99 (100.0%)
0 (0.0%)
Office & Administration
0 (0.0%)
0 (0.0%)
Total (Category)
99 (100.0%)
0 (0.0%)
Total (Overall)
99 (100.0%)
0 (0.0%)
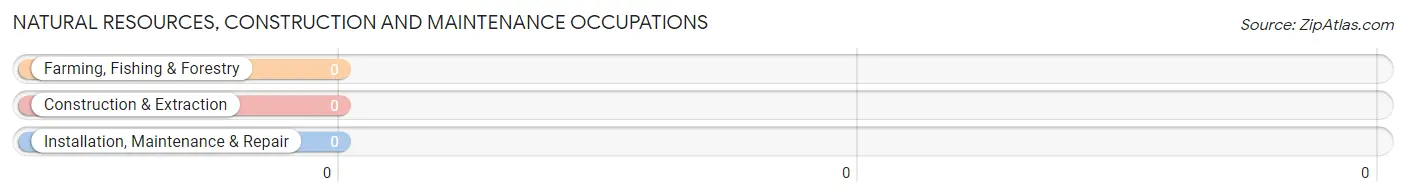
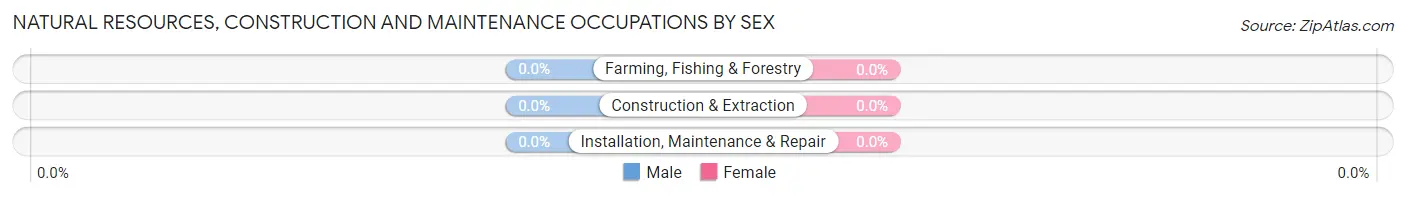
Natural Resources, Construction and Maintenance Occupations
Natural Resources, Construction and Maintenance Occupations by Sex
Occupation
Male
Female
Farming, Fishing & Forestry
0 (0.0%)
0 (0.0%)
Construction & Extraction
0 (0.0%)
0 (0.0%)
Installation, Maintenance & Repair
0 (0.0%)
0 (0.0%)
Total (Category)
0 (0.0%)
0 (0.0%)
Total (Overall)
99 (100.0%)
0 (0.0%)
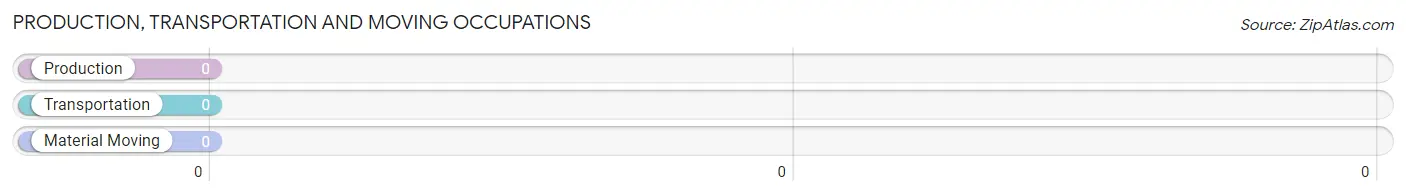
Production, Transportation and Moving Occupations
Production, Transportation and Moving Occupations by Sex
Occupation
Male
Female
Production
0 (0.0%)
0 (0.0%)
Transportation
0 (0.0%)
0 (0.0%)
Material Moving
0 (0.0%)
0 (0.0%)
Total (Category)
0 (0.0%)
0 (0.0%)
Total (Overall)
99 (100.0%)
0 (0.0%)
Employment Industries by Sex in Yellow Pine
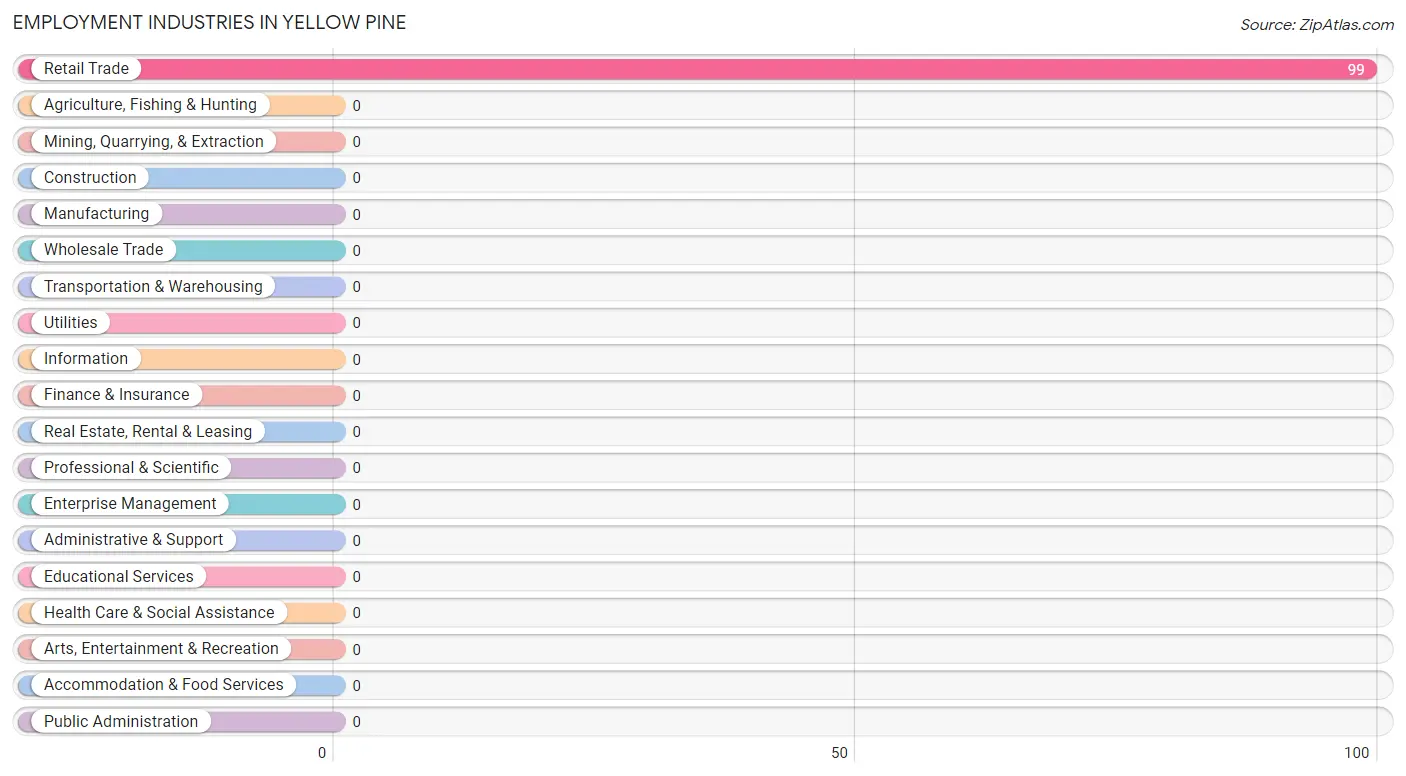
Employment Industries in Yellow Pine
The major employment industries in Yellow Pine include , and Retail Trade (99 | 100.0%).
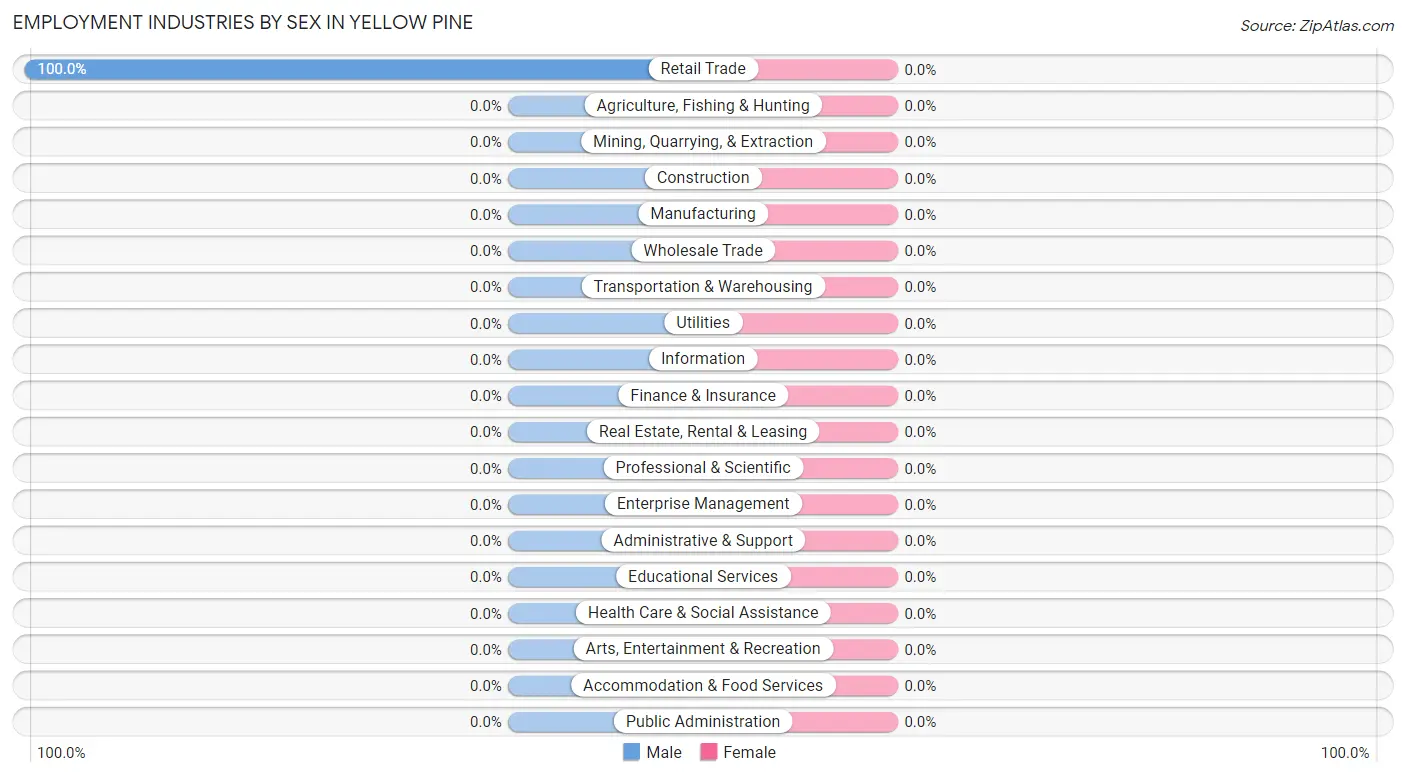
Employment Industries by Sex in Yellow Pine
Industry
Male
Female
Agriculture, Fishing & Hunting
0 (0.0%)
0 (0.0%)
Mining, Quarrying, & Extraction
0 (0.0%)
0 (0.0%)
Construction
0 (0.0%)
0 (0.0%)
Manufacturing
0 (0.0%)
0 (0.0%)
Wholesale Trade
0 (0.0%)
0 (0.0%)
Retail Trade
99 (100.0%)
0 (0.0%)
Transportation & Warehousing
0 (0.0%)
0 (0.0%)
Utilities
0 (0.0%)
0 (0.0%)
Information
0 (0.0%)
0 (0.0%)
Finance & Insurance
0 (0.0%)
0 (0.0%)
Real Estate, Rental & Leasing
0 (0.0%)
0 (0.0%)
Professional & Scientific
0 (0.0%)
0 (0.0%)
Enterprise Management
0 (0.0%)
0 (0.0%)
Administrative & Support
0 (0.0%)
0 (0.0%)
Educational Services
0 (0.0%)
0 (0.0%)
Health Care & Social Assistance
0 (0.0%)
0 (0.0%)
Arts, Entertainment & Recreation
0 (0.0%)
0 (0.0%)
Accommodation & Food Services
0 (0.0%)
0 (0.0%)
Public Administration
0 (0.0%)
0 (0.0%)
Total
99 (100.0%)
0 (0.0%)
Education in Yellow Pine
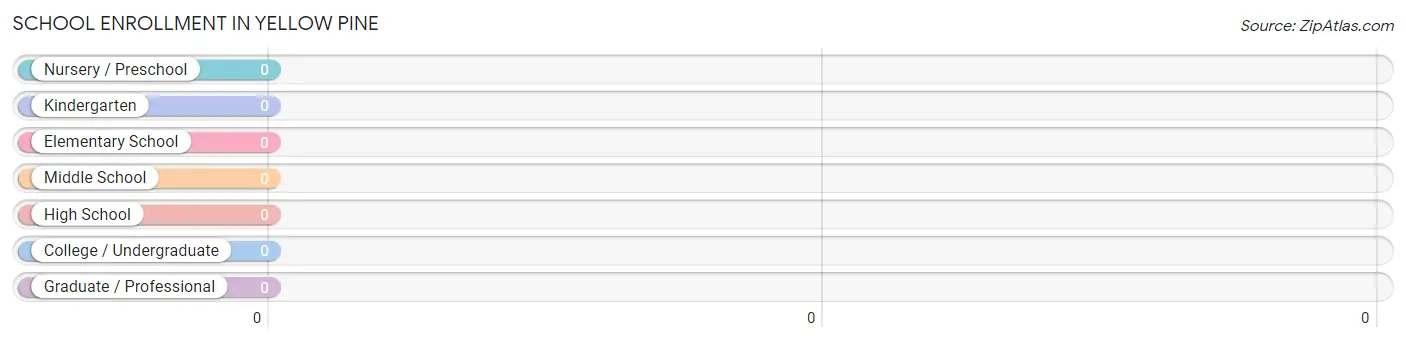
School Enrollment in Yellow Pine
School Level
# Students
% Students
Nursery / Preschool
0
0.0%
Kindergarten
0
0.0%
Elementary School
0
0.0%
Middle School
0
0.0%
High School
0
0.0%
College / Undergraduate
0
0.0%
Graduate / Professional
0
0.0%
Total
0
0.0%
School Enrollment by Age by Funding Source in Yellow Pine
Age Bracket
Public School
Private School
3 to 4 Year Olds
0 (0.0%)
0 (0.0%)
5 to 9 Year Old
0 (0.0%)
0 (0.0%)
10 to 14 Year Olds
0 (0.0%)
0 (0.0%)
15 to 17 Year Olds
0 (0.0%)
0 (0.0%)
18 to 19 Year Olds
0 (0.0%)
0 (0.0%)
20 to 24 Year Olds
0 (0.0%)
0 (0.0%)
25 to 34 Year Olds
0 (0.0%)
0 (0.0%)
35 Years and over
0 (0.0%)
0 (0.0%)
Total
0 (0.0%)
0 (0.0%)
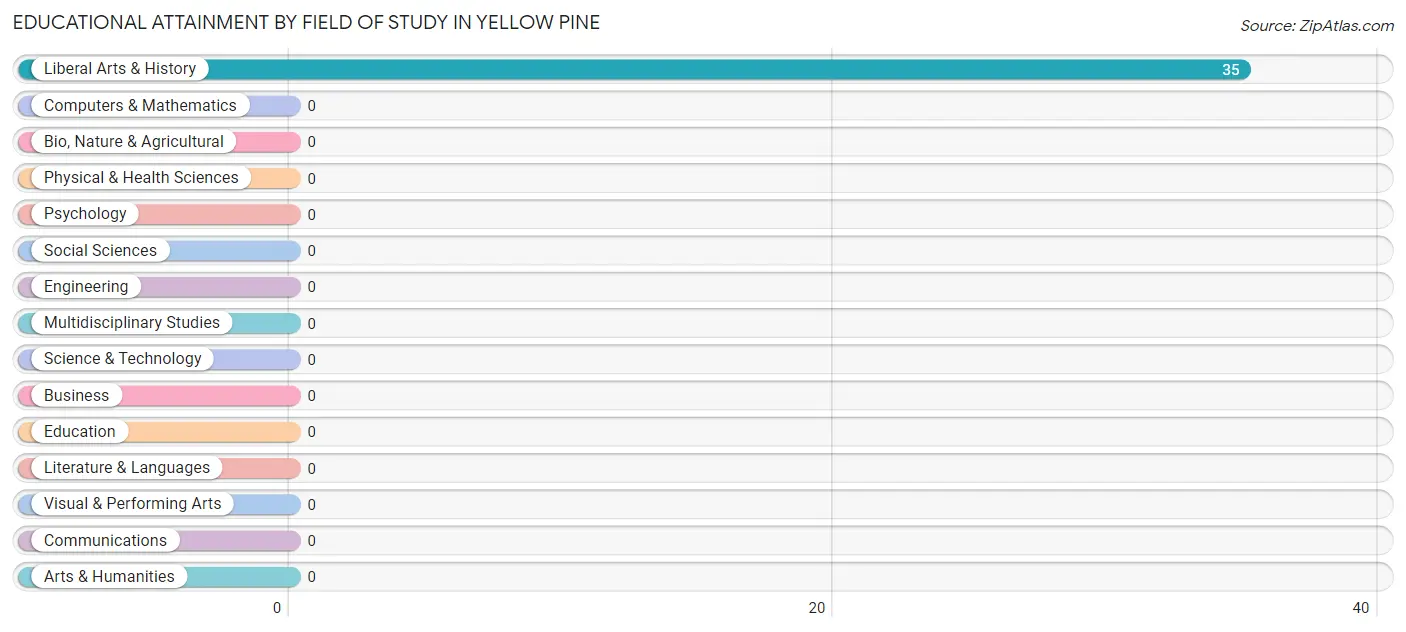
Educational Attainment by Field of Study in Yellow Pine
, and liberal arts & history (35 | 100.0%) are the most common fields of study among 35 individuals in Yellow Pine who have obtained a bachelor's degree or higher.
Field of Study
# Graduates
% Graduates
Computers & Mathematics
0
0.0%
Bio, Nature & Agricultural
0
0.0%
Physical & Health Sciences
0
0.0%
Psychology
0
0.0%
Social Sciences
0
0.0%
Engineering
0
0.0%
Multidisciplinary Studies
0
0.0%
Science & Technology
0
0.0%
Business
0
0.0%
Education
0
0.0%
Literature & Languages
0
0.0%
Liberal Arts & History
35
100.0%
Visual & Performing Arts
0
0.0%
Communications
0
0.0%
Arts & Humanities
0
0.0%
Total
35
100.0%
Transportation & Commute in Yellow Pine
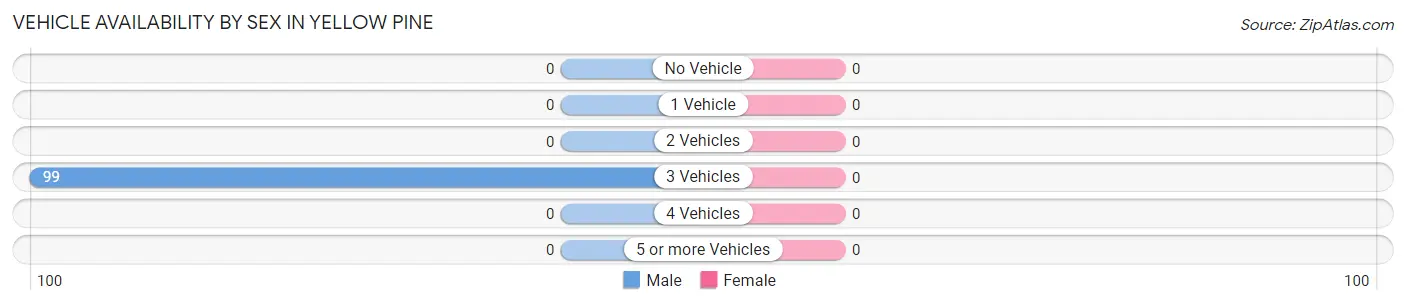
Vehicle Availability by Sex in Yellow Pine
Vehicles Available
Male
Female
No Vehicle
0 (0.0%)
0 (0.0%)
1 Vehicle
0 (0.0%)
0 (0.0%)
2 Vehicles
0 (0.0%)
0 (0.0%)
3 Vehicles
99 (100.0%)
0 (0.0%)
4 Vehicles
0 (0.0%)
0 (0.0%)
5 or more Vehicles
0 (0.0%)
0 (0.0%)
Total
99 (100.0%)
0 (0.0%)
Commute Time in Yellow Pine
Commute Time
# Commuters
% Commuters
Less than 5 Minutes
0
0.0%
5 to 9 Minutes
0
0.0%
10 to 14 Minutes
0
0.0%
15 to 19 Minutes
0
0.0%
20 to 24 Minutes
0
0.0%
25 to 29 Minutes
0
0.0%
30 to 34 Minutes
0
0.0%
35 to 39 Minutes
0
0.0%
40 to 44 Minutes
0
0.0%
45 to 59 Minutes
0
0.0%
60 to 89 Minutes
0
0.0%
90 or more Minutes
0
0.0%
Commute Time by Sex in Yellow Pine
Commute Time
Male
Female
Less than 5 Minutes
0 (0.0%)
0 (0.0%)
5 to 9 Minutes
0 (0.0%)
0 (0.0%)
10 to 14 Minutes
0 (0.0%)
0 (0.0%)
15 to 19 Minutes
0 (0.0%)
0 (0.0%)
20 to 24 Minutes
0 (0.0%)
0 (0.0%)
25 to 29 Minutes
0 (0.0%)
0 (0.0%)
30 to 34 Minutes
0 (0.0%)
0 (0.0%)
35 to 39 Minutes
0 (0.0%)
0 (0.0%)
40 to 44 Minutes
0 (0.0%)
0 (0.0%)
45 to 59 Minutes
0 (0.0%)
0 (0.0%)
60 to 89 Minutes
0 (0.0%)
0 (0.0%)
90 or more Minutes
0 (0.0%)
0 (0.0%)
Time of Departure to Work by Sex in Yellow Pine
Time of Departure
Male
Female
12:00 AM to 4:59 AM
0 (0.0%)
0 (0.0%)
5:00 AM to 5:29 AM
0 (0.0%)
0 (0.0%)
5:30 AM to 5:59 AM
0 (0.0%)
0 (0.0%)
6:00 AM to 6:29 AM
0 (0.0%)
0 (0.0%)
6:30 AM to 6:59 AM
0 (0.0%)
0 (0.0%)
7:00 AM to 7:29 AM
0 (0.0%)
0 (0.0%)
7:30 AM to 7:59 AM
0 (0.0%)
0 (0.0%)
8:00 AM to 8:29 AM
0 (0.0%)
0 (0.0%)
8:30 AM to 8:59 AM
0 (0.0%)
0 (0.0%)
9:00 AM to 9:59 AM
0 (0.0%)
0 (0.0%)
10:00 AM to 10:59 AM
0 (0.0%)
0 (0.0%)
11:00 AM to 11:59 AM
0 (0.0%)
0 (0.0%)
12:00 PM to 3:59 PM
0 (0.0%)
0 (0.0%)
4:00 PM to 11:59 PM
0 (0.0%)
0 (0.0%)
Total
0 (0.0%)
0 (0.0%)
Housing Occupancy in Yellow Pine
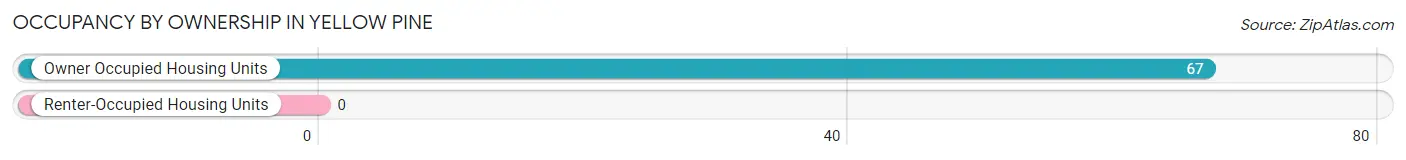
Occupancy by Ownership in Yellow Pine
Of the total 67 dwellings in Yellow Pine, owner-occupied units account for 67 (100.0%), while renter-occupied units make up 0 (0.0%).
Occupancy
# Housing Units
% Housing Units
Owner Occupied Housing Units
67
100.0%
Renter-Occupied Housing Units
0
0.0%
Total Occupied Housing Units
67
100.0%
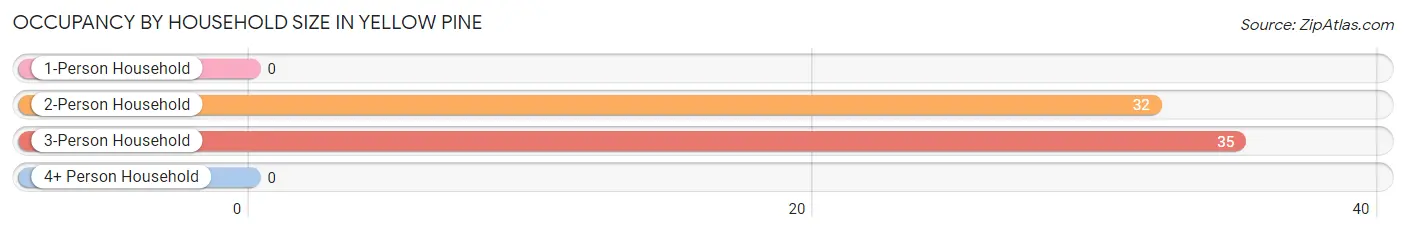
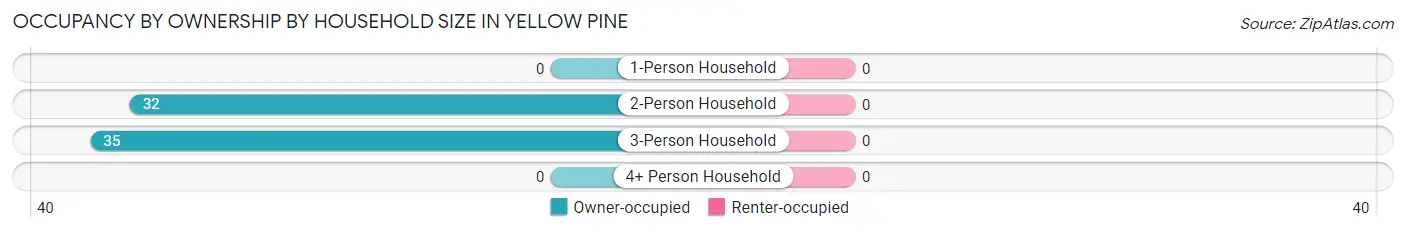
Occupancy by Household Size in Yellow Pine
Household Size
# Housing Units
% Housing Units
1-Person Household
0
0.0%
2-Person Household
32
47.8%
3-Person Household
35
52.2%
4+ Person Household
0
0.0%
Total Housing Units
67
100.0%
Occupancy by Ownership by Household Size in Yellow Pine
Household Size
Owner-occupied
Renter-occupied
1-Person Household
0 (0.0%)
0 (0.0%)
2-Person Household
32 (100.0%)
0 (0.0%)
3-Person Household
35 (100.0%)
0 (0.0%)
4+ Person Household
0 (0.0%)
0 (0.0%)
Total Housing Units
67 (100.0%)
0 (0.0%)
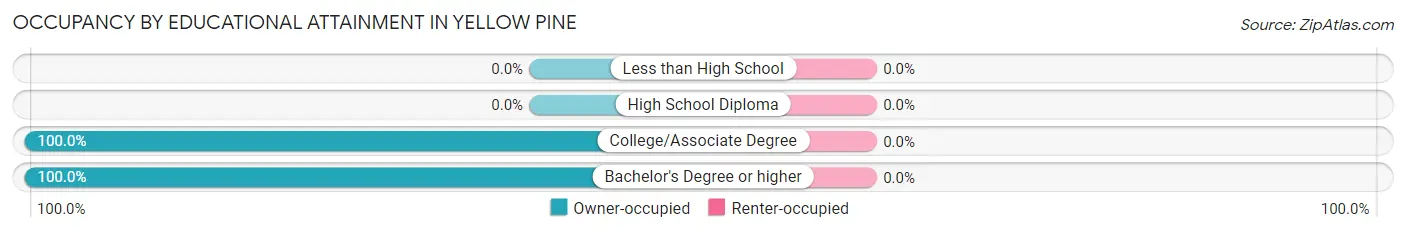
Occupancy by Educational Attainment in Yellow Pine
Household Size
Owner-occupied
Renter-occupied
Less than High School
0 (0.0%)
0 (0.0%)
High School Diploma
0 (0.0%)
0 (0.0%)
College/Associate Degree
32 (100.0%)
0 (0.0%)
Bachelor's Degree or higher
35 (100.0%)
0 (0.0%)
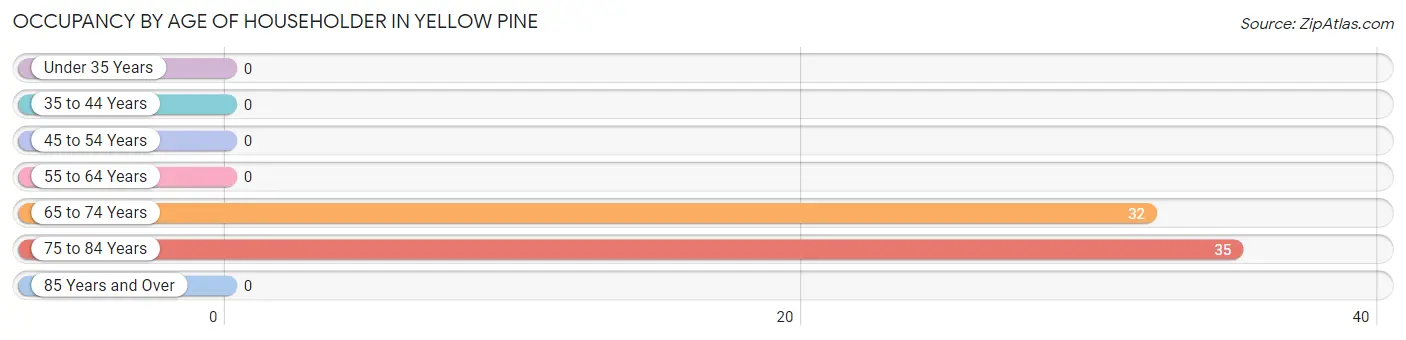
Occupancy by Age of Householder in Yellow Pine
Age Bracket
# Households
% Households
Under 35 Years
0
0.0%
35 to 44 Years
0
0.0%
45 to 54 Years
0
0.0%
55 to 64 Years
0
0.0%
65 to 74 Years
32
47.8%
75 to 84 Years
35
52.2%
85 Years and Over
0
0.0%
Total
67
100.0%
Housing Finances in Yellow Pine
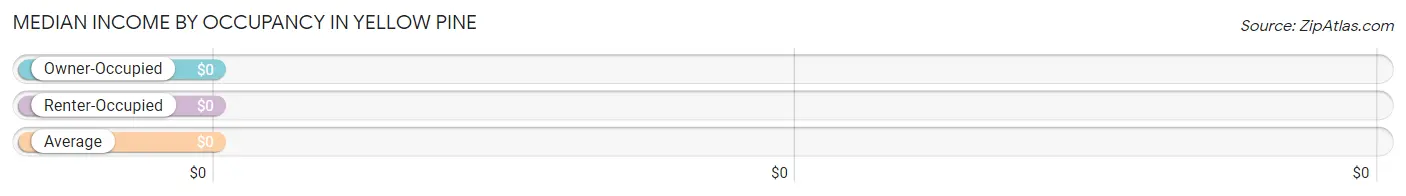
Median Income by Occupancy in Yellow Pine
Occupancy Type
# Households
Median Income
Owner-Occupied
67 (100.0%)
$0
Renter-Occupied
0 (0.0%)
$0
Average
67 (100.0%)
$0
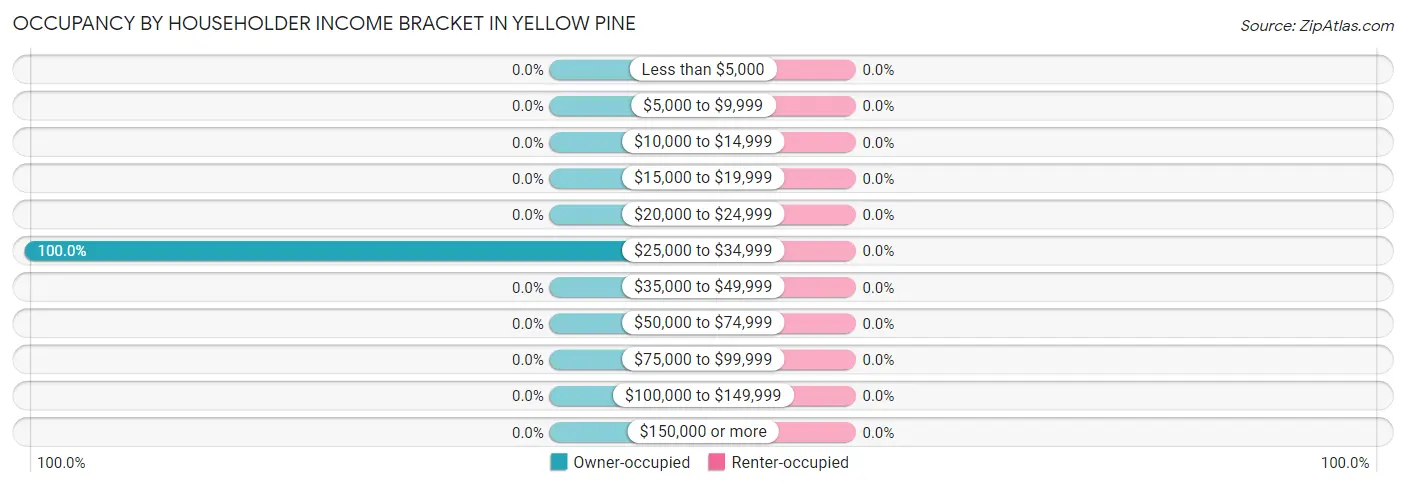
Occupancy by Householder Income Bracket in Yellow Pine
Income Bracket
Owner-occupied
Renter-occupied
Less than $5,000
0 (0.0%)
0 (0.0%)
$5,000 to $9,999
0 (0.0%)
0 (0.0%)
$10,000 to $14,999
0 (0.0%)
0 (0.0%)
$15,000 to $19,999
0 (0.0%)
0 (0.0%)
$20,000 to $24,999
0 (0.0%)
0 (0.0%)
$25,000 to $34,999
67 (100.0%)
0 (0.0%)
$35,000 to $49,999
0 (0.0%)
0 (0.0%)
$50,000 to $74,999
0 (0.0%)
0 (0.0%)
$75,000 to $99,999
0 (0.0%)
0 (0.0%)
$100,000 to $149,999
0 (0.0%)
0 (0.0%)
$150,000 or more
0 (0.0%)
0 (0.0%)
Total
67 (100.0%)
0 (0.0%)
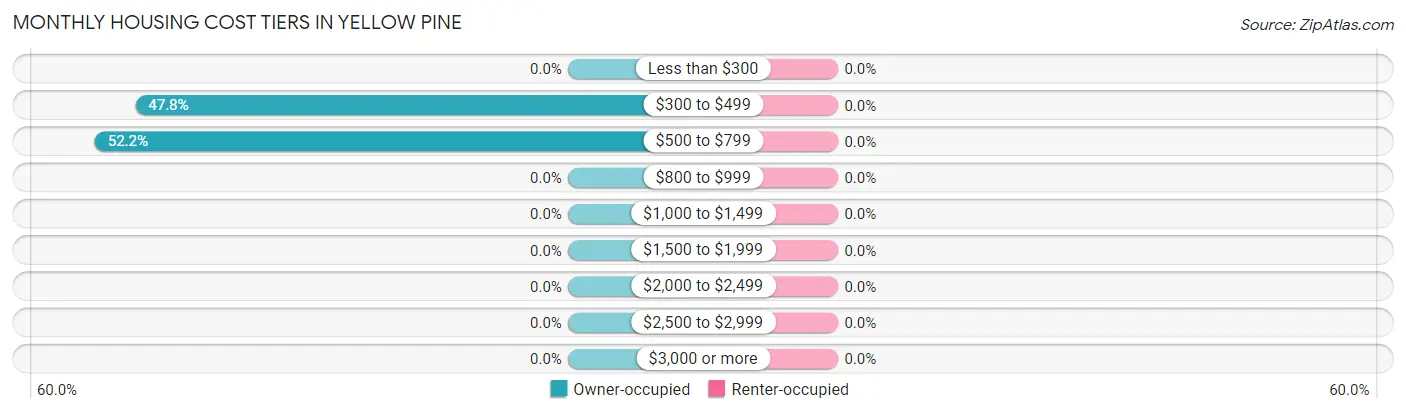
Monthly Housing Cost Tiers in Yellow Pine
Monthly Cost
Owner-occupied
Renter-occupied
Less than $300
0 (0.0%)
0 (0.0%)
$300 to $499
32 (47.8%)
0 (0.0%)
$500 to $799
35 (52.2%)
0 (0.0%)
$800 to $999
0 (0.0%)
0 (0.0%)
$1,000 to $1,499
0 (0.0%)
0 (0.0%)
$1,500 to $1,999
0 (0.0%)
0 (0.0%)
$2,000 to $2,499
0 (0.0%)
0 (0.0%)
$2,500 to $2,999
0 (0.0%)
0 (0.0%)
$3,000 or more
0 (0.0%)
0 (0.0%)
Total
67 (100.0%)
0 (0.0%)
Physical Housing Characteristics in Yellow Pine
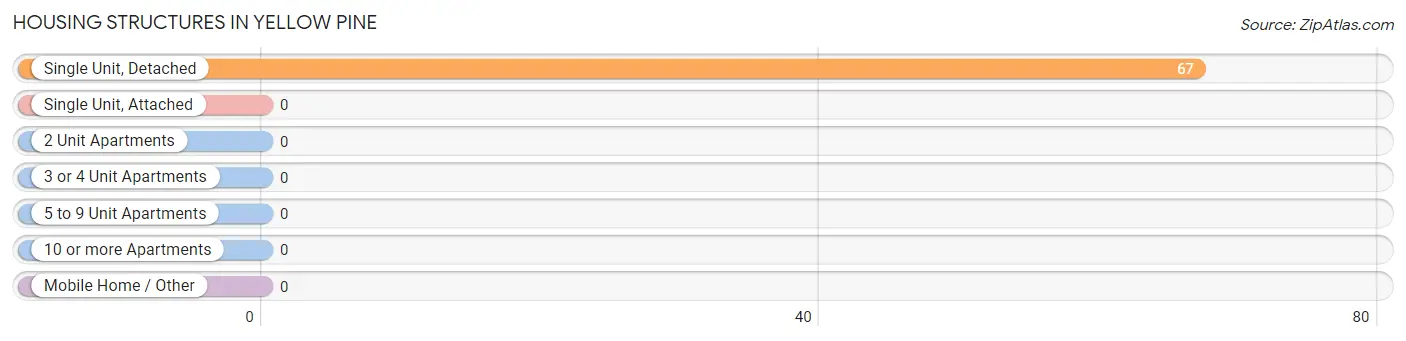
Housing Structures in Yellow Pine
Structure Type
# Housing Units
% Housing Units
Single Unit, Detached
67
100.0%
Single Unit, Attached
0
0.0%
2 Unit Apartments
0
0.0%
3 or 4 Unit Apartments
0
0.0%
5 to 9 Unit Apartments
0
0.0%
10 or more Apartments
0
0.0%
Mobile Home / Other
0
0.0%
Total
67
100.0%
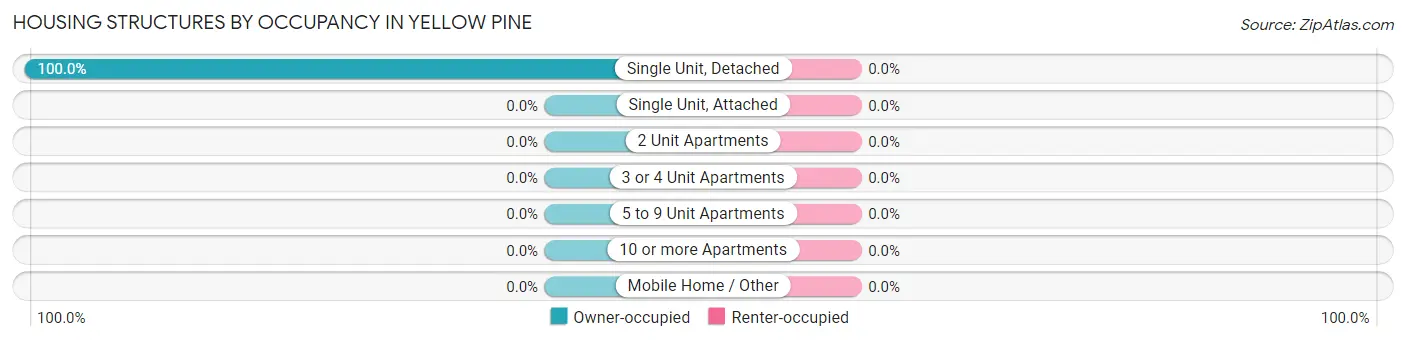
Housing Structures by Occupancy in Yellow Pine
Structure Type
Owner-occupied
Renter-occupied
Single Unit, Detached
67 (100.0%)
0 (0.0%)
Single Unit, Attached
0 (0.0%)
0 (0.0%)
2 Unit Apartments
0 (0.0%)
0 (0.0%)
3 or 4 Unit Apartments
0 (0.0%)
0 (0.0%)
5 to 9 Unit Apartments
0 (0.0%)
0 (0.0%)
10 or more Apartments
0 (0.0%)
0 (0.0%)
Mobile Home / Other
0 (0.0%)
0 (0.0%)
Total
67 (100.0%)
0 (0.0%)
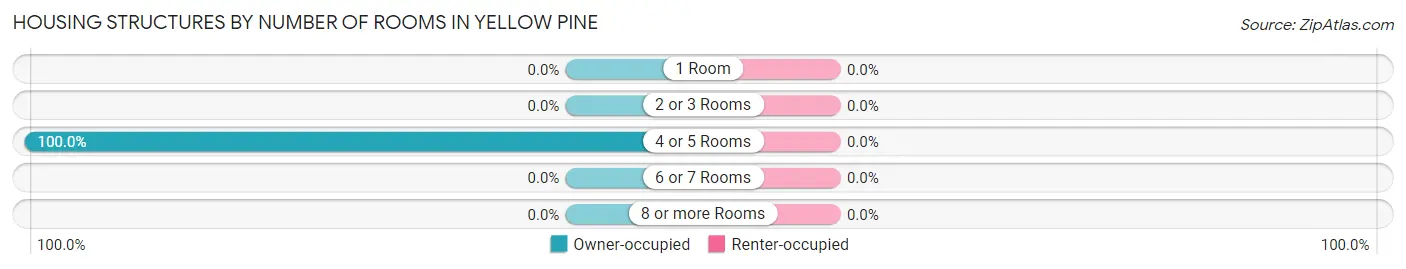
Housing Structures by Number of Rooms in Yellow Pine
Number of Rooms
Owner-occupied
Renter-occupied
1 Room
0 (0.0%)
0 (0.0%)
2 or 3 Rooms
0 (0.0%)
0 (0.0%)
4 or 5 Rooms
67 (100.0%)
0 (0.0%)
6 or 7 Rooms
0 (0.0%)
0 (0.0%)
8 or more Rooms
0 (0.0%)
0 (0.0%)
Total
67 (100.0%)
0 (0.0%)
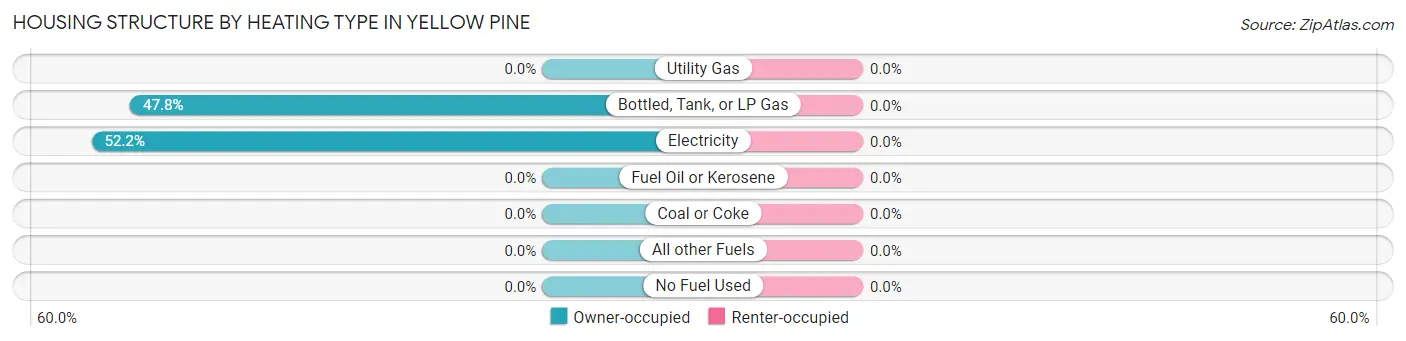
Housing Structure by Heating Type in Yellow Pine
Heating Type
Owner-occupied
Renter-occupied
Utility Gas
0 (0.0%)
0 (0.0%)
Bottled, Tank, or LP Gas
32 (47.8%)
0 (0.0%)
Electricity
35 (52.2%)
0 (0.0%)
Fuel Oil or Kerosene
0 (0.0%)
0 (0.0%)
Coal or Coke
0 (0.0%)
0 (0.0%)
All other Fuels
0 (0.0%)
0 (0.0%)
No Fuel Used
0 (0.0%)
0 (0.0%)
Total
67 (100.0%)
0 (0.0%)
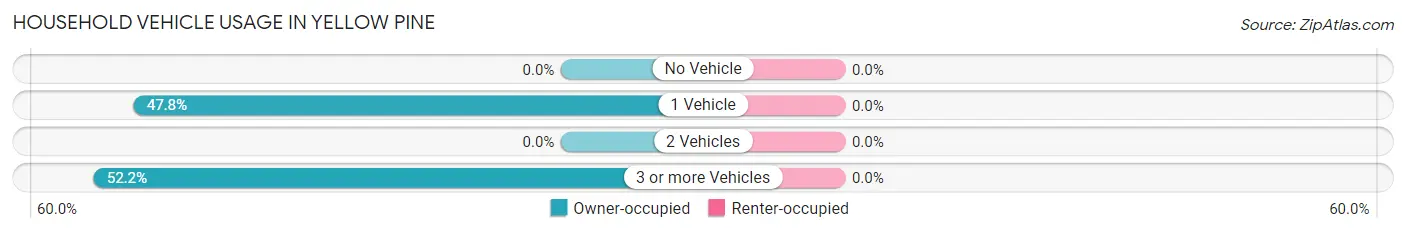
Household Vehicle Usage in Yellow Pine
Vehicles per Household
Owner-occupied
Renter-occupied
No Vehicle
0 (0.0%)
0 (0.0%)
1 Vehicle
32 (47.8%)
0 (0.0%)
2 Vehicles
0 (0.0%)
0 (0.0%)
3 or more Vehicles
35 (52.2%)
0 (0.0%)
Total
67 (100.0%)
0 (0.0%)
Real Estate & Mortgages in Yellow Pine
Real Estate and Mortgage Overview in Yellow Pine
Characteristic
Without Mortgage
With Mortgage
Housing Units
32
35
Median Property Value
-
-
Median Household Income
-
-
Monthly Housing Costs
-
-
Real Estate Taxes
-
-
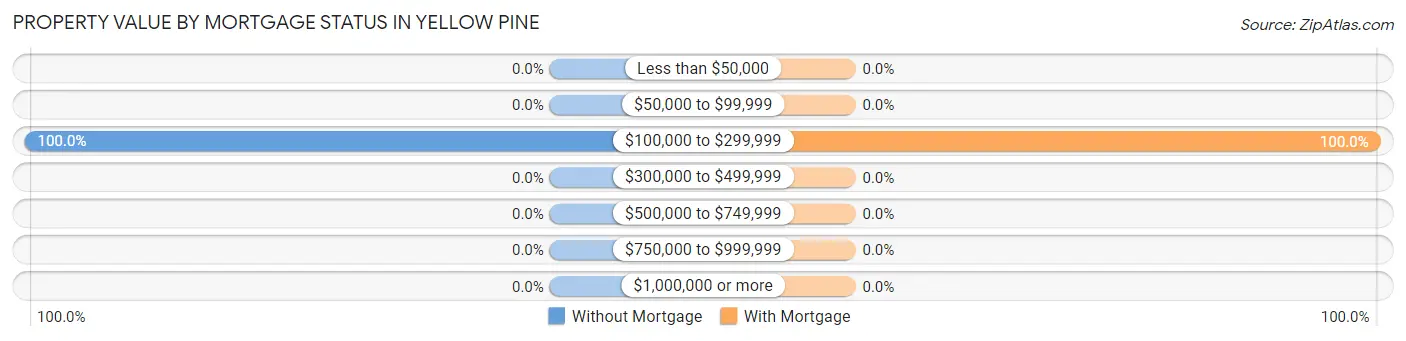
Property Value by Mortgage Status in Yellow Pine
Property Value
Without Mortgage
With Mortgage
Less than $50,000
0 (0.0%)
0 (0.0%)
$50,000 to $99,999
0 (0.0%)
0 (0.0%)
$100,000 to $299,999
32 (100.0%)
35 (100.0%)
$300,000 to $499,999
0 (0.0%)
0 (0.0%)
$500,000 to $749,999
0 (0.0%)
0 (0.0%)
$750,000 to $999,999
0 (0.0%)
0 (0.0%)
$1,000,000 or more
0 (0.0%)
0 (0.0%)
Total
32 (100.0%)
35 (100.0%)
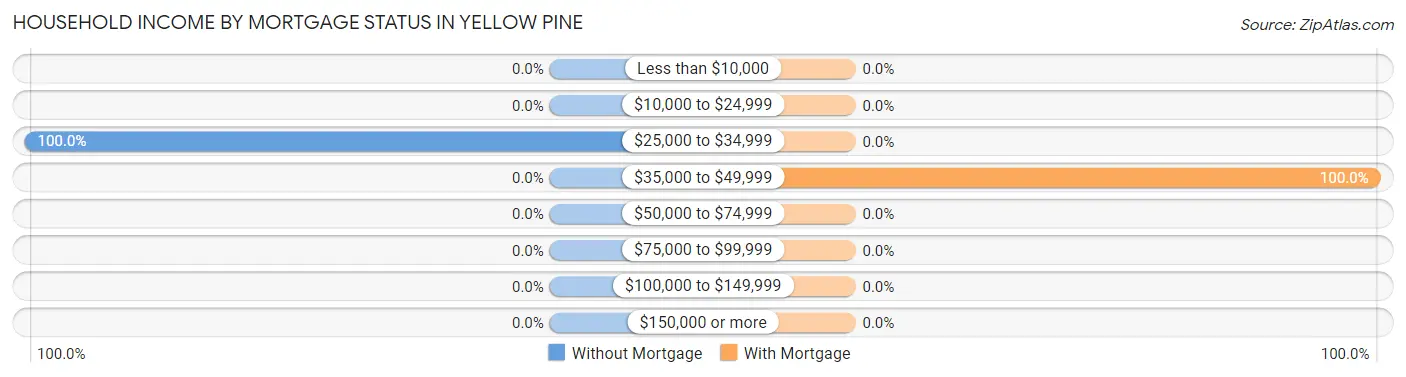
Household Income by Mortgage Status in Yellow Pine
Household Income
Without Mortgage
With Mortgage
Less than $10,000
0 (0.0%)
0 (0.0%)
$10,000 to $24,999
0 (0.0%)
0 (0.0%)
$25,000 to $34,999
32 (100.0%)
0 (0.0%)
$35,000 to $49,999
0 (0.0%)
35 (100.0%)
$50,000 to $74,999
0 (0.0%)
0 (0.0%)
$75,000 to $99,999
0 (0.0%)
0 (0.0%)
$100,000 to $149,999
0 (0.0%)
0 (0.0%)
$150,000 or more
0 (0.0%)
0 (0.0%)
Total
32 (100.0%)
35 (100.0%)
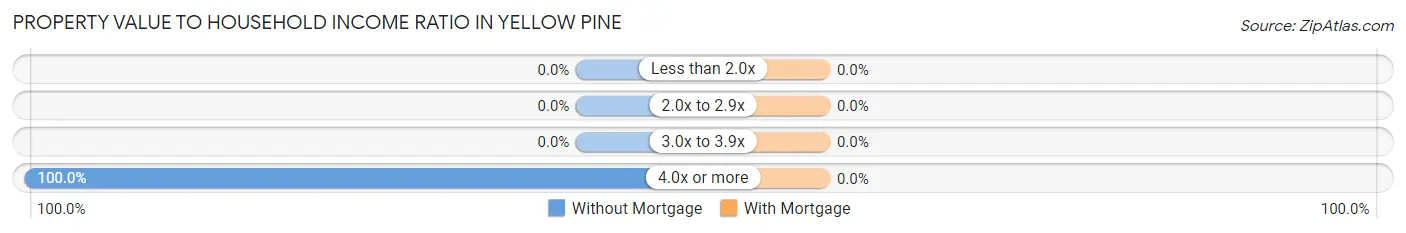
Property Value to Household Income Ratio in Yellow Pine
Value-to-Income Ratio
Without Mortgage
With Mortgage
Less than 2.0x
0 (0.0%)
0 (0.0%)
2.0x to 2.9x
0 (0.0%)
0 (0.0%)
3.0x to 3.9x
0 (0.0%)
0 (0.0%)
4.0x or more
32 (100.0%)
0 (0.0%)
Total
32 (100.0%)
35 (100.0%)
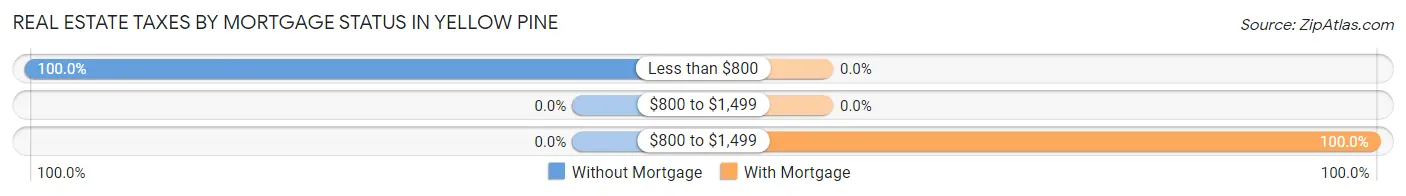
Real Estate Taxes by Mortgage Status in Yellow Pine
Property Taxes
Without Mortgage
With Mortgage
Less than $800
32 (100.0%)
0 (0.0%)
$800 to $1,499
0 (0.0%)
0 (0.0%)
$800 to $1,499
0 (0.0%)
35 (100.0%)
Total
32 (100.0%)
35 (100.0%)
Health & Disability in Yellow Pine
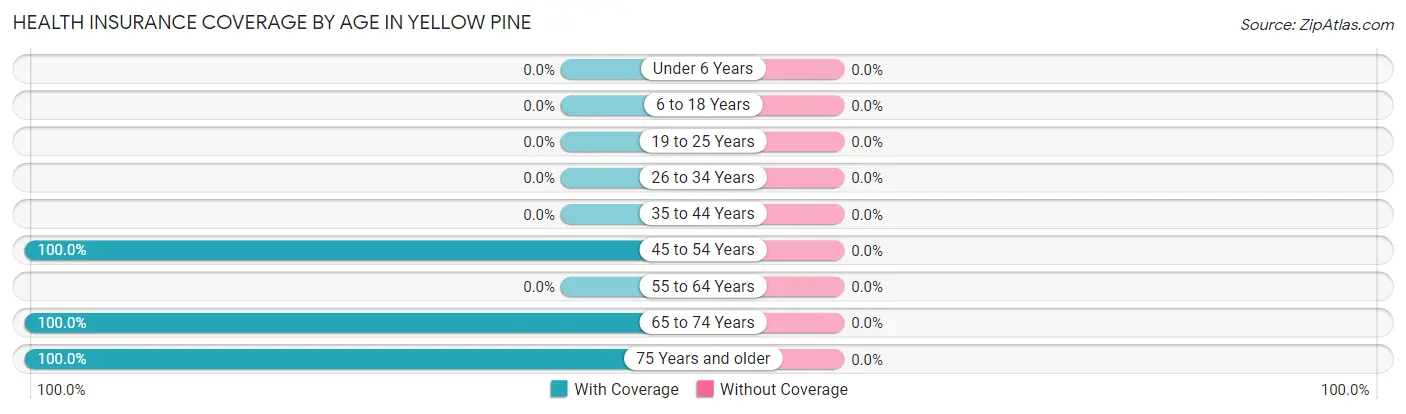
Health Insurance Coverage by Age in Yellow Pine
Age Bracket
With Coverage
Without Coverage
Under 6 Years
0 (0.0%)
0 (0.0%)
6 to 18 Years
0 (0.0%)
0 (0.0%)
19 to 25 Years
0 (0.0%)
0 (0.0%)
26 to 34 Years
0 (0.0%)
0 (0.0%)
35 to 44 Years
0 (0.0%)
0 (0.0%)
45 to 54 Years
231 (100.0%)
0 (0.0%)
55 to 64 Years
0 (0.0%)
0 (0.0%)
65 to 74 Years
61 (100.0%)
0 (0.0%)
75 Years and older
35 (100.0%)
0 (0.0%)
Total
327 (100.0%)
0 (0.0%)
Health Insurance Coverage by Citizenship Status in Yellow Pine
Citizenship Status
With Coverage
Without Coverage
Native Born
0 (0.0%)
0 (0.0%)
Foreign Born, Citizen
0 (0.0%)
0 (0.0%)
Foreign Born, not a Citizen
0 (0.0%)
0 (0.0%)
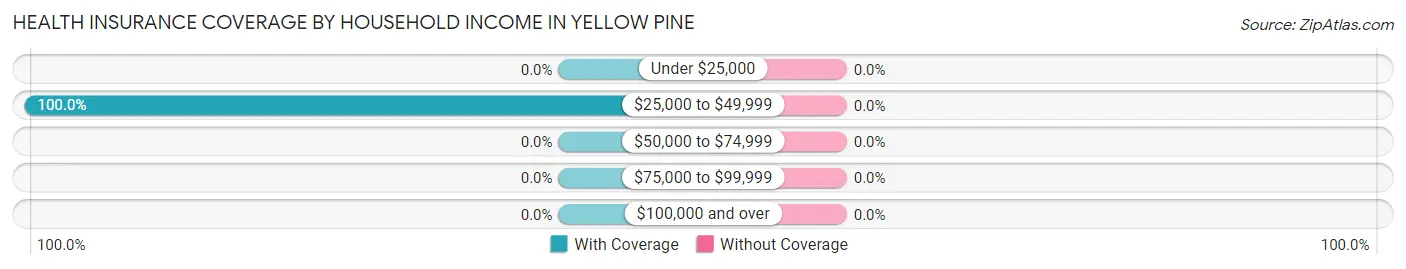
Health Insurance Coverage by Household Income in Yellow Pine
Household Income
With Coverage
Without Coverage
Under $25,000
0 (0.0%)
0 (0.0%)
$25,000 to $49,999
327 (100.0%)
0 (0.0%)
$50,000 to $74,999
0 (0.0%)
0 (0.0%)
$75,000 to $99,999
0 (0.0%)
0 (0.0%)
$100,000 and over
0 (0.0%)
0 (0.0%)
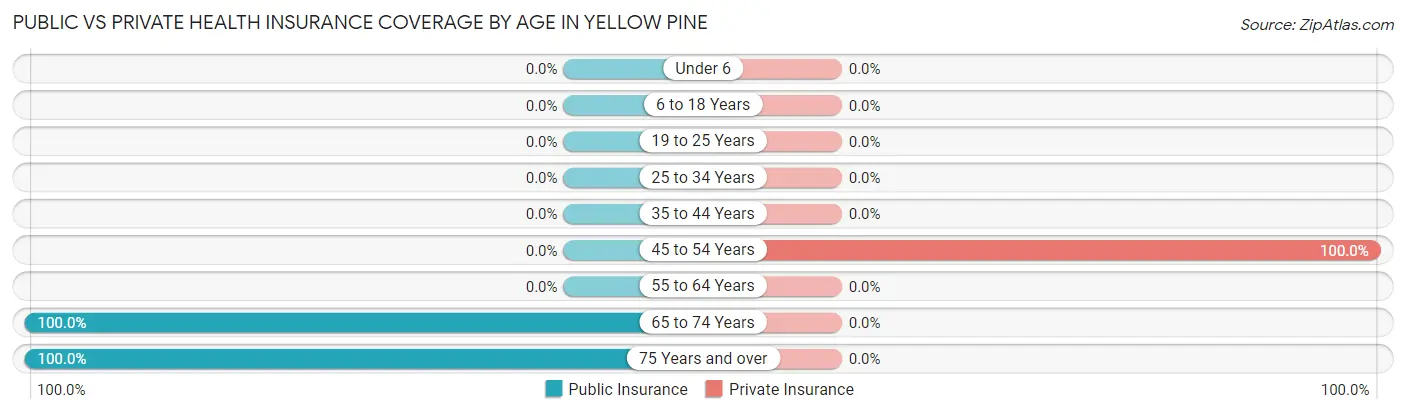
Public vs Private Health Insurance Coverage by Age in Yellow Pine
Age Bracket
Public Insurance
Private Insurance
Under 6
0 (0.0%)
0 (0.0%)
6 to 18 Years
0 (0.0%)
0 (0.0%)
19 to 25 Years
0 (0.0%)
0 (0.0%)
25 to 34 Years
0 (0.0%)
0 (0.0%)
35 to 44 Years
0 (0.0%)
0 (0.0%)
45 to 54 Years
0 (0.0%)
231 (100.0%)
55 to 64 Years
0 (0.0%)
0 (0.0%)
65 to 74 Years
61 (100.0%)
0 (0.0%)
75 Years and over
35 (100.0%)
0 (0.0%)
Total
96 (29.4%)
231 (70.6%)
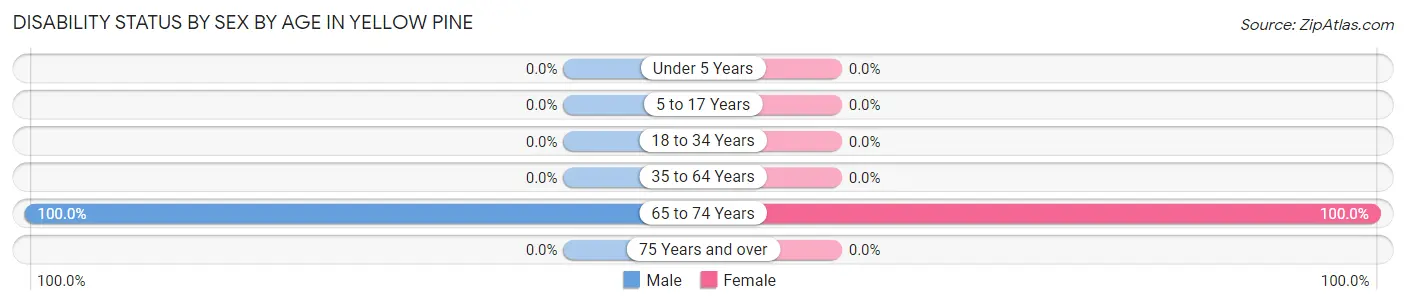
Disability Status by Sex by Age in Yellow Pine
Age Bracket
Male
Female
Under 5 Years
0 (0.0%)
0 (0.0%)
5 to 17 Years
0 (0.0%)
0 (0.0%)
18 to 34 Years
0 (0.0%)
0 (0.0%)
35 to 64 Years
0 (0.0%)
0 (0.0%)
65 to 74 Years
32 (100.0%)
29 (100.0%)
75 Years and over
0 (0.0%)
0 (0.0%)
Disability Class by Sex by Age in Yellow Pine
Disability Class: Hearing Difficulty
Age Bracket
Male
Female
Under 5 Years
0 (0.0%)
0 (0.0%)
5 to 17 Years
0 (0.0%)
0 (0.0%)
18 to 34 Years
0 (0.0%)
0 (0.0%)
35 to 64 Years
0 (0.0%)
0 (0.0%)
65 to 74 Years
0 (0.0%)
0 (0.0%)
75 Years and over
0 (0.0%)
0 (0.0%)
Disability Class: Vision Difficulty
Age Bracket
Male
Female
Under 5 Years
0 (0.0%)
0 (0.0%)
5 to 17 Years
0 (0.0%)
0 (0.0%)
18 to 34 Years
0 (0.0%)
0 (0.0%)
35 to 64 Years
0 (0.0%)
0 (0.0%)
65 to 74 Years
0 (0.0%)
0 (0.0%)
75 Years and over
0 (0.0%)
0 (0.0%)
Disability Class: Cognitive Difficulty
Age Bracket
Male
Female
5 to 17 Years
0 (0.0%)
0 (0.0%)
18 to 34 Years
0 (0.0%)
0 (0.0%)
35 to 64 Years
0 (0.0%)
0 (0.0%)
65 to 74 Years
0 (0.0%)
0 (0.0%)
75 Years and over
0 (0.0%)
0 (0.0%)
Disability Class: Ambulatory Difficulty
Age Bracket
Male
Female
5 to 17 Years
0 (0.0%)
0 (0.0%)
18 to 34 Years
0 (0.0%)
0 (0.0%)
35 to 64 Years
0 (0.0%)
0 (0.0%)
65 to 74 Years
32 (100.0%)
29 (100.0%)
75 Years and over
0 (0.0%)
0 (0.0%)
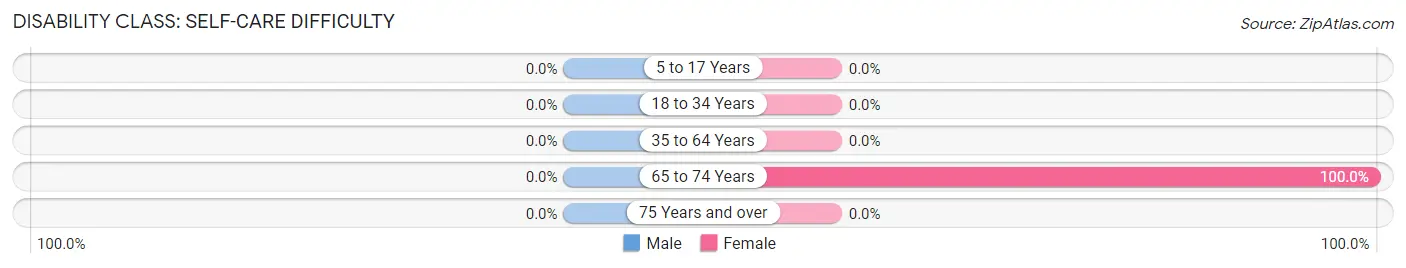
Disability Class: Self-Care Difficulty
Age Bracket
Male
Female
5 to 17 Years
0 (0.0%)
0 (0.0%)
18 to 34 Years
0 (0.0%)
0 (0.0%)
35 to 64 Years
0 (0.0%)
0 (0.0%)
65 to 74 Years
0 (0.0%)
29 (100.0%)
75 Years and over
0 (0.0%)
0 (0.0%)
Technology Access in Yellow Pine
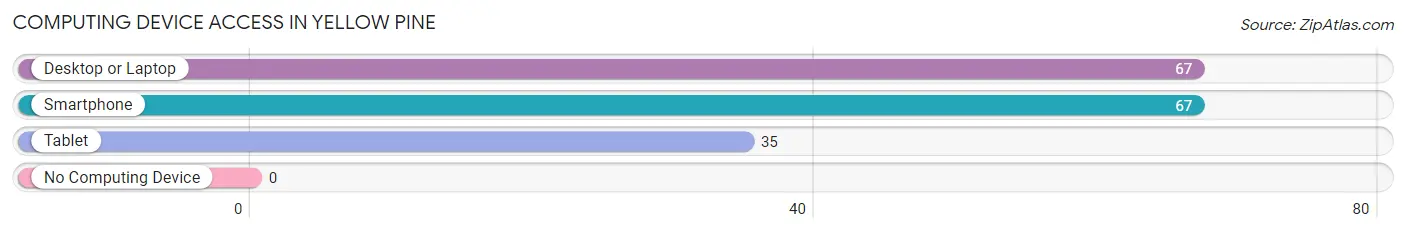
Computing Device Access in Yellow Pine
Device Type
# Households
% Households
Desktop or Laptop
67
100.0%
Smartphone
67
100.0%
Tablet
35
52.2%
No Computing Device
0
0.0%
Total
67
100.0%
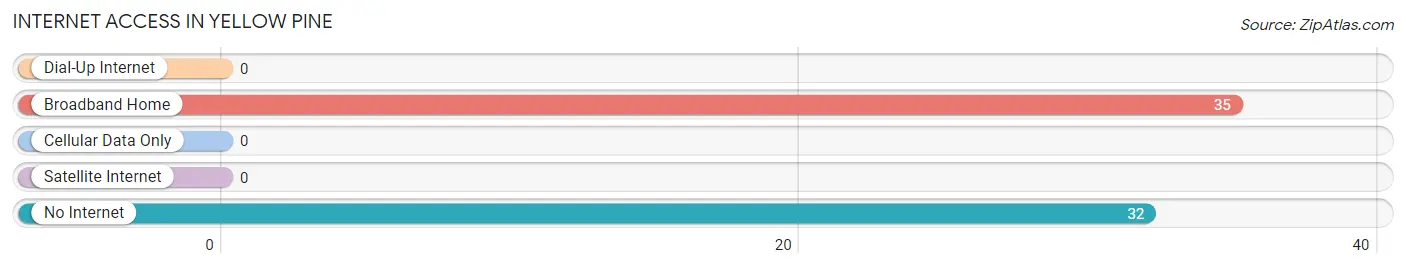
Internet Access in Yellow Pine
Internet Type
# Households
% Households
Dial-Up Internet
0
0.0%
Broadband Home
35
52.2%
Cellular Data Only
0
0.0%
Satellite Internet
0
0.0%
No Internet
32
47.8%
Total
67
100.0%
Yellow Pine Summary
Pine, Idaho is a small town located in the western part of the state, in the heart of the Sawtooth National Forest. It is a rural community with a population of just over 500 people. The town is located in Valley County, and is surrounded by the Salmon River Mountains to the east, the White Cloud Mountains to the west, and the Sawtooth National Forest to the north.
Geography
Pine, Idaho is located in the western part of the state, in the heart of the Sawtooth National Forest. It is a rural community with a population of just over 500 people. The town is located in Valley County, and is surrounded by the Salmon River Mountains to the east, the White Cloud Mountains to the west, and the Sawtooth National Forest to the north. The town is situated at an elevation of 5,000 feet, and is surrounded by a variety of terrain, including mountains, forests, and meadows. The climate in Pine is generally mild, with temperatures ranging from the low 30s in the winter to the high 80s in the summer.
Economy
The economy of Pine, Idaho is largely based on tourism and recreation. The town is home to a variety of outdoor activities, including camping, fishing, hunting, hiking, and skiing. The nearby Sawtooth National Forest provides a variety of recreational opportunities, and the town is also home to a number of small businesses, including restaurants, shops, and lodging. The town is also home to a number of small farms and ranches, which provide local produce and livestock.
Demographics
As of the 2010 census, the population of Pine, Idaho was 514. The racial makeup of the town was 95.3% White, 0.2% African American, 0.4% Native American, 0.4% Asian, 0.2% Pacific Islander, 0.4% from other races, and 2.3% from two or more races. The median household income in Pine was $37,500, and the median family income was $41,250. The per capita income in Pine was $17,857.
Conclusion
Pine, Idaho is a small rural town located in the western part of the state, in the heart of the Sawtooth National Forest. The town is home to a variety of outdoor activities, and is also home to a number of small businesses and farms. The population of Pine is just over 500 people, and the town has a median household income of $37,500. Pine is a great place to visit for outdoor recreation, and is a great place to live for those looking for a rural lifestyle.
Common Questions
What is the Total Population of Yellow Pine?
Total Population of Yellow Pine is 327.
What is the Total Male Population of Yellow Pine?
Total Male Population of Yellow Pine is 166.
What is the Total Female Population of Yellow Pine?
Total Female Population of Yellow Pine is 161.
What is the Ratio of Males per 100 Females in Yellow Pine?
There are 103.11 Males per 100 Females in Yellow Pine.
What is the Ratio of Females per 100 Males in Yellow Pine?
There are 96.99 Females per 100 Males in Yellow Pine.
What is the Median Population Age in Yellow Pine?
Median Population Age in Yellow Pine is 49.3 Years.
What is the Average Family Size in Yellow Pine
Average Family Size in Yellow Pine is 4.9 People.
What is the Average Household Size in Yellow Pine
Average Household Size in Yellow Pine is 4.9 People.
What is Per Capita Income in Yellow Pine?
Per Capita income in Yellow Pine is $8,872.
What is Inequality or Gini Index in Yellow Pine?
Inequality or Gini Index in Yellow Pine is 0.03.
How Large is the Labor Force in Yellow Pine?
There are 99 People in the Labor Forcein in Yellow Pine.
What is the Percentage of People in the Labor Force in Yellow Pine?
30.3% of People are in the Labor Force in Yellow Pine.
Report Title
Report Link
HTML Copy & Paste Link
Social Media
Copy and paste the folowing code into any webpage where you would like this interactive chart to display