Zip Codes with the Highest Percentage of Population Employed in Transportation & Warehousing in Hawaii
RELATED REPORTS & OPTIONS
Transportation & Warehousing
Hawaii
Compare Zip Codes
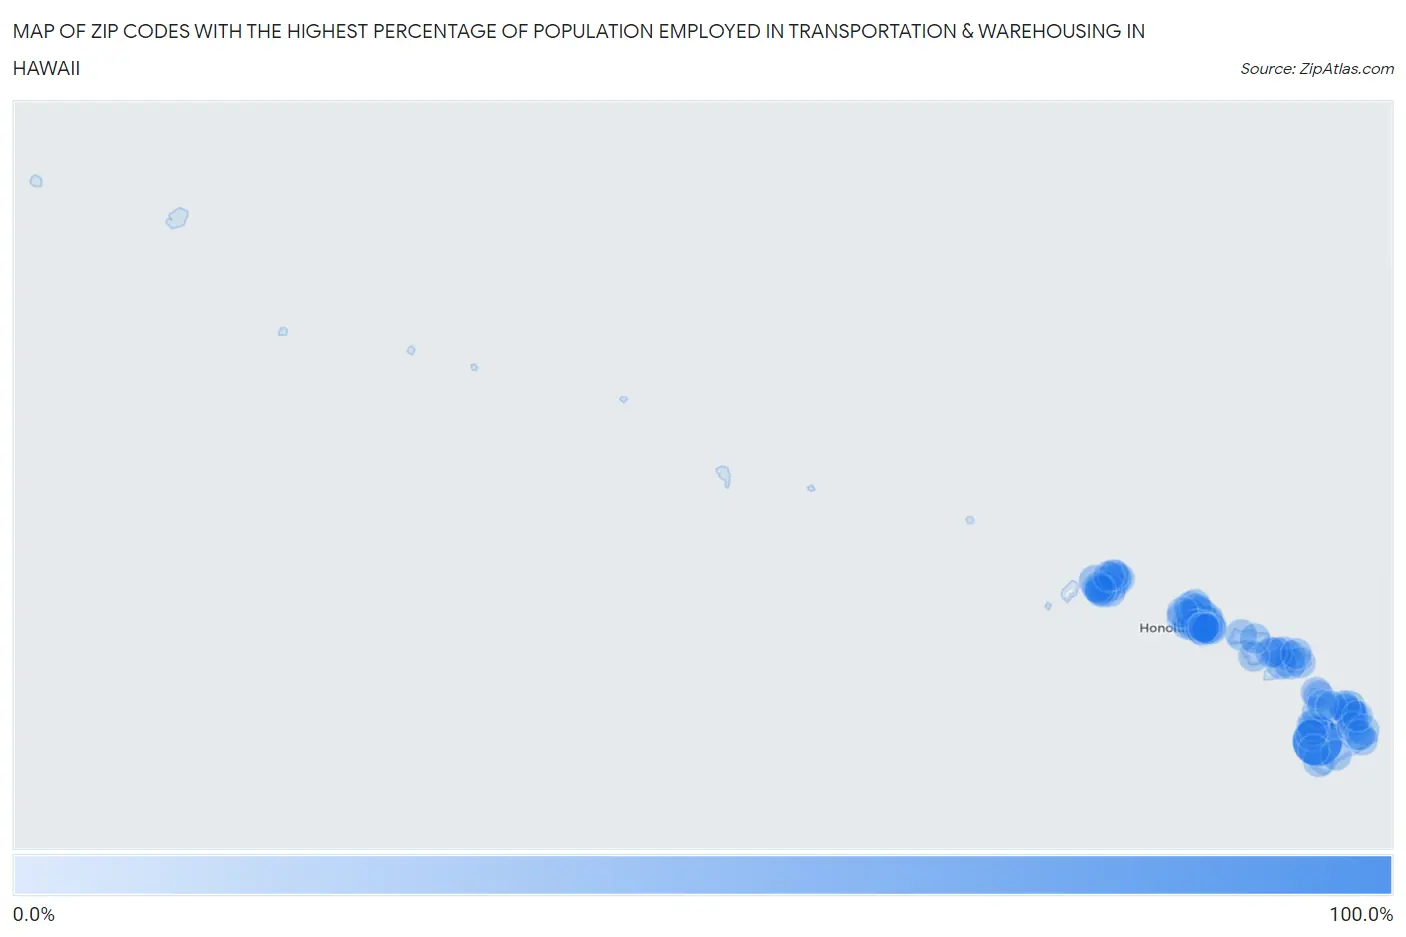
Map of Zip Codes with the Highest Percentage of Population Employed in Transportation & Warehousing in Hawaii
0.0%
100.0%
Zip Codes with the Highest Percentage of Population Employed in Transportation & Warehousing in Hawaii
| Zip Code | % Employed | vs State | vs National | |
| 1. | 96726 | 100.0% | 5.4%(+94.6)#1 | 4.9%(+95.1)#14 |
| 2. | 96781 | 18.5% | 5.4%(+13.1)#2 | 4.9%(+13.6)#635 |
| 3. | 96764 | 16.6% | 5.4%(+11.1)#3 | 4.9%(+11.6)#838 |
| 4. | 96710 | 16.2% | 5.4%(+10.8)#4 | 4.9%(+11.3)#873 |
| 5. | 96863 | 13.7% | 5.4%(+8.28)#5 | 4.9%(+8.78)#1,339 |
| 6. | 96752 | 10.9% | 5.4%(+5.41)#6 | 4.9%(+5.91)#2,392 |
| 7. | 96773 | 10.3% | 5.4%(+4.90)#7 | 4.9%(+5.40)#2,680 |
| 8. | 96703 | 9.4% | 5.4%(+3.93)#8 | 4.9%(+4.43)#3,334 |
| 9. | 96701 | 8.8% | 5.4%(+3.40)#9 | 4.9%(+3.90)#3,881 |
| 10. | 96717 | 8.8% | 5.4%(+3.36)#10 | 4.9%(+3.86)#3,922 |
| 11. | 96730 | 8.8% | 5.4%(+3.32)#11 | 4.9%(+3.82)#3,972 |
| 12. | 96813 | 8.2% | 5.4%(+2.71)#12 | 4.9%(+3.21)#4,690 |
| 13. | 96779 | 7.7% | 5.4%(+2.28)#13 | 4.9%(+2.78)#5,286 |
| 14. | 96792 | 7.6% | 5.4%(+2.17)#14 | 4.9%(+2.67)#5,459 |
| 15. | 96795 | 7.5% | 5.4%(+2.07)#15 | 4.9%(+2.57)#5,614 |
| 16. | 96826 | 7.3% | 5.4%(+1.82)#16 | 4.9%(+2.32)#6,063 |
| 17. | 96782 | 7.2% | 5.4%(+1.78)#17 | 4.9%(+2.28)#6,137 |
| 18. | 96712 | 7.2% | 5.4%(+1.73)#18 | 4.9%(+2.23)#6,223 |
| 19. | 96815 | 7.0% | 5.4%(+1.55)#19 | 4.9%(+2.05)#6,569 |
| 20. | 96751 | 6.7% | 5.4%(+1.28)#20 | 4.9%(+1.78)#7,107 |
| 21. | 96789 | 6.5% | 5.4%(+1.10)#21 | 4.9%(+1.60)#7,468 |
| 22. | 96744 | 6.5% | 5.4%(+1.02)#22 | 4.9%(+1.51)#7,650 |
| 23. | 96766 | 6.3% | 5.4%(+0.823)#23 | 4.9%(+1.32)#8,127 |
| 24. | 96731 | 6.3% | 5.4%(+0.811)#24 | 4.9%(+1.31)#8,149 |
| 25. | 96797 | 6.2% | 5.4%(+0.801)#25 | 4.9%(+1.30)#8,189 |
| 26. | 96707 | 6.1% | 5.4%(+0.668)#26 | 4.9%(+1.17)#8,504 |
| 27. | 96732 | 6.1% | 5.4%(+0.620)#27 | 4.9%(+1.12)#8,632 |
| 28. | 96729 | 6.0% | 5.4%(+0.591)#28 | 4.9%(+1.09)#8,698 |
| 29. | 96817 | 6.0% | 5.4%(+0.583)#29 | 4.9%(+1.08)#8,722 |
| 30. | 96776 | 5.9% | 5.4%(+0.472)#30 | 4.9%(+0.971)#8,987 |
| 31. | 96768 | 5.9% | 5.4%(+0.450)#31 | 4.9%(+0.949)#9,041 |
| 32. | 96746 | 5.8% | 5.4%(+0.334)#32 | 4.9%(+0.833)#9,402 |
| 33. | 96786 | 5.7% | 5.4%(+0.266)#33 | 4.9%(+0.765)#9,629 |
| 34. | 96737 | 5.6% | 5.4%(+0.183)#34 | 4.9%(+0.682)#9,868 |
| 35. | 96706 | 5.4% | 5.4%(-0.026)#35 | 4.9%(+0.473)#10,500 |
| 36. | 96819 | 5.4% | 5.4%(-0.048)#36 | 4.9%(+0.451)#10,579 |
| 37. | 96734 | 5.4% | 5.4%(-0.049)#37 | 4.9%(+0.450)#10,587 |
| 38. | 96825 | 5.3% | 5.4%(-0.115)#38 | 4.9%(+0.384)#10,824 |
| 39. | 96756 | 5.3% | 5.4%(-0.174)#39 | 4.9%(+0.325)#10,995 |
| 40. | 96790 | 5.2% | 5.4%(-0.284)#40 | 4.9%(+0.215)#11,393 |
| 41. | 96705 | 5.1% | 5.4%(-0.296)#41 | 4.9%(+0.203)#11,435 |
| 42. | 96741 | 5.0% | 5.4%(-0.402)#42 | 4.9%(+0.097)#11,805 |
| 43. | 96822 | 4.8% | 5.4%(-0.615)#43 | 4.9%(-0.116)#12,513 |
| 44. | 96762 | 4.8% | 5.4%(-0.648)#44 | 4.9%(-0.149)#12,655 |
| 45. | 96818 | 4.8% | 5.4%(-0.651)#45 | 4.9%(-0.152)#12,668 |
| 46. | 96753 | 4.7% | 5.4%(-0.718)#46 | 4.9%(-0.220)#12,929 |
| 47. | 96716 | 4.7% | 5.4%(-0.783)#47 | 4.9%(-0.284)#13,169 |
| 48. | 96769 | 4.6% | 5.4%(-0.830)#48 | 4.9%(-0.331)#13,341 |
| 49. | 96725 | 4.6% | 5.4%(-0.861)#49 | 4.9%(-0.362)#13,462 |
| 50. | 96738 | 4.4% | 5.4%(-1.05)#50 | 4.9%(-0.556)#14,214 |
| 51. | 96740 | 4.3% | 5.4%(-1.12)#51 | 4.9%(-0.625)#14,504 |
| 52. | 96747 | 4.3% | 5.4%(-1.15)#52 | 4.9%(-0.650)#14,617 |
| 53. | 96754 | 4.2% | 5.4%(-1.24)#53 | 4.9%(-0.740)#14,991 |
| 54. | 96791 | 4.2% | 5.4%(-1.28)#54 | 4.9%(-0.786)#15,205 |
| 55. | 96713 | 4.2% | 5.4%(-1.29)#55 | 4.9%(-0.790)#15,232 |
| 56. | 96793 | 4.0% | 5.4%(-1.43)#56 | 4.9%(-0.935)#15,860 |
| 57. | 96774 | 3.8% | 5.4%(-1.64)#57 | 4.9%(-1.14)#16,757 |
| 58. | 96814 | 3.8% | 5.4%(-1.64)#58 | 4.9%(-1.14)#16,783 |
| 59. | 96771 | 3.7% | 5.4%(-1.71)#59 | 4.9%(-1.21)#17,067 |
| 60. | 96720 | 3.7% | 5.4%(-1.73)#60 | 4.9%(-1.23)#17,176 |
| 61. | 96750 | 3.7% | 5.4%(-1.76)#61 | 4.9%(-1.26)#17,277 |
| 62. | 96816 | 3.6% | 5.4%(-1.87)#62 | 4.9%(-1.37)#17,751 |
| 63. | 96777 | 3.3% | 5.4%(-2.13)#63 | 4.9%(-1.64)#18,880 |
| 64. | 96755 | 3.3% | 5.4%(-2.18)#64 | 4.9%(-1.68)#19,054 |
| 65. | 96749 | 3.2% | 5.4%(-2.20)#65 | 4.9%(-1.71)#19,177 |
| 66. | 96821 | 3.2% | 5.4%(-2.28)#66 | 4.9%(-1.78)#19,506 |
| 67. | 96796 | 2.9% | 5.4%(-2.51)#67 | 4.9%(-2.01)#20,542 |
| 68. | 96719 | 2.8% | 5.4%(-2.64)#68 | 4.9%(-2.14)#21,097 |
| 69. | 96722 | 2.7% | 5.4%(-2.72)#69 | 4.9%(-2.22)#21,436 |
| 70. | 96761 | 2.7% | 5.4%(-2.75)#70 | 4.9%(-2.26)#21,575 |
| 71. | 96763 | 2.6% | 5.4%(-2.84)#71 | 4.9%(-2.34)#21,970 |
| 72. | 96708 | 2.5% | 5.4%(-2.94)#72 | 4.9%(-2.44)#22,389 |
| 73. | 96704 | 2.4% | 5.4%(-3.01)#73 | 4.9%(-2.52)#22,702 |
| 74. | 96848 | 2.4% | 5.4%(-3.07)#74 | 4.9%(-2.57)#22,931 |
| 75. | 96778 | 1.9% | 5.4%(-3.52)#75 | 4.9%(-3.02)#24,524 |
| 76. | 96743 | 1.9% | 5.4%(-3.53)#76 | 4.9%(-3.03)#24,575 |
| 77. | 96760 | 1.8% | 5.4%(-3.66)#77 | 4.9%(-3.16)#24,987 |
| 78. | 96727 | 1.7% | 5.4%(-3.77)#78 | 4.9%(-3.27)#25,343 |
| 79. | 96748 | 1.6% | 5.4%(-3.85)#79 | 4.9%(-3.35)#25,565 |
| 80. | 96783 | 1.2% | 5.4%(-4.20)#80 | 4.9%(-3.70)#26,496 |
1
Common Questions
What are the Top 10 Zip Codes with the Highest Percentage of Population Employed in Transportation & Warehousing in Hawaii?
Top 10 Zip Codes with the Highest Percentage of Population Employed in Transportation & Warehousing in Hawaii are:
What zip code has the Highest Percentage of Population Employed in Transportation & Warehousing in Hawaii?
96726 has the Highest Percentage of Population Employed in Transportation & Warehousing in Hawaii with 100.0%.
What is the Percentage of Population Employed in Transportation & Warehousing in the State of Hawaii?
Percentage of Population Employed in Transportation & Warehousing in Hawaii is 5.4%.
What is the Percentage of Population Employed in Transportation & Warehousing in the United States?
Percentage of Population Employed in Transportation & Warehousing in the United States is 4.9%.