Zip Codes with the Highest Percentage of Population Employed in Finance & Insurance in Hawaii
RELATED REPORTS & OPTIONS
Finance & Insurance
Hawaii
Compare Zip Codes
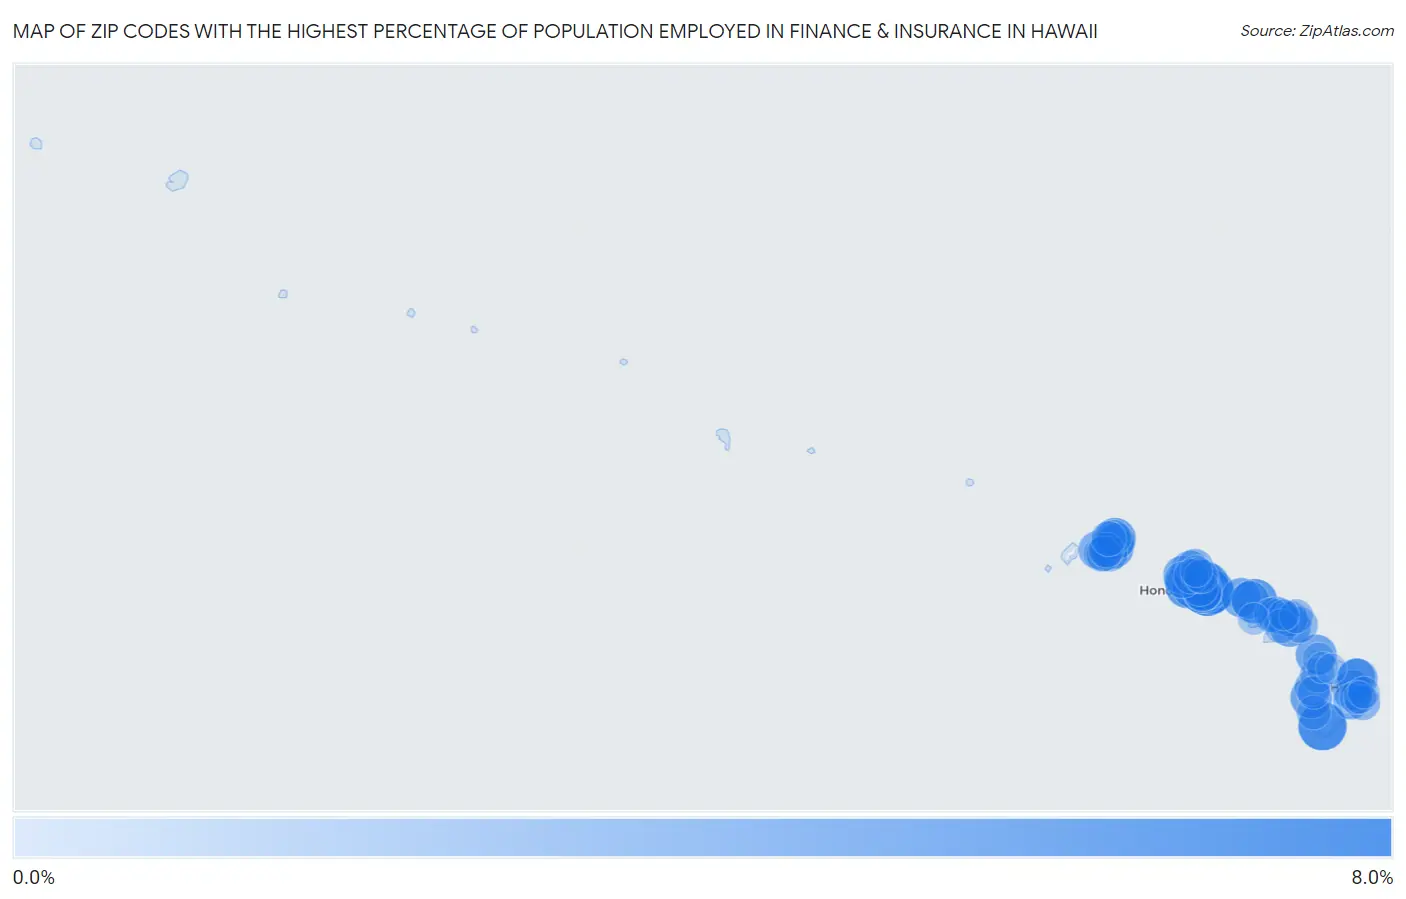
Map of Zip Codes with the Highest Percentage of Population Employed in Finance & Insurance in Hawaii
0.0%
8.0%
Zip Codes with the Highest Percentage of Population Employed in Finance & Insurance in Hawaii
| Zip Code | % Employed | vs State | vs National | |
| 1. | 96821 | 7.0% | 3.4%(+3.59)#1 | 4.8%(+2.25)#4,214 |
| 2. | 96772 | 6.5% | 3.4%(+3.11)#2 | 4.8%(+1.77)#4,918 |
| 3. | 96813 | 5.8% | 3.4%(+2.41)#3 | 4.8%(+1.07)#6,214 |
| 4. | 96825 | 5.5% | 3.4%(+2.10)#4 | 4.8%(+0.756)#6,918 |
| 5. | 96748 | 5.2% | 3.4%(+1.77)#5 | 4.8%(+0.434)#7,720 |
| 6. | 96818 | 5.1% | 3.4%(+1.72)#6 | 4.8%(+0.379)#7,859 |
| 7. | 96707 | 4.9% | 3.4%(+1.48)#7 | 4.8%(+0.143)#8,552 |
| 8. | 96816 | 4.9% | 3.4%(+1.45)#8 | 4.8%(+0.107)#8,675 |
| 9. | 96814 | 4.8% | 3.4%(+1.34)#9 | 4.8%(-0.005)#8,996 |
| 10. | 96782 | 4.7% | 3.4%(+1.32)#10 | 4.8%(-0.023)#9,071 |
| 11. | 96822 | 4.7% | 3.4%(+1.22)#11 | 4.8%(-0.116)#9,356 |
| 12. | 96744 | 4.6% | 3.4%(+1.19)#12 | 4.8%(-0.147)#9,459 |
| 13. | 96734 | 4.5% | 3.4%(+1.10)#13 | 4.8%(-0.240)#9,747 |
| 14. | 96766 | 4.4% | 3.4%(+1.02)#14 | 4.8%(-0.324)#10,037 |
| 15. | 96817 | 4.2% | 3.4%(+0.779)#15 | 4.8%(-0.561)#10,837 |
| 16. | 96703 | 4.2% | 3.4%(+0.776)#16 | 4.8%(-0.564)#10,845 |
| 17. | 96750 | 4.1% | 3.4%(+0.705)#17 | 4.8%(-0.635)#11,085 |
| 18. | 96790 | 3.9% | 3.4%(+0.475)#18 | 4.8%(-0.865)#11,974 |
| 19. | 96701 | 3.9% | 3.4%(+0.445)#19 | 4.8%(-0.895)#12,105 |
| 20. | 96719 | 3.9% | 3.4%(+0.432)#20 | 4.8%(-0.908)#12,157 |
| 21. | 96797 | 3.7% | 3.4%(+0.266)#21 | 4.8%(-1.07)#12,789 |
| 22. | 96706 | 3.7% | 3.4%(+0.233)#22 | 4.8%(-1.11)#12,920 |
| 23. | 96789 | 3.6% | 3.4%(+0.174)#23 | 4.8%(-1.17)#13,148 |
| 24. | 96783 | 3.6% | 3.4%(+0.159)#24 | 4.8%(-1.18)#13,209 |
| 25. | 96795 | 3.5% | 3.4%(+0.041)#25 | 4.8%(-1.30)#13,735 |
| 26. | 96720 | 3.4% | 3.4%(+0.017)#26 | 4.8%(-1.32)#13,850 |
| 27. | 96826 | 3.4% | 3.4%(-0.067)#27 | 4.8%(-1.41)#14,202 |
| 28. | 96729 | 3.2% | 3.4%(-0.208)#28 | 4.8%(-1.55)#14,827 |
| 29. | 96712 | 2.9% | 3.4%(-0.486)#29 | 4.8%(-1.83)#16,088 |
| 30. | 96791 | 2.9% | 3.4%(-0.509)#30 | 4.8%(-1.85)#16,195 |
| 31. | 96728 | 2.9% | 3.4%(-0.557)#31 | 4.8%(-1.90)#16,418 |
| 32. | 96796 | 2.7% | 3.4%(-0.690)#32 | 4.8%(-2.03)#17,051 |
| 33. | 96757 | 2.7% | 3.4%(-0.697)#33 | 4.8%(-2.04)#17,080 |
| 34. | 96815 | 2.7% | 3.4%(-0.763)#34 | 4.8%(-2.10)#17,394 |
| 35. | 96819 | 2.5% | 3.4%(-0.966)#35 | 4.8%(-2.31)#18,373 |
| 36. | 96793 | 2.4% | 3.4%(-1.03)#36 | 4.8%(-2.37)#18,698 |
| 37. | 96731 | 2.4% | 3.4%(-1.07)#37 | 4.8%(-2.41)#18,854 |
| 38. | 96746 | 2.3% | 3.4%(-1.11)#38 | 4.8%(-2.45)#19,029 |
| 39. | 96792 | 2.2% | 3.4%(-1.23)#39 | 4.8%(-2.57)#19,582 |
| 40. | 96785 | 2.2% | 3.4%(-1.26)#40 | 4.8%(-2.60)#19,736 |
| 41. | 96732 | 2.1% | 3.4%(-1.29)#41 | 4.8%(-2.63)#19,883 |
| 42. | 96740 | 2.1% | 3.4%(-1.37)#42 | 4.8%(-2.71)#20,221 |
| 43. | 96713 | 2.0% | 3.4%(-1.47)#43 | 4.8%(-2.81)#20,659 |
| 44. | 96768 | 1.9% | 3.4%(-1.50)#44 | 4.8%(-2.84)#20,797 |
| 45. | 96778 | 1.8% | 3.4%(-1.59)#45 | 4.8%(-2.93)#21,160 |
| 46. | 96716 | 1.8% | 3.4%(-1.64)#46 | 4.8%(-2.98)#21,385 |
| 47. | 96756 | 1.8% | 3.4%(-1.64)#47 | 4.8%(-2.98)#21,402 |
| 48. | 96754 | 1.8% | 3.4%(-1.66)#48 | 4.8%(-3.00)#21,475 |
| 49. | 96705 | 1.7% | 3.4%(-1.68)#49 | 4.8%(-3.02)#21,565 |
| 50. | 96717 | 1.7% | 3.4%(-1.71)#50 | 4.8%(-3.05)#21,675 |
| 51. | 96738 | 1.7% | 3.4%(-1.73)#51 | 4.8%(-3.07)#21,777 |
| 52. | 96741 | 1.7% | 3.4%(-1.76)#52 | 4.8%(-3.10)#21,874 |
| 53. | 96722 | 1.6% | 3.4%(-1.79)#53 | 4.8%(-3.13)#22,009 |
| 54. | 96786 | 1.6% | 3.4%(-1.81)#54 | 4.8%(-3.15)#22,090 |
| 55. | 96761 | 1.5% | 3.4%(-1.92)#55 | 4.8%(-3.26)#22,487 |
| 56. | 96753 | 1.4% | 3.4%(-2.02)#56 | 4.8%(-3.36)#22,896 |
| 57. | 96730 | 1.3% | 3.4%(-2.09)#57 | 4.8%(-3.43)#23,181 |
| 58. | 96704 | 1.3% | 3.4%(-2.11)#58 | 4.8%(-3.45)#23,275 |
| 59. | 96708 | 1.3% | 3.4%(-2.13)#59 | 4.8%(-3.47)#23,318 |
| 60. | 96771 | 1.1% | 3.4%(-2.31)#60 | 4.8%(-3.65)#23,923 |
| 61. | 96725 | 0.85% | 3.4%(-2.57)#61 | 4.8%(-3.91)#24,685 |
| 62. | 96760 | 0.75% | 3.4%(-2.68)#62 | 4.8%(-4.02)#24,963 |
| 63. | 96755 | 0.69% | 3.4%(-2.74)#63 | 4.8%(-4.08)#25,138 |
| 64. | 96749 | 0.56% | 3.4%(-2.86)#64 | 4.8%(-4.20)#25,401 |
| 65. | 96763 | 0.53% | 3.4%(-2.90)#65 | 4.8%(-4.24)#25,474 |
| 66. | 96762 | 0.51% | 3.4%(-2.92)#66 | 4.8%(-4.26)#25,528 |
| 67. | 96743 | 0.35% | 3.4%(-3.07)#67 | 4.8%(-4.41)#25,818 |
| 68. | 96779 | 0.14% | 3.4%(-3.29)#68 | 4.8%(-4.63)#26,096 |
| 69. | 96727 | 0.093% | 3.4%(-3.33)#69 | 4.8%(-4.67)#26,123 |
1
Common Questions
What are the Top 10 Zip Codes with the Highest Percentage of Population Employed in Finance & Insurance in Hawaii?
Top 10 Zip Codes with the Highest Percentage of Population Employed in Finance & Insurance in Hawaii are:
What zip code has the Highest Percentage of Population Employed in Finance & Insurance in Hawaii?
96821 has the Highest Percentage of Population Employed in Finance & Insurance in Hawaii with 7.0%.
What is the Percentage of Population Employed in Finance & Insurance in the State of Hawaii?
Percentage of Population Employed in Finance & Insurance in Hawaii is 3.4%.
What is the Percentage of Population Employed in Finance & Insurance in the United States?
Percentage of Population Employed in Finance & Insurance in the United States is 4.8%.