Zip Codes with the Highest Percentage of Population Employed in Arts, Entertainment & Recreation in Hawaii
RELATED REPORTS & OPTIONS
Arts, Entertainment & Recreation
Hawaii
Compare Zip Codes
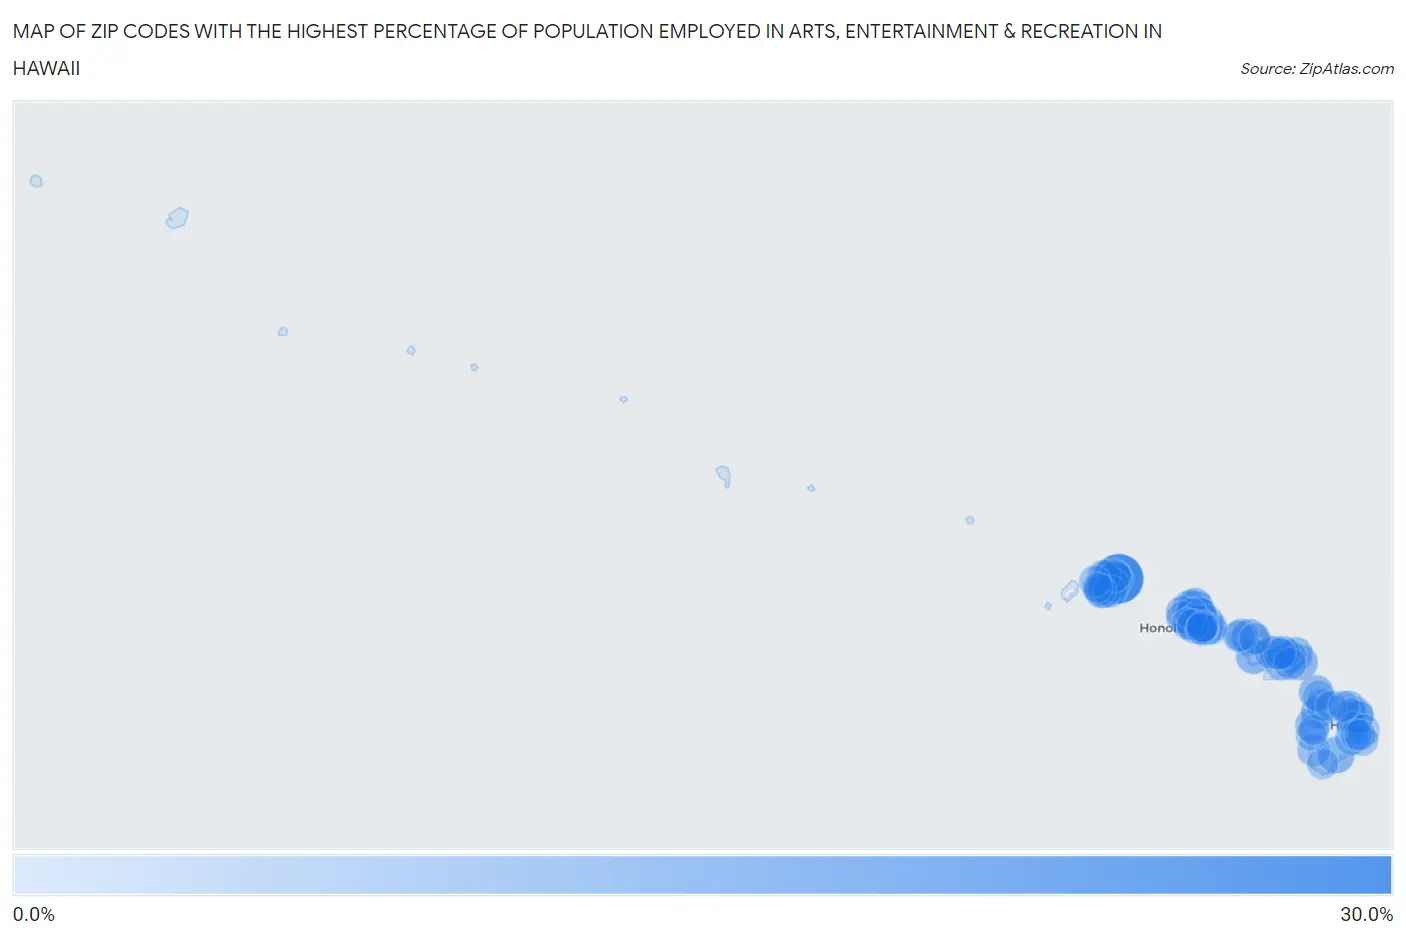
Map of Zip Codes with the Highest Percentage of Population Employed in Arts, Entertainment & Recreation in Hawaii
0.0%
30.0%
Zip Codes with the Highest Percentage of Population Employed in Arts, Entertainment & Recreation in Hawaii
| Zip Code | % Employed | vs State | vs National | |
| 1. | 96751 | 26.9% | 2.5%(+24.4)#1 | 2.1%(+24.8)#103 |
| 2. | 96860 | 9.1% | 2.5%(+6.62)#2 | 2.1%(+7.04)#832 |
| 3. | 96777 | 8.8% | 2.5%(+6.27)#3 | 2.1%(+6.69)#894 |
| 4. | 96757 | 8.5% | 2.5%(+6.02)#4 | 2.1%(+6.45)#936 |
| 5. | 96763 | 7.3% | 2.5%(+4.77)#5 | 2.1%(+5.19)#1,239 |
| 6. | 96762 | 7.2% | 2.5%(+4.71)#6 | 2.1%(+5.13)#1,263 |
| 7. | 96713 | 7.1% | 2.5%(+4.58)#7 | 2.1%(+5.01)#1,305 |
| 8. | 96728 | 6.7% | 2.5%(+4.19)#8 | 2.1%(+4.62)#1,416 |
| 9. | 96741 | 6.5% | 2.5%(+3.99)#9 | 2.1%(+4.41)#1,504 |
| 10. | 96719 | 6.1% | 2.5%(+3.63)#10 | 2.1%(+4.06)#1,637 |
| 11. | 96712 | 6.0% | 2.5%(+3.48)#11 | 2.1%(+3.90)#1,709 |
| 12. | 96740 | 5.7% | 2.5%(+3.20)#12 | 2.1%(+3.62)#1,856 |
| 13. | 96731 | 5.4% | 2.5%(+2.93)#13 | 2.1%(+3.36)#1,999 |
| 14. | 96716 | 4.8% | 2.5%(+2.31)#14 | 2.1%(+2.73)#2,421 |
| 15. | 96722 | 4.6% | 2.5%(+2.07)#15 | 2.1%(+2.50)#2,650 |
| 16. | 96754 | 4.5% | 2.5%(+1.97)#16 | 2.1%(+2.40)#2,770 |
| 17. | 96764 | 4.4% | 2.5%(+1.91)#17 | 2.1%(+2.34)#2,823 |
| 18. | 96738 | 4.4% | 2.5%(+1.91)#18 | 2.1%(+2.34)#2,824 |
| 19. | 96753 | 4.4% | 2.5%(+1.90)#19 | 2.1%(+2.33)#2,835 |
| 20. | 96705 | 4.4% | 2.5%(+1.89)#20 | 2.1%(+2.32)#2,847 |
| 21. | 96746 | 4.4% | 2.5%(+1.87)#21 | 2.1%(+2.30)#2,869 |
| 22. | 96708 | 4.3% | 2.5%(+1.77)#22 | 2.1%(+2.19)#2,993 |
| 23. | 96791 | 4.1% | 2.5%(+1.56)#23 | 2.1%(+1.98)#3,241 |
| 24. | 96766 | 4.1% | 2.5%(+1.55)#24 | 2.1%(+1.98)#3,258 |
| 25. | 96793 | 3.9% | 2.5%(+1.39)#25 | 2.1%(+1.81)#3,492 |
| 26. | 96761 | 3.9% | 2.5%(+1.39)#26 | 2.1%(+1.81)#3,493 |
| 27. | 96768 | 3.7% | 2.5%(+1.22)#27 | 2.1%(+1.64)#3,739 |
| 28. | 96714 | 3.6% | 2.5%(+1.14)#28 | 2.1%(+1.57)#3,849 |
| 29. | 96779 | 3.5% | 2.5%(+1.00)#29 | 2.1%(+1.43)#4,107 |
| 30. | 96729 | 3.4% | 2.5%(+0.913)#30 | 2.1%(+1.34)#4,314 |
| 31. | 96704 | 3.4% | 2.5%(+0.896)#31 | 2.1%(+1.32)#4,350 |
| 32. | 96710 | 3.4% | 2.5%(+0.871)#32 | 2.1%(+1.30)#4,405 |
| 33. | 96795 | 3.4% | 2.5%(+0.854)#33 | 2.1%(+1.28)#4,437 |
| 34. | 96717 | 3.2% | 2.5%(+0.723)#34 | 2.1%(+1.15)#4,721 |
| 35. | 96756 | 3.0% | 2.5%(+0.516)#35 | 2.1%(+0.941)#5,292 |
| 36. | 96792 | 3.0% | 2.5%(+0.483)#36 | 2.1%(+0.907)#5,379 |
| 37. | 96743 | 2.9% | 2.5%(+0.439)#37 | 2.1%(+0.864)#5,515 |
| 38. | 96734 | 2.9% | 2.5%(+0.431)#38 | 2.1%(+0.856)#5,545 |
| 39. | 96785 | 2.9% | 2.5%(+0.431)#39 | 2.1%(+0.856)#5,546 |
| 40. | 96818 | 2.7% | 2.5%(+0.164)#40 | 2.1%(+0.589)#6,478 |
| 41. | 96816 | 2.7% | 2.5%(+0.153)#41 | 2.1%(+0.578)#6,519 |
| 42. | 96783 | 2.5% | 2.5%(-0.025)#42 | 2.1%(+0.400)#7,253 |
| 43. | 96790 | 2.4% | 2.5%(-0.091)#43 | 2.1%(+0.334)#7,563 |
| 44. | 96732 | 2.3% | 2.5%(-0.159)#44 | 2.1%(+0.266)#7,885 |
| 45. | 96821 | 2.3% | 2.5%(-0.167)#45 | 2.1%(+0.258)#7,925 |
| 46. | 96703 | 2.3% | 2.5%(-0.244)#46 | 2.1%(+0.181)#8,313 |
| 47. | 96744 | 2.2% | 2.5%(-0.344)#47 | 2.1%(+0.081)#8,843 |
| 48. | 96822 | 2.2% | 2.5%(-0.347)#48 | 2.1%(+0.077)#8,860 |
| 49. | 96797 | 2.1% | 2.5%(-0.368)#49 | 2.1%(+0.057)#8,992 |
| 50. | 96720 | 2.1% | 2.5%(-0.455)#50 | 2.1%(-0.030)#9,477 |
| 51. | 96789 | 2.0% | 2.5%(-0.499)#51 | 2.1%(-0.074)#9,723 |
| 52. | 96815 | 2.0% | 2.5%(-0.518)#52 | 2.1%(-0.093)#9,844 |
| 53. | 96747 | 1.9% | 2.5%(-0.598)#53 | 2.1%(-0.173)#10,331 |
| 54. | 96755 | 1.9% | 2.5%(-0.623)#54 | 2.1%(-0.198)#10,472 |
| 55. | 96782 | 1.9% | 2.5%(-0.633)#55 | 2.1%(-0.208)#10,520 |
| 56. | 96752 | 1.9% | 2.5%(-0.640)#56 | 2.1%(-0.215)#10,569 |
| 57. | 96770 | 1.9% | 2.5%(-0.656)#57 | 2.1%(-0.231)#10,681 |
| 58. | 96819 | 1.8% | 2.5%(-0.661)#58 | 2.1%(-0.236)#10,713 |
| 59. | 96748 | 1.8% | 2.5%(-0.675)#59 | 2.1%(-0.250)#10,802 |
| 60. | 96749 | 1.8% | 2.5%(-0.715)#60 | 2.1%(-0.290)#11,064 |
| 61. | 96825 | 1.7% | 2.5%(-0.770)#61 | 2.1%(-0.345)#11,469 |
| 62. | 96778 | 1.7% | 2.5%(-0.816)#62 | 2.1%(-0.392)#11,810 |
| 63. | 96701 | 1.6% | 2.5%(-0.868)#63 | 2.1%(-0.443)#12,165 |
| 64. | 96730 | 1.6% | 2.5%(-0.873)#64 | 2.1%(-0.448)#12,194 |
| 65. | 96826 | 1.6% | 2.5%(-0.884)#65 | 2.1%(-0.459)#12,268 |
| 66. | 96786 | 1.5% | 2.5%(-0.983)#66 | 2.1%(-0.558)#13,069 |
| 67. | 96813 | 1.5% | 2.5%(-0.994)#67 | 2.1%(-0.569)#13,156 |
| 68. | 96707 | 1.5% | 2.5%(-1.04)#68 | 2.1%(-0.616)#13,473 |
| 69. | 96706 | 1.4% | 2.5%(-1.06)#69 | 2.1%(-0.635)#13,620 |
| 70. | 96727 | 1.4% | 2.5%(-1.11)#70 | 2.1%(-0.688)#14,039 |
| 71. | 96771 | 1.4% | 2.5%(-1.12)#71 | 2.1%(-0.695)#14,092 |
| 72. | 96814 | 1.3% | 2.5%(-1.17)#72 | 2.1%(-0.748)#14,483 |
| 73. | 96772 | 1.3% | 2.5%(-1.22)#73 | 2.1%(-0.796)#14,817 |
| 74. | 96750 | 1.3% | 2.5%(-1.24)#74 | 2.1%(-0.811)#14,924 |
| 75. | 96817 | 1.2% | 2.5%(-1.27)#75 | 2.1%(-0.844)#15,193 |
| 76. | 96760 | 1.1% | 2.5%(-1.41)#76 | 2.1%(-0.986)#16,272 |
| 77. | 96725 | 0.81% | 2.5%(-1.70)#77 | 2.1%(-1.27)#18,338 |
| 78. | 96776 | 0.74% | 2.5%(-1.77)#78 | 2.1%(-1.34)#18,847 |
| 79. | 96796 | 0.20% | 2.5%(-2.31)#79 | 2.1%(-1.89)#22,217 |
1
Common Questions
What are the Top 10 Zip Codes with the Highest Percentage of Population Employed in Arts, Entertainment & Recreation in Hawaii?
Top 10 Zip Codes with the Highest Percentage of Population Employed in Arts, Entertainment & Recreation in Hawaii are:
What zip code has the Highest Percentage of Population Employed in Arts, Entertainment & Recreation in Hawaii?
96751 has the Highest Percentage of Population Employed in Arts, Entertainment & Recreation in Hawaii with 26.9%.
What is the Percentage of Population Employed in Arts, Entertainment & Recreation in the State of Hawaii?
Percentage of Population Employed in Arts, Entertainment & Recreation in Hawaii is 2.5%.
What is the Percentage of Population Employed in Arts, Entertainment & Recreation in the United States?
Percentage of Population Employed in Arts, Entertainment & Recreation in the United States is 2.1%.