Aiea, HI
Aiea Map
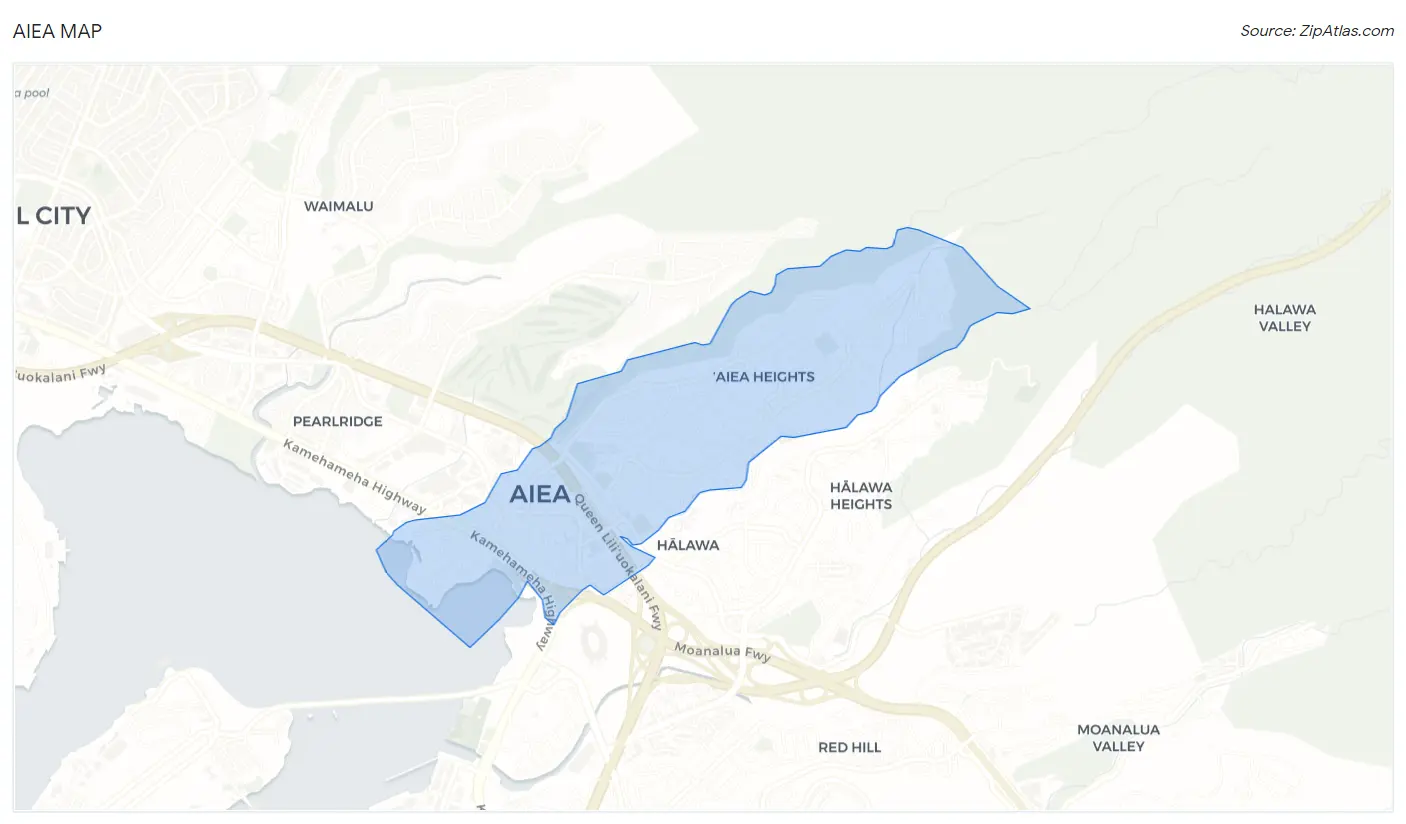
Aiea Overview
9,571
TOTAL POPULATION
4,742
MALE POPULATION
4,829
FEMALE POPULATION
98.20
MALES / 100 FEMALES
101.83
FEMALES / 100 MALES
41.3
MEDIAN AGE
3.8
AVG FAMILY SIZE
3.2
AVG HOUSEHOLD SIZE
$47,612
PER CAPITA INCOME
$149,565
AVG FAMILY INCOME
$130,507
AVG HOUSEHOLD INCOME
22.4%
WAGE / INCOME GAP [ % ]
77.6¢/ $1
WAGE / INCOME GAP [ $ ]
0.40
INEQUALITY / GINI INDEX
4,873
LABOR FORCE [ PEOPLE ]
62.9%
PERCENT IN LABOR FORCE
4.6%
UNEMPLOYMENT RATE
Aiea Zip Codes
Aiea Area Codes
Race in Aiea
The most populous races in Aiea are Asian (4,698 | 49.1%), Two or more Races (2,478 | 25.9%), and White / Caucasian (1,341 | 14.0%).
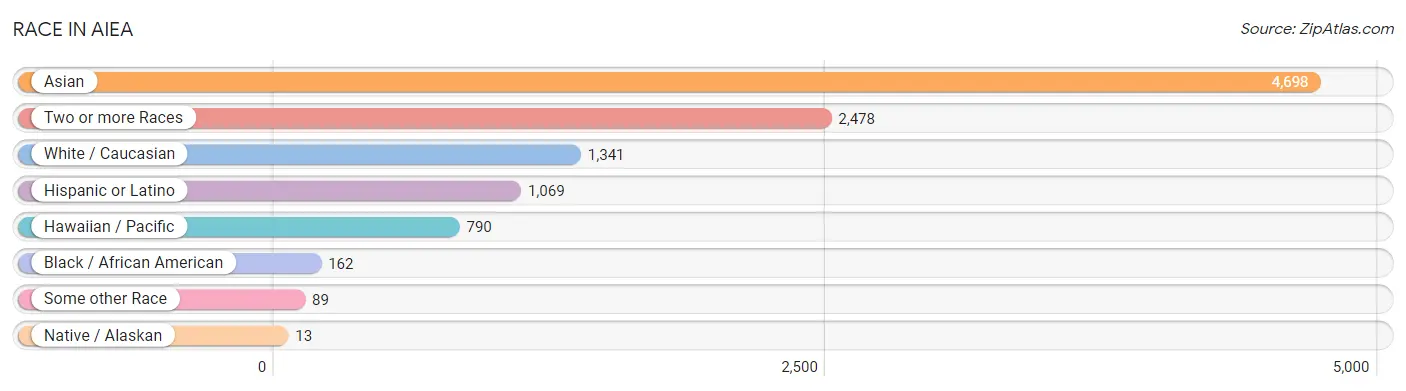
| Race | # Population | % Population |
| Asian | 4,698 | 49.1% |
| Black / African American | 162 | 1.7% |
| Hawaiian / Pacific | 790 | 8.3% |
| Hispanic or Latino | 1,069 | 11.2% |
| Native / Alaskan | 13 | 0.1% |
| White / Caucasian | 1,341 | 14.0% |
| Two or more Races | 2,478 | 25.9% |
| Some other Race | 89 | 0.9% |
| Total | 9,571 | 100.0% |
Ancestry in Aiea
The most populous ancestries reported in Aiea are Bhutanese (3,582 | 37.4%), Native Hawaiian (2,265 | 23.7%), Korean (2,063 | 21.5%), Indian (Asian) (1,877 | 19.6%), and Burmese (478 | 5.0%), together accounting for 107.3% of all Aiea residents.
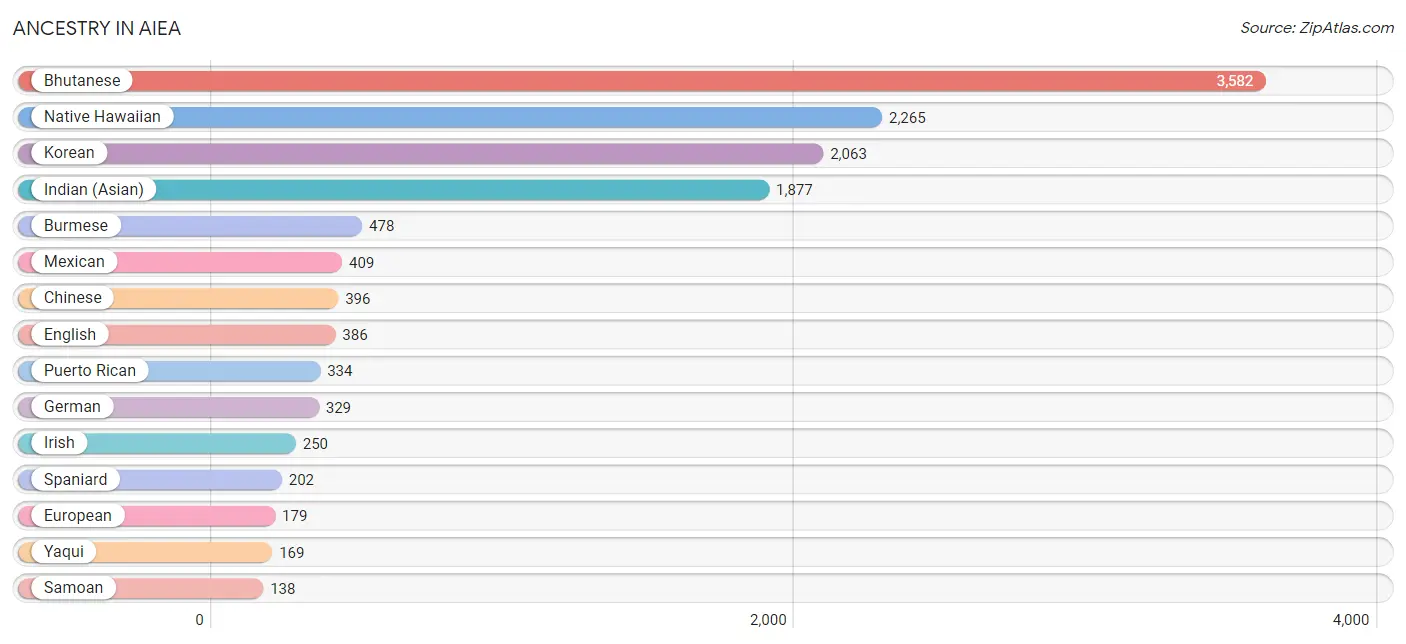
| Ancestry | # Population | % Population |
| American | 107 | 1.1% |
| Arab | 7 | 0.1% |
| Argentinean | 32 | 0.3% |
| Australian | 54 | 0.6% |
| Bhutanese | 3,582 | 37.4% |
| British | 12 | 0.1% |
| Bulgarian | 13 | 0.1% |
| Burmese | 478 | 5.0% |
| Chinese | 396 | 4.1% |
| Dutch | 21 | 0.2% |
| English | 386 | 4.0% |
| European | 179 | 1.9% |
| French | 73 | 0.8% |
| French Canadian | 20 | 0.2% |
| German | 329 | 3.4% |
| Guamanian / Chamorro | 40 | 0.4% |
| Hungarian | 21 | 0.2% |
| Indian (Asian) | 1,877 | 19.6% |
| Irish | 250 | 2.6% |
| Italian | 85 | 0.9% |
| Japanese | 11 | 0.1% |
| Korean | 2,063 | 21.5% |
| Lebanese | 7 | 0.1% |
| Malaysian | 27 | 0.3% |
| Mexican | 409 | 4.3% |
| Mexican American Indian | 27 | 0.3% |
| Native Hawaiian | 2,265 | 23.7% |
| Northern European | 10 | 0.1% |
| Norwegian | 9 | 0.1% |
| Pakistani | 22 | 0.2% |
| Polish | 52 | 0.5% |
| Portuguese | 106 | 1.1% |
| Puerto Rican | 334 | 3.5% |
| Russian | 11 | 0.1% |
| Samoan | 138 | 1.4% |
| Scotch-Irish | 9 | 0.1% |
| Scottish | 40 | 0.4% |
| Slovak | 10 | 0.1% |
| Slovene | 8 | 0.1% |
| South American | 32 | 0.3% |
| Spaniard | 202 | 2.1% |
| Spanish | 92 | 1.0% |
| Sri Lankan | 62 | 0.6% |
| Swedish | 20 | 0.2% |
| Welsh | 10 | 0.1% |
| Yaqui | 169 | 1.8% | View All 46 Rows |
Immigrants in Aiea
The most numerous immigrant groups reported in Aiea came from Asia (672 | 7.0%), South Eastern Asia (380 | 4.0%), Philippines (327 | 3.4%), Eastern Asia (292 | 3.0%), and Oceania (163 | 1.7%), together accounting for 19.2% of all Aiea residents.
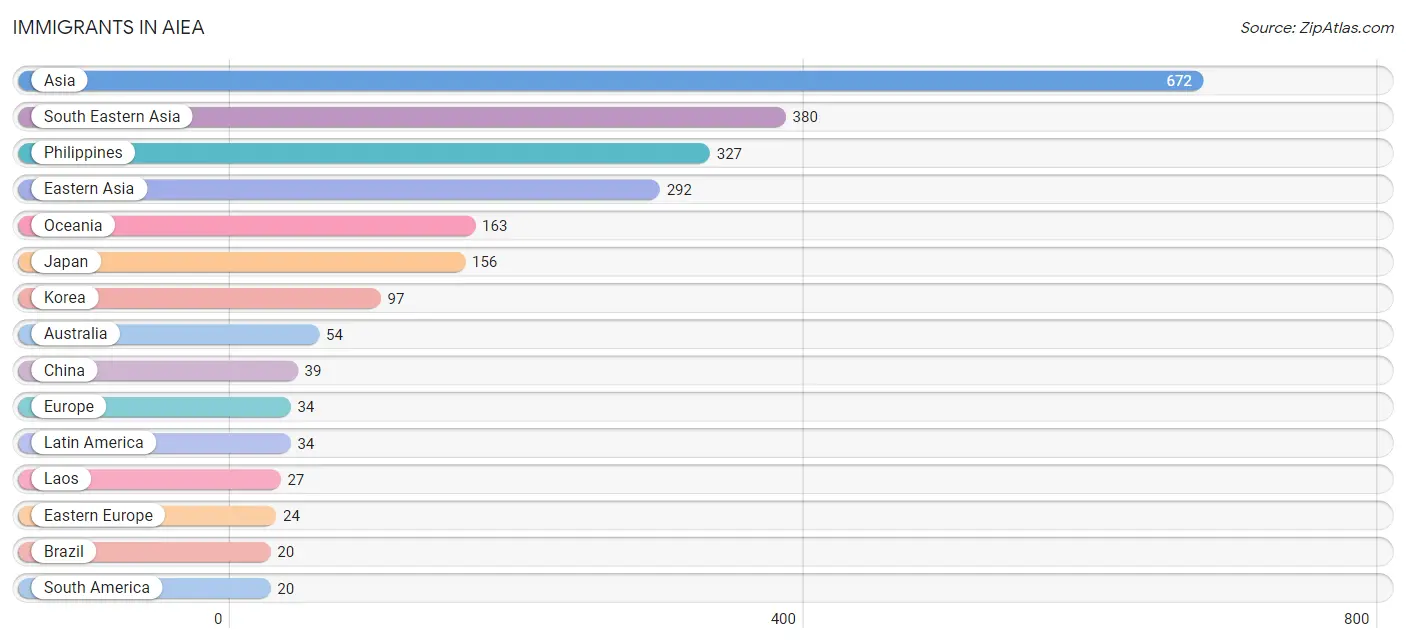
| Immigration Origin | # Population | % Population |
| Asia | 672 | 7.0% |
| Australia | 54 | 0.6% |
| Brazil | 20 | 0.2% |
| Bulgaria | 13 | 0.1% |
| Canada | 9 | 0.1% |
| Central America | 14 | 0.2% |
| China | 39 | 0.4% |
| Eastern Asia | 292 | 3.0% |
| Eastern Europe | 24 | 0.3% |
| Europe | 34 | 0.4% |
| Germany | 10 | 0.1% |
| Hong Kong | 8 | 0.1% |
| Japan | 156 | 1.6% |
| Korea | 97 | 1.0% |
| Laos | 27 | 0.3% |
| Latin America | 34 | 0.4% |
| Malaysia | 10 | 0.1% |
| Mexico | 14 | 0.2% |
| Oceania | 163 | 1.7% |
| Philippines | 327 | 3.4% |
| Russia | 11 | 0.1% |
| Singapore | 16 | 0.2% |
| South America | 20 | 0.2% |
| South Eastern Asia | 380 | 4.0% |
| Western Europe | 10 | 0.1% | View All 25 Rows |
Sex and Age in Aiea
Sex and Age in Aiea
The most populous age groups in Aiea are 30 to 34 Years (595 | 12.6%) for men and Under 5 Years (502 | 10.4%) for women.
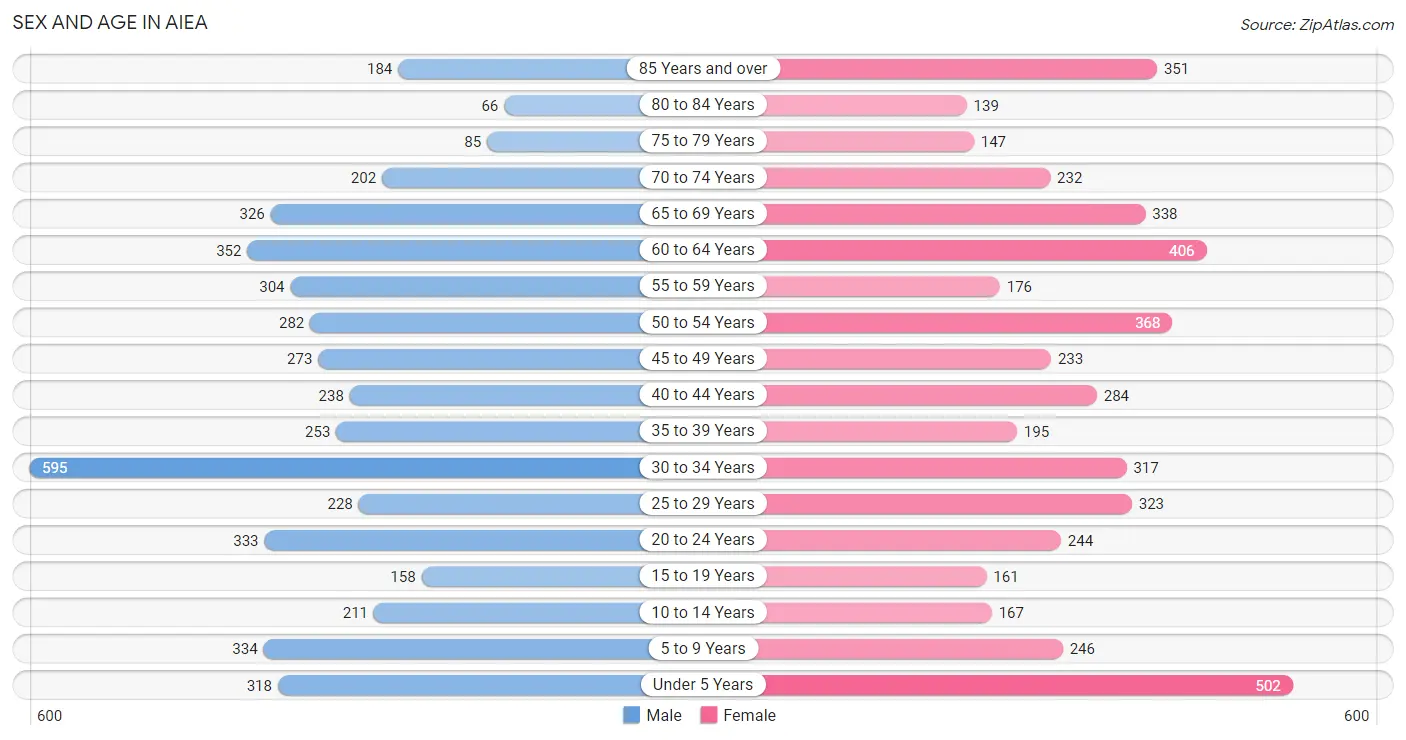
| Age Bracket | Male | Female |
| Under 5 Years | 318 (6.7%) | 502 (10.4%) |
| 5 to 9 Years | 334 (7.0%) | 246 (5.1%) |
| 10 to 14 Years | 211 (4.4%) | 167 (3.5%) |
| 15 to 19 Years | 158 (3.3%) | 161 (3.3%) |
| 20 to 24 Years | 333 (7.0%) | 244 (5.1%) |
| 25 to 29 Years | 228 (4.8%) | 323 (6.7%) |
| 30 to 34 Years | 595 (12.6%) | 317 (6.6%) |
| 35 to 39 Years | 253 (5.3%) | 195 (4.0%) |
| 40 to 44 Years | 238 (5.0%) | 284 (5.9%) |
| 45 to 49 Years | 273 (5.8%) | 233 (4.8%) |
| 50 to 54 Years | 282 (5.9%) | 368 (7.6%) |
| 55 to 59 Years | 304 (6.4%) | 176 (3.6%) |
| 60 to 64 Years | 352 (7.4%) | 406 (8.4%) |
| 65 to 69 Years | 326 (6.9%) | 338 (7.0%) |
| 70 to 74 Years | 202 (4.3%) | 232 (4.8%) |
| 75 to 79 Years | 85 (1.8%) | 147 (3.0%) |
| 80 to 84 Years | 66 (1.4%) | 139 (2.9%) |
| 85 Years and over | 184 (3.9%) | 351 (7.3%) |
| Total | 4,742 (100.0%) | 4,829 (100.0%) |
Families and Households in Aiea
Median Family Size in Aiea
The median family size in Aiea is 3.78 persons per family, with married-couple families (1,571 | 73.1%) accounting for the largest median family size of 3.91 persons per family. On the other hand, single male/father families (208 | 9.7%) represent the smallest median family size with 3.34 persons per family.
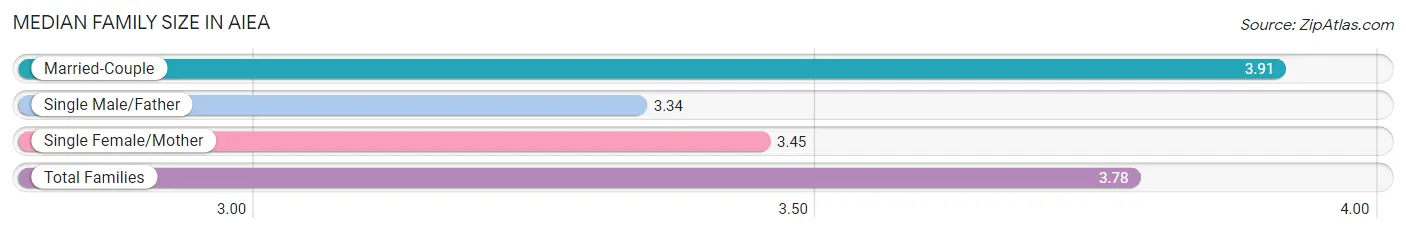
| Family Type | # Families | Family Size |
| Married-Couple | 1,571 (73.1%) | 3.91 |
| Single Male/Father | 208 (9.7%) | 3.34 |
| Single Female/Mother | 371 (17.3%) | 3.45 |
| Total Families | 2,150 (100.0%) | 3.78 |
Median Household Size in Aiea
The median household size in Aiea is 3.21 persons per household, with married-couple households (1,571 | 53.0%) accounting for the largest median household size of 4.06 persons per household. non-family households (815 | 27.5%) represent the smallest median household size with 1.23 persons per household.
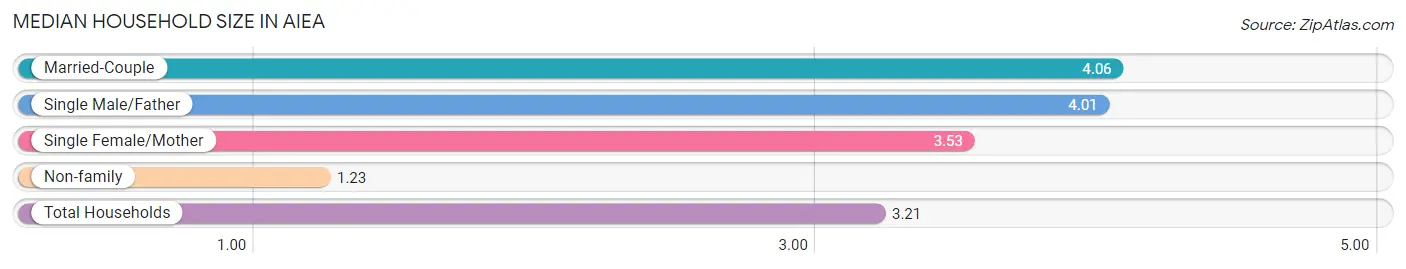
| Household Type | # Households | Household Size |
| Married-Couple | 1,571 (53.0%) | 4.06 |
| Single Male/Father | 208 (7.0%) | 4.01 |
| Single Female/Mother | 371 (12.5%) | 3.53 |
| Non-family | 815 (27.5%) | 1.23 |
| Total Households | 2,965 (100.0%) | 3.21 |
Household Size by Marriage Status in Aiea
Out of a total of 2,965 households in Aiea, 2,150 (72.5%) are family households, while 815 (27.5%) are nonfamily households. The most numerous type of family households are 2-person households, comprising 661, and the most common type of nonfamily households are 1-person households, comprising 660.
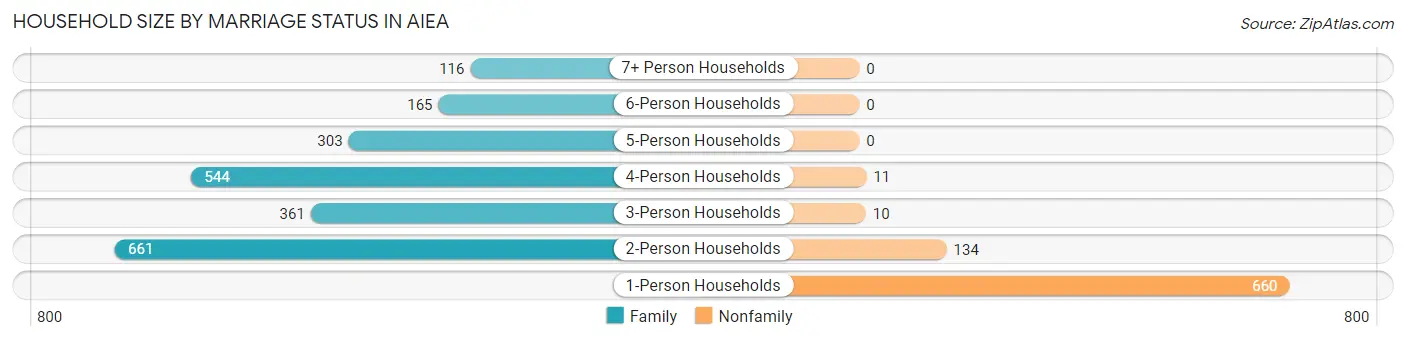
| Household Size | Family Households | Nonfamily Households |
| 1-Person Households | - | 660 (22.3%) |
| 2-Person Households | 661 (22.3%) | 134 (4.5%) |
| 3-Person Households | 361 (12.2%) | 10 (0.3%) |
| 4-Person Households | 544 (18.3%) | 11 (0.4%) |
| 5-Person Households | 303 (10.2%) | 0 (0.0%) |
| 6-Person Households | 165 (5.6%) | 0 (0.0%) |
| 7+ Person Households | 116 (3.9%) | 0 (0.0%) |
| Total | 2,150 (72.5%) | 815 (27.5%) |
Female Fertility in Aiea
Fertility by Age in Aiea
Average fertility rate in Aiea is 56.0 births per 1,000 women. Women in the age bracket of 20 to 34 years have the highest fertility rate with 68.0 births per 1,000 women. Women in the age bracket of 20 to 34 years acount for 59.4% of all women with births.
| Age Bracket | Women with Births | Births / 1,000 Women |
| 15 to 19 years | 0 (0.0%) | 0.0 |
| 20 to 34 years | 60 (59.4%) | 68.0 |
| 35 to 50 years | 41 (40.6%) | 53.0 |
| Total | 101 (100.0%) | 56.0 |
Fertility by Age by Marriage Status in Aiea
61.4% of women with births (101) in Aiea are married. The highest percentage of unmarried women with births falls into 35 to 50 years age bracket with 70.7% of them unmarried at the time of birth, while the lowest percentage of unmarried women with births belong to 20 to 34 years age bracket with 16.7% of them unmarried.
| Age Bracket | Married | Unmarried |
| 15 to 19 years | 0 (0.0%) | 0 (0.0%) |
| 20 to 34 years | 50 (83.3%) | 10 (16.7%) |
| 35 to 50 years | 12 (29.3%) | 29 (70.7%) |
| Total | 62 (61.4%) | 39 (38.6%) |
Fertility by Education in Aiea
| Educational Attainment | Women with Births | Births / 1,000 Women |
| Less than High School | 0 (0.0%) | 0.0 |
| High School Diploma | 13 (12.9%) | 31.0 |
| College or Associate's Degree | 48 (47.5%) | 96.0 |
| Bachelor's Degree | 11 (10.9%) | 23.0 |
| Graduate Degree | 29 (28.7%) | 106.0 |
| Total | 101 (100.0%) | 56.0 |
Fertility by Education by Marriage Status in Aiea
38.6% of women with births in Aiea are unmarried. Women with the educational attainment of high school diploma are most likely to be married with 100.0% of them married at childbirth, while women with the educational attainment of graduate degree are least likely to be married with 100.0% of them unmarried at childbirth.
| Educational Attainment | Married | Unmarried |
| Less than High School | 0 (0.0%) | 0 (0.0%) |
| High School Diploma | 13 (100.0%) | 0 (0.0%) |
| College or Associate's Degree | 38 (79.2%) | 10 (20.8%) |
| Bachelor's Degree | 11 (100.0%) | 0 (0.0%) |
| Graduate Degree | 0 (0.0%) | 29 (100.0%) |
| Total | 62 (61.4%) | 39 (38.6%) |
Income in Aiea
Income Overview in Aiea
Per Capita Income in Aiea is $47,612, while median incomes of families and households are $149,565 and $130,507 respectively.
| Characteristic | Number | Measure |
| Per Capita Income | 9,571 | $47,612 |
| Median Family Income | 2,150 | $149,565 |
| Mean Family Income | 2,150 | $164,637 |
| Median Household Income | 2,965 | $130,507 |
| Mean Household Income | 2,965 | $150,722 |
| Income Deficit | 2,150 | $0 |
| Wage / Income Gap (%) | 9,571 | 22.37% |
| Wage / Income Gap ($) | 9,571 | 77.63¢ per $1 |
| Gini / Inequality Index | 9,571 | 0.40 |
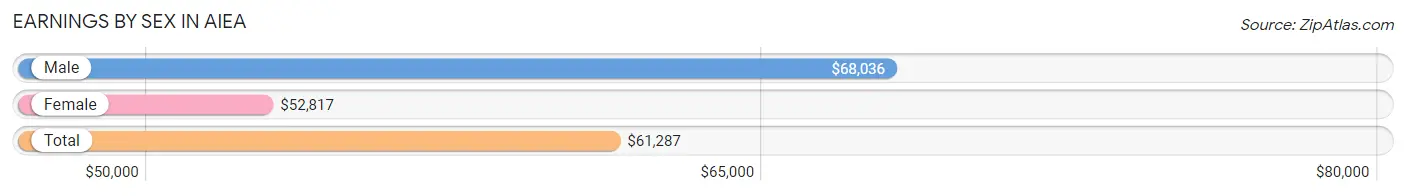
Earnings by Sex in Aiea
Average Earnings in Aiea are $61,287, $68,036 for men and $52,817 for women, a difference of 22.4%.
| Sex | Number | Average Earnings |
| Male | 2,741 (55.1%) | $68,036 |
| Female | 2,234 (44.9%) | $52,817 |
| Total | 4,975 (100.0%) | $61,287 |
Earnings by Sex by Income Bracket in Aiea
The most common earnings brackets in Aiea are $100,000+ for men (778 | 28.4%) and $100,000+ for women (344 | 15.4%).
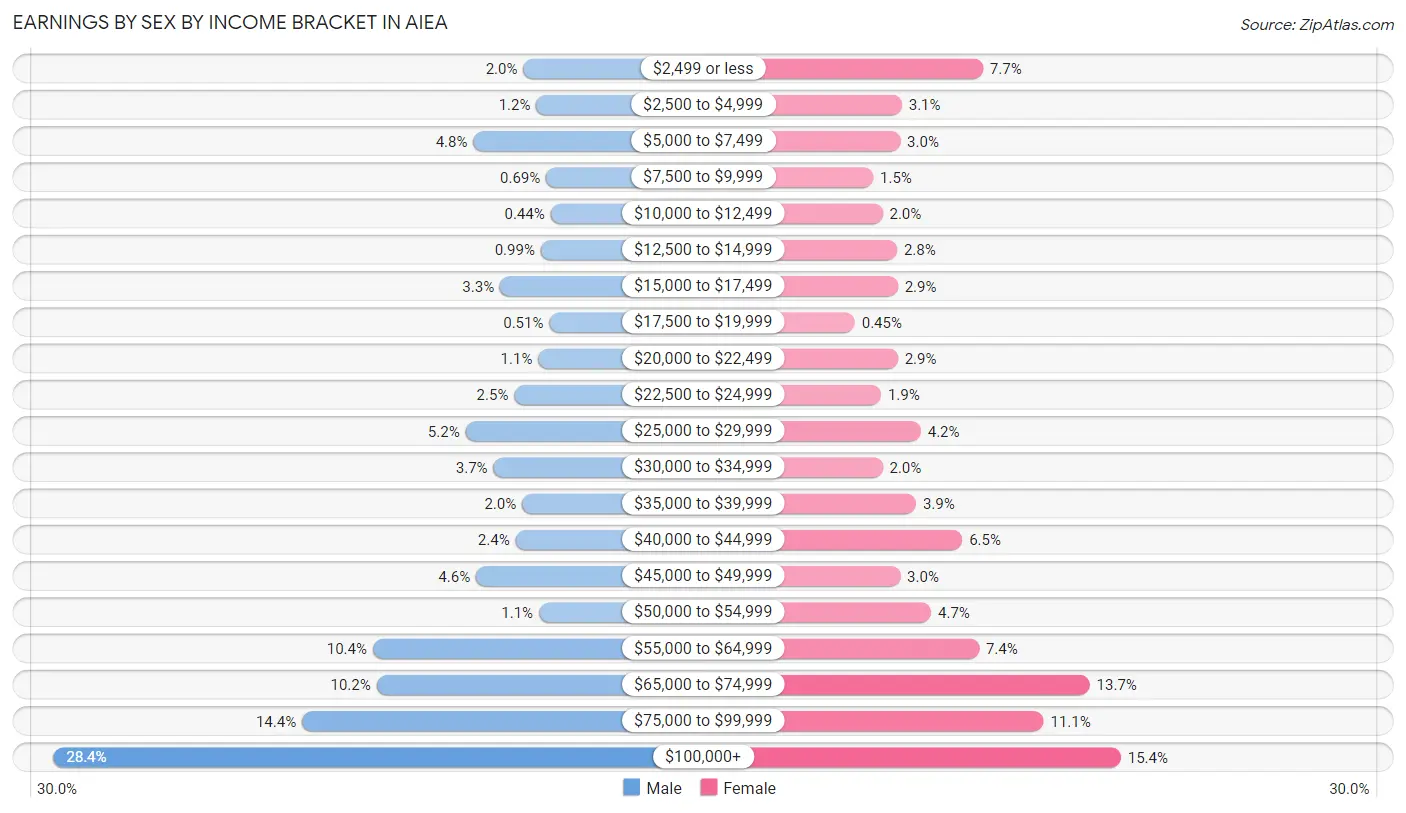
| Income | Male | Female |
| $2,499 or less | 54 (2.0%) | 171 (7.6%) |
| $2,500 to $4,999 | 34 (1.2%) | 69 (3.1%) |
| $5,000 to $7,499 | 131 (4.8%) | 67 (3.0%) |
| $7,500 to $9,999 | 19 (0.7%) | 33 (1.5%) |
| $10,000 to $12,499 | 12 (0.4%) | 45 (2.0%) |
| $12,500 to $14,999 | 27 (1.0%) | 63 (2.8%) |
| $15,000 to $17,499 | 90 (3.3%) | 64 (2.9%) |
| $17,500 to $19,999 | 14 (0.5%) | 10 (0.4%) |
| $20,000 to $22,499 | 31 (1.1%) | 64 (2.9%) |
| $22,500 to $24,999 | 68 (2.5%) | 43 (1.9%) |
| $25,000 to $29,999 | 143 (5.2%) | 93 (4.2%) |
| $30,000 to $34,999 | 100 (3.6%) | 45 (2.0%) |
| $35,000 to $39,999 | 56 (2.0%) | 87 (3.9%) |
| $40,000 to $44,999 | 66 (2.4%) | 145 (6.5%) |
| $45,000 to $49,999 | 127 (4.6%) | 67 (3.0%) |
| $50,000 to $54,999 | 30 (1.1%) | 106 (4.7%) |
| $55,000 to $64,999 | 286 (10.4%) | 166 (7.4%) |
| $65,000 to $74,999 | 280 (10.2%) | 305 (13.7%) |
| $75,000 to $99,999 | 395 (14.4%) | 247 (11.1%) |
| $100,000+ | 778 (28.4%) | 344 (15.4%) |
| Total | 2,741 (100.0%) | 2,234 (100.0%) |
Earnings by Sex by Educational Attainment in Aiea
Average earnings in Aiea are $71,504 for men and $60,580 for women, a difference of 15.3%. Men with an educational attainment of graduate degree enjoy the highest average annual earnings of $107,619, while those with college or associate's degree education earn the least with $62,692. Women with an educational attainment of graduate degree earn the most with the average annual earnings of $68,190, while those with high school diploma education have the smallest earnings of $37,961.
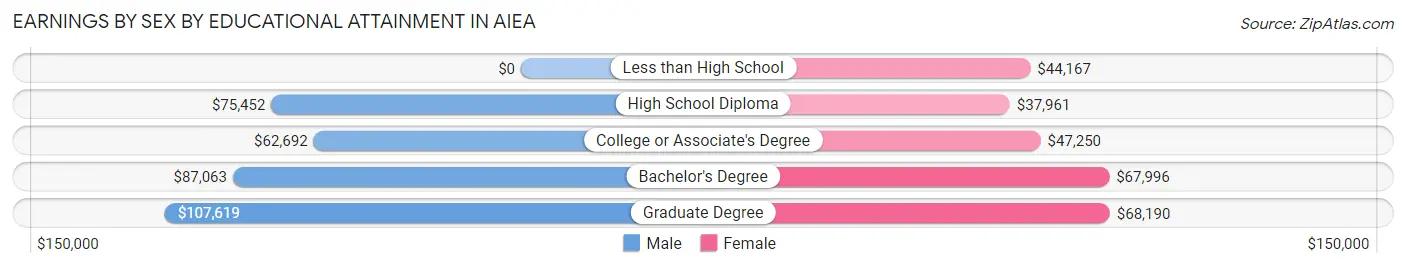
| Educational Attainment | Male Income | Female Income |
| Less than High School | - | - |
| High School Diploma | $75,452 | $37,961 |
| College or Associate's Degree | $62,692 | $47,250 |
| Bachelor's Degree | $87,063 | $67,996 |
| Graduate Degree | $107,619 | $68,190 |
| Total | $71,504 | $60,580 |
Family Income in Aiea
Family Income Brackets in Aiea
According to the Aiea family income data, there are 639 families falling into the $200,000+ income range, which is the most common income bracket and makes up 29.7% of all families.
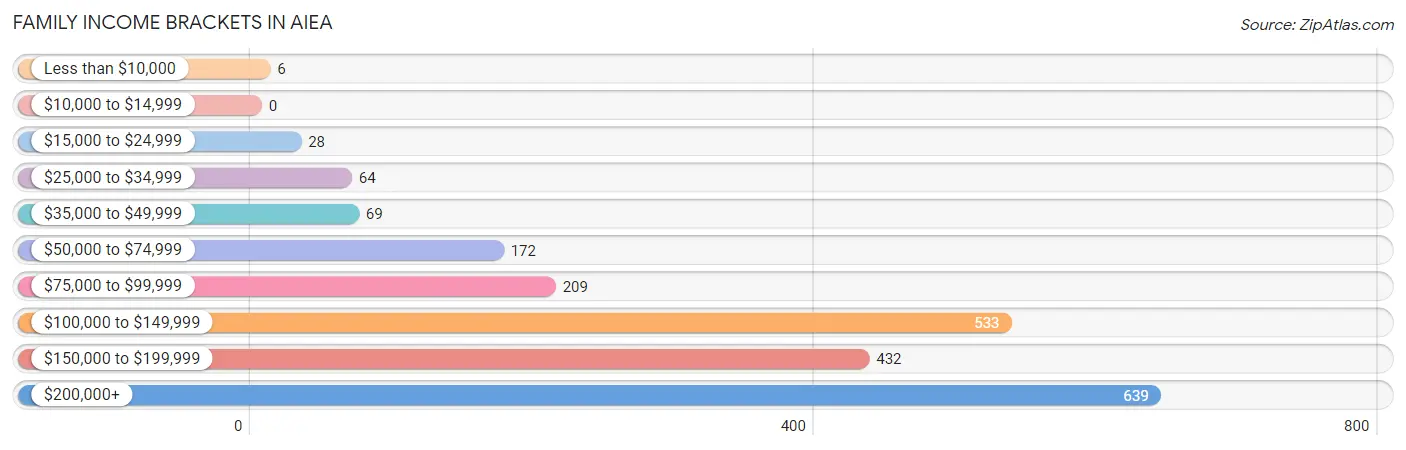
| Income Bracket | # Families | % Families |
| Less than $10,000 | 6 | 0.3% |
| $10,000 to $14,999 | 0 | 0.0% |
| $15,000 to $24,999 | 28 | 1.3% |
| $25,000 to $34,999 | 64 | 3.0% |
| $35,000 to $49,999 | 69 | 3.2% |
| $50,000 to $74,999 | 172 | 8.0% |
| $75,000 to $99,999 | 209 | 9.7% |
| $100,000 to $149,999 | 533 | 24.8% |
| $150,000 to $199,999 | 432 | 20.1% |
| $200,000+ | 639 | 29.7% |
Family Income by Famaliy Size in Aiea
7+ person families (75 | 3.5%) account for the highest median family income in Aiea with $250,001 per family, while 2-person families (747 | 34.7%) have the highest median income of $67,898 per family member.
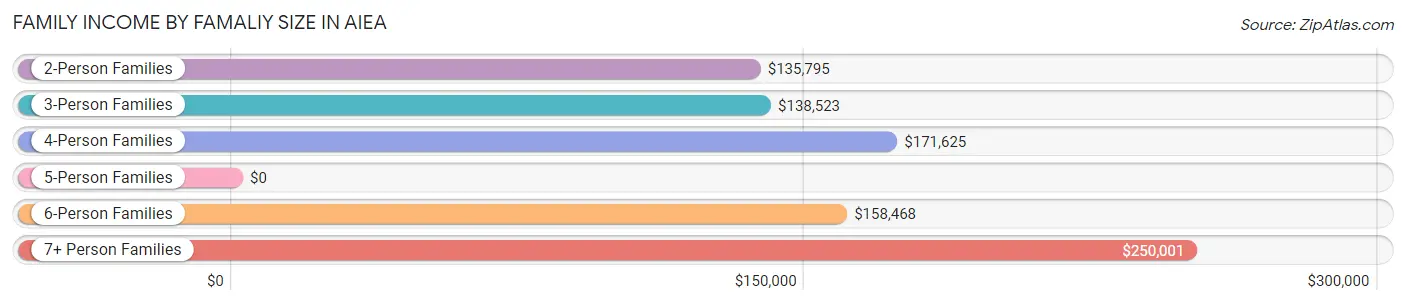
| Income Bracket | # Families | Median Income |
| 2-Person Families | 747 (34.7%) | $135,795 |
| 3-Person Families | 351 (16.3%) | $138,523 |
| 4-Person Families | 585 (27.2%) | $171,625 |
| 5-Person Families | 238 (11.1%) | $0 |
| 6-Person Families | 154 (7.2%) | $158,468 |
| 7+ Person Families | 75 (3.5%) | $250,001 |
| Total | 2,150 (100.0%) | $149,565 |
Family Income by Number of Earners in Aiea
The median family income in Aiea is $149,565, with families comprising 3+ earners (440) having the highest median family income of $221,926, while families with 1 earner (592) have the lowest median family income of $91,083, accounting for 20.5% and 27.5% of families, respectively.
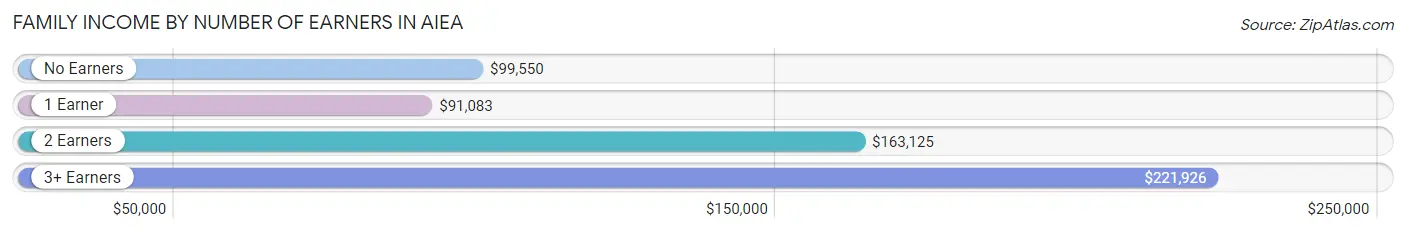
| Number of Earners | # Families | Median Income |
| No Earners | 241 (11.2%) | $99,550 |
| 1 Earner | 592 (27.5%) | $91,083 |
| 2 Earners | 877 (40.8%) | $163,125 |
| 3+ Earners | 440 (20.5%) | $221,926 |
| Total | 2,150 (100.0%) | $149,565 |
Household Income in Aiea
Household Income Brackets in Aiea
With 768 households falling in the category, the $200,000+ income range is the most frequent in Aiea, accounting for 25.9% of all households. In contrast, only 9 households (0.3%) fall into the $10,000 to $14,999 income bracket, making it the least populous group.
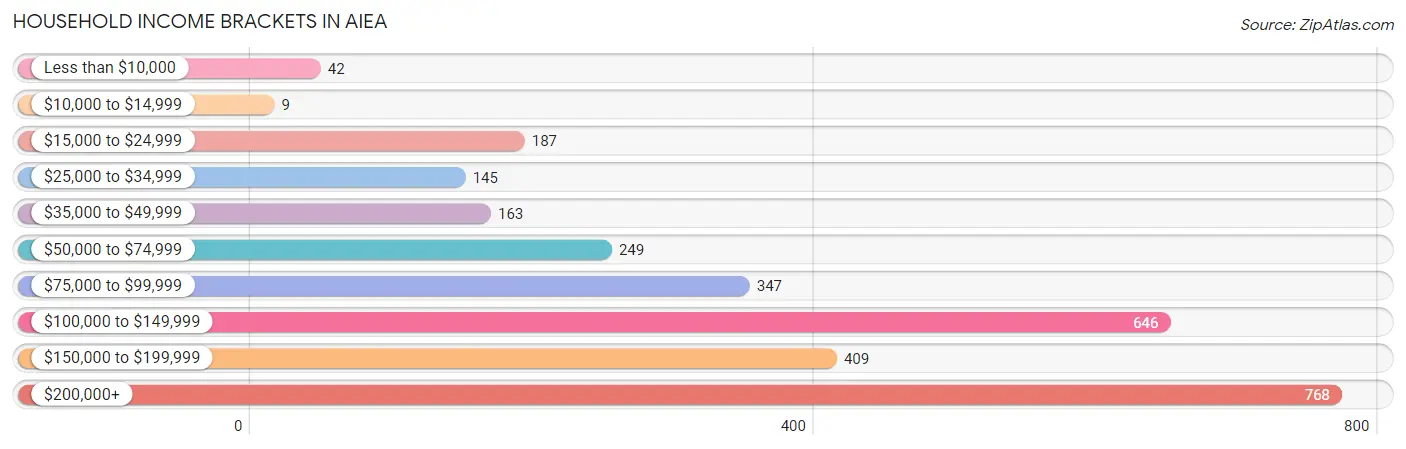
| Income Bracket | # Households | % Households |
| Less than $10,000 | 42 | 1.4% |
| $10,000 to $14,999 | 9 | 0.3% |
| $15,000 to $24,999 | 187 | 6.3% |
| $25,000 to $34,999 | 145 | 4.9% |
| $35,000 to $49,999 | 163 | 5.5% |
| $50,000 to $74,999 | 249 | 8.4% |
| $75,000 to $99,999 | 347 | 11.7% |
| $100,000 to $149,999 | 646 | 21.8% |
| $150,000 to $199,999 | 409 | 13.8% |
| $200,000+ | 768 | 25.9% |
Household Income by Householder Age in Aiea
The median household income in Aiea is $130,507, with the highest median household income of $160,750 found in the 45 to 64 years age bracket for the primary householder. A total of 1,086 households (36.6%) fall into this category. Meanwhile, the 15 to 24 years age bracket for the primary householder has the lowest median household income of $0, with 38 households (1.3%) in this group.
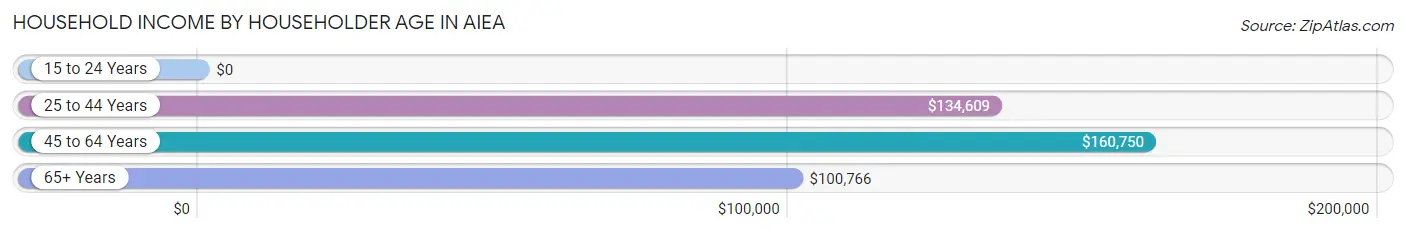
| Income Bracket | # Households | Median Income |
| 15 to 24 Years | 38 (1.3%) | $0 |
| 25 to 44 Years | 708 (23.9%) | $134,609 |
| 45 to 64 Years | 1,086 (36.6%) | $160,750 |
| 65+ Years | 1,133 (38.2%) | $100,766 |
| Total | 2,965 (100.0%) | $130,507 |
Poverty in Aiea
Income Below Poverty by Sex and Age in Aiea
With 3.3% poverty level for males and 3.6% for females among the residents of Aiea, 18 to 24 year old males and under 5 year old females are the most vulnerable to poverty, with 40 males (11.4%) and 35 females (7.0%) in their respective age groups living below the poverty level.
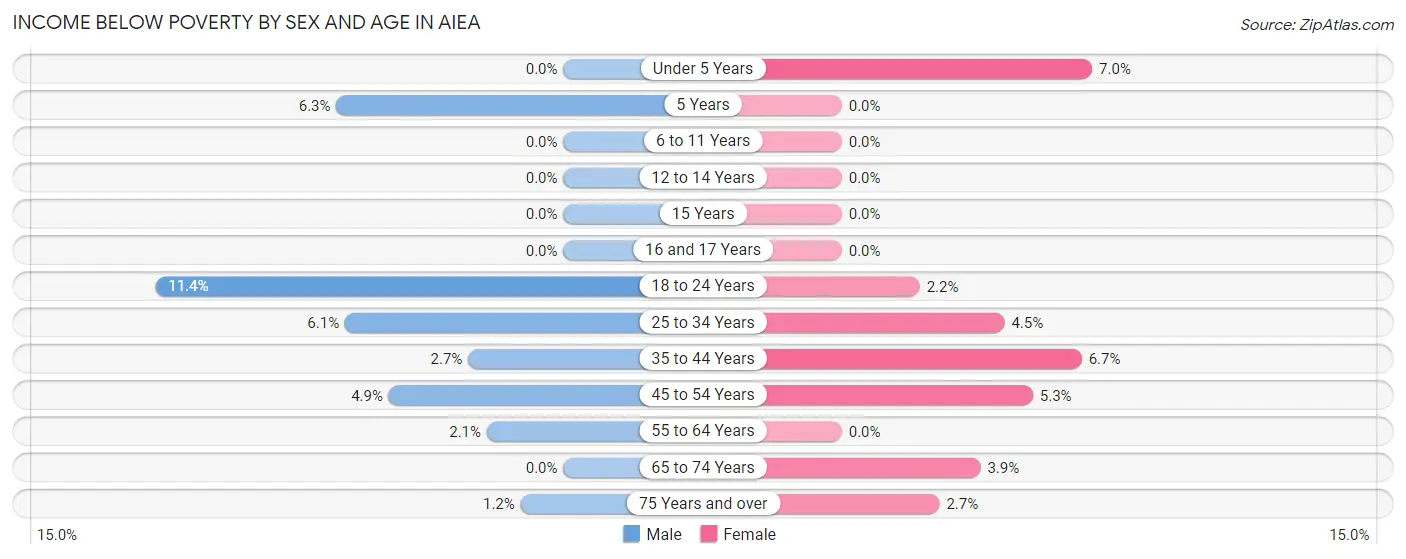
| Age Bracket | Male | Female |
| Under 5 Years | 0 (0.0%) | 35 (7.0%) |
| 5 Years | 6 (6.3%) | 0 (0.0%) |
| 6 to 11 Years | 0 (0.0%) | 0 (0.0%) |
| 12 to 14 Years | 0 (0.0%) | 0 (0.0%) |
| 15 Years | 0 (0.0%) | 0 (0.0%) |
| 16 and 17 Years | 0 (0.0%) | 0 (0.0%) |
| 18 to 24 Years | 40 (11.4%) | 7 (2.2%) |
| 25 to 34 Years | 50 (6.1%) | 29 (4.5%) |
| 35 to 44 Years | 13 (2.6%) | 32 (6.7%) |
| 45 to 54 Years | 27 (4.9%) | 32 (5.3%) |
| 55 to 64 Years | 14 (2.1%) | 0 (0.0%) |
| 65 to 74 Years | 0 (0.0%) | 22 (3.9%) |
| 75 Years and over | 4 (1.2%) | 17 (2.7%) |
| Total | 154 (3.3%) | 174 (3.6%) |
Income Above Poverty by Sex and Age in Aiea
According to the poverty statistics in Aiea, males aged under 5 years and females aged 5 years are the age groups that are most secure financially, with 100.0% of males and 100.0% of females in these age groups living above the poverty line.
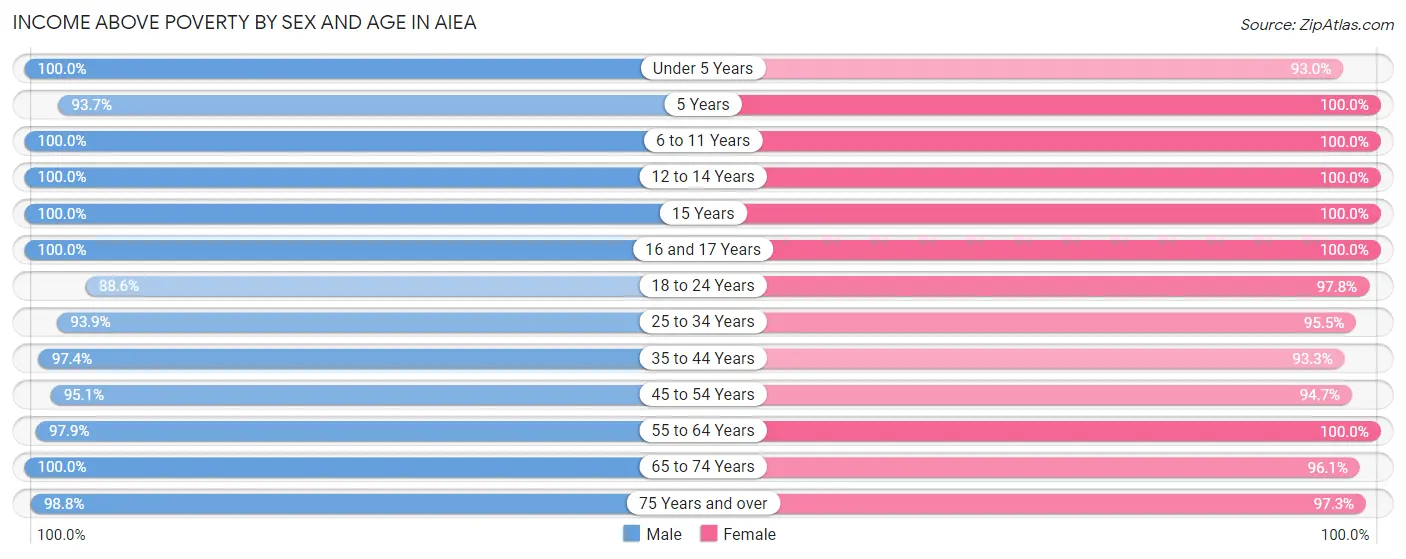
| Age Bracket | Male | Female |
| Under 5 Years | 307 (100.0%) | 467 (93.0%) |
| 5 Years | 89 (93.7%) | 77 (100.0%) |
| 6 to 11 Years | 339 (100.0%) | 258 (100.0%) |
| 12 to 14 Years | 102 (100.0%) | 68 (100.0%) |
| 15 Years | 20 (100.0%) | 25 (100.0%) |
| 16 and 17 Years | 119 (100.0%) | 57 (100.0%) |
| 18 to 24 Years | 312 (88.6%) | 316 (97.8%) |
| 25 to 34 Years | 773 (93.9%) | 611 (95.5%) |
| 35 to 44 Years | 478 (97.4%) | 447 (93.3%) |
| 45 to 54 Years | 528 (95.1%) | 569 (94.7%) |
| 55 to 64 Years | 642 (97.9%) | 582 (100.0%) |
| 65 to 74 Years | 528 (100.0%) | 548 (96.1%) |
| 75 Years and over | 331 (98.8%) | 609 (97.3%) |
| Total | 4,568 (96.7%) | 4,634 (96.4%) |
Income Below Poverty Among Married-Couple Families in Aiea
The poverty statistics for married-couple families in Aiea show that 0.7% or 11 of the total 1,571 families live below the poverty line. Families with no children have the highest poverty rate of 1.1%, comprising of 11 families. On the other hand, families with 1 or 2 children have the lowest poverty rate of 0.0%, which includes 0 families.
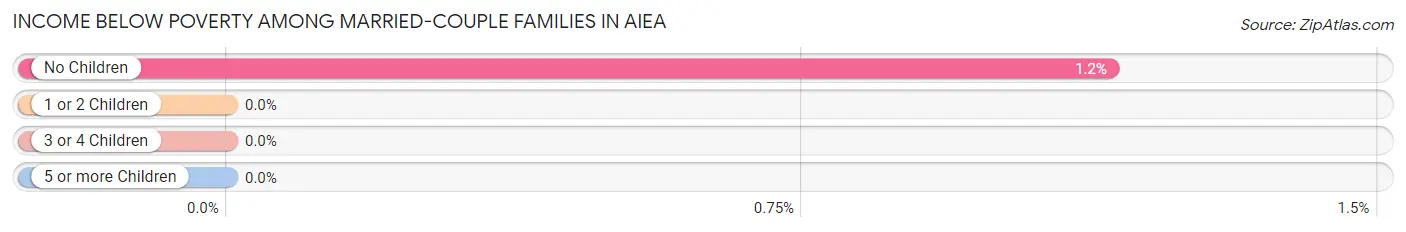
| Children | Above Poverty | Below Poverty |
| No Children | 947 (98.9%) | 11 (1.1%) |
| 1 or 2 Children | 392 (100.0%) | 0 (0.0%) |
| 3 or 4 Children | 221 (100.0%) | 0 (0.0%) |
| 5 or more Children | 0 (0.0%) | 0 (0.0%) |
| Total | 1,560 (99.3%) | 11 (0.7%) |
Income Below Poverty Among Single-Parent Households in Aiea
According to the poverty data in Aiea, 6.2% or 13 single-father households and 1.3% or 5 single-mother households are living below the poverty line. Among single-father households, those with 1 or 2 children have the highest poverty rate, with 13 households (27.7%) experiencing poverty. Likewise, among single-mother households, those with 1 or 2 children have the highest poverty rate, with 5 households (2.9%) falling below the poverty line.
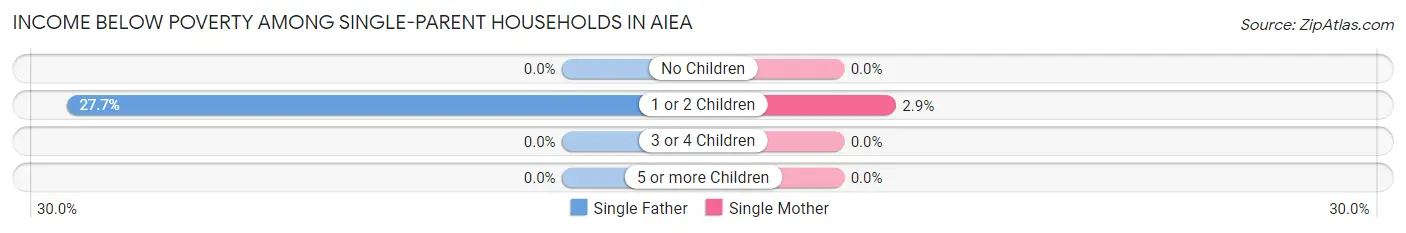
| Children | Single Father | Single Mother |
| No Children | 0 (0.0%) | 0 (0.0%) |
| 1 or 2 Children | 13 (27.7%) | 5 (2.9%) |
| 3 or 4 Children | 0 (0.0%) | 0 (0.0%) |
| 5 or more Children | 0 (0.0%) | 0 (0.0%) |
| Total | 13 (6.2%) | 5 (1.3%) |
Income Below Poverty Among Married-Couple vs Single-Parent Households in Aiea
The poverty data for Aiea shows that 11 of the married-couple family households (0.7%) and 18 of the single-parent households (3.1%) are living below the poverty level. Within the married-couple family households, those with no children have the highest poverty rate, with 11 households (1.1%) falling below the poverty line. Among the single-parent households, those with 1 or 2 children have the highest poverty rate, with 18 household (8.2%) living below poverty.
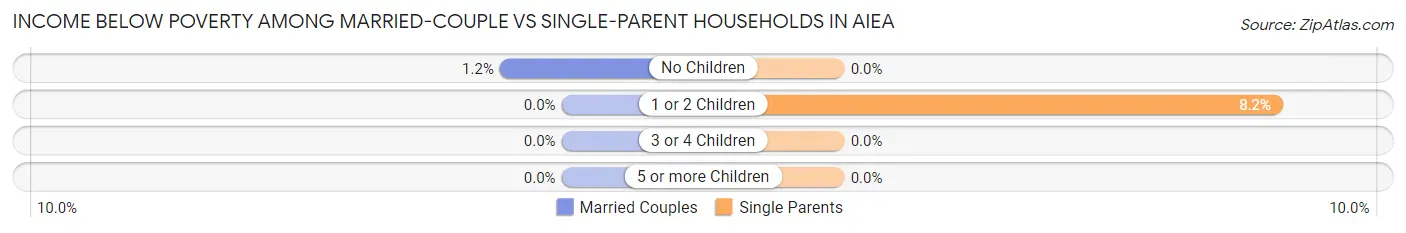
| Children | Married-Couple Families | Single-Parent Households |
| No Children | 11 (1.1%) | 0 (0.0%) |
| 1 or 2 Children | 0 (0.0%) | 18 (8.2%) |
| 3 or 4 Children | 0 (0.0%) | 0 (0.0%) |
| 5 or more Children | 0 (0.0%) | 0 (0.0%) |
| Total | 11 (0.7%) | 18 (3.1%) |
Employment Characteristics in Aiea
Employment by Class of Employer in Aiea
Among the 4,609 employed individuals in Aiea, private company employees (2,372 | 51.5%), federal government employees (798 | 17.3%), and state government employees (493 | 10.7%) make up the most common classes of employment.
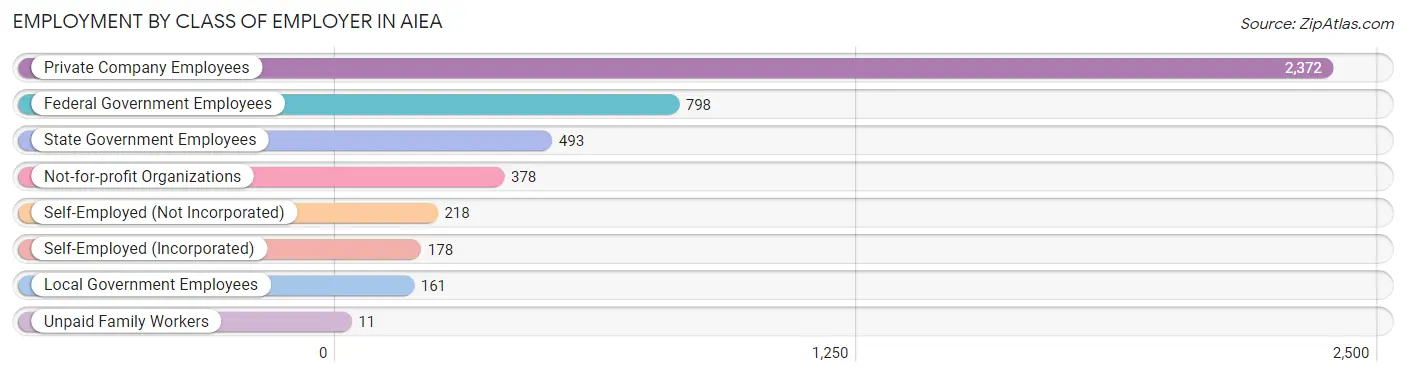
| Employer Class | # Employees | % Employees |
| Private Company Employees | 2,372 | 51.5% |
| Self-Employed (Incorporated) | 178 | 3.9% |
| Self-Employed (Not Incorporated) | 218 | 4.7% |
| Not-for-profit Organizations | 378 | 8.2% |
| Local Government Employees | 161 | 3.5% |
| State Government Employees | 493 | 10.7% |
| Federal Government Employees | 798 | 17.3% |
| Unpaid Family Workers | 11 | 0.2% |
| Total | 4,609 | 100.0% |
Employment Status by Age in Aiea
According to the labor force statistics for Aiea, out of the total population over 16 years of age (7,748), 62.9% or 4,873 individuals are in the labor force, with 4.6% or 224 of them unemployed. The age group with the highest labor force participation rate is 25 to 29 years, with 94.7% or 522 individuals in the labor force. Within the labor force, the 20 to 24 years age range has the highest percentage of unemployed individuals, with 21.4% or 99 of them being unemployed.
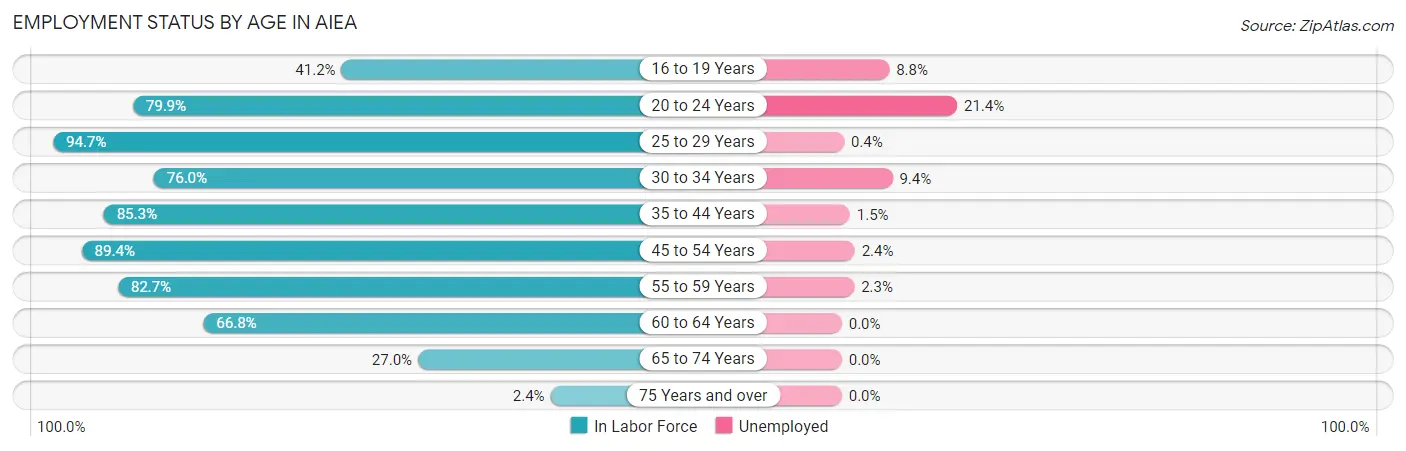
| Age Bracket | In Labor Force | Unemployed |
| 16 to 19 Years | 113 (41.2%) | 10 (8.8%) |
| 20 to 24 Years | 461 (79.9%) | 99 (21.4%) |
| 25 to 29 Years | 522 (94.7%) | 2 (0.4%) |
| 30 to 34 Years | 693 (76.0%) | 65 (9.4%) |
| 35 to 44 Years | 827 (85.3%) | 12 (1.5%) |
| 45 to 54 Years | 1,033 (89.4%) | 25 (2.4%) |
| 55 to 59 Years | 397 (82.7%) | 9 (2.3%) |
| 60 to 64 Years | 506 (66.8%) | 0 (0.0%) |
| 65 to 74 Years | 296 (27.0%) | 0 (0.0%) |
| 75 Years and over | 23 (2.4%) | 0 (0.0%) |
| Total | 4,873 (62.9%) | 224 (4.6%) |
Employment Status by Educational Attainment in Aiea
According to labor force statistics for Aiea, 82.4% of individuals (3,977) out of the total population between 25 and 64 years of age (4,827) are in the labor force, with 2.9% or 115 of them being unemployed. The group with the highest labor force participation rate are those with the educational attainment of bachelor's degree or higher, with 90.7% or 1,819 individuals in the labor force. Within the labor force, individuals with high school diploma education have the highest percentage of unemployment, with 7.1% or 53 of them being unemployed.
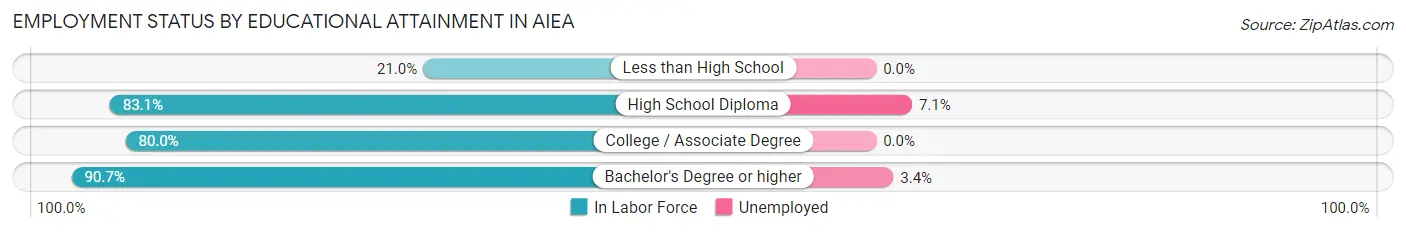
| Educational Attainment | In Labor Force | Unemployed |
| Less than High School | 45 (21.0%) | 0 (0.0%) |
| High School Diploma | 744 (83.1%) | 64 (7.1%) |
| College / Associate Degree | 1,370 (80.0%) | 0 (0.0%) |
| Bachelor's Degree or higher | 1,819 (90.7%) | 68 (3.4%) |
| Total | 3,977 (82.4%) | 140 (2.9%) |
Employment Occupations by Sex in Aiea
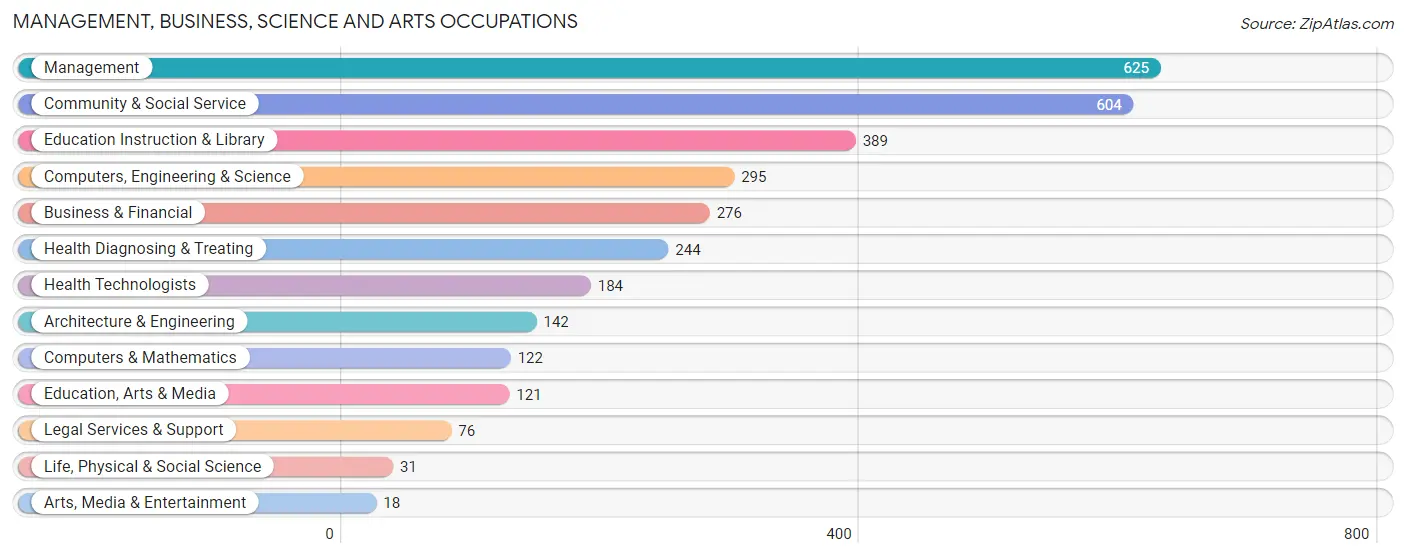
Management, Business, Science and Arts Occupations
The most common Management, Business, Science and Arts occupations in Aiea are Management (625 | 14.0%), Community & Social Service (604 | 13.6%), Education Instruction & Library (389 | 8.7%), Computers, Engineering & Science (295 | 6.6%), and Business & Financial (276 | 6.2%).
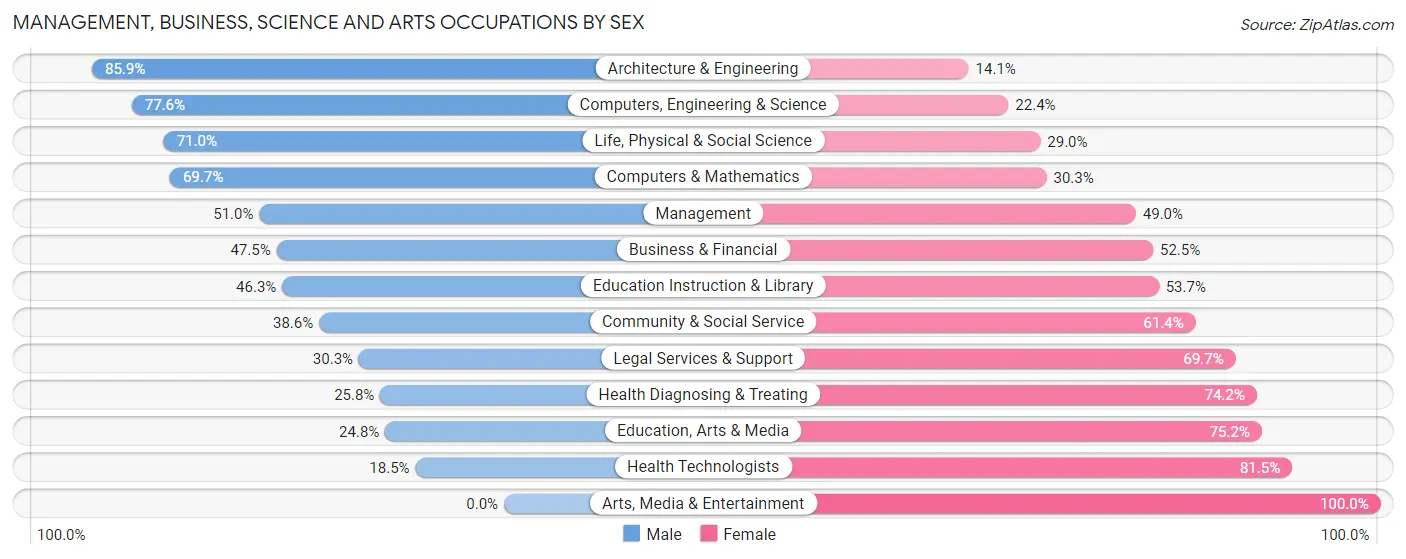
Management, Business, Science and Arts Occupations by Sex
Within the Management, Business, Science and Arts occupations in Aiea, the most male-oriented occupations are Architecture & Engineering (85.9%), Computers, Engineering & Science (77.6%), and Life, Physical & Social Science (71.0%), while the most female-oriented occupations are Arts, Media & Entertainment (100.0%), Health Technologists (81.5%), and Education, Arts & Media (75.2%).
| Occupation | Male | Female |
| Management | 319 (51.0%) | 306 (49.0%) |
| Business & Financial | 131 (47.5%) | 145 (52.5%) |
| Computers, Engineering & Science | 229 (77.6%) | 66 (22.4%) |
| Computers & Mathematics | 85 (69.7%) | 37 (30.3%) |
| Architecture & Engineering | 122 (85.9%) | 20 (14.1%) |
| Life, Physical & Social Science | 22 (71.0%) | 9 (29.0%) |
| Community & Social Service | 233 (38.6%) | 371 (61.4%) |
| Education, Arts & Media | 30 (24.8%) | 91 (75.2%) |
| Legal Services & Support | 23 (30.3%) | 53 (69.7%) |
| Education Instruction & Library | 180 (46.3%) | 209 (53.7%) |
| Arts, Media & Entertainment | 0 (0.0%) | 18 (100.0%) |
| Health Diagnosing & Treating | 63 (25.8%) | 181 (74.2%) |
| Health Technologists | 34 (18.5%) | 150 (81.5%) |
| Total (Category) | 975 (47.7%) | 1,069 (52.3%) |
| Total (Overall) | 2,391 (53.7%) | 2,061 (46.3%) |
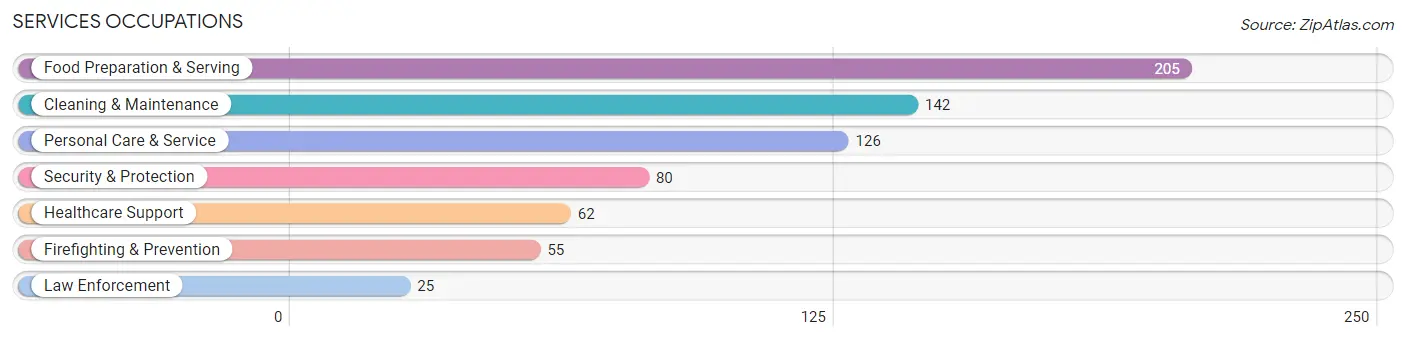
Services Occupations
The most common Services occupations in Aiea are Food Preparation & Serving (205 | 4.6%), Cleaning & Maintenance (142 | 3.2%), Personal Care & Service (126 | 2.8%), Security & Protection (80 | 1.8%), and Healthcare Support (62 | 1.4%).
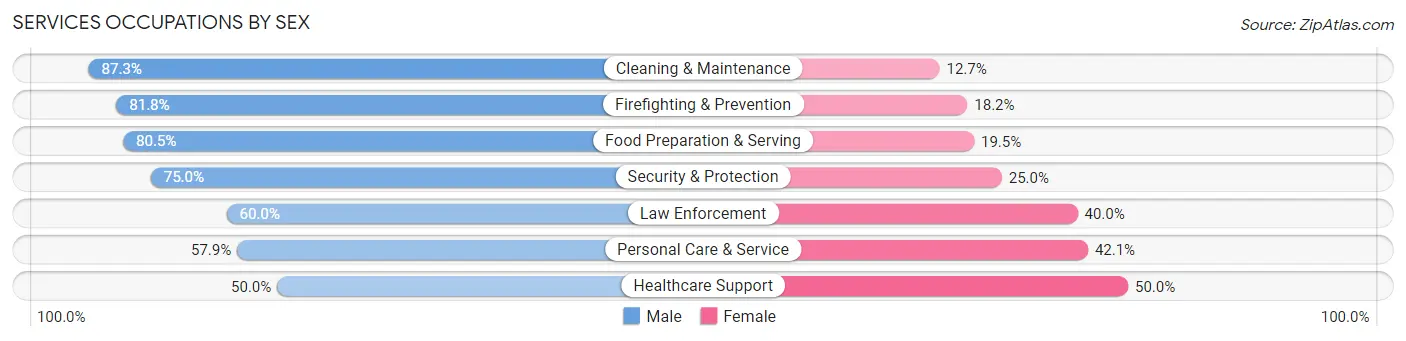
Services Occupations by Sex
Within the Services occupations in Aiea, the most male-oriented occupations are Cleaning & Maintenance (87.3%), Firefighting & Prevention (81.8%), and Food Preparation & Serving (80.5%), while the most female-oriented occupations are Healthcare Support (50.0%), Personal Care & Service (42.1%), and Law Enforcement (40.0%).
| Occupation | Male | Female |
| Healthcare Support | 31 (50.0%) | 31 (50.0%) |
| Security & Protection | 60 (75.0%) | 20 (25.0%) |
| Firefighting & Prevention | 45 (81.8%) | 10 (18.2%) |
| Law Enforcement | 15 (60.0%) | 10 (40.0%) |
| Food Preparation & Serving | 165 (80.5%) | 40 (19.5%) |
| Cleaning & Maintenance | 124 (87.3%) | 18 (12.7%) |
| Personal Care & Service | 73 (57.9%) | 53 (42.1%) |
| Total (Category) | 453 (73.7%) | 162 (26.3%) |
| Total (Overall) | 2,391 (53.7%) | 2,061 (46.3%) |
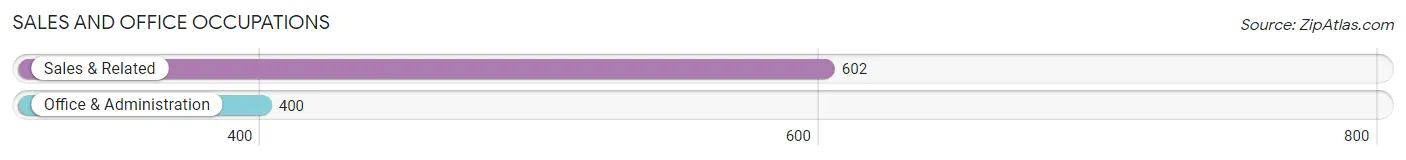
Sales and Office Occupations
The most common Sales and Office occupations in Aiea are Sales & Related (602 | 13.5%), and Office & Administration (400 | 9.0%).
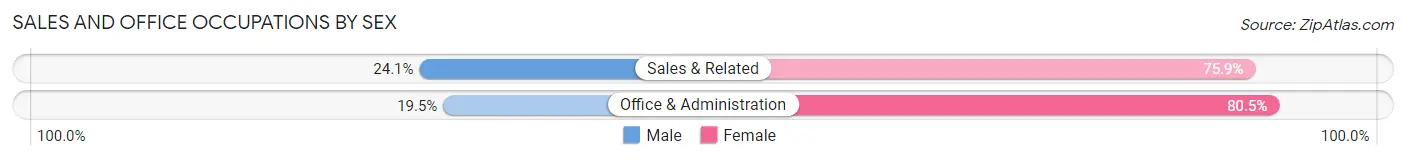
Sales and Office Occupations by Sex
| Occupation | Male | Female |
| Sales & Related | 145 (24.1%) | 457 (75.9%) |
| Office & Administration | 78 (19.5%) | 322 (80.5%) |
| Total (Category) | 223 (22.3%) | 779 (77.7%) |
| Total (Overall) | 2,391 (53.7%) | 2,061 (46.3%) |
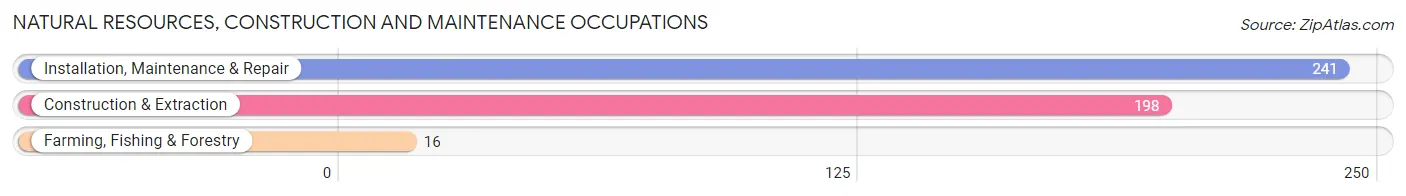
Natural Resources, Construction and Maintenance Occupations
The most common Natural Resources, Construction and Maintenance occupations in Aiea are Installation, Maintenance & Repair (241 | 5.4%), Construction & Extraction (198 | 4.4%), and Farming, Fishing & Forestry (16 | 0.4%).
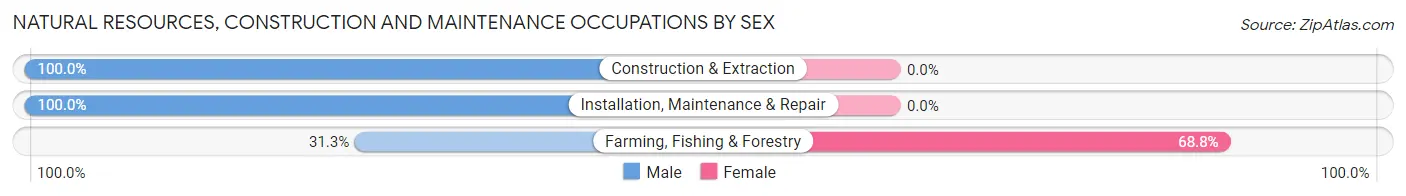
Natural Resources, Construction and Maintenance Occupations by Sex
| Occupation | Male | Female |
| Farming, Fishing & Forestry | 5 (31.2%) | 11 (68.8%) |
| Construction & Extraction | 198 (100.0%) | 0 (0.0%) |
| Installation, Maintenance & Repair | 241 (100.0%) | 0 (0.0%) |
| Total (Category) | 444 (97.6%) | 11 (2.4%) |
| Total (Overall) | 2,391 (53.7%) | 2,061 (46.3%) |
Production, Transportation and Moving Occupations
The most common Production, Transportation and Moving occupations in Aiea are Transportation (187 | 4.2%), Material Moving (128 | 2.9%), and Production (21 | 0.5%).
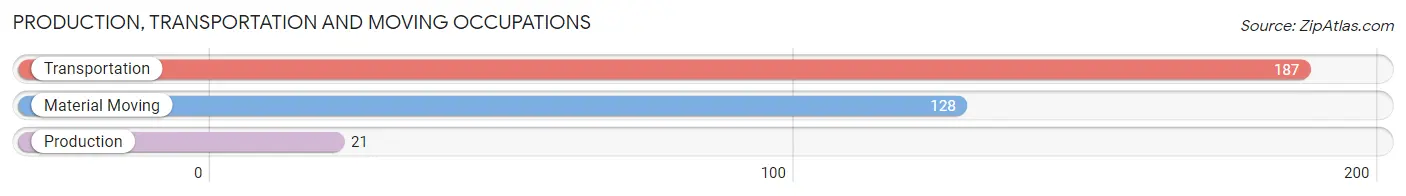
Production, Transportation and Moving Occupations by Sex
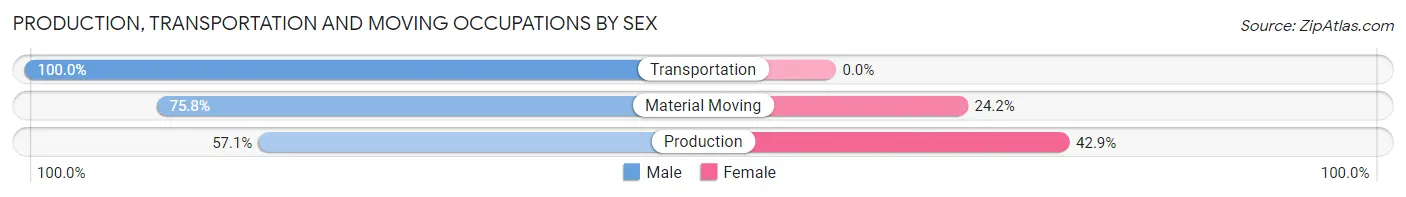
| Occupation | Male | Female |
| Production | 12 (57.1%) | 9 (42.9%) |
| Transportation | 187 (100.0%) | 0 (0.0%) |
| Material Moving | 97 (75.8%) | 31 (24.2%) |
| Total (Category) | 296 (88.1%) | 40 (11.9%) |
| Total (Overall) | 2,391 (53.7%) | 2,061 (46.3%) |
Employment Industries by Sex in Aiea
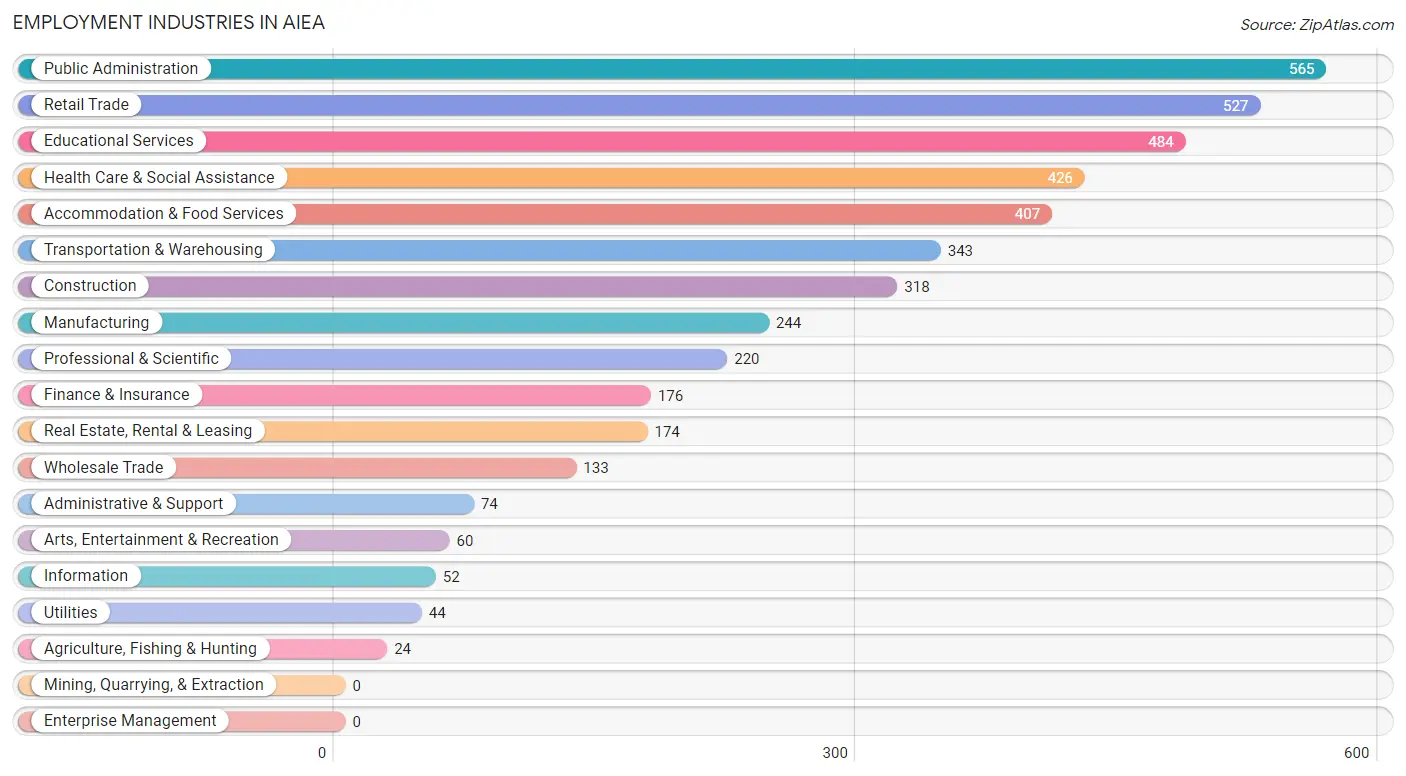
Employment Industries in Aiea
The major employment industries in Aiea include Public Administration (565 | 12.7%), Retail Trade (527 | 11.8%), Educational Services (484 | 10.9%), Health Care & Social Assistance (426 | 9.6%), and Accommodation & Food Services (407 | 9.1%).
Employment Industries by Sex in Aiea
The Aiea industries that see more men than women are Construction (84.3%), Manufacturing (79.5%), and Accommodation & Food Services (78.6%), whereas the industries that tend to have a higher number of women are Information (84.6%), Wholesale Trade (83.5%), and Health Care & Social Assistance (75.8%).
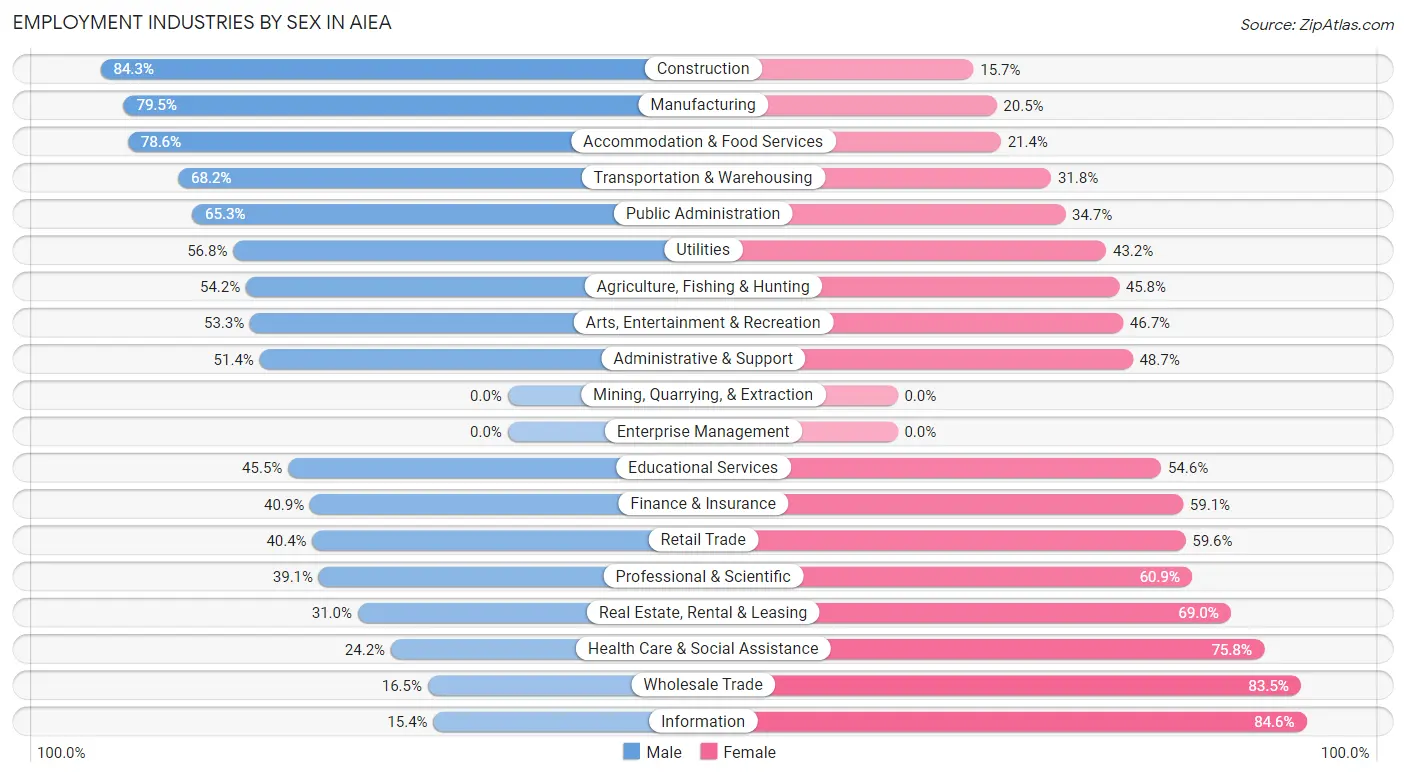
| Industry | Male | Female |
| Agriculture, Fishing & Hunting | 13 (54.2%) | 11 (45.8%) |
| Mining, Quarrying, & Extraction | 0 (0.0%) | 0 (0.0%) |
| Construction | 268 (84.3%) | 50 (15.7%) |
| Manufacturing | 194 (79.5%) | 50 (20.5%) |
| Wholesale Trade | 22 (16.5%) | 111 (83.5%) |
| Retail Trade | 213 (40.4%) | 314 (59.6%) |
| Transportation & Warehousing | 234 (68.2%) | 109 (31.8%) |
| Utilities | 25 (56.8%) | 19 (43.2%) |
| Information | 8 (15.4%) | 44 (84.6%) |
| Finance & Insurance | 72 (40.9%) | 104 (59.1%) |
| Real Estate, Rental & Leasing | 54 (31.0%) | 120 (69.0%) |
| Professional & Scientific | 86 (39.1%) | 134 (60.9%) |
| Enterprise Management | 0 (0.0%) | 0 (0.0%) |
| Administrative & Support | 38 (51.3%) | 36 (48.6%) |
| Educational Services | 220 (45.5%) | 264 (54.5%) |
| Health Care & Social Assistance | 103 (24.2%) | 323 (75.8%) |
| Arts, Entertainment & Recreation | 32 (53.3%) | 28 (46.7%) |
| Accommodation & Food Services | 320 (78.6%) | 87 (21.4%) |
| Public Administration | 369 (65.3%) | 196 (34.7%) |
| Total | 2,391 (53.7%) | 2,061 (46.3%) |
Education in Aiea
School Enrollment in Aiea
The most common levels of schooling among the 1,992 students in Aiea are college / undergraduate (352 | 17.7%), elementary school (329 | 16.5%), and middle school (325 | 16.3%).
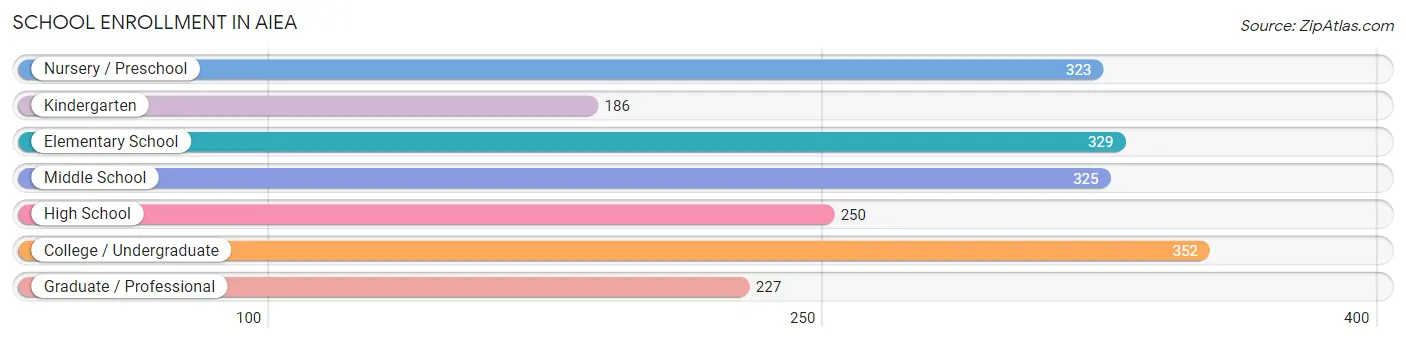
| School Level | # Students | % Students |
| Nursery / Preschool | 323 | 16.2% |
| Kindergarten | 186 | 9.3% |
| Elementary School | 329 | 16.5% |
| Middle School | 325 | 16.3% |
| High School | 250 | 12.6% |
| College / Undergraduate | 352 | 17.7% |
| Graduate / Professional | 227 | 11.4% |
| Total | 1,992 | 100.0% |
School Enrollment by Age by Funding Source in Aiea
Out of a total of 1,992 students who are enrolled in schools in Aiea, 719 (36.1%) attend a private institution, while the remaining 1,273 (63.9%) are enrolled in public schools. The age group of 3 to 4 year olds has the highest likelihood of being enrolled in private schools, with 178 (76.1% in the age bracket) enrolled. Conversely, the age group of 10 to 14 year olds has the lowest likelihood of being enrolled in a private school, with 309 (82.0% in the age bracket) attending a public institution.
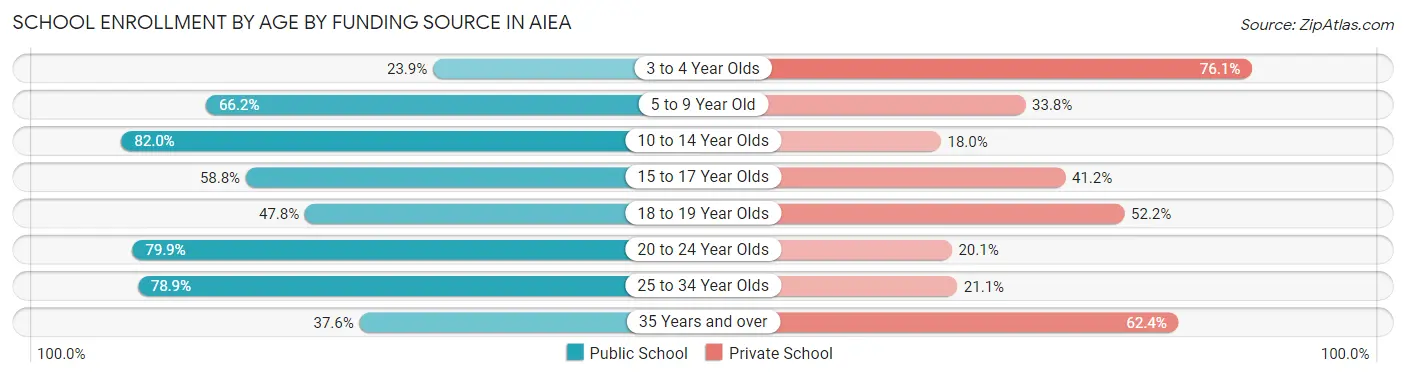
| Age Bracket | Public School | Private School |
| 3 to 4 Year Olds | 56 (23.9%) | 178 (76.1%) |
| 5 to 9 Year Old | 384 (66.2%) | 196 (33.8%) |
| 10 to 14 Year Olds | 309 (82.0%) | 68 (18.0%) |
| 15 to 17 Year Olds | 124 (58.8%) | 87 (41.2%) |
| 18 to 19 Year Olds | 32 (47.8%) | 35 (52.2%) |
| 20 to 24 Year Olds | 207 (79.9%) | 52 (20.1%) |
| 25 to 34 Year Olds | 116 (78.9%) | 31 (21.1%) |
| 35 Years and over | 44 (37.6%) | 73 (62.4%) |
| Total | 1,273 (63.9%) | 719 (36.1%) |
Educational Attainment by Field of Study in Aiea
Business (657 | 23.6%), social sciences (353 | 12.7%), education (230 | 8.3%), science & technology (206 | 7.4%), and psychology (177 | 6.4%) are the most common fields of study among 2,783 individuals in Aiea who have obtained a bachelor's degree or higher.
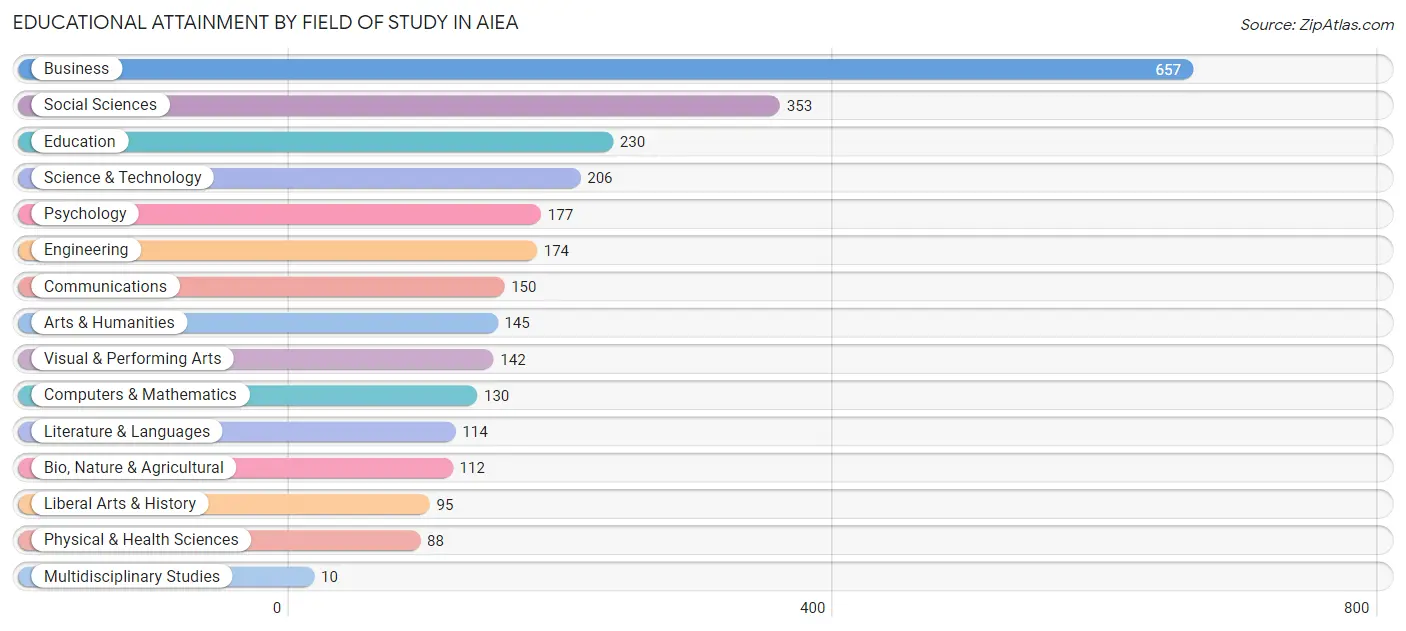
| Field of Study | # Graduates | % Graduates |
| Computers & Mathematics | 130 | 4.7% |
| Bio, Nature & Agricultural | 112 | 4.0% |
| Physical & Health Sciences | 88 | 3.2% |
| Psychology | 177 | 6.4% |
| Social Sciences | 353 | 12.7% |
| Engineering | 174 | 6.2% |
| Multidisciplinary Studies | 10 | 0.4% |
| Science & Technology | 206 | 7.4% |
| Business | 657 | 23.6% |
| Education | 230 | 8.3% |
| Literature & Languages | 114 | 4.1% |
| Liberal Arts & History | 95 | 3.4% |
| Visual & Performing Arts | 142 | 5.1% |
| Communications | 150 | 5.4% |
| Arts & Humanities | 145 | 5.2% |
| Total | 2,783 | 100.0% |
Transportation & Commute in Aiea
Vehicle Availability by Sex in Aiea
The most prevalent vehicle ownership categories in Aiea are males with 3 vehicles (692, accounting for 27.3%) and females with 3 vehicles (490, making up 33.4%).
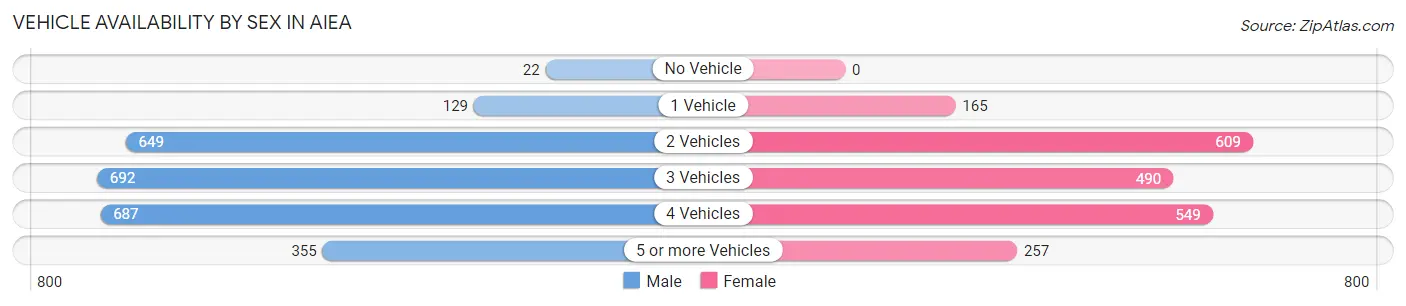
| Vehicles Available | Male | Female |
| No Vehicle | 22 (0.9%) | 0 (0.0%) |
| 1 Vehicle | 129 (5.1%) | 165 (8.0%) |
| 2 Vehicles | 649 (25.6%) | 609 (29.4%) |
| 3 Vehicles | 692 (27.3%) | 490 (23.7%) |
| 4 Vehicles | 687 (27.1%) | 549 (26.5%) |
| 5 or more Vehicles | 355 (14.0%) | 257 (12.4%) |
| Total | 2,534 (100.0%) | 2,070 (100.0%) |
Commute Time in Aiea
The most frequently occuring commute durations in Aiea are 30 to 34 minutes (920 commuters, 21.2%), 20 to 24 minutes (730 commuters, 16.8%), and 10 to 14 minutes (679 commuters, 15.7%).
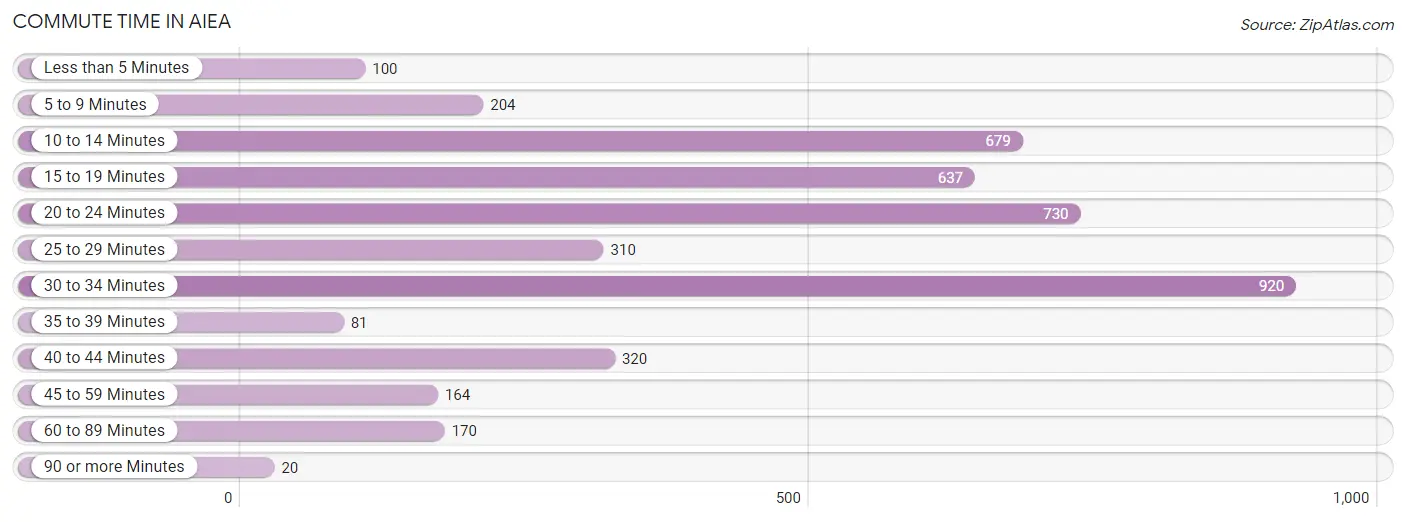
| Commute Time | # Commuters | % Commuters |
| Less than 5 Minutes | 100 | 2.3% |
| 5 to 9 Minutes | 204 | 4.7% |
| 10 to 14 Minutes | 679 | 15.7% |
| 15 to 19 Minutes | 637 | 14.7% |
| 20 to 24 Minutes | 730 | 16.8% |
| 25 to 29 Minutes | 310 | 7.1% |
| 30 to 34 Minutes | 920 | 21.2% |
| 35 to 39 Minutes | 81 | 1.9% |
| 40 to 44 Minutes | 320 | 7.4% |
| 45 to 59 Minutes | 164 | 3.8% |
| 60 to 89 Minutes | 170 | 3.9% |
| 90 or more Minutes | 20 | 0.5% |
Commute Time by Sex in Aiea
The most common commute times in Aiea are 30 to 34 minutes (490 commuters, 19.7%) for males and 30 to 34 minutes (430 commuters, 23.3%) for females.
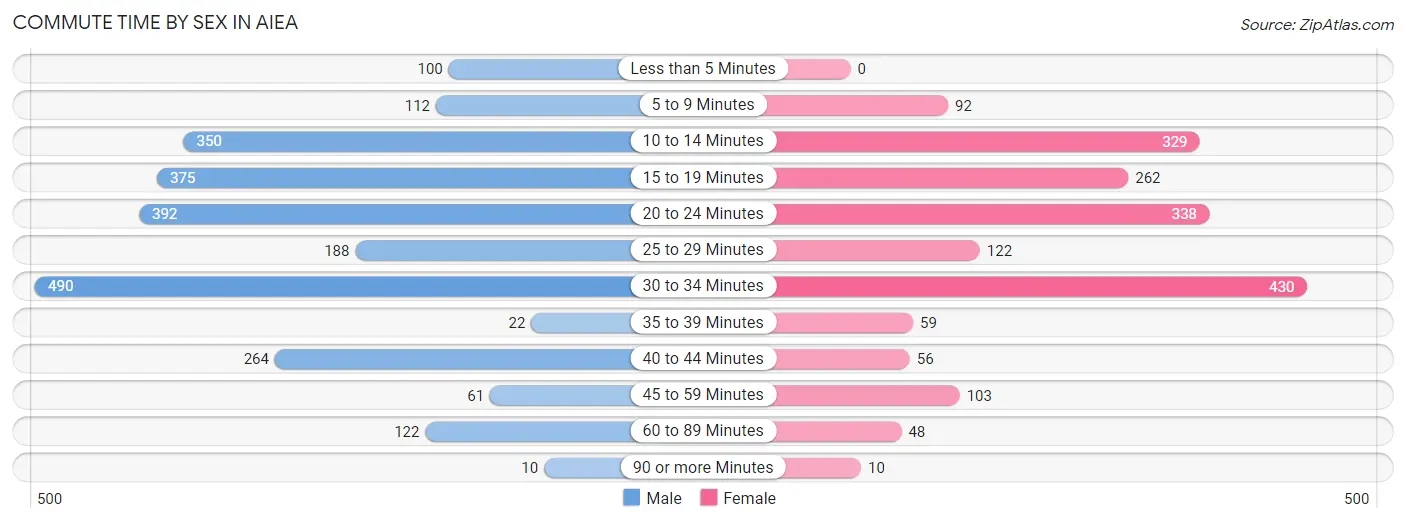
| Commute Time | Male | Female |
| Less than 5 Minutes | 100 (4.0%) | 0 (0.0%) |
| 5 to 9 Minutes | 112 (4.5%) | 92 (5.0%) |
| 10 to 14 Minutes | 350 (14.1%) | 329 (17.8%) |
| 15 to 19 Minutes | 375 (15.1%) | 262 (14.2%) |
| 20 to 24 Minutes | 392 (15.8%) | 338 (18.3%) |
| 25 to 29 Minutes | 188 (7.6%) | 122 (6.6%) |
| 30 to 34 Minutes | 490 (19.7%) | 430 (23.3%) |
| 35 to 39 Minutes | 22 (0.9%) | 59 (3.2%) |
| 40 to 44 Minutes | 264 (10.6%) | 56 (3.0%) |
| 45 to 59 Minutes | 61 (2.5%) | 103 (5.6%) |
| 60 to 89 Minutes | 122 (4.9%) | 48 (2.6%) |
| 90 or more Minutes | 10 (0.4%) | 10 (0.5%) |
Time of Departure to Work by Sex in Aiea
The most frequent times of departure to work in Aiea are 6:00 AM to 6:29 AM (331, 13.3%) for males and 6:00 AM to 6:29 AM (410, 22.2%) for females.
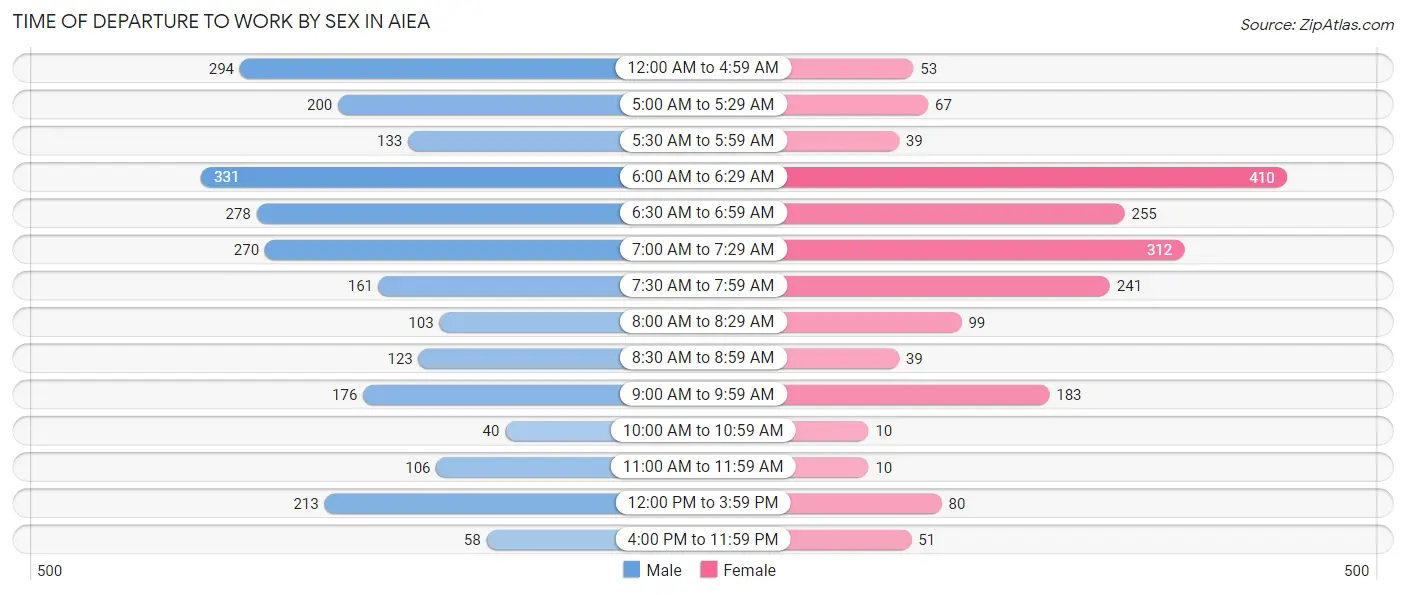
| Time of Departure | Male | Female |
| 12:00 AM to 4:59 AM | 294 (11.8%) | 53 (2.9%) |
| 5:00 AM to 5:29 AM | 200 (8.1%) | 67 (3.6%) |
| 5:30 AM to 5:59 AM | 133 (5.3%) | 39 (2.1%) |
| 6:00 AM to 6:29 AM | 331 (13.3%) | 410 (22.2%) |
| 6:30 AM to 6:59 AM | 278 (11.2%) | 255 (13.8%) |
| 7:00 AM to 7:29 AM | 270 (10.9%) | 312 (16.9%) |
| 7:30 AM to 7:59 AM | 161 (6.5%) | 241 (13.0%) |
| 8:00 AM to 8:29 AM | 103 (4.1%) | 99 (5.3%) |
| 8:30 AM to 8:59 AM | 123 (5.0%) | 39 (2.1%) |
| 9:00 AM to 9:59 AM | 176 (7.1%) | 183 (9.9%) |
| 10:00 AM to 10:59 AM | 40 (1.6%) | 10 (0.5%) |
| 11:00 AM to 11:59 AM | 106 (4.3%) | 10 (0.5%) |
| 12:00 PM to 3:59 PM | 213 (8.6%) | 80 (4.3%) |
| 4:00 PM to 11:59 PM | 58 (2.3%) | 51 (2.8%) |
| Total | 2,486 (100.0%) | 1,849 (100.0%) |
Housing Occupancy in Aiea
Occupancy by Ownership in Aiea
Of the total 2,965 dwellings in Aiea, owner-occupied units account for 2,223 (75.0%), while renter-occupied units make up 742 (25.0%).
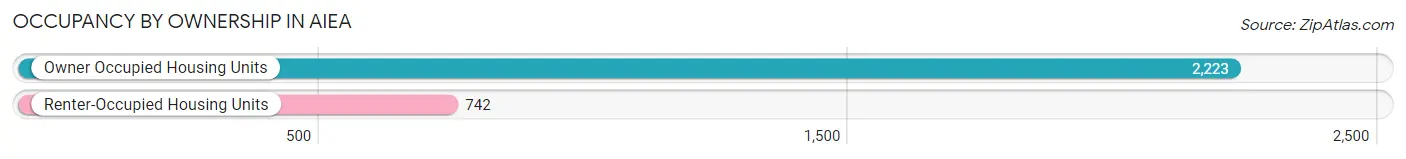
| Occupancy | # Housing Units | % Housing Units |
| Owner Occupied Housing Units | 2,223 | 75.0% |
| Renter-Occupied Housing Units | 742 | 25.0% |
| Total Occupied Housing Units | 2,965 | 100.0% |
Occupancy by Household Size in Aiea
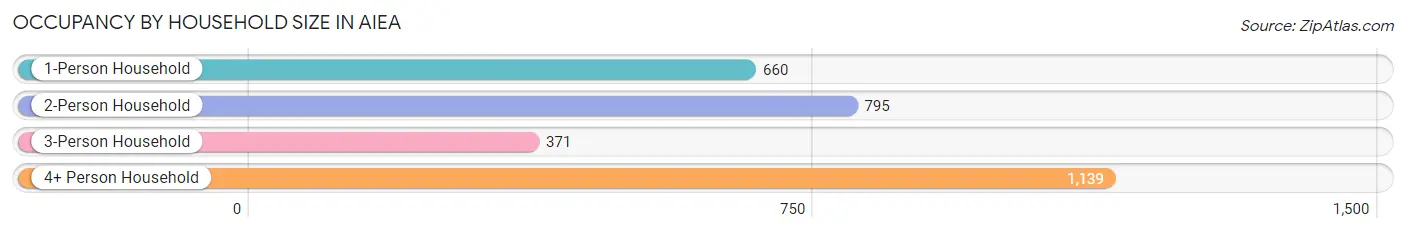
| Household Size | # Housing Units | % Housing Units |
| 1-Person Household | 660 | 22.3% |
| 2-Person Household | 795 | 26.8% |
| 3-Person Household | 371 | 12.5% |
| 4+ Person Household | 1,139 | 38.4% |
| Total Housing Units | 2,965 | 100.0% |
Occupancy by Ownership by Household Size in Aiea
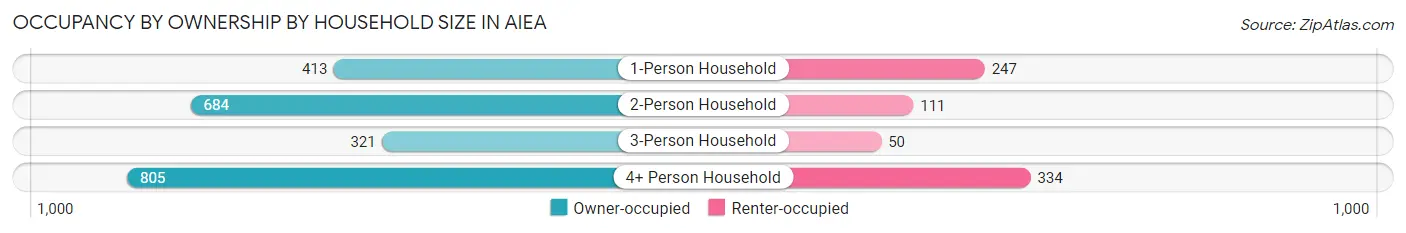
| Household Size | Owner-occupied | Renter-occupied |
| 1-Person Household | 413 (62.6%) | 247 (37.4%) |
| 2-Person Household | 684 (86.0%) | 111 (14.0%) |
| 3-Person Household | 321 (86.5%) | 50 (13.5%) |
| 4+ Person Household | 805 (70.7%) | 334 (29.3%) |
| Total Housing Units | 2,223 (75.0%) | 742 (25.0%) |
Occupancy by Educational Attainment in Aiea
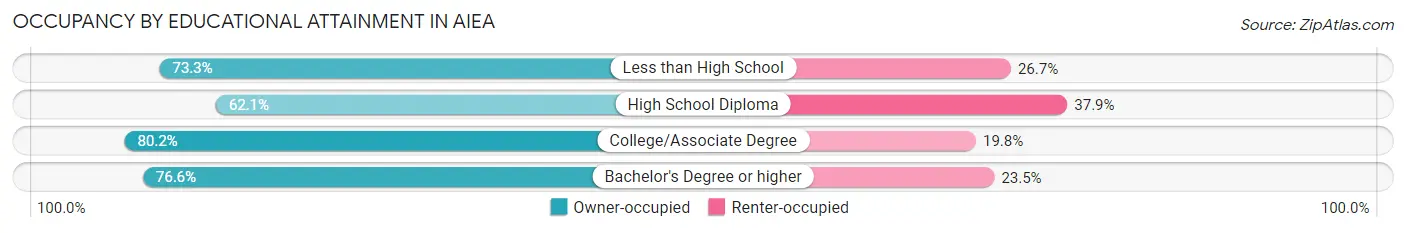
| Household Size | Owner-occupied | Renter-occupied |
| Less than High School | 74 (73.3%) | 27 (26.7%) |
| High School Diploma | 344 (62.1%) | 210 (37.9%) |
| College/Associate Degree | 806 (80.2%) | 199 (19.8%) |
| Bachelor's Degree or higher | 999 (76.5%) | 306 (23.4%) |
Occupancy by Age of Householder in Aiea
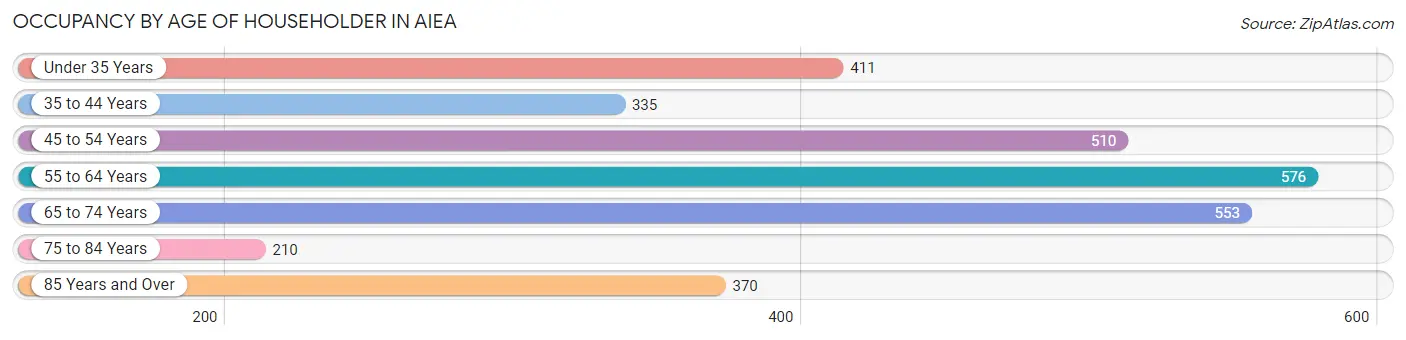
| Age Bracket | # Households | % Households |
| Under 35 Years | 411 | 13.9% |
| 35 to 44 Years | 335 | 11.3% |
| 45 to 54 Years | 510 | 17.2% |
| 55 to 64 Years | 576 | 19.4% |
| 65 to 74 Years | 553 | 18.6% |
| 75 to 84 Years | 210 | 7.1% |
| 85 Years and Over | 370 | 12.5% |
| Total | 2,965 | 100.0% |
Housing Finances in Aiea
Median Income by Occupancy in Aiea
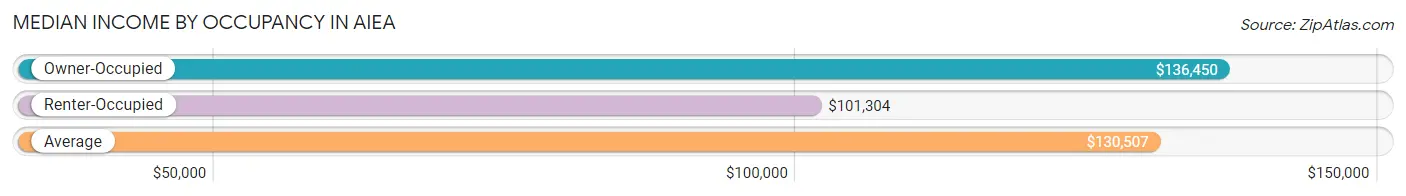
| Occupancy Type | # Households | Median Income |
| Owner-Occupied | 2,223 (75.0%) | $136,450 |
| Renter-Occupied | 742 (25.0%) | $101,304 |
| Average | 2,965 (100.0%) | $130,507 |
Occupancy by Householder Income Bracket in Aiea
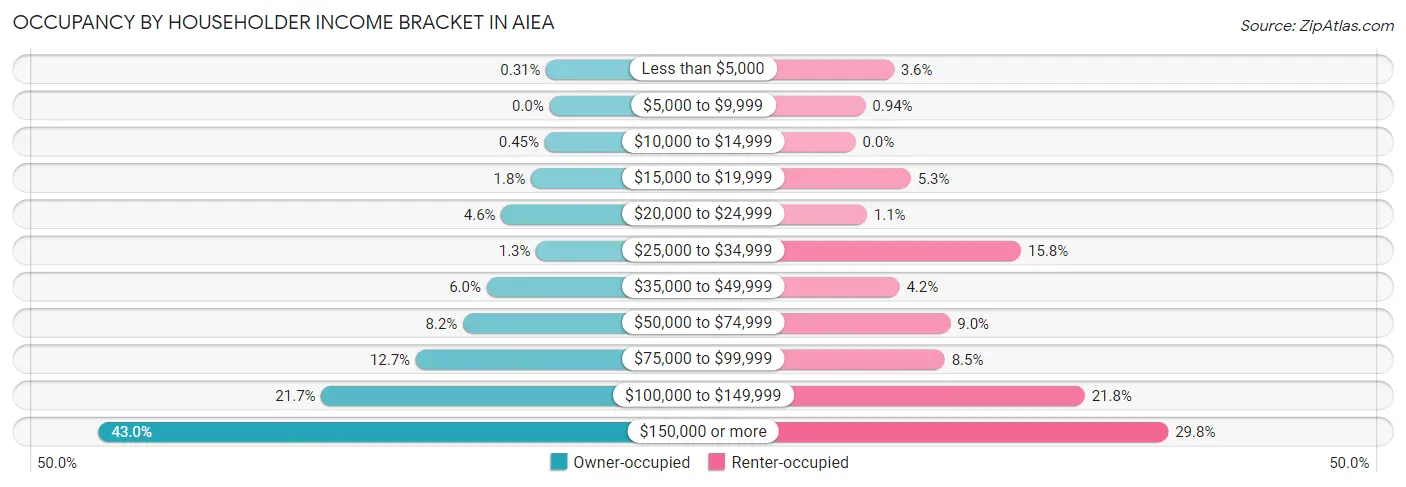
| Income Bracket | Owner-occupied | Renter-occupied |
| Less than $5,000 | 7 (0.3%) | 27 (3.6%) |
| $5,000 to $9,999 | 0 (0.0%) | 7 (0.9%) |
| $10,000 to $14,999 | 10 (0.4%) | 0 (0.0%) |
| $15,000 to $19,999 | 39 (1.8%) | 39 (5.3%) |
| $20,000 to $24,999 | 102 (4.6%) | 8 (1.1%) |
| $25,000 to $34,999 | 28 (1.3%) | 117 (15.8%) |
| $35,000 to $49,999 | 133 (6.0%) | 31 (4.2%) |
| $50,000 to $74,999 | 183 (8.2%) | 67 (9.0%) |
| $75,000 to $99,999 | 283 (12.7%) | 63 (8.5%) |
| $100,000 to $149,999 | 483 (21.7%) | 162 (21.8%) |
| $150,000 or more | 955 (43.0%) | 221 (29.8%) |
| Total | 2,223 (100.0%) | 742 (100.0%) |
Monthly Housing Cost Tiers in Aiea
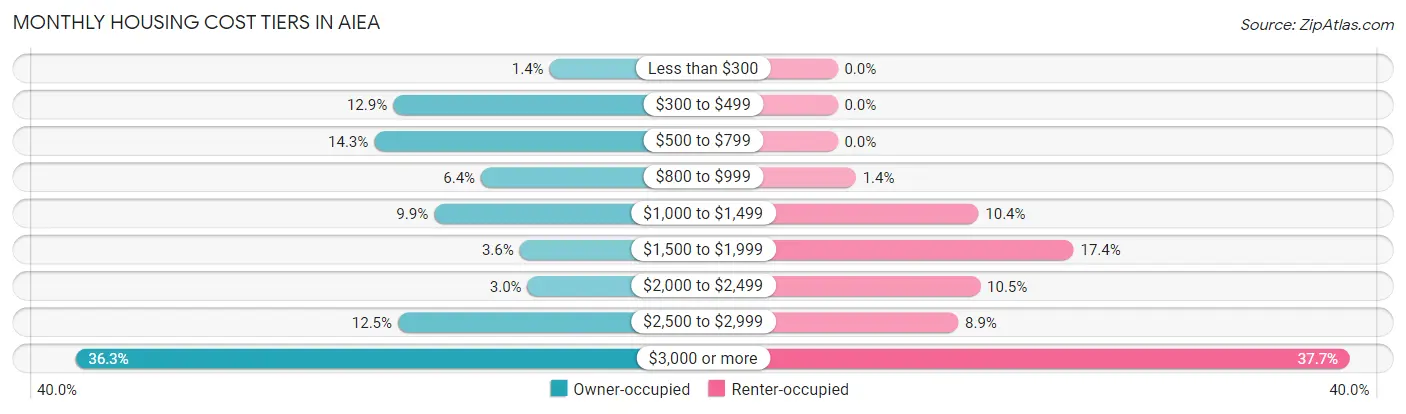
| Monthly Cost | Owner-occupied | Renter-occupied |
| Less than $300 | 30 (1.3%) | 0 (0.0%) |
| $300 to $499 | 286 (12.9%) | 0 (0.0%) |
| $500 to $799 | 317 (14.3%) | 0 (0.0%) |
| $800 to $999 | 142 (6.4%) | 10 (1.3%) |
| $1,000 to $1,499 | 219 (9.9%) | 77 (10.4%) |
| $1,500 to $1,999 | 79 (3.5%) | 129 (17.4%) |
| $2,000 to $2,499 | 66 (3.0%) | 78 (10.5%) |
| $2,500 to $2,999 | 278 (12.5%) | 66 (8.9%) |
| $3,000 or more | 806 (36.3%) | 280 (37.7%) |
| Total | 2,223 (100.0%) | 742 (100.0%) |
Physical Housing Characteristics in Aiea
Housing Structures in Aiea
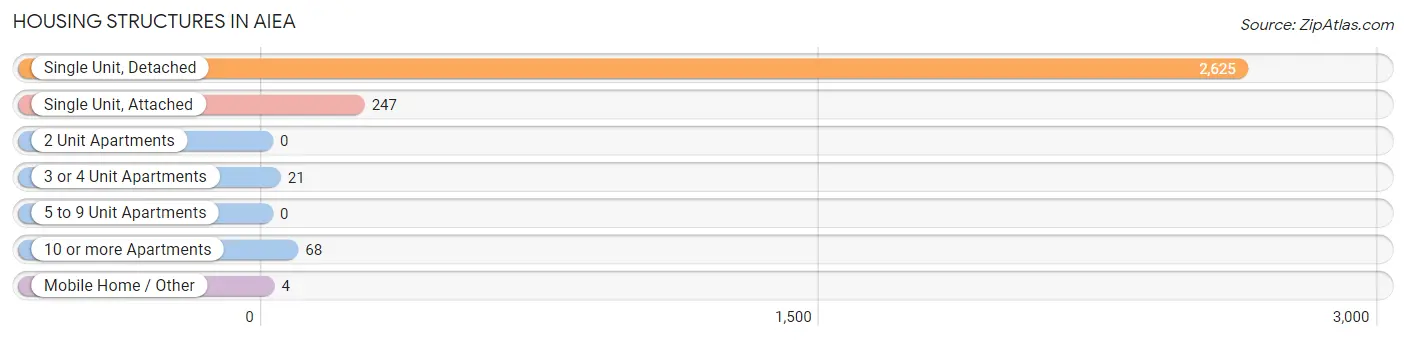
| Structure Type | # Housing Units | % Housing Units |
| Single Unit, Detached | 2,625 | 88.5% |
| Single Unit, Attached | 247 | 8.3% |
| 2 Unit Apartments | 0 | 0.0% |
| 3 or 4 Unit Apartments | 21 | 0.7% |
| 5 to 9 Unit Apartments | 0 | 0.0% |
| 10 or more Apartments | 68 | 2.3% |
| Mobile Home / Other | 4 | 0.1% |
| Total | 2,965 | 100.0% |
Housing Structures by Occupancy in Aiea
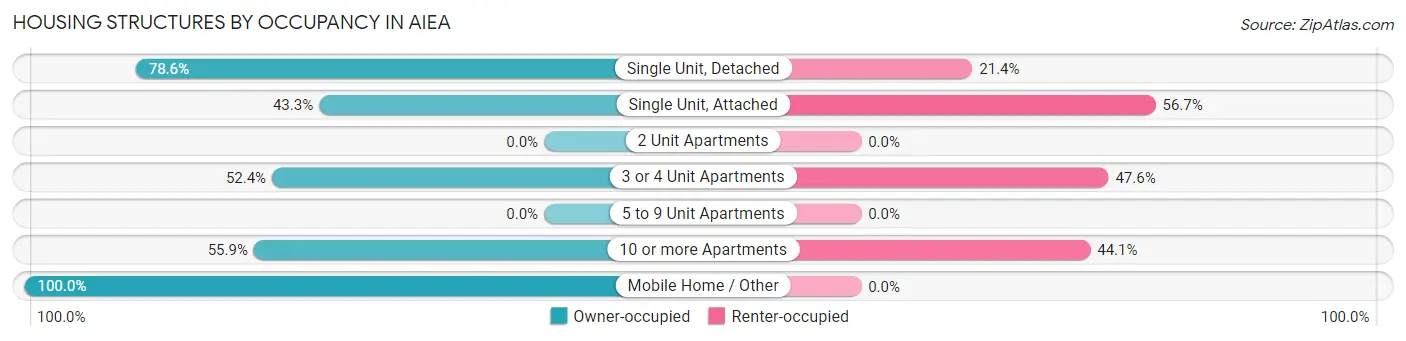
| Structure Type | Owner-occupied | Renter-occupied |
| Single Unit, Detached | 2,063 (78.6%) | 562 (21.4%) |
| Single Unit, Attached | 107 (43.3%) | 140 (56.7%) |
| 2 Unit Apartments | 0 (0.0%) | 0 (0.0%) |
| 3 or 4 Unit Apartments | 11 (52.4%) | 10 (47.6%) |
| 5 to 9 Unit Apartments | 0 (0.0%) | 0 (0.0%) |
| 10 or more Apartments | 38 (55.9%) | 30 (44.1%) |
| Mobile Home / Other | 4 (100.0%) | 0 (0.0%) |
| Total | 2,223 (75.0%) | 742 (25.0%) |
Housing Structures by Number of Rooms in Aiea
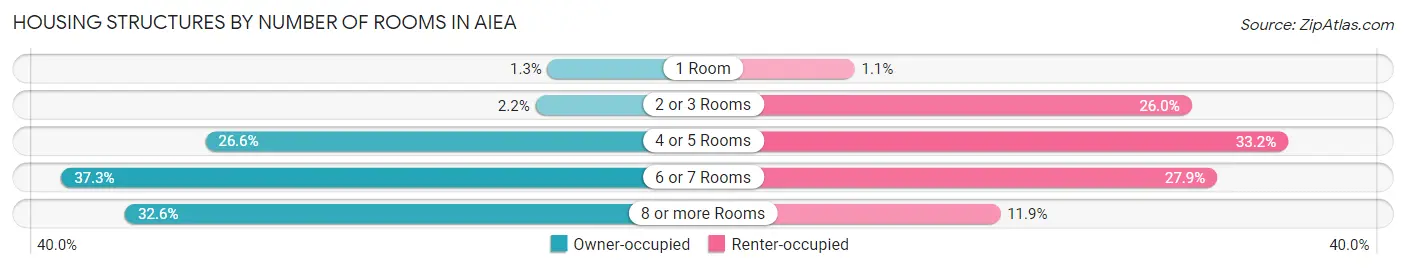
| Number of Rooms | Owner-occupied | Renter-occupied |
| 1 Room | 29 (1.3%) | 8 (1.1%) |
| 2 or 3 Rooms | 49 (2.2%) | 193 (26.0%) |
| 4 or 5 Rooms | 592 (26.6%) | 246 (33.2%) |
| 6 or 7 Rooms | 829 (37.3%) | 207 (27.9%) |
| 8 or more Rooms | 724 (32.6%) | 88 (11.9%) |
| Total | 2,223 (100.0%) | 742 (100.0%) |
Housing Structure by Heating Type in Aiea
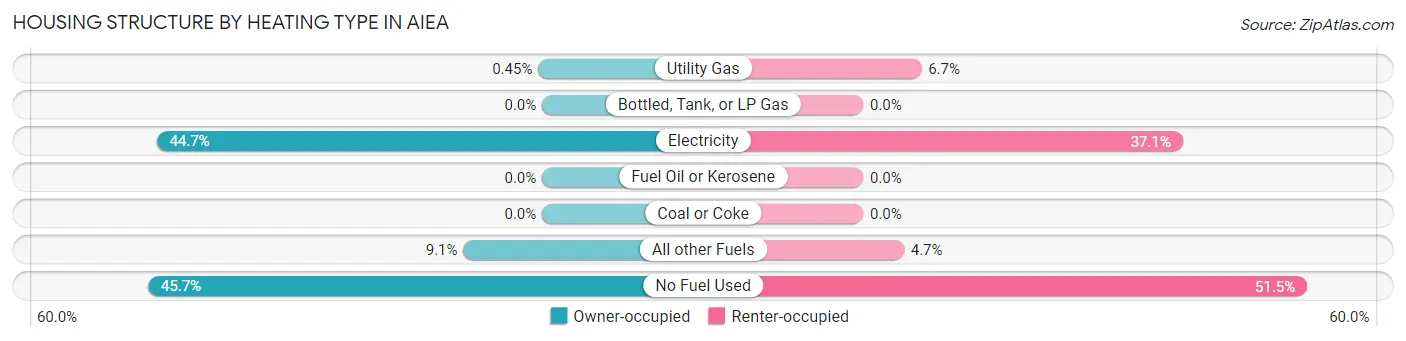
| Heating Type | Owner-occupied | Renter-occupied |
| Utility Gas | 10 (0.4%) | 50 (6.7%) |
| Bottled, Tank, or LP Gas | 0 (0.0%) | 0 (0.0%) |
| Electricity | 994 (44.7%) | 275 (37.1%) |
| Fuel Oil or Kerosene | 0 (0.0%) | 0 (0.0%) |
| Coal or Coke | 0 (0.0%) | 0 (0.0%) |
| All other Fuels | 203 (9.1%) | 35 (4.7%) |
| No Fuel Used | 1,016 (45.7%) | 382 (51.5%) |
| Total | 2,223 (100.0%) | 742 (100.0%) |
Household Vehicle Usage in Aiea
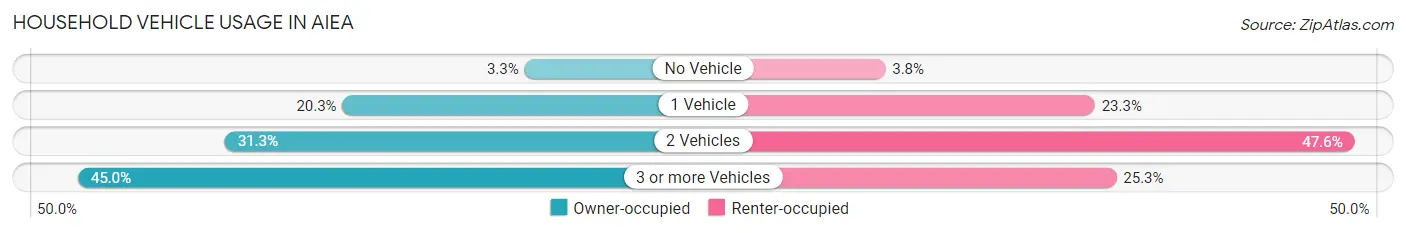
| Vehicles per Household | Owner-occupied | Renter-occupied |
| No Vehicle | 74 (3.3%) | 28 (3.8%) |
| 1 Vehicle | 452 (20.3%) | 173 (23.3%) |
| 2 Vehicles | 696 (31.3%) | 353 (47.6%) |
| 3 or more Vehicles | 1,001 (45.0%) | 188 (25.3%) |
| Total | 2,223 (100.0%) | 742 (100.0%) |
Real Estate & Mortgages in Aiea
Real Estate and Mortgage Overview in Aiea
| Characteristic | Without Mortgage | With Mortgage |
| Housing Units | 813 | 1,410 |
| Median Property Value | $977,000 | $945,500 |
| Median Household Income | $92,625 | $806 |
| Monthly Housing Costs | $572 | $806 |
| Real Estate Taxes | $2,777 | $29 |
Property Value by Mortgage Status in Aiea
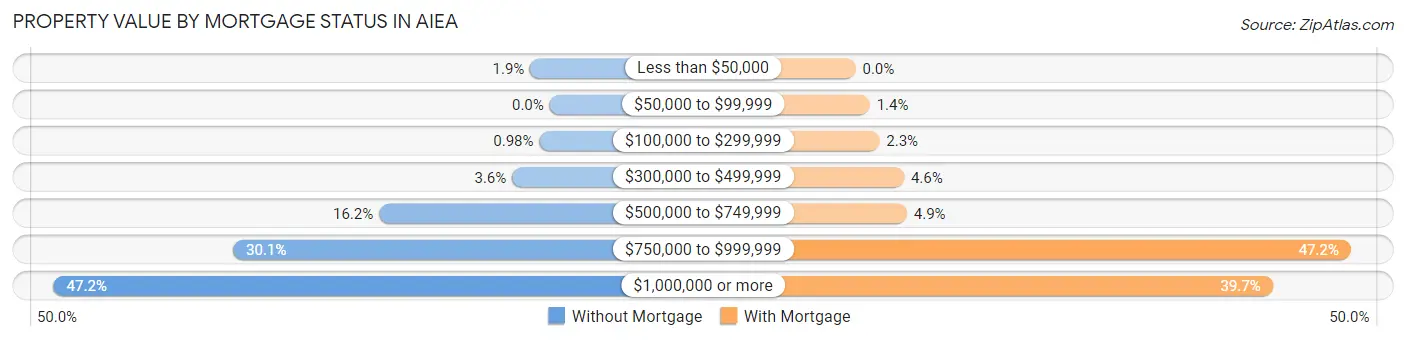
| Property Value | Without Mortgage | With Mortgage |
| Less than $50,000 | 15 (1.8%) | 0 (0.0%) |
| $50,000 to $99,999 | 0 (0.0%) | 19 (1.3%) |
| $100,000 to $299,999 | 8 (1.0%) | 32 (2.3%) |
| $300,000 to $499,999 | 29 (3.6%) | 65 (4.6%) |
| $500,000 to $749,999 | 132 (16.2%) | 69 (4.9%) |
| $750,000 to $999,999 | 245 (30.1%) | 665 (47.2%) |
| $1,000,000 or more | 384 (47.2%) | 560 (39.7%) |
| Total | 813 (100.0%) | 1,410 (100.0%) |
Household Income by Mortgage Status in Aiea
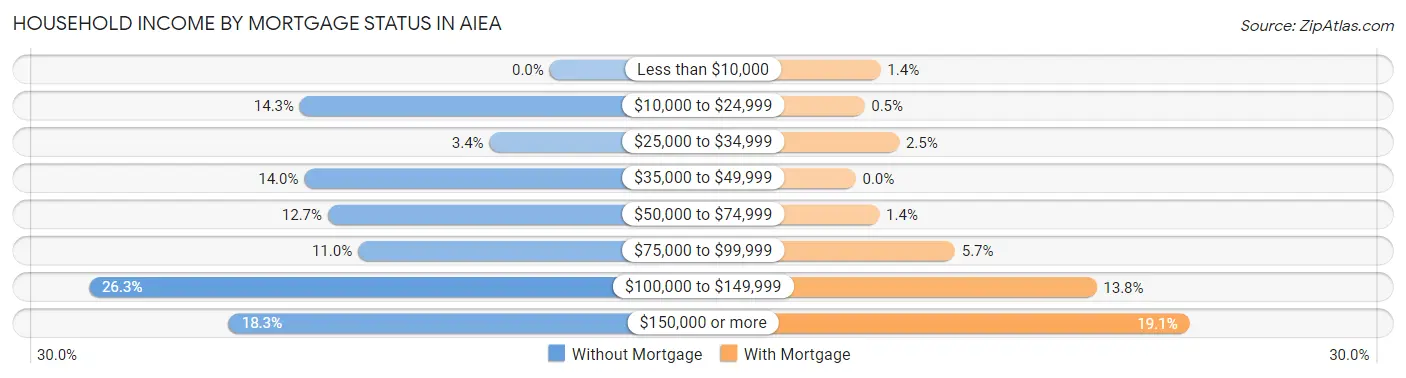
| Household Income | Without Mortgage | With Mortgage |
| Less than $10,000 | 0 (0.0%) | 20 (1.4%) |
| $10,000 to $24,999 | 116 (14.3%) | 7 (0.5%) |
| $25,000 to $34,999 | 28 (3.4%) | 35 (2.5%) |
| $35,000 to $49,999 | 114 (14.0%) | 0 (0.0%) |
| $50,000 to $74,999 | 103 (12.7%) | 19 (1.3%) |
| $75,000 to $99,999 | 89 (11.0%) | 80 (5.7%) |
| $100,000 to $149,999 | 214 (26.3%) | 194 (13.8%) |
| $150,000 or more | 149 (18.3%) | 269 (19.1%) |
| Total | 813 (100.0%) | 1,410 (100.0%) |
Property Value to Household Income Ratio in Aiea
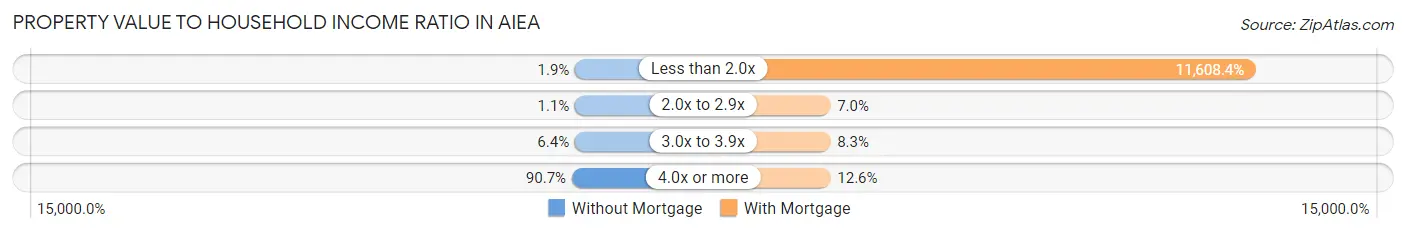
| Value-to-Income Ratio | Without Mortgage | With Mortgage |
| Less than 2.0x | 15 (1.8%) | 163,679 (11,608.4%) |
| 2.0x to 2.9x | 9 (1.1%) | 98 (7.0%) |
| 3.0x to 3.9x | 52 (6.4%) | 117 (8.3%) |
| 4.0x or more | 737 (90.6%) | 178 (12.6%) |
| Total | 813 (100.0%) | 1,410 (100.0%) |
Real Estate Taxes by Mortgage Status in Aiea
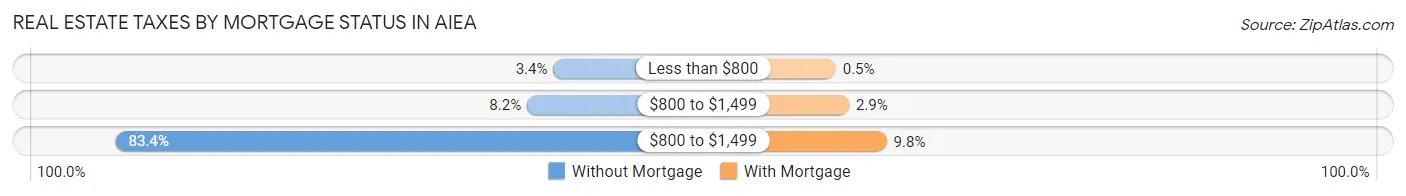
| Property Taxes | Without Mortgage | With Mortgage |
| Less than $800 | 28 (3.4%) | 7 (0.5%) |
| $800 to $1,499 | 67 (8.2%) | 41 (2.9%) |
| $800 to $1,499 | 678 (83.4%) | 138 (9.8%) |
| Total | 813 (100.0%) | 1,410 (100.0%) |
Health & Disability in Aiea
Health Insurance Coverage by Age in Aiea
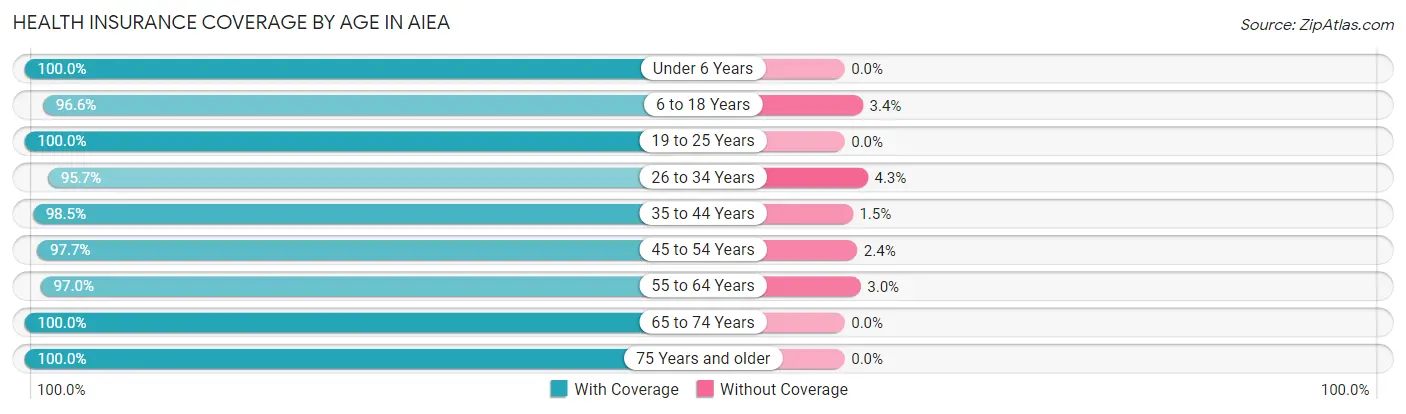
| Age Bracket | With Coverage | Without Coverage |
| Under 6 Years | 992 (100.0%) | 0 (0.0%) |
| 6 to 18 Years | 1,017 (96.6%) | 36 (3.4%) |
| 19 to 25 Years | 722 (100.0%) | 0 (0.0%) |
| 26 to 34 Years | 1,282 (95.7%) | 58 (4.3%) |
| 35 to 44 Years | 841 (98.5%) | 13 (1.5%) |
| 45 to 54 Years | 1,079 (97.7%) | 26 (2.4%) |
| 55 to 64 Years | 1,195 (97.0%) | 37 (3.0%) |
| 65 to 74 Years | 1,098 (100.0%) | 0 (0.0%) |
| 75 Years and older | 961 (100.0%) | 0 (0.0%) |
| Total | 9,187 (98.2%) | 170 (1.8%) |
Health Insurance Coverage by Citizenship Status in Aiea
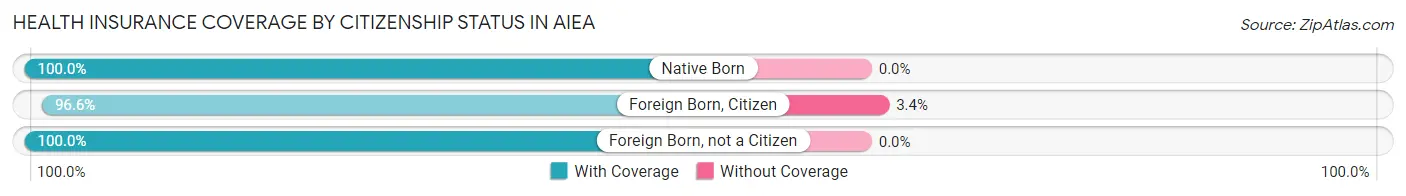
| Citizenship Status | With Coverage | Without Coverage |
| Native Born | 992 (100.0%) | 0 (0.0%) |
| Foreign Born, Citizen | 1,017 (96.6%) | 36 (3.4%) |
| Foreign Born, not a Citizen | 722 (100.0%) | 0 (0.0%) |
Health Insurance Coverage by Household Income in Aiea
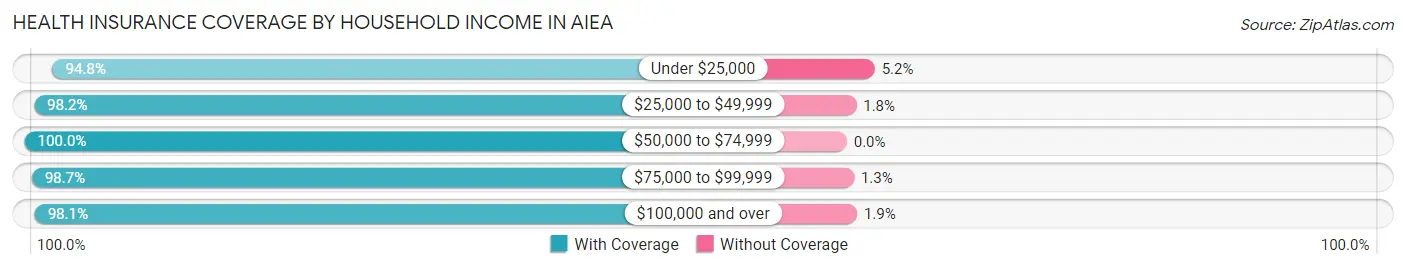
| Household Income | With Coverage | Without Coverage |
| Under $25,000 | 253 (94.8%) | 14 (5.2%) |
| $25,000 to $49,999 | 608 (98.2%) | 11 (1.8%) |
| $50,000 to $74,999 | 660 (100.0%) | 0 (0.0%) |
| $75,000 to $99,999 | 881 (98.7%) | 12 (1.3%) |
| $100,000 and over | 6,743 (98.1%) | 131 (1.9%) |
Public vs Private Health Insurance Coverage by Age in Aiea
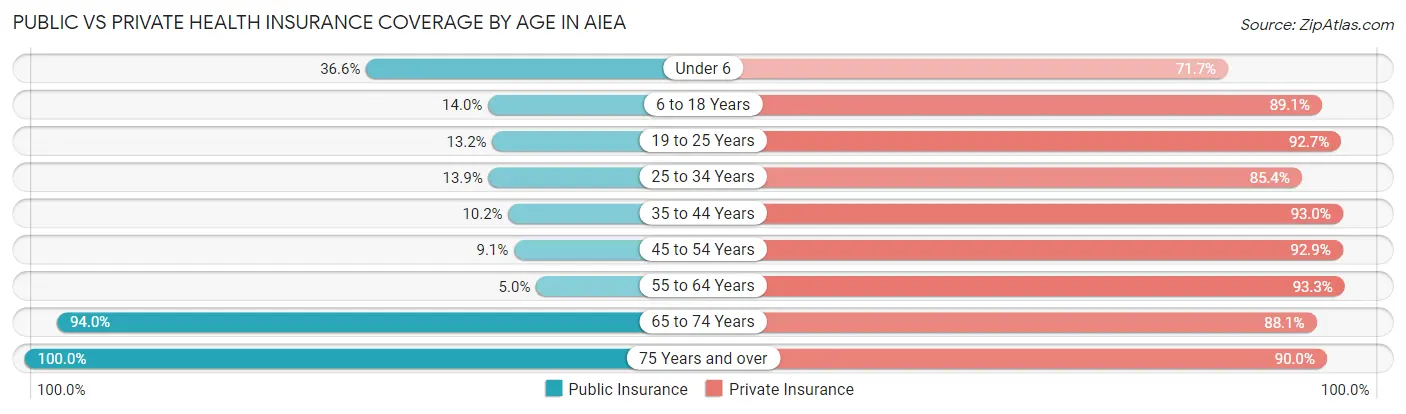
| Age Bracket | Public Insurance | Private Insurance |
| Under 6 | 363 (36.6%) | 711 (71.7%) |
| 6 to 18 Years | 147 (14.0%) | 938 (89.1%) |
| 19 to 25 Years | 95 (13.2%) | 669 (92.7%) |
| 25 to 34 Years | 186 (13.9%) | 1,144 (85.4%) |
| 35 to 44 Years | 87 (10.2%) | 794 (93.0%) |
| 45 to 54 Years | 101 (9.1%) | 1,027 (92.9%) |
| 55 to 64 Years | 62 (5.0%) | 1,150 (93.3%) |
| 65 to 74 Years | 1,032 (94.0%) | 967 (88.1%) |
| 75 Years and over | 961 (100.0%) | 865 (90.0%) |
| Total | 3,034 (32.4%) | 8,265 (88.3%) |
Disability Status by Sex by Age in Aiea
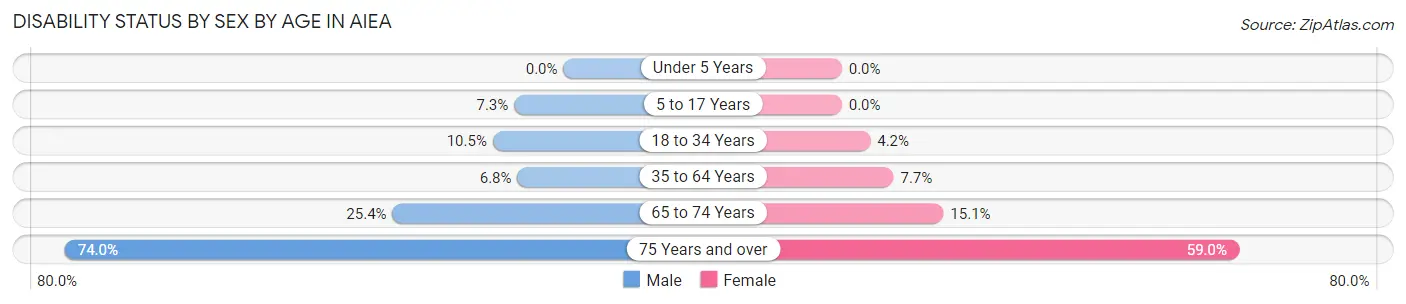
| Age Bracket | Male | Female |
| Under 5 Years | 0 (0.0%) | 0 (0.0%) |
| 5 to 17 Years | 50 (7.3%) | 0 (0.0%) |
| 18 to 34 Years | 122 (10.5%) | 40 (4.2%) |
| 35 to 64 Years | 105 (6.8%) | 127 (7.7%) |
| 65 to 74 Years | 134 (25.4%) | 86 (15.1%) |
| 75 Years and over | 248 (74.0%) | 369 (59.0%) |
Disability Class by Sex by Age in Aiea
Disability Class: Hearing Difficulty
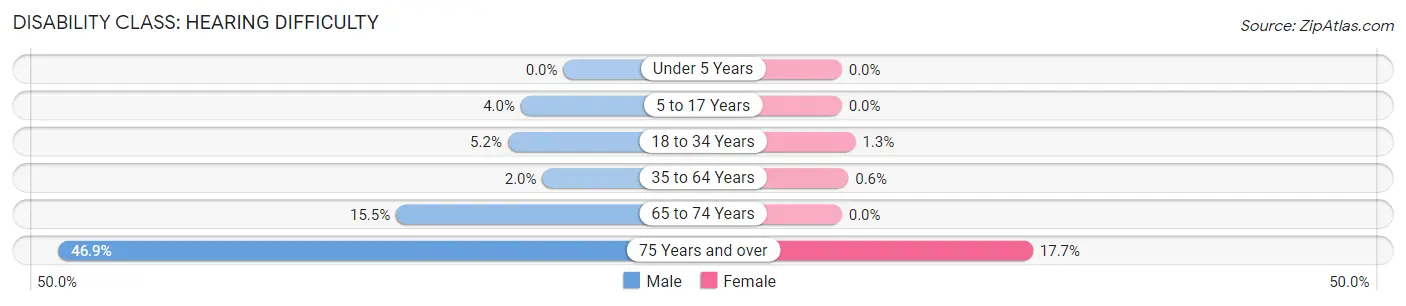
| Age Bracket | Male | Female |
| Under 5 Years | 0 (0.0%) | 0 (0.0%) |
| 5 to 17 Years | 27 (4.0%) | 0 (0.0%) |
| 18 to 34 Years | 60 (5.2%) | 12 (1.3%) |
| 35 to 64 Years | 30 (1.9%) | 10 (0.6%) |
| 65 to 74 Years | 82 (15.5%) | 0 (0.0%) |
| 75 Years and over | 157 (46.9%) | 111 (17.7%) |
Disability Class: Vision Difficulty
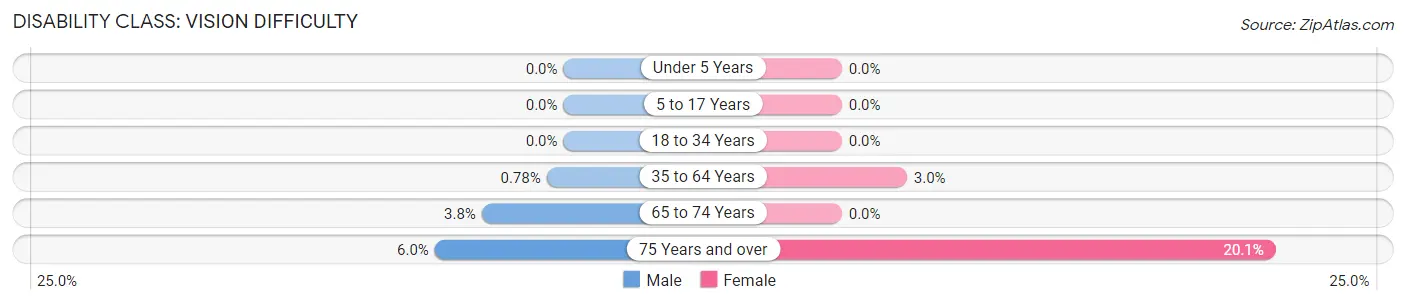
| Age Bracket | Male | Female |
| Under 5 Years | 0 (0.0%) | 0 (0.0%) |
| 5 to 17 Years | 0 (0.0%) | 0 (0.0%) |
| 18 to 34 Years | 0 (0.0%) | 0 (0.0%) |
| 35 to 64 Years | 12 (0.8%) | 50 (3.0%) |
| 65 to 74 Years | 20 (3.8%) | 0 (0.0%) |
| 75 Years and over | 20 (6.0%) | 126 (20.1%) |
Disability Class: Cognitive Difficulty
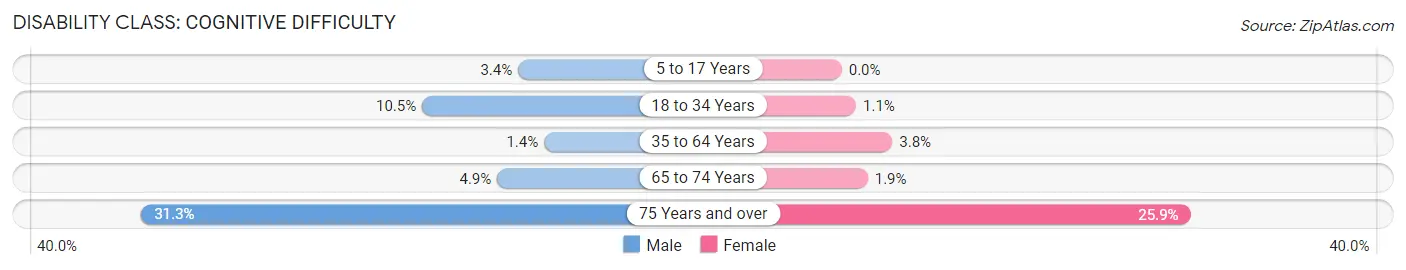
| Age Bracket | Male | Female |
| 5 to 17 Years | 23 (3.4%) | 0 (0.0%) |
| 18 to 34 Years | 122 (10.5%) | 10 (1.1%) |
| 35 to 64 Years | 22 (1.4%) | 62 (3.7%) |
| 65 to 74 Years | 26 (4.9%) | 11 (1.9%) |
| 75 Years and over | 105 (31.3%) | 162 (25.9%) |
Disability Class: Ambulatory Difficulty
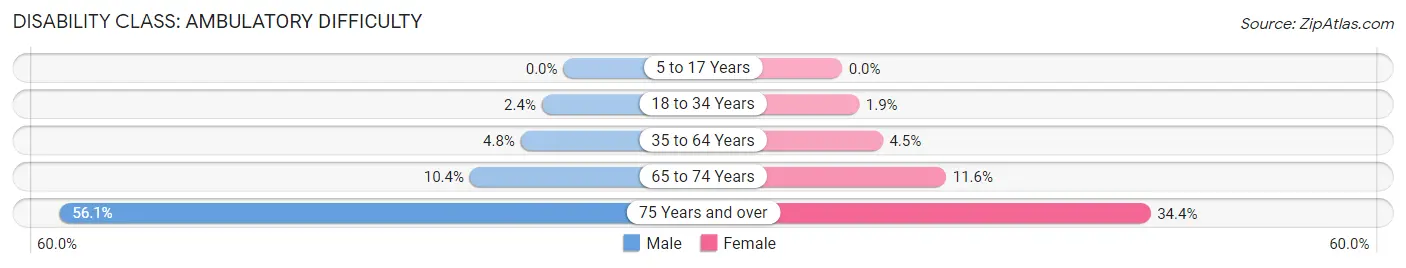
| Age Bracket | Male | Female |
| 5 to 17 Years | 0 (0.0%) | 0 (0.0%) |
| 18 to 34 Years | 28 (2.4%) | 18 (1.9%) |
| 35 to 64 Years | 73 (4.8%) | 75 (4.5%) |
| 65 to 74 Years | 55 (10.4%) | 66 (11.6%) |
| 75 Years and over | 188 (56.1%) | 215 (34.4%) |
Disability Class: Self-Care Difficulty
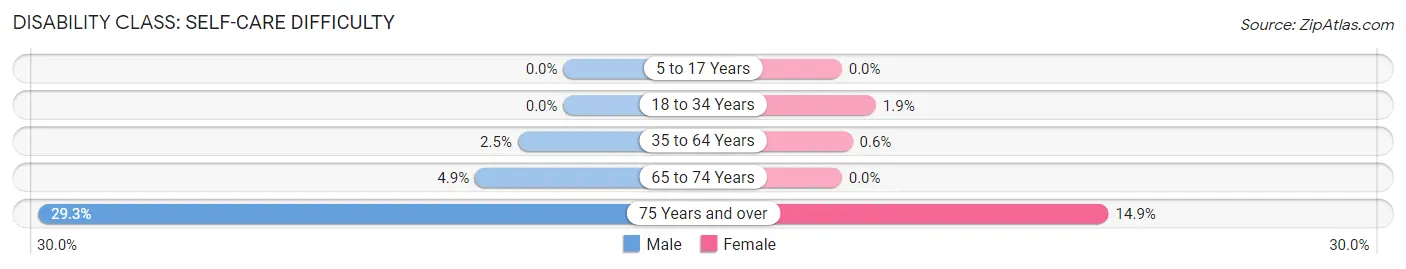
| Age Bracket | Male | Female |
| 5 to 17 Years | 0 (0.0%) | 0 (0.0%) |
| 18 to 34 Years | 0 (0.0%) | 18 (1.9%) |
| 35 to 64 Years | 39 (2.5%) | 10 (0.6%) |
| 65 to 74 Years | 26 (4.9%) | 0 (0.0%) |
| 75 Years and over | 98 (29.2%) | 93 (14.9%) |
Technology Access in Aiea
Computing Device Access in Aiea
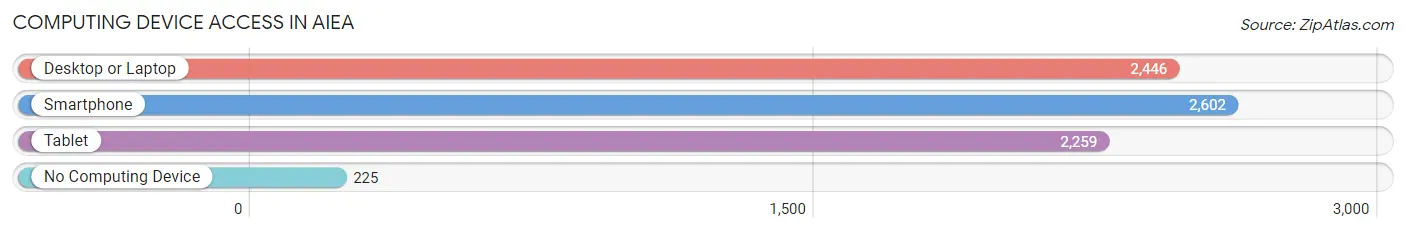
| Device Type | # Households | % Households |
| Desktop or Laptop | 2,446 | 82.5% |
| Smartphone | 2,602 | 87.8% |
| Tablet | 2,259 | 76.2% |
| No Computing Device | 225 | 7.6% |
| Total | 2,965 | 100.0% |
Internet Access in Aiea
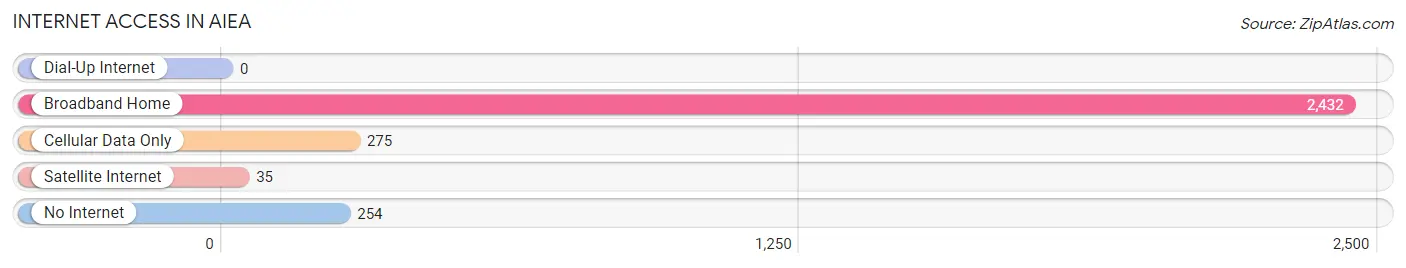
| Internet Type | # Households | % Households |
| Dial-Up Internet | 0 | 0.0% |
| Broadband Home | 2,432 | 82.0% |
| Cellular Data Only | 275 | 9.3% |
| Satellite Internet | 35 | 1.2% |
| No Internet | 254 | 8.6% |
| Total | 2,965 | 100.0% |
Aiea Summary
Aiea is a census-designated place (CDP) located in the City and County of Honolulu, Hawaii, United States. It is located in the central part of the island of Oahu, approximately 12 miles (19 km) west of downtown Honolulu. As of the 2010 Census, the CDP had a total population of 9,338.
Geography
Aiea is located at 21°23'35" North, 157°56'17" West (21.393, -157.938). It is bordered by Pearl City to the east, Halawa to the west, and Pearl Harbor to the south. The total area of Aiea is 2.7 square miles (7.0 km2), all land.
The area is made up of two distinct volcanic cones, Puʻuloa and Kamaile. The highest point in Aiea is Puʻuloa at 945 feet (288 m). The climate is tropical and warm year-round.
Economy
Aiea is home to several major businesses, including the Pearlridge Shopping Center, the largest shopping center in Hawaii. Other major employers include the U.S. Navy, the University of Hawaii, and the Hawaii State Department of Education.
The median household income in Aiea is $63,845, and the median family income is $71,945. The unemployment rate is 4.2%.
Demographics
As of the 2010 Census, there were 9,338 people, 3,717 households, and 2,541 families residing in Aiea. The population density was 3,457.3 people per square mile (1,339.2/km2). There were 3,945 housing units at an average density of 1,461.3 per square mile (564.7/km2). The racial makeup of Aiea was 44.2% White, 8.3% African American, 0.3% Native American, 24.7% Asian, 8.2% Pacific Islander, 0.7% from other races, and 13.4% from two or more races. Hispanic or Latino of any race were 8.2% of the population.
There were 3,717 households, out of which 33.2% had children under the age of 18 living with them, 51.2% were married couples living together, 12.7% had a female householder with no husband present, and 30.7% were non-families. 24.2% of all households were made up of individuals, and 8.2% had someone living alone who was 65 years of age or older. The average household size was 2.50 and the average family size was 2.99.
In Aiea, the population was spread out, with 24.2% under the age of 18, 8.2% from 18 to 24, 28.2% from 25 to 44, 25.2% from 45 to 64, and 14.2% who were 65 years of age or older. The median age was 38 years. For every 100 females, there were 94.7 males. For every 100 females age 18 and over, there were 92.2 males.
The median income for a household in Aiea was $63,845, and the median income for a family was $71,945. Males had a median income of $45,945 versus $35,945 for females. The per capita income for the CDP was $27,945. About 4.2% of families and 6.2% of the population were below the poverty line, including 7.2% of those under age 18 and 5.2% of those age 65 or over.
Common Questions
What is the Total Population of Aiea?
Total Population of Aiea is 9,571.
What is the Total Male Population of Aiea?
Total Male Population of Aiea is 4,742.
What is the Total Female Population of Aiea?
Total Female Population of Aiea is 4,829.
What is the Ratio of Males per 100 Females in Aiea?
There are 98.20 Males per 100 Females in Aiea.
What is the Ratio of Females per 100 Males in Aiea?
There are 101.83 Females per 100 Males in Aiea.
What is the Median Population Age in Aiea?
Median Population Age in Aiea is 41.3 Years.
What is the Average Family Size in Aiea
Average Family Size in Aiea is 3.8 People.
What is the Average Household Size in Aiea
Average Household Size in Aiea is 3.2 People.
What is Per Capita Income in Aiea?
Per Capita income in Aiea is $47,612.
What is the Median Family Income in Aiea?
Median Family Income in Aiea is $149,565.
What is the Median Household income in Aiea?
Median Household Income in Aiea is $130,507.
What is Income or Wage Gap in Aiea?
Income or Wage Gap in Aiea is 22.4%.
Women in Aiea earn 77.6 cents for every dollar earned by a man.
What is Inequality or Gini Index in Aiea?
Inequality or Gini Index in Aiea is 0.40.
How Large is the Labor Force in Aiea?
There are 4,873 People in the Labor Forcein in Aiea.
What is the Percentage of People in the Labor Force in Aiea?
62.9% of People are in the Labor Force in Aiea.
What is the Unemployment Rate in Aiea?
Unemployment Rate in Aiea is 4.6%.