Cities with the Highest Percentage of Self-Employed / Incorporated in Georgia
RELATED REPORTS & OPTIONS
Self-Employed / Incorporated
Georgia
Compare Cities
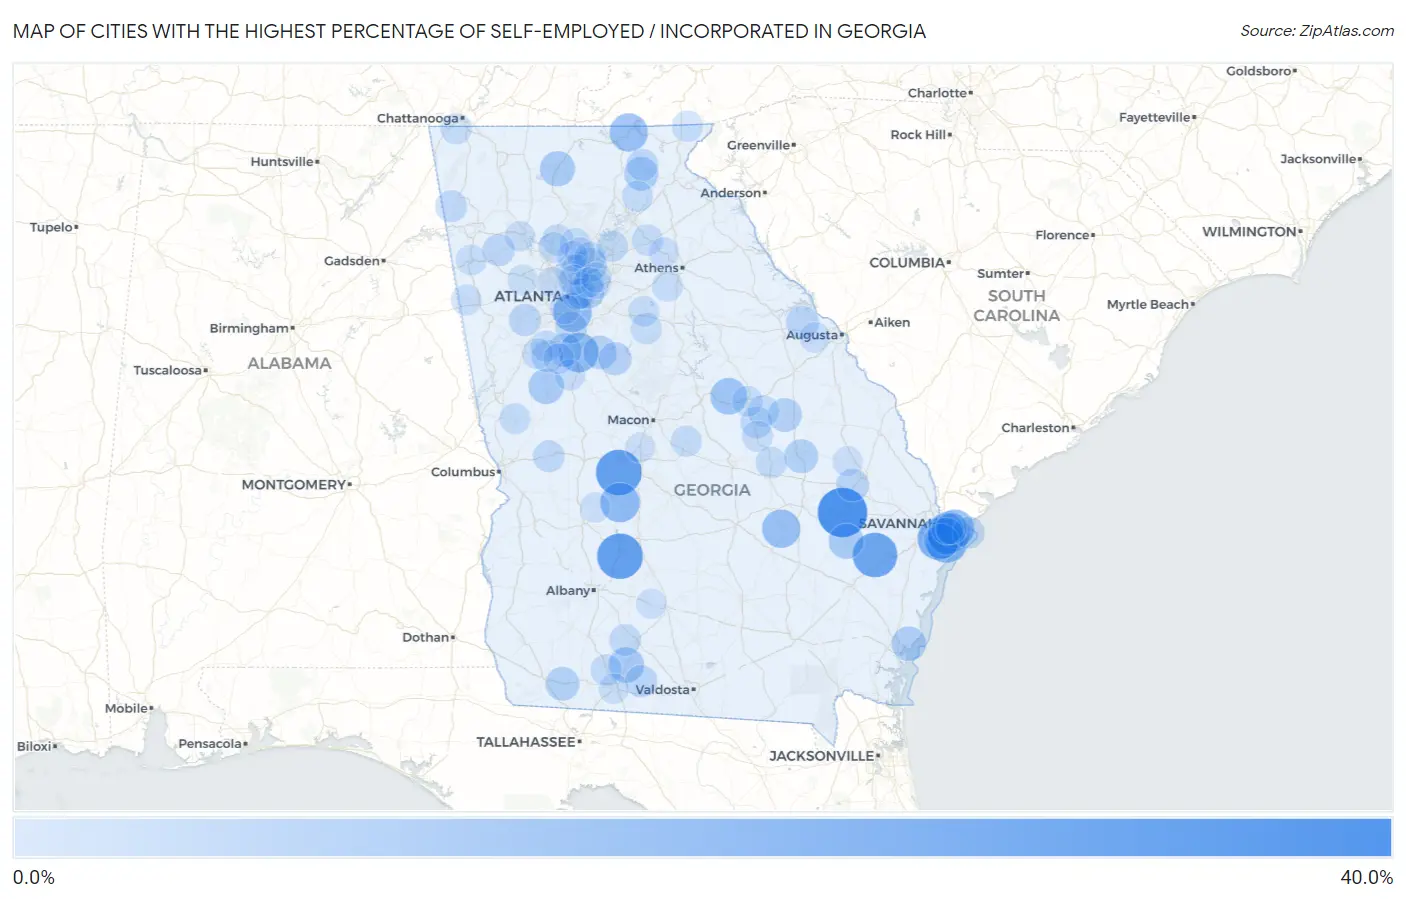
Map of Cities with the Highest Percentage of Self-Employed / Incorporated in Georgia
0.0%
40.0%
Cities with the Highest Percentage of Self-Employed / Incorporated in Georgia
| City | % Self-Employed / Incorporated | vs State | vs National | |
| 1. | Bellville | 36.3% | 4.4%(+31.9)#1 | 3.8%(+32.5)#185 |
| 2. | West Brow | 31.2% | 4.4%(+26.8)#2 | 3.8%(+27.4)#236 |
| 3. | Warwick | 30.0% | 4.4%(+25.7)#3 | 3.8%(+26.2)#249 |
| 4. | Marshallville | 29.9% | 4.4%(+25.6)#4 | 3.8%(+26.1)#259 |
| 5. | Gumbranch | 28.4% | 4.4%(+24.0)#5 | 3.8%(+24.5)#291 |
| 6. | Vernonburg | 24.4% | 4.4%(+20.1)#6 | 3.8%(+20.6)#403 |
| 7. | Dutch Island | 24.0% | 4.4%(+19.6)#7 | 3.8%(+20.2)#415 |
| 8. | Skidaway Island | 21.7% | 4.4%(+17.3)#8 | 3.8%(+17.9)#510 |
| 9. | Sunny Side | 20.3% | 4.4%(+15.9)#9 | 3.8%(+16.5)#595 |
| 10. | Dooling | 20.0% | 4.4%(+15.6)#10 | 3.8%(+16.2)#625 |
| 11. | Antioch | 19.1% | 4.4%(+14.8)#11 | 3.8%(+15.3)#685 |
| 12. | Conley | 19.0% | 4.4%(+14.6)#12 | 3.8%(+15.1)#703 |
| 13. | Talahi Island | 18.5% | 4.4%(+14.1)#13 | 3.8%(+14.7)#745 |
| 14. | Uvalda | 18.2% | 4.4%(+13.8)#14 | 3.8%(+14.4)#769 |
| 15. | Young Harris | 18.0% | 4.4%(+13.6)#15 | 3.8%(+14.2)#787 |
| 16. | Isle Of Hope | 16.2% | 4.4%(+11.8)#16 | 3.8%(+12.4)#929 |
| 17. | Deepstep | 15.8% | 4.4%(+11.4)#17 | 3.8%(+12.0)#970 |
| 18. | Crescent | 15.7% | 4.4%(+11.4)#18 | 3.8%(+11.9)#980 |
| 19. | Coolidge | 13.8% | 4.4%(+9.46)#19 | 3.8%(+10.0)#1,261 |
| 20. | Gay | 13.6% | 4.4%(+9.20)#20 | 3.8%(+9.76)#1,308 |
| 21. | Glennville | 13.3% | 4.4%(+8.96)#21 | 3.8%(+9.52)#1,350 |
| 22. | Montgomery | 13.3% | 4.4%(+8.89)#22 | 3.8%(+9.45)#1,370 |
| 23. | Ellijay | 13.2% | 4.4%(+8.85)#23 | 3.8%(+9.41)#1,377 |
| 24. | Pine Lake | 12.4% | 4.4%(+8.05)#24 | 3.8%(+8.61)#1,554 |
| 25. | St Simons | 12.4% | 4.4%(+8.03)#25 | 3.8%(+8.59)#1,555 |
| 26. | Milstead | 12.0% | 4.4%(+7.61)#26 | 3.8%(+8.17)#1,662 |
| 27. | Yonah | 11.6% | 4.4%(+7.19)#27 | 3.8%(+7.75)#1,776 |
| 28. | Berkeley Lake | 11.5% | 4.4%(+7.15)#28 | 3.8%(+7.71)#1,792 |
| 29. | Swainsboro | 11.3% | 4.4%(+6.96)#29 | 3.8%(+7.52)#1,843 |
| 30. | Climax | 11.3% | 4.4%(+6.91)#30 | 3.8%(+7.47)#1,850 |
| 31. | Bartow | 11.0% | 4.4%(+6.65)#31 | 3.8%(+7.21)#1,931 |
| 32. | Locust Grove | 11.0% | 4.4%(+6.59)#32 | 3.8%(+7.15)#1,946 |
| 33. | Woolsey | 10.5% | 4.4%(+6.15)#33 | 3.8%(+6.71)#2,086 |
| 34. | Jackson | 10.1% | 4.4%(+5.70)#34 | 3.8%(+6.26)#2,242 |
| 35. | Appling | 10.0% | 4.4%(+5.62)#35 | 3.8%(+6.18)#2,273 |
| 36. | Register | 9.7% | 4.4%(+5.30)#36 | 3.8%(+5.86)#2,414 |
| 37. | New England | 9.4% | 4.4%(+5.00)#37 | 3.8%(+5.56)#2,528 |
| 38. | Barwick | 9.0% | 4.4%(+4.62)#38 | 3.8%(+5.18)#2,711 |
| 39. | Chattahoochee Hills | 8.9% | 4.4%(+4.56)#39 | 3.8%(+5.12)#2,748 |
| 40. | Taylorsville | 8.7% | 4.4%(+4.32)#40 | 3.8%(+4.88)#2,877 |
| 41. | Senoia | 8.6% | 4.4%(+4.21)#41 | 3.8%(+4.77)#2,931 |
| 42. | Tybee Island | 8.6% | 4.4%(+4.20)#42 | 3.8%(+4.76)#2,933 |
| 43. | Decatur | 8.5% | 4.4%(+4.10)#43 | 3.8%(+4.66)#3,008 |
| 44. | Sterling | 8.4% | 4.4%(+4.03)#44 | 3.8%(+4.59)#3,048 |
| 45. | Geneva | 8.3% | 4.4%(+3.96)#45 | 3.8%(+4.52)#3,103 |
| 46. | Helen | 8.3% | 4.4%(+3.92)#46 | 3.8%(+4.48)#3,126 |
| 47. | Rock Spring | 8.3% | 4.4%(+3.90)#47 | 3.8%(+4.46)#3,133 |
| 48. | Lyerly | 8.2% | 4.4%(+3.84)#48 | 3.8%(+4.40)#3,190 |
| 49. | Jonesboro | 8.2% | 4.4%(+3.80)#49 | 3.8%(+4.36)#3,222 |
| 50. | Harrison | 8.0% | 4.4%(+3.66)#50 | 3.8%(+4.22)#3,317 |
| 51. | Funston | 8.0% | 4.4%(+3.61)#51 | 3.8%(+4.17)#3,351 |
| 52. | Thunderbolt | 7.9% | 4.4%(+3.57)#52 | 3.8%(+4.13)#3,381 |
| 53. | Jekyll Island | 7.8% | 4.4%(+3.44)#53 | 3.8%(+4.00)#3,469 |
| 54. | Adrian | 7.8% | 4.4%(+3.39)#54 | 3.8%(+3.95)#3,517 |
| 55. | Riddleville | 7.6% | 4.4%(+3.20)#55 | 3.8%(+3.76)#3,683 |
| 56. | Ochlocknee | 7.5% | 4.4%(+3.11)#56 | 3.8%(+3.67)#3,743 |
| 57. | Holly Springs | 7.5% | 4.4%(+3.09)#57 | 3.8%(+3.65)#3,760 |
| 58. | Newborn | 7.4% | 4.4%(+3.05)#58 | 3.8%(+3.61)#3,790 |
| 59. | Pendergrass | 7.4% | 4.4%(+3.03)#59 | 3.8%(+3.59)#3,804 |
| 60. | Milton | 7.4% | 4.4%(+3.01)#60 | 3.8%(+3.57)#3,832 |
| 61. | Sandy Springs | 7.4% | 4.4%(+3.01)#61 | 3.8%(+3.57)#3,834 |
| 62. | Jeffersonville | 7.4% | 4.4%(+3.00)#62 | 3.8%(+3.56)#3,836 |
| 63. | Johns Creek | 7.4% | 4.4%(+3.00)#63 | 3.8%(+3.56)#3,838 |
| 64. | Buford | 7.3% | 4.4%(+2.96)#64 | 3.8%(+3.52)#3,866 |
| 65. | Lookout Mountain | 7.3% | 4.4%(+2.93)#65 | 3.8%(+3.48)#3,906 |
| 66. | Sky Valley | 7.2% | 4.4%(+2.84)#66 | 3.8%(+3.40)#3,986 |
| 67. | Pine Mountain | 7.1% | 4.4%(+2.73)#67 | 3.8%(+3.29)#4,083 |
| 68. | Clermont | 7.1% | 4.4%(+2.69)#68 | 3.8%(+3.25)#4,114 |
| 69. | Peachtree City | 7.0% | 4.4%(+2.67)#69 | 3.8%(+3.23)#4,126 |
| 70. | Whitemarsh Island | 7.0% | 4.4%(+2.65)#70 | 3.8%(+3.21)#4,149 |
| 71. | Wrightsville | 7.0% | 4.4%(+2.59)#71 | 3.8%(+3.15)#4,206 |
| 72. | Social Circle | 6.8% | 4.4%(+2.37)#72 | 3.8%(+2.93)#4,437 |
| 73. | Sandersville | 6.7% | 4.4%(+2.37)#73 | 3.8%(+2.93)#4,442 |
| 74. | Tallapoosa | 6.7% | 4.4%(+2.33)#74 | 3.8%(+2.89)#4,480 |
| 75. | Williamson | 6.7% | 4.4%(+2.33)#75 | 3.8%(+2.89)#4,491 |
| 76. | Sharpsburg | 6.7% | 4.4%(+2.29)#76 | 3.8%(+2.85)#4,517 |
| 77. | Avondale Estates | 6.5% | 4.4%(+2.16)#77 | 3.8%(+2.72)#4,657 |
| 78. | North High Shoals | 6.5% | 4.4%(+2.16)#78 | 3.8%(+2.72)#4,664 |
| 79. | Cedartown | 6.5% | 4.4%(+2.12)#79 | 3.8%(+2.68)#4,702 |
| 80. | Dunwoody | 6.5% | 4.4%(+2.09)#80 | 3.8%(+2.65)#4,723 |
| 81. | Roswell | 6.4% | 4.4%(+2.05)#81 | 3.8%(+2.61)#4,761 |
| 82. | Alpharetta | 6.4% | 4.4%(+2.02)#82 | 3.8%(+2.58)#4,793 |
| 83. | Brooks | 6.4% | 4.4%(+2.00)#83 | 3.8%(+2.56)#4,811 |
| 84. | Hapeville | 6.4% | 4.4%(+1.99)#84 | 3.8%(+2.55)#4,817 |
| 85. | Woodstock | 6.4% | 4.4%(+1.98)#85 | 3.8%(+2.54)#4,823 |
| 86. | Brookhaven | 6.3% | 4.4%(+1.91)#86 | 3.8%(+2.47)#4,914 |
| 87. | Grovetown | 6.3% | 4.4%(+1.88)#87 | 3.8%(+2.44)#4,948 |
| 88. | Hiram | 6.1% | 4.4%(+1.77)#88 | 3.8%(+2.32)#5,096 |
| 89. | Arcade | 6.1% | 4.4%(+1.69)#89 | 3.8%(+2.25)#5,197 |
| 90. | Cartersville | 6.0% | 4.4%(+1.63)#90 | 3.8%(+2.18)#5,286 |
| 91. | Thomasville | 6.0% | 4.4%(+1.60)#91 | 3.8%(+2.16)#5,315 |
| 92. | Smyrna | 6.0% | 4.4%(+1.60)#92 | 3.8%(+2.16)#5,324 |
| 93. | Andersonville | 6.0% | 4.4%(+1.58)#93 | 3.8%(+2.14)#5,363 |
| 94. | Mountain Park | 5.9% | 4.4%(+1.54)#94 | 3.8%(+2.10)#5,411 |
| 95. | Ty Ty | 5.8% | 4.4%(+1.44)#95 | 3.8%(+2.00)#5,523 |
| 96. | Tucker | 5.8% | 4.4%(+1.44)#96 | 3.8%(+2.00)#5,535 |
| 97. | Waverly | 5.8% | 4.4%(+1.41)#97 | 3.8%(+1.97)#5,578 |
| 98. | Portal | 5.8% | 4.4%(+1.40)#98 | 3.8%(+1.96)#5,583 |
| 99. | Lilburn | 5.8% | 4.4%(+1.39)#99 | 3.8%(+1.95)#5,610 |
| 100. | Byron | 5.7% | 4.4%(+1.32)#100 | 3.8%(+1.88)#5,698 |
Common Questions
What are the Top 10 Cities with the Highest Percentage of Self-Employed / Incorporated in Georgia?
Top 10 Cities with the Highest Percentage of Self-Employed / Incorporated in Georgia are:
#1
36.3%
#2
30.0%
#3
29.9%
#4
28.4%
#5
24.4%
#6
24.0%
#7
21.7%
#8
20.3%
#9
20.0%
#10
19.0%
What city has the Highest Percentage of Self-Employed / Incorporated in Georgia?
Bellville has the Highest Percentage of Self-Employed / Incorporated in Georgia with 36.3%.
What is the Percentage of Self-Employed / Incorporated in the State of Georgia?
Percentage of Self-Employed / Incorporated in Georgia is 4.4%.
What is the Percentage of Self-Employed / Incorporated in the United States?
Percentage of Self-Employed / Incorporated in the United States is 3.8%.