Cities with the Highest Percentage of Population Employed in Arts, Entertainment & Recreation in Georgia
RELATED REPORTS & OPTIONS
Arts, Entertainment & Recreation
Georgia
Compare Cities
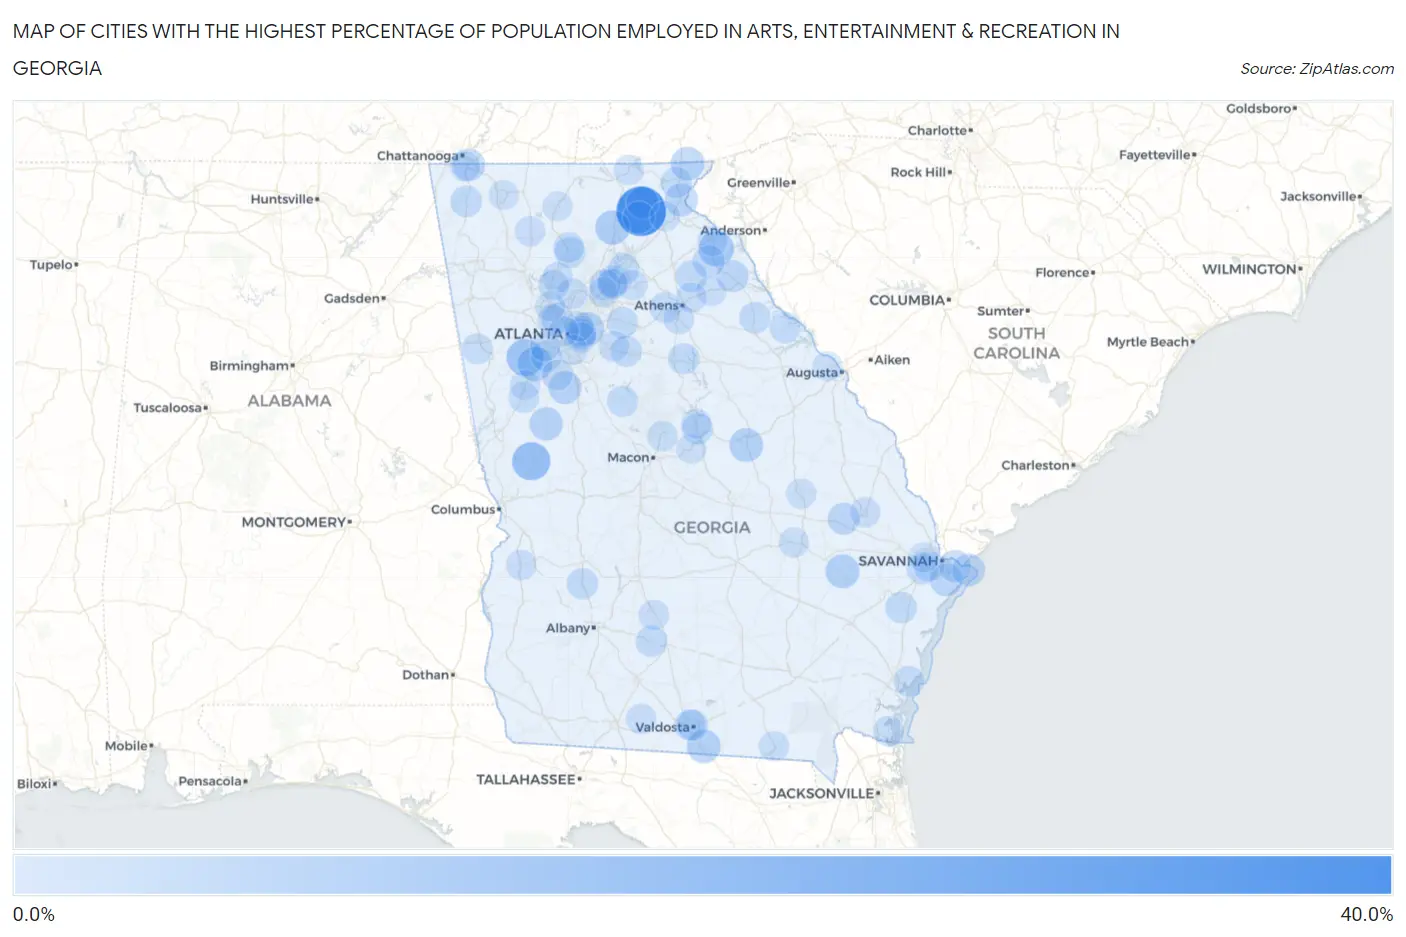
Map of Cities with the Highest Percentage of Population Employed in Arts, Entertainment & Recreation in Georgia
0.0%
40.0%
Cities with the Highest Percentage of Population Employed in Arts, Entertainment & Recreation in Georgia
| City | % Employed | vs State | vs National | |
| 1. | Yonah | 35.6% | 1.6%(+34.0)#1 | 2.1%(+33.5)#92 |
| 2. | Waverly | 16.5% | 1.6%(+14.9)#2 | 2.1%(+14.4)#387 |
| 3. | Shiloh | 15.5% | 1.6%(+13.9)#3 | 2.1%(+13.4)#436 |
| 4. | Chattahoochee Hills | 13.7% | 1.6%(+12.1)#4 | 2.1%(+11.6)#548 |
| 5. | Bolingbroke | 12.3% | 1.6%(+10.7)#5 | 2.1%(+10.2)#646 |
| 6. | Bowersville | 10.8% | 1.6%(+9.15)#6 | 2.1%(+8.69)#795 |
| 7. | Palmetto | 9.6% | 1.6%(+7.98)#7 | 2.1%(+7.52)#986 |
| 8. | Dahlonega | 9.4% | 1.6%(+7.83)#8 | 2.1%(+7.36)#1,007 |
| 9. | Warthen | 8.7% | 1.6%(+7.08)#9 | 2.1%(+6.61)#1,130 |
| 10. | Mendes | 8.6% | 1.6%(+6.95)#10 | 2.1%(+6.49)#1,165 |
| 11. | Lake Park | 8.3% | 1.6%(+6.66)#11 | 2.1%(+6.19)#1,230 |
| 12. | Tennille | 8.3% | 1.6%(+6.65)#12 | 2.1%(+6.19)#1,234 |
| 13. | Sky Valley | 7.9% | 1.6%(+6.26)#13 | 2.1%(+5.79)#1,328 |
| 14. | Pine Lake | 7.8% | 1.6%(+6.15)#14 | 2.1%(+5.69)#1,361 |
| 15. | Gay | 7.4% | 1.6%(+5.79)#15 | 2.1%(+5.32)#1,485 |
| 16. | Woolsey | 7.1% | 1.6%(+5.45)#16 | 2.1%(+4.99)#1,571 |
| 17. | Tallulah Falls | 6.8% | 1.6%(+5.16)#17 | 2.1%(+4.70)#1,662 |
| 18. | Skidaway Island | 6.4% | 1.6%(+4.76)#18 | 2.1%(+4.30)#1,821 |
| 19. | Tybee Island | 6.4% | 1.6%(+4.75)#19 | 2.1%(+4.29)#1,829 |
| 20. | Lakeview | 6.3% | 1.6%(+4.65)#20 | 2.1%(+4.18)#1,870 |
| 21. | Talahi Island | 5.7% | 1.6%(+4.13)#21 | 2.1%(+3.66)#2,122 |
| 22. | Helen | 5.7% | 1.6%(+4.06)#22 | 2.1%(+3.59)#2,156 |
| 23. | Cleveland | 5.6% | 1.6%(+3.94)#23 | 2.1%(+3.48)#2,228 |
| 24. | Dewy Rose | 5.5% | 1.6%(+3.83)#24 | 2.1%(+3.37)#2,289 |
| 25. | Pulaski | 5.4% | 1.6%(+3.81)#25 | 2.1%(+3.35)#2,308 |
| 26. | Franklin Springs | 5.3% | 1.6%(+3.68)#26 | 2.1%(+3.21)#2,384 |
| 27. | Fairplay | 5.1% | 1.6%(+3.47)#27 | 2.1%(+3.00)#2,535 |
| 28. | Henderson | 4.7% | 1.6%(+3.06)#28 | 2.1%(+2.60)#2,845 |
| 29. | Vinings | 4.7% | 1.6%(+3.04)#29 | 2.1%(+2.57)#2,858 |
| 30. | Lafayette | 4.6% | 1.6%(+3.00)#30 | 2.1%(+2.54)#2,890 |
| 31. | Ty Ty | 4.6% | 1.6%(+2.94)#31 | 2.1%(+2.48)#2,958 |
| 32. | Riceboro | 4.5% | 1.6%(+2.93)#32 | 2.1%(+2.46)#2,974 |
| 33. | Tignall | 4.5% | 1.6%(+2.88)#33 | 2.1%(+2.42)#3,032 |
| 34. | Ila | 4.4% | 1.6%(+2.82)#34 | 2.1%(+2.36)#3,100 |
| 35. | Buckhead | 4.4% | 1.6%(+2.78)#35 | 2.1%(+2.31)#3,158 |
| 36. | Rest Haven | 4.3% | 1.6%(+2.73)#36 | 2.1%(+2.27)#3,218 |
| 37. | Ball Ground | 4.3% | 1.6%(+2.72)#37 | 2.1%(+2.26)#3,219 |
| 38. | Smithville | 4.3% | 1.6%(+2.67)#38 | 2.1%(+2.20)#3,289 |
| 39. | Loganville | 4.2% | 1.6%(+2.61)#39 | 2.1%(+2.15)#3,347 |
| 40. | Hardwick | 4.2% | 1.6%(+2.59)#40 | 2.1%(+2.13)#3,365 |
| 41. | Oakwood | 4.1% | 1.6%(+2.43)#41 | 2.1%(+1.97)#3,575 |
| 42. | Remerton | 4.0% | 1.6%(+2.38)#42 | 2.1%(+1.92)#3,626 |
| 43. | Lincolnton | 4.0% | 1.6%(+2.37)#43 | 2.1%(+1.91)#3,644 |
| 44. | Sugar Hill | 3.9% | 1.6%(+2.32)#44 | 2.1%(+1.86)#3,714 |
| 45. | Oxford | 3.9% | 1.6%(+2.31)#45 | 2.1%(+1.85)#3,721 |
| 46. | Tiger | 3.9% | 1.6%(+2.31)#46 | 2.1%(+1.85)#3,722 |
| 47. | Avondale Estates | 3.9% | 1.6%(+2.27)#47 | 2.1%(+1.81)#3,769 |
| 48. | Flovilla | 3.9% | 1.6%(+2.26)#48 | 2.1%(+1.80)#3,785 |
| 49. | Valdosta | 3.9% | 1.6%(+2.23)#49 | 2.1%(+1.77)#3,816 |
| 50. | Kennesaw State University | 3.8% | 1.6%(+2.21)#50 | 2.1%(+1.74)#3,862 |
| 51. | Union City | 3.8% | 1.6%(+2.19)#51 | 2.1%(+1.73)#3,884 |
| 52. | St Simons | 3.7% | 1.6%(+2.06)#52 | 2.1%(+1.60)#4,106 |
| 53. | Moreland | 3.6% | 1.6%(+1.97)#53 | 2.1%(+1.50)#4,238 |
| 54. | Smarr | 3.6% | 1.6%(+1.93)#54 | 2.1%(+1.47)#4,302 |
| 55. | Bogart | 3.5% | 1.6%(+1.92)#55 | 2.1%(+1.46)#4,312 |
| 56. | Mount Zion | 3.5% | 1.6%(+1.91)#56 | 2.1%(+1.44)#4,348 |
| 57. | Roswell | 3.5% | 1.6%(+1.86)#57 | 2.1%(+1.40)#4,419 |
| 58. | Watkinsville | 3.4% | 1.6%(+1.74)#58 | 2.1%(+1.28)#4,669 |
| 59. | Fayetteville | 3.3% | 1.6%(+1.71)#59 | 2.1%(+1.25)#4,729 |
| 60. | Nelson | 3.3% | 1.6%(+1.68)#60 | 2.1%(+1.22)#4,783 |
| 61. | Kings Bay Base | 3.3% | 1.6%(+1.63)#61 | 2.1%(+1.17)#4,868 |
| 62. | Hull | 3.1% | 1.6%(+1.50)#62 | 2.1%(+1.04)#5,122 |
| 63. | Belvedere Park | 3.1% | 1.6%(+1.50)#63 | 2.1%(+1.03)#5,140 |
| 64. | Suwanee | 3.1% | 1.6%(+1.49)#64 | 2.1%(+1.03)#5,150 |
| 65. | Rossville | 3.1% | 1.6%(+1.48)#65 | 2.1%(+1.02)#5,184 |
| 66. | Conyers | 3.1% | 1.6%(+1.46)#66 | 2.1%(+1.000)#5,222 |
| 67. | Holly Springs | 3.1% | 1.6%(+1.44)#67 | 2.1%(+0.974)#5,277 |
| 68. | Barwick | 3.0% | 1.6%(+1.38)#68 | 2.1%(+0.917)#5,389 |
| 69. | Braselton | 3.0% | 1.6%(+1.34)#69 | 2.1%(+0.882)#5,474 |
| 70. | Savannah | 3.0% | 1.6%(+1.34)#70 | 2.1%(+0.880)#5,478 |
| 71. | Woodstock | 2.9% | 1.6%(+1.31)#71 | 2.1%(+0.852)#5,545 |
| 72. | Buford | 2.9% | 1.6%(+1.29)#72 | 2.1%(+0.832)#5,593 |
| 73. | Ranger | 2.9% | 1.6%(+1.24)#73 | 2.1%(+0.775)#5,760 |
| 74. | Statesboro | 2.8% | 1.6%(+1.22)#74 | 2.1%(+0.762)#5,790 |
| 75. | Sycamore | 2.8% | 1.6%(+1.21)#75 | 2.1%(+0.750)#5,818 |
| 76. | Smyrna | 2.8% | 1.6%(+1.19)#76 | 2.1%(+0.732)#5,871 |
| 77. | Lumpkin | 2.8% | 1.6%(+1.16)#77 | 2.1%(+0.695)#5,963 |
| 78. | Vidalia | 2.7% | 1.6%(+1.12)#78 | 2.1%(+0.660)#6,058 |
| 79. | Fargo | 2.7% | 1.6%(+1.06)#79 | 2.1%(+0.596)#6,255 |
| 80. | Cusseta Chattahoochee County Unified Government | 2.7% | 1.6%(+1.06)#80 | 2.1%(+0.595)#6,258 |
| 81. | Gray | 2.7% | 1.6%(+1.06)#81 | 2.1%(+0.594)#6,259 |
| 82. | Young Harris | 2.6% | 1.6%(+1.03)#82 | 2.1%(+0.564)#6,346 |
| 83. | Candler Mcafee | 2.6% | 1.6%(+1.00)#83 | 2.1%(+0.538)#6,431 |
| 84. | Swainsboro | 2.6% | 1.6%(+0.963)#84 | 2.1%(+0.501)#6,536 |
| 85. | Newnan | 2.6% | 1.6%(+0.962)#85 | 2.1%(+0.499)#6,541 |
| 86. | Lavonia | 2.6% | 1.6%(+0.960)#86 | 2.1%(+0.497)#6,547 |
| 87. | Clarkesville | 2.6% | 1.6%(+0.956)#87 | 2.1%(+0.493)#6,556 |
| 88. | North Decatur | 2.6% | 1.6%(+0.951)#88 | 2.1%(+0.489)#6,566 |
| 89. | Pooler | 2.6% | 1.6%(+0.943)#89 | 2.1%(+0.480)#6,599 |
| 90. | Conley | 2.6% | 1.6%(+0.934)#90 | 2.1%(+0.472)#6,626 |
| 91. | Atlanta | 2.5% | 1.6%(+0.922)#91 | 2.1%(+0.459)#6,673 |
| 92. | South Fulton | 2.5% | 1.6%(+0.918)#92 | 2.1%(+0.456)#6,684 |
| 93. | Athens-Clarke County Unified Government (Balance) | 2.5% | 1.6%(+0.883)#93 | 2.1%(+0.421)#6,809 |
| 94. | Comer | 2.5% | 1.6%(+0.880)#94 | 2.1%(+0.417)#6,819 |
| 95. | Ivey | 2.5% | 1.6%(+0.866)#95 | 2.1%(+0.404)#6,866 |
| 96. | Martinez | 2.5% | 1.6%(+0.842)#96 | 2.1%(+0.380)#6,943 |
| 97. | Milledgeville | 2.5% | 1.6%(+0.836)#97 | 2.1%(+0.373)#6,966 |
| 98. | Marietta | 2.4% | 1.6%(+0.736)#98 | 2.1%(+0.274)#7,309 |
| 99. | Dalton | 2.3% | 1.6%(+0.729)#99 | 2.1%(+0.266)#7,333 |
| 100. | Ellijay | 2.3% | 1.6%(+0.705)#100 | 2.1%(+0.243)#7,394 |
Common Questions
What are the Top 10 Cities with the Highest Percentage of Population Employed in Arts, Entertainment & Recreation in Georgia?
Top 10 Cities with the Highest Percentage of Population Employed in Arts, Entertainment & Recreation in Georgia are:
#1
35.6%
#2
15.5%
#3
13.7%
#4
10.8%
#5
9.6%
#6
9.4%
#7
8.6%
#8
8.3%
#9
8.3%
#10
7.9%
What city has the Highest Percentage of Population Employed in Arts, Entertainment & Recreation in Georgia?
Yonah has the Highest Percentage of Population Employed in Arts, Entertainment & Recreation in Georgia with 35.6%.
What is the Percentage of Population Employed in Arts, Entertainment & Recreation in the State of Georgia?
Percentage of Population Employed in Arts, Entertainment & Recreation in Georgia is 1.6%.
What is the Percentage of Population Employed in Arts, Entertainment & Recreation in the United States?
Percentage of Population Employed in Arts, Entertainment & Recreation in the United States is 2.1%.