Cities with the Highest Percentage of Population Employed in Farming, Fishing & Forestry in Georgia
RELATED REPORTS & OPTIONS
Farming, Fishing & Forestry
Georgia
Compare Cities
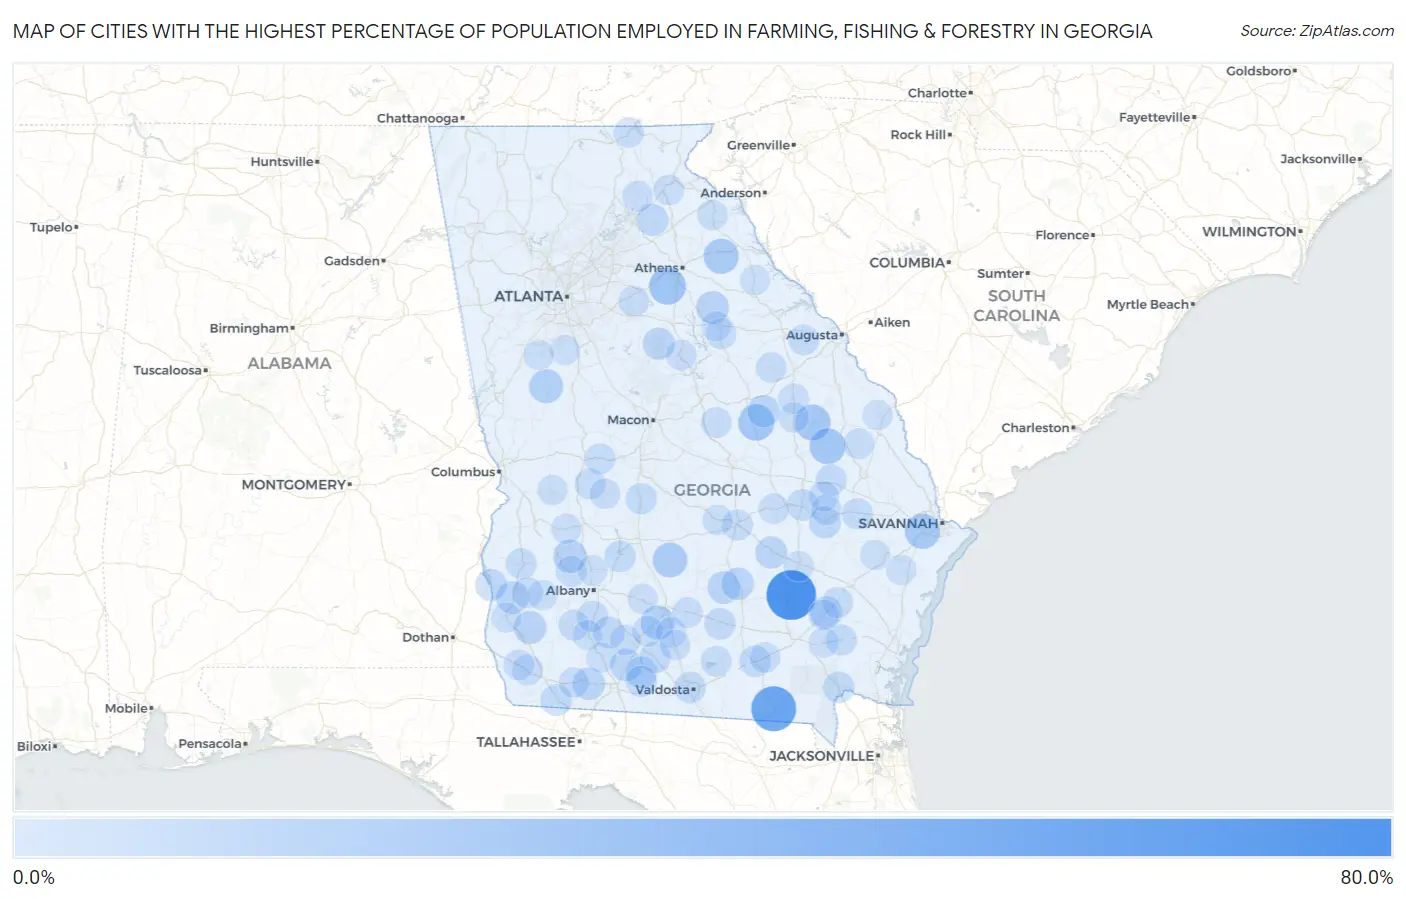
Map of Cities with the Highest Percentage of Population Employed in Farming, Fishing & Forestry in Georgia
0.0%
80.0%
Cities with the Highest Percentage of Population Employed in Farming, Fishing & Forestry in Georgia
| City | % Employed | vs State | vs National | |
| 1. | Rockingham | 67.5% | 0.45%(+67.1)#1 | 0.61%(+66.9)#35 |
| 2. | Fargo | 51.3% | 0.45%(+50.9)#2 | 0.61%(+50.7)#72 |
| 3. | North High Shoals | 23.6% | 0.45%(+23.1)#3 | 0.61%(+23.0)#349 |
| 4. | Harrison | 21.4% | 0.45%(+21.0)#4 | 0.61%(+20.8)#394 |
| 5. | Midville | 20.3% | 0.45%(+19.9)#5 | 0.61%(+19.7)#432 |
| 6. | Garfield | 20.2% | 0.45%(+19.8)#6 | 0.61%(+19.6)#438 |
| 7. | Henderson | 18.6% | 0.45%(+18.2)#7 | 0.61%(+18.0)#491 |
| 8. | Carlton | 17.9% | 0.45%(+17.5)#8 | 0.61%(+17.3)#519 |
| 9. | Rebecca | 16.9% | 0.45%(+16.4)#9 | 0.61%(+16.3)#564 |
| 10. | Omega | 14.3% | 0.45%(+13.9)#10 | 0.61%(+13.7)#678 |
| 11. | Gay | 13.6% | 0.45%(+13.1)#11 | 0.61%(+13.0)#737 |
| 12. | Bronwood | 12.1% | 0.45%(+11.7)#12 | 0.61%(+11.5)#854 |
| 13. | Damascus | 10.5% | 0.45%(+10.0)#13 | 0.61%(+9.88)#1,013 |
| 14. | Woodville | 10.3% | 0.45%(+9.81)#14 | 0.61%(+9.65)#1,040 |
| 15. | Bluffton | 9.9% | 0.45%(+9.46)#15 | 0.61%(+9.30)#1,087 |
| 16. | Ambrose | 9.6% | 0.45%(+9.12)#16 | 0.61%(+8.97)#1,135 |
| 17. | Echols County Consolidated Government | 9.5% | 0.45%(+9.02)#17 | 0.61%(+8.86)#1,155 |
| 18. | Broxton | 9.4% | 0.45%(+8.99)#18 | 0.61%(+8.84)#1,157 |
| 19. | Coolidge | 9.4% | 0.45%(+8.99)#19 | 0.61%(+8.83)#1,158 |
| 20. | Cairo | 9.4% | 0.45%(+8.99)#20 | 0.61%(+8.83)#1,159 |
| 21. | Riddleville | 9.1% | 0.45%(+8.64)#21 | 0.61%(+8.49)#1,214 |
| 22. | Shady Dale | 8.3% | 0.45%(+7.82)#22 | 0.61%(+7.67)#1,374 |
| 23. | Hazlehurst | 8.0% | 0.45%(+7.52)#23 | 0.61%(+7.36)#1,437 |
| 24. | Offerman | 7.9% | 0.45%(+7.41)#24 | 0.61%(+7.25)#1,461 |
| 25. | Gillsville | 7.5% | 0.45%(+7.01)#25 | 0.61%(+6.86)#1,550 |
| 26. | Fort Gaines | 7.2% | 0.45%(+6.77)#26 | 0.61%(+6.62)#1,610 |
| 27. | Godfrey | 7.1% | 0.45%(+6.69)#27 | 0.61%(+6.54)#1,625 |
| 28. | Sale City | 7.0% | 0.45%(+6.51)#28 | 0.61%(+6.36)#1,678 |
| 29. | Reidsville | 6.9% | 0.45%(+6.48)#29 | 0.61%(+6.32)#1,682 |
| 30. | Lyons | 6.7% | 0.45%(+6.26)#30 | 0.61%(+6.10)#1,726 |
| 31. | Pavo | 6.4% | 0.45%(+5.98)#31 | 0.61%(+5.83)#1,800 |
| 32. | Attapulgus | 6.2% | 0.45%(+5.73)#32 | 0.61%(+5.57)#1,863 |
| 33. | Willacoochee | 6.1% | 0.45%(+5.62)#33 | 0.61%(+5.47)#1,898 |
| 34. | Remerton | 6.1% | 0.45%(+5.61)#34 | 0.61%(+5.46)#1,901 |
| 35. | Homerville | 6.0% | 0.45%(+5.55)#35 | 0.61%(+5.40)#1,921 |
| 36. | Folkston | 5.9% | 0.45%(+5.49)#36 | 0.61%(+5.34)#1,941 |
| 37. | Berlin | 5.9% | 0.45%(+5.47)#37 | 0.61%(+5.31)#1,950 |
| 38. | Warwick | 5.5% | 0.45%(+5.08)#38 | 0.61%(+4.93)#2,083 |
| 39. | Unadilla | 5.2% | 0.45%(+4.78)#39 | 0.61%(+4.63)#2,213 |
| 40. | Metter | 5.1% | 0.45%(+4.69)#40 | 0.61%(+4.53)#2,250 |
| 41. | Daisy | 5.1% | 0.45%(+4.60)#41 | 0.61%(+4.44)#2,280 |
| 42. | Barwick | 5.0% | 0.45%(+4.55)#42 | 0.61%(+4.39)#2,302 |
| 43. | Nahunta | 4.8% | 0.45%(+4.35)#43 | 0.61%(+4.20)#2,394 |
| 44. | Baconton | 4.6% | 0.45%(+4.17)#44 | 0.61%(+4.02)#2,476 |
| 45. | Mcrae Helena | 4.5% | 0.45%(+4.10)#45 | 0.61%(+3.94)#2,507 |
| 46. | Screven | 4.5% | 0.45%(+4.08)#46 | 0.61%(+3.92)#2,527 |
| 47. | Sasser | 4.5% | 0.45%(+4.01)#47 | 0.61%(+3.85)#2,563 |
| 48. | Cuthbert | 4.2% | 0.45%(+3.70)#48 | 0.61%(+3.55)#2,734 |
| 49. | Lakeland | 4.1% | 0.45%(+3.64)#49 | 0.61%(+3.48)#2,767 |
| 50. | Reynolds | 3.9% | 0.45%(+3.50)#50 | 0.61%(+3.34)#2,860 |
| 51. | Edison | 3.9% | 0.45%(+3.48)#51 | 0.61%(+3.33)#2,874 |
| 52. | Newton | 3.8% | 0.45%(+3.39)#52 | 0.61%(+3.24)#2,930 |
| 53. | Ideal | 3.8% | 0.45%(+3.37)#53 | 0.61%(+3.22)#2,951 |
| 54. | White Plains | 3.8% | 0.45%(+3.36)#54 | 0.61%(+3.20)#2,959 |
| 55. | Brinson | 3.8% | 0.45%(+3.32)#55 | 0.61%(+3.17)#2,983 |
| 56. | Toomsboro | 3.8% | 0.45%(+3.30)#56 | 0.61%(+3.15)#2,994 |
| 57. | Rocky Ford | 3.7% | 0.45%(+3.21)#57 | 0.61%(+3.05)#3,069 |
| 58. | Gibson | 3.6% | 0.45%(+3.16)#58 | 0.61%(+3.01)#3,114 |
| 59. | Harlem | 3.5% | 0.45%(+3.04)#59 | 0.61%(+2.88)#3,227 |
| 60. | Collins | 3.4% | 0.45%(+2.98)#60 | 0.61%(+2.83)#3,263 |
| 61. | Louisville | 3.4% | 0.45%(+2.91)#61 | 0.61%(+2.75)#3,317 |
| 62. | Funston | 3.4% | 0.45%(+2.90)#62 | 0.61%(+2.74)#3,325 |
| 63. | Jersey | 3.3% | 0.45%(+2.88)#63 | 0.61%(+2.73)#3,338 |
| 64. | Argyle | 3.3% | 0.45%(+2.86)#64 | 0.61%(+2.70)#3,361 |
| 65. | Ailey | 3.3% | 0.45%(+2.84)#65 | 0.61%(+2.68)#3,387 |
| 66. | Mount Airy | 3.3% | 0.45%(+2.82)#66 | 0.61%(+2.66)#3,397 |
| 67. | Clermont | 3.2% | 0.45%(+2.74)#67 | 0.61%(+2.58)#3,464 |
| 68. | Eatonton | 3.2% | 0.45%(+2.72)#68 | 0.61%(+2.57)#3,482 |
| 69. | Norman Park | 3.1% | 0.45%(+2.67)#69 | 0.61%(+2.52)#3,524 |
| 70. | Webster County Unified Government | 3.1% | 0.45%(+2.67)#70 | 0.61%(+2.52)#3,533 |
| 71. | Enigma | 3.1% | 0.45%(+2.66)#71 | 0.61%(+2.51)#3,538 |
| 72. | Iron City | 3.1% | 0.45%(+2.64)#72 | 0.61%(+2.49)#3,560 |
| 73. | Lenox | 3.1% | 0.45%(+2.61)#73 | 0.61%(+2.46)#3,584 |
| 74. | Young Harris | 3.0% | 0.45%(+2.57)#74 | 0.61%(+2.42)#3,621 |
| 75. | Sparks | 2.9% | 0.45%(+2.47)#75 | 0.61%(+2.32)#3,718 |
| 76. | Patterson | 2.9% | 0.45%(+2.46)#76 | 0.61%(+2.31)#3,724 |
| 77. | Oglethorpe | 2.9% | 0.45%(+2.41)#77 | 0.61%(+2.26)#3,768 |
| 78. | Cobbtown | 2.8% | 0.45%(+2.31)#78 | 0.61%(+2.16)#3,878 |
| 79. | Chauncey | 2.7% | 0.45%(+2.29)#79 | 0.61%(+2.13)#3,913 |
| 80. | Baxley | 2.6% | 0.45%(+2.20)#80 | 0.61%(+2.04)#4,018 |
| 81. | Whigham | 2.6% | 0.45%(+2.17)#81 | 0.61%(+2.02)#4,053 |
| 82. | Berry College | 2.6% | 0.45%(+2.17)#82 | 0.61%(+2.01)#4,057 |
| 83. | Canon | 2.6% | 0.45%(+2.15)#83 | 0.61%(+2.00)#4,079 |
| 84. | Buena Vista | 2.5% | 0.45%(+2.02)#84 | 0.61%(+1.87)#4,246 |
| 85. | Blakely | 2.3% | 0.45%(+1.81)#85 | 0.61%(+1.66)#4,482 |
| 86. | Tignall | 2.3% | 0.45%(+1.80)#86 | 0.61%(+1.65)#4,501 |
| 87. | Wadley | 2.2% | 0.45%(+1.76)#87 | 0.61%(+1.61)#4,561 |
| 88. | Plains | 2.1% | 0.45%(+1.65)#88 | 0.61%(+1.50)#4,706 |
| 89. | Siloam | 2.1% | 0.45%(+1.63)#89 | 0.61%(+1.48)#4,732 |
| 90. | Gumbranch | 2.1% | 0.45%(+1.61)#90 | 0.61%(+1.46)#4,768 |
| 91. | Woolsey | 2.0% | 0.45%(+1.57)#91 | 0.61%(+1.41)#4,846 |
| 92. | Leesburg | 2.0% | 0.45%(+1.56)#92 | 0.61%(+1.41)#4,854 |
| 93. | Morgan | 2.0% | 0.45%(+1.55)#93 | 0.61%(+1.39)#4,868 |
| 94. | Riceboro | 2.0% | 0.45%(+1.54)#94 | 0.61%(+1.38)#4,892 |
| 95. | Camilla | 2.0% | 0.45%(+1.52)#95 | 0.61%(+1.37)#4,915 |
| 96. | Turin | 2.0% | 0.45%(+1.51)#96 | 0.61%(+1.36)#4,932 |
| 97. | Hoboken | 1.9% | 0.45%(+1.48)#97 | 0.61%(+1.32)#4,985 |
| 98. | Meigs | 1.9% | 0.45%(+1.46)#98 | 0.61%(+1.30)#5,014 |
| 99. | Hiltonia | 1.9% | 0.45%(+1.44)#99 | 0.61%(+1.28)#5,052 |
| 100. | Sumner | 1.8% | 0.45%(+1.38)#100 | 0.61%(+1.22)#5,142 |
Common Questions
What are the Top 10 Cities with the Highest Percentage of Population Employed in Farming, Fishing & Forestry in Georgia?
Top 10 Cities with the Highest Percentage of Population Employed in Farming, Fishing & Forestry in Georgia are:
#1
67.5%
#2
51.3%
#3
23.6%
#4
21.4%
#5
20.3%
#6
20.2%
#7
18.6%
#8
17.9%
#9
16.9%
#10
14.3%
What city has the Highest Percentage of Population Employed in Farming, Fishing & Forestry in Georgia?
Rockingham has the Highest Percentage of Population Employed in Farming, Fishing & Forestry in Georgia with 67.5%.
What is the Percentage of Population Employed in Farming, Fishing & Forestry in the State of Georgia?
Percentage of Population Employed in Farming, Fishing & Forestry in Georgia is 0.45%.
What is the Percentage of Population Employed in Farming, Fishing & Forestry in the United States?
Percentage of Population Employed in Farming, Fishing & Forestry in the United States is 0.61%.