Zellwood, FL
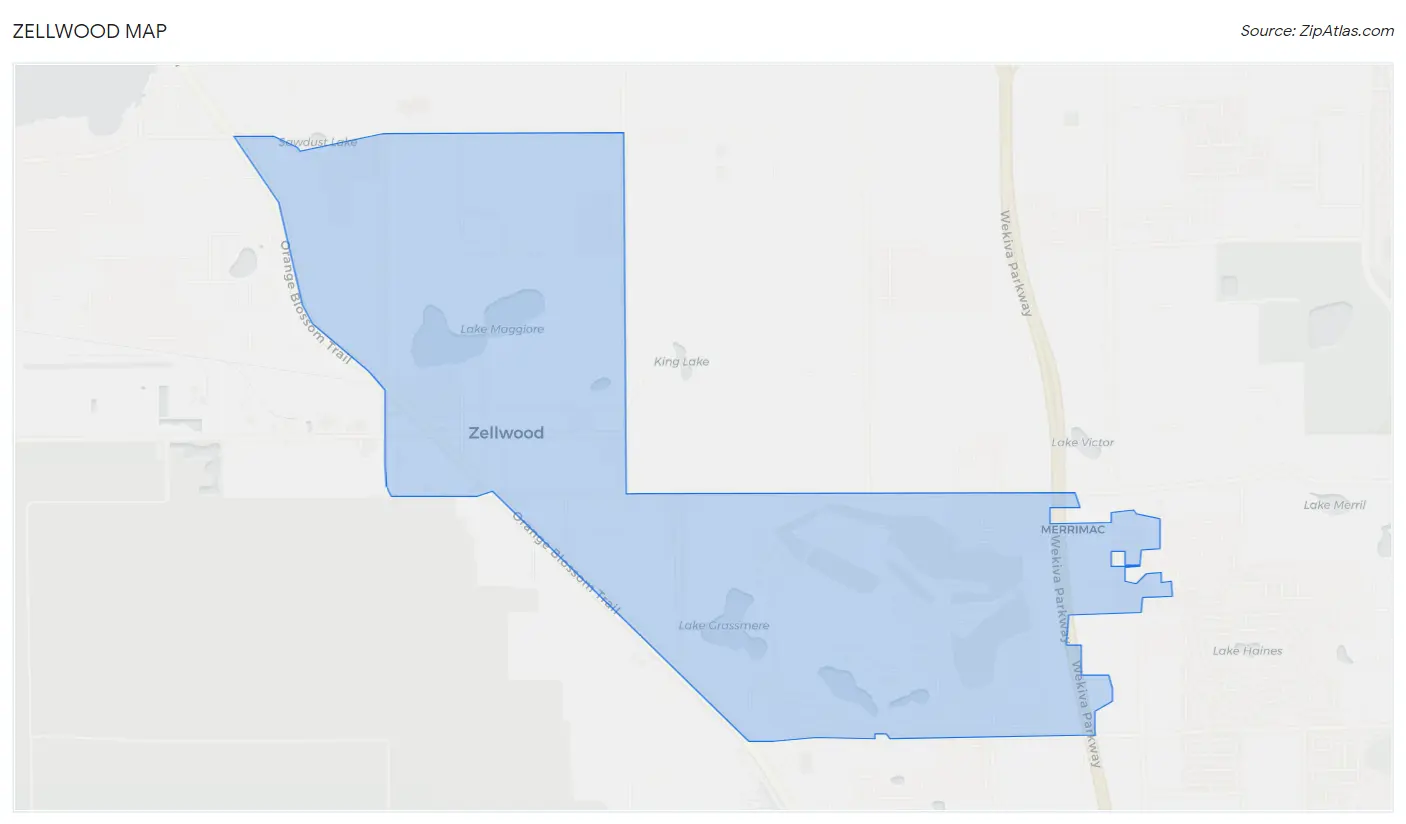
Zellwood Map
Zellwood Overview
2,850
TOTAL POPULATION
1,388
MALE POPULATION
1,462
FEMALE POPULATION
94.94
MALES / 100 FEMALES
105.33
FEMALES / 100 MALES
62.9
MEDIAN AGE
2.5
AVG FAMILY SIZE
2.0
AVG HOUSEHOLD SIZE
$38,980
PER CAPITA INCOME
$70,078
AVG FAMILY INCOME
$56,733
AVG HOUSEHOLD INCOME
45.2%
WAGE / INCOME GAP [ % ]
54.8¢/ $1
WAGE / INCOME GAP [ $ ]
0.40
INEQUALITY / GINI INDEX
1,243
LABOR FORCE [ PEOPLE ]
47.6%
PERCENT IN LABOR FORCE
0.3%
UNEMPLOYMENT RATE
Zellwood Zip Codes
Zellwood Area Codes
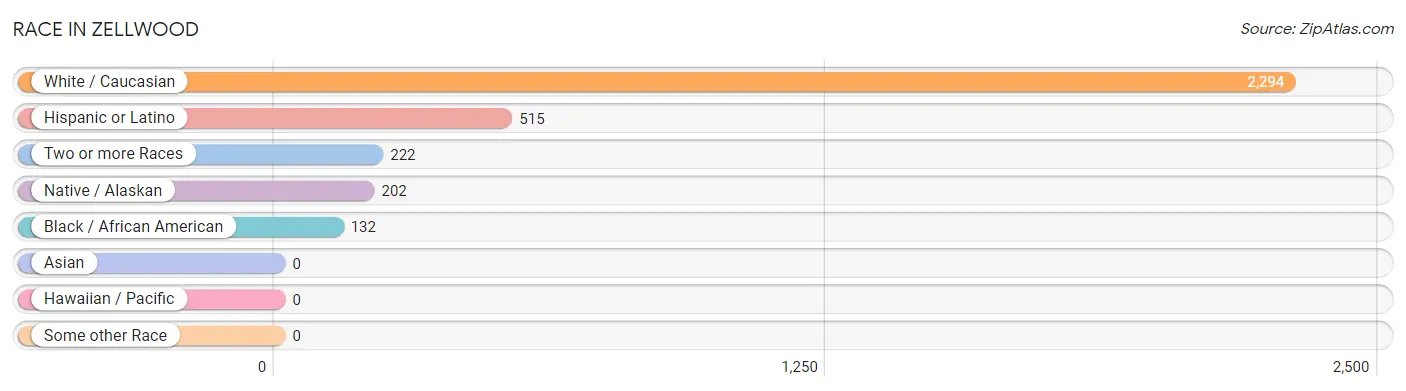
Race in Zellwood
The most populous races in Zellwood are White / Caucasian (2,294 | 80.5%), Hispanic or Latino (515 | 18.1%), and Two or more Races (222 | 7.8%).
| Race | # Population | % Population |
| Asian | 0 | 0.0% |
| Black / African American | 132 | 4.6% |
| Hawaiian / Pacific | 0 | 0.0% |
| Hispanic or Latino | 515 | 18.1% |
| Native / Alaskan | 202 | 7.1% |
| White / Caucasian | 2,294 | 80.5% |
| Two or more Races | 222 | 7.8% |
| Some other Race | 0 | 0.0% |
| Total | 2,850 | 100.0% |
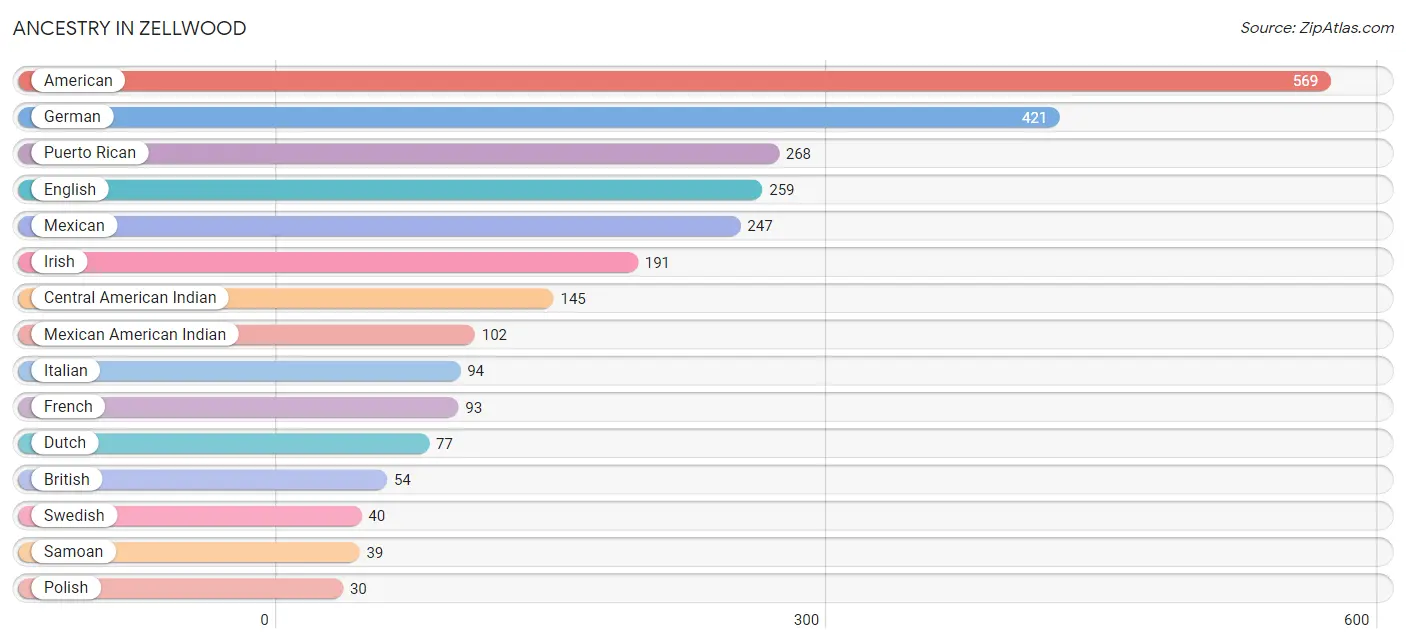
Ancestry in Zellwood
The most populous ancestries reported in Zellwood are American (569 | 20.0%), German (421 | 14.8%), Puerto Rican (268 | 9.4%), English (259 | 9.1%), and Mexican (247 | 8.7%), together accounting for 61.9% of all Zellwood residents.
| Ancestry | # Population | % Population |
| American | 569 | 20.0% |
| British | 54 | 1.9% |
| British West Indian | 16 | 0.6% |
| Central American Indian | 145 | 5.1% |
| Dutch | 77 | 2.7% |
| Eastern European | 15 | 0.5% |
| English | 259 | 9.1% |
| French | 93 | 3.3% |
| French Canadian | 15 | 0.5% |
| German | 421 | 14.8% |
| Indian (Asian) | 6 | 0.2% |
| Irish | 191 | 6.7% |
| Italian | 94 | 3.3% |
| Mexican | 247 | 8.7% |
| Mexican American Indian | 102 | 3.6% |
| Norwegian | 24 | 0.8% |
| Polish | 30 | 1.1% |
| Puerto Rican | 268 | 9.4% |
| Samoan | 39 | 1.4% |
| Scottish | 30 | 1.1% |
| Sri Lankan | 6 | 0.2% |
| Swedish | 40 | 1.4% |
| Welsh | 28 | 1.0% |
| West Indian | 19 | 0.7% | View All 24 Rows |
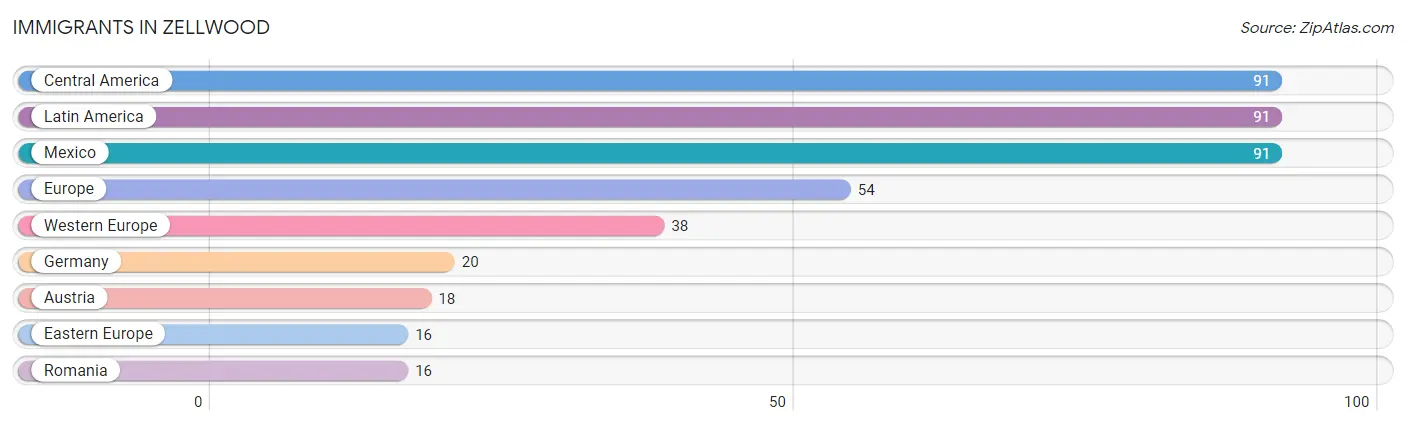
Immigrants in Zellwood
The most numerous immigrant groups reported in Zellwood came from Central America (91 | 3.2%), Latin America (91 | 3.2%), Mexico (91 | 3.2%), Europe (54 | 1.9%), and Western Europe (38 | 1.3%), together accounting for 12.8% of all Zellwood residents.
| Immigration Origin | # Population | % Population |
| Austria | 18 | 0.6% |
| Central America | 91 | 3.2% |
| Eastern Europe | 16 | 0.6% |
| Europe | 54 | 1.9% |
| Germany | 20 | 0.7% |
| Latin America | 91 | 3.2% |
| Mexico | 91 | 3.2% |
| Romania | 16 | 0.6% |
| Western Europe | 38 | 1.3% | View All 9 Rows |
Sex and Age in Zellwood
Sex and Age in Zellwood
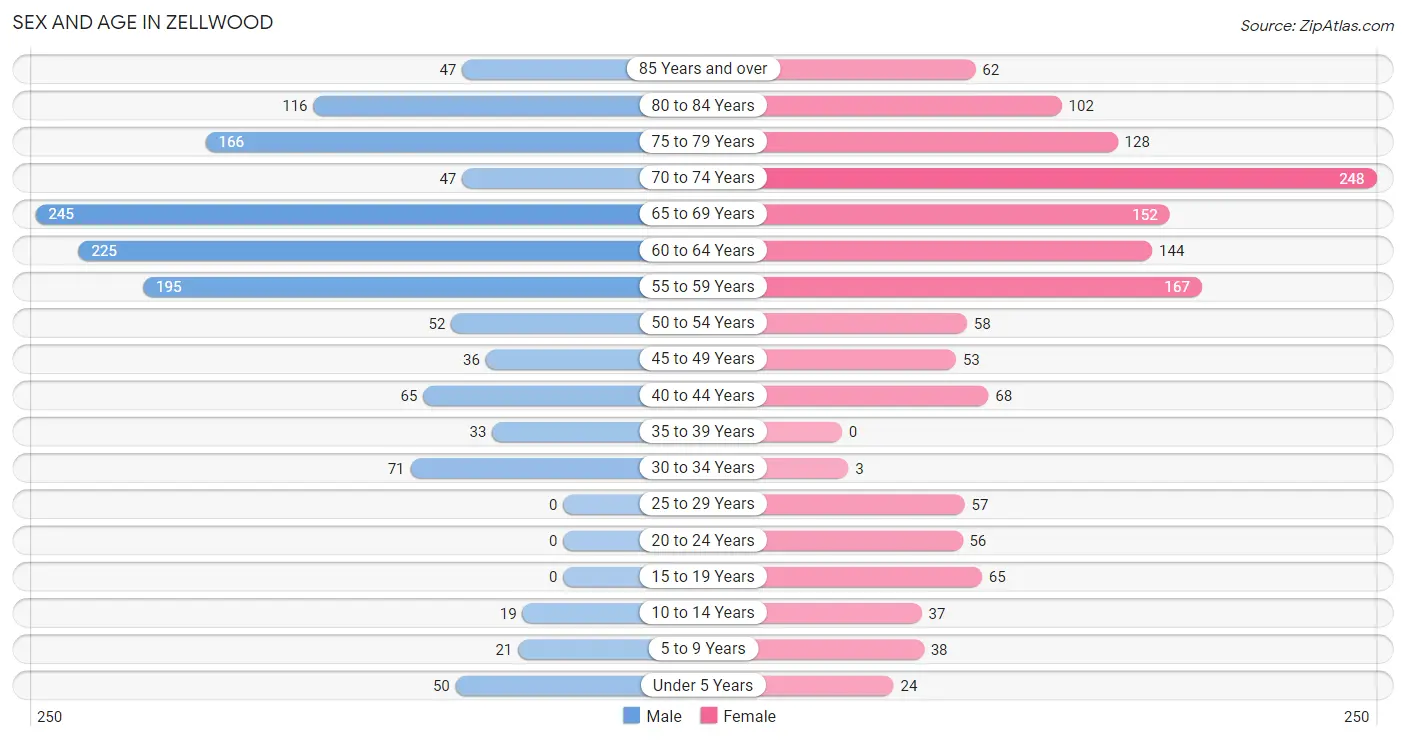
The most populous age groups in Zellwood are 65 to 69 Years (245 | 17.6%) for men and 70 to 74 Years (248 | 17.0%) for women.
| Age Bracket | Male | Female |
| Under 5 Years | 50 (3.6%) | 24 (1.6%) |
| 5 to 9 Years | 21 (1.5%) | 38 (2.6%) |
| 10 to 14 Years | 19 (1.4%) | 37 (2.5%) |
| 15 to 19 Years | 0 (0.0%) | 65 (4.4%) |
| 20 to 24 Years | 0 (0.0%) | 56 (3.8%) |
| 25 to 29 Years | 0 (0.0%) | 57 (3.9%) |
| 30 to 34 Years | 71 (5.1%) | 3 (0.2%) |
| 35 to 39 Years | 33 (2.4%) | 0 (0.0%) |
| 40 to 44 Years | 65 (4.7%) | 68 (4.6%) |
| 45 to 49 Years | 36 (2.6%) | 53 (3.6%) |
| 50 to 54 Years | 52 (3.7%) | 58 (4.0%) |
| 55 to 59 Years | 195 (14.1%) | 167 (11.4%) |
| 60 to 64 Years | 225 (16.2%) | 144 (9.9%) |
| 65 to 69 Years | 245 (17.6%) | 152 (10.4%) |
| 70 to 74 Years | 47 (3.4%) | 248 (17.0%) |
| 75 to 79 Years | 166 (12.0%) | 128 (8.8%) |
| 80 to 84 Years | 116 (8.4%) | 102 (7.0%) |
| 85 Years and over | 47 (3.4%) | 62 (4.2%) |
| Total | 1,388 (100.0%) | 1,462 (100.0%) |
Families and Households in Zellwood
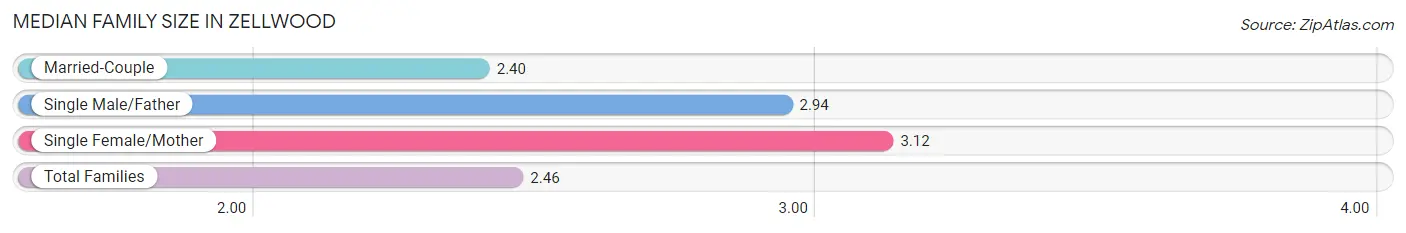
Median Family Size in Zellwood
The median family size in Zellwood is 2.46 persons per family, with single female/mother families (33 | 3.7%) accounting for the largest median family size of 3.12 persons per family. On the other hand, married-couple families (821 | 91.1%) represent the smallest median family size with 2.40 persons per family.
| Family Type | # Families | Family Size |
| Married-Couple | 821 (91.1%) | 2.40 |
| Single Male/Father | 47 (5.2%) | 2.94 |
| Single Female/Mother | 33 (3.7%) | 3.12 |
| Total Families | 901 (100.0%) | 2.46 |
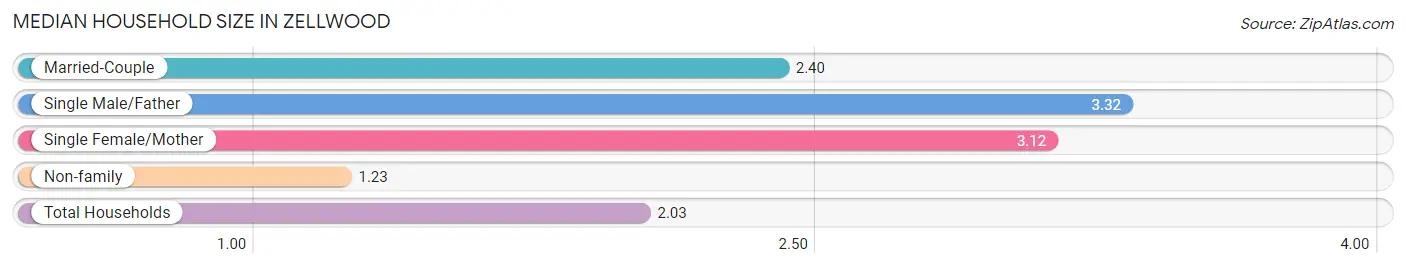
Median Household Size in Zellwood
The median household size in Zellwood is 2.03 persons per household, with single male/father households (47 | 3.4%) accounting for the largest median household size of 3.32 persons per household. non-family households (498 | 35.6%) represent the smallest median household size with 1.23 persons per household.
| Household Type | # Households | Household Size |
| Married-Couple | 821 (58.7%) | 2.40 |
| Single Male/Father | 47 (3.4%) | 3.32 |
| Single Female/Mother | 33 (2.4%) | 3.12 |
| Non-family | 498 (35.6%) | 1.23 |
| Total Households | 1,399 (100.0%) | 2.03 |
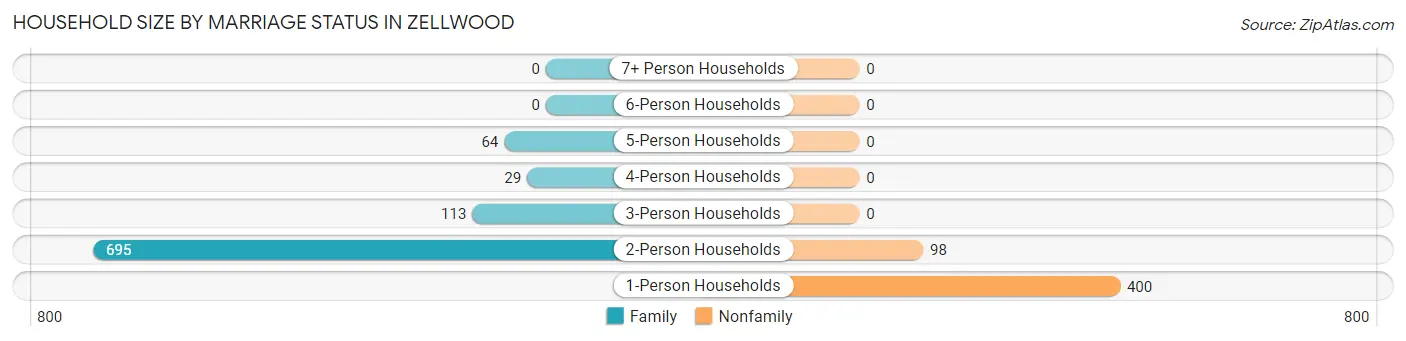
Household Size by Marriage Status in Zellwood
Out of a total of 1,399 households in Zellwood, 901 (64.4%) are family households, while 498 (35.6%) are nonfamily households. The most numerous type of family households are 2-person households, comprising 695, and the most common type of nonfamily households are 1-person households, comprising 400.
| Household Size | Family Households | Nonfamily Households |
| 1-Person Households | - | 400 (28.6%) |
| 2-Person Households | 695 (49.7%) | 98 (7.0%) |
| 3-Person Households | 113 (8.1%) | 0 (0.0%) |
| 4-Person Households | 29 (2.1%) | 0 (0.0%) |
| 5-Person Households | 64 (4.6%) | 0 (0.0%) |
| 6-Person Households | 0 (0.0%) | 0 (0.0%) |
| 7+ Person Households | 0 (0.0%) | 0 (0.0%) |
| Total | 901 (64.4%) | 498 (35.6%) |
Female Fertility in Zellwood
Fertility by Age in Zellwood
| Age Bracket | Women with Births | Births / 1,000 Women |
| 15 to 19 years | 0 (0.0%) | 0.0 |
| 20 to 34 years | 0 (0.0%) | 0.0 |
| 35 to 50 years | 0 (0.0%) | 0.0 |
| Total | 0 (0.0%) | 0.0 |
Fertility by Age by Marriage Status in Zellwood
| Age Bracket | Married | Unmarried |
| 15 to 19 years | 0 (0.0%) | 0 (0.0%) |
| 20 to 34 years | 0 (0.0%) | 0 (0.0%) |
| 35 to 50 years | 0 (0.0%) | 0 (0.0%) |
| Total | 0 (0.0%) | 0 (0.0%) |
Fertility by Education in Zellwood
| Educational Attainment | Women with Births | Births / 1,000 Women |
| Less than High School | 0 (0.0%) | 0.0 |
| High School Diploma | 0 (0.0%) | 0.0 |
| College or Associate's Degree | 0 (0.0%) | 0.0 |
| Bachelor's Degree | 0 (0.0%) | 0.0 |
| Graduate Degree | 0 (0.0%) | 0.0 |
| Total | 0 (0.0%) | 0.0 |
Fertility by Education by Marriage Status in Zellwood
| Educational Attainment | Married | Unmarried |
| Less than High School | 0 (0.0%) | 0 (0.0%) |
| High School Diploma | 0 (0.0%) | 0 (0.0%) |
| College or Associate's Degree | 0 (0.0%) | 0 (0.0%) |
| Bachelor's Degree | 0 (0.0%) | 0 (0.0%) |
| Graduate Degree | 0 (0.0%) | 0 (0.0%) |
| Total | 0 (0.0%) | 0 (0.0%) |
Income in Zellwood
Income Overview in Zellwood
Per Capita Income in Zellwood is $38,980, while median incomes of families and households are $70,078 and $56,733 respectively.
| Characteristic | Number | Measure |
| Per Capita Income | 2,850 | $38,980 |
| Median Family Income | 901 | $70,078 |
| Mean Family Income | 901 | $95,967 |
| Median Household Income | 1,399 | $56,733 |
| Mean Household Income | 1,399 | $77,632 |
| Income Deficit | 901 | $0 |
| Wage / Income Gap (%) | 2,850 | 45.16% |
| Wage / Income Gap ($) | 2,850 | 54.84¢ per $1 |
| Gini / Inequality Index | 2,850 | 0.40 |
Earnings by Sex in Zellwood
Average Earnings in Zellwood are $46,000, $54,675 for men and $29,983 for women, a difference of 45.2%.
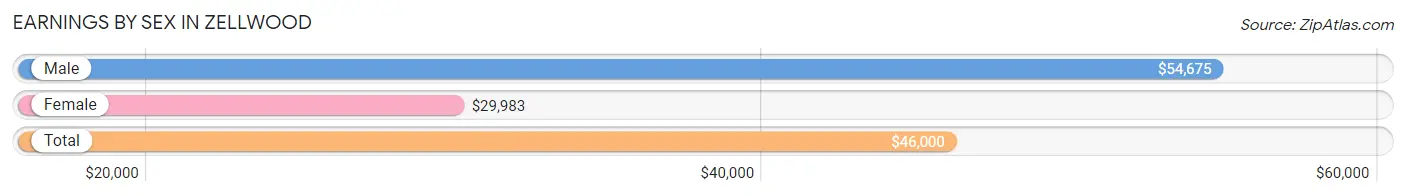
| Sex | Number | Average Earnings |
| Male | 677 (52.5%) | $54,675 |
| Female | 613 (47.5%) | $29,983 |
| Total | 1,290 (100.0%) | $46,000 |
Earnings by Sex by Income Bracket in Zellwood
The most common earnings brackets in Zellwood are $100,000+ for men (143 | 21.1%) and $25,000 to $29,999 for women (114 | 18.6%).
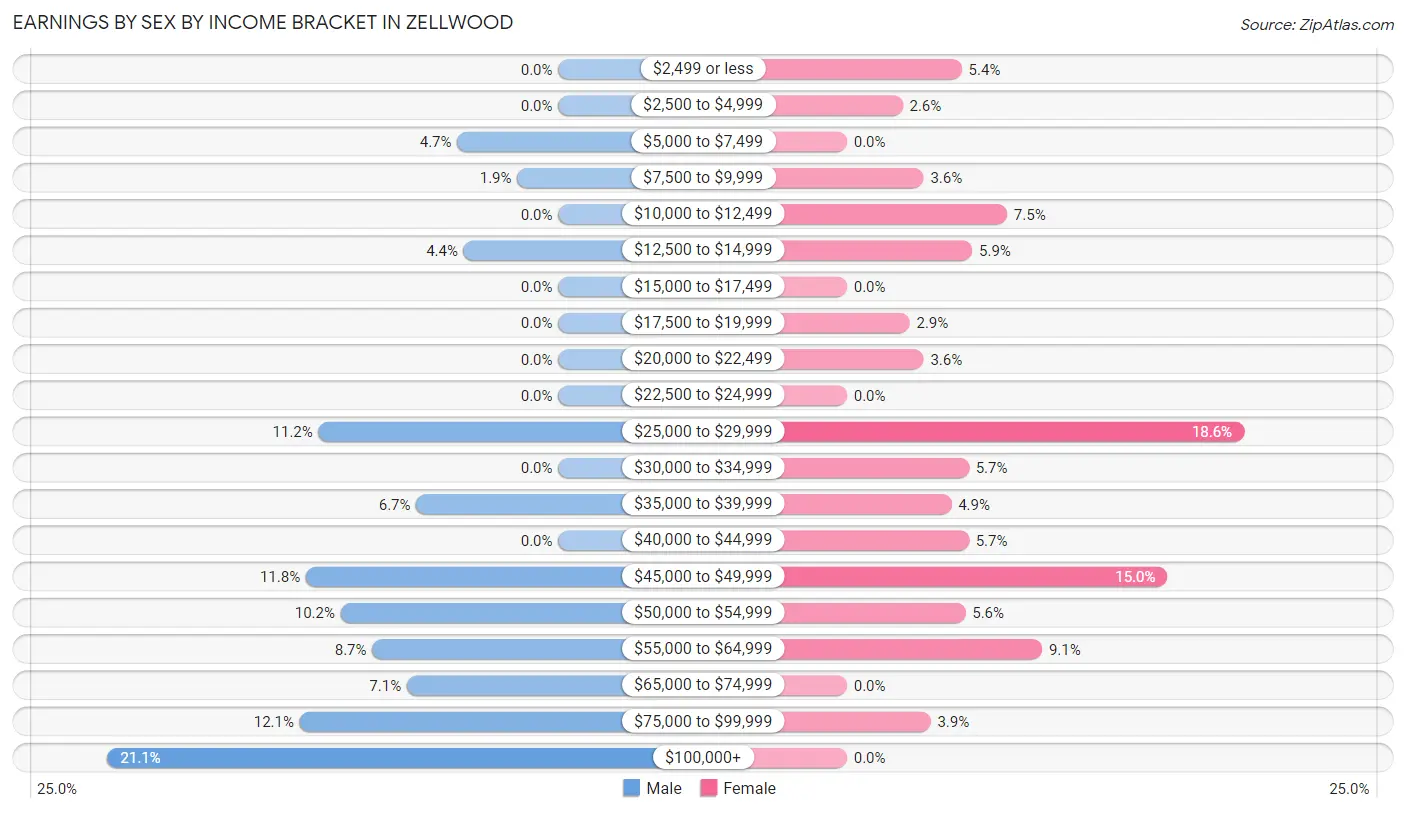
| Income | Male | Female |
| $2,499 or less | 0 (0.0%) | 33 (5.4%) |
| $2,500 to $4,999 | 0 (0.0%) | 16 (2.6%) |
| $5,000 to $7,499 | 32 (4.7%) | 0 (0.0%) |
| $7,500 to $9,999 | 13 (1.9%) | 22 (3.6%) |
| $10,000 to $12,499 | 0 (0.0%) | 46 (7.5%) |
| $12,500 to $14,999 | 30 (4.4%) | 36 (5.9%) |
| $15,000 to $17,499 | 0 (0.0%) | 0 (0.0%) |
| $17,500 to $19,999 | 0 (0.0%) | 18 (2.9%) |
| $20,000 to $22,499 | 0 (0.0%) | 22 (3.6%) |
| $22,500 to $24,999 | 0 (0.0%) | 0 (0.0%) |
| $25,000 to $29,999 | 76 (11.2%) | 114 (18.6%) |
| $30,000 to $34,999 | 0 (0.0%) | 35 (5.7%) |
| $35,000 to $39,999 | 45 (6.7%) | 30 (4.9%) |
| $40,000 to $44,999 | 0 (0.0%) | 35 (5.7%) |
| $45,000 to $49,999 | 80 (11.8%) | 92 (15.0%) |
| $50,000 to $54,999 | 69 (10.2%) | 34 (5.6%) |
| $55,000 to $64,999 | 59 (8.7%) | 56 (9.1%) |
| $65,000 to $74,999 | 48 (7.1%) | 0 (0.0%) |
| $75,000 to $99,999 | 82 (12.1%) | 24 (3.9%) |
| $100,000+ | 143 (21.1%) | 0 (0.0%) |
| Total | 677 (100.0%) | 613 (100.0%) |
Earnings by Sex by Educational Attainment in Zellwood
Average earnings in Zellwood are $54,675 for men and $29,300 for women, a difference of 46.4%. Men with an educational attainment of college or associate's degree enjoy the highest average annual earnings of $57,203, while those with high school diploma education earn the least with $52,614. Women with an educational attainment of college or associate's degree earn the most with the average annual earnings of $39,417, while those with bachelor's degree education have the smallest earnings of $28,341.
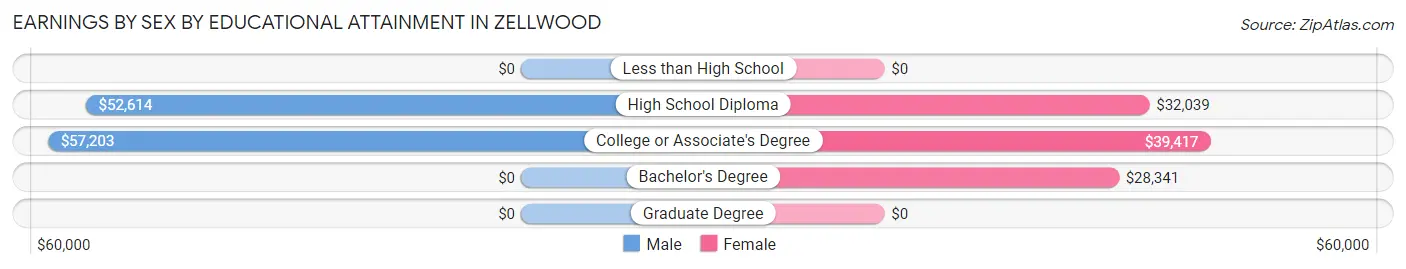
| Educational Attainment | Male Income | Female Income |
| Less than High School | - | - |
| High School Diploma | $52,614 | $32,039 |
| College or Associate's Degree | $57,203 | $39,417 |
| Bachelor's Degree | - | - |
| Graduate Degree | - | - |
| Total | $54,675 | $29,300 |
Family Income in Zellwood
Family Income Brackets in Zellwood
According to the Zellwood family income data, there are 241 families falling into the $100,000 to $149,999 income range, which is the most common income bracket and makes up 26.8% of all families.
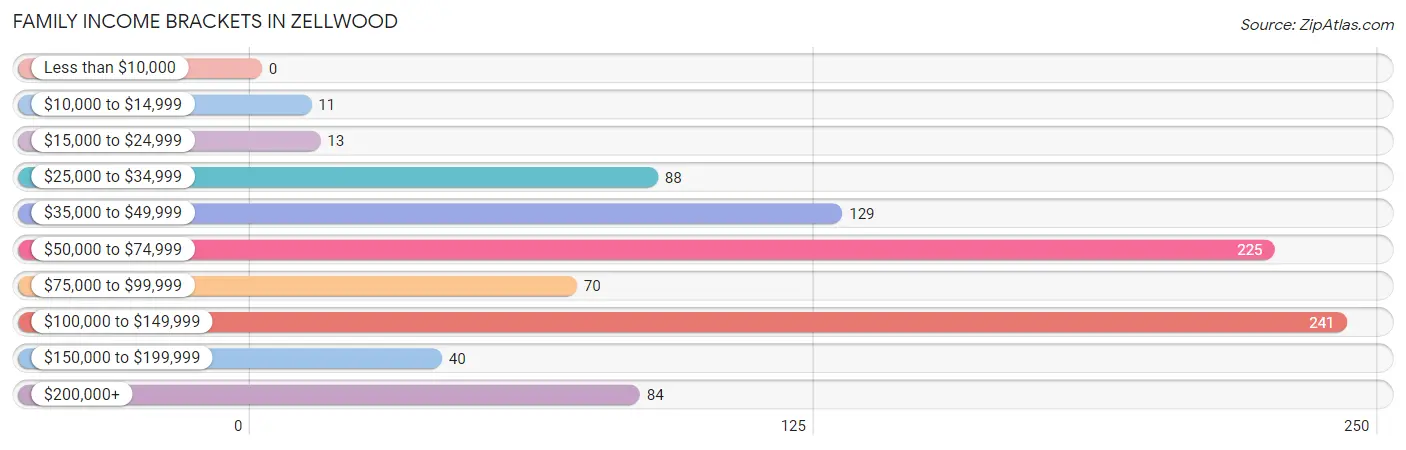
| Income Bracket | # Families | % Families |
| Less than $10,000 | 0 | 0.0% |
| $10,000 to $14,999 | 11 | 1.2% |
| $15,000 to $24,999 | 13 | 1.4% |
| $25,000 to $34,999 | 88 | 9.8% |
| $35,000 to $49,999 | 129 | 14.3% |
| $50,000 to $74,999 | 225 | 25.0% |
| $75,000 to $99,999 | 70 | 7.8% |
| $100,000 to $149,999 | 241 | 26.7% |
| $150,000 to $199,999 | 40 | 4.4% |
| $200,000+ | 84 | 9.3% |
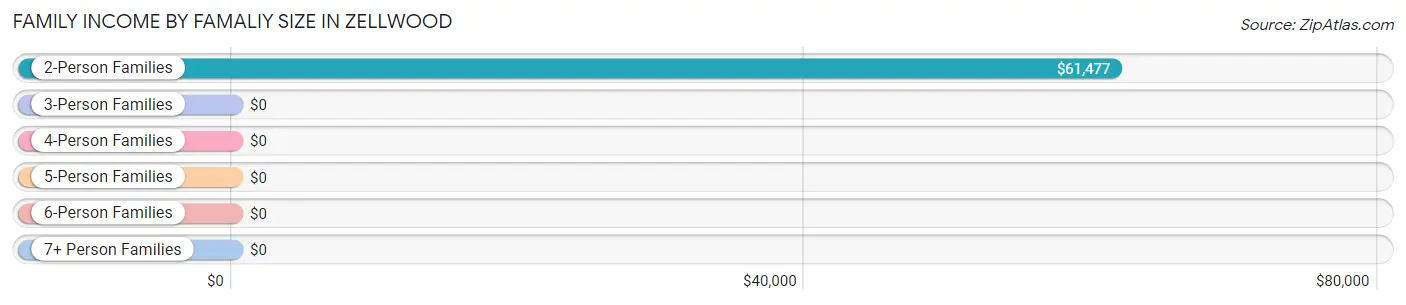
Family Income by Famaliy Size in Zellwood
2-person families (695 | 77.1%) account for the highest median family income in Zellwood with $61,477 per family, while 2-person families (695 | 77.1%) have the highest median income of $30,738 per family member.
| Income Bracket | # Families | Median Income |
| 2-Person Families | 695 (77.1%) | $61,477 |
| 3-Person Families | 126 (14.0%) | $0 |
| 4-Person Families | 16 (1.8%) | $0 |
| 5-Person Families | 64 (7.1%) | $0 |
| 6-Person Families | 0 (0.0%) | $0 |
| 7+ Person Families | 0 (0.0%) | $0 |
| Total | 901 (100.0%) | $70,078 |
Family Income by Number of Earners in Zellwood
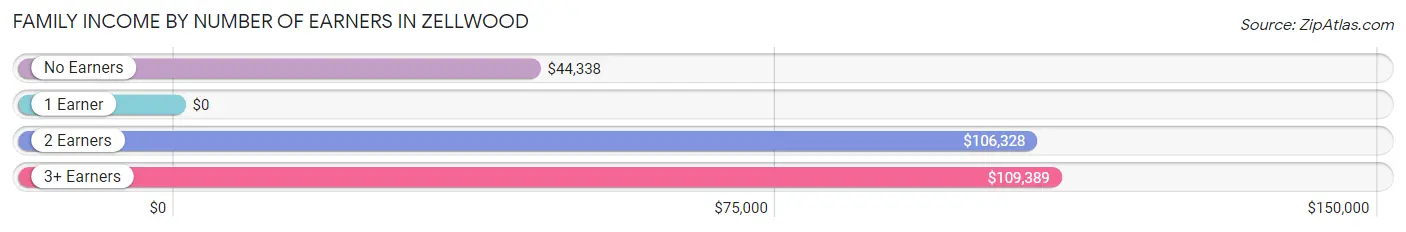
| Number of Earners | # Families | Median Income |
| No Earners | 353 (39.2%) | $44,338 |
| 1 Earner | 179 (19.9%) | $0 |
| 2 Earners | 269 (29.9%) | $106,328 |
| 3+ Earners | 100 (11.1%) | $109,389 |
| Total | 901 (100.0%) | $70,078 |
Household Income in Zellwood
Household Income Brackets in Zellwood
With 309 households falling in the category, the $100,000 to $149,999 income range is the most frequent in Zellwood, accounting for 22.1% of all households.
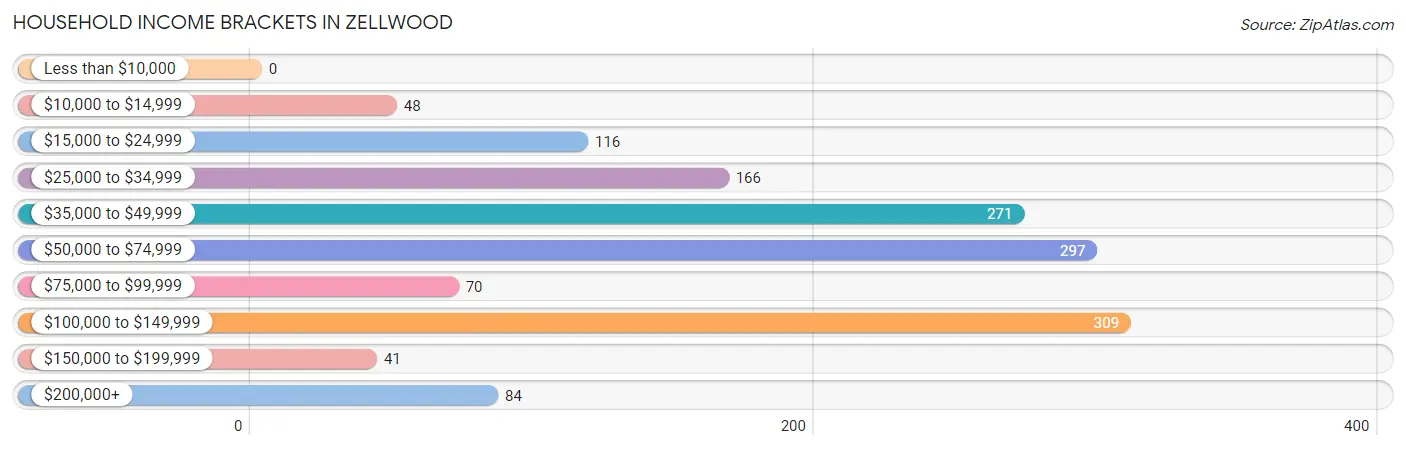
| Income Bracket | # Households | % Households |
| Less than $10,000 | 0 | 0.0% |
| $10,000 to $14,999 | 48 | 3.4% |
| $15,000 to $24,999 | 116 | 8.3% |
| $25,000 to $34,999 | 166 | 11.9% |
| $35,000 to $49,999 | 271 | 19.4% |
| $50,000 to $74,999 | 297 | 21.2% |
| $75,000 to $99,999 | 70 | 5.0% |
| $100,000 to $149,999 | 309 | 22.1% |
| $150,000 to $199,999 | 41 | 2.9% |
| $200,000+ | 84 | 6.0% |
Household Income by Householder Age in Zellwood
The median household income in Zellwood is $56,733, with the highest median household income of $108,222 found in the 45 to 64 years age bracket for the primary householder. A total of 426 households (30.4%) fall into this category.
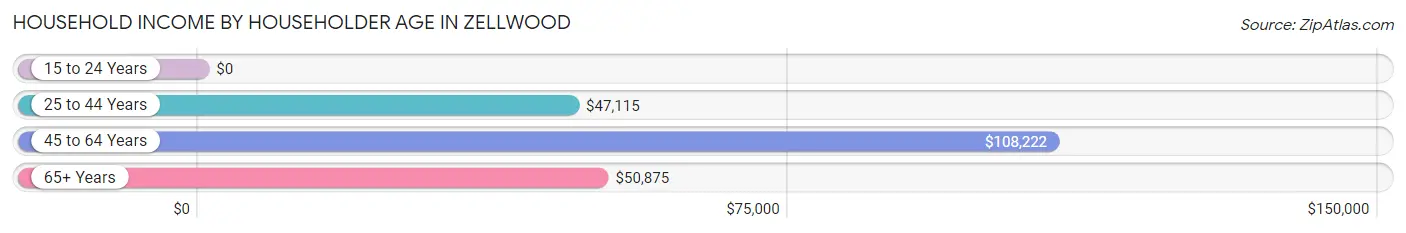
| Income Bracket | # Households | Median Income |
| 15 to 24 Years | 0 (0.0%) | $0 |
| 25 to 44 Years | 136 (9.7%) | $47,115 |
| 45 to 64 Years | 426 (30.4%) | $108,222 |
| 65+ Years | 837 (59.8%) | $50,875 |
| Total | 1,399 (100.0%) | $56,733 |
Poverty in Zellwood
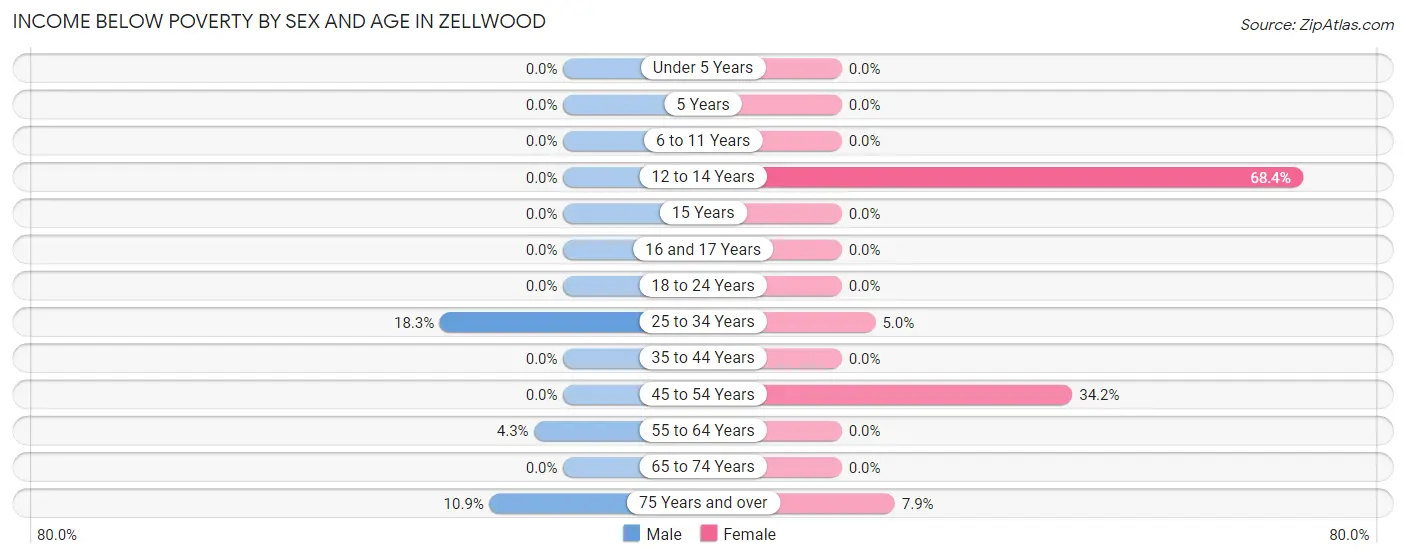
Income Below Poverty by Sex and Age in Zellwood
With 4.8% poverty level for males and 5.3% for females among the residents of Zellwood, 25 to 34 year old males and 12 to 14 year old females are the most vulnerable to poverty, with 13 males (18.3%) and 13 females (68.4%) in their respective age groups living below the poverty level.
| Age Bracket | Male | Female |
| Under 5 Years | 0 (0.0%) | 0 (0.0%) |
| 5 Years | 0 (0.0%) | 0 (0.0%) |
| 6 to 11 Years | 0 (0.0%) | 0 (0.0%) |
| 12 to 14 Years | 0 (0.0%) | 13 (68.4%) |
| 15 Years | 0 (0.0%) | 0 (0.0%) |
| 16 and 17 Years | 0 (0.0%) | 0 (0.0%) |
| 18 to 24 Years | 0 (0.0%) | 0 (0.0%) |
| 25 to 34 Years | 13 (18.3%) | 3 (5.0%) |
| 35 to 44 Years | 0 (0.0%) | 0 (0.0%) |
| 45 to 54 Years | 0 (0.0%) | 38 (34.2%) |
| 55 to 64 Years | 18 (4.3%) | 0 (0.0%) |
| 65 to 74 Years | 0 (0.0%) | 0 (0.0%) |
| 75 Years and over | 36 (10.9%) | 23 (7.9%) |
| Total | 67 (4.8%) | 77 (5.3%) |
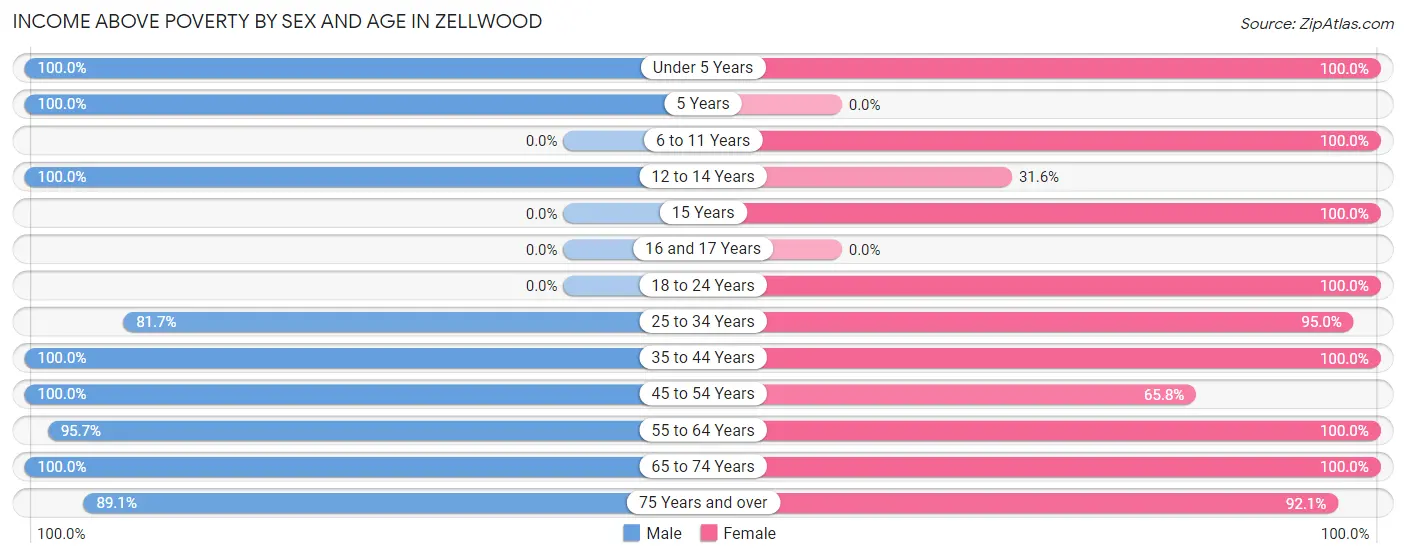
Income Above Poverty by Sex and Age in Zellwood
According to the poverty statistics in Zellwood, males aged under 5 years and females aged under 5 years are the age groups that are most secure financially, with 100.0% of males and 100.0% of females in these age groups living above the poverty line.
| Age Bracket | Male | Female |
| Under 5 Years | 50 (100.0%) | 24 (100.0%) |
| 5 Years | 21 (100.0%) | 0 (0.0%) |
| 6 to 11 Years | 0 (0.0%) | 56 (100.0%) |
| 12 to 14 Years | 19 (100.0%) | 6 (31.6%) |
| 15 Years | 0 (0.0%) | 50 (100.0%) |
| 16 and 17 Years | 0 (0.0%) | 0 (0.0%) |
| 18 to 24 Years | 0 (0.0%) | 71 (100.0%) |
| 25 to 34 Years | 58 (81.7%) | 57 (95.0%) |
| 35 to 44 Years | 98 (100.0%) | 68 (100.0%) |
| 45 to 54 Years | 88 (100.0%) | 73 (65.8%) |
| 55 to 64 Years | 402 (95.7%) | 311 (100.0%) |
| 65 to 74 Years | 292 (100.0%) | 400 (100.0%) |
| 75 Years and over | 293 (89.1%) | 269 (92.1%) |
| Total | 1,321 (95.2%) | 1,385 (94.7%) |
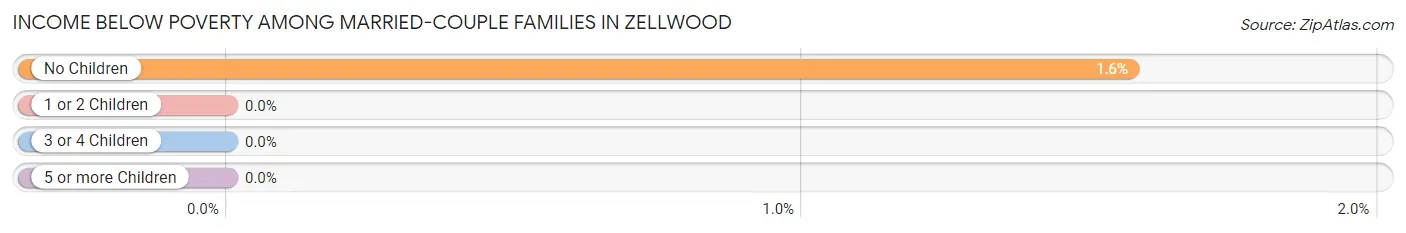
Income Below Poverty Among Married-Couple Families in Zellwood
The poverty statistics for married-couple families in Zellwood show that 1.3% or 11 of the total 821 families live below the poverty line. Families with no children have the highest poverty rate of 1.6%, comprising of 11 families. On the other hand, families with 1 or 2 children have the lowest poverty rate of 0.0%, which includes 0 families.
| Children | Above Poverty | Below Poverty |
| No Children | 691 (98.4%) | 11 (1.6%) |
| 1 or 2 Children | 100 (100.0%) | 0 (0.0%) |
| 3 or 4 Children | 19 (100.0%) | 0 (0.0%) |
| 5 or more Children | 0 (0.0%) | 0 (0.0%) |
| Total | 810 (98.7%) | 11 (1.3%) |
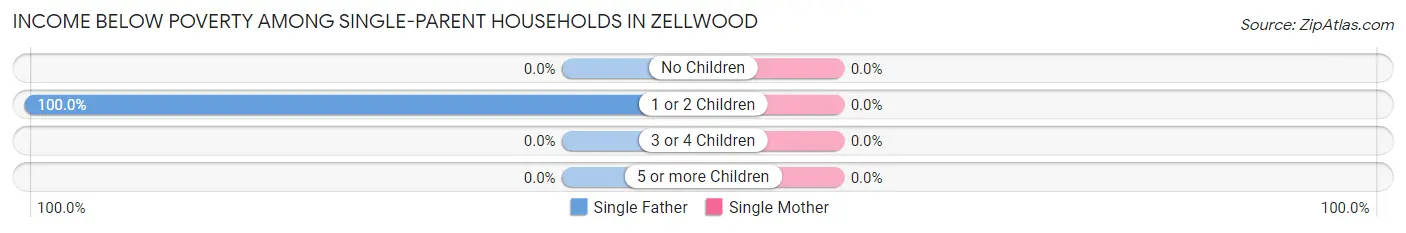
Income Below Poverty Among Single-Parent Households in Zellwood
| Children | Single Father | Single Mother |
| No Children | 0 (0.0%) | 0 (0.0%) |
| 1 or 2 Children | 13 (100.0%) | 0 (0.0%) |
| 3 or 4 Children | 0 (0.0%) | 0 (0.0%) |
| 5 or more Children | 0 (0.0%) | 0 (0.0%) |
| Total | 13 (27.7%) | 0 (0.0%) |
Income Below Poverty Among Married-Couple vs Single-Parent Households in Zellwood
The poverty data for Zellwood shows that 11 of the married-couple family households (1.3%) and 13 of the single-parent households (16.3%) are living below the poverty level. Within the married-couple family households, those with no children have the highest poverty rate, with 11 households (1.6%) falling below the poverty line. Among the single-parent households, those with 1 or 2 children have the highest poverty rate, with 13 household (76.5%) living below poverty.

| Children | Married-Couple Families | Single-Parent Households |
| No Children | 11 (1.6%) | 0 (0.0%) |
| 1 or 2 Children | 0 (0.0%) | 13 (76.5%) |
| 3 or 4 Children | 0 (0.0%) | 0 (0.0%) |
| 5 or more Children | 0 (0.0%) | 0 (0.0%) |
| Total | 11 (1.3%) | 13 (16.3%) |
Employment Characteristics in Zellwood
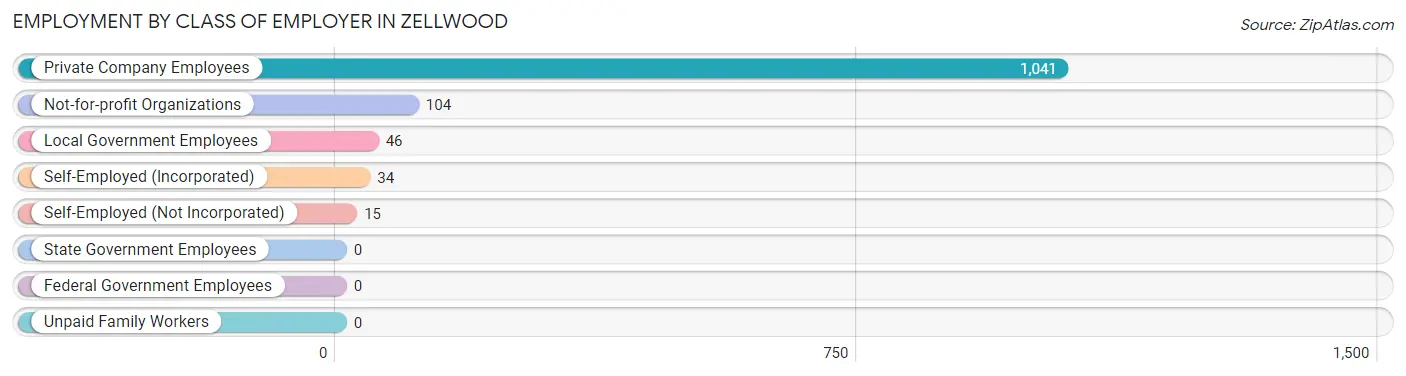
Employment by Class of Employer in Zellwood
Among the 1,240 employed individuals in Zellwood, private company employees (1,041 | 84.0%), not-for-profit organizations (104 | 8.4%), and local government employees (46 | 3.7%) make up the most common classes of employment.
| Employer Class | # Employees | % Employees |
| Private Company Employees | 1,041 | 84.0% |
| Self-Employed (Incorporated) | 34 | 2.7% |
| Self-Employed (Not Incorporated) | 15 | 1.2% |
| Not-for-profit Organizations | 104 | 8.4% |
| Local Government Employees | 46 | 3.7% |
| State Government Employees | 0 | 0.0% |
| Federal Government Employees | 0 | 0.0% |
| Unpaid Family Workers | 0 | 0.0% |
| Total | 1,240 | 100.0% |
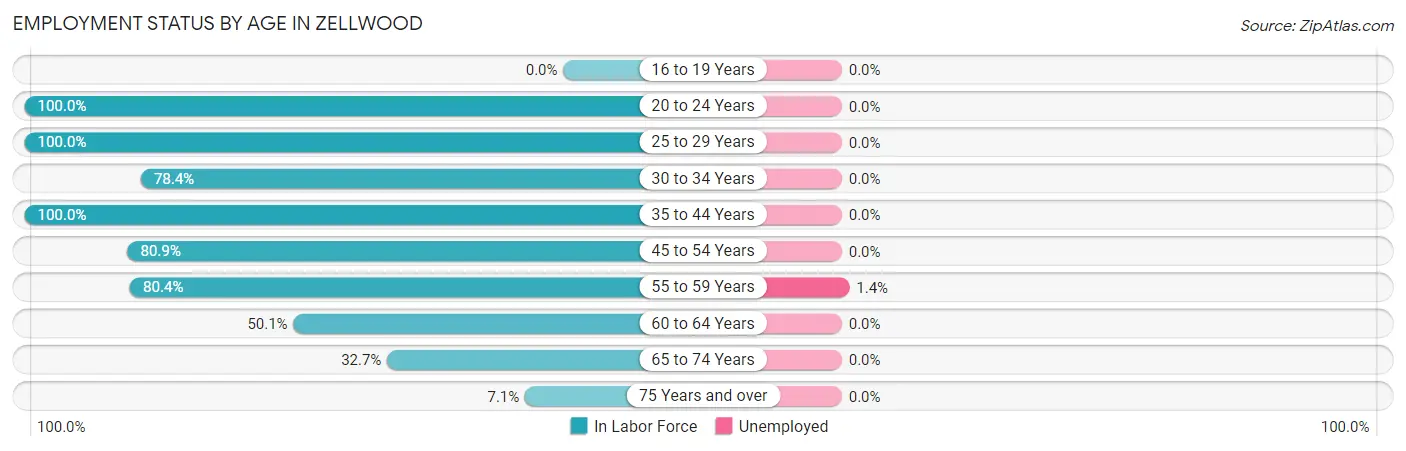
Employment Status by Age in Zellwood
According to the labor force statistics for Zellwood, out of the total population over 16 years of age (2,611), 47.6% or 1,243 individuals are in the labor force, with 0.3% or 4 of them unemployed. The age group with the highest labor force participation rate is 20 to 24 years, with 100.0% or 56 individuals in the labor force. Within the labor force, the 55 to 59 years age range has the highest percentage of unemployed individuals, with 1.4% or 4 of them being unemployed.
| Age Bracket | In Labor Force | Unemployed |
| 16 to 19 Years | 0 (0.0%) | 0 (0.0%) |
| 20 to 24 Years | 56 (100.0%) | 0 (0.0%) |
| 25 to 29 Years | 57 (100.0%) | 0 (0.0%) |
| 30 to 34 Years | 58 (78.4%) | 0 (0.0%) |
| 35 to 44 Years | 166 (100.0%) | 0 (0.0%) |
| 45 to 54 Years | 161 (80.9%) | 0 (0.0%) |
| 55 to 59 Years | 291 (80.4%) | 4 (1.4%) |
| 60 to 64 Years | 185 (50.1%) | 0 (0.0%) |
| 65 to 74 Years | 226 (32.7%) | 0 (0.0%) |
| 75 Years and over | 44 (7.1%) | 0 (0.0%) |
| Total | 1,243 (47.6%) | 4 (0.3%) |
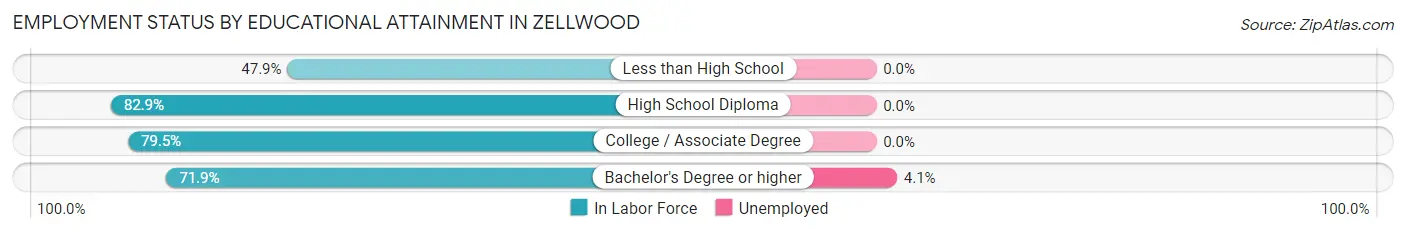
Employment Status by Educational Attainment in Zellwood
According to labor force statistics for Zellwood, 74.8% of individuals (918) out of the total population between 25 and 64 years of age (1,227) are in the labor force, with 0.4% or 4 of them being unemployed. The group with the highest labor force participation rate are those with the educational attainment of high school diploma, with 82.9% or 315 individuals in the labor force. Within the labor force, individuals with bachelor's degree or higher education have the highest percentage of unemployment, with 4.1% or 4 of them being unemployed.
| Educational Attainment | In Labor Force | Unemployed |
| Less than High School | 91 (47.9%) | 0 (0.0%) |
| High School Diploma | 315 (82.9%) | 0 (0.0%) |
| College / Associate Degree | 415 (79.5%) | 0 (0.0%) |
| Bachelor's Degree or higher | 97 (71.9%) | 6 (4.1%) |
| Total | 918 (74.8%) | 5 (0.4%) |
Employment Occupations by Sex in Zellwood
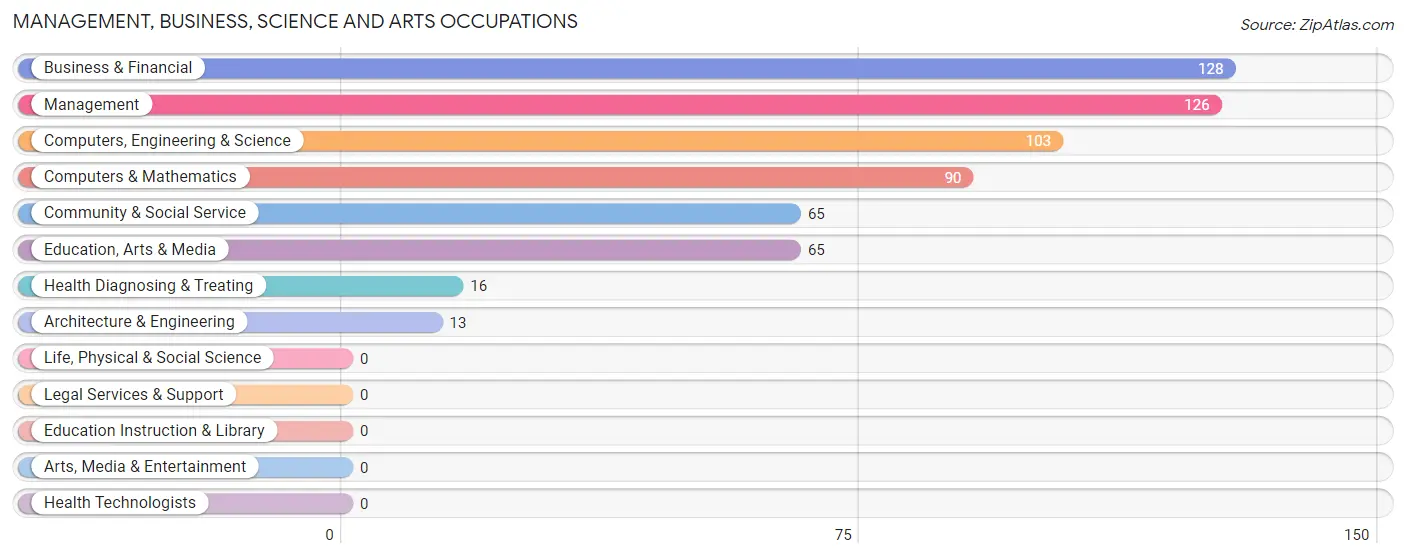
Management, Business, Science and Arts Occupations
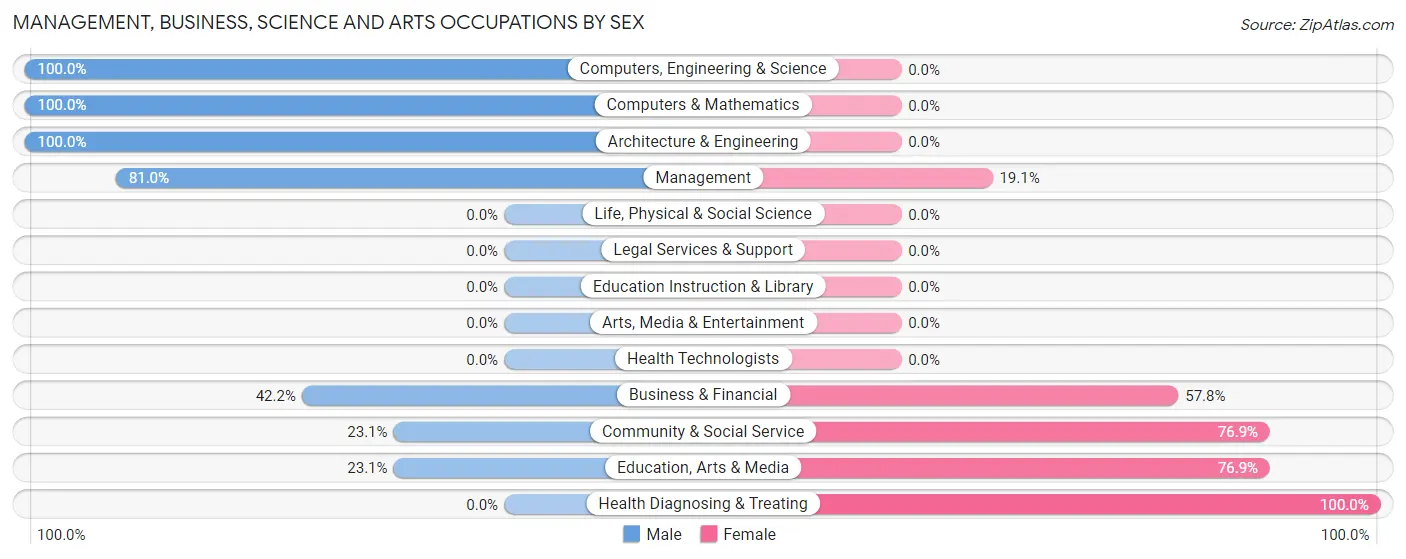
The most common Management, Business, Science and Arts occupations in Zellwood are Business & Financial (128 | 10.3%), Management (126 | 10.2%), Computers, Engineering & Science (103 | 8.3%), Computers & Mathematics (90 | 7.3%), and Community & Social Service (65 | 5.2%).
Management, Business, Science and Arts Occupations by Sex
Within the Management, Business, Science and Arts occupations in Zellwood, the most male-oriented occupations are Computers, Engineering & Science (100.0%), Computers & Mathematics (100.0%), and Architecture & Engineering (100.0%), while the most female-oriented occupations are Health Diagnosing & Treating (100.0%), Community & Social Service (76.9%), and Education, Arts & Media (76.9%).
| Occupation | Male | Female |
| Management | 102 (80.9%) | 24 (19.1%) |
| Business & Financial | 54 (42.2%) | 74 (57.8%) |
| Computers, Engineering & Science | 103 (100.0%) | 0 (0.0%) |
| Computers & Mathematics | 90 (100.0%) | 0 (0.0%) |
| Architecture & Engineering | 13 (100.0%) | 0 (0.0%) |
| Life, Physical & Social Science | 0 (0.0%) | 0 (0.0%) |
| Community & Social Service | 15 (23.1%) | 50 (76.9%) |
| Education, Arts & Media | 15 (23.1%) | 50 (76.9%) |
| Legal Services & Support | 0 (0.0%) | 0 (0.0%) |
| Education Instruction & Library | 0 (0.0%) | 0 (0.0%) |
| Arts, Media & Entertainment | 0 (0.0%) | 0 (0.0%) |
| Health Diagnosing & Treating | 0 (0.0%) | 16 (100.0%) |
| Health Technologists | 0 (0.0%) | 0 (0.0%) |
| Total (Category) | 274 (62.6%) | 164 (37.4%) |
| Total (Overall) | 660 (53.2%) | 580 (46.8%) |
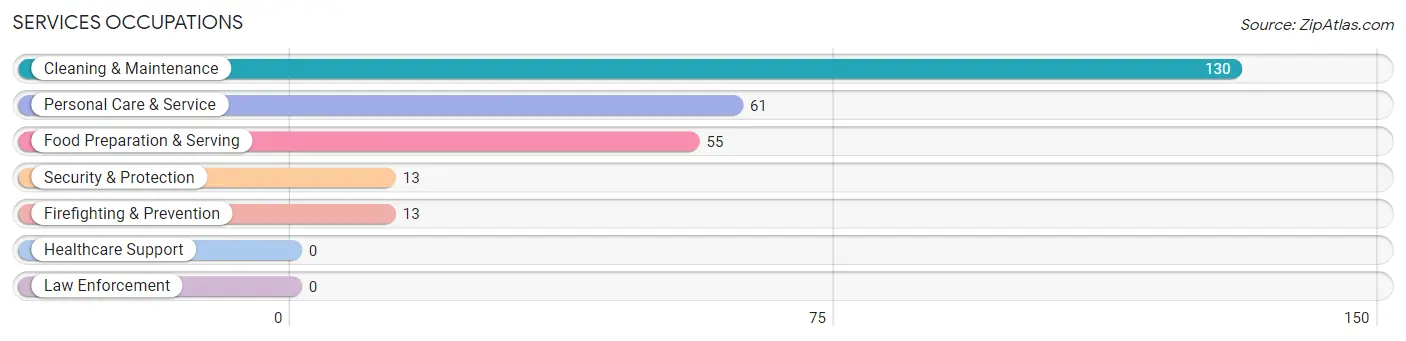
Services Occupations
The most common Services occupations in Zellwood are Cleaning & Maintenance (130 | 10.5%), Personal Care & Service (61 | 4.9%), Food Preparation & Serving (55 | 4.4%), Security & Protection (13 | 1.1%), and Firefighting & Prevention (13 | 1.1%).
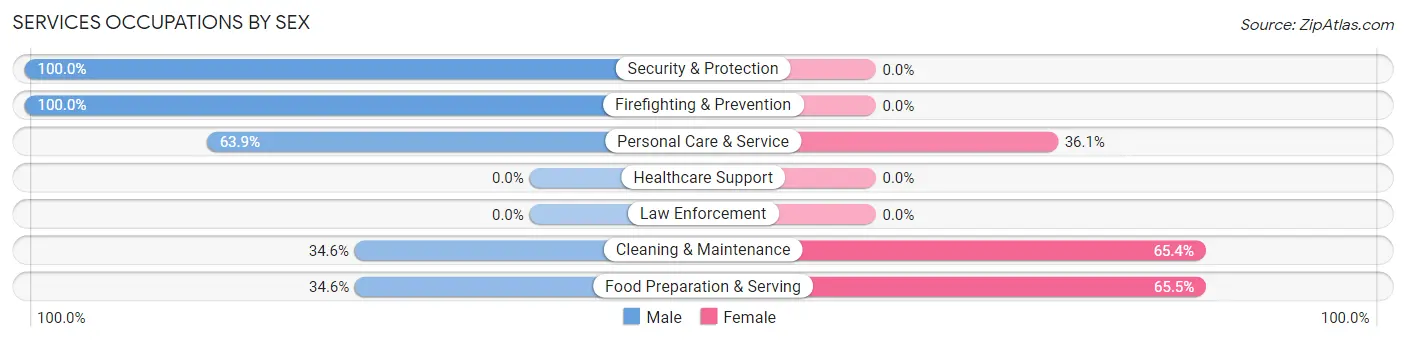
Services Occupations by Sex
Within the Services occupations in Zellwood, the most male-oriented occupations are Security & Protection (100.0%), Firefighting & Prevention (100.0%), and Personal Care & Service (63.9%), while the most female-oriented occupations are Food Preparation & Serving (65.4%), Cleaning & Maintenance (65.4%), and Personal Care & Service (36.1%).
| Occupation | Male | Female |
| Healthcare Support | 0 (0.0%) | 0 (0.0%) |
| Security & Protection | 13 (100.0%) | 0 (0.0%) |
| Firefighting & Prevention | 13 (100.0%) | 0 (0.0%) |
| Law Enforcement | 0 (0.0%) | 0 (0.0%) |
| Food Preparation & Serving | 19 (34.5%) | 36 (65.4%) |
| Cleaning & Maintenance | 45 (34.6%) | 85 (65.4%) |
| Personal Care & Service | 39 (63.9%) | 22 (36.1%) |
| Total (Category) | 116 (44.8%) | 143 (55.2%) |
| Total (Overall) | 660 (53.2%) | 580 (46.8%) |
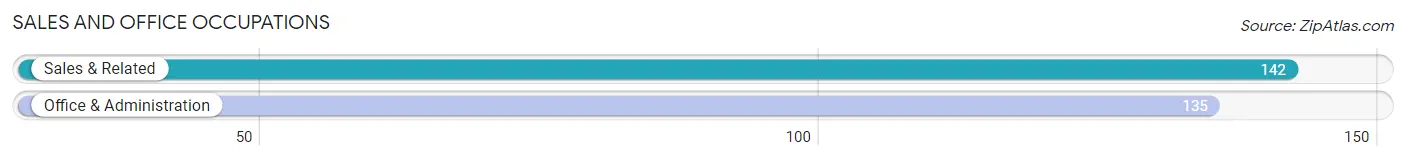
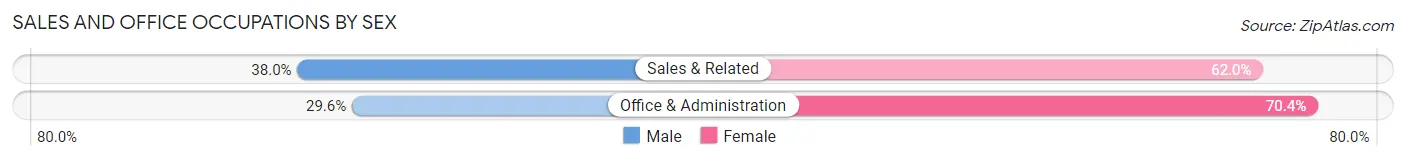
Sales and Office Occupations
The most common Sales and Office occupations in Zellwood are Sales & Related (142 | 11.5%), and Office & Administration (135 | 10.9%).
Sales and Office Occupations by Sex
| Occupation | Male | Female |
| Sales & Related | 54 (38.0%) | 88 (62.0%) |
| Office & Administration | 40 (29.6%) | 95 (70.4%) |
| Total (Category) | 94 (33.9%) | 183 (66.1%) |
| Total (Overall) | 660 (53.2%) | 580 (46.8%) |
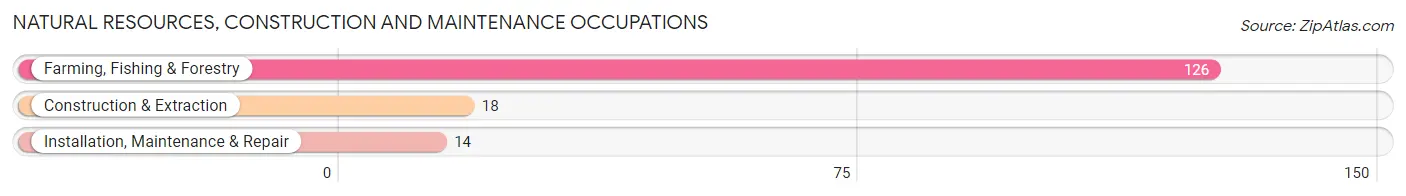
Natural Resources, Construction and Maintenance Occupations
The most common Natural Resources, Construction and Maintenance occupations in Zellwood are Farming, Fishing & Forestry (126 | 10.2%), Construction & Extraction (18 | 1.5%), and Installation, Maintenance & Repair (14 | 1.1%).
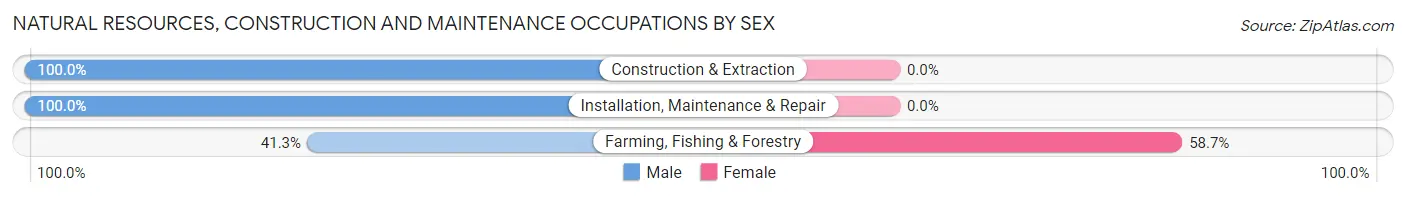
Natural Resources, Construction and Maintenance Occupations by Sex
| Occupation | Male | Female |
| Farming, Fishing & Forestry | 52 (41.3%) | 74 (58.7%) |
| Construction & Extraction | 18 (100.0%) | 0 (0.0%) |
| Installation, Maintenance & Repair | 14 (100.0%) | 0 (0.0%) |
| Total (Category) | 84 (53.2%) | 74 (46.8%) |
| Total (Overall) | 660 (53.2%) | 580 (46.8%) |
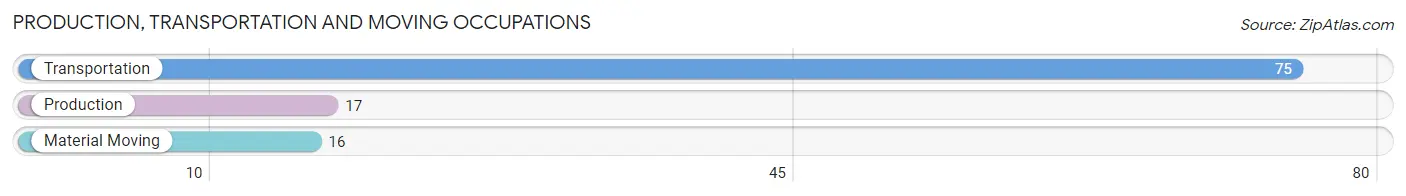
Production, Transportation and Moving Occupations
The most common Production, Transportation and Moving occupations in Zellwood are Transportation (75 | 6.0%), Production (17 | 1.4%), and Material Moving (16 | 1.3%).
Production, Transportation and Moving Occupations by Sex
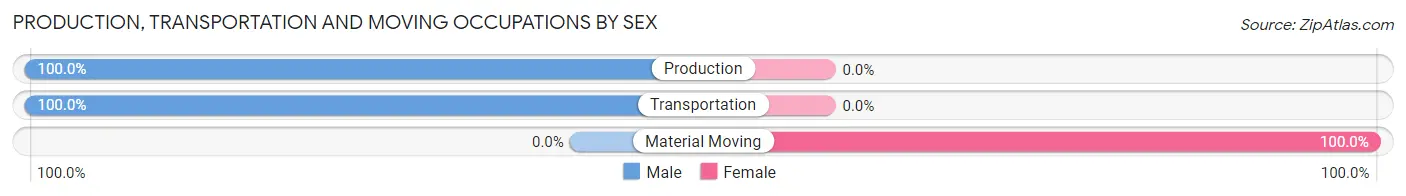
| Occupation | Male | Female |
| Production | 17 (100.0%) | 0 (0.0%) |
| Transportation | 75 (100.0%) | 0 (0.0%) |
| Material Moving | 0 (0.0%) | 16 (100.0%) |
| Total (Category) | 92 (85.2%) | 16 (14.8%) |
| Total (Overall) | 660 (53.2%) | 580 (46.8%) |
Employment Industries by Sex in Zellwood
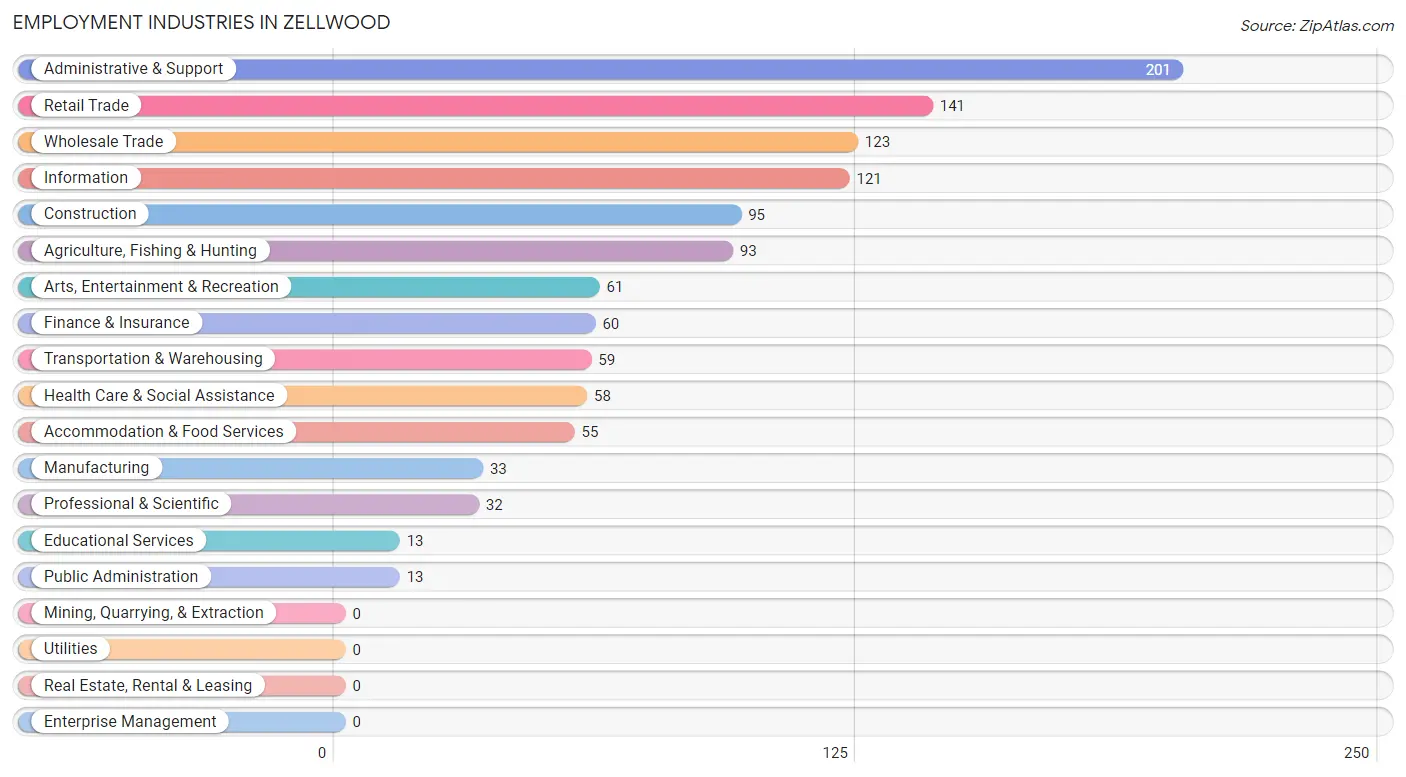
Employment Industries in Zellwood
The major employment industries in Zellwood include Administrative & Support (201 | 16.2%), Retail Trade (141 | 11.4%), Wholesale Trade (123 | 9.9%), Information (121 | 9.8%), and Construction (95 | 7.7%).
Employment Industries by Sex in Zellwood
The Zellwood industries that see more men than women are Construction (100.0%), Transportation & Warehousing (100.0%), and Public Administration (100.0%), whereas the industries that tend to have a higher number of women are Educational Services (100.0%), Agriculture, Fishing & Hunting (79.6%), and Finance & Insurance (70.0%).
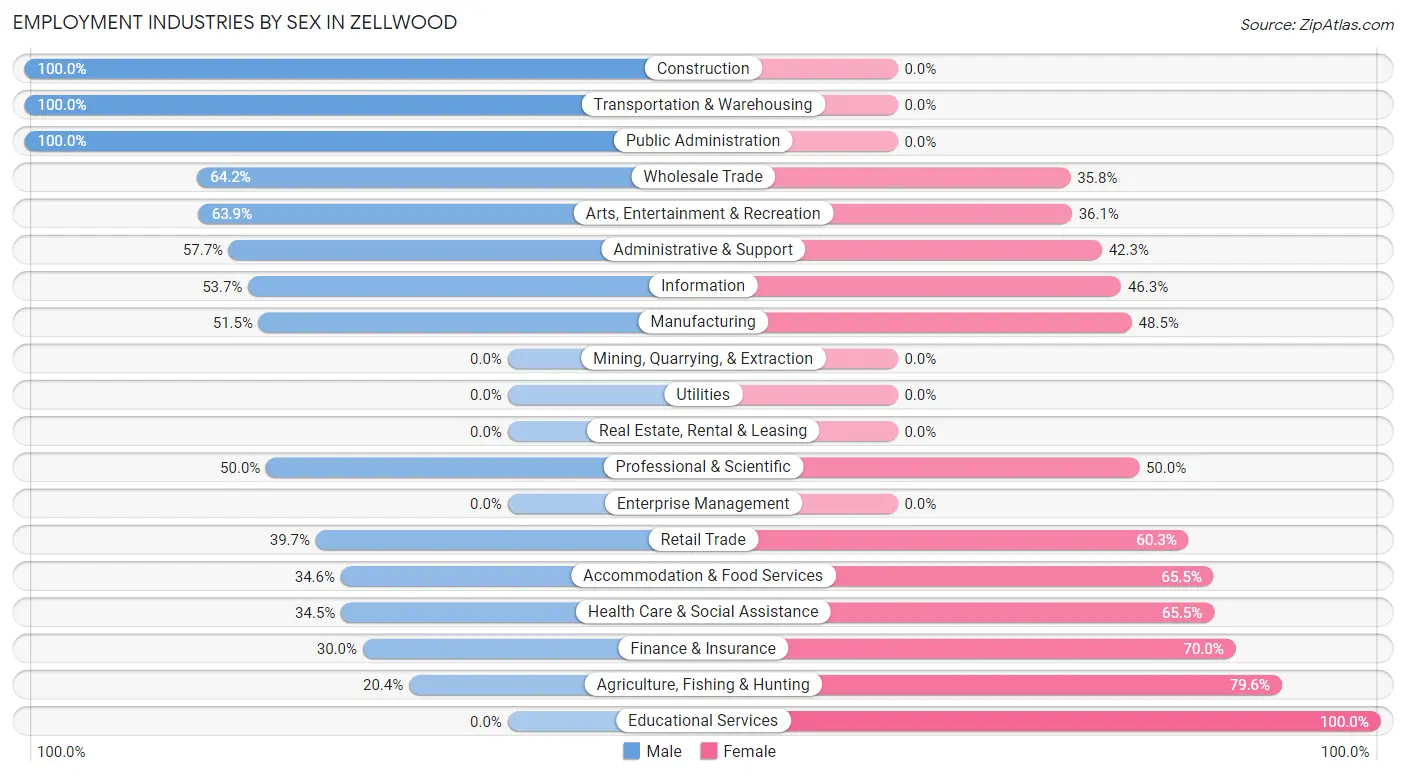
| Industry | Male | Female |
| Agriculture, Fishing & Hunting | 19 (20.4%) | 74 (79.6%) |
| Mining, Quarrying, & Extraction | 0 (0.0%) | 0 (0.0%) |
| Construction | 95 (100.0%) | 0 (0.0%) |
| Manufacturing | 17 (51.5%) | 16 (48.5%) |
| Wholesale Trade | 79 (64.2%) | 44 (35.8%) |
| Retail Trade | 56 (39.7%) | 85 (60.3%) |
| Transportation & Warehousing | 59 (100.0%) | 0 (0.0%) |
| Utilities | 0 (0.0%) | 0 (0.0%) |
| Information | 65 (53.7%) | 56 (46.3%) |
| Finance & Insurance | 18 (30.0%) | 42 (70.0%) |
| Real Estate, Rental & Leasing | 0 (0.0%) | 0 (0.0%) |
| Professional & Scientific | 16 (50.0%) | 16 (50.0%) |
| Enterprise Management | 0 (0.0%) | 0 (0.0%) |
| Administrative & Support | 116 (57.7%) | 85 (42.3%) |
| Educational Services | 0 (0.0%) | 13 (100.0%) |
| Health Care & Social Assistance | 20 (34.5%) | 38 (65.5%) |
| Arts, Entertainment & Recreation | 39 (63.9%) | 22 (36.1%) |
| Accommodation & Food Services | 19 (34.5%) | 36 (65.4%) |
| Public Administration | 13 (100.0%) | 0 (0.0%) |
| Total | 660 (53.2%) | 580 (46.8%) |
Education in Zellwood
School Enrollment in Zellwood
The most common levels of schooling among the 180 students in Zellwood are middle school (56 | 31.1%), high school (50 | 27.8%), and kindergarten (38 | 21.1%).
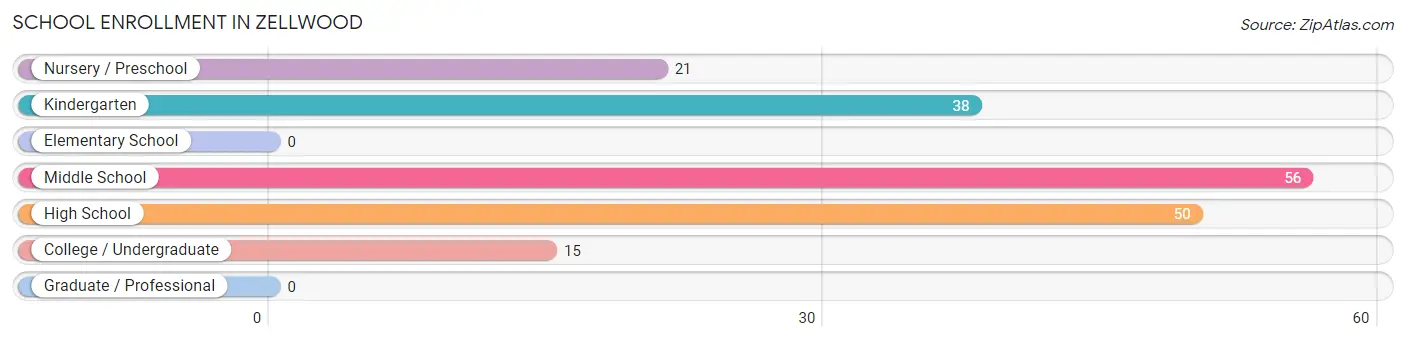
| School Level | # Students | % Students |
| Nursery / Preschool | 21 | 11.7% |
| Kindergarten | 38 | 21.1% |
| Elementary School | 0 | 0.0% |
| Middle School | 56 | 31.1% |
| High School | 50 | 27.8% |
| College / Undergraduate | 15 | 8.3% |
| Graduate / Professional | 0 | 0.0% |
| Total | 180 | 100.0% |
School Enrollment by Age by Funding Source in Zellwood
Out of a total of 180 students who are enrolled in schools in Zellwood, 88 (48.9%) attend a private institution, while the remaining 92 (51.1%) are enrolled in public schools. The age group of 15 to 17 year olds has the highest likelihood of being enrolled in private schools, with 50 (100.0% in the age bracket) enrolled. Conversely, the age group of 5 to 9 year old has the lowest likelihood of being enrolled in a private school, with 59 (100.0% in the age bracket) attending a public institution.
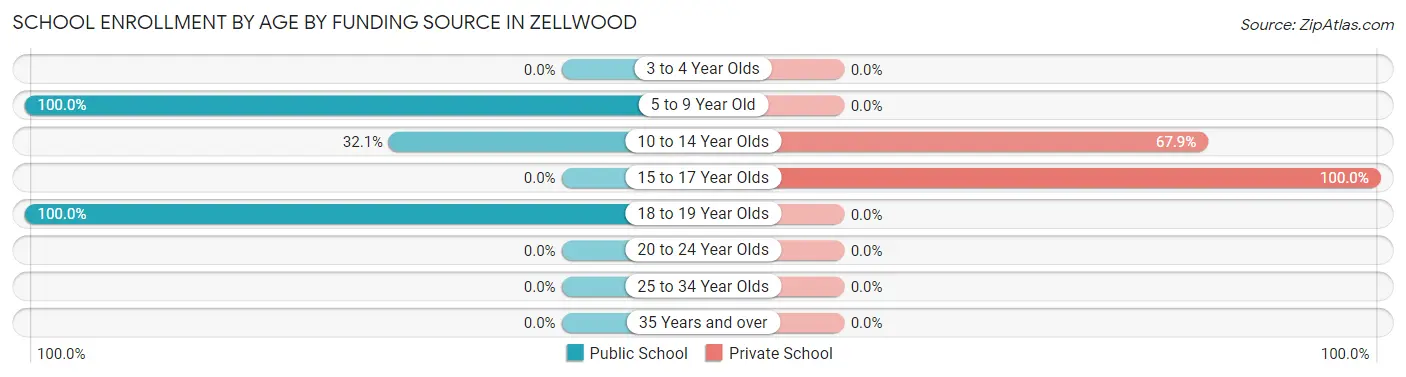
| Age Bracket | Public School | Private School |
| 3 to 4 Year Olds | 0 (0.0%) | 0 (0.0%) |
| 5 to 9 Year Old | 59 (100.0%) | 0 (0.0%) |
| 10 to 14 Year Olds | 18 (32.1%) | 38 (67.9%) |
| 15 to 17 Year Olds | 0 (0.0%) | 50 (100.0%) |
| 18 to 19 Year Olds | 15 (100.0%) | 0 (0.0%) |
| 20 to 24 Year Olds | 0 (0.0%) | 0 (0.0%) |
| 25 to 34 Year Olds | 0 (0.0%) | 0 (0.0%) |
| 35 Years and over | 0 (0.0%) | 0 (0.0%) |
| Total | 92 (51.1%) | 88 (48.9%) |
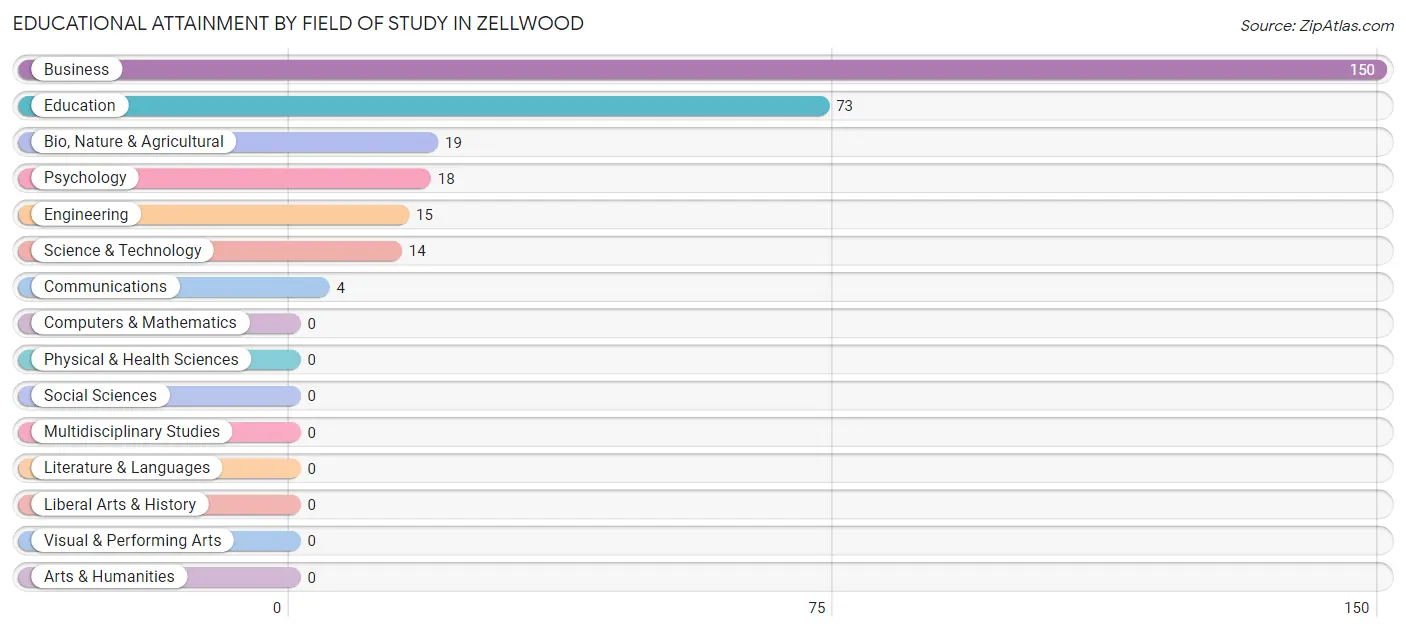
Educational Attainment by Field of Study in Zellwood
Business (150 | 51.2%), education (73 | 24.9%), bio, nature & agricultural (19 | 6.5%), psychology (18 | 6.1%), and engineering (15 | 5.1%) are the most common fields of study among 293 individuals in Zellwood who have obtained a bachelor's degree or higher.
| Field of Study | # Graduates | % Graduates |
| Computers & Mathematics | 0 | 0.0% |
| Bio, Nature & Agricultural | 19 | 6.5% |
| Physical & Health Sciences | 0 | 0.0% |
| Psychology | 18 | 6.1% |
| Social Sciences | 0 | 0.0% |
| Engineering | 15 | 5.1% |
| Multidisciplinary Studies | 0 | 0.0% |
| Science & Technology | 14 | 4.8% |
| Business | 150 | 51.2% |
| Education | 73 | 24.9% |
| Literature & Languages | 0 | 0.0% |
| Liberal Arts & History | 0 | 0.0% |
| Visual & Performing Arts | 0 | 0.0% |
| Communications | 4 | 1.4% |
| Arts & Humanities | 0 | 0.0% |
| Total | 293 | 100.0% |
Transportation & Commute in Zellwood
Vehicle Availability by Sex in Zellwood
The most prevalent vehicle ownership categories in Zellwood are males with 2 vehicles (404, accounting for 61.2%) and females with 2 vehicles (361, making up 69.7%).
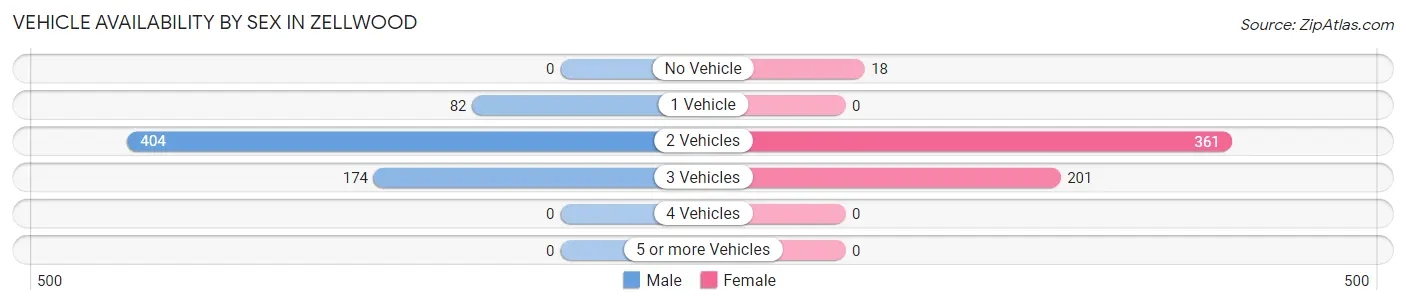
| Vehicles Available | Male | Female |
| No Vehicle | 0 (0.0%) | 18 (3.1%) |
| 1 Vehicle | 82 (12.4%) | 0 (0.0%) |
| 2 Vehicles | 404 (61.2%) | 361 (62.2%) |
| 3 Vehicles | 174 (26.4%) | 201 (34.7%) |
| 4 Vehicles | 0 (0.0%) | 0 (0.0%) |
| 5 or more Vehicles | 0 (0.0%) | 0 (0.0%) |
| Total | 660 (100.0%) | 580 (100.0%) |
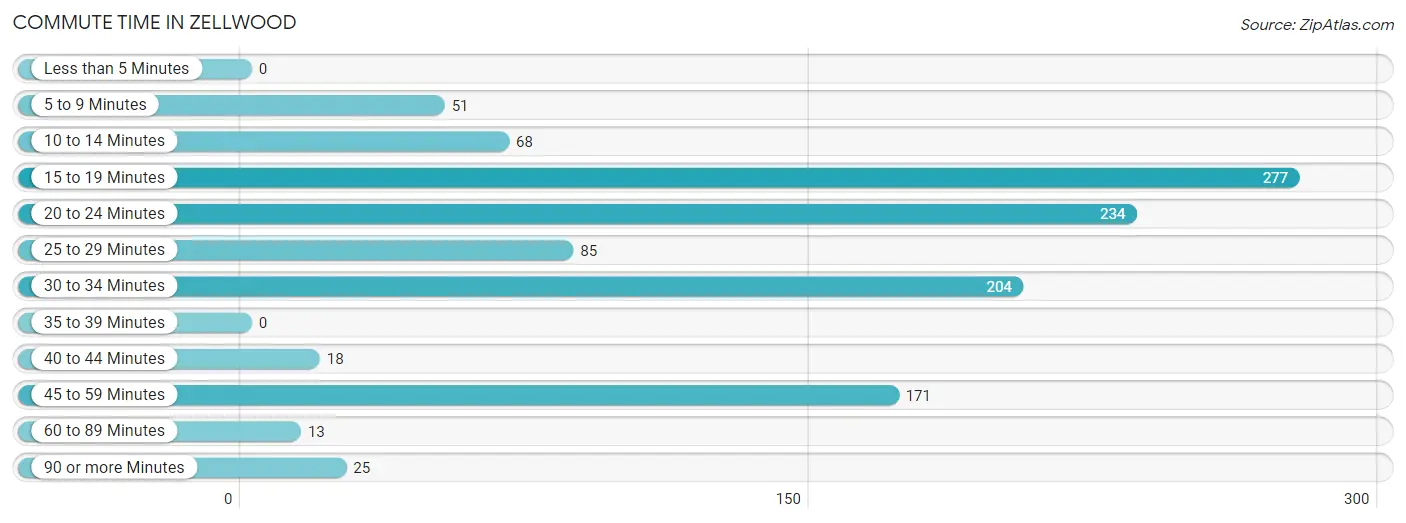
Commute Time in Zellwood
The most frequently occuring commute durations in Zellwood are 15 to 19 minutes (277 commuters, 24.2%), 20 to 24 minutes (234 commuters, 20.4%), and 30 to 34 minutes (204 commuters, 17.8%).
| Commute Time | # Commuters | % Commuters |
| Less than 5 Minutes | 0 | 0.0% |
| 5 to 9 Minutes | 51 | 4.4% |
| 10 to 14 Minutes | 68 | 5.9% |
| 15 to 19 Minutes | 277 | 24.2% |
| 20 to 24 Minutes | 234 | 20.4% |
| 25 to 29 Minutes | 85 | 7.4% |
| 30 to 34 Minutes | 204 | 17.8% |
| 35 to 39 Minutes | 0 | 0.0% |
| 40 to 44 Minutes | 18 | 1.6% |
| 45 to 59 Minutes | 171 | 14.9% |
| 60 to 89 Minutes | 13 | 1.1% |
| 90 or more Minutes | 25 | 2.2% |
Commute Time by Sex in Zellwood
The most common commute times in Zellwood are 15 to 19 minutes (135 commuters, 23.0%) for males and 30 to 34 minutes (157 commuters, 28.0%) for females.
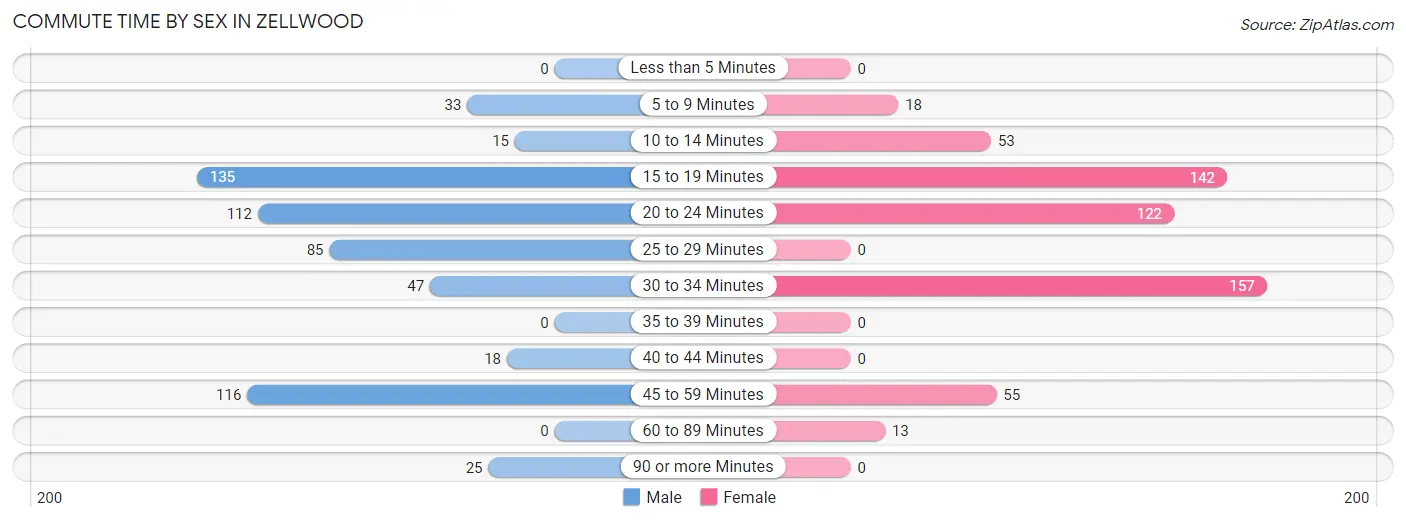
| Commute Time | Male | Female |
| Less than 5 Minutes | 0 (0.0%) | 0 (0.0%) |
| 5 to 9 Minutes | 33 (5.6%) | 18 (3.2%) |
| 10 to 14 Minutes | 15 (2.6%) | 53 (9.5%) |
| 15 to 19 Minutes | 135 (23.0%) | 142 (25.4%) |
| 20 to 24 Minutes | 112 (19.1%) | 122 (21.8%) |
| 25 to 29 Minutes | 85 (14.5%) | 0 (0.0%) |
| 30 to 34 Minutes | 47 (8.0%) | 157 (28.0%) |
| 35 to 39 Minutes | 0 (0.0%) | 0 (0.0%) |
| 40 to 44 Minutes | 18 (3.1%) | 0 (0.0%) |
| 45 to 59 Minutes | 116 (19.8%) | 55 (9.8%) |
| 60 to 89 Minutes | 0 (0.0%) | 13 (2.3%) |
| 90 or more Minutes | 25 (4.3%) | 0 (0.0%) |
Time of Departure to Work by Sex in Zellwood
The most frequent times of departure to work in Zellwood are 5:00 AM to 5:29 AM (123, 21.0%) for males and 9:00 AM to 9:59 AM (133, 23.7%) for females.
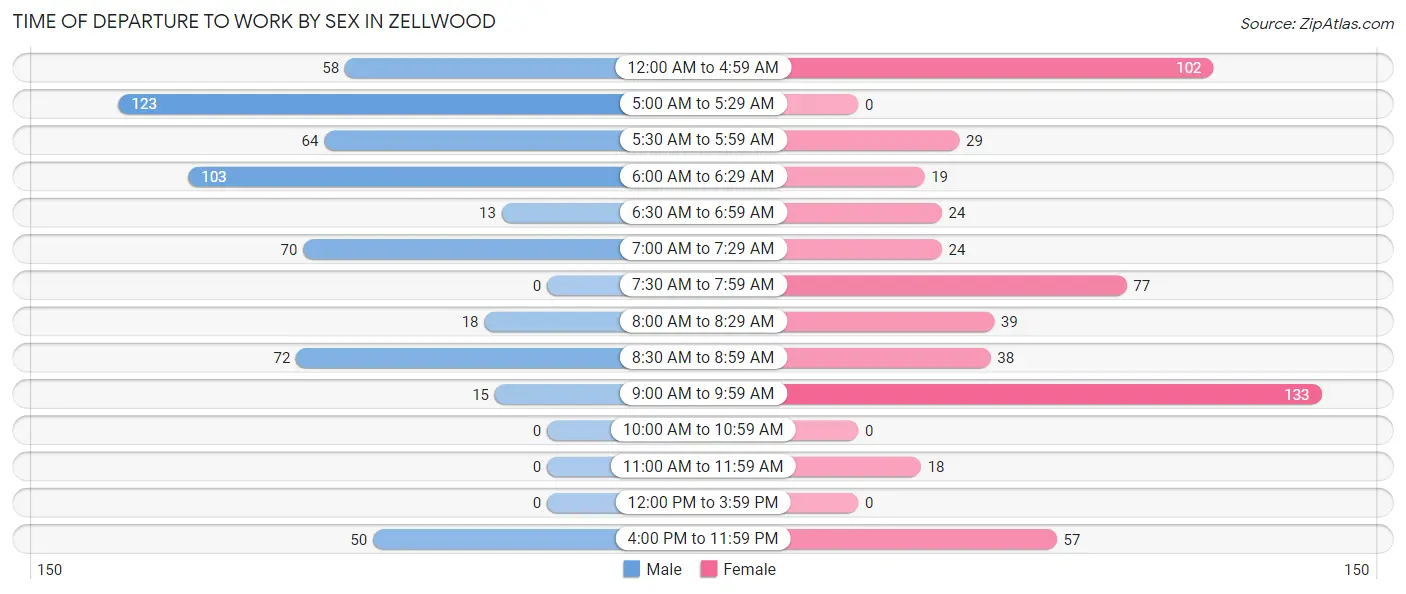
| Time of Departure | Male | Female |
| 12:00 AM to 4:59 AM | 58 (9.9%) | 102 (18.2%) |
| 5:00 AM to 5:29 AM | 123 (21.0%) | 0 (0.0%) |
| 5:30 AM to 5:59 AM | 64 (10.9%) | 29 (5.2%) |
| 6:00 AM to 6:29 AM | 103 (17.6%) | 19 (3.4%) |
| 6:30 AM to 6:59 AM | 13 (2.2%) | 24 (4.3%) |
| 7:00 AM to 7:29 AM | 70 (11.9%) | 24 (4.3%) |
| 7:30 AM to 7:59 AM | 0 (0.0%) | 77 (13.8%) |
| 8:00 AM to 8:29 AM | 18 (3.1%) | 39 (7.0%) |
| 8:30 AM to 8:59 AM | 72 (12.3%) | 38 (6.8%) |
| 9:00 AM to 9:59 AM | 15 (2.6%) | 133 (23.7%) |
| 10:00 AM to 10:59 AM | 0 (0.0%) | 0 (0.0%) |
| 11:00 AM to 11:59 AM | 0 (0.0%) | 18 (3.2%) |
| 12:00 PM to 3:59 PM | 0 (0.0%) | 0 (0.0%) |
| 4:00 PM to 11:59 PM | 50 (8.5%) | 57 (10.2%) |
| Total | 586 (100.0%) | 560 (100.0%) |
Housing Occupancy in Zellwood
Occupancy by Ownership in Zellwood
Of the total 1,399 dwellings in Zellwood, owner-occupied units account for 1,320 (94.4%), while renter-occupied units make up 79 (5.7%).
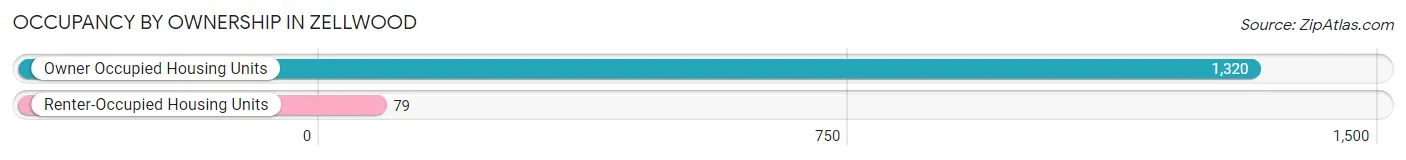
| Occupancy | # Housing Units | % Housing Units |
| Owner Occupied Housing Units | 1,320 | 94.4% |
| Renter-Occupied Housing Units | 79 | 5.7% |
| Total Occupied Housing Units | 1,399 | 100.0% |
Occupancy by Household Size in Zellwood
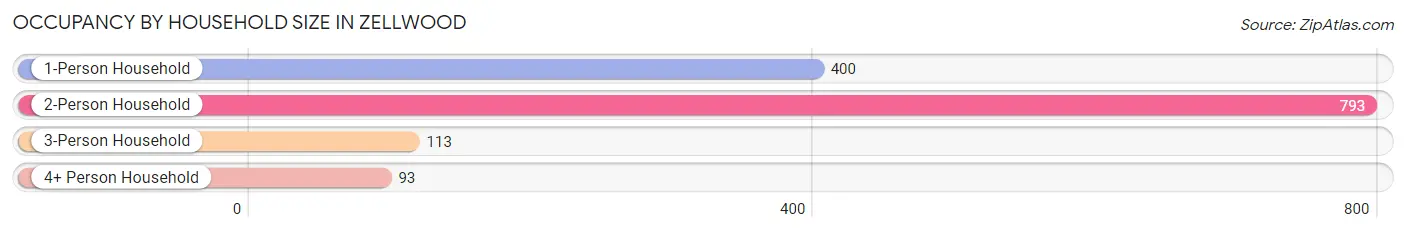
| Household Size | # Housing Units | % Housing Units |
| 1-Person Household | 400 | 28.6% |
| 2-Person Household | 793 | 56.7% |
| 3-Person Household | 113 | 8.1% |
| 4+ Person Household | 93 | 6.7% |
| Total Housing Units | 1,399 | 100.0% |
Occupancy by Ownership by Household Size in Zellwood
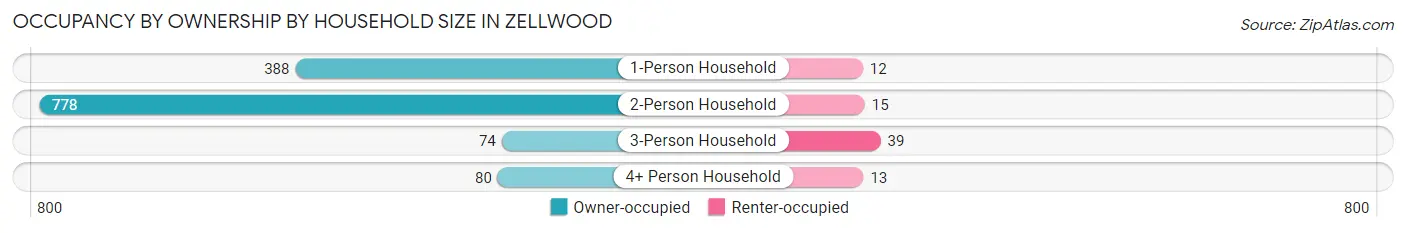
| Household Size | Owner-occupied | Renter-occupied |
| 1-Person Household | 388 (97.0%) | 12 (3.0%) |
| 2-Person Household | 778 (98.1%) | 15 (1.9%) |
| 3-Person Household | 74 (65.5%) | 39 (34.5%) |
| 4+ Person Household | 80 (86.0%) | 13 (14.0%) |
| Total Housing Units | 1,320 (94.4%) | 79 (5.7%) |
Occupancy by Educational Attainment in Zellwood
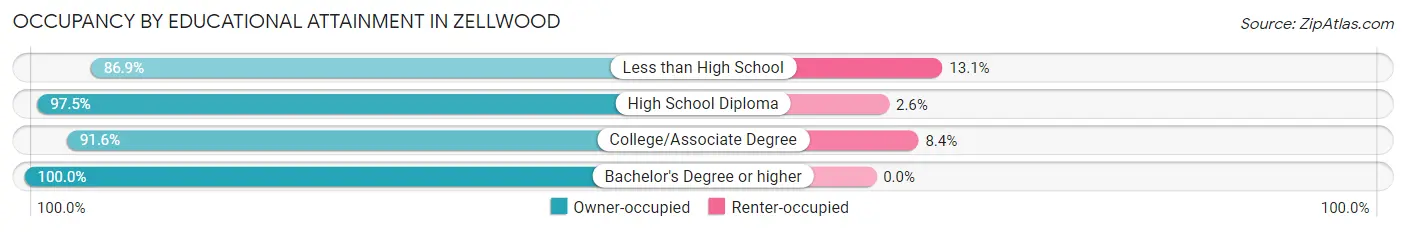
| Household Size | Owner-occupied | Renter-occupied |
| Less than High School | 86 (86.9%) | 13 (13.1%) |
| High School Diploma | 458 (97.5%) | 12 (2.5%) |
| College/Associate Degree | 590 (91.6%) | 54 (8.4%) |
| Bachelor's Degree or higher | 186 (100.0%) | 0 (0.0%) |
Occupancy by Age of Householder in Zellwood
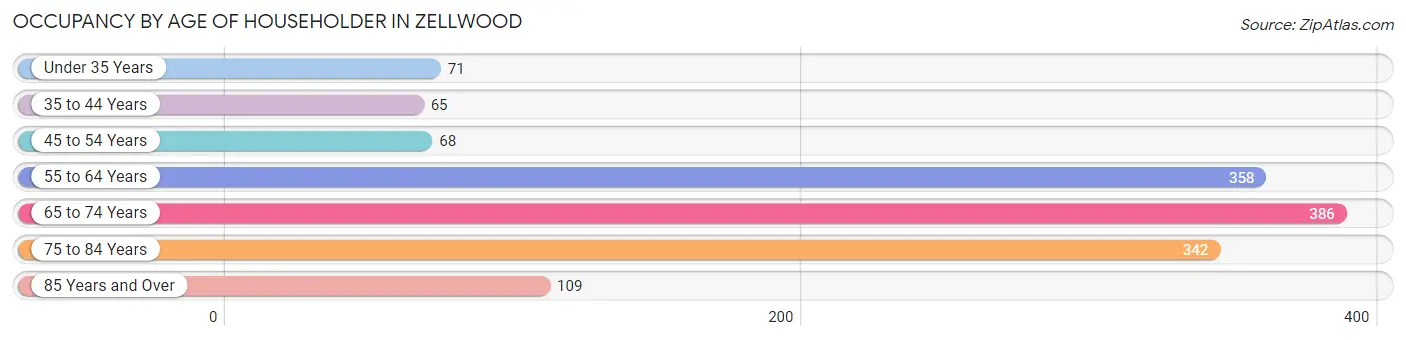
| Age Bracket | # Households | % Households |
| Under 35 Years | 71 | 5.1% |
| 35 to 44 Years | 65 | 4.6% |
| 45 to 54 Years | 68 | 4.9% |
| 55 to 64 Years | 358 | 25.6% |
| 65 to 74 Years | 386 | 27.6% |
| 75 to 84 Years | 342 | 24.4% |
| 85 Years and Over | 109 | 7.8% |
| Total | 1,399 | 100.0% |
Housing Finances in Zellwood
Median Income by Occupancy in Zellwood
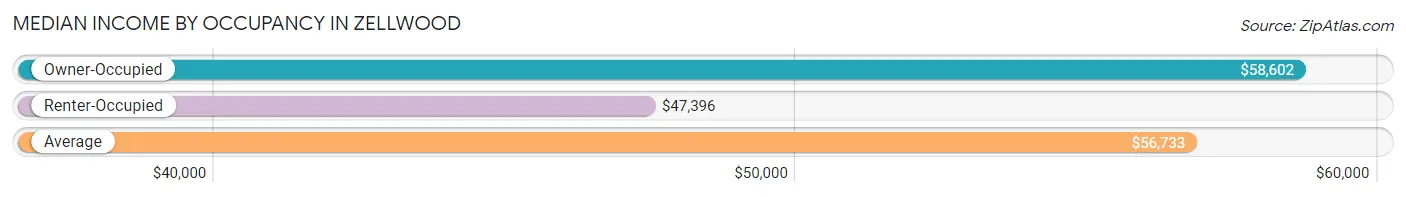
| Occupancy Type | # Households | Median Income |
| Owner-Occupied | 1,320 (94.4%) | $58,602 |
| Renter-Occupied | 79 (5.7%) | $47,396 |
| Average | 1,399 (100.0%) | $56,733 |
Occupancy by Householder Income Bracket in Zellwood
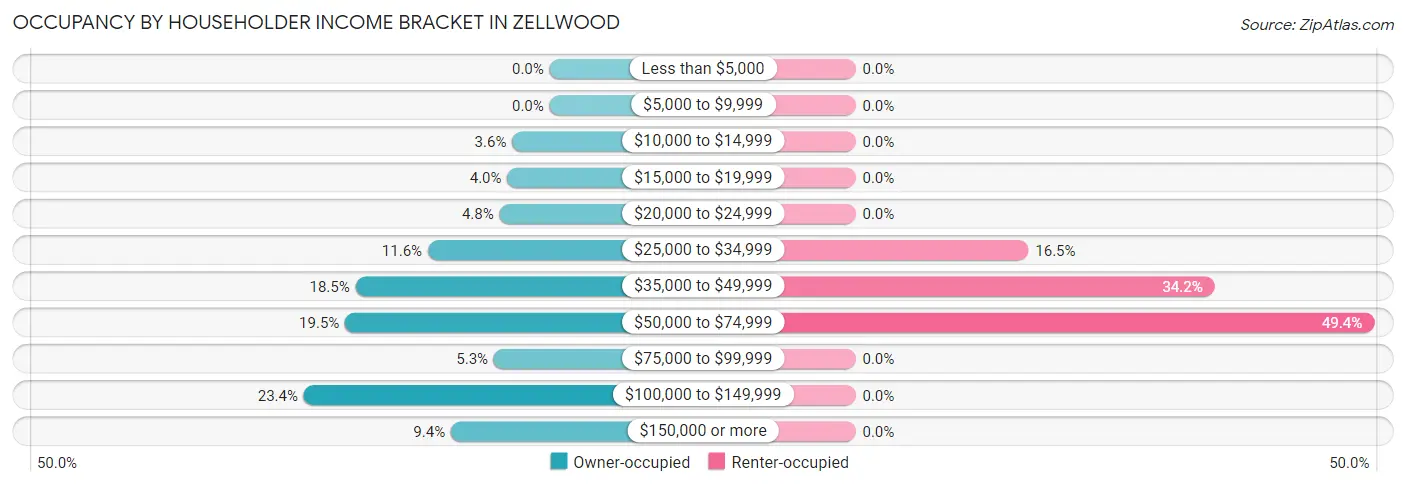
| Income Bracket | Owner-occupied | Renter-occupied |
| Less than $5,000 | 0 (0.0%) | 0 (0.0%) |
| $5,000 to $9,999 | 0 (0.0%) | 0 (0.0%) |
| $10,000 to $14,999 | 47 (3.6%) | 0 (0.0%) |
| $15,000 to $19,999 | 53 (4.0%) | 0 (0.0%) |
| $20,000 to $24,999 | 63 (4.8%) | 0 (0.0%) |
| $25,000 to $34,999 | 153 (11.6%) | 13 (16.5%) |
| $35,000 to $49,999 | 244 (18.5%) | 27 (34.2%) |
| $50,000 to $74,999 | 257 (19.5%) | 39 (49.4%) |
| $75,000 to $99,999 | 70 (5.3%) | 0 (0.0%) |
| $100,000 to $149,999 | 309 (23.4%) | 0 (0.0%) |
| $150,000 or more | 124 (9.4%) | 0 (0.0%) |
| Total | 1,320 (100.0%) | 79 (100.0%) |
Monthly Housing Cost Tiers in Zellwood
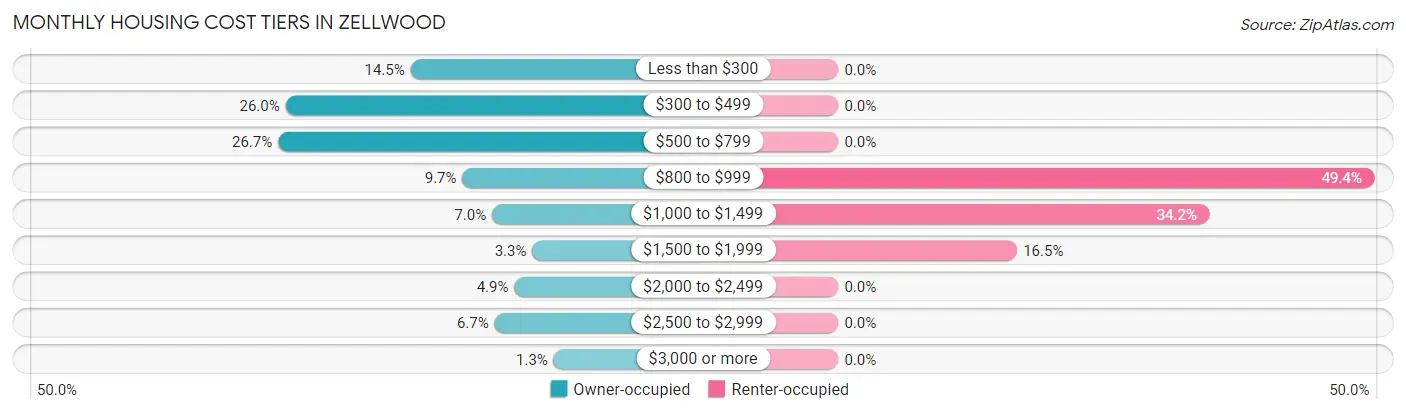
| Monthly Cost | Owner-occupied | Renter-occupied |
| Less than $300 | 191 (14.5%) | 0 (0.0%) |
| $300 to $499 | 343 (26.0%) | 0 (0.0%) |
| $500 to $799 | 352 (26.7%) | 0 (0.0%) |
| $800 to $999 | 128 (9.7%) | 39 (49.4%) |
| $1,000 to $1,499 | 92 (7.0%) | 27 (34.2%) |
| $1,500 to $1,999 | 43 (3.3%) | 13 (16.5%) |
| $2,000 to $2,499 | 65 (4.9%) | 0 (0.0%) |
| $2,500 to $2,999 | 89 (6.7%) | 0 (0.0%) |
| $3,000 or more | 17 (1.3%) | 0 (0.0%) |
| Total | 1,320 (100.0%) | 79 (100.0%) |
Physical Housing Characteristics in Zellwood
Housing Structures in Zellwood
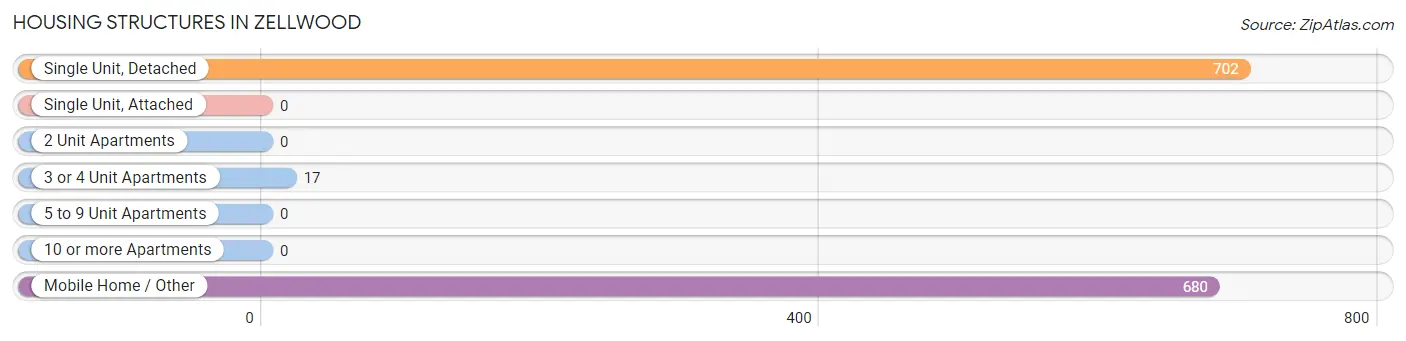
| Structure Type | # Housing Units | % Housing Units |
| Single Unit, Detached | 702 | 50.2% |
| Single Unit, Attached | 0 | 0.0% |
| 2 Unit Apartments | 0 | 0.0% |
| 3 or 4 Unit Apartments | 17 | 1.2% |
| 5 to 9 Unit Apartments | 0 | 0.0% |
| 10 or more Apartments | 0 | 0.0% |
| Mobile Home / Other | 680 | 48.6% |
| Total | 1,399 | 100.0% |
Housing Structures by Occupancy in Zellwood
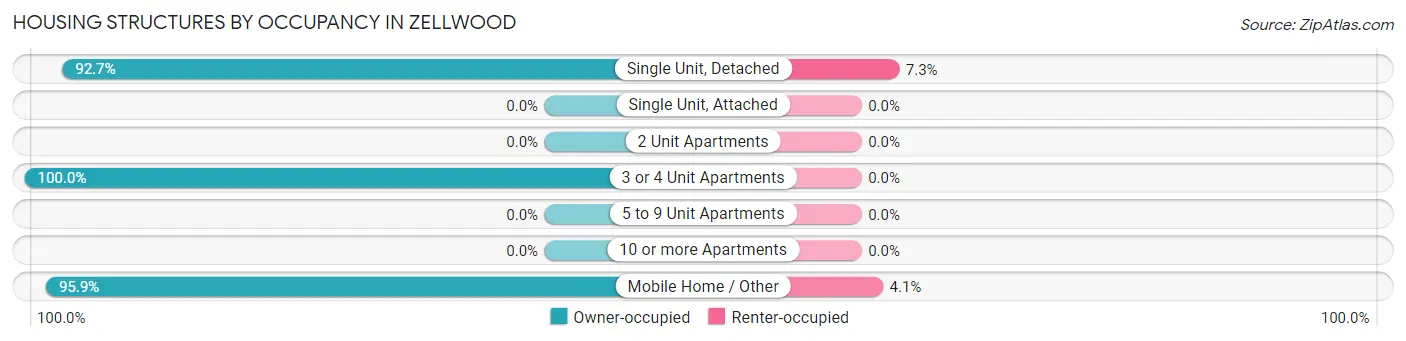
| Structure Type | Owner-occupied | Renter-occupied |
| Single Unit, Detached | 651 (92.7%) | 51 (7.3%) |
| Single Unit, Attached | 0 (0.0%) | 0 (0.0%) |
| 2 Unit Apartments | 0 (0.0%) | 0 (0.0%) |
| 3 or 4 Unit Apartments | 17 (100.0%) | 0 (0.0%) |
| 5 to 9 Unit Apartments | 0 (0.0%) | 0 (0.0%) |
| 10 or more Apartments | 0 (0.0%) | 0 (0.0%) |
| Mobile Home / Other | 652 (95.9%) | 28 (4.1%) |
| Total | 1,320 (94.4%) | 79 (5.7%) |
Housing Structures by Number of Rooms in Zellwood
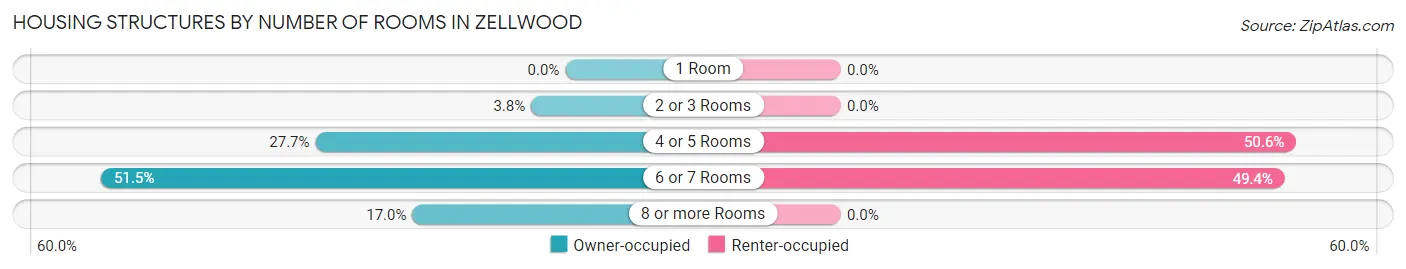
| Number of Rooms | Owner-occupied | Renter-occupied |
| 1 Room | 0 (0.0%) | 0 (0.0%) |
| 2 or 3 Rooms | 50 (3.8%) | 0 (0.0%) |
| 4 or 5 Rooms | 366 (27.7%) | 40 (50.6%) |
| 6 or 7 Rooms | 680 (51.5%) | 39 (49.4%) |
| 8 or more Rooms | 224 (17.0%) | 0 (0.0%) |
| Total | 1,320 (100.0%) | 79 (100.0%) |
Housing Structure by Heating Type in Zellwood
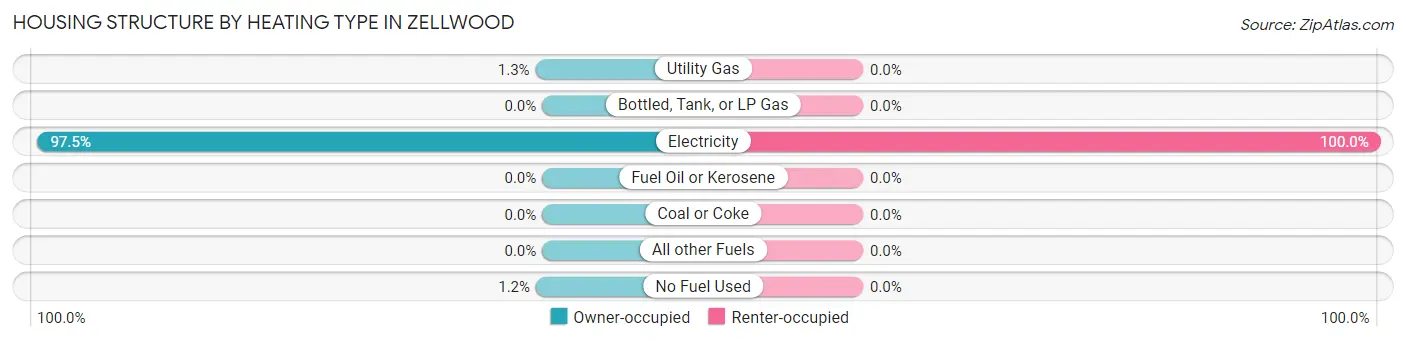
| Heating Type | Owner-occupied | Renter-occupied |
| Utility Gas | 17 (1.3%) | 0 (0.0%) |
| Bottled, Tank, or LP Gas | 0 (0.0%) | 0 (0.0%) |
| Electricity | 1,287 (97.5%) | 79 (100.0%) |
| Fuel Oil or Kerosene | 0 (0.0%) | 0 (0.0%) |
| Coal or Coke | 0 (0.0%) | 0 (0.0%) |
| All other Fuels | 0 (0.0%) | 0 (0.0%) |
| No Fuel Used | 16 (1.2%) | 0 (0.0%) |
| Total | 1,320 (100.0%) | 79 (100.0%) |
Household Vehicle Usage in Zellwood
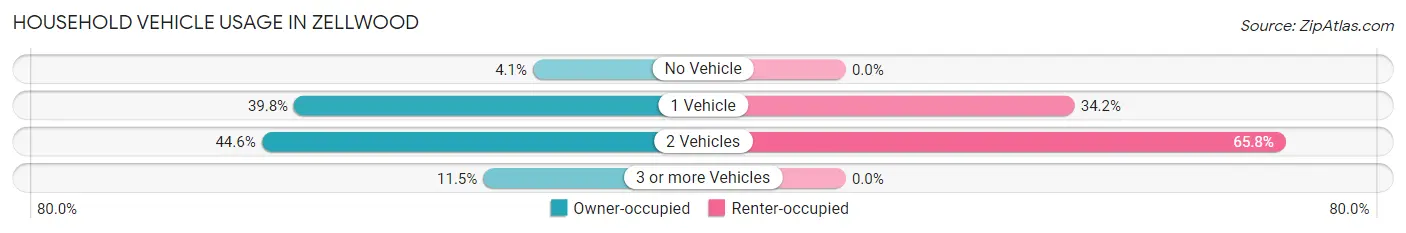
| Vehicles per Household | Owner-occupied | Renter-occupied |
| No Vehicle | 54 (4.1%) | 0 (0.0%) |
| 1 Vehicle | 525 (39.8%) | 27 (34.2%) |
| 2 Vehicles | 589 (44.6%) | 52 (65.8%) |
| 3 or more Vehicles | 152 (11.5%) | 0 (0.0%) |
| Total | 1,320 (100.0%) | 79 (100.0%) |
Real Estate & Mortgages in Zellwood
Real Estate and Mortgage Overview in Zellwood
| Characteristic | Without Mortgage | With Mortgage |
| Housing Units | 951 | 369 |
| Median Property Value | $133,500 | $219,500 |
| Median Household Income | $51,797 | $85 |
| Monthly Housing Costs | $470 | $4 |
| Real Estate Taxes | $677 | $0 |
Property Value by Mortgage Status in Zellwood
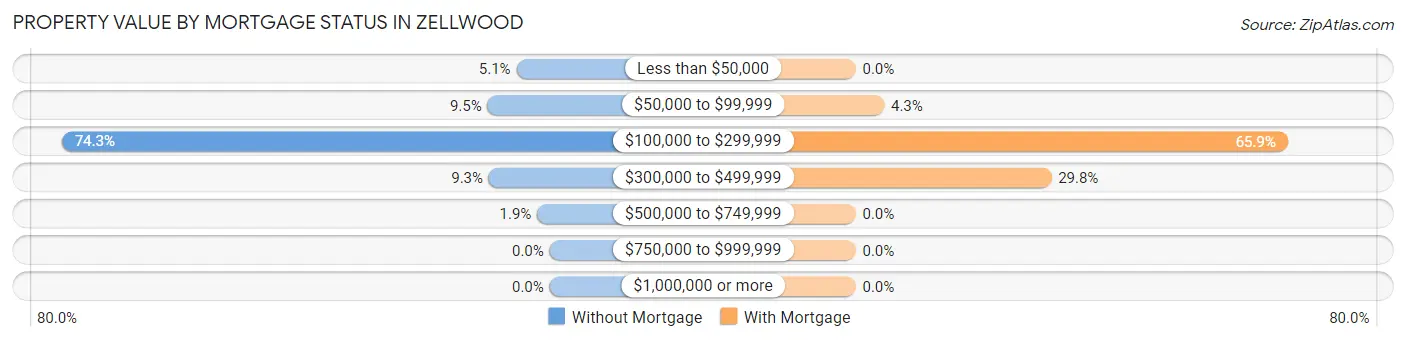
| Property Value | Without Mortgage | With Mortgage |
| Less than $50,000 | 48 (5.1%) | 0 (0.0%) |
| $50,000 to $99,999 | 90 (9.5%) | 16 (4.3%) |
| $100,000 to $299,999 | 707 (74.3%) | 243 (65.8%) |
| $300,000 to $499,999 | 88 (9.2%) | 110 (29.8%) |
| $500,000 to $749,999 | 18 (1.9%) | 0 (0.0%) |
| $750,000 to $999,999 | 0 (0.0%) | 0 (0.0%) |
| $1,000,000 or more | 0 (0.0%) | 0 (0.0%) |
| Total | 951 (100.0%) | 369 (100.0%) |
Household Income by Mortgage Status in Zellwood
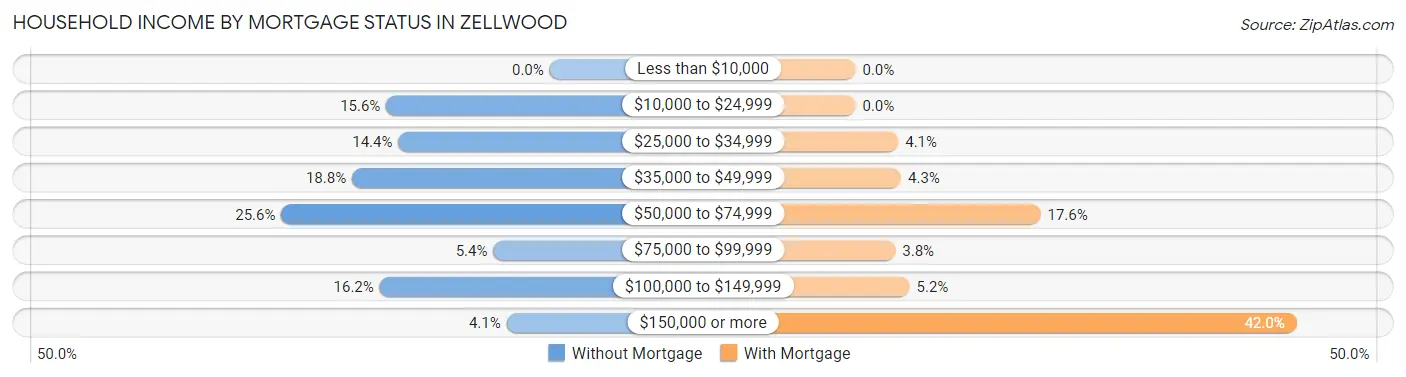
| Household Income | Without Mortgage | With Mortgage |
| Less than $10,000 | 0 (0.0%) | 0 (0.0%) |
| $10,000 to $24,999 | 148 (15.6%) | 0 (0.0%) |
| $25,000 to $34,999 | 137 (14.4%) | 15 (4.1%) |
| $35,000 to $49,999 | 179 (18.8%) | 16 (4.3%) |
| $50,000 to $74,999 | 243 (25.6%) | 65 (17.6%) |
| $75,000 to $99,999 | 51 (5.4%) | 14 (3.8%) |
| $100,000 to $149,999 | 154 (16.2%) | 19 (5.1%) |
| $150,000 or more | 39 (4.1%) | 155 (42.0%) |
| Total | 951 (100.0%) | 369 (100.0%) |
Property Value to Household Income Ratio in Zellwood
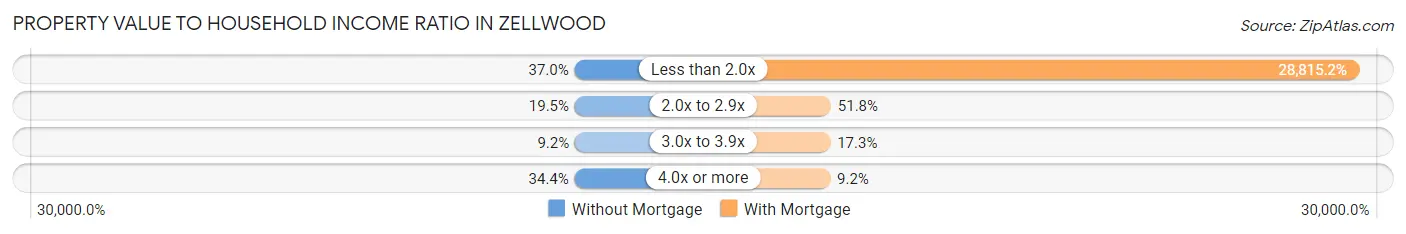
| Value-to-Income Ratio | Without Mortgage | With Mortgage |
| Less than 2.0x | 352 (37.0%) | 106,328 (28,815.2%) |
| 2.0x to 2.9x | 185 (19.5%) | 191 (51.8%) |
| 3.0x to 3.9x | 87 (9.1%) | 64 (17.3%) |
| 4.0x or more | 327 (34.4%) | 34 (9.2%) |
| Total | 951 (100.0%) | 369 (100.0%) |
Real Estate Taxes by Mortgage Status in Zellwood
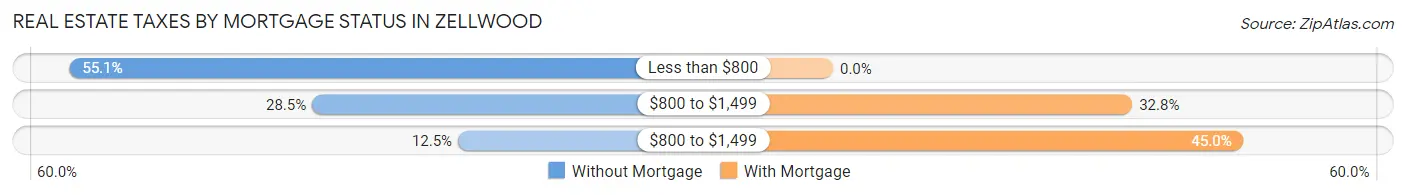
| Property Taxes | Without Mortgage | With Mortgage |
| Less than $800 | 524 (55.1%) | 0 (0.0%) |
| $800 to $1,499 | 271 (28.5%) | 121 (32.8%) |
| $800 to $1,499 | 119 (12.5%) | 166 (45.0%) |
| Total | 951 (100.0%) | 369 (100.0%) |
Health & Disability in Zellwood
Health Insurance Coverage by Age in Zellwood
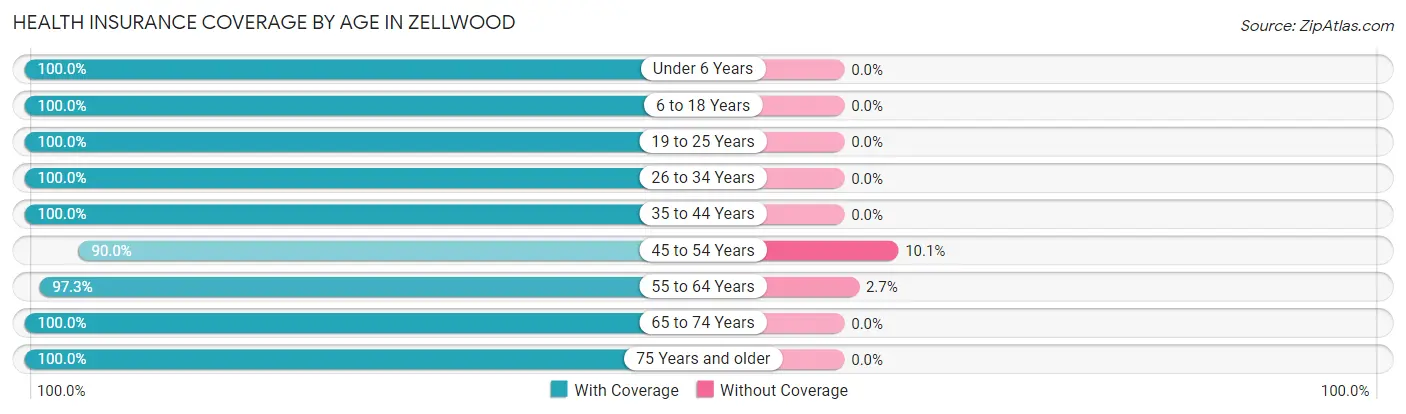
| Age Bracket | With Coverage | Without Coverage |
| Under 6 Years | 95 (100.0%) | 0 (0.0%) |
| 6 to 18 Years | 159 (100.0%) | 0 (0.0%) |
| 19 to 25 Years | 56 (100.0%) | 0 (0.0%) |
| 26 to 34 Years | 131 (100.0%) | 0 (0.0%) |
| 35 to 44 Years | 166 (100.0%) | 0 (0.0%) |
| 45 to 54 Years | 179 (89.9%) | 20 (10.1%) |
| 55 to 64 Years | 711 (97.3%) | 20 (2.7%) |
| 65 to 74 Years | 692 (100.0%) | 0 (0.0%) |
| 75 Years and older | 621 (100.0%) | 0 (0.0%) |
| Total | 2,810 (98.6%) | 40 (1.4%) |
Health Insurance Coverage by Citizenship Status in Zellwood
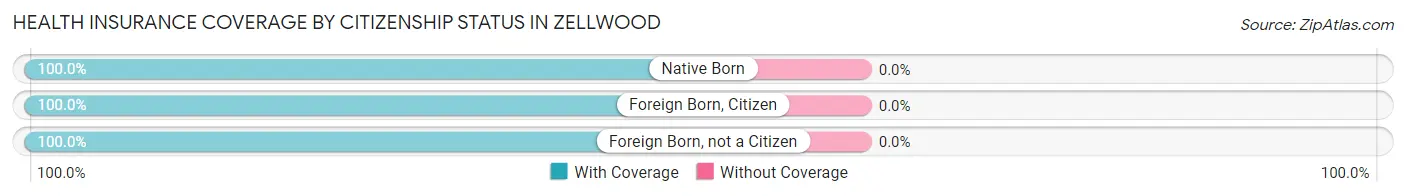
| Citizenship Status | With Coverage | Without Coverage |
| Native Born | 95 (100.0%) | 0 (0.0%) |
| Foreign Born, Citizen | 159 (100.0%) | 0 (0.0%) |
| Foreign Born, not a Citizen | 56 (100.0%) | 0 (0.0%) |
Health Insurance Coverage by Household Income in Zellwood
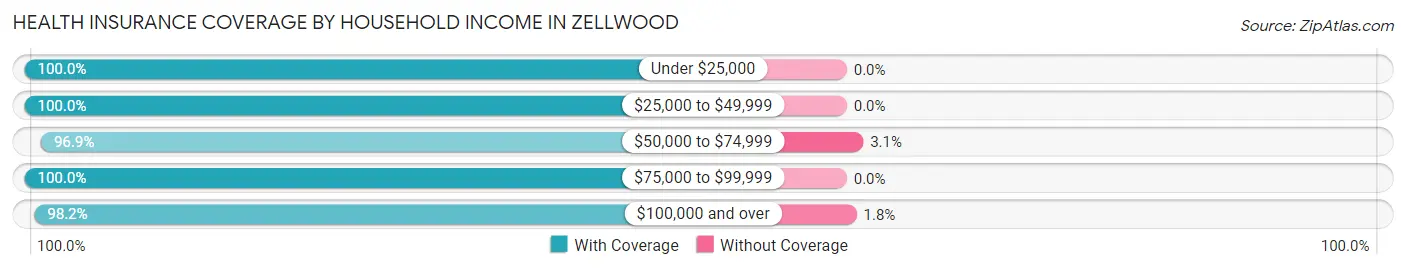
| Household Income | With Coverage | Without Coverage |
| Under $25,000 | 173 (100.0%) | 0 (0.0%) |
| $25,000 to $49,999 | 734 (100.0%) | 0 (0.0%) |
| $50,000 to $74,999 | 630 (96.9%) | 20 (3.1%) |
| $75,000 to $99,999 | 201 (100.0%) | 0 (0.0%) |
| $100,000 and over | 1,067 (98.2%) | 20 (1.8%) |
Public vs Private Health Insurance Coverage by Age in Zellwood
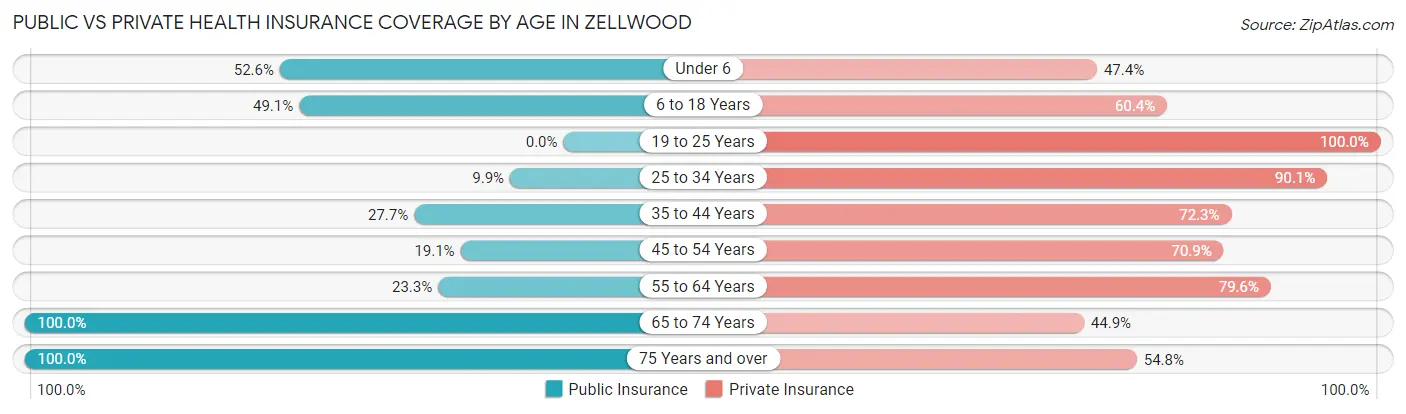
| Age Bracket | Public Insurance | Private Insurance |
| Under 6 | 50 (52.6%) | 45 (47.4%) |
| 6 to 18 Years | 78 (49.1%) | 96 (60.4%) |
| 19 to 25 Years | 0 (0.0%) | 56 (100.0%) |
| 25 to 34 Years | 13 (9.9%) | 118 (90.1%) |
| 35 to 44 Years | 46 (27.7%) | 120 (72.3%) |
| 45 to 54 Years | 38 (19.1%) | 141 (70.9%) |
| 55 to 64 Years | 170 (23.3%) | 582 (79.6%) |
| 65 to 74 Years | 692 (100.0%) | 311 (44.9%) |
| 75 Years and over | 621 (100.0%) | 340 (54.7%) |
| Total | 1,708 (59.9%) | 1,809 (63.5%) |
Disability Status by Sex by Age in Zellwood
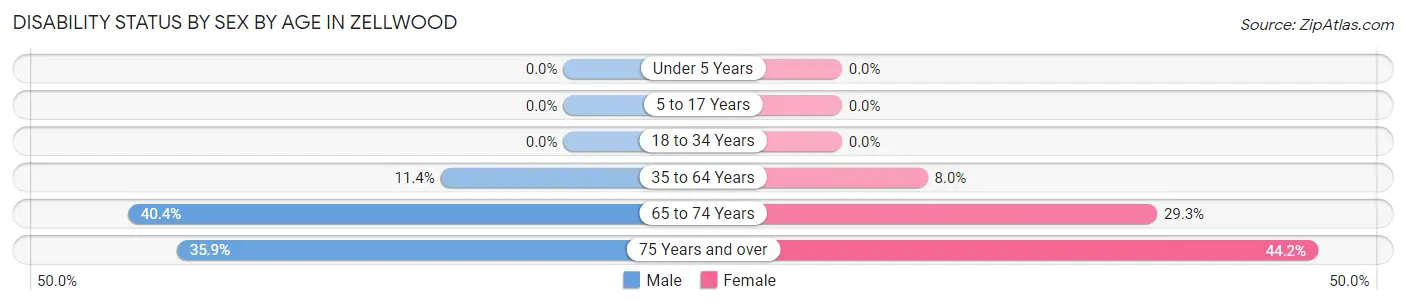
| Age Bracket | Male | Female |
| Under 5 Years | 0 (0.0%) | 0 (0.0%) |
| 5 to 17 Years | 0 (0.0%) | 0 (0.0%) |
| 18 to 34 Years | 0 (0.0%) | 0 (0.0%) |
| 35 to 64 Years | 69 (11.4%) | 39 (8.0%) |
| 65 to 74 Years | 118 (40.4%) | 117 (29.2%) |
| 75 Years and over | 118 (35.9%) | 129 (44.2%) |
Disability Class by Sex by Age in Zellwood
Disability Class: Hearing Difficulty
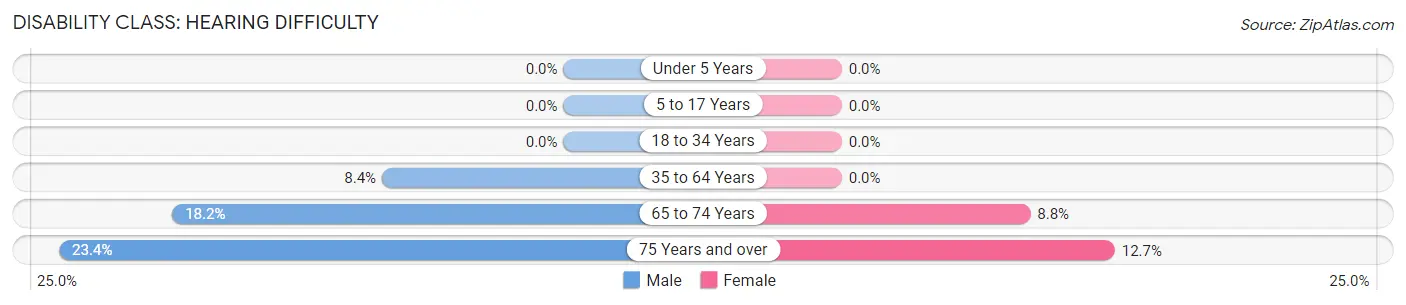
| Age Bracket | Male | Female |
| Under 5 Years | 0 (0.0%) | 0 (0.0%) |
| 5 to 17 Years | 0 (0.0%) | 0 (0.0%) |
| 18 to 34 Years | 0 (0.0%) | 0 (0.0%) |
| 35 to 64 Years | 51 (8.4%) | 0 (0.0%) |
| 65 to 74 Years | 53 (18.1%) | 35 (8.7%) |
| 75 Years and over | 77 (23.4%) | 37 (12.7%) |
Disability Class: Vision Difficulty
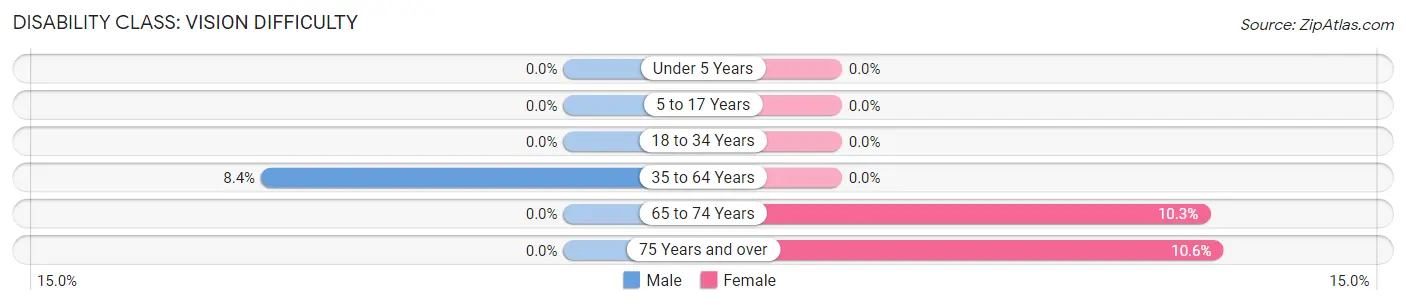
| Age Bracket | Male | Female |
| Under 5 Years | 0 (0.0%) | 0 (0.0%) |
| 5 to 17 Years | 0 (0.0%) | 0 (0.0%) |
| 18 to 34 Years | 0 (0.0%) | 0 (0.0%) |
| 35 to 64 Years | 51 (8.4%) | 0 (0.0%) |
| 65 to 74 Years | 0 (0.0%) | 41 (10.2%) |
| 75 Years and over | 0 (0.0%) | 31 (10.6%) |
Disability Class: Cognitive Difficulty
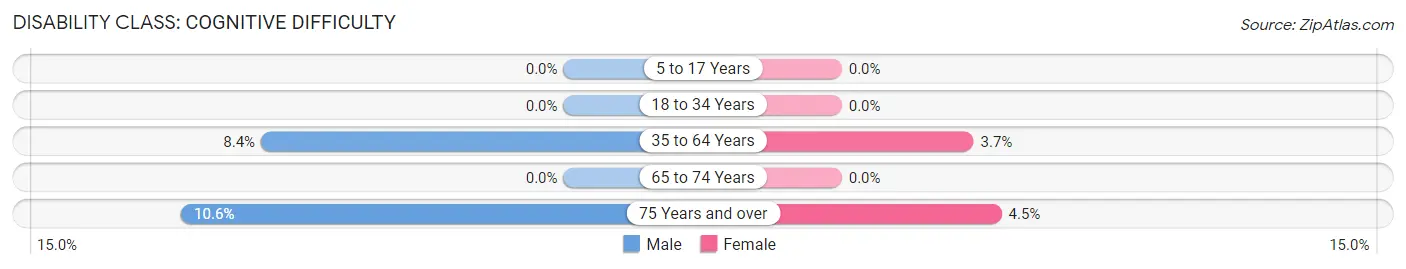
| Age Bracket | Male | Female |
| 5 to 17 Years | 0 (0.0%) | 0 (0.0%) |
| 18 to 34 Years | 0 (0.0%) | 0 (0.0%) |
| 35 to 64 Years | 51 (8.4%) | 18 (3.7%) |
| 65 to 74 Years | 0 (0.0%) | 0 (0.0%) |
| 75 Years and over | 35 (10.6%) | 13 (4.4%) |
Disability Class: Ambulatory Difficulty
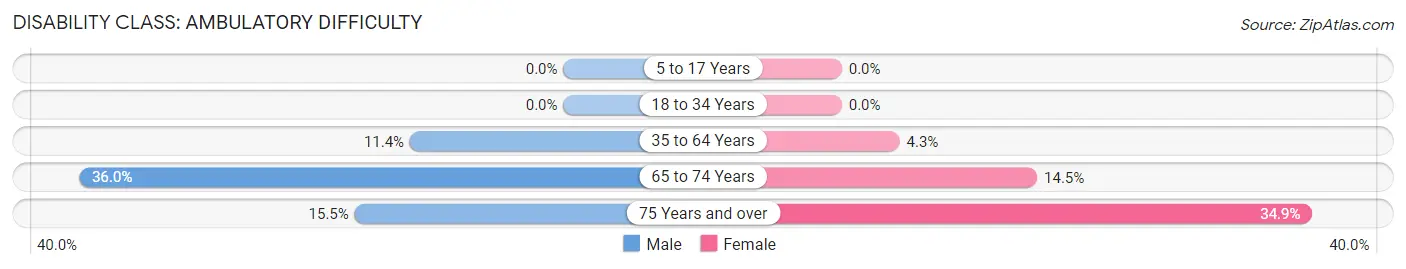
| Age Bracket | Male | Female |
| 5 to 17 Years | 0 (0.0%) | 0 (0.0%) |
| 18 to 34 Years | 0 (0.0%) | 0 (0.0%) |
| 35 to 64 Years | 69 (11.4%) | 21 (4.3%) |
| 65 to 74 Years | 105 (36.0%) | 58 (14.5%) |
| 75 Years and over | 51 (15.5%) | 102 (34.9%) |
Disability Class: Self-Care Difficulty
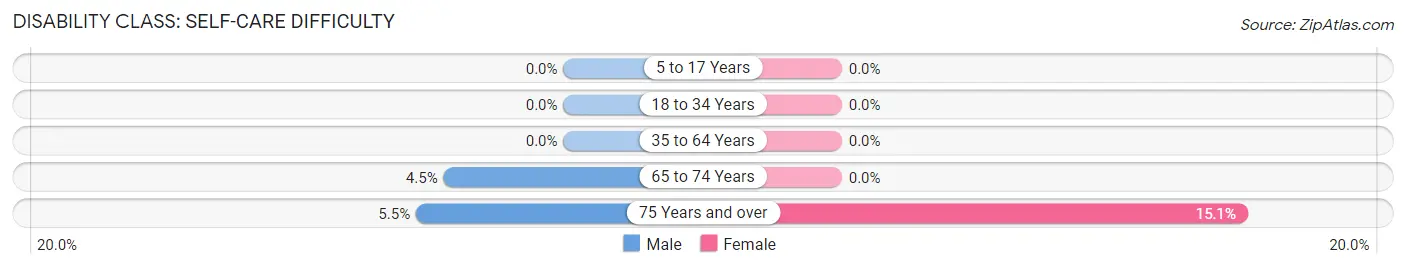
| Age Bracket | Male | Female |
| 5 to 17 Years | 0 (0.0%) | 0 (0.0%) |
| 18 to 34 Years | 0 (0.0%) | 0 (0.0%) |
| 35 to 64 Years | 0 (0.0%) | 0 (0.0%) |
| 65 to 74 Years | 13 (4.4%) | 0 (0.0%) |
| 75 Years and over | 18 (5.5%) | 44 (15.1%) |
Technology Access in Zellwood
Computing Device Access in Zellwood
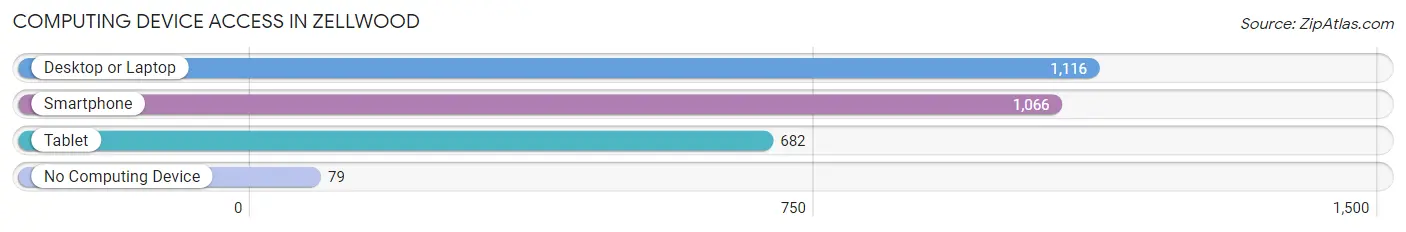
| Device Type | # Households | % Households |
| Desktop or Laptop | 1,116 | 79.8% |
| Smartphone | 1,066 | 76.2% |
| Tablet | 682 | 48.7% |
| No Computing Device | 79 | 5.7% |
| Total | 1,399 | 100.0% |
Internet Access in Zellwood
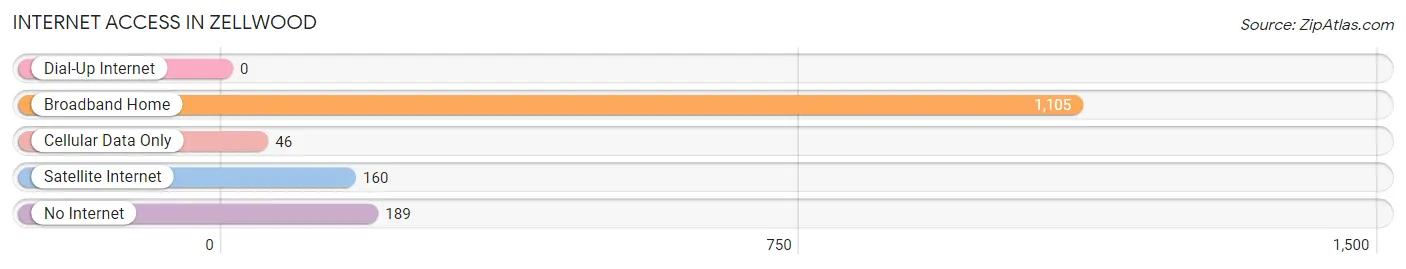
| Internet Type | # Households | % Households |
| Dial-Up Internet | 0 | 0.0% |
| Broadband Home | 1,105 | 79.0% |
| Cellular Data Only | 46 | 3.3% |
| Satellite Internet | 160 | 11.4% |
| No Internet | 189 | 13.5% |
| Total | 1,399 | 100.0% |
Zellwood Summary
Zellwood is a small unincorporated community located in Orange County, Florida, United States. It is situated in the northwest corner of the county, approximately 25 miles northwest of downtown Orlando. The population of Zellwood was estimated to be 2,845 in 2019.
History
The area that is now Zellwood was originally inhabited by the Seminole Indians. The first settlers in the area were the Zell family, who arrived in the late 1800s. The family purchased a large tract of land and established a citrus grove. The area was named Zellwood in honor of the family.
In the early 1900s, the area began to grow as more settlers moved in and established farms and businesses. The first post office was established in 1915. In the 1920s, the area began to develop as a tourist destination, with the opening of several hotels and resorts.
Geography
Zellwood is located in the northwest corner of Orange County, Florida. It is situated on the northern shore of Lake Apopka, approximately 25 miles northwest of downtown Orlando. The area is mostly flat, with an elevation of approximately 50 feet above sea level.
The climate in Zellwood is subtropical, with hot, humid summers and mild winters. The average annual temperature is 73 degrees Fahrenheit, with an average high of 87 degrees in the summer and an average low of 59 degrees in the winter.
Economy
The economy of Zellwood is largely based on agriculture and tourism. The area is home to several citrus groves, as well as a number of farms that produce vegetables, fruits, and other crops. Tourism is also an important part of the local economy, with several hotels and resorts located in the area.
Demographics
As of 2019, the population of Zellwood was estimated to be 2,845. The population is predominantly white (90.3%), with a small percentage of African Americans (4.2%) and Hispanics (3.2%). The median household income is $45,845, and the median home value is $179,000.
Conclusion
Zellwood is a small unincorporated community located in Orange County, Florida. It has a long history, dating back to the late 1800s when the Zell family first settled in the area. The economy of Zellwood is largely based on agriculture and tourism, and the population is predominantly white. With its subtropical climate and proximity to Orlando, Zellwood is an attractive destination for tourists and residents alike.
Common Questions
What is the Total Population of Zellwood?
Total Population of Zellwood is 2,850.
What is the Total Male Population of Zellwood?
Total Male Population of Zellwood is 1,388.
What is the Total Female Population of Zellwood?
Total Female Population of Zellwood is 1,462.
What is the Ratio of Males per 100 Females in Zellwood?
There are 94.94 Males per 100 Females in Zellwood.
What is the Ratio of Females per 100 Males in Zellwood?
There are 105.33 Females per 100 Males in Zellwood.
What is the Median Population Age in Zellwood?
Median Population Age in Zellwood is 62.9 Years.
What is the Average Family Size in Zellwood
Average Family Size in Zellwood is 2.5 People.
What is the Average Household Size in Zellwood
Average Household Size in Zellwood is 2.0 People.
What is Per Capita Income in Zellwood?
Per Capita income in Zellwood is $38,980.
What is the Median Family Income in Zellwood?
Median Family Income in Zellwood is $70,078.
What is the Median Household income in Zellwood?
Median Household Income in Zellwood is $56,733.
What is Income or Wage Gap in Zellwood?
Income or Wage Gap in Zellwood is 45.2%.
Women in Zellwood earn 54.8 cents for every dollar earned by a man.
What is Inequality or Gini Index in Zellwood?
Inequality or Gini Index in Zellwood is 0.40.
How Large is the Labor Force in Zellwood?
There are 1,243 People in the Labor Forcein in Zellwood.
What is the Percentage of People in the Labor Force in Zellwood?
47.6% of People are in the Labor Force in Zellwood.
What is the Unemployment Rate in Zellwood?
Unemployment Rate in Zellwood is 0.3%.