Sanibel, FL
Sanibel Map
Sanibel Overview
6,420
TOTAL POPULATION
3,060
MALE POPULATION
3,360
FEMALE POPULATION
91.07
MALES / 100 FEMALES
109.80
FEMALES / 100 MALES
68.6
MEDIAN AGE
2.2
AVG FAMILY SIZE
1.8
AVG HOUSEHOLD SIZE
$114,484
PER CAPITA INCOME
$153,287
AVG FAMILY INCOME
$111,683
AVG HOUSEHOLD INCOME
43.8%
WAGE / INCOME GAP [ % ]
56.2¢/ $1
WAGE / INCOME GAP [ $ ]
0.59
INEQUALITY / GINI INDEX
2,088
LABOR FORCE [ PEOPLE ]
33.2%
PERCENT IN LABOR FORCE
4.6%
UNEMPLOYMENT RATE
Sanibel Zip Codes
Sanibel Area Codes
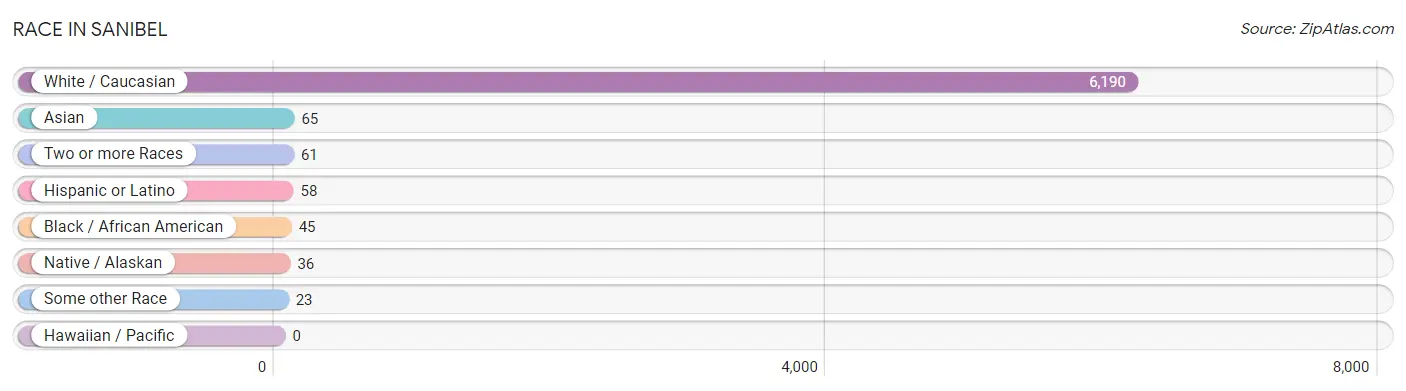
Race in Sanibel
The most populous races in Sanibel are White / Caucasian (6,190 | 96.4%), Asian (65 | 1.0%), and Two or more Races (61 | 0.9%).
| Race | # Population | % Population |
| Asian | 65 | 1.0% |
| Black / African American | 45 | 0.7% |
| Hawaiian / Pacific | 0 | 0.0% |
| Hispanic or Latino | 58 | 0.9% |
| Native / Alaskan | 36 | 0.6% |
| White / Caucasian | 6,190 | 96.4% |
| Two or more Races | 61 | 0.9% |
| Some other Race | 23 | 0.4% |
| Total | 6,420 | 100.0% |
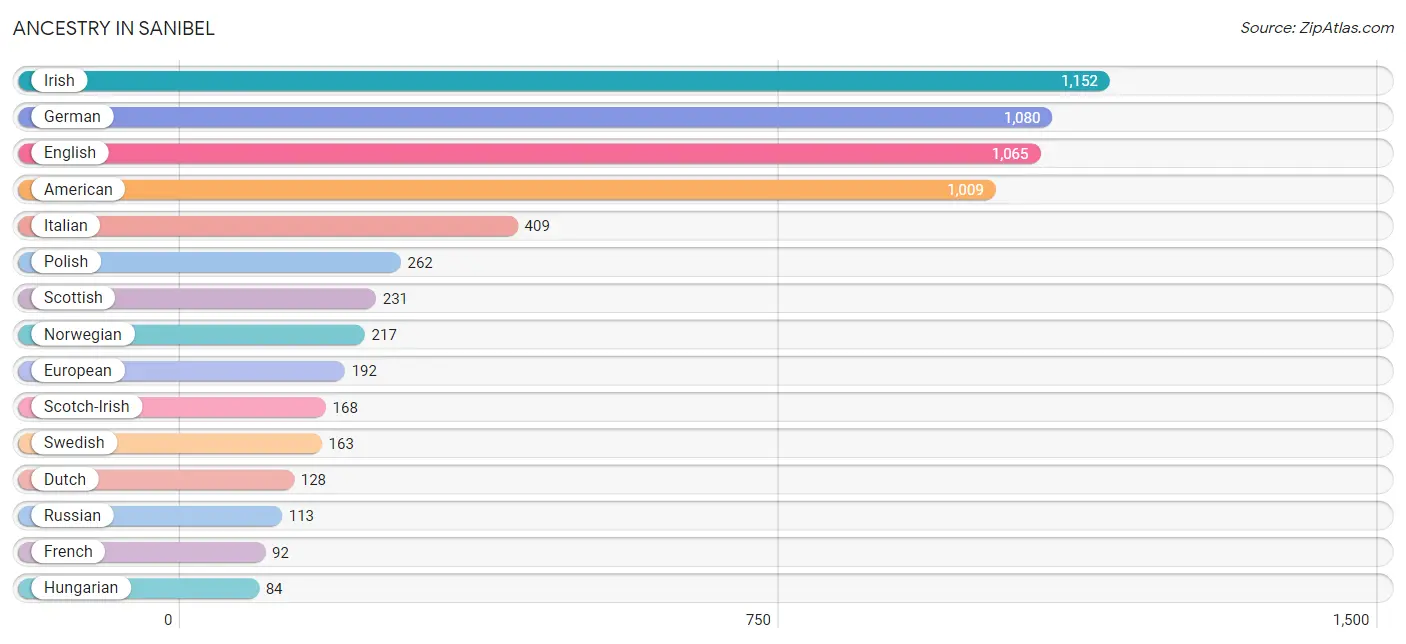
Ancestry in Sanibel
The most populous ancestries reported in Sanibel are Irish (1,152 | 17.9%), German (1,080 | 16.8%), English (1,065 | 16.6%), American (1,009 | 15.7%), and Italian (409 | 6.4%), together accounting for 73.4% of all Sanibel residents.
| Ancestry | # Population | % Population |
| African | 18 | 0.3% |
| American | 1,009 | 15.7% |
| Arab | 7 | 0.1% |
| Armenian | 15 | 0.2% |
| Austrian | 82 | 1.3% |
| British | 82 | 1.3% |
| Canadian | 25 | 0.4% |
| Cherokee | 18 | 0.3% |
| Chickasaw | 6 | 0.1% |
| Colombian | 25 | 0.4% |
| Cuban | 6 | 0.1% |
| Czech | 76 | 1.2% |
| Czechoslovakian | 37 | 0.6% |
| Danish | 36 | 0.6% |
| Dutch | 128 | 2.0% |
| Eastern European | 78 | 1.2% |
| English | 1,065 | 16.6% |
| European | 192 | 3.0% |
| Finnish | 22 | 0.3% |
| French | 92 | 1.4% |
| French Canadian | 48 | 0.7% |
| German | 1,080 | 16.8% |
| Greek | 44 | 0.7% |
| Hungarian | 84 | 1.3% |
| Indian (Asian) | 23 | 0.4% |
| Iranian | 13 | 0.2% |
| Irish | 1,152 | 17.9% |
| Italian | 409 | 6.4% |
| Korean | 47 | 0.7% |
| Lebanese | 7 | 0.1% |
| Lithuanian | 21 | 0.3% |
| Luxembourger | 17 | 0.3% |
| Macedonian | 13 | 0.2% |
| Norwegian | 217 | 3.4% |
| Polish | 262 | 4.1% |
| Portuguese | 7 | 0.1% |
| Puerto Rican | 25 | 0.4% |
| Romanian | 16 | 0.3% |
| Russian | 113 | 1.8% |
| Scandinavian | 7 | 0.1% |
| Scotch-Irish | 168 | 2.6% |
| Scottish | 231 | 3.6% |
| Slovak | 26 | 0.4% |
| South American | 25 | 0.4% |
| South American Indian | 12 | 0.2% |
| Subsaharan African | 18 | 0.3% |
| Swedish | 163 | 2.5% |
| Swiss | 39 | 0.6% |
| Thai | 25 | 0.4% |
| Ukrainian | 13 | 0.2% |
| Welsh | 48 | 0.7% | View All 51 Rows |
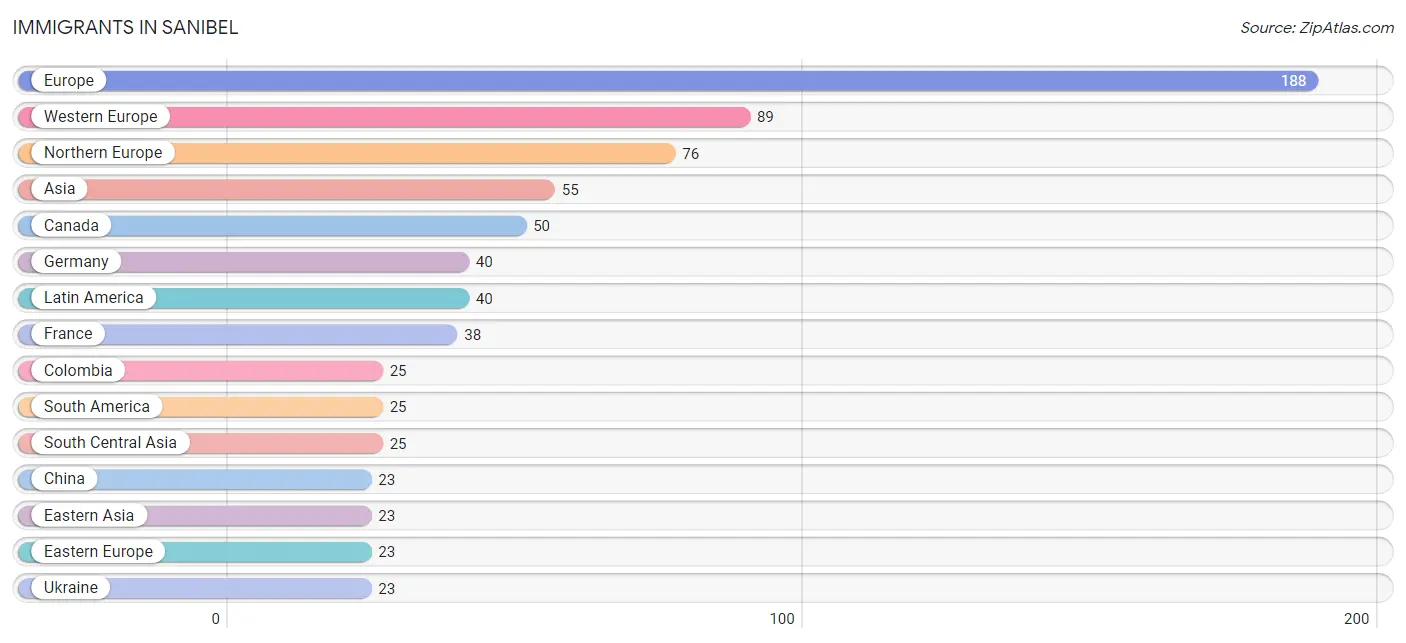
Immigrants in Sanibel
The most numerous immigrant groups reported in Sanibel came from Europe (188 | 2.9%), Western Europe (89 | 1.4%), Northern Europe (76 | 1.2%), Asia (55 | 0.9%), and Canada (50 | 0.8%), together accounting for 7.1% of all Sanibel residents.
| Immigration Origin | # Population | % Population |
| Asia | 55 | 0.9% |
| Canada | 50 | 0.8% |
| Caribbean | 15 | 0.2% |
| China | 23 | 0.4% |
| Colombia | 25 | 0.4% |
| Cuba | 6 | 0.1% |
| Dominican Republic | 9 | 0.1% |
| Eastern Asia | 23 | 0.4% |
| Eastern Europe | 23 | 0.4% |
| England | 21 | 0.3% |
| Europe | 188 | 2.9% |
| France | 38 | 0.6% |
| Germany | 40 | 0.6% |
| India | 17 | 0.3% |
| Latin America | 40 | 0.6% |
| Lebanon | 7 | 0.1% |
| Northern Europe | 76 | 1.2% |
| Norway | 14 | 0.2% |
| South America | 25 | 0.4% |
| South Central Asia | 25 | 0.4% |
| Sri Lanka | 8 | 0.1% |
| Switzerland | 11 | 0.2% |
| Ukraine | 23 | 0.4% |
| Western Asia | 7 | 0.1% |
| Western Europe | 89 | 1.4% | View All 25 Rows |
Sex and Age in Sanibel
Sex and Age in Sanibel
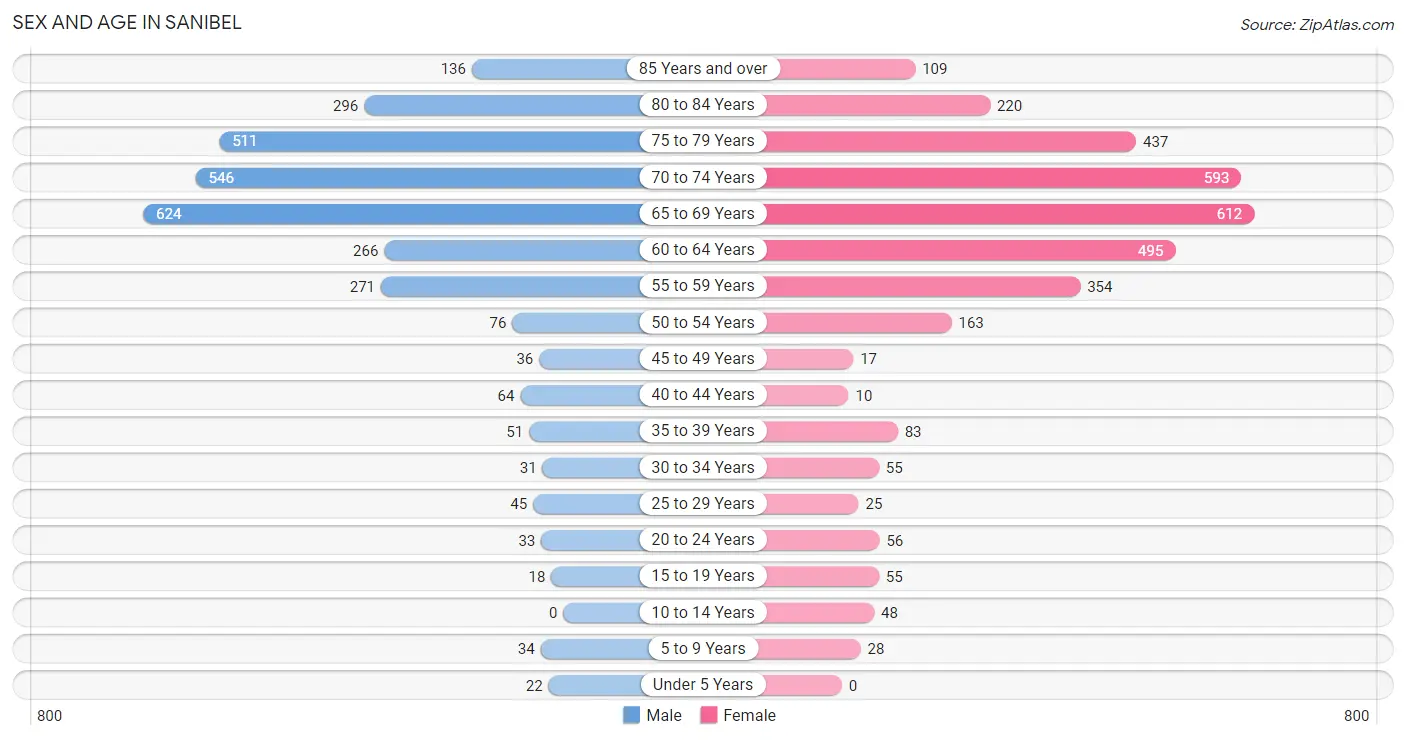
The most populous age groups in Sanibel are 65 to 69 Years (624 | 20.4%) for men and 65 to 69 Years (612 | 18.2%) for women.
| Age Bracket | Male | Female |
| Under 5 Years | 22 (0.7%) | 0 (0.0%) |
| 5 to 9 Years | 34 (1.1%) | 28 (0.8%) |
| 10 to 14 Years | 0 (0.0%) | 48 (1.4%) |
| 15 to 19 Years | 18 (0.6%) | 55 (1.6%) |
| 20 to 24 Years | 33 (1.1%) | 56 (1.7%) |
| 25 to 29 Years | 45 (1.5%) | 25 (0.7%) |
| 30 to 34 Years | 31 (1.0%) | 55 (1.6%) |
| 35 to 39 Years | 51 (1.7%) | 83 (2.5%) |
| 40 to 44 Years | 64 (2.1%) | 10 (0.3%) |
| 45 to 49 Years | 36 (1.2%) | 17 (0.5%) |
| 50 to 54 Years | 76 (2.5%) | 163 (4.9%) |
| 55 to 59 Years | 271 (8.9%) | 354 (10.5%) |
| 60 to 64 Years | 266 (8.7%) | 495 (14.7%) |
| 65 to 69 Years | 624 (20.4%) | 612 (18.2%) |
| 70 to 74 Years | 546 (17.8%) | 593 (17.6%) |
| 75 to 79 Years | 511 (16.7%) | 437 (13.0%) |
| 80 to 84 Years | 296 (9.7%) | 220 (6.6%) |
| 85 Years and over | 136 (4.4%) | 109 (3.2%) |
| Total | 3,060 (100.0%) | 3,360 (100.0%) |
Families and Households in Sanibel
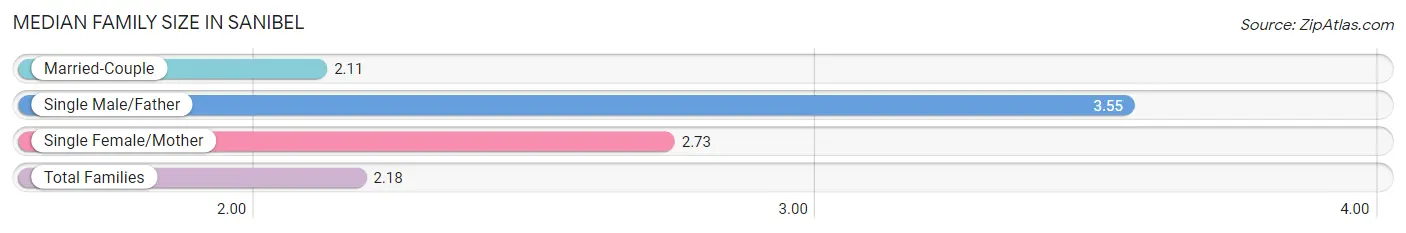
Median Family Size in Sanibel
The median family size in Sanibel is 2.18 persons per family, with single male/father families (73 | 3.1%) accounting for the largest median family size of 3.55 persons per family. On the other hand, married-couple families (2,208 | 93.4%) represent the smallest median family size with 2.11 persons per family.
| Family Type | # Families | Family Size |
| Married-Couple | 2,208 (93.4%) | 2.11 |
| Single Male/Father | 73 (3.1%) | 3.55 |
| Single Female/Mother | 84 (3.5%) | 2.73 |
| Total Families | 2,365 (100.0%) | 2.18 |
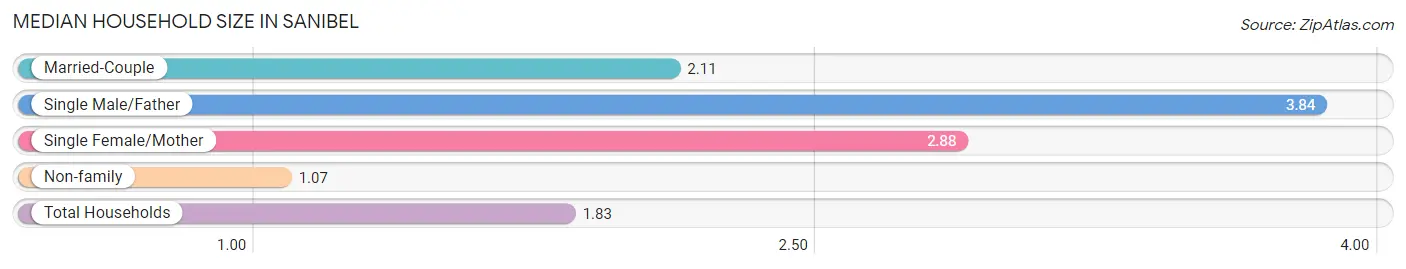
Median Household Size in Sanibel
The median household size in Sanibel is 1.83 persons per household, with single male/father households (73 | 2.1%) accounting for the largest median household size of 3.84 persons per household. non-family households (1,126 | 32.3%) represent the smallest median household size with 1.07 persons per household.
| Household Type | # Households | Household Size |
| Married-Couple | 2,208 (63.2%) | 2.11 |
| Single Male/Father | 73 (2.1%) | 3.84 |
| Single Female/Mother | 84 (2.4%) | 2.88 |
| Non-family | 1,126 (32.3%) | 1.07 |
| Total Households | 3,491 (100.0%) | 1.83 |
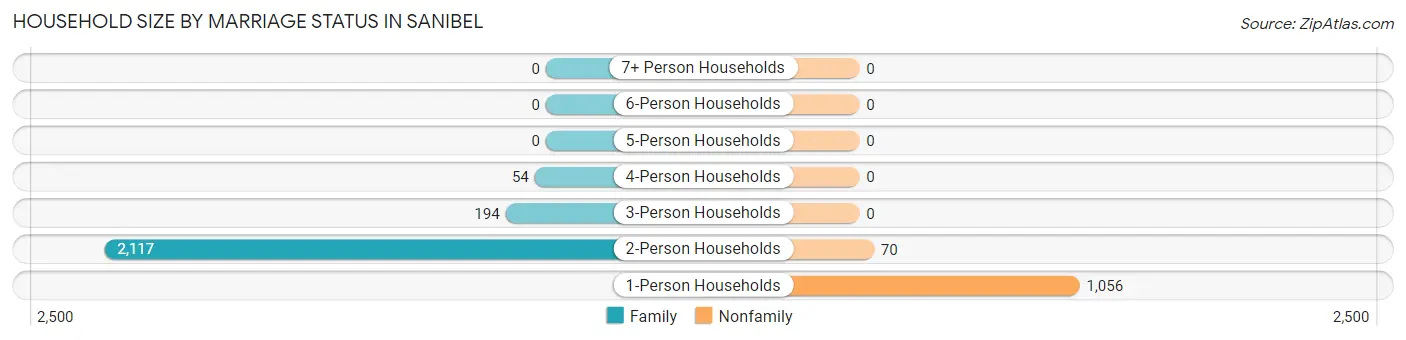
Household Size by Marriage Status in Sanibel
Out of a total of 3,491 households in Sanibel, 2,365 (67.7%) are family households, while 1,126 (32.3%) are nonfamily households. The most numerous type of family households are 2-person households, comprising 2,117, and the most common type of nonfamily households are 1-person households, comprising 1,056.
| Household Size | Family Households | Nonfamily Households |
| 1-Person Households | - | 1,056 (30.2%) |
| 2-Person Households | 2,117 (60.6%) | 70 (2.0%) |
| 3-Person Households | 194 (5.6%) | 0 (0.0%) |
| 4-Person Households | 54 (1.5%) | 0 (0.0%) |
| 5-Person Households | 0 (0.0%) | 0 (0.0%) |
| 6-Person Households | 0 (0.0%) | 0 (0.0%) |
| 7+ Person Households | 0 (0.0%) | 0 (0.0%) |
| Total | 2,365 (67.7%) | 1,126 (32.3%) |
Female Fertility in Sanibel
Fertility by Age in Sanibel
| Age Bracket | Women with Births | Births / 1,000 Women |
| 15 to 19 years | 0 (0.0%) | 0.0 |
| 20 to 34 years | 0 (0.0%) | 0.0 |
| 35 to 50 years | 0 (0.0%) | 0.0 |
| Total | 0 (0.0%) | 0.0 |
Fertility by Age by Marriage Status in Sanibel
| Age Bracket | Married | Unmarried |
| 15 to 19 years | 0 (0.0%) | 0 (0.0%) |
| 20 to 34 years | 0 (0.0%) | 0 (0.0%) |
| 35 to 50 years | 0 (0.0%) | 0 (0.0%) |
| Total | 0 (0.0%) | 0 (0.0%) |
Fertility by Education in Sanibel
| Educational Attainment | Women with Births | Births / 1,000 Women |
| Less than High School | 0 (0.0%) | 0.0 |
| High School Diploma | 0 (0.0%) | 0.0 |
| College or Associate's Degree | 0 (0.0%) | 0.0 |
| Bachelor's Degree | 0 (0.0%) | 0.0 |
| Graduate Degree | 0 (0.0%) | 0.0 |
| Total | 0 (0.0%) | 0.0 |
Fertility by Education by Marriage Status in Sanibel
| Educational Attainment | Married | Unmarried |
| Less than High School | 0 (0.0%) | 0 (0.0%) |
| High School Diploma | 0 (0.0%) | 0 (0.0%) |
| College or Associate's Degree | 0 (0.0%) | 0 (0.0%) |
| Bachelor's Degree | 0 (0.0%) | 0 (0.0%) |
| Graduate Degree | 0 (0.0%) | 0 (0.0%) |
| Total | 0 (0.0%) | 0 (0.0%) |
Income in Sanibel
Income Overview in Sanibel
Per Capita Income in Sanibel is $114,484, while median incomes of families and households are $153,287 and $111,683 respectively.
| Characteristic | Number | Measure |
| Per Capita Income | 6,420 | $114,484 |
| Median Family Income | 2,365 | $153,287 |
| Mean Family Income | 2,365 | $238,311 |
| Median Household Income | 3,491 | $111,683 |
| Mean Household Income | 3,491 | $205,817 |
| Income Deficit | 2,365 | $0 |
| Wage / Income Gap (%) | 6,420 | 43.82% |
| Wage / Income Gap ($) | 6,420 | 56.18¢ per $1 |
| Gini / Inequality Index | 6,420 | 0.59 |
Earnings by Sex in Sanibel
Average Earnings in Sanibel are $47,175, $68,026 for men and $38,220 for women, a difference of 43.8%.
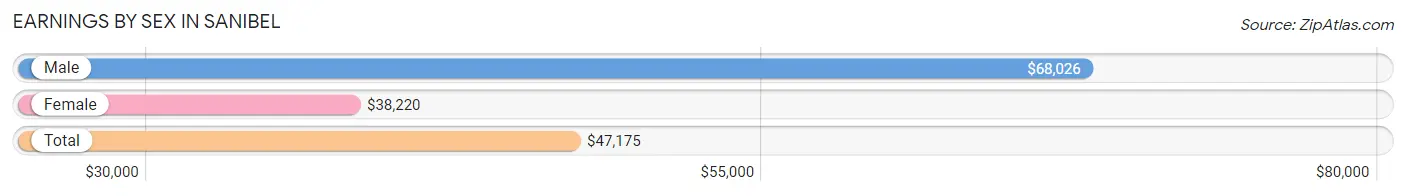
| Sex | Number | Average Earnings |
| Male | 1,306 (54.8%) | $68,026 |
| Female | 1,076 (45.2%) | $38,220 |
| Total | 2,382 (100.0%) | $47,175 |
Earnings by Sex by Income Bracket in Sanibel
The most common earnings brackets in Sanibel are $100,000+ for men (496 | 38.0%) and $100,000+ for women (252 | 23.4%).
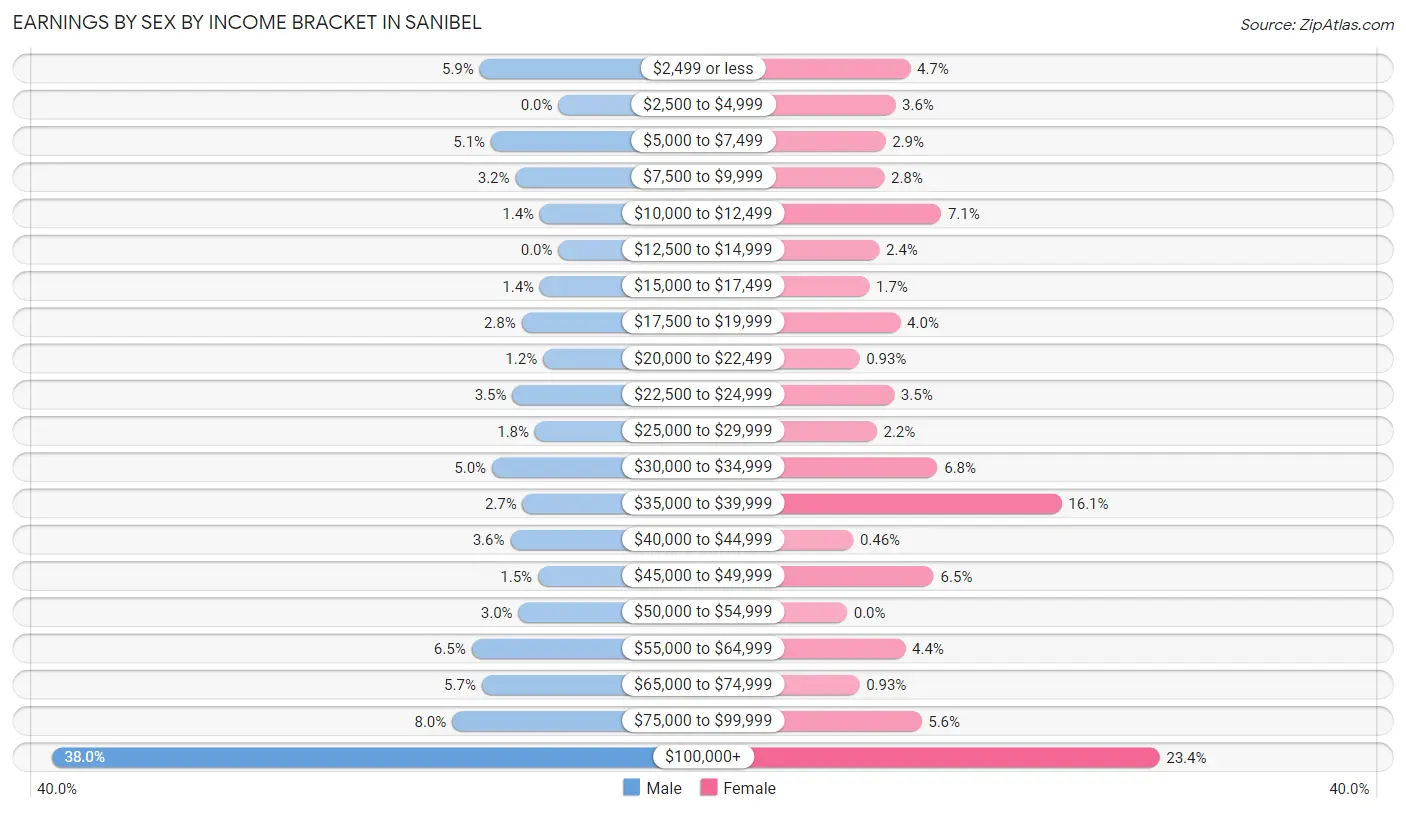
| Income | Male | Female |
| $2,499 or less | 77 (5.9%) | 51 (4.7%) |
| $2,500 to $4,999 | 0 (0.0%) | 39 (3.6%) |
| $5,000 to $7,499 | 66 (5.1%) | 31 (2.9%) |
| $7,500 to $9,999 | 42 (3.2%) | 30 (2.8%) |
| $10,000 to $12,499 | 18 (1.4%) | 76 (7.1%) |
| $12,500 to $14,999 | 0 (0.0%) | 26 (2.4%) |
| $15,000 to $17,499 | 18 (1.4%) | 18 (1.7%) |
| $17,500 to $19,999 | 36 (2.8%) | 43 (4.0%) |
| $20,000 to $22,499 | 15 (1.1%) | 10 (0.9%) |
| $22,500 to $24,999 | 45 (3.5%) | 38 (3.5%) |
| $25,000 to $29,999 | 23 (1.8%) | 24 (2.2%) |
| $30,000 to $34,999 | 65 (5.0%) | 73 (6.8%) |
| $35,000 to $39,999 | 35 (2.7%) | 173 (16.1%) |
| $40,000 to $44,999 | 47 (3.6%) | 5 (0.5%) |
| $45,000 to $49,999 | 20 (1.5%) | 70 (6.5%) |
| $50,000 to $54,999 | 39 (3.0%) | 0 (0.0%) |
| $55,000 to $64,999 | 85 (6.5%) | 47 (4.4%) |
| $65,000 to $74,999 | 75 (5.7%) | 10 (0.9%) |
| $75,000 to $99,999 | 104 (8.0%) | 60 (5.6%) |
| $100,000+ | 496 (38.0%) | 252 (23.4%) |
| Total | 1,306 (100.0%) | 1,076 (100.0%) |
Earnings by Sex by Educational Attainment in Sanibel
Average earnings in Sanibel are $68,684 for men and $38,826 for women, a difference of 43.5%. Men with an educational attainment of graduate degree enjoy the highest average annual earnings of $113,846, while those with college or associate's degree education earn the least with $32,841. Women with an educational attainment of graduate degree earn the most with the average annual earnings of $90,568, while those with high school diploma education have the smallest earnings of $38,583.
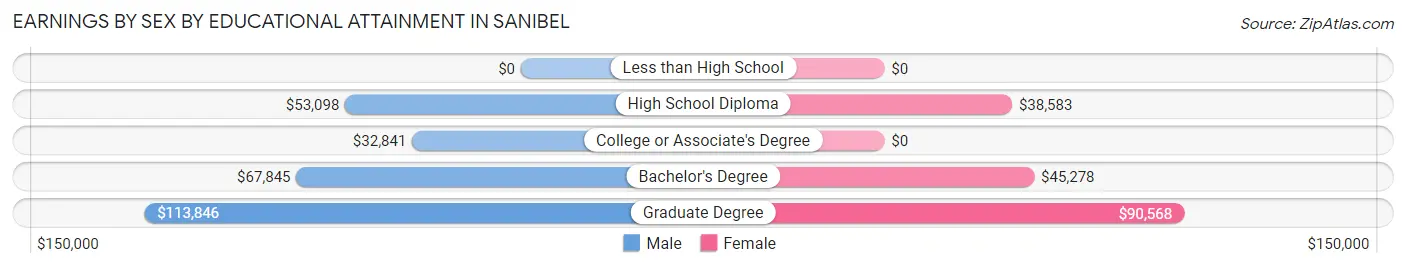
| Educational Attainment | Male Income | Female Income |
| Less than High School | - | - |
| High School Diploma | $53,098 | $38,583 |
| College or Associate's Degree | $32,841 | $0 |
| Bachelor's Degree | $67,845 | $45,278 |
| Graduate Degree | $113,846 | $90,568 |
| Total | $68,684 | $38,826 |
Family Income in Sanibel
Family Income Brackets in Sanibel
According to the Sanibel family income data, there are 866 families falling into the $200,000+ income range, which is the most common income bracket and makes up 36.6% of all families. Conversely, the $10,000 to $14,999 income bracket is the least frequent group with only 19 families (0.8%) belonging to this category.
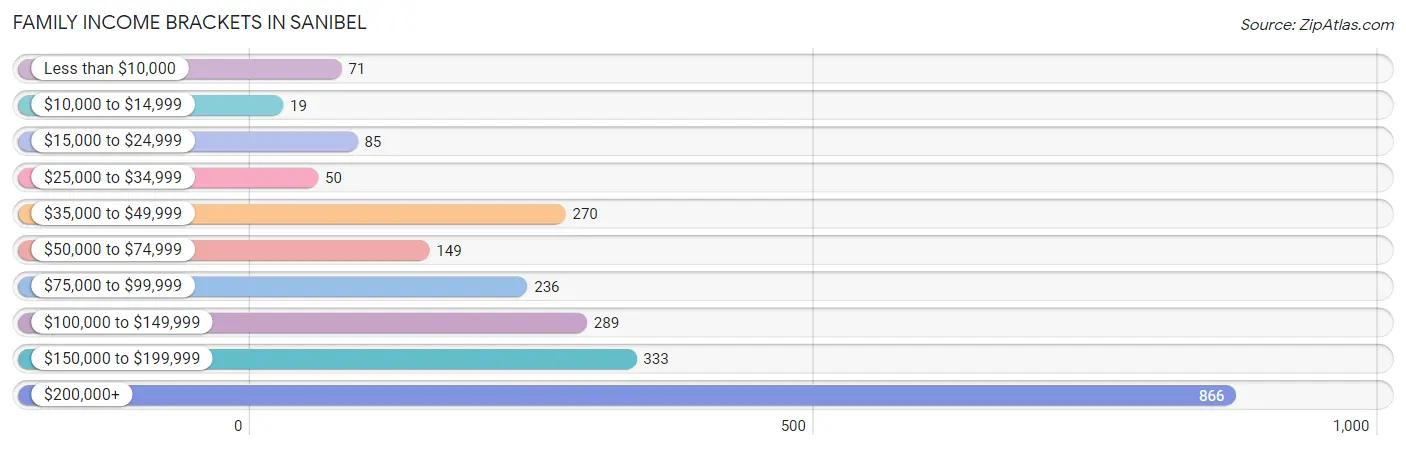
| Income Bracket | # Families | % Families |
| Less than $10,000 | 71 | 3.0% |
| $10,000 to $14,999 | 19 | 0.8% |
| $15,000 to $24,999 | 85 | 3.6% |
| $25,000 to $34,999 | 50 | 2.1% |
| $35,000 to $49,999 | 270 | 11.4% |
| $50,000 to $74,999 | 149 | 6.3% |
| $75,000 to $99,999 | 236 | 10.0% |
| $100,000 to $149,999 | 289 | 12.2% |
| $150,000 to $199,999 | 333 | 14.1% |
| $200,000+ | 866 | 36.6% |
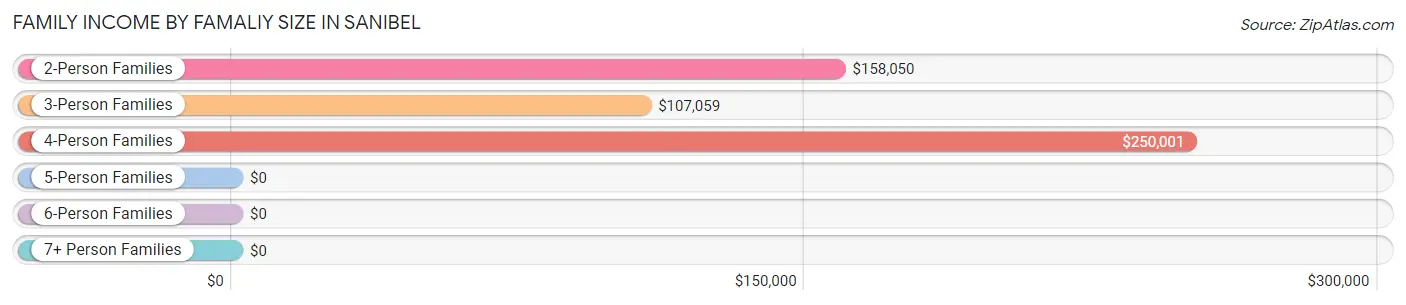
Family Income by Famaliy Size in Sanibel
4-person families (37 | 1.6%) account for the highest median family income in Sanibel with $250,001 per family, while 2-person families (2,126 | 89.9%) have the highest median income of $79,025 per family member.
| Income Bracket | # Families | Median Income |
| 2-Person Families | 2,126 (89.9%) | $158,050 |
| 3-Person Families | 202 (8.5%) | $107,059 |
| 4-Person Families | 37 (1.6%) | $250,001 |
| 5-Person Families | 0 (0.0%) | $0 |
| 6-Person Families | 0 (0.0%) | $0 |
| 7+ Person Families | 0 (0.0%) | $0 |
| Total | 2,365 (100.0%) | $153,287 |
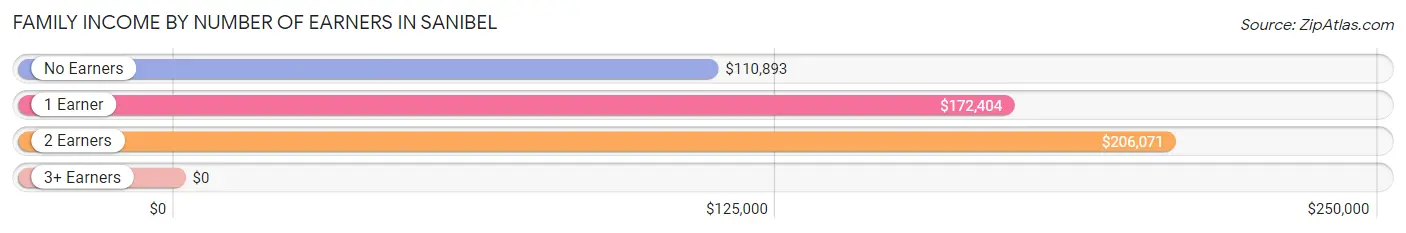
Family Income by Number of Earners in Sanibel
| Number of Earners | # Families | Median Income |
| No Earners | 1,169 (49.4%) | $110,893 |
| 1 Earner | 736 (31.1%) | $172,404 |
| 2 Earners | 416 (17.6%) | $206,071 |
| 3+ Earners | 44 (1.9%) | $0 |
| Total | 2,365 (100.0%) | $153,287 |
Household Income in Sanibel
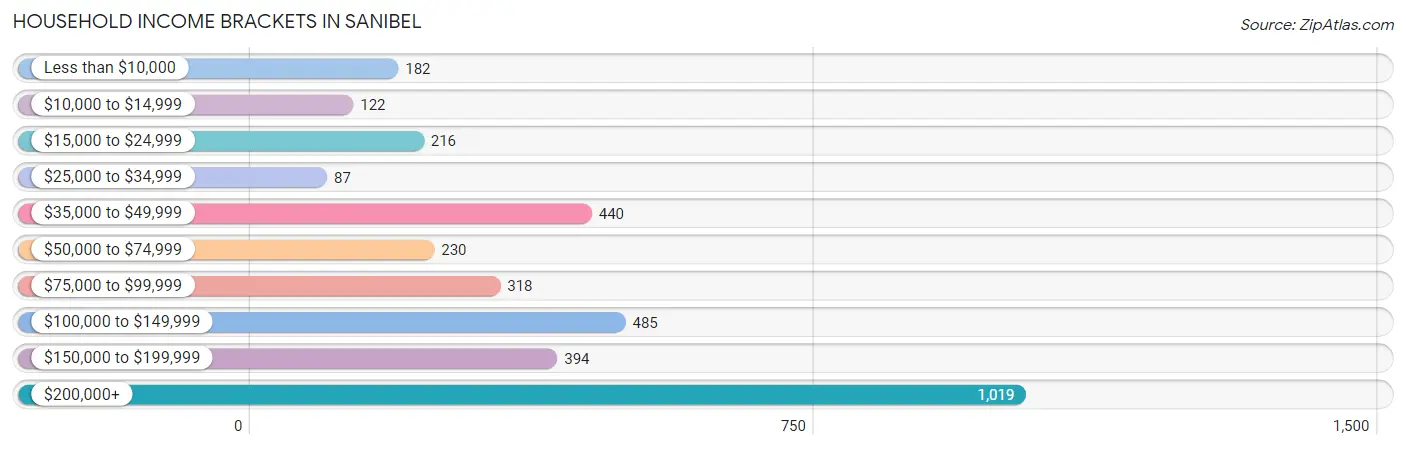
Household Income Brackets in Sanibel
With 1,019 households falling in the category, the $200,000+ income range is the most frequent in Sanibel, accounting for 29.2% of all households. In contrast, only 87 households (2.5%) fall into the $25,000 to $34,999 income bracket, making it the least populous group.
| Income Bracket | # Households | % Households |
| Less than $10,000 | 182 | 5.2% |
| $10,000 to $14,999 | 122 | 3.5% |
| $15,000 to $24,999 | 216 | 6.2% |
| $25,000 to $34,999 | 87 | 2.5% |
| $35,000 to $49,999 | 440 | 12.6% |
| $50,000 to $74,999 | 230 | 6.6% |
| $75,000 to $99,999 | 318 | 9.1% |
| $100,000 to $149,999 | 485 | 13.9% |
| $150,000 to $199,999 | 394 | 11.3% |
| $200,000+ | 1,019 | 29.2% |
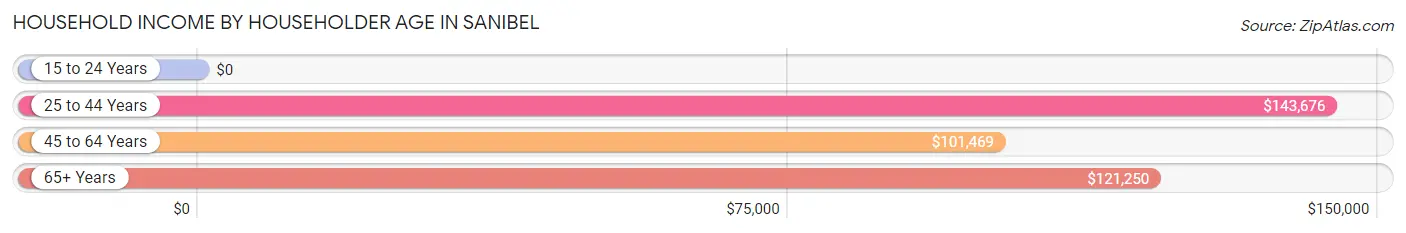
Household Income by Householder Age in Sanibel
The median household income in Sanibel is $111,683, with the highest median household income of $143,676 found in the 25 to 44 years age bracket for the primary householder. A total of 130 households (3.7%) fall into this category. Meanwhile, the 15 to 24 years age bracket for the primary householder has the lowest median household income of $0, with 30 households (0.9%) in this group.
| Income Bracket | # Households | Median Income |
| 15 to 24 Years | 30 (0.9%) | $0 |
| 25 to 44 Years | 130 (3.7%) | $143,676 |
| 45 to 64 Years | 901 (25.8%) | $101,469 |
| 65+ Years | 2,430 (69.6%) | $121,250 |
| Total | 3,491 (100.0%) | $111,683 |
Poverty in Sanibel
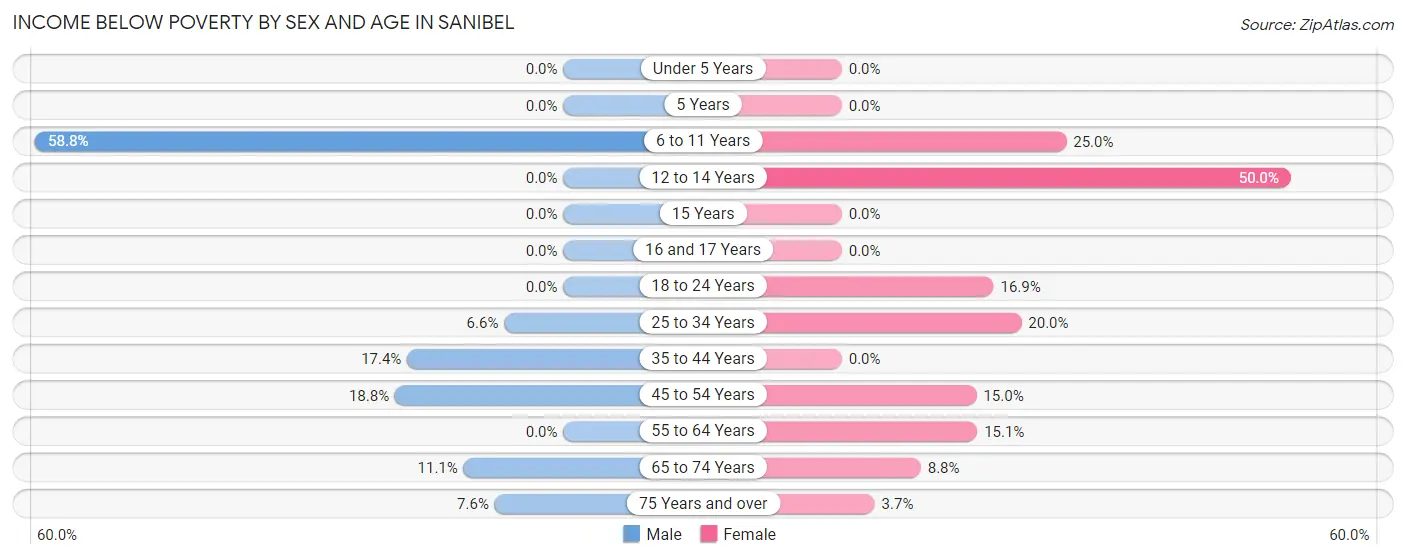
Income Below Poverty by Sex and Age in Sanibel
With 8.8% poverty level for males and 10.2% for females among the residents of Sanibel, 6 to 11 year old males and 12 to 14 year old females are the most vulnerable to poverty, with 20 males (58.8%) and 12 females (50.0%) in their respective age groups living below the poverty level.
| Age Bracket | Male | Female |
| Under 5 Years | 0 (0.0%) | 0 (0.0%) |
| 5 Years | 0 (0.0%) | 0 (0.0%) |
| 6 to 11 Years | 20 (58.8%) | 13 (25.0%) |
| 12 to 14 Years | 0 (0.0%) | 12 (50.0%) |
| 15 Years | 0 (0.0%) | 0 (0.0%) |
| 16 and 17 Years | 0 (0.0%) | 0 (0.0%) |
| 18 to 24 Years | 0 (0.0%) | 12 (16.9%) |
| 25 to 34 Years | 5 (6.6%) | 16 (20.0%) |
| 35 to 44 Years | 20 (17.4%) | 0 (0.0%) |
| 45 to 54 Years | 21 (18.8%) | 27 (15.0%) |
| 55 to 64 Years | 0 (0.0%) | 128 (15.1%) |
| 65 to 74 Years | 130 (11.1%) | 106 (8.8%) |
| 75 Years and over | 72 (7.6%) | 28 (3.7%) |
| Total | 268 (8.8%) | 342 (10.2%) |
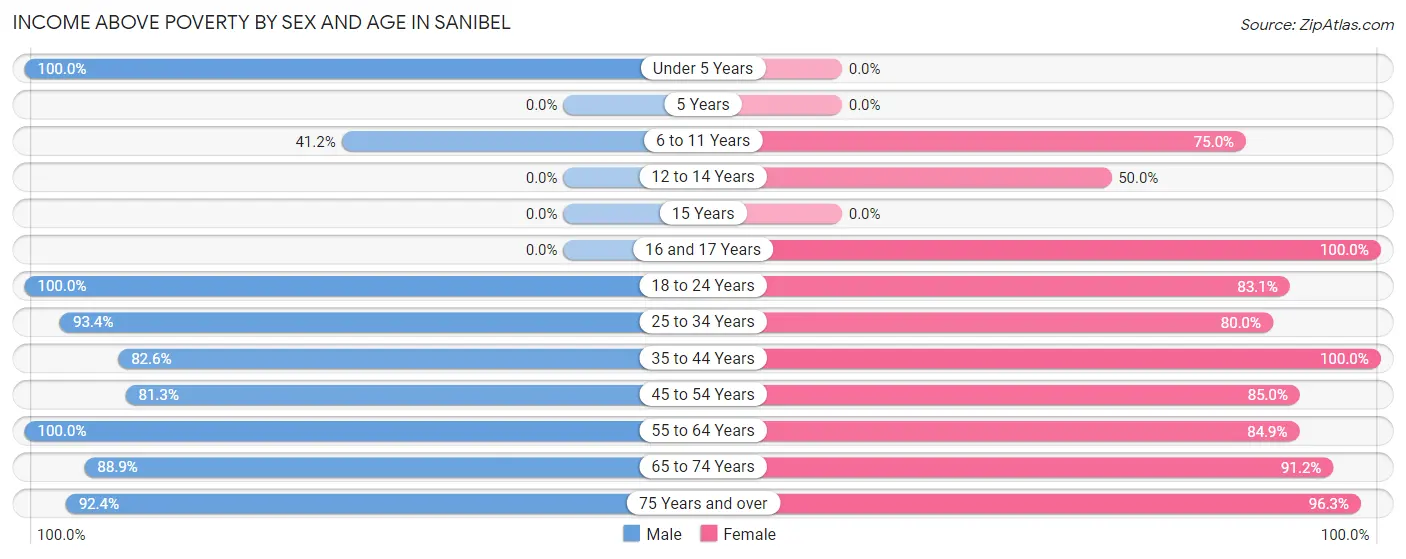
Income Above Poverty by Sex and Age in Sanibel
According to the poverty statistics in Sanibel, males aged under 5 years and females aged 16 and 17 years are the age groups that are most secure financially, with 100.0% of males and 100.0% of females in these age groups living above the poverty line.
| Age Bracket | Male | Female |
| Under 5 Years | 22 (100.0%) | 0 (0.0%) |
| 5 Years | 0 (0.0%) | 0 (0.0%) |
| 6 to 11 Years | 14 (41.2%) | 39 (75.0%) |
| 12 to 14 Years | 0 (0.0%) | 12 (50.0%) |
| 15 Years | 0 (0.0%) | 0 (0.0%) |
| 16 and 17 Years | 0 (0.0%) | 19 (100.0%) |
| 18 to 24 Years | 51 (100.0%) | 59 (83.1%) |
| 25 to 34 Years | 71 (93.4%) | 64 (80.0%) |
| 35 to 44 Years | 95 (82.6%) | 93 (100.0%) |
| 45 to 54 Years | 91 (81.2%) | 153 (85.0%) |
| 55 to 64 Years | 537 (100.0%) | 721 (84.9%) |
| 65 to 74 Years | 1,040 (88.9%) | 1,099 (91.2%) |
| 75 Years and over | 871 (92.4%) | 738 (96.3%) |
| Total | 2,792 (91.2%) | 2,997 (89.8%) |
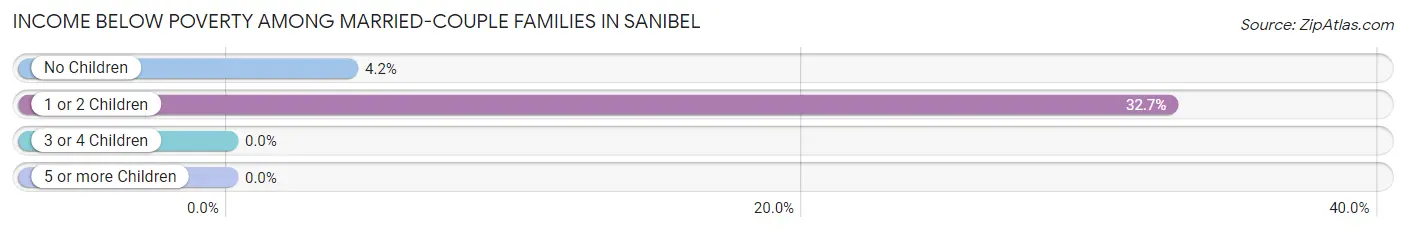
Income Below Poverty Among Married-Couple Families in Sanibel
The poverty statistics for married-couple families in Sanibel show that 4.9% or 108 of the total 2,208 families live below the poverty line. Families with 1 or 2 children have the highest poverty rate of 32.7%, comprising of 18 families. On the other hand, families with no children have the lowest poverty rate of 4.2%, which includes 90 families.
| Children | Above Poverty | Below Poverty |
| No Children | 2,063 (95.8%) | 90 (4.2%) |
| 1 or 2 Children | 37 (67.3%) | 18 (32.7%) |
| 3 or 4 Children | 0 (0.0%) | 0 (0.0%) |
| 5 or more Children | 0 (0.0%) | 0 (0.0%) |
| Total | 2,100 (95.1%) | 108 (4.9%) |
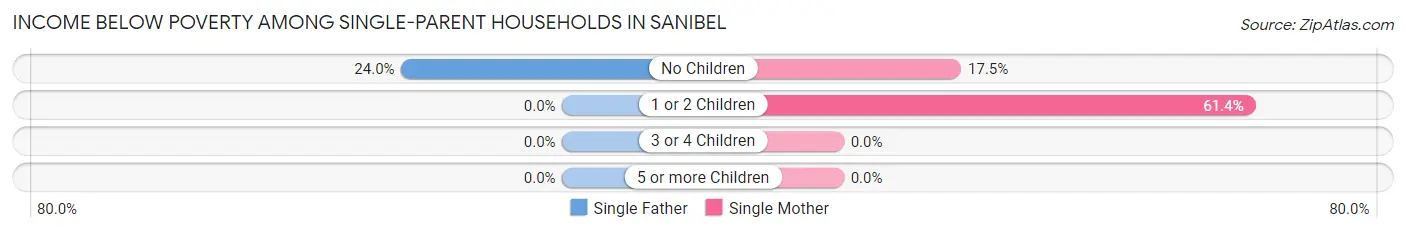
Income Below Poverty Among Single-Parent Households in Sanibel
According to the poverty data in Sanibel, 16.4% or 12 single-father households and 40.5% or 34 single-mother households are living below the poverty line. Among single-father households, those with no children have the highest poverty rate, with 12 households (24.0%) experiencing poverty. Likewise, among single-mother households, those with 1 or 2 children have the highest poverty rate, with 27 households (61.4%) falling below the poverty line.
| Children | Single Father | Single Mother |
| No Children | 12 (24.0%) | 7 (17.5%) |
| 1 or 2 Children | 0 (0.0%) | 27 (61.4%) |
| 3 or 4 Children | 0 (0.0%) | 0 (0.0%) |
| 5 or more Children | 0 (0.0%) | 0 (0.0%) |
| Total | 12 (16.4%) | 34 (40.5%) |
Income Below Poverty Among Married-Couple vs Single-Parent Households in Sanibel
The poverty data for Sanibel shows that 108 of the married-couple family households (4.9%) and 46 of the single-parent households (29.3%) are living below the poverty level. Within the married-couple family households, those with 1 or 2 children have the highest poverty rate, with 18 households (32.7%) falling below the poverty line. Among the single-parent households, those with 1 or 2 children have the highest poverty rate, with 27 household (40.3%) living below poverty.
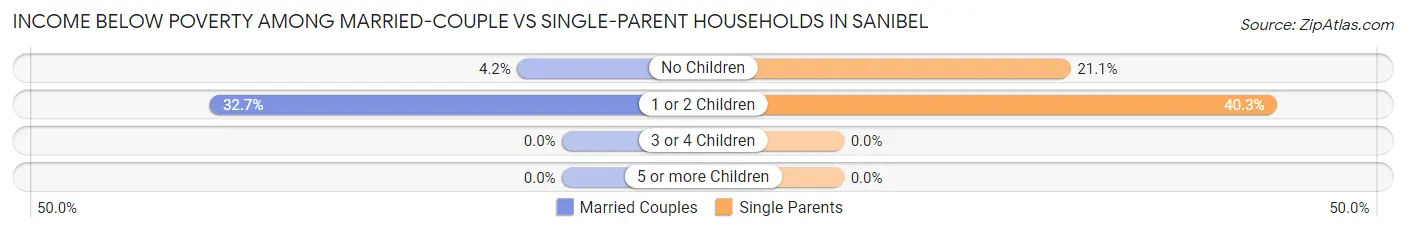
| Children | Married-Couple Families | Single-Parent Households |
| No Children | 90 (4.2%) | 19 (21.1%) |
| 1 or 2 Children | 18 (32.7%) | 27 (40.3%) |
| 3 or 4 Children | 0 (0.0%) | 0 (0.0%) |
| 5 or more Children | 0 (0.0%) | 0 (0.0%) |
| Total | 108 (4.9%) | 46 (29.3%) |
Employment Characteristics in Sanibel
Employment by Class of Employer in Sanibel
Among the 1,936 employed individuals in Sanibel, private company employees (1,069 | 55.2%), self-employed (incorporated) (439 | 22.7%), and self-employed (not incorporated) (208 | 10.7%) make up the most common classes of employment.
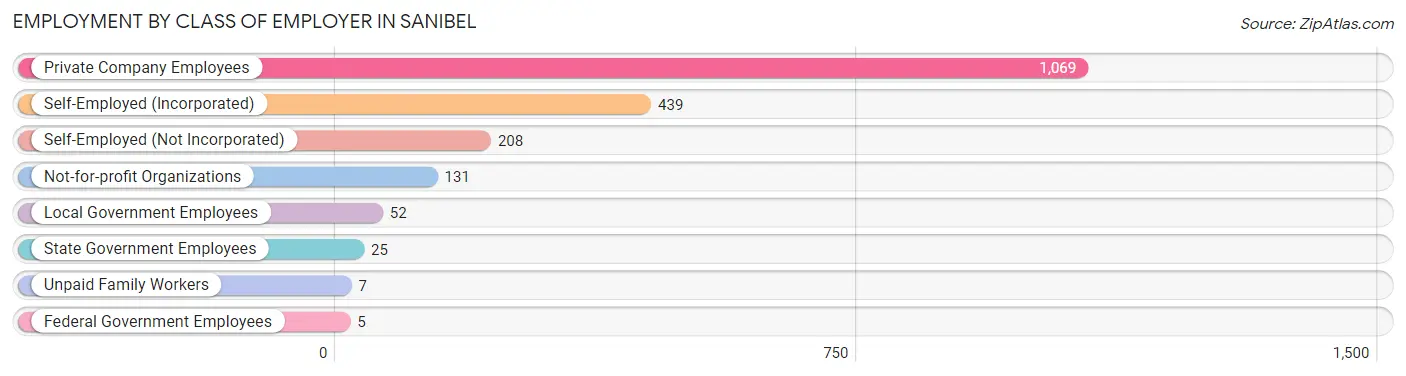
| Employer Class | # Employees | % Employees |
| Private Company Employees | 1,069 | 55.2% |
| Self-Employed (Incorporated) | 439 | 22.7% |
| Self-Employed (Not Incorporated) | 208 | 10.7% |
| Not-for-profit Organizations | 131 | 6.8% |
| Local Government Employees | 52 | 2.7% |
| State Government Employees | 25 | 1.3% |
| Federal Government Employees | 5 | 0.3% |
| Unpaid Family Workers | 7 | 0.4% |
| Total | 1,936 | 100.0% |
Employment Status by Age in Sanibel
According to the labor force statistics for Sanibel, out of the total population over 16 years of age (6,288), 33.2% or 2,088 individuals are in the labor force, with 4.6% or 96 of them unemployed. The age group with the highest labor force participation rate is 25 to 29 years, with 100.0% or 70 individuals in the labor force. Within the labor force, the 16 to 19 years age range has the highest percentage of unemployed individuals, with 65.9% or 29 of them being unemployed.
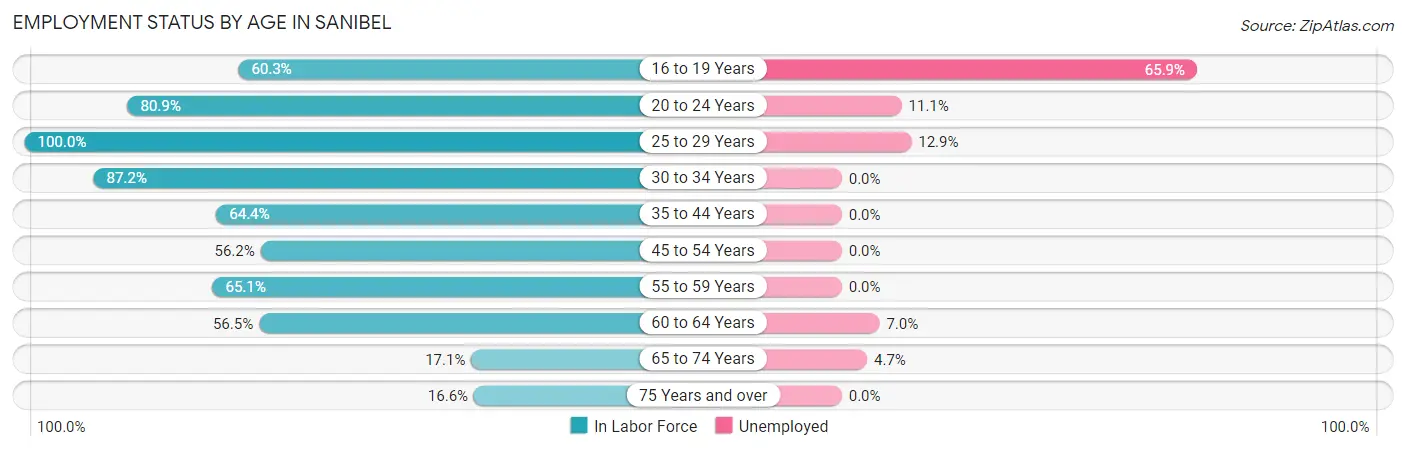
| Age Bracket | In Labor Force | Unemployed |
| 16 to 19 Years | 44 (60.3%) | 29 (65.9%) |
| 20 to 24 Years | 72 (80.9%) | 8 (11.1%) |
| 25 to 29 Years | 70 (100.0%) | 9 (12.9%) |
| 30 to 34 Years | 75 (87.2%) | 0 (0.0%) |
| 35 to 44 Years | 134 (64.4%) | 0 (0.0%) |
| 45 to 54 Years | 164 (56.2%) | 0 (0.0%) |
| 55 to 59 Years | 407 (65.1%) | 0 (0.0%) |
| 60 to 64 Years | 430 (56.5%) | 30 (7.0%) |
| 65 to 74 Years | 406 (17.1%) | 19 (4.7%) |
| 75 Years and over | 284 (16.6%) | 0 (0.0%) |
| Total | 2,088 (33.2%) | 96 (4.6%) |
Employment Status by Educational Attainment in Sanibel
According to labor force statistics for Sanibel, 62.7% of individuals (1,280) out of the total population between 25 and 64 years of age (2,042) are in the labor force, with 3.0% or 38 of them being unemployed. The group with the highest labor force participation rate are those with the educational attainment of high school diploma, with 81.1% or 335 individuals in the labor force. Within the labor force, individuals with high school diploma education have the highest percentage of unemployment, with 9.0% or 30 of them being unemployed.
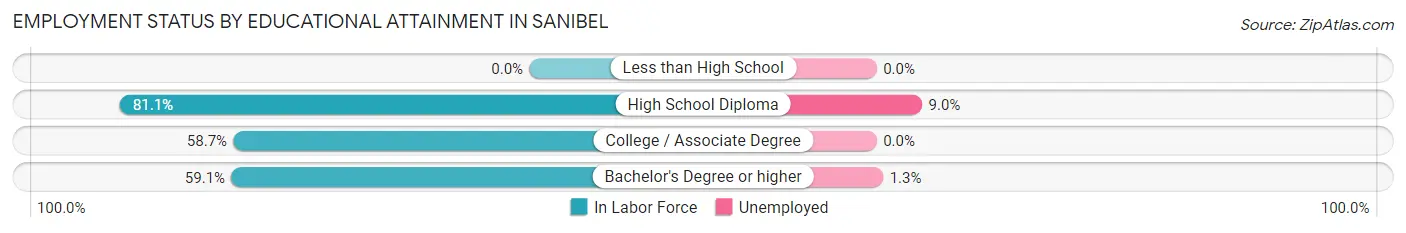
| Educational Attainment | In Labor Force | Unemployed |
| Less than High School | 0 (0.0%) | 0 (0.0%) |
| High School Diploma | 335 (81.1%) | 37 (9.0%) |
| College / Associate Degree | 260 (58.7%) | 0 (0.0%) |
| Bachelor's Degree or higher | 685 (59.1%) | 15 (1.3%) |
| Total | 1,280 (62.7%) | 61 (3.0%) |
Employment Occupations by Sex in Sanibel
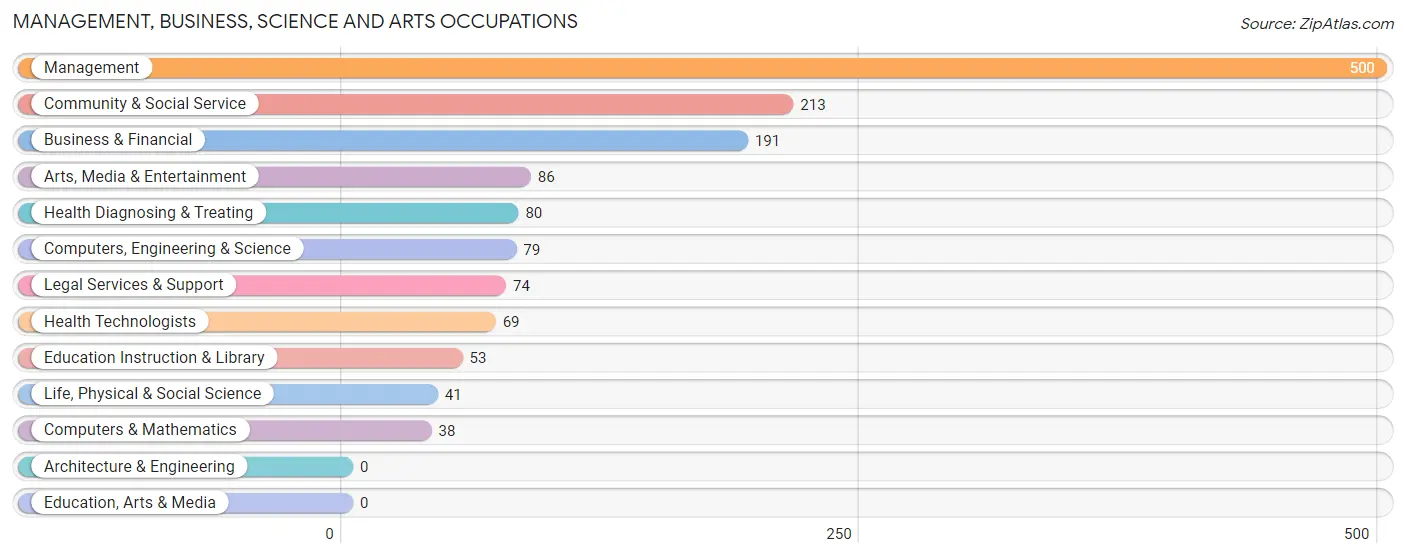
Management, Business, Science and Arts Occupations
The most common Management, Business, Science and Arts occupations in Sanibel are Management (500 | 25.1%), Community & Social Service (213 | 10.7%), Business & Financial (191 | 9.6%), Arts, Media & Entertainment (86 | 4.3%), and Health Diagnosing & Treating (80 | 4.0%).
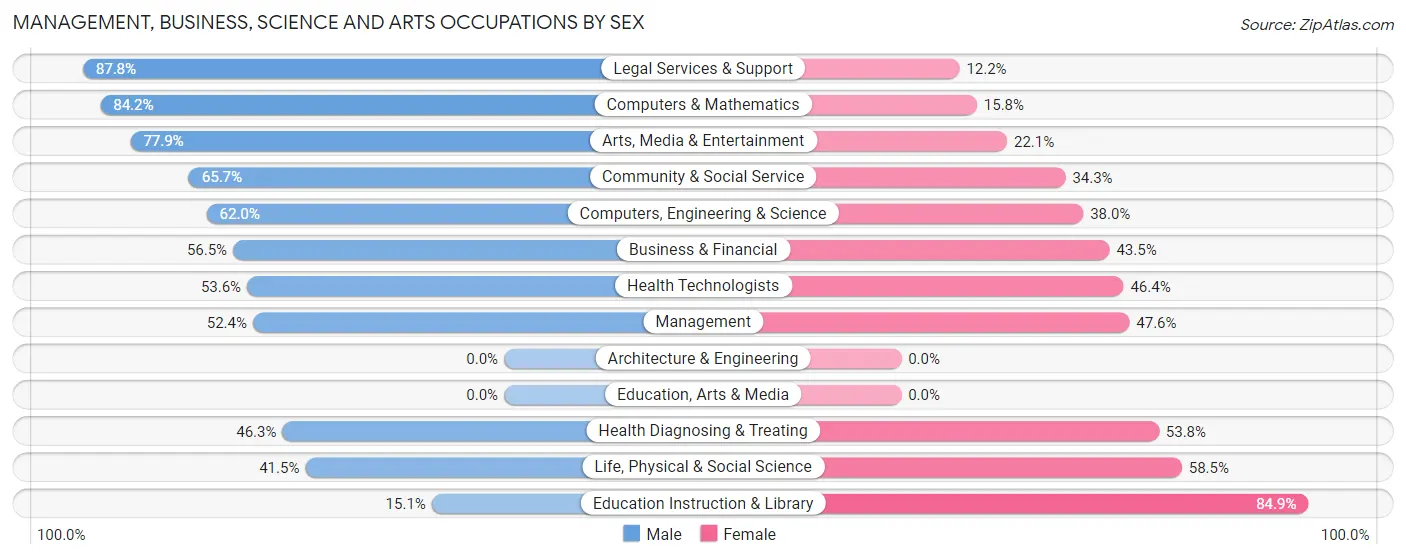
Management, Business, Science and Arts Occupations by Sex
Within the Management, Business, Science and Arts occupations in Sanibel, the most male-oriented occupations are Legal Services & Support (87.8%), Computers & Mathematics (84.2%), and Arts, Media & Entertainment (77.9%), while the most female-oriented occupations are Education Instruction & Library (84.9%), Life, Physical & Social Science (58.5%), and Health Diagnosing & Treating (53.7%).
| Occupation | Male | Female |
| Management | 262 (52.4%) | 238 (47.6%) |
| Business & Financial | 108 (56.5%) | 83 (43.5%) |
| Computers, Engineering & Science | 49 (62.0%) | 30 (38.0%) |
| Computers & Mathematics | 32 (84.2%) | 6 (15.8%) |
| Architecture & Engineering | 0 (0.0%) | 0 (0.0%) |
| Life, Physical & Social Science | 17 (41.5%) | 24 (58.5%) |
| Community & Social Service | 140 (65.7%) | 73 (34.3%) |
| Education, Arts & Media | 0 (0.0%) | 0 (0.0%) |
| Legal Services & Support | 65 (87.8%) | 9 (12.2%) |
| Education Instruction & Library | 8 (15.1%) | 45 (84.9%) |
| Arts, Media & Entertainment | 67 (77.9%) | 19 (22.1%) |
| Health Diagnosing & Treating | 37 (46.3%) | 43 (53.7%) |
| Health Technologists | 37 (53.6%) | 32 (46.4%) |
| Total (Category) | 596 (56.1%) | 467 (43.9%) |
| Total (Overall) | 1,073 (53.9%) | 917 (46.1%) |
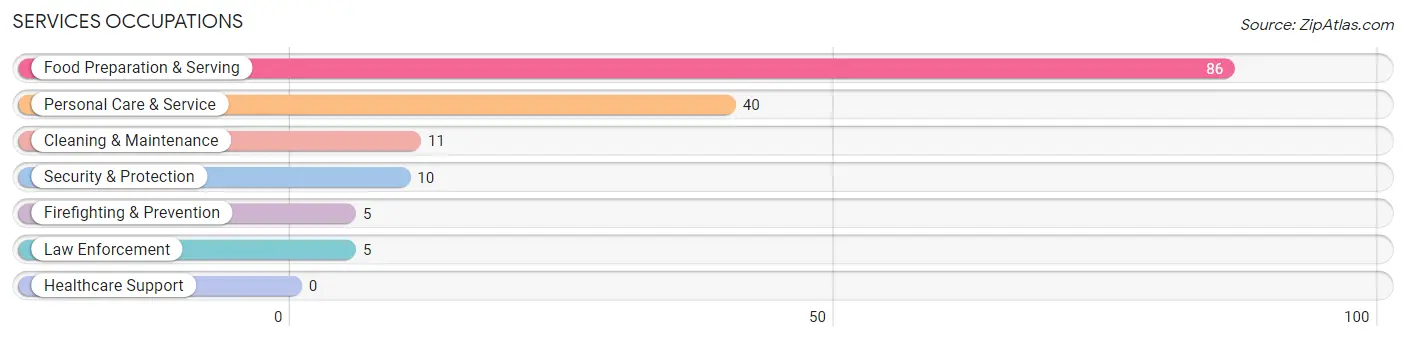
Services Occupations
The most common Services occupations in Sanibel are Food Preparation & Serving (86 | 4.3%), Personal Care & Service (40 | 2.0%), Cleaning & Maintenance (11 | 0.5%), Security & Protection (10 | 0.5%), and Firefighting & Prevention (5 | 0.3%).
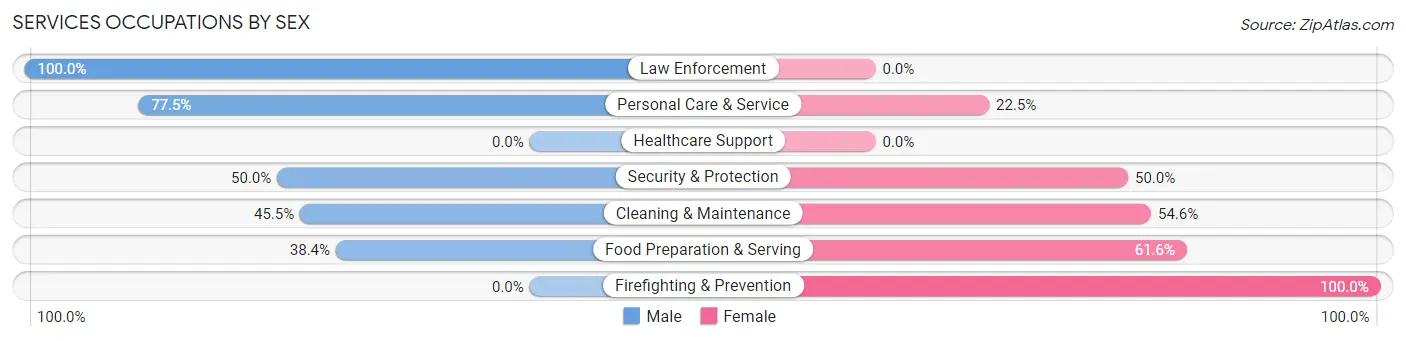
Services Occupations by Sex
Within the Services occupations in Sanibel, the most male-oriented occupations are Law Enforcement (100.0%), Personal Care & Service (77.5%), and Security & Protection (50.0%), while the most female-oriented occupations are Firefighting & Prevention (100.0%), Food Preparation & Serving (61.6%), and Cleaning & Maintenance (54.5%).
| Occupation | Male | Female |
| Healthcare Support | 0 (0.0%) | 0 (0.0%) |
| Security & Protection | 5 (50.0%) | 5 (50.0%) |
| Firefighting & Prevention | 0 (0.0%) | 5 (100.0%) |
| Law Enforcement | 5 (100.0%) | 0 (0.0%) |
| Food Preparation & Serving | 33 (38.4%) | 53 (61.6%) |
| Cleaning & Maintenance | 5 (45.5%) | 6 (54.5%) |
| Personal Care & Service | 31 (77.5%) | 9 (22.5%) |
| Total (Category) | 74 (50.3%) | 73 (49.7%) |
| Total (Overall) | 1,073 (53.9%) | 917 (46.1%) |
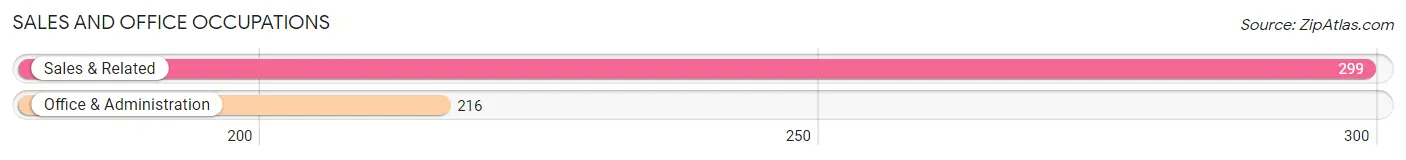
Sales and Office Occupations
The most common Sales and Office occupations in Sanibel are Sales & Related (299 | 15.0%), and Office & Administration (216 | 10.8%).
Sales and Office Occupations by Sex
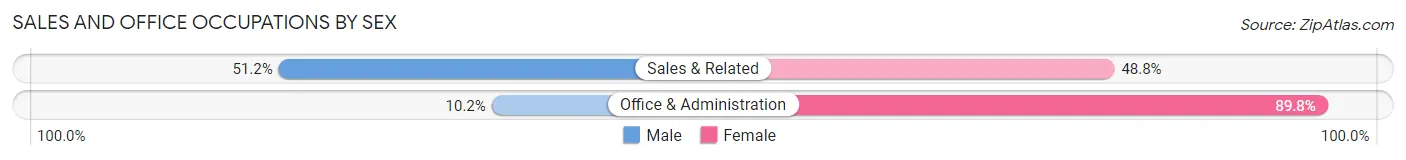
| Occupation | Male | Female |
| Sales & Related | 153 (51.2%) | 146 (48.8%) |
| Office & Administration | 22 (10.2%) | 194 (89.8%) |
| Total (Category) | 175 (34.0%) | 340 (66.0%) |
| Total (Overall) | 1,073 (53.9%) | 917 (46.1%) |
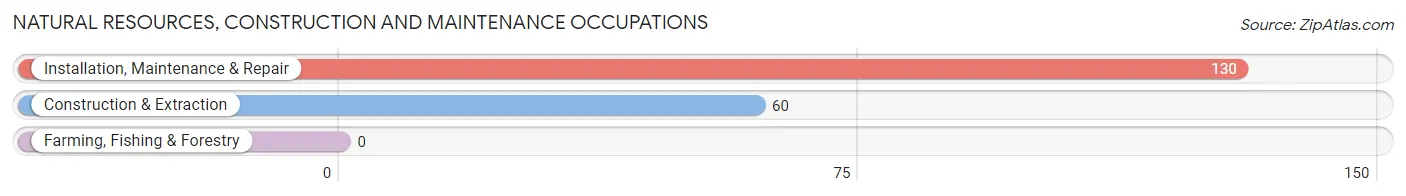
Natural Resources, Construction and Maintenance Occupations
The most common Natural Resources, Construction and Maintenance occupations in Sanibel are Installation, Maintenance & Repair (130 | 6.5%), and Construction & Extraction (60 | 3.0%).
Natural Resources, Construction and Maintenance Occupations by Sex
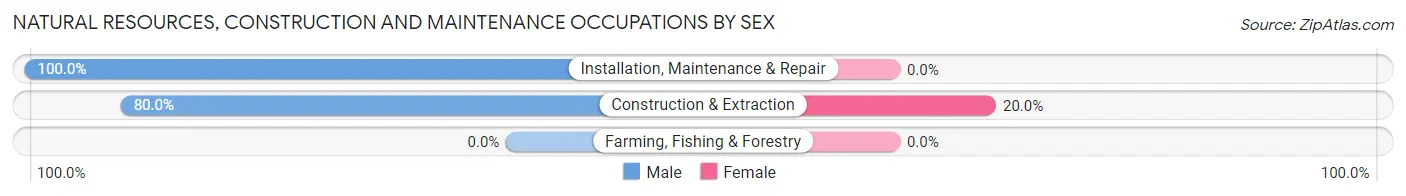
| Occupation | Male | Female |
| Farming, Fishing & Forestry | 0 (0.0%) | 0 (0.0%) |
| Construction & Extraction | 48 (80.0%) | 12 (20.0%) |
| Installation, Maintenance & Repair | 130 (100.0%) | 0 (0.0%) |
| Total (Category) | 178 (93.7%) | 12 (6.3%) |
| Total (Overall) | 1,073 (53.9%) | 917 (46.1%) |
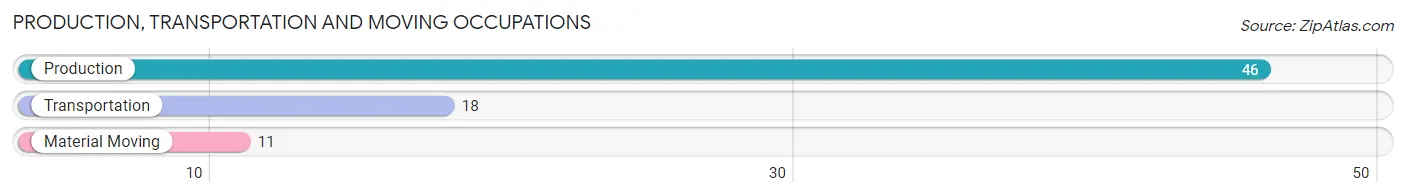
Production, Transportation and Moving Occupations
The most common Production, Transportation and Moving occupations in Sanibel are Production (46 | 2.3%), Transportation (18 | 0.9%), and Material Moving (11 | 0.5%).
Production, Transportation and Moving Occupations by Sex
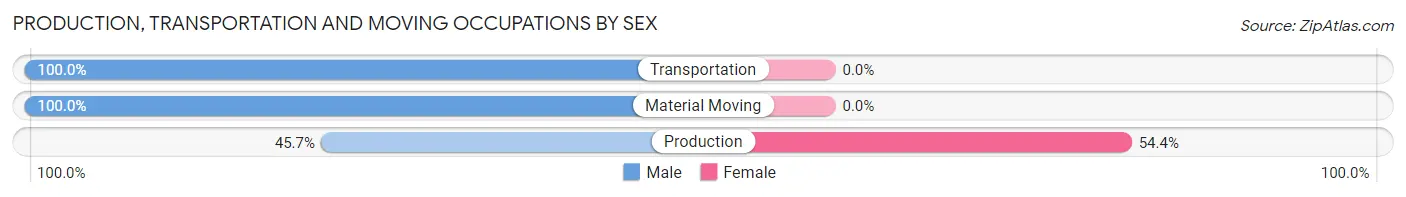
| Occupation | Male | Female |
| Production | 21 (45.7%) | 25 (54.3%) |
| Transportation | 18 (100.0%) | 0 (0.0%) |
| Material Moving | 11 (100.0%) | 0 (0.0%) |
| Total (Category) | 50 (66.7%) | 25 (33.3%) |
| Total (Overall) | 1,073 (53.9%) | 917 (46.1%) |
Employment Industries by Sex in Sanibel
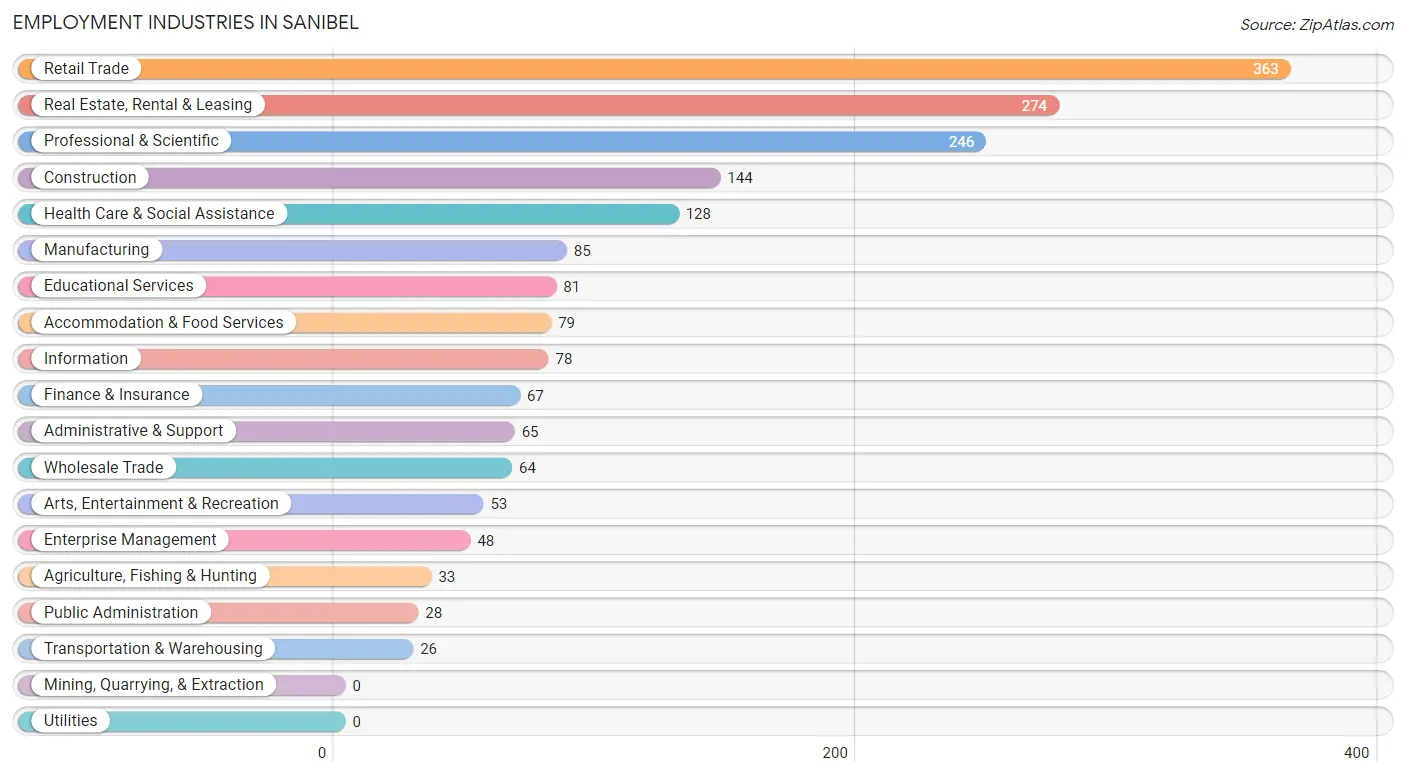
Employment Industries in Sanibel
The major employment industries in Sanibel include Retail Trade (363 | 18.2%), Real Estate, Rental & Leasing (274 | 13.8%), Professional & Scientific (246 | 12.4%), Construction (144 | 7.2%), and Health Care & Social Assistance (128 | 6.4%).
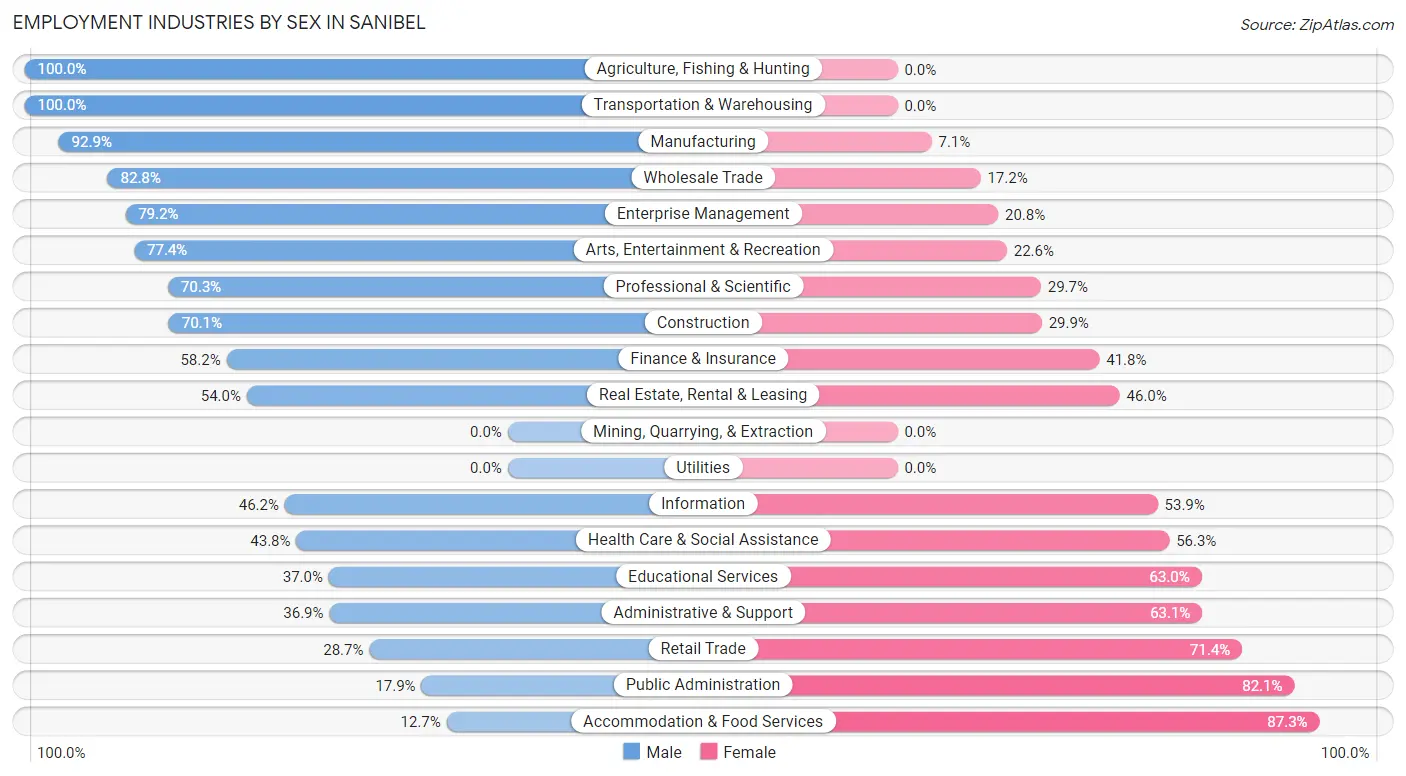
Employment Industries by Sex in Sanibel
The Sanibel industries that see more men than women are Agriculture, Fishing & Hunting (100.0%), Transportation & Warehousing (100.0%), and Manufacturing (92.9%), whereas the industries that tend to have a higher number of women are Accommodation & Food Services (87.3%), Public Administration (82.1%), and Retail Trade (71.4%).
| Industry | Male | Female |
| Agriculture, Fishing & Hunting | 33 (100.0%) | 0 (0.0%) |
| Mining, Quarrying, & Extraction | 0 (0.0%) | 0 (0.0%) |
| Construction | 101 (70.1%) | 43 (29.9%) |
| Manufacturing | 79 (92.9%) | 6 (7.1%) |
| Wholesale Trade | 53 (82.8%) | 11 (17.2%) |
| Retail Trade | 104 (28.6%) | 259 (71.4%) |
| Transportation & Warehousing | 26 (100.0%) | 0 (0.0%) |
| Utilities | 0 (0.0%) | 0 (0.0%) |
| Information | 36 (46.2%) | 42 (53.8%) |
| Finance & Insurance | 39 (58.2%) | 28 (41.8%) |
| Real Estate, Rental & Leasing | 148 (54.0%) | 126 (46.0%) |
| Professional & Scientific | 173 (70.3%) | 73 (29.7%) |
| Enterprise Management | 38 (79.2%) | 10 (20.8%) |
| Administrative & Support | 24 (36.9%) | 41 (63.1%) |
| Educational Services | 30 (37.0%) | 51 (63.0%) |
| Health Care & Social Assistance | 56 (43.8%) | 72 (56.2%) |
| Arts, Entertainment & Recreation | 41 (77.4%) | 12 (22.6%) |
| Accommodation & Food Services | 10 (12.7%) | 69 (87.3%) |
| Public Administration | 5 (17.9%) | 23 (82.1%) |
| Total | 1,073 (53.9%) | 917 (46.1%) |
Education in Sanibel
School Enrollment in Sanibel
The most common levels of schooling among the 293 students in Sanibel are college / undergraduate (125 | 42.7%), elementary school (57 | 19.5%), and graduate / professional (34 | 11.6%).
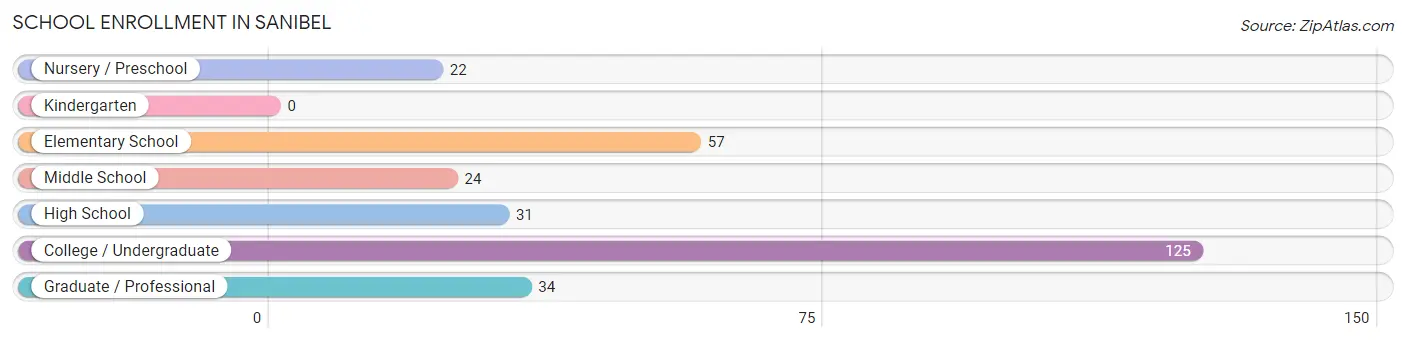
| School Level | # Students | % Students |
| Nursery / Preschool | 22 | 7.5% |
| Kindergarten | 0 | 0.0% |
| Elementary School | 57 | 19.5% |
| Middle School | 24 | 8.2% |
| High School | 31 | 10.6% |
| College / Undergraduate | 125 | 42.7% |
| Graduate / Professional | 34 | 11.6% |
| Total | 293 | 100.0% |
School Enrollment by Age by Funding Source in Sanibel
Out of a total of 293 students who are enrolled in schools in Sanibel, 102 (34.8%) attend a private institution, while the remaining 191 (65.2%) are enrolled in public schools. The age group of 20 to 24 year olds has the highest likelihood of being enrolled in private schools, with 38 (77.5% in the age bracket) enrolled. Conversely, the age group of 3 to 4 year olds has the lowest likelihood of being enrolled in a private school, with 22 (100.0% in the age bracket) attending a public institution.
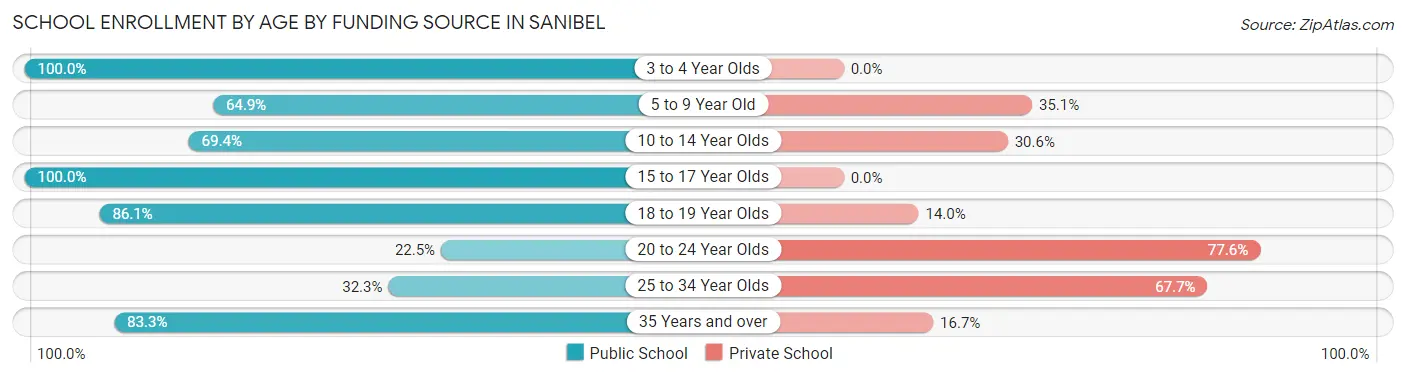
| Age Bracket | Public School | Private School |
| 3 to 4 Year Olds | 22 (100.0%) | 0 (0.0%) |
| 5 to 9 Year Old | 37 (64.9%) | 20 (35.1%) |
| 10 to 14 Year Olds | 25 (69.4%) | 11 (30.6%) |
| 15 to 17 Year Olds | 19 (100.0%) | 0 (0.0%) |
| 18 to 19 Year Olds | 37 (86.1%) | 6 (14.0%) |
| 20 to 24 Year Olds | 11 (22.5%) | 38 (77.5%) |
| 25 to 34 Year Olds | 10 (32.3%) | 21 (67.7%) |
| 35 Years and over | 30 (83.3%) | 6 (16.7%) |
| Total | 191 (65.2%) | 102 (34.8%) |
Educational Attainment by Field of Study in Sanibel
Business (746 | 19.0%), social sciences (648 | 16.5%), education (552 | 14.1%), engineering (296 | 7.5%), and literature & languages (283 | 7.2%) are the most common fields of study among 3,924 individuals in Sanibel who have obtained a bachelor's degree or higher.
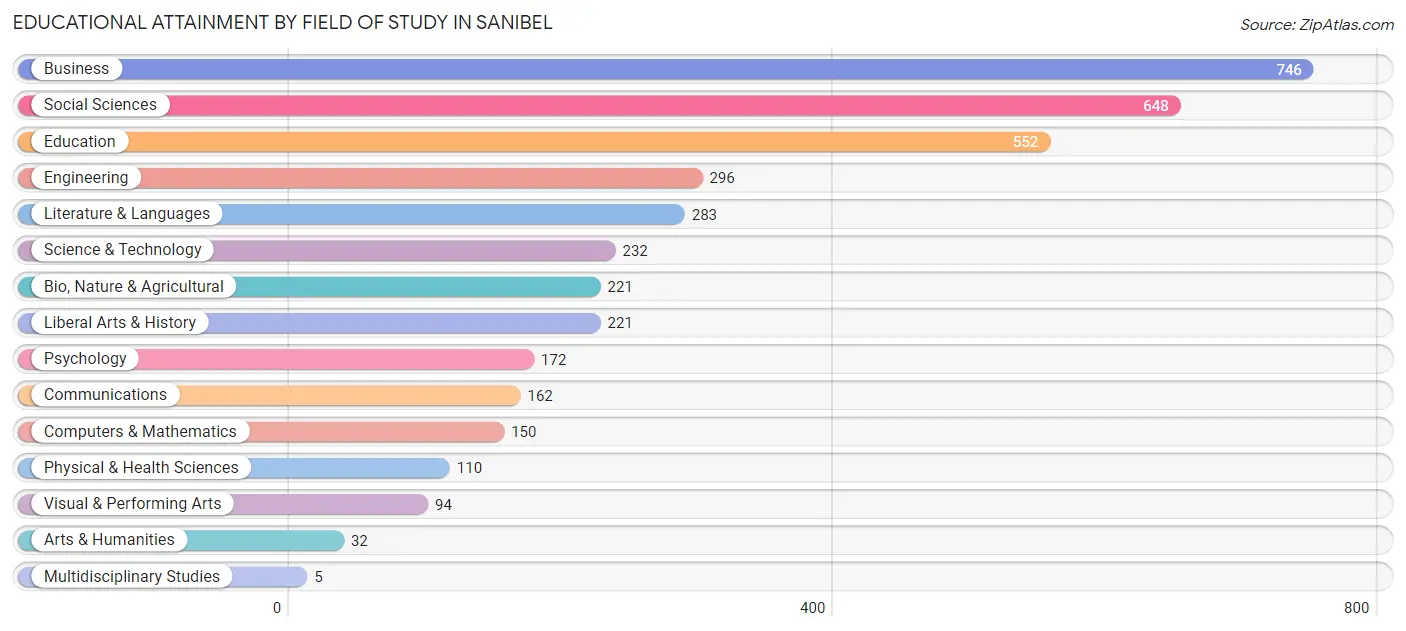
| Field of Study | # Graduates | % Graduates |
| Computers & Mathematics | 150 | 3.8% |
| Bio, Nature & Agricultural | 221 | 5.6% |
| Physical & Health Sciences | 110 | 2.8% |
| Psychology | 172 | 4.4% |
| Social Sciences | 648 | 16.5% |
| Engineering | 296 | 7.5% |
| Multidisciplinary Studies | 5 | 0.1% |
| Science & Technology | 232 | 5.9% |
| Business | 746 | 19.0% |
| Education | 552 | 14.1% |
| Literature & Languages | 283 | 7.2% |
| Liberal Arts & History | 221 | 5.6% |
| Visual & Performing Arts | 94 | 2.4% |
| Communications | 162 | 4.1% |
| Arts & Humanities | 32 | 0.8% |
| Total | 3,924 | 100.0% |
Transportation & Commute in Sanibel
Vehicle Availability by Sex in Sanibel
The most prevalent vehicle ownership categories in Sanibel are males with 2 vehicles (557, accounting for 53.5%) and females with 2 vehicles (449, making up 62.9%).
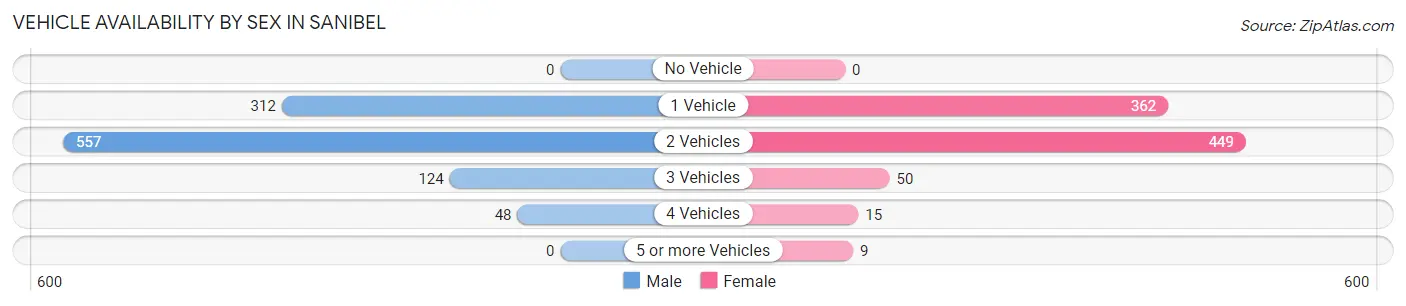
| Vehicles Available | Male | Female |
| No Vehicle | 0 (0.0%) | 0 (0.0%) |
| 1 Vehicle | 312 (30.0%) | 362 (40.9%) |
| 2 Vehicles | 557 (53.5%) | 449 (50.7%) |
| 3 Vehicles | 124 (11.9%) | 50 (5.7%) |
| 4 Vehicles | 48 (4.6%) | 15 (1.7%) |
| 5 or more Vehicles | 0 (0.0%) | 9 (1.0%) |
| Total | 1,041 (100.0%) | 885 (100.0%) |
Commute Time in Sanibel
The most frequently occuring commute durations in Sanibel are 5 to 9 minutes (343 commuters, 26.0%), 10 to 14 minutes (250 commuters, 19.0%), and 15 to 19 minutes (199 commuters, 15.1%).
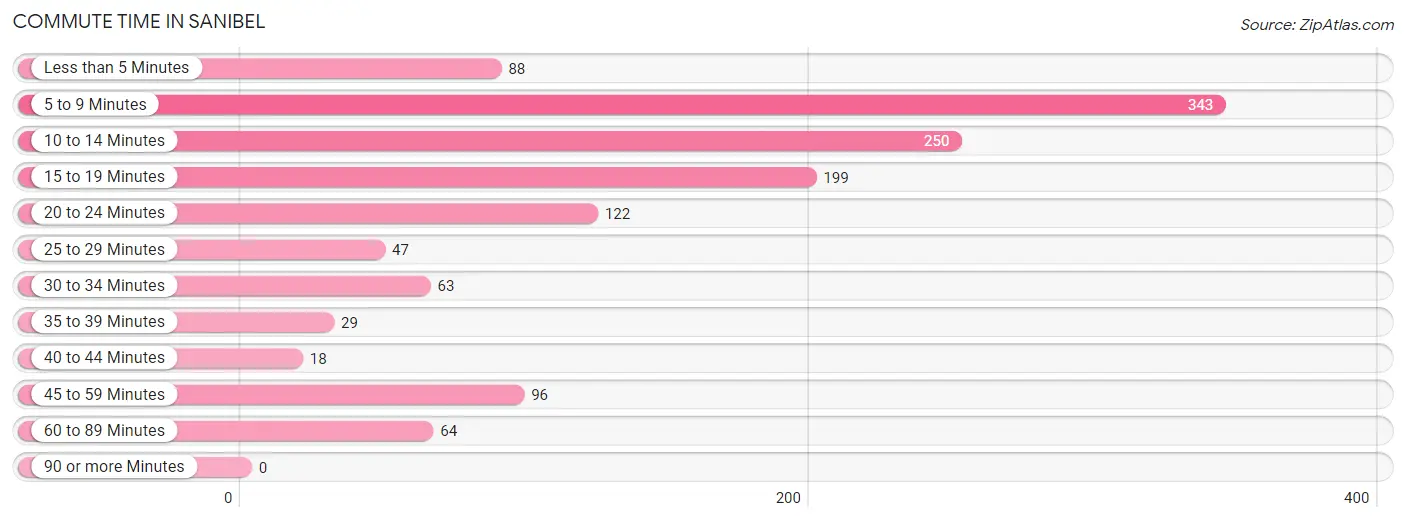
| Commute Time | # Commuters | % Commuters |
| Less than 5 Minutes | 88 | 6.7% |
| 5 to 9 Minutes | 343 | 26.0% |
| 10 to 14 Minutes | 250 | 19.0% |
| 15 to 19 Minutes | 199 | 15.1% |
| 20 to 24 Minutes | 122 | 9.2% |
| 25 to 29 Minutes | 47 | 3.6% |
| 30 to 34 Minutes | 63 | 4.8% |
| 35 to 39 Minutes | 29 | 2.2% |
| 40 to 44 Minutes | 18 | 1.4% |
| 45 to 59 Minutes | 96 | 7.3% |
| 60 to 89 Minutes | 64 | 4.9% |
| 90 or more Minutes | 0 | 0.0% |
Commute Time by Sex in Sanibel
The most common commute times in Sanibel are 10 to 14 minutes (154 commuters, 22.9%) for males and 5 to 9 minutes (258 commuters, 39.9%) for females.
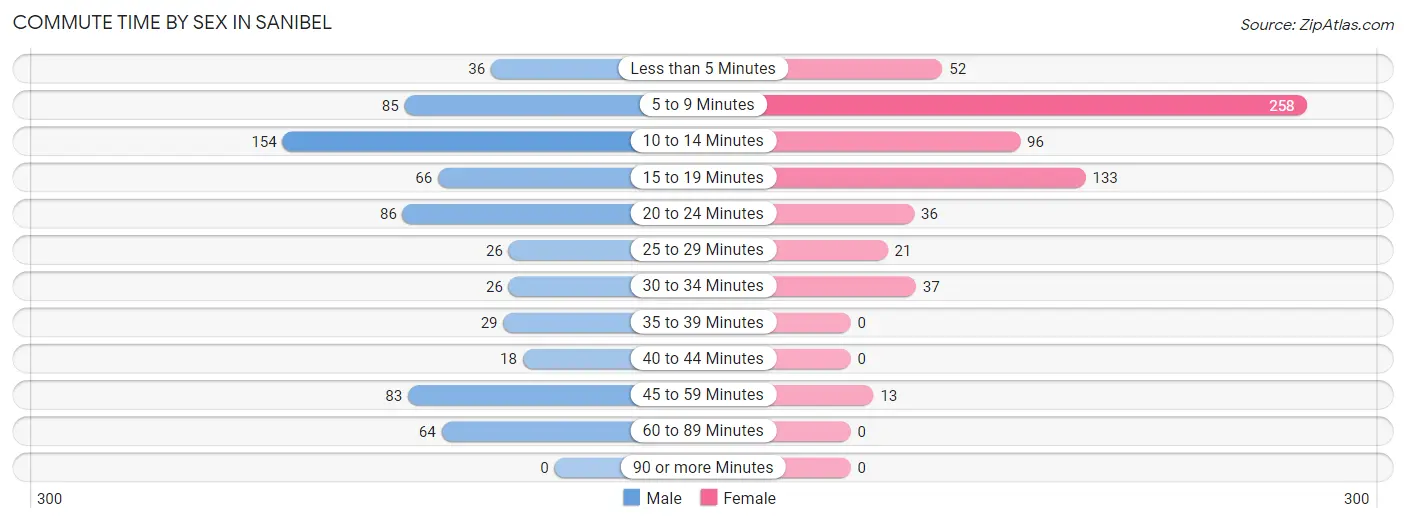
| Commute Time | Male | Female |
| Less than 5 Minutes | 36 (5.3%) | 52 (8.1%) |
| 5 to 9 Minutes | 85 (12.6%) | 258 (39.9%) |
| 10 to 14 Minutes | 154 (22.9%) | 96 (14.9%) |
| 15 to 19 Minutes | 66 (9.8%) | 133 (20.6%) |
| 20 to 24 Minutes | 86 (12.8%) | 36 (5.6%) |
| 25 to 29 Minutes | 26 (3.9%) | 21 (3.3%) |
| 30 to 34 Minutes | 26 (3.9%) | 37 (5.7%) |
| 35 to 39 Minutes | 29 (4.3%) | 0 (0.0%) |
| 40 to 44 Minutes | 18 (2.7%) | 0 (0.0%) |
| 45 to 59 Minutes | 83 (12.3%) | 13 (2.0%) |
| 60 to 89 Minutes | 64 (9.5%) | 0 (0.0%) |
| 90 or more Minutes | 0 (0.0%) | 0 (0.0%) |
Time of Departure to Work by Sex in Sanibel
The most frequent times of departure to work in Sanibel are 8:00 AM to 8:29 AM (154, 22.9%) for males and 9:00 AM to 9:59 AM (199, 30.8%) for females.
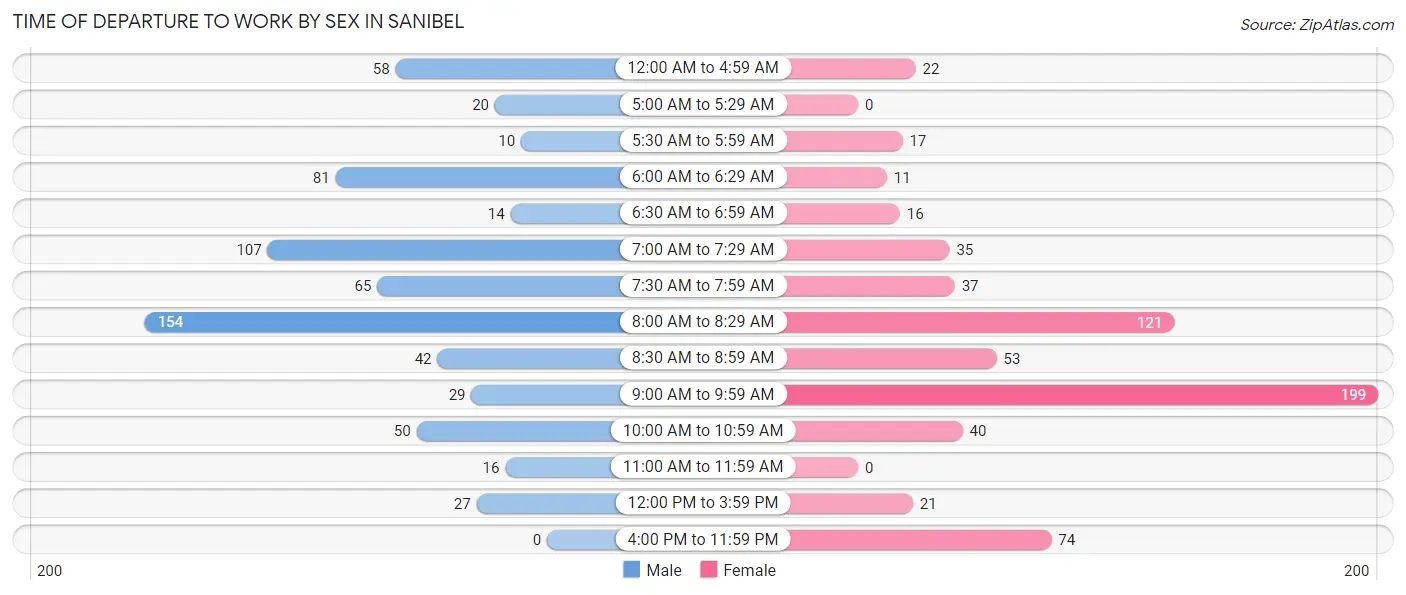
| Time of Departure | Male | Female |
| 12:00 AM to 4:59 AM | 58 (8.6%) | 22 (3.4%) |
| 5:00 AM to 5:29 AM | 20 (3.0%) | 0 (0.0%) |
| 5:30 AM to 5:59 AM | 10 (1.5%) | 17 (2.6%) |
| 6:00 AM to 6:29 AM | 81 (12.0%) | 11 (1.7%) |
| 6:30 AM to 6:59 AM | 14 (2.1%) | 16 (2.5%) |
| 7:00 AM to 7:29 AM | 107 (15.9%) | 35 (5.4%) |
| 7:30 AM to 7:59 AM | 65 (9.7%) | 37 (5.7%) |
| 8:00 AM to 8:29 AM | 154 (22.9%) | 121 (18.7%) |
| 8:30 AM to 8:59 AM | 42 (6.2%) | 53 (8.2%) |
| 9:00 AM to 9:59 AM | 29 (4.3%) | 199 (30.8%) |
| 10:00 AM to 10:59 AM | 50 (7.4%) | 40 (6.2%) |
| 11:00 AM to 11:59 AM | 16 (2.4%) | 0 (0.0%) |
| 12:00 PM to 3:59 PM | 27 (4.0%) | 21 (3.3%) |
| 4:00 PM to 11:59 PM | 0 (0.0%) | 74 (11.5%) |
| Total | 673 (100.0%) | 646 (100.0%) |
Housing Occupancy in Sanibel
Occupancy by Ownership in Sanibel
Of the total 3,491 dwellings in Sanibel, owner-occupied units account for 3,133 (89.7%), while renter-occupied units make up 358 (10.2%).
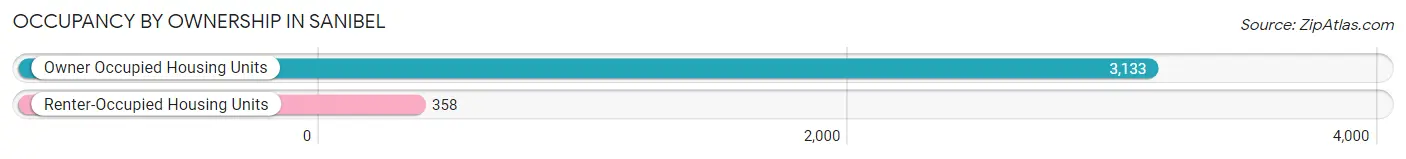
| Occupancy | # Housing Units | % Housing Units |
| Owner Occupied Housing Units | 3,133 | 89.7% |
| Renter-Occupied Housing Units | 358 | 10.2% |
| Total Occupied Housing Units | 3,491 | 100.0% |
Occupancy by Household Size in Sanibel
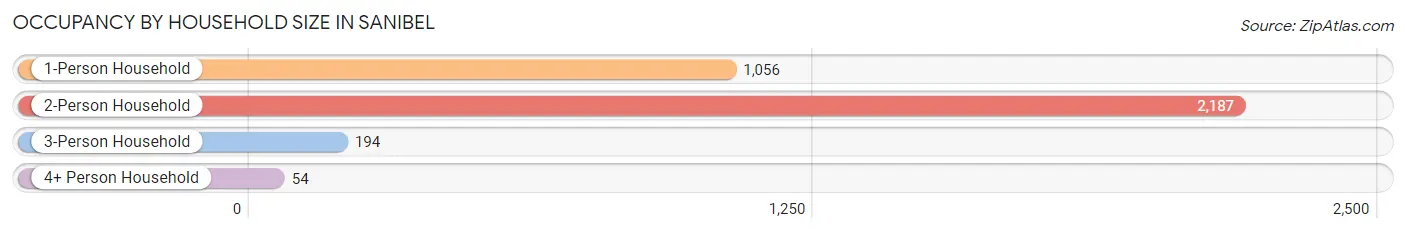
| Household Size | # Housing Units | % Housing Units |
| 1-Person Household | 1,056 | 30.2% |
| 2-Person Household | 2,187 | 62.6% |
| 3-Person Household | 194 | 5.6% |
| 4+ Person Household | 54 | 1.5% |
| Total Housing Units | 3,491 | 100.0% |
Occupancy by Ownership by Household Size in Sanibel
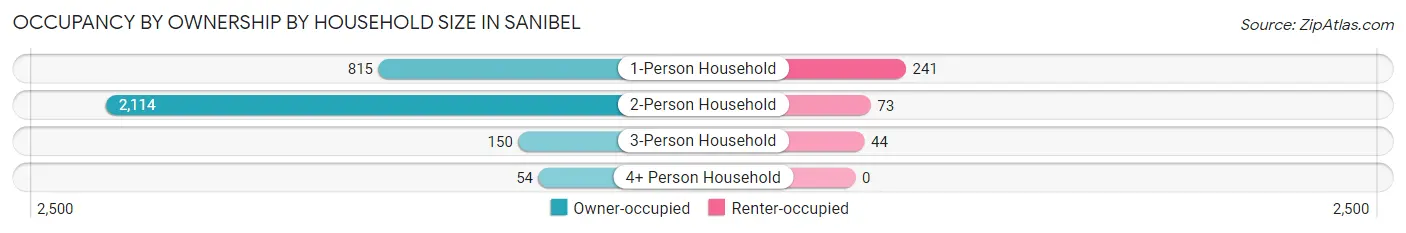
| Household Size | Owner-occupied | Renter-occupied |
| 1-Person Household | 815 (77.2%) | 241 (22.8%) |
| 2-Person Household | 2,114 (96.7%) | 73 (3.3%) |
| 3-Person Household | 150 (77.3%) | 44 (22.7%) |
| 4+ Person Household | 54 (100.0%) | 0 (0.0%) |
| Total Housing Units | 3,133 (89.7%) | 358 (10.2%) |
Occupancy by Educational Attainment in Sanibel
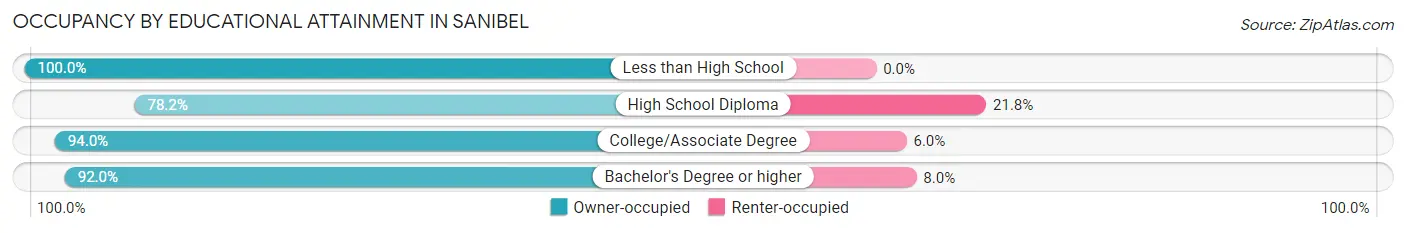
| Household Size | Owner-occupied | Renter-occupied |
| Less than High School | 10 (100.0%) | 0 (0.0%) |
| High School Diploma | 520 (78.2%) | 145 (21.8%) |
| College/Associate Degree | 562 (94.0%) | 36 (6.0%) |
| Bachelor's Degree or higher | 2,041 (92.0%) | 177 (8.0%) |
Occupancy by Age of Householder in Sanibel
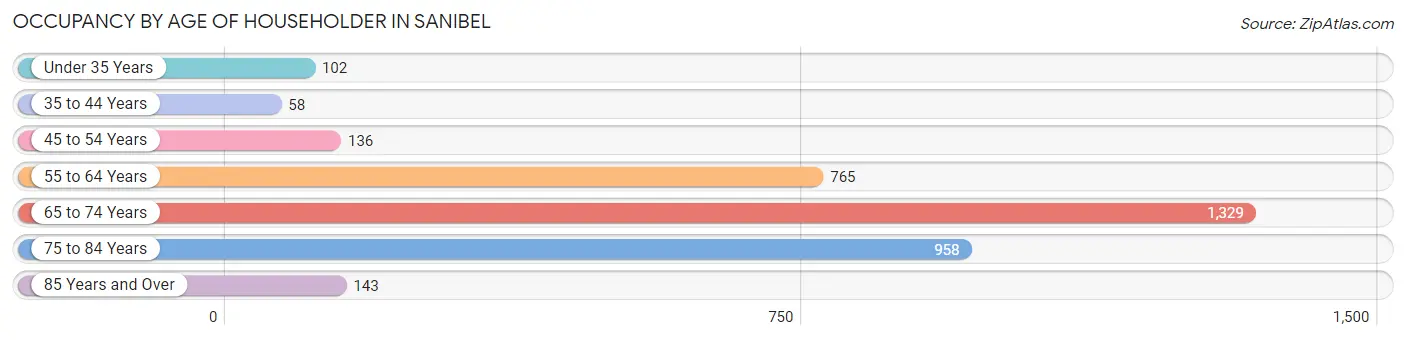
| Age Bracket | # Households | % Households |
| Under 35 Years | 102 | 2.9% |
| 35 to 44 Years | 58 | 1.7% |
| 45 to 54 Years | 136 | 3.9% |
| 55 to 64 Years | 765 | 21.9% |
| 65 to 74 Years | 1,329 | 38.1% |
| 75 to 84 Years | 958 | 27.4% |
| 85 Years and Over | 143 | 4.1% |
| Total | 3,491 | 100.0% |
Housing Finances in Sanibel
Median Income by Occupancy in Sanibel
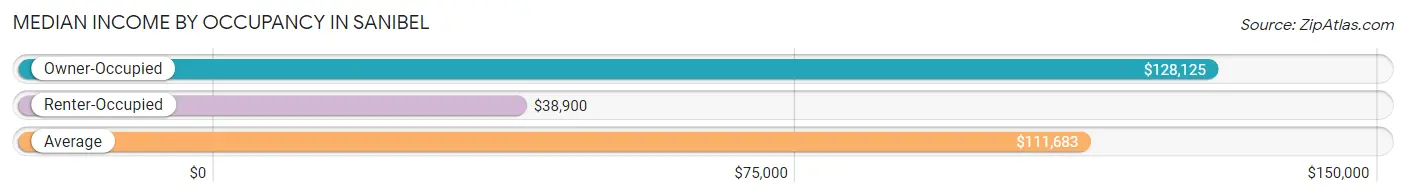
| Occupancy Type | # Households | Median Income |
| Owner-Occupied | 3,133 (89.7%) | $128,125 |
| Renter-Occupied | 358 (10.2%) | $38,900 |
| Average | 3,491 (100.0%) | $111,683 |
Occupancy by Householder Income Bracket in Sanibel
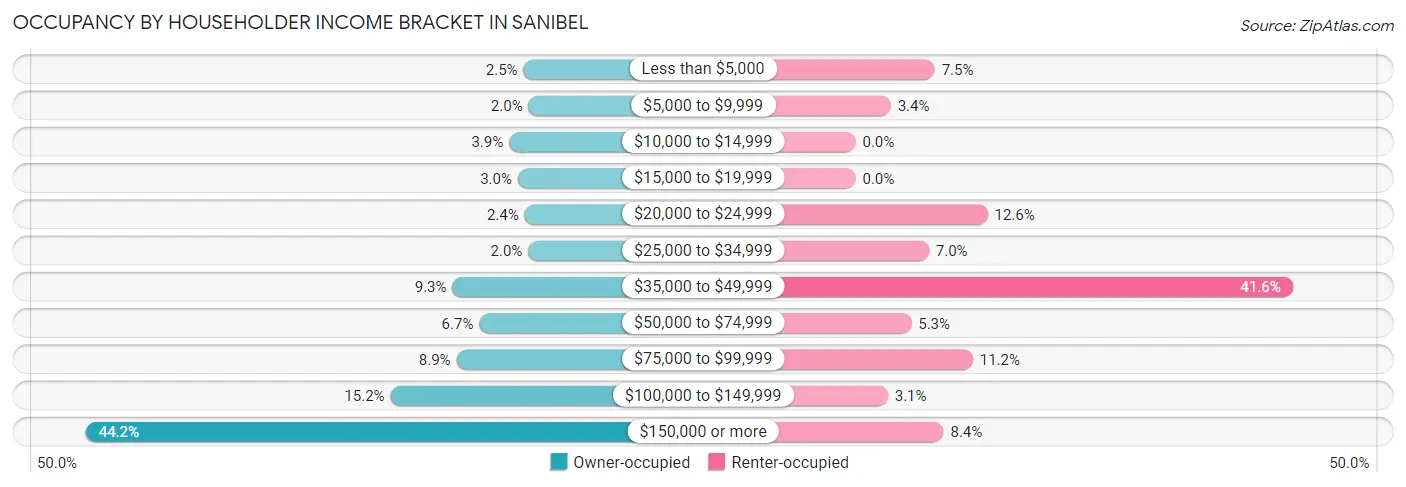
| Income Bracket | Owner-occupied | Renter-occupied |
| Less than $5,000 | 78 (2.5%) | 27 (7.5%) |
| $5,000 to $9,999 | 63 (2.0%) | 12 (3.4%) |
| $10,000 to $14,999 | 121 (3.9%) | 0 (0.0%) |
| $15,000 to $19,999 | 95 (3.0%) | 0 (0.0%) |
| $20,000 to $24,999 | 75 (2.4%) | 45 (12.6%) |
| $25,000 to $34,999 | 64 (2.0%) | 25 (7.0%) |
| $35,000 to $49,999 | 290 (9.3%) | 149 (41.6%) |
| $50,000 to $74,999 | 210 (6.7%) | 19 (5.3%) |
| $75,000 to $99,999 | 278 (8.9%) | 40 (11.2%) |
| $100,000 to $149,999 | 475 (15.2%) | 11 (3.1%) |
| $150,000 or more | 1,384 (44.2%) | 30 (8.4%) |
| Total | 3,133 (100.0%) | 358 (100.0%) |
Monthly Housing Cost Tiers in Sanibel
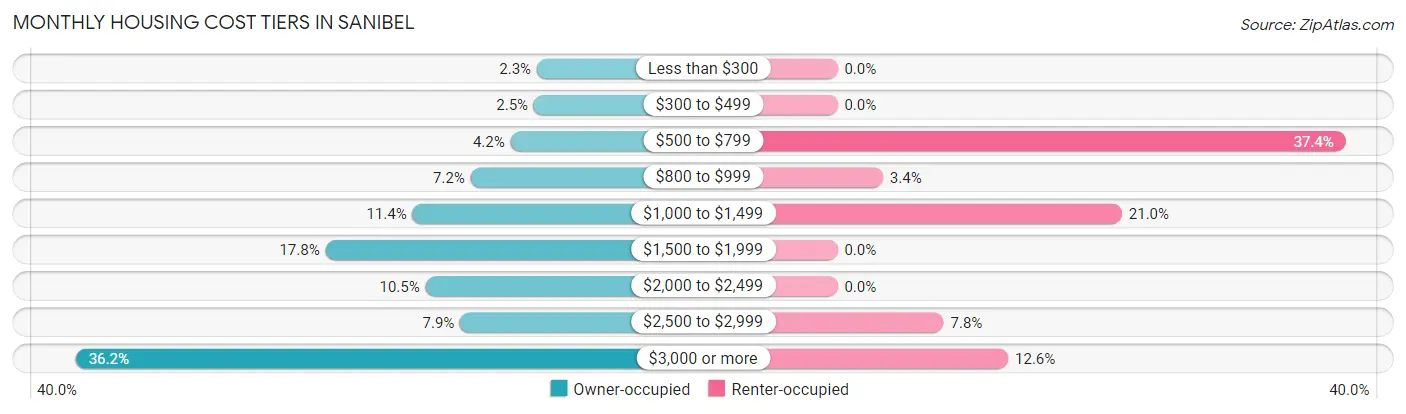
| Monthly Cost | Owner-occupied | Renter-occupied |
| Less than $300 | 71 (2.3%) | 0 (0.0%) |
| $300 to $499 | 78 (2.5%) | 0 (0.0%) |
| $500 to $799 | 132 (4.2%) | 134 (37.4%) |
| $800 to $999 | 224 (7.1%) | 12 (3.4%) |
| $1,000 to $1,499 | 358 (11.4%) | 75 (20.9%) |
| $1,500 to $1,999 | 559 (17.8%) | 0 (0.0%) |
| $2,000 to $2,499 | 328 (10.5%) | 0 (0.0%) |
| $2,500 to $2,999 | 248 (7.9%) | 28 (7.8%) |
| $3,000 or more | 1,135 (36.2%) | 45 (12.6%) |
| Total | 3,133 (100.0%) | 358 (100.0%) |
Physical Housing Characteristics in Sanibel
Housing Structures in Sanibel
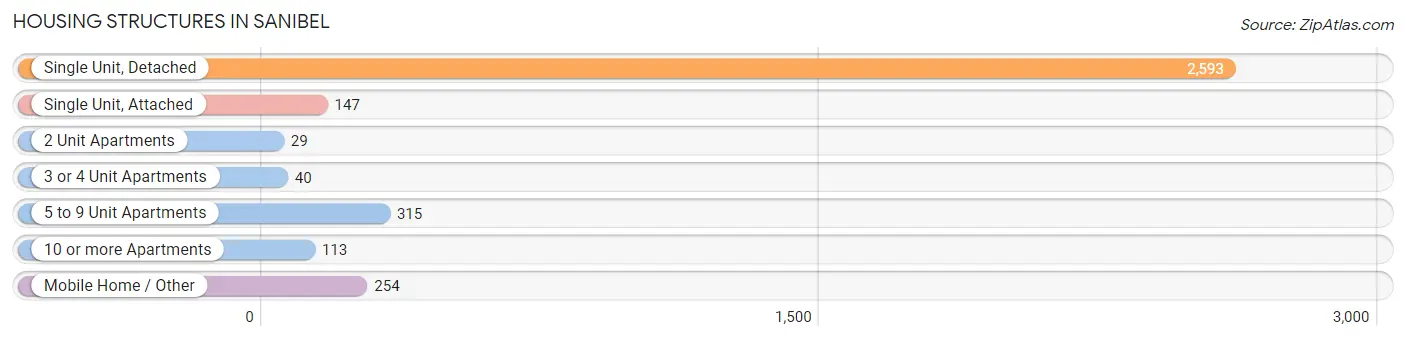
| Structure Type | # Housing Units | % Housing Units |
| Single Unit, Detached | 2,593 | 74.3% |
| Single Unit, Attached | 147 | 4.2% |
| 2 Unit Apartments | 29 | 0.8% |
| 3 or 4 Unit Apartments | 40 | 1.1% |
| 5 to 9 Unit Apartments | 315 | 9.0% |
| 10 or more Apartments | 113 | 3.2% |
| Mobile Home / Other | 254 | 7.3% |
| Total | 3,491 | 100.0% |
Housing Structures by Occupancy in Sanibel
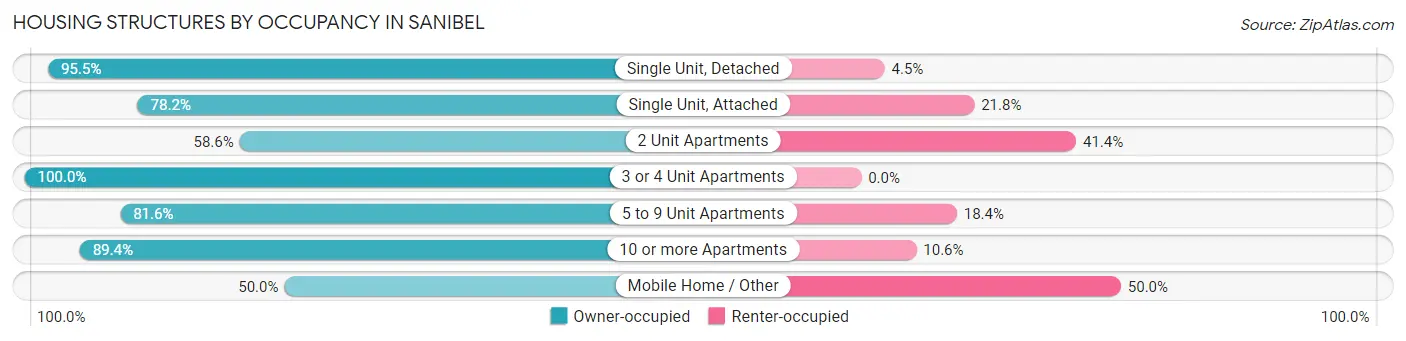
| Structure Type | Owner-occupied | Renter-occupied |
| Single Unit, Detached | 2,476 (95.5%) | 117 (4.5%) |
| Single Unit, Attached | 115 (78.2%) | 32 (21.8%) |
| 2 Unit Apartments | 17 (58.6%) | 12 (41.4%) |
| 3 or 4 Unit Apartments | 40 (100.0%) | 0 (0.0%) |
| 5 to 9 Unit Apartments | 257 (81.6%) | 58 (18.4%) |
| 10 or more Apartments | 101 (89.4%) | 12 (10.6%) |
| Mobile Home / Other | 127 (50.0%) | 127 (50.0%) |
| Total | 3,133 (89.7%) | 358 (10.2%) |
Housing Structures by Number of Rooms in Sanibel
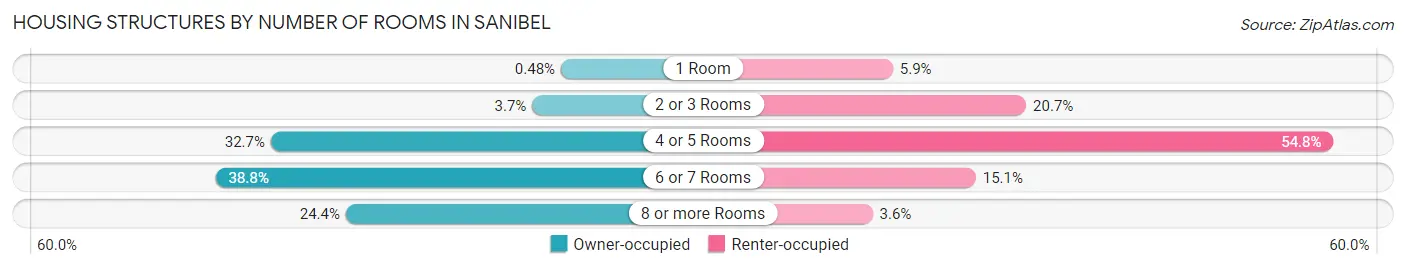
| Number of Rooms | Owner-occupied | Renter-occupied |
| 1 Room | 15 (0.5%) | 21 (5.9%) |
| 2 or 3 Rooms | 115 (3.7%) | 74 (20.7%) |
| 4 or 5 Rooms | 1,024 (32.7%) | 196 (54.7%) |
| 6 or 7 Rooms | 1,216 (38.8%) | 54 (15.1%) |
| 8 or more Rooms | 763 (24.3%) | 13 (3.6%) |
| Total | 3,133 (100.0%) | 358 (100.0%) |
Housing Structure by Heating Type in Sanibel
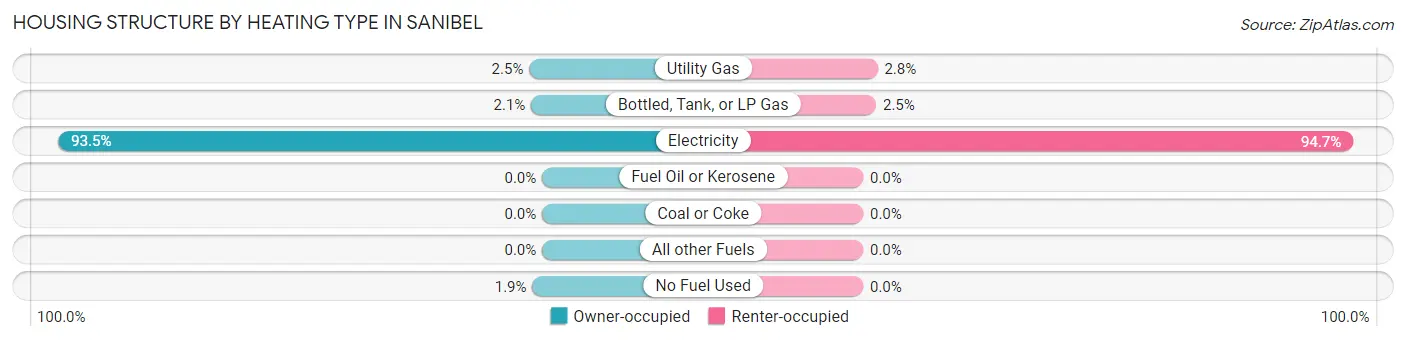
| Heating Type | Owner-occupied | Renter-occupied |
| Utility Gas | 78 (2.5%) | 10 (2.8%) |
| Bottled, Tank, or LP Gas | 66 (2.1%) | 9 (2.5%) |
| Electricity | 2,930 (93.5%) | 339 (94.7%) |
| Fuel Oil or Kerosene | 0 (0.0%) | 0 (0.0%) |
| Coal or Coke | 0 (0.0%) | 0 (0.0%) |
| All other Fuels | 0 (0.0%) | 0 (0.0%) |
| No Fuel Used | 59 (1.9%) | 0 (0.0%) |
| Total | 3,133 (100.0%) | 358 (100.0%) |
Household Vehicle Usage in Sanibel
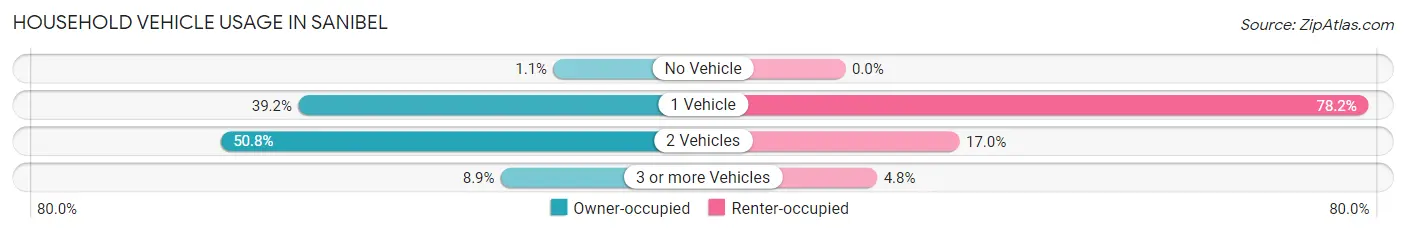
| Vehicles per Household | Owner-occupied | Renter-occupied |
| No Vehicle | 34 (1.1%) | 0 (0.0%) |
| 1 Vehicle | 1,228 (39.2%) | 280 (78.2%) |
| 2 Vehicles | 1,591 (50.8%) | 61 (17.0%) |
| 3 or more Vehicles | 280 (8.9%) | 17 (4.8%) |
| Total | 3,133 (100.0%) | 358 (100.0%) |
Real Estate & Mortgages in Sanibel
Real Estate and Mortgage Overview in Sanibel
| Characteristic | Without Mortgage | With Mortgage |
| Housing Units | 1,792 | 1,341 |
| Median Property Value | $974,500 | $681,400 |
| Median Household Income | $140,526 | $567 |
| Monthly Housing Costs | $1,501 | $1,005 |
| Real Estate Taxes | $9,464 | $10 |
Property Value by Mortgage Status in Sanibel
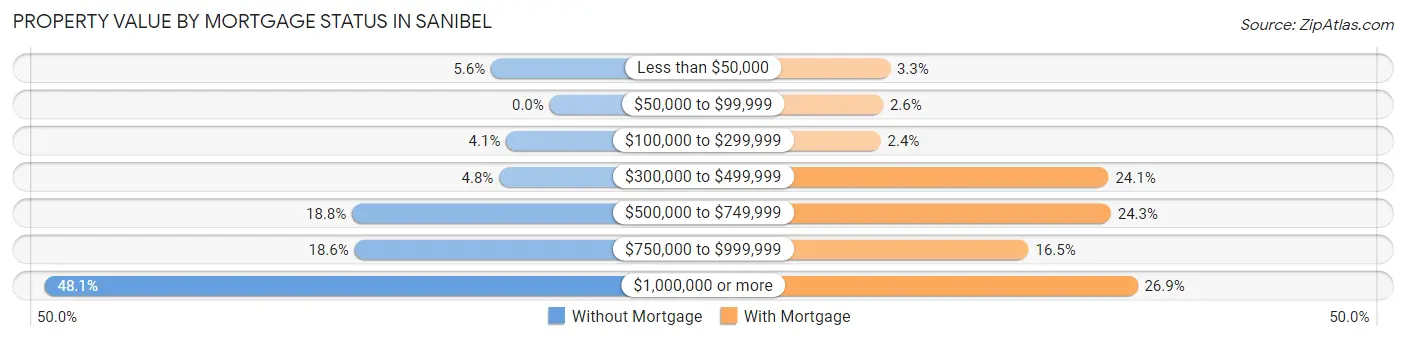
| Property Value | Without Mortgage | With Mortgage |
| Less than $50,000 | 100 (5.6%) | 44 (3.3%) |
| $50,000 to $99,999 | 0 (0.0%) | 35 (2.6%) |
| $100,000 to $299,999 | 74 (4.1%) | 32 (2.4%) |
| $300,000 to $499,999 | 86 (4.8%) | 323 (24.1%) |
| $500,000 to $749,999 | 337 (18.8%) | 326 (24.3%) |
| $750,000 to $999,999 | 333 (18.6%) | 221 (16.5%) |
| $1,000,000 or more | 862 (48.1%) | 360 (26.9%) |
| Total | 1,792 (100.0%) | 1,341 (100.0%) |
Household Income by Mortgage Status in Sanibel
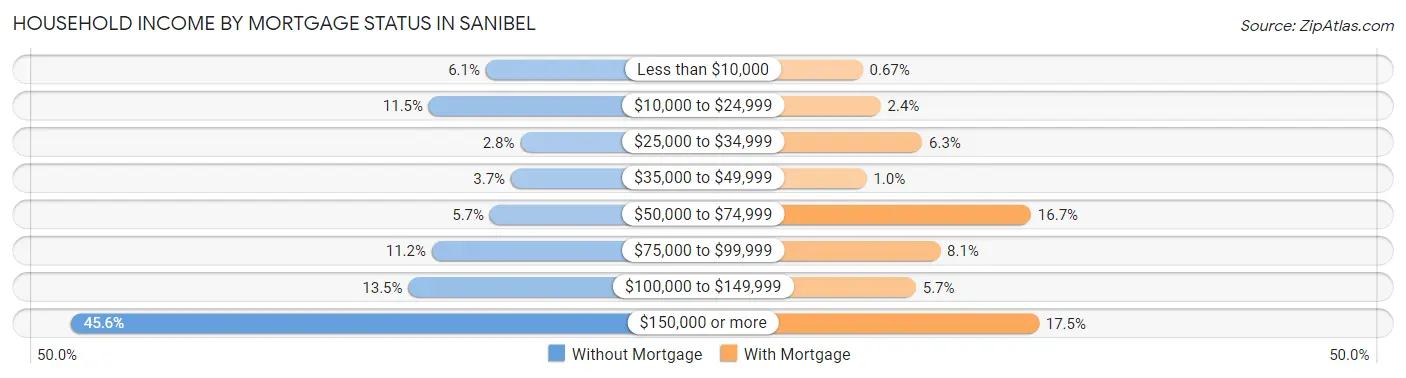
| Household Income | Without Mortgage | With Mortgage |
| Less than $10,000 | 109 (6.1%) | 9 (0.7%) |
| $10,000 to $24,999 | 206 (11.5%) | 32 (2.4%) |
| $25,000 to $34,999 | 50 (2.8%) | 85 (6.3%) |
| $35,000 to $49,999 | 66 (3.7%) | 14 (1.0%) |
| $50,000 to $74,999 | 102 (5.7%) | 224 (16.7%) |
| $75,000 to $99,999 | 201 (11.2%) | 108 (8.1%) |
| $100,000 to $149,999 | 241 (13.5%) | 77 (5.7%) |
| $150,000 or more | 817 (45.6%) | 234 (17.4%) |
| Total | 1,792 (100.0%) | 1,341 (100.0%) |
Property Value to Household Income Ratio in Sanibel
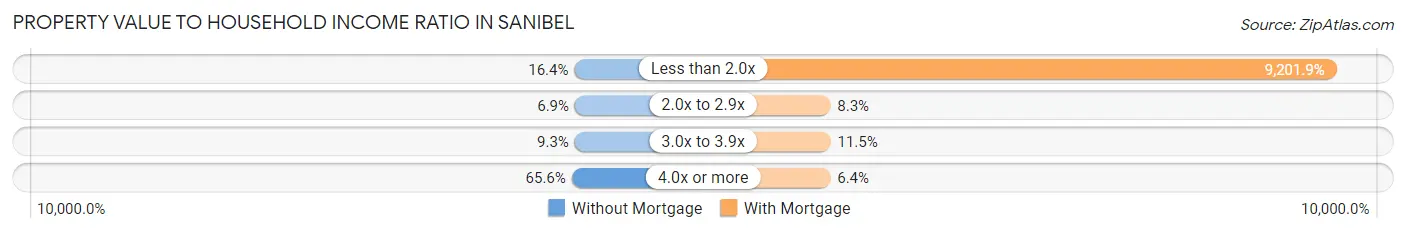
| Value-to-Income Ratio | Without Mortgage | With Mortgage |
| Less than 2.0x | 294 (16.4%) | 123,398 (9,201.9%) |
| 2.0x to 2.9x | 124 (6.9%) | 111 (8.3%) |
| 3.0x to 3.9x | 167 (9.3%) | 154 (11.5%) |
| 4.0x or more | 1,176 (65.6%) | 86 (6.4%) |
| Total | 1,792 (100.0%) | 1,341 (100.0%) |
Real Estate Taxes by Mortgage Status in Sanibel
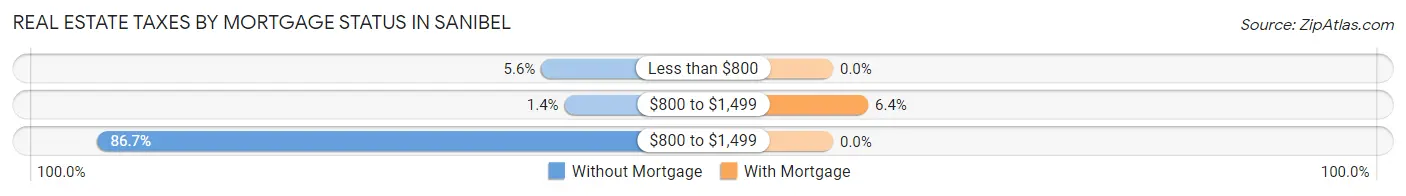
| Property Taxes | Without Mortgage | With Mortgage |
| Less than $800 | 101 (5.6%) | 0 (0.0%) |
| $800 to $1,499 | 25 (1.4%) | 86 (6.4%) |
| $800 to $1,499 | 1,553 (86.7%) | 0 (0.0%) |
| Total | 1,792 (100.0%) | 1,341 (100.0%) |
Health & Disability in Sanibel
Health Insurance Coverage by Age in Sanibel
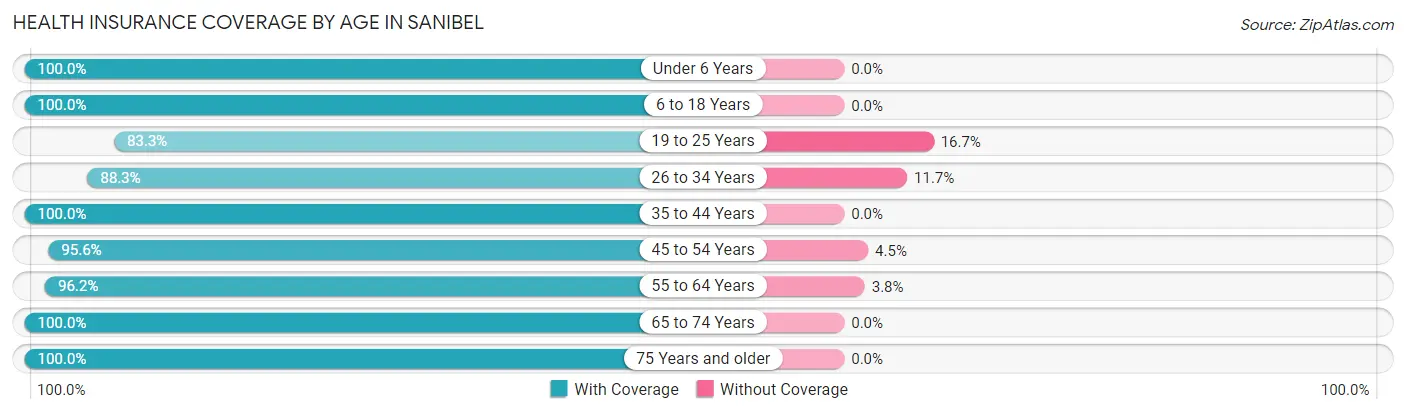
| Age Bracket | With Coverage | Without Coverage |
| Under 6 Years | 22 (100.0%) | 0 (0.0%) |
| 6 to 18 Years | 137 (100.0%) | 0 (0.0%) |
| 19 to 25 Years | 150 (83.3%) | 30 (16.7%) |
| 26 to 34 Years | 98 (88.3%) | 13 (11.7%) |
| 35 to 44 Years | 208 (100.0%) | 0 (0.0%) |
| 45 to 54 Years | 279 (95.6%) | 13 (4.4%) |
| 55 to 64 Years | 1,333 (96.2%) | 53 (3.8%) |
| 65 to 74 Years | 2,375 (100.0%) | 0 (0.0%) |
| 75 Years and older | 1,709 (100.0%) | 0 (0.0%) |
| Total | 6,311 (98.3%) | 109 (1.7%) |
Health Insurance Coverage by Citizenship Status in Sanibel
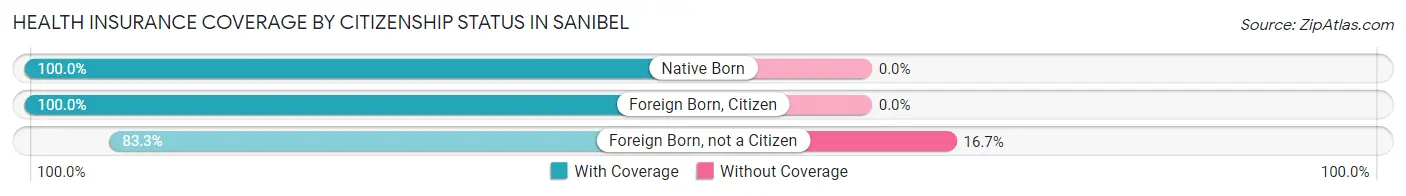
| Citizenship Status | With Coverage | Without Coverage |
| Native Born | 22 (100.0%) | 0 (0.0%) |
| Foreign Born, Citizen | 137 (100.0%) | 0 (0.0%) |
| Foreign Born, not a Citizen | 150 (83.3%) | 30 (16.7%) |
Health Insurance Coverage by Household Income in Sanibel
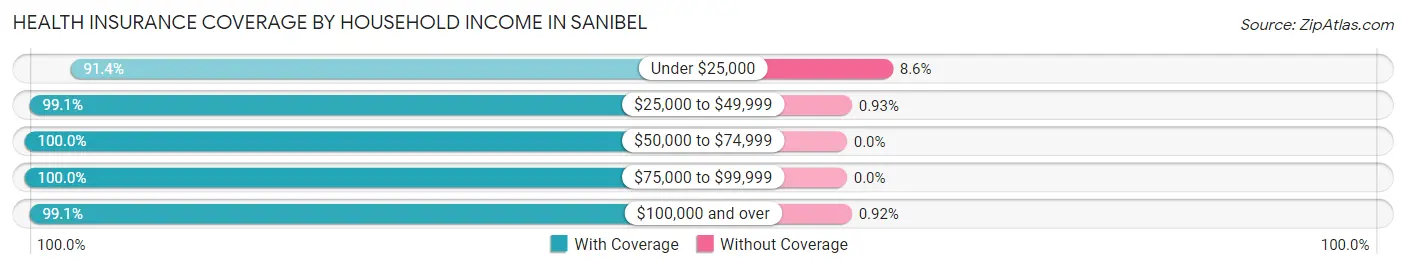
| Household Income | With Coverage | Without Coverage |
| Under $25,000 | 689 (91.4%) | 65 (8.6%) |
| $25,000 to $49,999 | 850 (99.1%) | 8 (0.9%) |
| $50,000 to $74,999 | 408 (100.0%) | 0 (0.0%) |
| $75,000 to $99,999 | 589 (100.0%) | 0 (0.0%) |
| $100,000 and over | 3,755 (99.1%) | 35 (0.9%) |
Public vs Private Health Insurance Coverage by Age in Sanibel
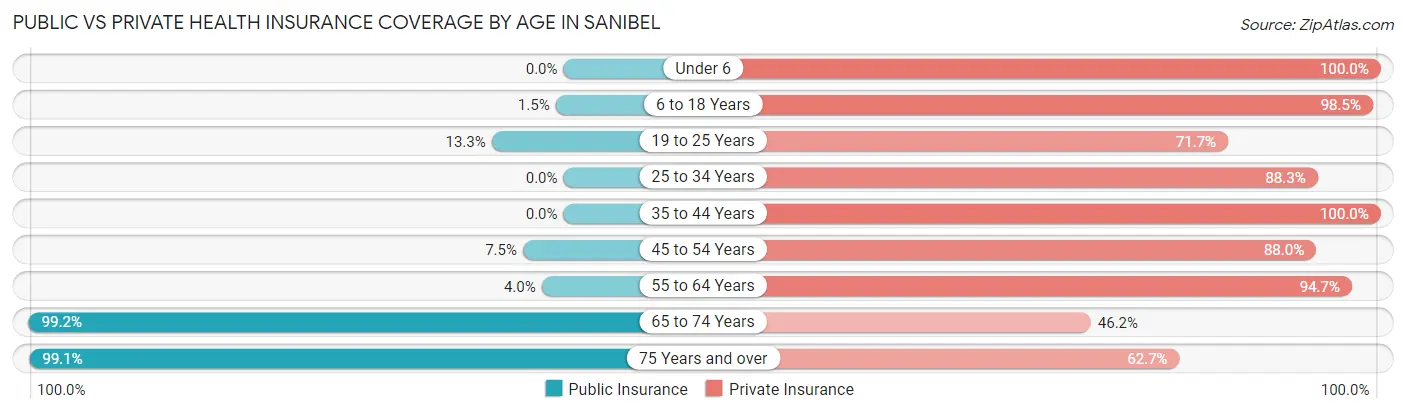
| Age Bracket | Public Insurance | Private Insurance |
| Under 6 | 0 (0.0%) | 22 (100.0%) |
| 6 to 18 Years | 2 (1.5%) | 135 (98.5%) |
| 19 to 25 Years | 24 (13.3%) | 129 (71.7%) |
| 25 to 34 Years | 0 (0.0%) | 98 (88.3%) |
| 35 to 44 Years | 0 (0.0%) | 208 (100.0%) |
| 45 to 54 Years | 22 (7.5%) | 257 (88.0%) |
| 55 to 64 Years | 56 (4.0%) | 1,312 (94.7%) |
| 65 to 74 Years | 2,357 (99.2%) | 1,098 (46.2%) |
| 75 Years and over | 1,694 (99.1%) | 1,071 (62.7%) |
| Total | 4,155 (64.7%) | 4,330 (67.4%) |
Disability Status by Sex by Age in Sanibel
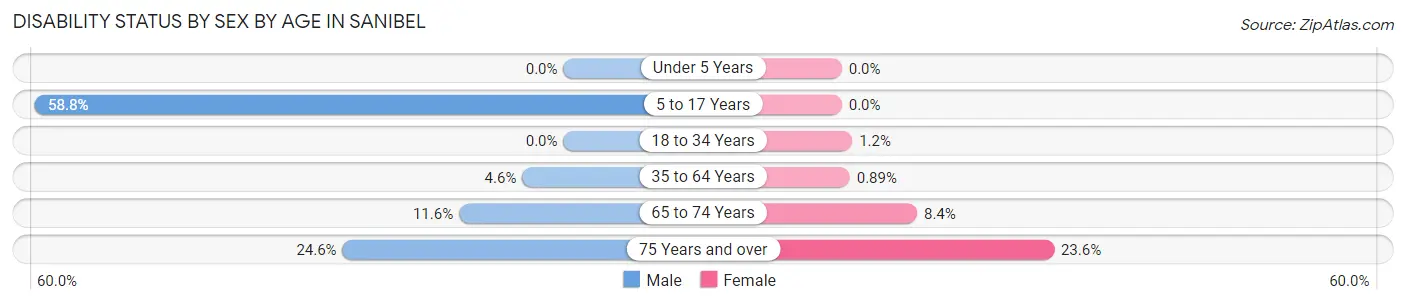
| Age Bracket | Male | Female |
| Under 5 Years | 0 (0.0%) | 0 (0.0%) |
| 5 to 17 Years | 20 (58.8%) | 0 (0.0%) |
| 18 to 34 Years | 0 (0.0%) | 2 (1.2%) |
| 35 to 64 Years | 35 (4.6%) | 10 (0.9%) |
| 65 to 74 Years | 136 (11.6%) | 101 (8.4%) |
| 75 Years and over | 232 (24.6%) | 181 (23.6%) |
Disability Class by Sex by Age in Sanibel
Disability Class: Hearing Difficulty
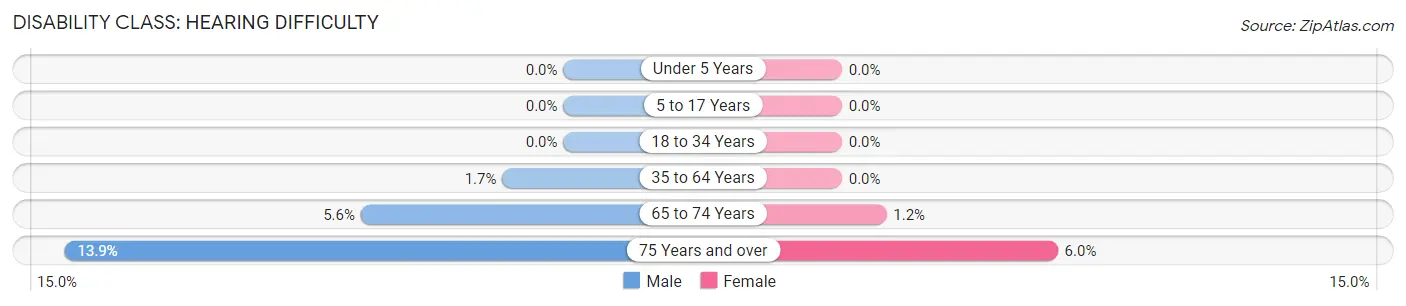
| Age Bracket | Male | Female |
| Under 5 Years | 0 (0.0%) | 0 (0.0%) |
| 5 to 17 Years | 0 (0.0%) | 0 (0.0%) |
| 18 to 34 Years | 0 (0.0%) | 0 (0.0%) |
| 35 to 64 Years | 13 (1.7%) | 0 (0.0%) |
| 65 to 74 Years | 66 (5.6%) | 15 (1.2%) |
| 75 Years and over | 131 (13.9%) | 46 (6.0%) |
Disability Class: Vision Difficulty
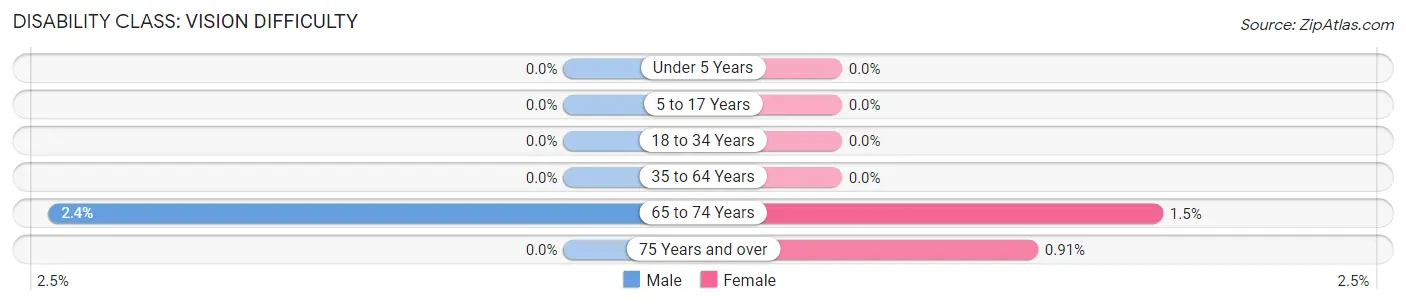
| Age Bracket | Male | Female |
| Under 5 Years | 0 (0.0%) | 0 (0.0%) |
| 5 to 17 Years | 0 (0.0%) | 0 (0.0%) |
| 18 to 34 Years | 0 (0.0%) | 0 (0.0%) |
| 35 to 64 Years | 0 (0.0%) | 0 (0.0%) |
| 65 to 74 Years | 28 (2.4%) | 18 (1.5%) |
| 75 Years and over | 0 (0.0%) | 7 (0.9%) |
Disability Class: Cognitive Difficulty
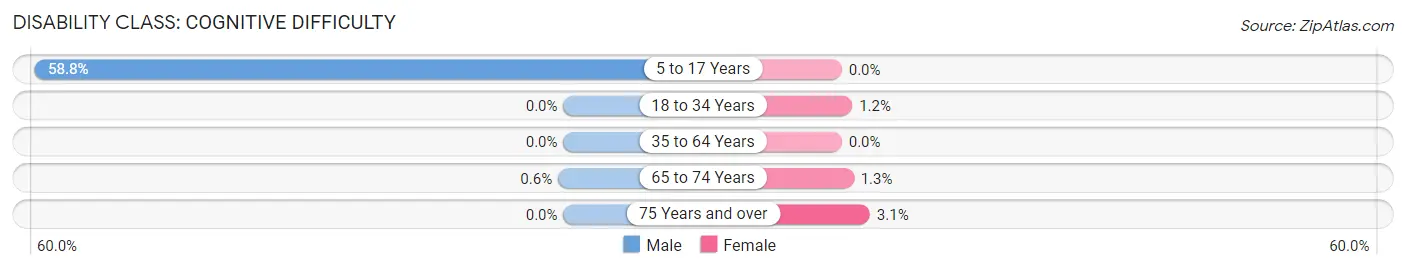
| Age Bracket | Male | Female |
| 5 to 17 Years | 20 (58.8%) | 0 (0.0%) |
| 18 to 34 Years | 0 (0.0%) | 2 (1.2%) |
| 35 to 64 Years | 0 (0.0%) | 0 (0.0%) |
| 65 to 74 Years | 7 (0.6%) | 16 (1.3%) |
| 75 Years and over | 0 (0.0%) | 24 (3.1%) |
Disability Class: Ambulatory Difficulty
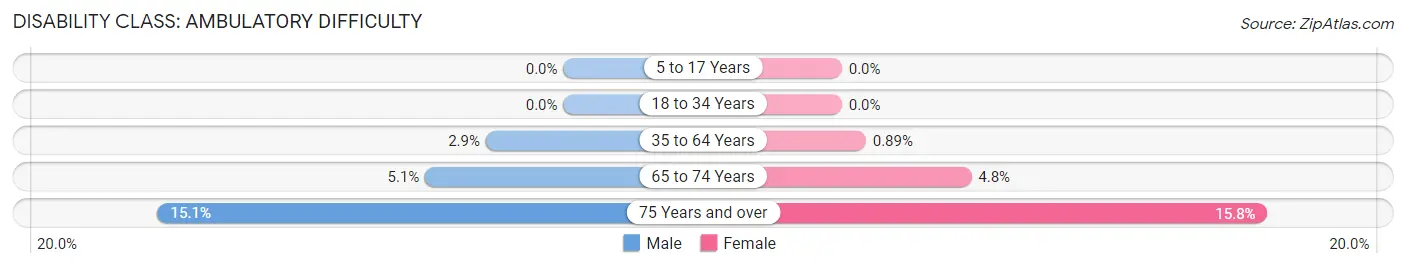
| Age Bracket | Male | Female |
| 5 to 17 Years | 0 (0.0%) | 0 (0.0%) |
| 18 to 34 Years | 0 (0.0%) | 0 (0.0%) |
| 35 to 64 Years | 22 (2.9%) | 10 (0.9%) |
| 65 to 74 Years | 60 (5.1%) | 58 (4.8%) |
| 75 Years and over | 142 (15.1%) | 121 (15.8%) |
Disability Class: Self-Care Difficulty
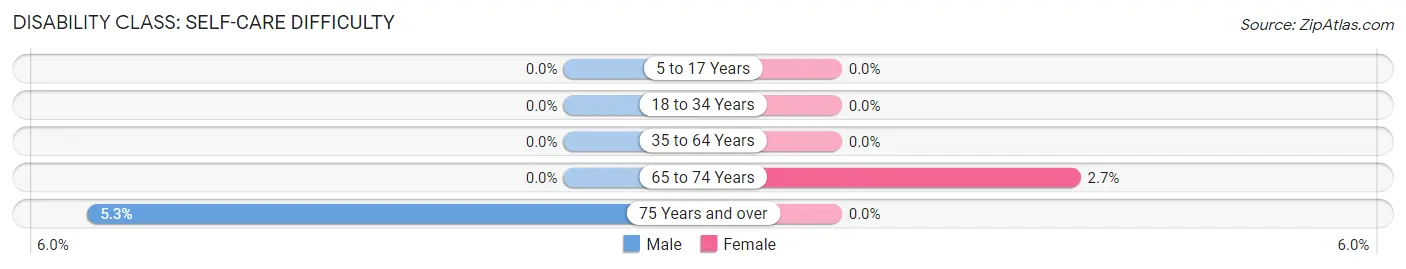
| Age Bracket | Male | Female |
| 5 to 17 Years | 0 (0.0%) | 0 (0.0%) |
| 18 to 34 Years | 0 (0.0%) | 0 (0.0%) |
| 35 to 64 Years | 0 (0.0%) | 0 (0.0%) |
| 65 to 74 Years | 0 (0.0%) | 32 (2.7%) |
| 75 Years and over | 50 (5.3%) | 0 (0.0%) |
Technology Access in Sanibel
Computing Device Access in Sanibel
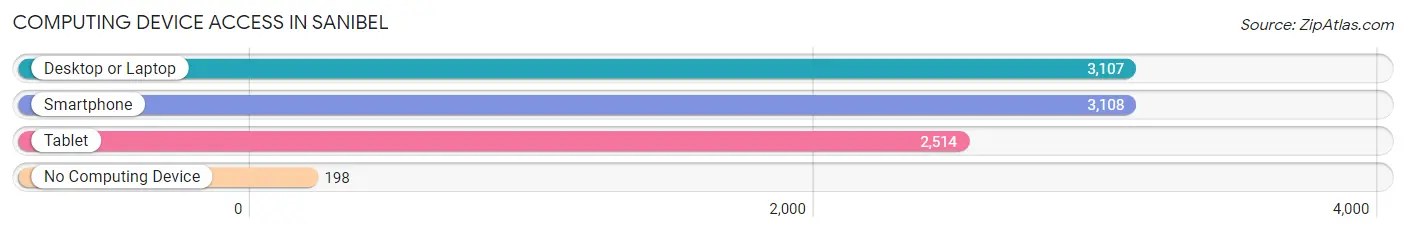
| Device Type | # Households | % Households |
| Desktop or Laptop | 3,107 | 89.0% |
| Smartphone | 3,108 | 89.0% |
| Tablet | 2,514 | 72.0% |
| No Computing Device | 198 | 5.7% |
| Total | 3,491 | 100.0% |
Internet Access in Sanibel
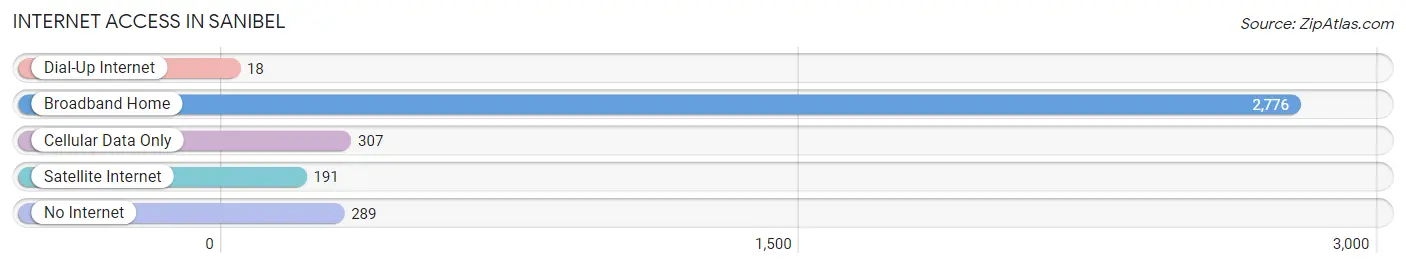
| Internet Type | # Households | % Households |
| Dial-Up Internet | 18 | 0.5% |
| Broadband Home | 2,776 | 79.5% |
| Cellular Data Only | 307 | 8.8% |
| Satellite Internet | 191 | 5.5% |
| No Internet | 289 | 8.3% |
| Total | 3,491 | 100.0% |
Sanibel Summary
Sanibel, Florida is a small island located off the coast of Southwest Florida in Lee County. It is known for its beautiful beaches, wildlife, and relaxed atmosphere. The island is approximately 12 miles long and 3 miles wide, and is connected to the mainland by a causeway. Sanibel is a popular tourist destination, and is home to a variety of businesses, restaurants, and attractions.
History
Sanibel has a long and rich history. The island was first inhabited by the Calusa Indians, who lived in the area for centuries before the arrival of Europeans. The first Europeans to settle on the island were Spanish explorers in the late 1500s. The island was later used as a base for fishing and trading by the Spanish, and was eventually named Sanibel by the Spanish, which means “Island of the Shells” in Spanish.
In the late 1800s, the island was purchased by the Bailey family, who developed the island into a resort destination. The Bailey family built a hotel, a lighthouse, and a pier, and the island quickly became a popular destination for tourists. In the early 1900s, the island was connected to the mainland by a causeway, which allowed for easier access to the island.
Geography
Sanibel is located off the coast of Southwest Florida in Lee County. It is approximately 12 miles long and 3 miles wide, and is connected to the mainland by a causeway. The island is surrounded by the Gulf of Mexico to the west and Pine Island Sound to the east. The island is made up of a variety of habitats, including mangrove forests, salt marshes, and sandy beaches.
The island is known for its beautiful beaches, which are made up of white sand and shells. The beaches are popular for swimming, sunbathing, and shelling. The island is also home to a variety of wildlife, including dolphins, manatees, sea turtles, and a variety of birds.
Economy
Sanibel’s economy is largely based on tourism. The island is home to a variety of businesses, restaurants, and attractions, which attract visitors from all over the world. The island is also home to a number of resorts, hotels, and vacation rentals, which provide accommodations for visitors.
The island is also home to a number of fishing charters, which offer visitors the opportunity to go fishing in the Gulf of Mexico. The island is also home to a number of art galleries, which feature the work of local artists.
Demographics
As of the 2010 census, the population of Sanibel was 6,469. The population is largely made up of white (90.2%) and Hispanic (7.2%) residents. The median age of residents is 57.7 years, and the median household income is $77,845.
Conclusion
Sanibel, Florida is a small island located off the coast of Southwest Florida in Lee County. It is known for its beautiful beaches, wildlife, and relaxed atmosphere. The island has a long and rich history, and is home to a variety of businesses, restaurants, and attractions. The island’s economy is largely based on tourism, and the population is largely made up of white and Hispanic residents. Sanibel is a popular tourist destination, and is a great place to visit for those looking for a relaxing getaway.
Common Questions
What is the Total Population of Sanibel?
Total Population of Sanibel is 6,420.
What is the Total Male Population of Sanibel?
Total Male Population of Sanibel is 3,060.
What is the Total Female Population of Sanibel?
Total Female Population of Sanibel is 3,360.
What is the Ratio of Males per 100 Females in Sanibel?
There are 91.07 Males per 100 Females in Sanibel.
What is the Ratio of Females per 100 Males in Sanibel?
There are 109.80 Females per 100 Males in Sanibel.
What is the Median Population Age in Sanibel?
Median Population Age in Sanibel is 68.6 Years.
What is the Average Family Size in Sanibel
Average Family Size in Sanibel is 2.2 People.
What is the Average Household Size in Sanibel
Average Household Size in Sanibel is 1.8 People.
What is Per Capita Income in Sanibel?
Per Capita income in Sanibel is $114,484.
What is the Median Family Income in Sanibel?
Median Family Income in Sanibel is $153,287.
What is the Median Household income in Sanibel?
Median Household Income in Sanibel is $111,683.
What is Income or Wage Gap in Sanibel?
Income or Wage Gap in Sanibel is 43.8%.
Women in Sanibel earn 56.2 cents for every dollar earned by a man.
What is Inequality or Gini Index in Sanibel?
Inequality or Gini Index in Sanibel is 0.59.
How Large is the Labor Force in Sanibel?
There are 2,088 People in the Labor Forcein in Sanibel.
What is the Percentage of People in the Labor Force in Sanibel?
33.2% of People are in the Labor Force in Sanibel.
What is the Unemployment Rate in Sanibel?
Unemployment Rate in Sanibel is 4.6%.