Midway, FL
Midway Map
Midway Overview
3,500
TOTAL POPULATION
1,428
MALE POPULATION
2,072
FEMALE POPULATION
68.92
MALES / 100 FEMALES
145.10
FEMALES / 100 MALES
31.1
MEDIAN AGE
3.7
AVG FAMILY SIZE
3.2
AVG HOUSEHOLD SIZE
$23,289
PER CAPITA INCOME
$67,679
AVG FAMILY INCOME
$58,393
AVG HOUSEHOLD INCOME
29.3%
WAGE / INCOME GAP [ % ]
70.7¢/ $1
WAGE / INCOME GAP [ $ ]
0.43
INEQUALITY / GINI INDEX
1,612
LABOR FORCE [ PEOPLE ]
69.3%
PERCENT IN LABOR FORCE
4.5%
UNEMPLOYMENT RATE
Midway Zip Codes
Midway Area Codes
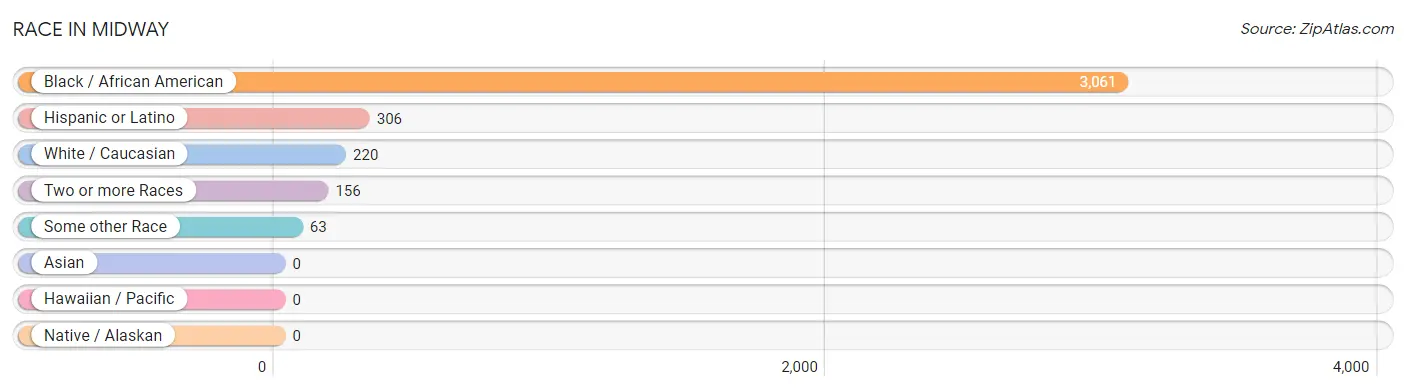
Race in Midway
The most populous races in Midway are Black / African American (3,061 | 87.5%), Hispanic or Latino (306 | 8.7%), and White / Caucasian (220 | 6.3%).
| Race | # Population | % Population |
| Asian | 0 | 0.0% |
| Black / African American | 3,061 | 87.5% |
| Hawaiian / Pacific | 0 | 0.0% |
| Hispanic or Latino | 306 | 8.7% |
| Native / Alaskan | 0 | 0.0% |
| White / Caucasian | 220 | 6.3% |
| Two or more Races | 156 | 4.5% |
| Some other Race | 63 | 1.8% |
| Total | 3,500 | 100.0% |
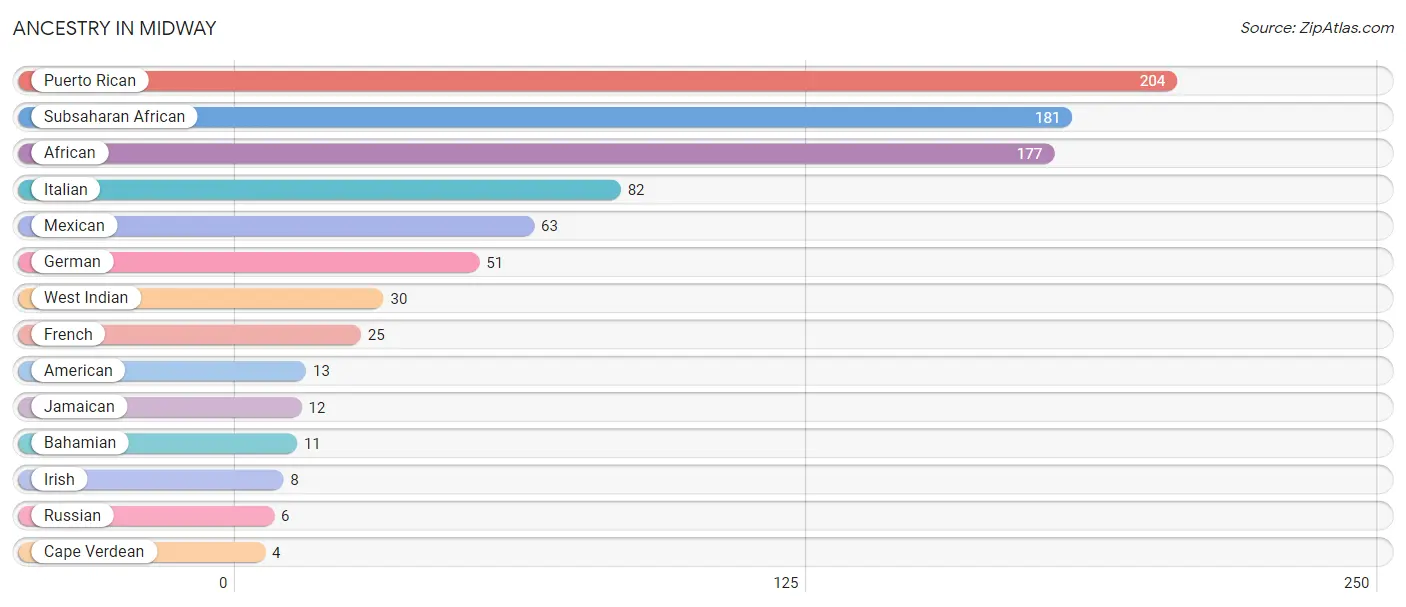
Ancestry in Midway
The most populous ancestries reported in Midway are Puerto Rican (204 | 5.8%), Subsaharan African (181 | 5.2%), African (177 | 5.1%), Italian (82 | 2.3%), and Mexican (63 | 1.8%), together accounting for 20.2% of all Midway residents.
| Ancestry | # Population | % Population |
| African | 177 | 5.1% |
| American | 13 | 0.4% |
| Bahamian | 11 | 0.3% |
| Cape Verdean | 4 | 0.1% |
| French | 25 | 0.7% |
| German | 51 | 1.5% |
| Irish | 8 | 0.2% |
| Italian | 82 | 2.3% |
| Jamaican | 12 | 0.3% |
| Mexican | 63 | 1.8% |
| Puerto Rican | 204 | 5.8% |
| Russian | 6 | 0.2% |
| Subsaharan African | 181 | 5.2% |
| West Indian | 30 | 0.9% | View All 14 Rows |
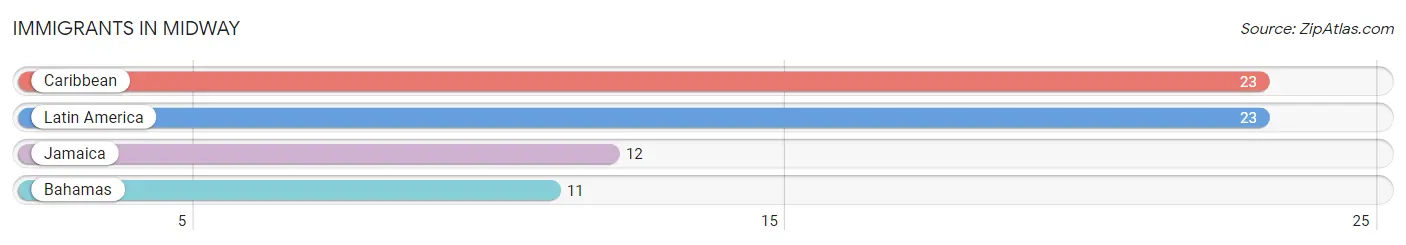
Immigrants in Midway
The most numerous immigrant groups reported in Midway came from Caribbean (23 | 0.7%), Latin America (23 | 0.7%), Jamaica (12 | 0.3%), and Bahamas (11 | 0.3%), together accounting for 2.0% of all Midway residents.
| Immigration Origin | # Population | % Population |
| Bahamas | 11 | 0.3% |
| Caribbean | 23 | 0.7% |
| Jamaica | 12 | 0.3% |
| Latin America | 23 | 0.7% | View All 4 Rows |
Sex and Age in Midway
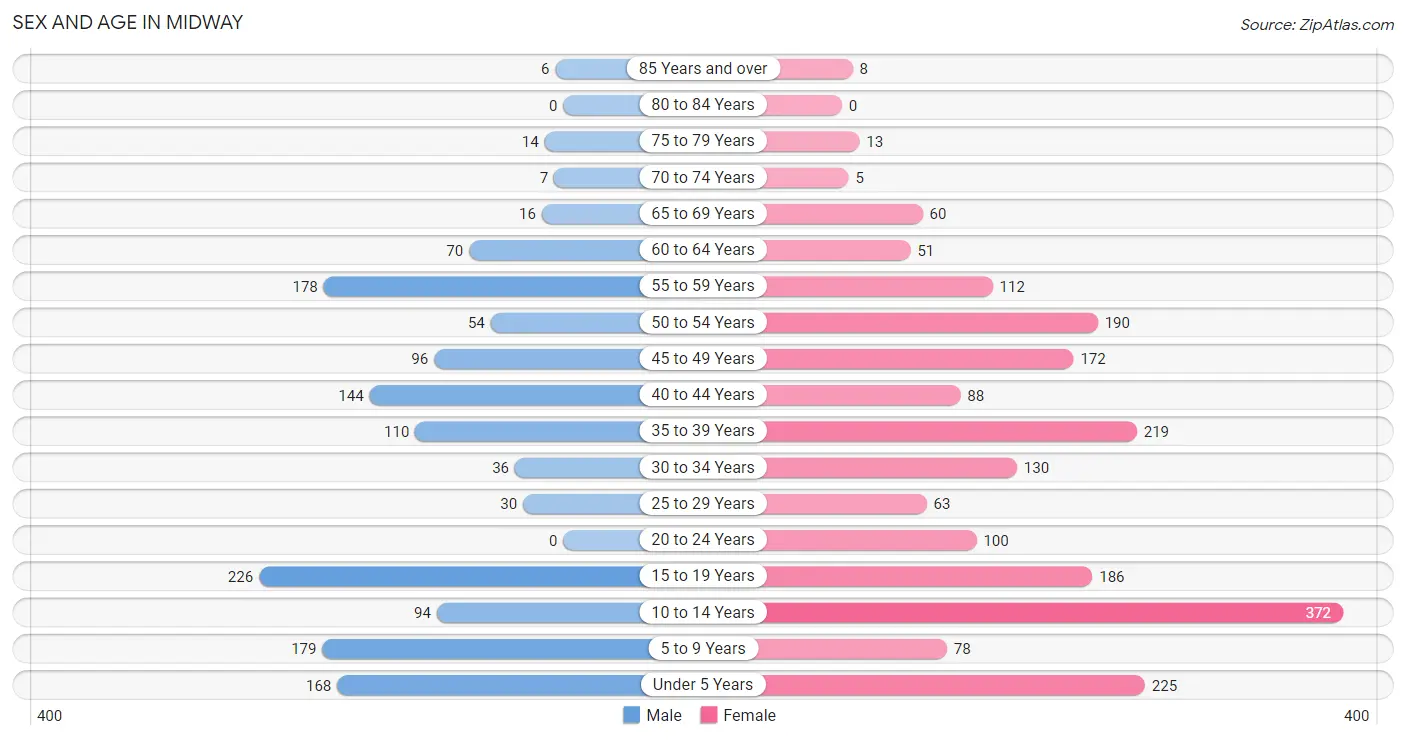
Sex and Age in Midway
The most populous age groups in Midway are 15 to 19 Years (226 | 15.8%) for men and 10 to 14 Years (372 | 17.9%) for women.
| Age Bracket | Male | Female |
| Under 5 Years | 168 (11.8%) | 225 (10.9%) |
| 5 to 9 Years | 179 (12.5%) | 78 (3.8%) |
| 10 to 14 Years | 94 (6.6%) | 372 (17.9%) |
| 15 to 19 Years | 226 (15.8%) | 186 (9.0%) |
| 20 to 24 Years | 0 (0.0%) | 100 (4.8%) |
| 25 to 29 Years | 30 (2.1%) | 63 (3.0%) |
| 30 to 34 Years | 36 (2.5%) | 130 (6.3%) |
| 35 to 39 Years | 110 (7.7%) | 219 (10.6%) |
| 40 to 44 Years | 144 (10.1%) | 88 (4.3%) |
| 45 to 49 Years | 96 (6.7%) | 172 (8.3%) |
| 50 to 54 Years | 54 (3.8%) | 190 (9.2%) |
| 55 to 59 Years | 178 (12.5%) | 112 (5.4%) |
| 60 to 64 Years | 70 (4.9%) | 51 (2.5%) |
| 65 to 69 Years | 16 (1.1%) | 60 (2.9%) |
| 70 to 74 Years | 7 (0.5%) | 5 (0.2%) |
| 75 to 79 Years | 14 (1.0%) | 13 (0.6%) |
| 80 to 84 Years | 0 (0.0%) | 0 (0.0%) |
| 85 Years and over | 6 (0.4%) | 8 (0.4%) |
| Total | 1,428 (100.0%) | 2,072 (100.0%) |
Families and Households in Midway
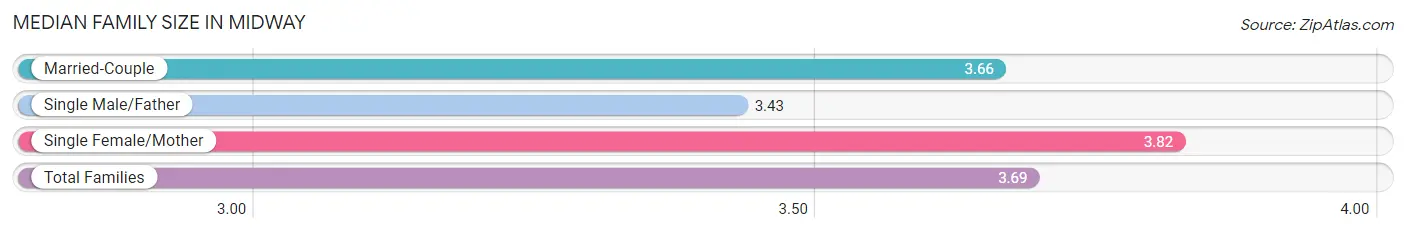
Median Family Size in Midway
The median family size in Midway is 3.69 persons per family, with single female/mother families (288 | 33.5%) accounting for the largest median family size of 3.82 persons per family. On the other hand, single male/father families (63 | 7.3%) represent the smallest median family size with 3.43 persons per family.
| Family Type | # Families | Family Size |
| Married-Couple | 508 (59.1%) | 3.66 |
| Single Male/Father | 63 (7.3%) | 3.43 |
| Single Female/Mother | 288 (33.5%) | 3.82 |
| Total Families | 859 (100.0%) | 3.69 |
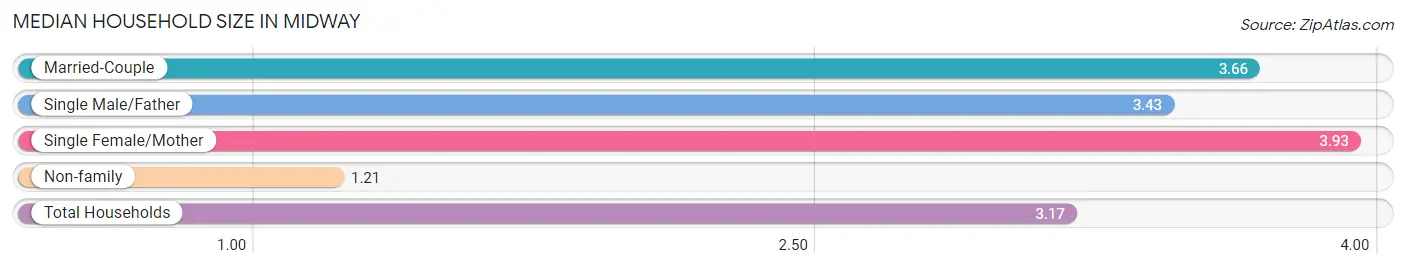
Median Household Size in Midway
The median household size in Midway is 3.17 persons per household, with single female/mother households (288 | 26.1%) accounting for the largest median household size of 3.93 persons per household. non-family households (244 | 22.1%) represent the smallest median household size with 1.21 persons per household.
| Household Type | # Households | Household Size |
| Married-Couple | 508 (46.1%) | 3.66 |
| Single Male/Father | 63 (5.7%) | 3.43 |
| Single Female/Mother | 288 (26.1%) | 3.93 |
| Non-family | 244 (22.1%) | 1.21 |
| Total Households | 1,103 (100.0%) | 3.17 |
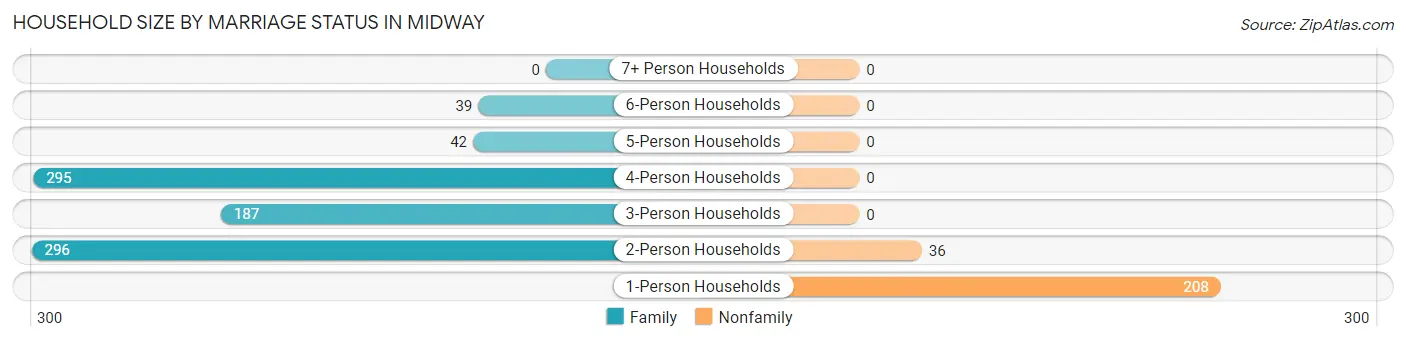
Household Size by Marriage Status in Midway
Out of a total of 1,103 households in Midway, 859 (77.9%) are family households, while 244 (22.1%) are nonfamily households. The most numerous type of family households are 2-person households, comprising 296, and the most common type of nonfamily households are 1-person households, comprising 208.
| Household Size | Family Households | Nonfamily Households |
| 1-Person Households | - | 208 (18.9%) |
| 2-Person Households | 296 (26.8%) | 36 (3.3%) |
| 3-Person Households | 187 (17.0%) | 0 (0.0%) |
| 4-Person Households | 295 (26.8%) | 0 (0.0%) |
| 5-Person Households | 42 (3.8%) | 0 (0.0%) |
| 6-Person Households | 39 (3.5%) | 0 (0.0%) |
| 7+ Person Households | 0 (0.0%) | 0 (0.0%) |
| Total | 859 (77.9%) | 244 (22.1%) |
Female Fertility in Midway
Fertility by Age in Midway
Average fertility rate in Midway is 60.0 births per 1,000 women. Women in the age bracket of 35 to 50 years have the highest fertility rate with 117.0 births per 1,000 women. Women in the age bracket of 35 to 50 years acount for 100.0% of all women with births.
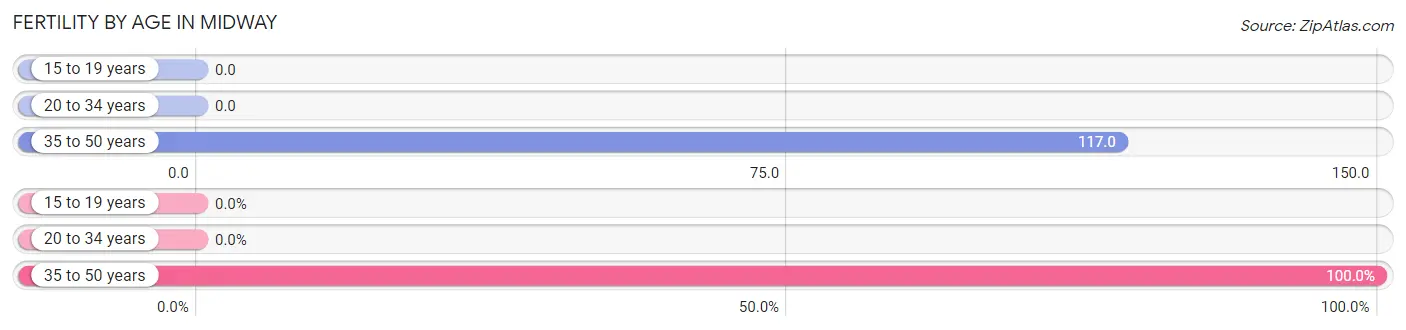
| Age Bracket | Women with Births | Births / 1,000 Women |
| 15 to 19 years | 0 (0.0%) | 0.0 |
| 20 to 34 years | 0 (0.0%) | 0.0 |
| 35 to 50 years | 59 (100.0%) | 117.0 |
| Total | 59 (100.0%) | 60.0 |
Fertility by Age by Marriage Status in Midway
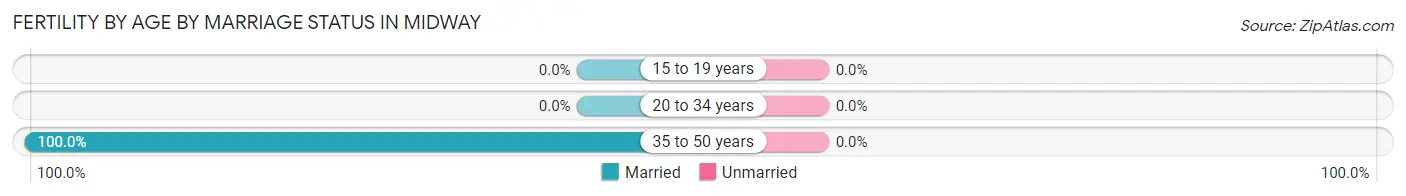
| Age Bracket | Married | Unmarried |
| 15 to 19 years | 0 (0.0%) | 0 (0.0%) |
| 20 to 34 years | 0 (0.0%) | 0 (0.0%) |
| 35 to 50 years | 59 (100.0%) | 0 (0.0%) |
| Total | 59 (100.0%) | 0 (0.0%) |
Fertility by Education in Midway
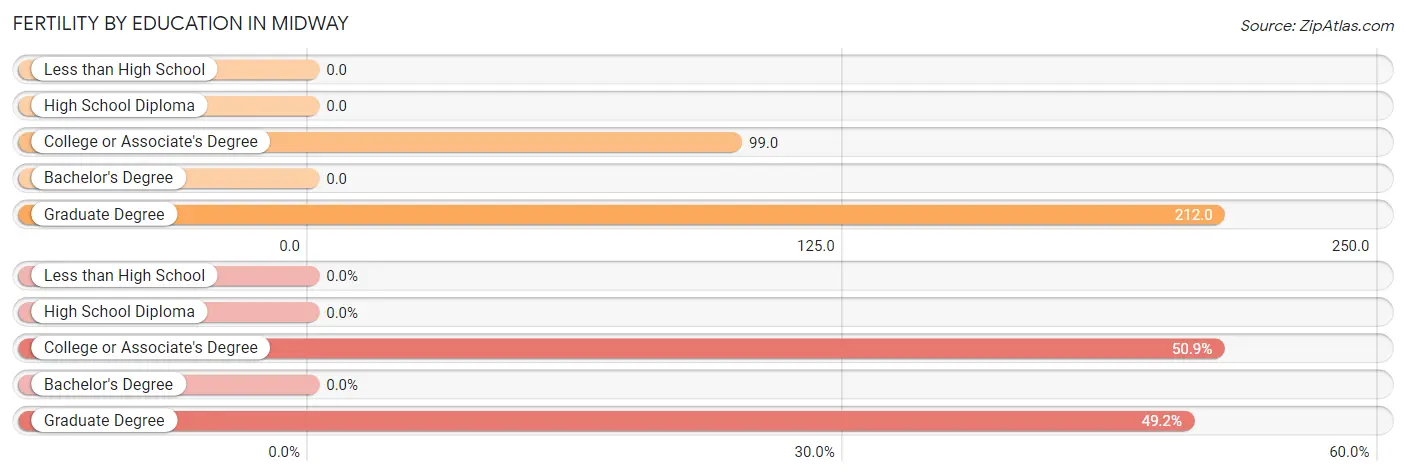
| Educational Attainment | Women with Births | Births / 1,000 Women |
| Less than High School | 0 (0.0%) | 0.0 |
| High School Diploma | 0 (0.0%) | 0.0 |
| College or Associate's Degree | 30 (50.8%) | 99.0 |
| Bachelor's Degree | 0 (0.0%) | 0.0 |
| Graduate Degree | 29 (49.1%) | 212.0 |
| Total | 59 (100.0%) | 60.0 |
Fertility by Education by Marriage Status in Midway
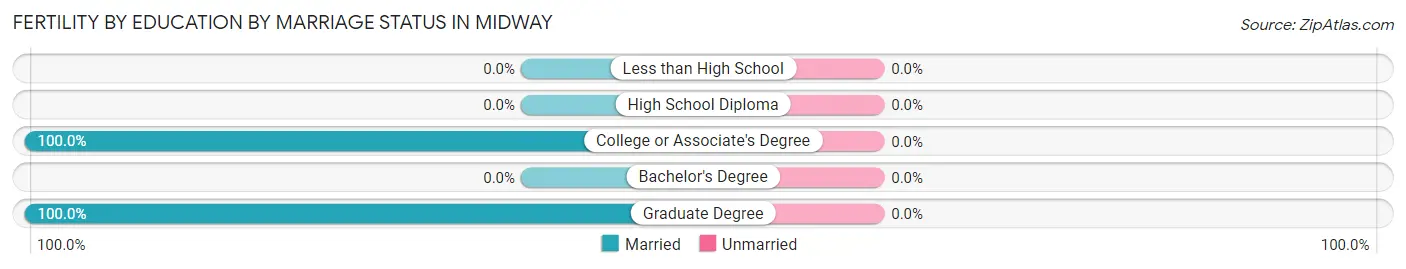
| Educational Attainment | Married | Unmarried |
| Less than High School | 0 (0.0%) | 0 (0.0%) |
| High School Diploma | 0 (0.0%) | 0 (0.0%) |
| College or Associate's Degree | 30 (100.0%) | 0 (0.0%) |
| Bachelor's Degree | 0 (0.0%) | 0 (0.0%) |
| Graduate Degree | 29 (100.0%) | 0 (0.0%) |
| Total | 59 (100.0%) | 0 (0.0%) |
Income in Midway
Income Overview in Midway
Per Capita Income in Midway is $23,289, while median incomes of families and households are $67,679 and $58,393 respectively.
| Characteristic | Number | Measure |
| Per Capita Income | 3,500 | $23,289 |
| Median Family Income | 859 | $67,679 |
| Mean Family Income | 859 | $83,779 |
| Median Household Income | 1,103 | $58,393 |
| Mean Household Income | 1,103 | $72,789 |
| Income Deficit | 859 | $0 |
| Wage / Income Gap (%) | 3,500 | 29.32% |
| Wage / Income Gap ($) | 3,500 | 70.68¢ per $1 |
| Gini / Inequality Index | 3,500 | 0.43 |
Earnings by Sex in Midway
Average Earnings in Midway are $38,250, $46,231 for men and $32,676 for women, a difference of 29.3%.
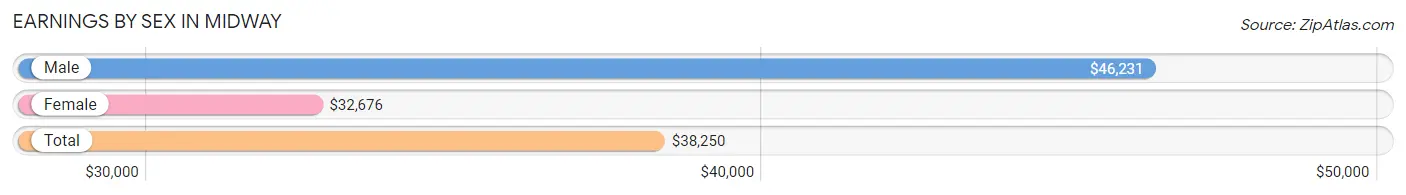
| Sex | Number | Average Earnings |
| Male | 600 (37.4%) | $46,231 |
| Female | 1,004 (62.6%) | $32,676 |
| Total | 1,604 (100.0%) | $38,250 |
Earnings by Sex by Income Bracket in Midway
The most common earnings brackets in Midway are $75,000 to $99,999 for men (160 | 26.7%) and $55,000 to $64,999 for women (121 | 12.0%).
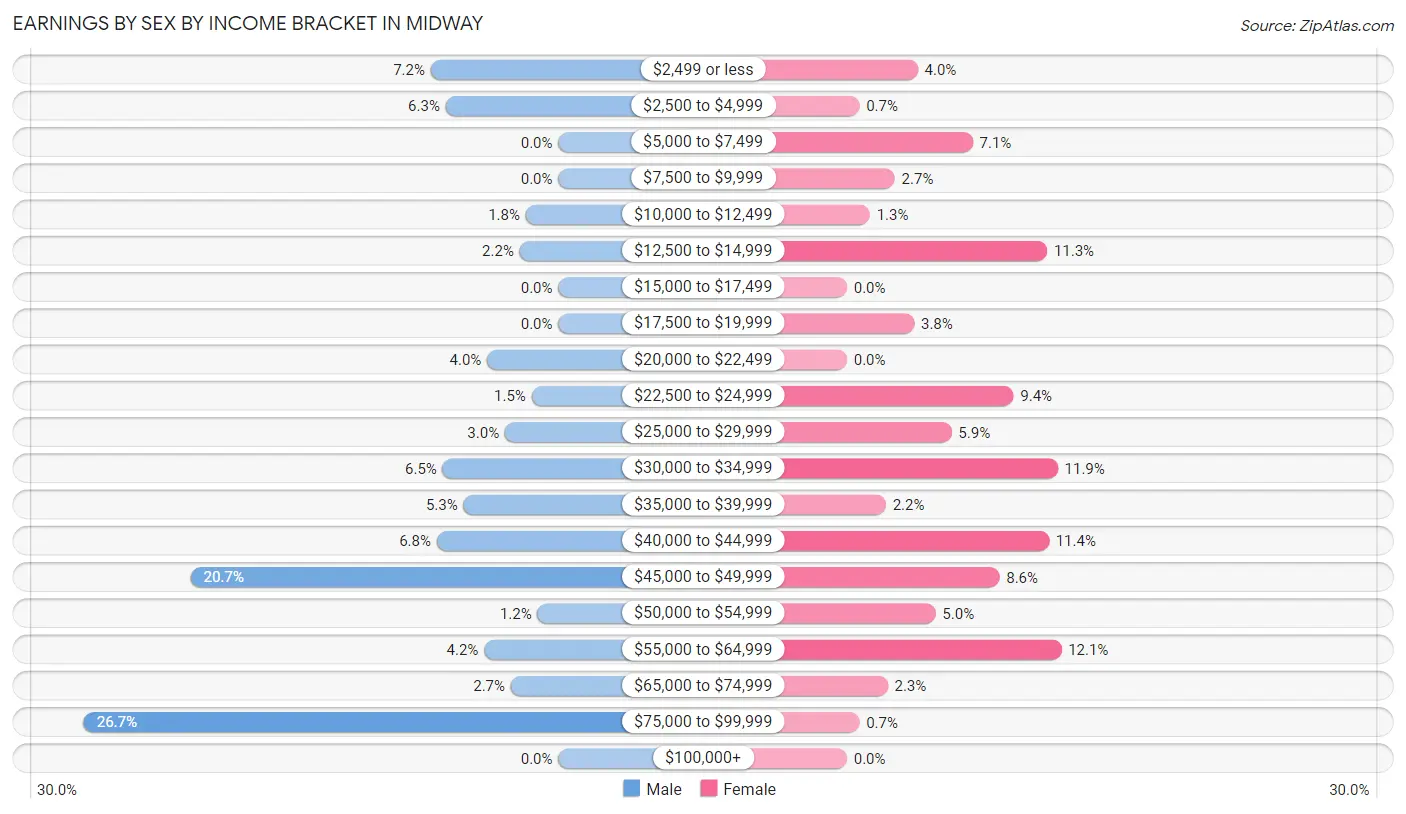
| Income | Male | Female |
| $2,499 or less | 43 (7.2%) | 40 (4.0%) |
| $2,500 to $4,999 | 38 (6.3%) | 7 (0.7%) |
| $5,000 to $7,499 | 0 (0.0%) | 71 (7.1%) |
| $7,500 to $9,999 | 0 (0.0%) | 27 (2.7%) |
| $10,000 to $12,499 | 11 (1.8%) | 13 (1.3%) |
| $12,500 to $14,999 | 13 (2.2%) | 113 (11.3%) |
| $15,000 to $17,499 | 0 (0.0%) | 0 (0.0%) |
| $17,500 to $19,999 | 0 (0.0%) | 38 (3.8%) |
| $20,000 to $22,499 | 24 (4.0%) | 0 (0.0%) |
| $22,500 to $24,999 | 9 (1.5%) | 94 (9.4%) |
| $25,000 to $29,999 | 18 (3.0%) | 59 (5.9%) |
| $30,000 to $34,999 | 39 (6.5%) | 119 (11.8%) |
| $35,000 to $39,999 | 32 (5.3%) | 22 (2.2%) |
| $40,000 to $44,999 | 41 (6.8%) | 114 (11.4%) |
| $45,000 to $49,999 | 124 (20.7%) | 86 (8.6%) |
| $50,000 to $54,999 | 7 (1.2%) | 50 (5.0%) |
| $55,000 to $64,999 | 25 (4.2%) | 121 (12.0%) |
| $65,000 to $74,999 | 16 (2.7%) | 23 (2.3%) |
| $75,000 to $99,999 | 160 (26.7%) | 7 (0.7%) |
| $100,000+ | 0 (0.0%) | 0 (0.0%) |
| Total | 600 (100.0%) | 1,004 (100.0%) |
Earnings by Sex by Educational Attainment in Midway
Average earnings in Midway are $47,038 for men and $34,574 for women, a difference of 26.5%. Men with an educational attainment of college or associate's degree enjoy the highest average annual earnings of $71,563, while those with less than high school education earn the least with $2,499. Women with an educational attainment of bachelor's degree earn the most with the average annual earnings of $45,156, while those with high school diploma education have the smallest earnings of $24,719.
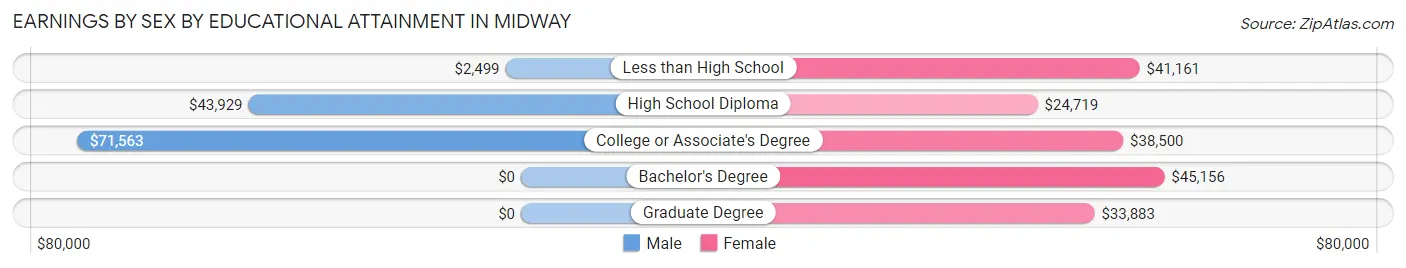
| Educational Attainment | Male Income | Female Income |
| Less than High School | $2,499 | $41,161 |
| High School Diploma | $43,929 | $24,719 |
| College or Associate's Degree | $71,563 | $38,500 |
| Bachelor's Degree | - | - |
| Graduate Degree | - | - |
| Total | $47,038 | $34,574 |
Family Income in Midway
Family Income Brackets in Midway
According to the Midway family income data, there are 198 families falling into the $75,000 to $99,999 income range, which is the most common income bracket and makes up 23.1% of all families.
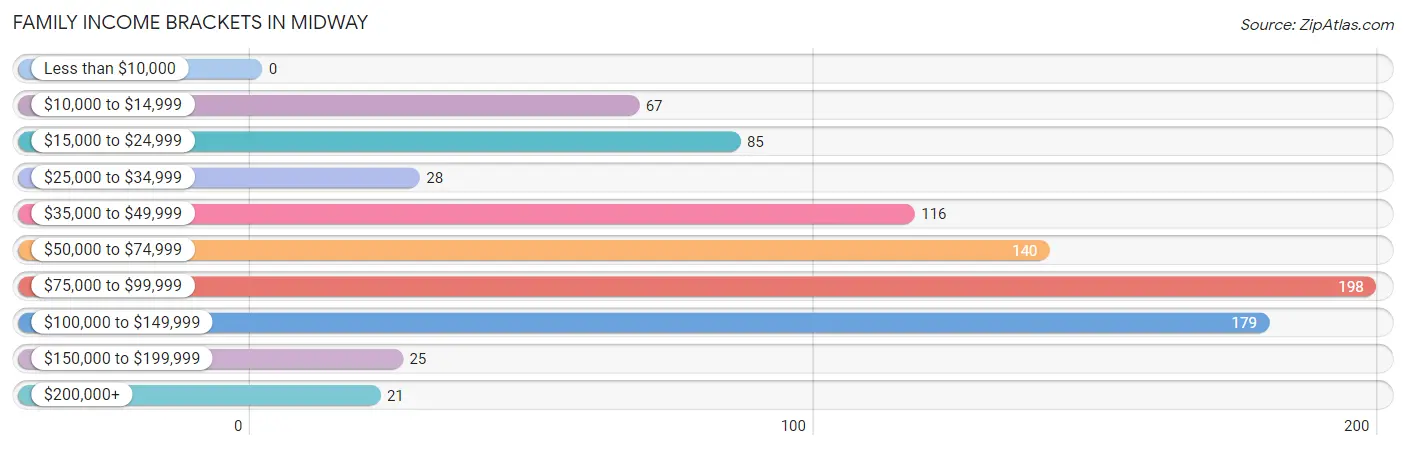
| Income Bracket | # Families | % Families |
| Less than $10,000 | 0 | 0.0% |
| $10,000 to $14,999 | 67 | 7.8% |
| $15,000 to $24,999 | 85 | 9.9% |
| $25,000 to $34,999 | 28 | 3.3% |
| $35,000 to $49,999 | 116 | 13.5% |
| $50,000 to $74,999 | 140 | 16.3% |
| $75,000 to $99,999 | 198 | 23.1% |
| $100,000 to $149,999 | 179 | 20.8% |
| $150,000 to $199,999 | 25 | 2.9% |
| $200,000+ | 21 | 2.4% |
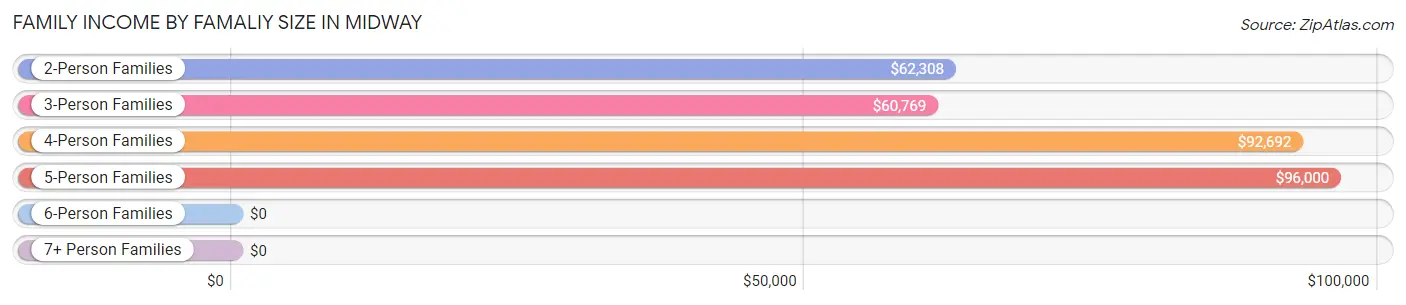
Family Income by Famaliy Size in Midway
5-person families (38 | 4.4%) account for the highest median family income in Midway with $96,000 per family, while 2-person families (300 | 34.9%) have the highest median income of $31,154 per family member.
| Income Bracket | # Families | Median Income |
| 2-Person Families | 300 (34.9%) | $62,308 |
| 3-Person Families | 202 (23.5%) | $60,769 |
| 4-Person Families | 280 (32.6%) | $92,692 |
| 5-Person Families | 38 (4.4%) | $96,000 |
| 6-Person Families | 39 (4.5%) | $0 |
| 7+ Person Families | 0 (0.0%) | $0 |
| Total | 859 (100.0%) | $67,679 |
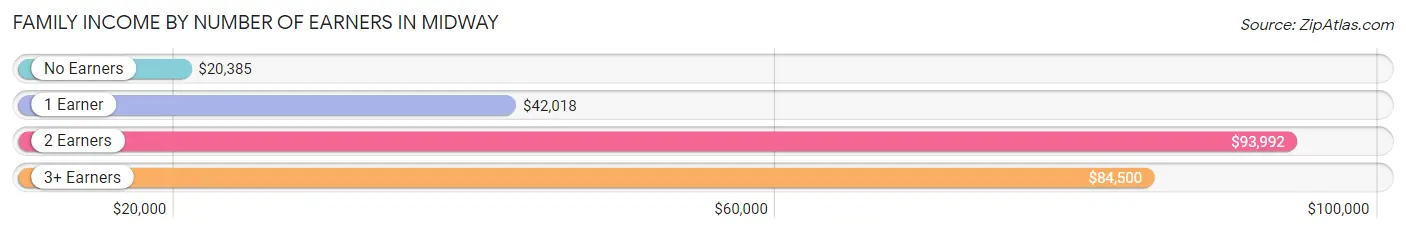
Family Income by Number of Earners in Midway
The median family income in Midway is $67,679, with families comprising 2 earners (347) having the highest median family income of $93,992, while families with no earners (78) have the lowest median family income of $20,385, accounting for 40.4% and 9.1% of families, respectively.
| Number of Earners | # Families | Median Income |
| No Earners | 78 (9.1%) | $20,385 |
| 1 Earner | 352 (41.0%) | $42,018 |
| 2 Earners | 347 (40.4%) | $93,992 |
| 3+ Earners | 82 (9.6%) | $84,500 |
| Total | 859 (100.0%) | $67,679 |
Household Income in Midway
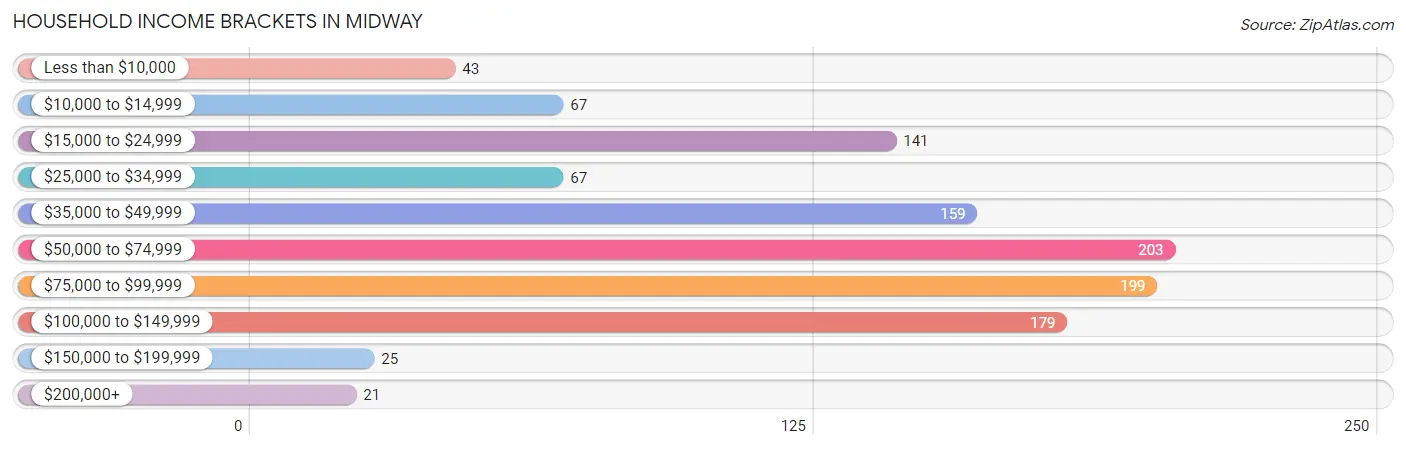
Household Income Brackets in Midway
With 203 households falling in the category, the $50,000 to $74,999 income range is the most frequent in Midway, accounting for 18.4% of all households. In contrast, only 21 households (1.9%) fall into the $200,000+ income bracket, making it the least populous group.
| Income Bracket | # Households | % Households |
| Less than $10,000 | 43 | 3.9% |
| $10,000 to $14,999 | 67 | 6.1% |
| $15,000 to $24,999 | 141 | 12.8% |
| $25,000 to $34,999 | 67 | 6.1% |
| $35,000 to $49,999 | 159 | 14.4% |
| $50,000 to $74,999 | 203 | 18.4% |
| $75,000 to $99,999 | 199 | 18.0% |
| $100,000 to $149,999 | 179 | 16.2% |
| $150,000 to $199,999 | 25 | 2.3% |
| $200,000+ | 21 | 1.9% |
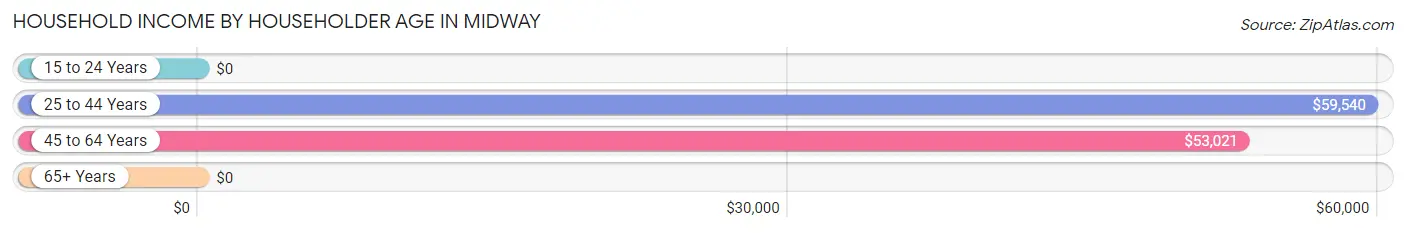
Household Income by Householder Age in Midway
The median household income in Midway is $58,393, with the highest median household income of $59,540 found in the 25 to 44 years age bracket for the primary householder. A total of 513 households (46.5%) fall into this category.
| Income Bracket | # Households | Median Income |
| 15 to 24 Years | 0 (0.0%) | $0 |
| 25 to 44 Years | 513 (46.5%) | $59,540 |
| 45 to 64 Years | 503 (45.6%) | $53,021 |
| 65+ Years | 87 (7.9%) | $0 |
| Total | 1,103 (100.0%) | $58,393 |
Poverty in Midway
Income Below Poverty by Sex and Age in Midway
With 14.2% poverty level for males and 18.8% for females among the residents of Midway, 12 to 14 year old males and 65 to 74 year old females are the most vulnerable to poverty, with 40 males (63.5%) and 38 females (58.5%) in their respective age groups living below the poverty level.
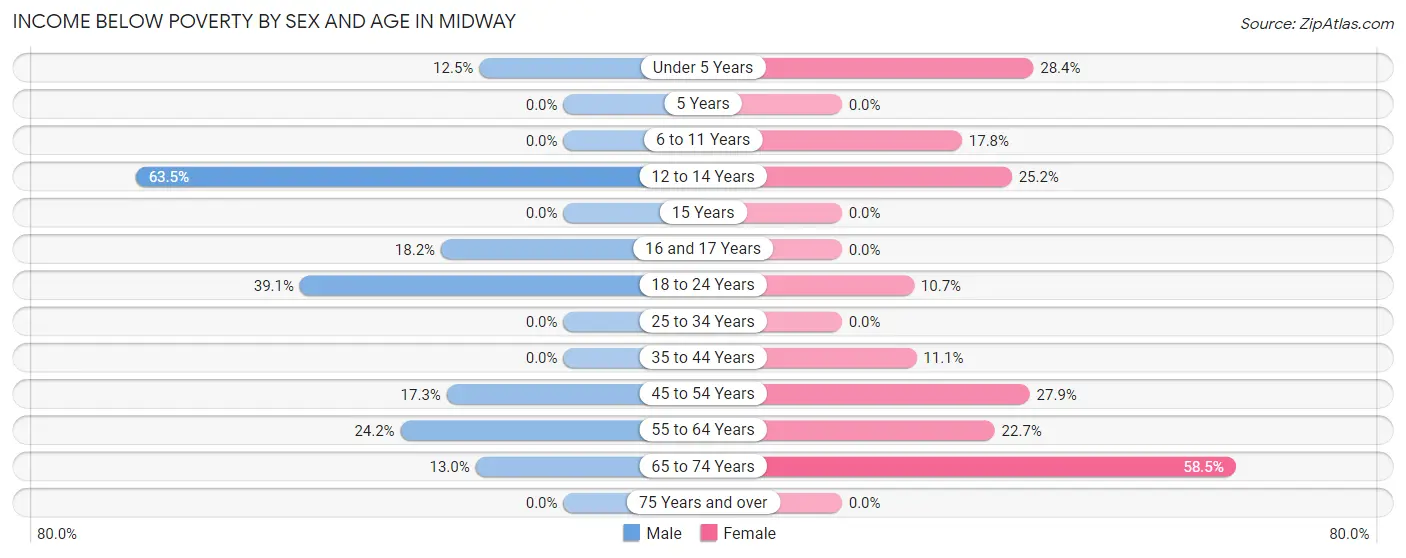
| Age Bracket | Male | Female |
| Under 5 Years | 21 (12.5%) | 64 (28.4%) |
| 5 Years | 0 (0.0%) | 0 (0.0%) |
| 6 to 11 Years | 0 (0.0%) | 23 (17.8%) |
| 12 to 14 Years | 40 (63.5%) | 81 (25.2%) |
| 15 Years | 0 (0.0%) | 0 (0.0%) |
| 16 and 17 Years | 26 (18.2%) | 0 (0.0%) |
| 18 to 24 Years | 27 (39.1%) | 12 (10.7%) |
| 25 to 34 Years | 0 (0.0%) | 0 (0.0%) |
| 35 to 44 Years | 0 (0.0%) | 34 (11.1%) |
| 45 to 54 Years | 26 (17.3%) | 101 (27.9%) |
| 55 to 64 Years | 60 (24.2%) | 37 (22.7%) |
| 65 to 74 Years | 3 (13.0%) | 38 (58.5%) |
| 75 Years and over | 0 (0.0%) | 0 (0.0%) |
| Total | 203 (14.2%) | 390 (18.8%) |
Income Above Poverty by Sex and Age in Midway
According to the poverty statistics in Midway, males aged 5 years and females aged 15 years are the age groups that are most secure financially, with 100.0% of males and 100.0% of females in these age groups living above the poverty line.
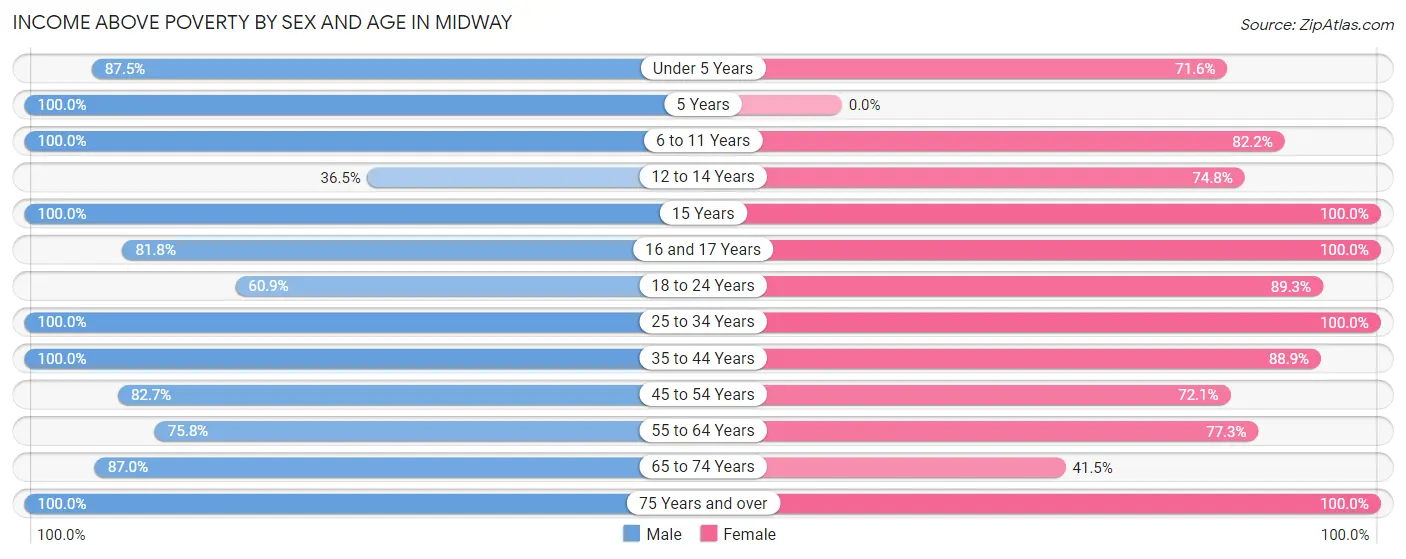
| Age Bracket | Male | Female |
| Under 5 Years | 147 (87.5%) | 161 (71.6%) |
| 5 Years | 32 (100.0%) | 0 (0.0%) |
| 6 to 11 Years | 178 (100.0%) | 106 (82.2%) |
| 12 to 14 Years | 23 (36.5%) | 240 (74.8%) |
| 15 Years | 14 (100.0%) | 44 (100.0%) |
| 16 and 17 Years | 117 (81.8%) | 130 (100.0%) |
| 18 to 24 Years | 42 (60.9%) | 100 (89.3%) |
| 25 to 34 Years | 66 (100.0%) | 193 (100.0%) |
| 35 to 44 Years | 254 (100.0%) | 273 (88.9%) |
| 45 to 54 Years | 124 (82.7%) | 261 (72.1%) |
| 55 to 64 Years | 188 (75.8%) | 126 (77.3%) |
| 65 to 74 Years | 20 (87.0%) | 27 (41.5%) |
| 75 Years and over | 20 (100.0%) | 21 (100.0%) |
| Total | 1,225 (85.8%) | 1,682 (81.2%) |
Income Below Poverty Among Married-Couple Families in Midway
The poverty statistics for married-couple families in Midway show that 6.9% or 35 of the total 508 families live below the poverty line. Families with 1 or 2 children have the highest poverty rate of 12.2%, comprising of 35 families. On the other hand, families with no children have the lowest poverty rate of 0.0%, which includes 0 families.
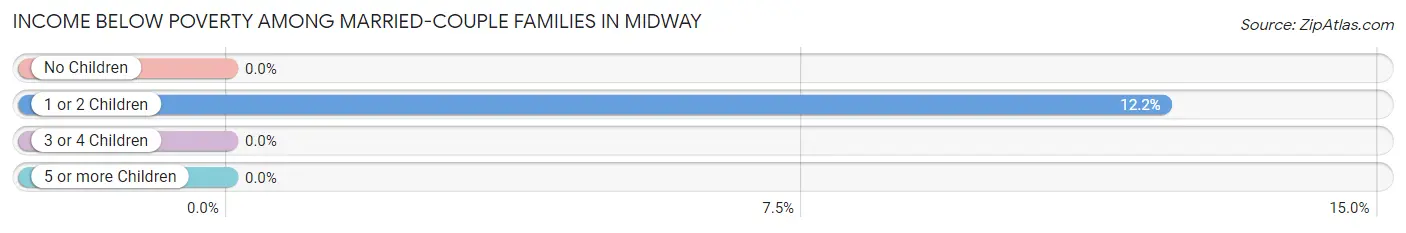
| Children | Above Poverty | Below Poverty |
| No Children | 211 (100.0%) | 0 (0.0%) |
| 1 or 2 Children | 252 (87.8%) | 35 (12.2%) |
| 3 or 4 Children | 10 (100.0%) | 0 (0.0%) |
| 5 or more Children | 0 (0.0%) | 0 (0.0%) |
| Total | 473 (93.1%) | 35 (6.9%) |
Income Below Poverty Among Single-Parent Households in Midway
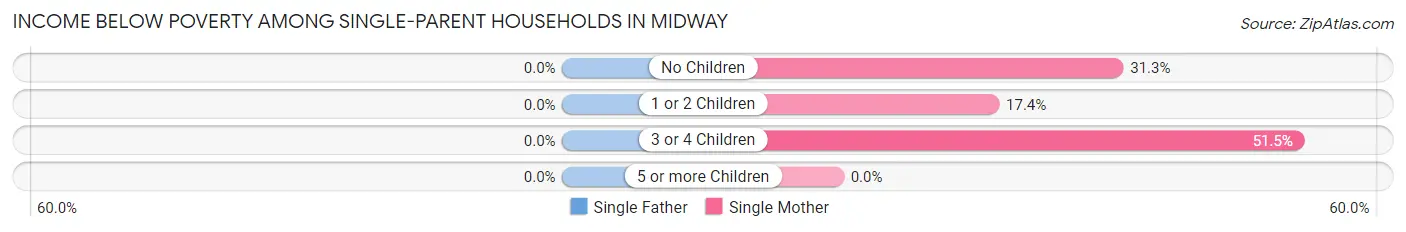
| Children | Single Father | Single Mother |
| No Children | 0 (0.0%) | 10 (31.2%) |
| 1 or 2 Children | 0 (0.0%) | 33 (17.4%) |
| 3 or 4 Children | 0 (0.0%) | 34 (51.5%) |
| 5 or more Children | 0 (0.0%) | 0 (0.0%) |
| Total | 0 (0.0%) | 77 (26.7%) |
Income Below Poverty Among Married-Couple vs Single-Parent Households in Midway
The poverty data for Midway shows that 35 of the married-couple family households (6.9%) and 77 of the single-parent households (21.9%) are living below the poverty level. Within the married-couple family households, those with 1 or 2 children have the highest poverty rate, with 35 households (12.2%) falling below the poverty line. Among the single-parent households, those with 3 or 4 children have the highest poverty rate, with 34 household (40.5%) living below poverty.
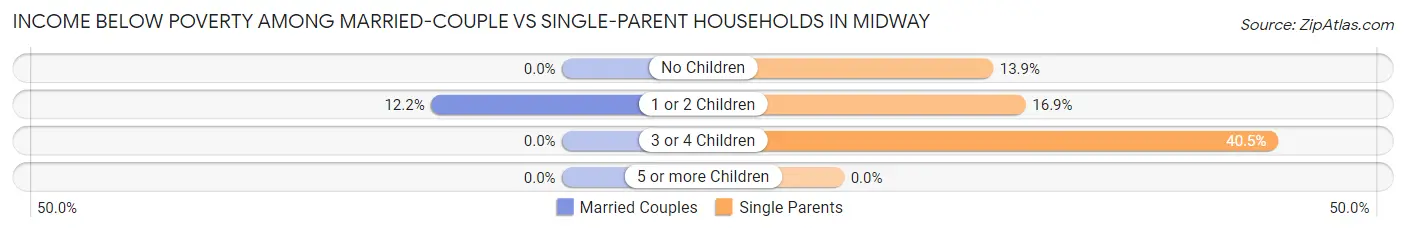
| Children | Married-Couple Families | Single-Parent Households |
| No Children | 0 (0.0%) | 10 (13.9%) |
| 1 or 2 Children | 35 (12.2%) | 33 (16.9%) |
| 3 or 4 Children | 0 (0.0%) | 34 (40.5%) |
| 5 or more Children | 0 (0.0%) | 0 (0.0%) |
| Total | 35 (6.9%) | 77 (21.9%) |
Employment Characteristics in Midway
Employment by Class of Employer in Midway
Among the 1,536 employed individuals in Midway, private company employees (629 | 40.9%), state government employees (359 | 23.4%), and local government employees (245 | 16.0%) make up the most common classes of employment.
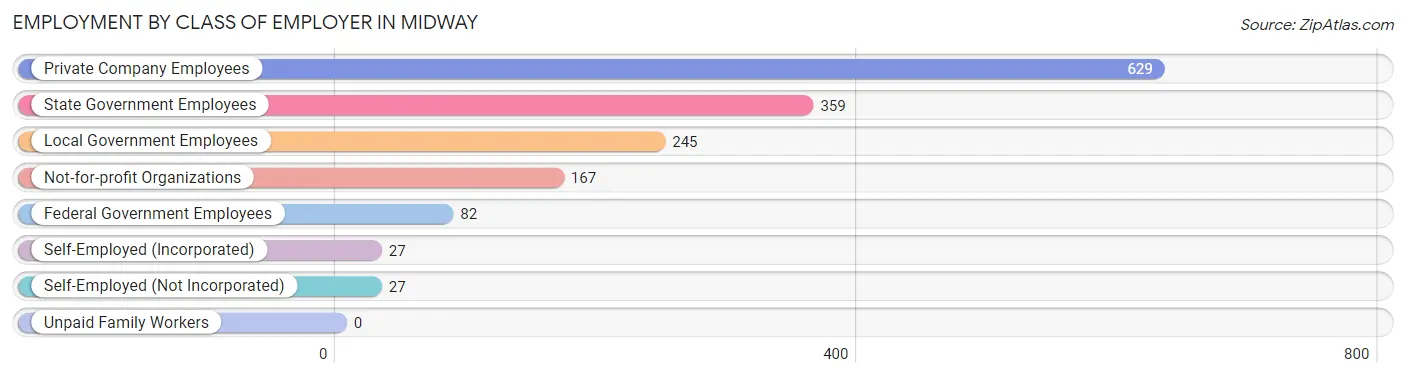
| Employer Class | # Employees | % Employees |
| Private Company Employees | 629 | 40.9% |
| Self-Employed (Incorporated) | 27 | 1.8% |
| Self-Employed (Not Incorporated) | 27 | 1.8% |
| Not-for-profit Organizations | 167 | 10.9% |
| Local Government Employees | 245 | 16.0% |
| State Government Employees | 359 | 23.4% |
| Federal Government Employees | 82 | 5.3% |
| Unpaid Family Workers | 0 | 0.0% |
| Total | 1,536 | 100.0% |
Employment Status by Age in Midway
According to the labor force statistics for Midway, out of the total population over 16 years of age (2,326), 69.3% or 1,612 individuals are in the labor force, with 4.5% or 73 of them unemployed. The age group with the highest labor force participation rate is 30 to 34 years, with 100.0% or 166 individuals in the labor force. Within the labor force, the 16 to 19 years age range has the highest percentage of unemployed individuals, with 37.1% or 33 of them being unemployed.
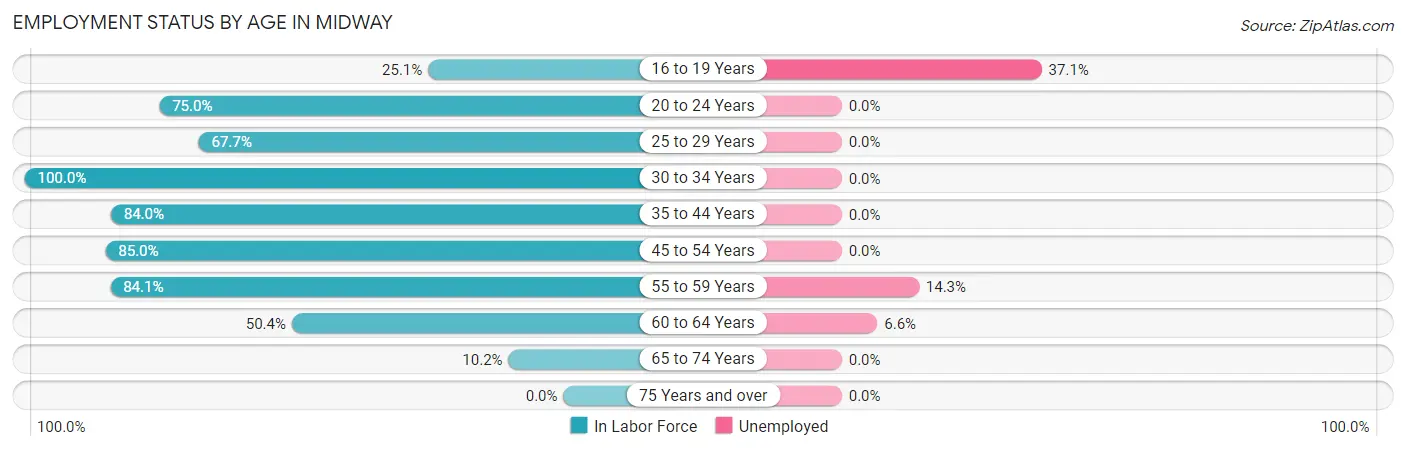
| Age Bracket | In Labor Force | Unemployed |
| 16 to 19 Years | 89 (25.1%) | 33 (37.1%) |
| 20 to 24 Years | 75 (75.0%) | 0 (0.0%) |
| 25 to 29 Years | 63 (67.7%) | 0 (0.0%) |
| 30 to 34 Years | 166 (100.0%) | 0 (0.0%) |
| 35 to 44 Years | 471 (84.0%) | 0 (0.0%) |
| 45 to 54 Years | 435 (85.0%) | 0 (0.0%) |
| 55 to 59 Years | 244 (84.1%) | 35 (14.3%) |
| 60 to 64 Years | 61 (50.4%) | 4 (6.6%) |
| 65 to 74 Years | 9 (10.2%) | 0 (0.0%) |
| 75 Years and over | 0 (0.0%) | 0 (0.0%) |
| Total | 1,612 (69.3%) | 73 (4.5%) |
Employment Status by Educational Attainment in Midway
According to labor force statistics for Midway, 82.6% of individuals (1,440) out of the total population between 25 and 64 years of age (1,743) are in the labor force, with 2.7% or 39 of them being unemployed. The group with the highest labor force participation rate are those with the educational attainment of bachelor's degree or higher, with 89.1% or 400 individuals in the labor force. Within the labor force, individuals with less than high school education have the highest percentage of unemployment, with 28.9% or 39 of them being unemployed.
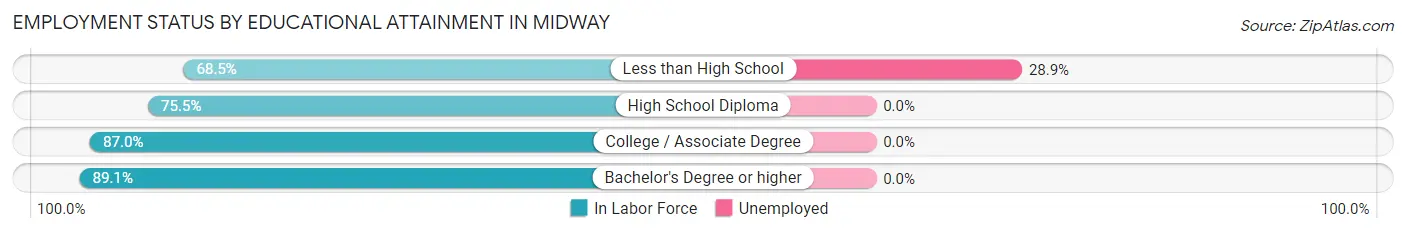
| Educational Attainment | In Labor Force | Unemployed |
| Less than High School | 135 (68.5%) | 57 (28.9%) |
| High School Diploma | 327 (75.5%) | 0 (0.0%) |
| College / Associate Degree | 578 (87.0%) | 0 (0.0%) |
| Bachelor's Degree or higher | 400 (89.1%) | 0 (0.0%) |
| Total | 1,440 (82.6%) | 47 (2.7%) |
Employment Occupations by Sex in Midway
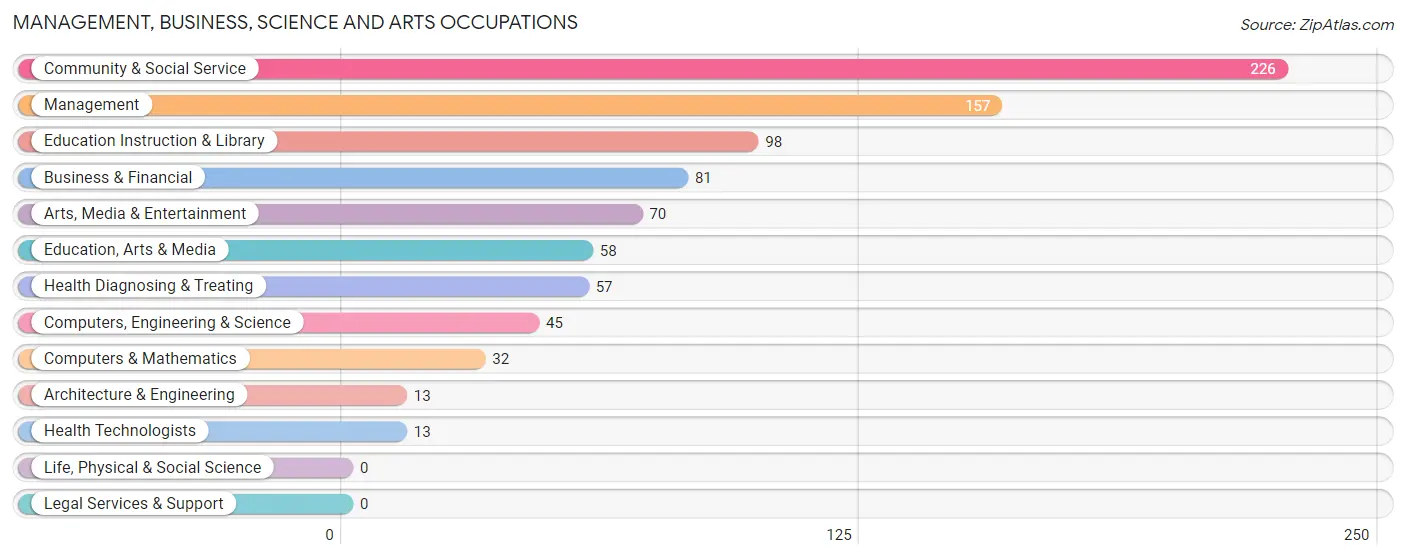
Management, Business, Science and Arts Occupations
The most common Management, Business, Science and Arts occupations in Midway are Community & Social Service (226 | 14.7%), Management (157 | 10.2%), Education Instruction & Library (98 | 6.4%), Business & Financial (81 | 5.3%), and Arts, Media & Entertainment (70 | 4.5%).
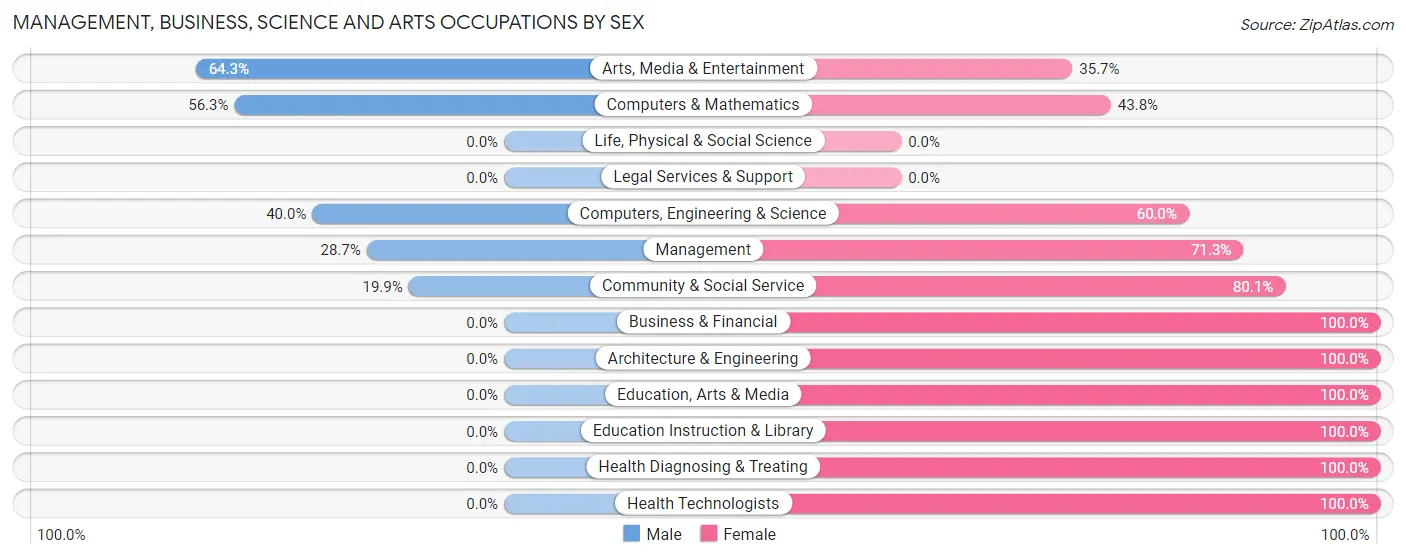
Management, Business, Science and Arts Occupations by Sex
Within the Management, Business, Science and Arts occupations in Midway, the most male-oriented occupations are Arts, Media & Entertainment (64.3%), Computers & Mathematics (56.2%), and Computers, Engineering & Science (40.0%), while the most female-oriented occupations are Business & Financial (100.0%), Architecture & Engineering (100.0%), and Education, Arts & Media (100.0%).
| Occupation | Male | Female |
| Management | 45 (28.7%) | 112 (71.3%) |
| Business & Financial | 0 (0.0%) | 81 (100.0%) |
| Computers, Engineering & Science | 18 (40.0%) | 27 (60.0%) |
| Computers & Mathematics | 18 (56.2%) | 14 (43.8%) |
| Architecture & Engineering | 0 (0.0%) | 13 (100.0%) |
| Life, Physical & Social Science | 0 (0.0%) | 0 (0.0%) |
| Community & Social Service | 45 (19.9%) | 181 (80.1%) |
| Education, Arts & Media | 0 (0.0%) | 58 (100.0%) |
| Legal Services & Support | 0 (0.0%) | 0 (0.0%) |
| Education Instruction & Library | 0 (0.0%) | 98 (100.0%) |
| Arts, Media & Entertainment | 45 (64.3%) | 25 (35.7%) |
| Health Diagnosing & Treating | 0 (0.0%) | 57 (100.0%) |
| Health Technologists | 0 (0.0%) | 13 (100.0%) |
| Total (Category) | 108 (19.1%) | 458 (80.9%) |
| Total (Overall) | 587 (38.1%) | 954 (61.9%) |
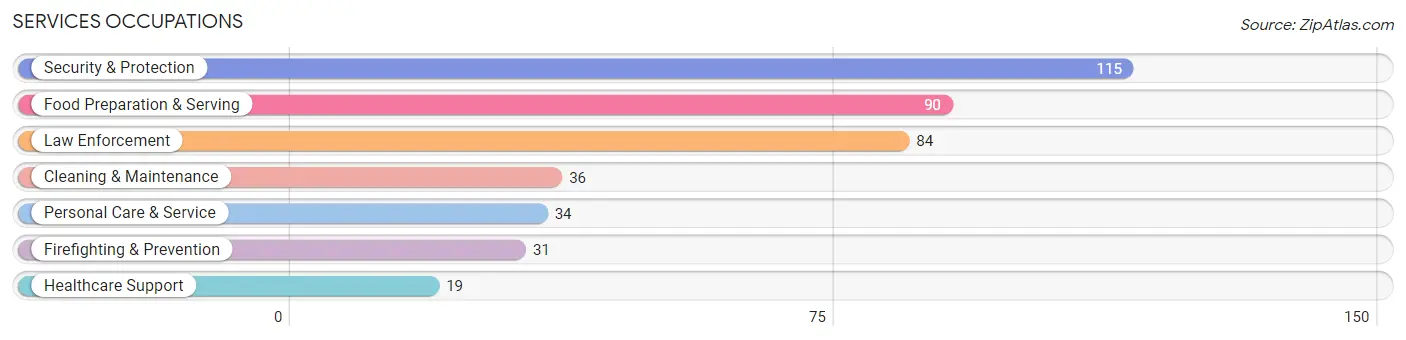
Services Occupations
The most common Services occupations in Midway are Security & Protection (115 | 7.5%), Food Preparation & Serving (90 | 5.8%), Law Enforcement (84 | 5.4%), Cleaning & Maintenance (36 | 2.3%), and Personal Care & Service (34 | 2.2%).
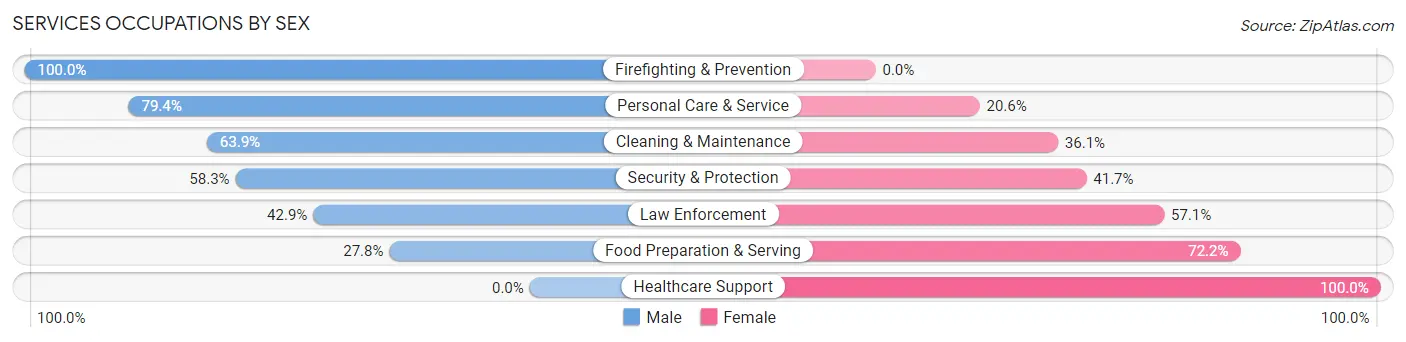
Services Occupations by Sex
Within the Services occupations in Midway, the most male-oriented occupations are Firefighting & Prevention (100.0%), Personal Care & Service (79.4%), and Cleaning & Maintenance (63.9%), while the most female-oriented occupations are Healthcare Support (100.0%), Food Preparation & Serving (72.2%), and Law Enforcement (57.1%).
| Occupation | Male | Female |
| Healthcare Support | 0 (0.0%) | 19 (100.0%) |
| Security & Protection | 67 (58.3%) | 48 (41.7%) |
| Firefighting & Prevention | 31 (100.0%) | 0 (0.0%) |
| Law Enforcement | 36 (42.9%) | 48 (57.1%) |
| Food Preparation & Serving | 25 (27.8%) | 65 (72.2%) |
| Cleaning & Maintenance | 23 (63.9%) | 13 (36.1%) |
| Personal Care & Service | 27 (79.4%) | 7 (20.6%) |
| Total (Category) | 142 (48.3%) | 152 (51.7%) |
| Total (Overall) | 587 (38.1%) | 954 (61.9%) |
Sales and Office Occupations
The most common Sales and Office occupations in Midway are Office & Administration (258 | 16.7%), and Sales & Related (174 | 11.3%).

Sales and Office Occupations by Sex
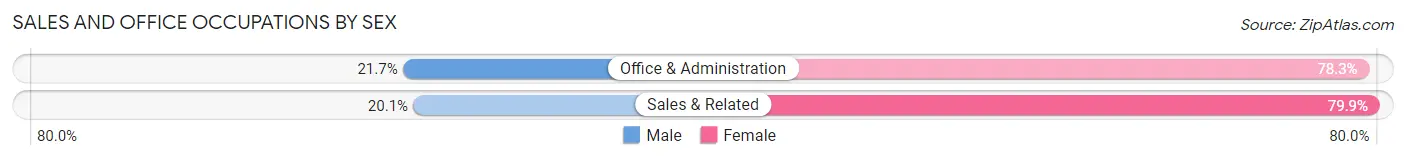
| Occupation | Male | Female |
| Sales & Related | 35 (20.1%) | 139 (79.9%) |
| Office & Administration | 56 (21.7%) | 202 (78.3%) |
| Total (Category) | 91 (21.1%) | 341 (78.9%) |
| Total (Overall) | 587 (38.1%) | 954 (61.9%) |
Natural Resources, Construction and Maintenance Occupations
The most common Natural Resources, Construction and Maintenance occupations in Midway are Installation, Maintenance & Repair (72 | 4.7%), and Construction & Extraction (67 | 4.3%).
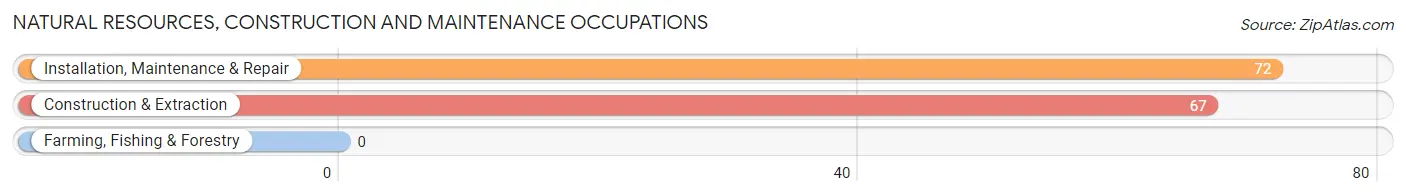
Natural Resources, Construction and Maintenance Occupations by Sex

| Occupation | Male | Female |
| Farming, Fishing & Forestry | 0 (0.0%) | 0 (0.0%) |
| Construction & Extraction | 67 (100.0%) | 0 (0.0%) |
| Installation, Maintenance & Repair | 72 (100.0%) | 0 (0.0%) |
| Total (Category) | 139 (100.0%) | 0 (0.0%) |
| Total (Overall) | 587 (38.1%) | 954 (61.9%) |
Production, Transportation and Moving Occupations
The most common Production, Transportation and Moving occupations in Midway are Transportation (55 | 3.6%), Material Moving (31 | 2.0%), and Production (24 | 1.6%).
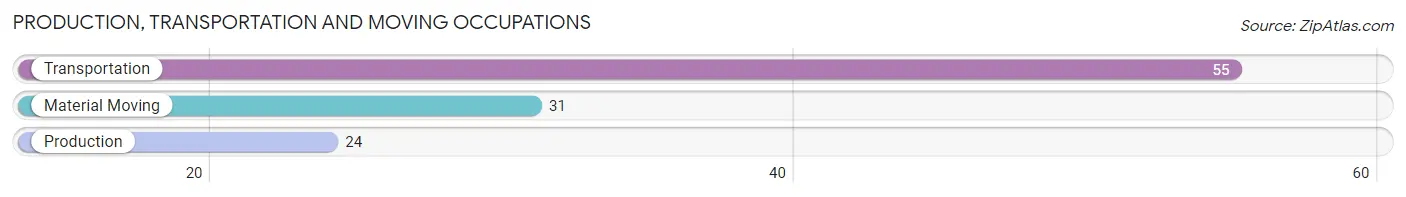
Production, Transportation and Moving Occupations by Sex
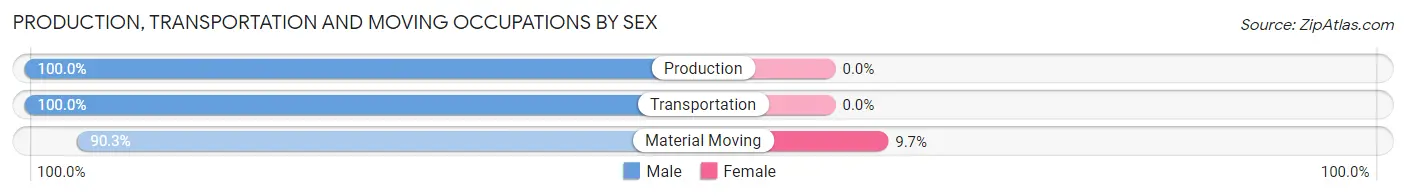
| Occupation | Male | Female |
| Production | 24 (100.0%) | 0 (0.0%) |
| Transportation | 55 (100.0%) | 0 (0.0%) |
| Material Moving | 28 (90.3%) | 3 (9.7%) |
| Total (Category) | 107 (97.3%) | 3 (2.7%) |
| Total (Overall) | 587 (38.1%) | 954 (61.9%) |
Employment Industries by Sex in Midway
Employment Industries in Midway
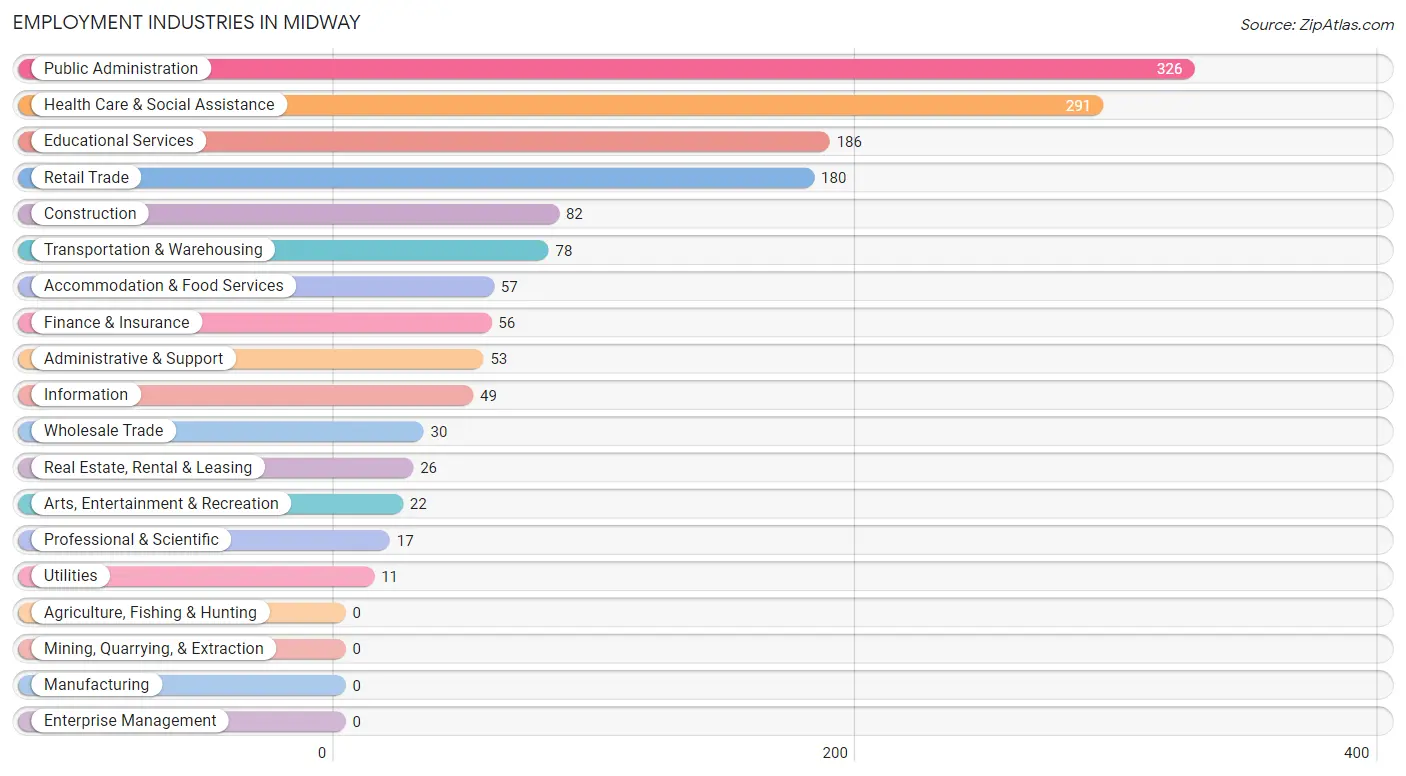
The major employment industries in Midway include Public Administration (326 | 21.2%), Health Care & Social Assistance (291 | 18.9%), Educational Services (186 | 12.1%), Retail Trade (180 | 11.7%), and Construction (82 | 5.3%).
Employment Industries by Sex in Midway
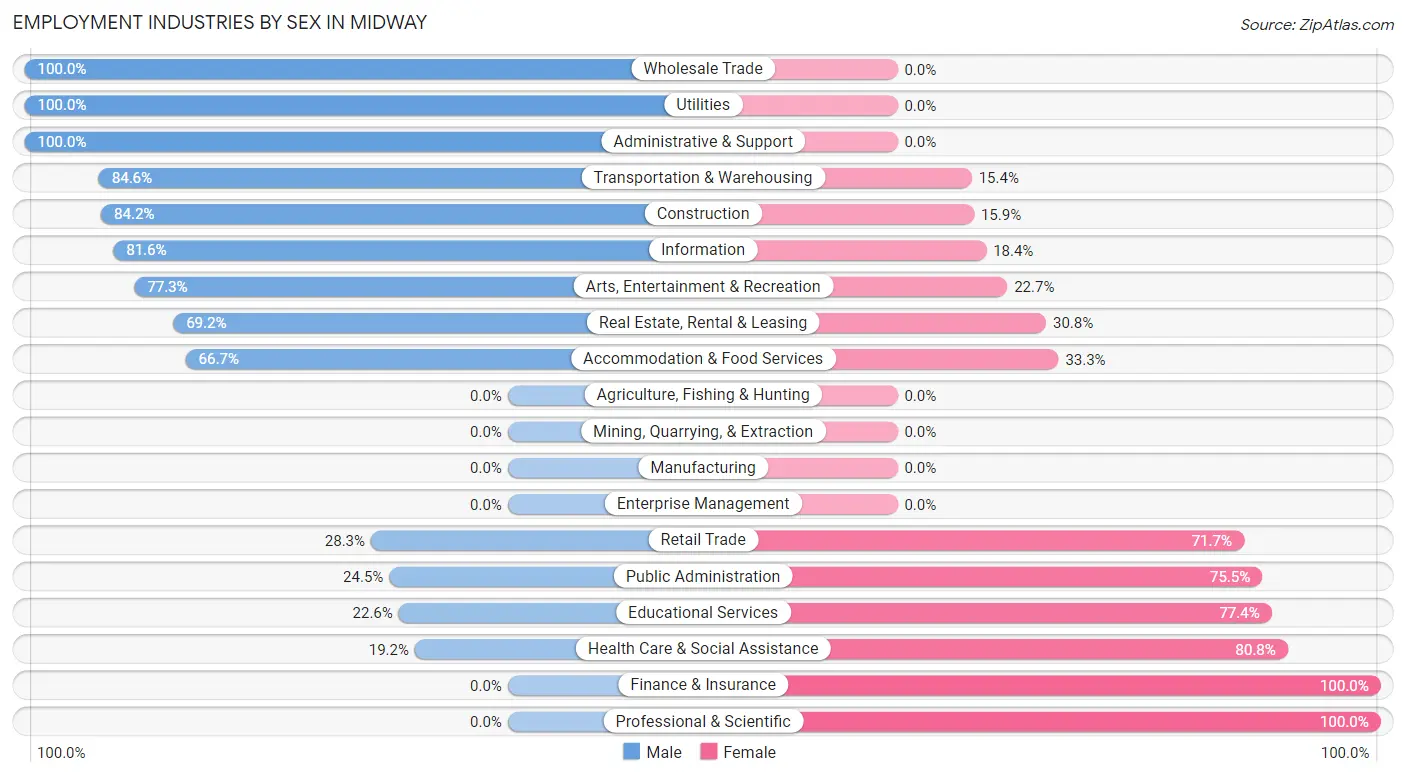
The Midway industries that see more men than women are Wholesale Trade (100.0%), Utilities (100.0%), and Administrative & Support (100.0%), whereas the industries that tend to have a higher number of women are Finance & Insurance (100.0%), Professional & Scientific (100.0%), and Health Care & Social Assistance (80.8%).
| Industry | Male | Female |
| Agriculture, Fishing & Hunting | 0 (0.0%) | 0 (0.0%) |
| Mining, Quarrying, & Extraction | 0 (0.0%) | 0 (0.0%) |
| Construction | 69 (84.2%) | 13 (15.9%) |
| Manufacturing | 0 (0.0%) | 0 (0.0%) |
| Wholesale Trade | 30 (100.0%) | 0 (0.0%) |
| Retail Trade | 51 (28.3%) | 129 (71.7%) |
| Transportation & Warehousing | 66 (84.6%) | 12 (15.4%) |
| Utilities | 11 (100.0%) | 0 (0.0%) |
| Information | 40 (81.6%) | 9 (18.4%) |
| Finance & Insurance | 0 (0.0%) | 56 (100.0%) |
| Real Estate, Rental & Leasing | 18 (69.2%) | 8 (30.8%) |
| Professional & Scientific | 0 (0.0%) | 17 (100.0%) |
| Enterprise Management | 0 (0.0%) | 0 (0.0%) |
| Administrative & Support | 53 (100.0%) | 0 (0.0%) |
| Educational Services | 42 (22.6%) | 144 (77.4%) |
| Health Care & Social Assistance | 56 (19.2%) | 235 (80.8%) |
| Arts, Entertainment & Recreation | 17 (77.3%) | 5 (22.7%) |
| Accommodation & Food Services | 38 (66.7%) | 19 (33.3%) |
| Public Administration | 80 (24.5%) | 246 (75.5%) |
| Total | 587 (38.1%) | 954 (61.9%) |
Education in Midway
School Enrollment in Midway
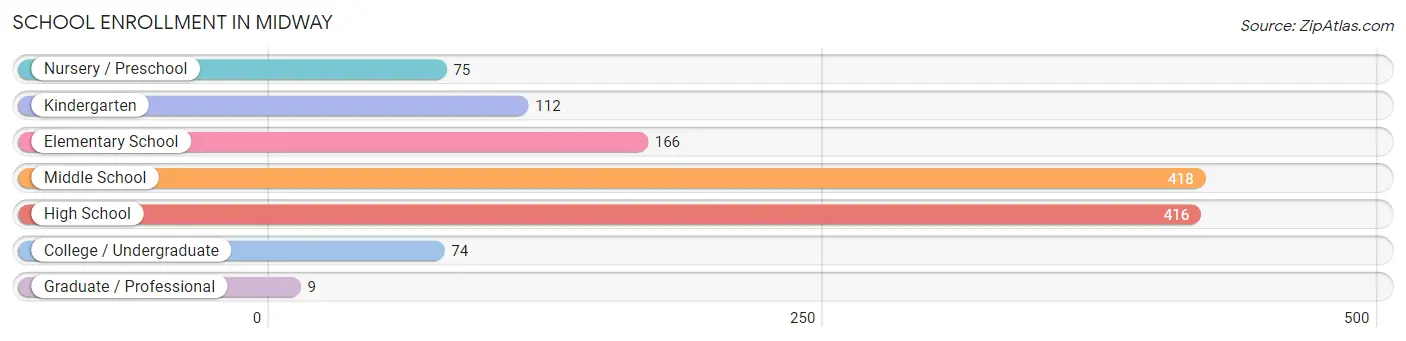
The most common levels of schooling among the 1,270 students in Midway are middle school (418 | 32.9%), high school (416 | 32.8%), and elementary school (166 | 13.1%).
| School Level | # Students | % Students |
| Nursery / Preschool | 75 | 5.9% |
| Kindergarten | 112 | 8.8% |
| Elementary School | 166 | 13.1% |
| Middle School | 418 | 32.9% |
| High School | 416 | 32.8% |
| College / Undergraduate | 74 | 5.8% |
| Graduate / Professional | 9 | 0.7% |
| Total | 1,270 | 100.0% |
School Enrollment by Age by Funding Source in Midway
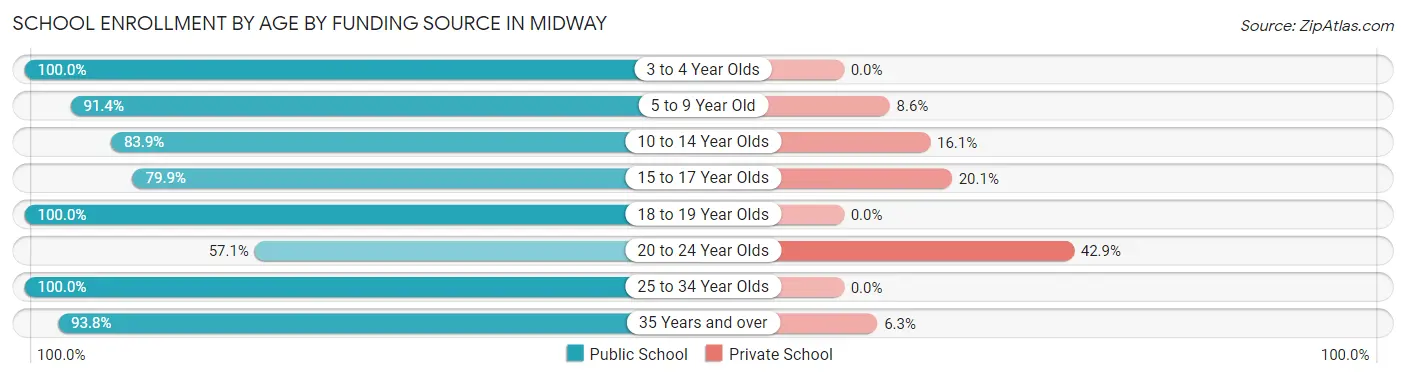
Out of a total of 1,270 students who are enrolled in schools in Midway, 178 (14.0%) attend a private institution, while the remaining 1,092 (86.0%) are enrolled in public schools. The age group of 20 to 24 year olds has the highest likelihood of being enrolled in private schools, with 18 (42.9% in the age bracket) enrolled. Conversely, the age group of 3 to 4 year olds has the lowest likelihood of being enrolled in a private school, with 75 (100.0% in the age bracket) attending a public institution.
| Age Bracket | Public School | Private School |
| 3 to 4 Year Olds | 75 (100.0%) | 0 (0.0%) |
| 5 to 9 Year Old | 235 (91.4%) | 22 (8.6%) |
| 10 to 14 Year Olds | 391 (83.9%) | 75 (16.1%) |
| 15 to 17 Year Olds | 238 (79.9%) | 60 (20.1%) |
| 18 to 19 Year Olds | 54 (100.0%) | 0 (0.0%) |
| 20 to 24 Year Olds | 24 (57.1%) | 18 (42.9%) |
| 25 to 34 Year Olds | 30 (100.0%) | 0 (0.0%) |
| 35 Years and over | 45 (93.8%) | 3 (6.2%) |
| Total | 1,092 (86.0%) | 178 (14.0%) |
Educational Attainment by Field of Study in Midway
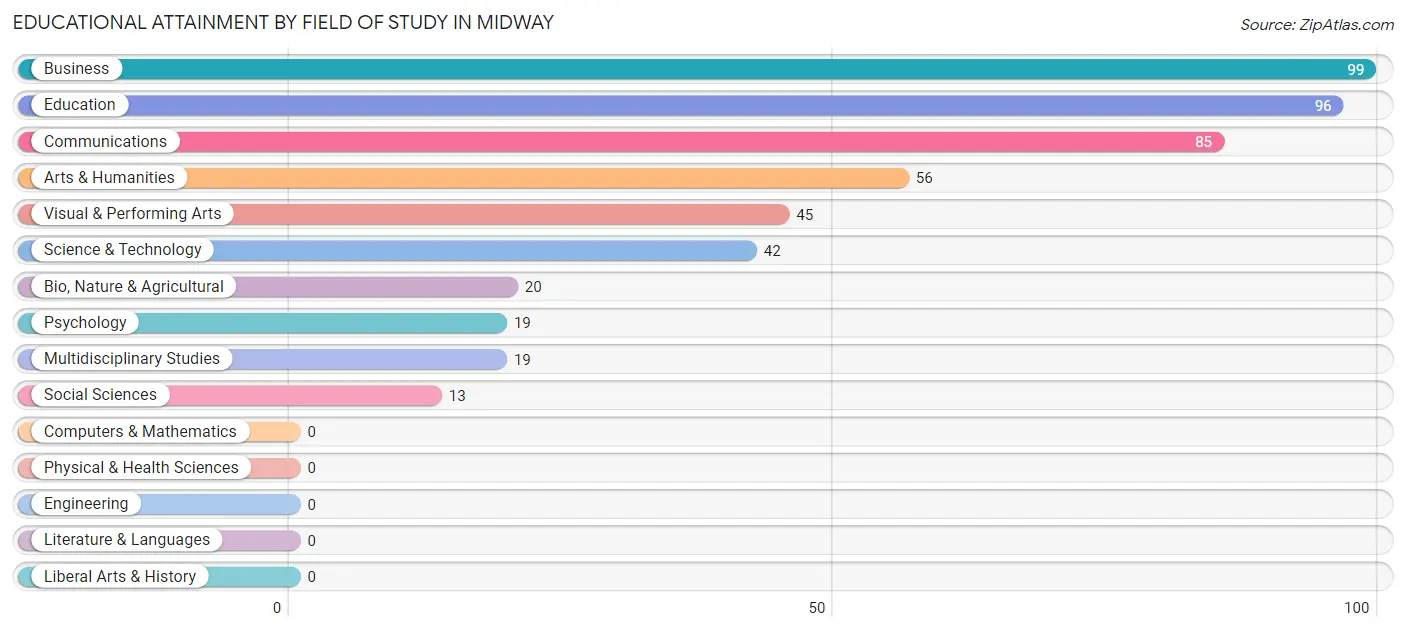
Business (99 | 20.0%), education (96 | 19.4%), communications (85 | 17.2%), arts & humanities (56 | 11.3%), and visual & performing arts (45 | 9.1%) are the most common fields of study among 494 individuals in Midway who have obtained a bachelor's degree or higher.
| Field of Study | # Graduates | % Graduates |
| Computers & Mathematics | 0 | 0.0% |
| Bio, Nature & Agricultural | 20 | 4.1% |
| Physical & Health Sciences | 0 | 0.0% |
| Psychology | 19 | 3.8% |
| Social Sciences | 13 | 2.6% |
| Engineering | 0 | 0.0% |
| Multidisciplinary Studies | 19 | 3.8% |
| Science & Technology | 42 | 8.5% |
| Business | 99 | 20.0% |
| Education | 96 | 19.4% |
| Literature & Languages | 0 | 0.0% |
| Liberal Arts & History | 0 | 0.0% |
| Visual & Performing Arts | 45 | 9.1% |
| Communications | 85 | 17.2% |
| Arts & Humanities | 56 | 11.3% |
| Total | 494 | 100.0% |
Transportation & Commute in Midway
Vehicle Availability by Sex in Midway
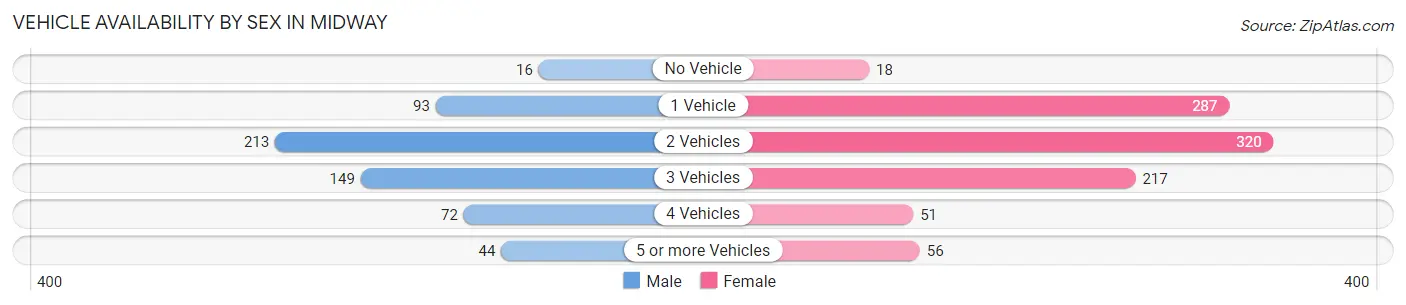
The most prevalent vehicle ownership categories in Midway are males with 2 vehicles (213, accounting for 36.3%) and females with 2 vehicles (320, making up 22.4%).
| Vehicles Available | Male | Female |
| No Vehicle | 16 (2.7%) | 18 (1.9%) |
| 1 Vehicle | 93 (15.8%) | 287 (30.2%) |
| 2 Vehicles | 213 (36.3%) | 320 (33.7%) |
| 3 Vehicles | 149 (25.4%) | 217 (22.9%) |
| 4 Vehicles | 72 (12.3%) | 51 (5.4%) |
| 5 or more Vehicles | 44 (7.5%) | 56 (5.9%) |
| Total | 587 (100.0%) | 949 (100.0%) |
Commute Time in Midway
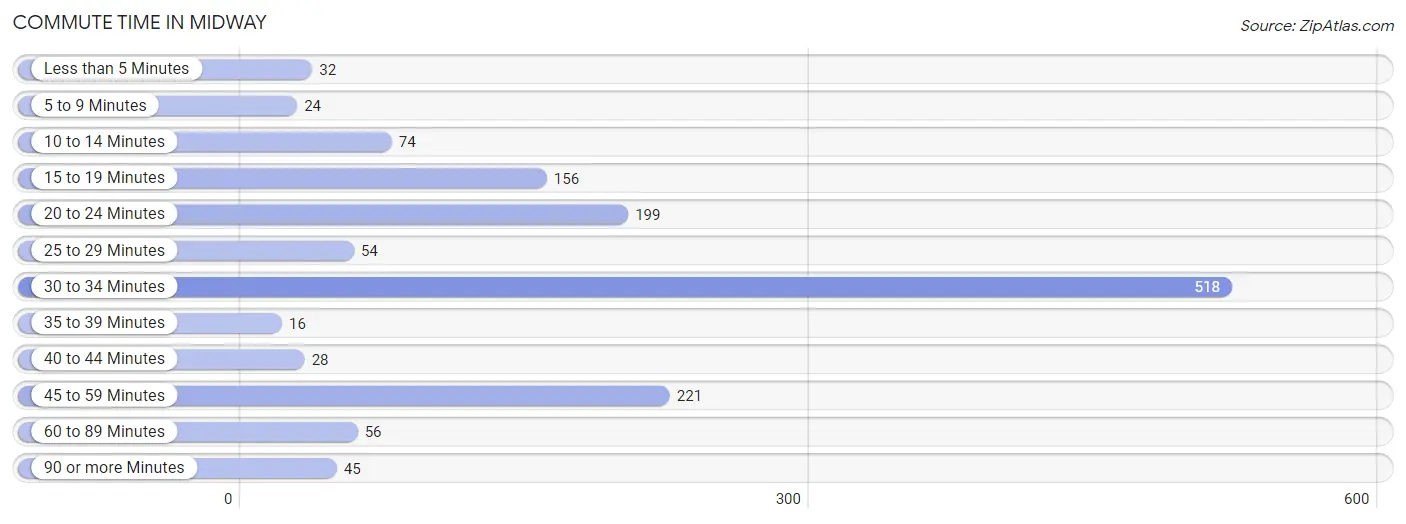
The most frequently occuring commute durations in Midway are 30 to 34 minutes (518 commuters, 36.4%), 45 to 59 minutes (221 commuters, 15.5%), and 20 to 24 minutes (199 commuters, 14.0%).
| Commute Time | # Commuters | % Commuters |
| Less than 5 Minutes | 32 | 2.2% |
| 5 to 9 Minutes | 24 | 1.7% |
| 10 to 14 Minutes | 74 | 5.2% |
| 15 to 19 Minutes | 156 | 11.0% |
| 20 to 24 Minutes | 199 | 14.0% |
| 25 to 29 Minutes | 54 | 3.8% |
| 30 to 34 Minutes | 518 | 36.4% |
| 35 to 39 Minutes | 16 | 1.1% |
| 40 to 44 Minutes | 28 | 2.0% |
| 45 to 59 Minutes | 221 | 15.5% |
| 60 to 89 Minutes | 56 | 3.9% |
| 90 or more Minutes | 45 | 3.2% |
Commute Time by Sex in Midway
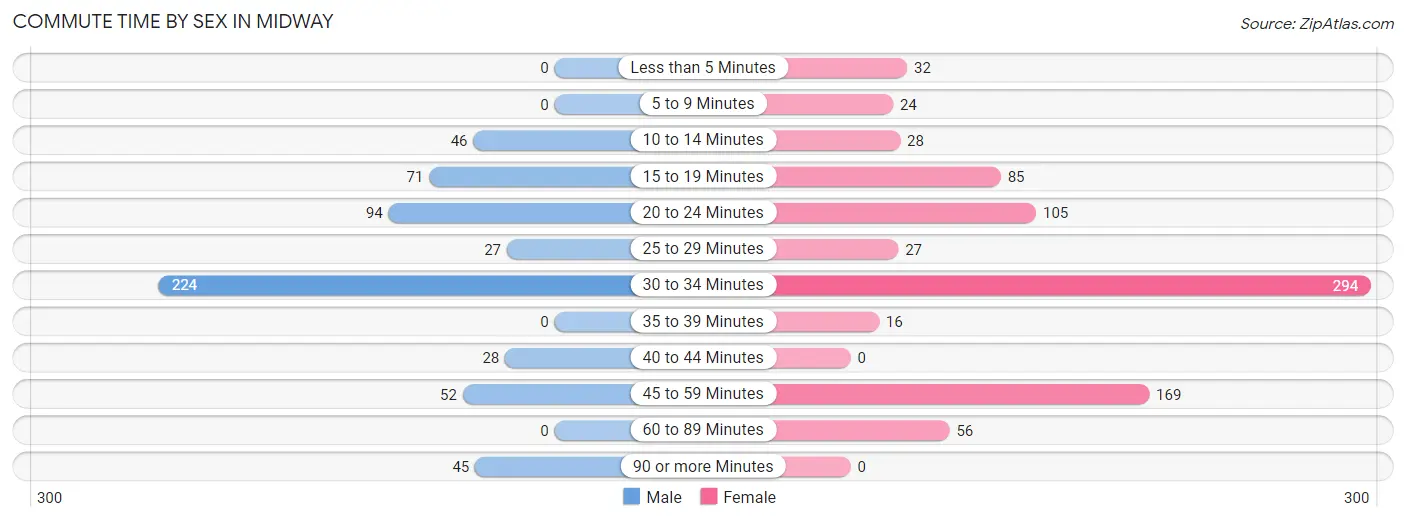
The most common commute times in Midway are 30 to 34 minutes (224 commuters, 38.2%) for males and 30 to 34 minutes (294 commuters, 35.2%) for females.
| Commute Time | Male | Female |
| Less than 5 Minutes | 0 (0.0%) | 32 (3.8%) |
| 5 to 9 Minutes | 0 (0.0%) | 24 (2.9%) |
| 10 to 14 Minutes | 46 (7.8%) | 28 (3.4%) |
| 15 to 19 Minutes | 71 (12.1%) | 85 (10.2%) |
| 20 to 24 Minutes | 94 (16.0%) | 105 (12.6%) |
| 25 to 29 Minutes | 27 (4.6%) | 27 (3.2%) |
| 30 to 34 Minutes | 224 (38.2%) | 294 (35.2%) |
| 35 to 39 Minutes | 0 (0.0%) | 16 (1.9%) |
| 40 to 44 Minutes | 28 (4.8%) | 0 (0.0%) |
| 45 to 59 Minutes | 52 (8.9%) | 169 (20.2%) |
| 60 to 89 Minutes | 0 (0.0%) | 56 (6.7%) |
| 90 or more Minutes | 45 (7.7%) | 0 (0.0%) |
Time of Departure to Work by Sex in Midway
The most frequent times of departure to work in Midway are 7:00 AM to 7:29 AM (165, 28.1%) for males and 6:30 AM to 6:59 AM (181, 21.6%) for females.
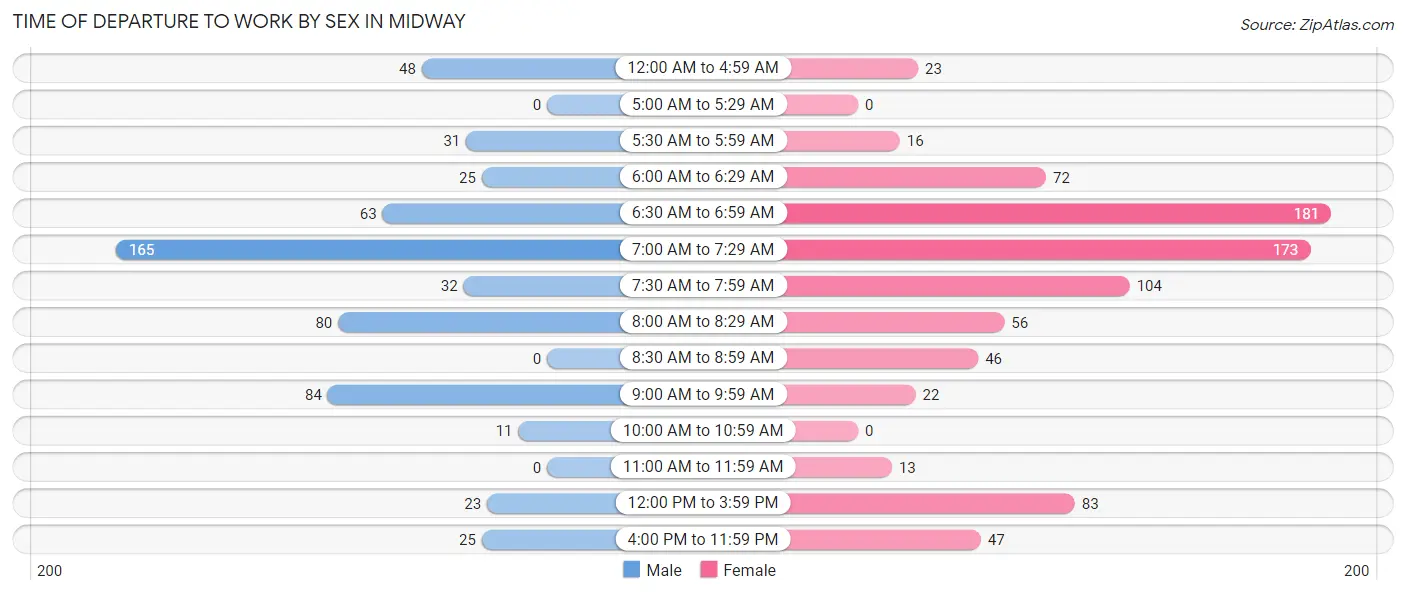
| Time of Departure | Male | Female |
| 12:00 AM to 4:59 AM | 48 (8.2%) | 23 (2.8%) |
| 5:00 AM to 5:29 AM | 0 (0.0%) | 0 (0.0%) |
| 5:30 AM to 5:59 AM | 31 (5.3%) | 16 (1.9%) |
| 6:00 AM to 6:29 AM | 25 (4.3%) | 72 (8.6%) |
| 6:30 AM to 6:59 AM | 63 (10.7%) | 181 (21.6%) |
| 7:00 AM to 7:29 AM | 165 (28.1%) | 173 (20.7%) |
| 7:30 AM to 7:59 AM | 32 (5.4%) | 104 (12.4%) |
| 8:00 AM to 8:29 AM | 80 (13.6%) | 56 (6.7%) |
| 8:30 AM to 8:59 AM | 0 (0.0%) | 46 (5.5%) |
| 9:00 AM to 9:59 AM | 84 (14.3%) | 22 (2.6%) |
| 10:00 AM to 10:59 AM | 11 (1.9%) | 0 (0.0%) |
| 11:00 AM to 11:59 AM | 0 (0.0%) | 13 (1.6%) |
| 12:00 PM to 3:59 PM | 23 (3.9%) | 83 (9.9%) |
| 4:00 PM to 11:59 PM | 25 (4.3%) | 47 (5.6%) |
| Total | 587 (100.0%) | 836 (100.0%) |
Housing Occupancy in Midway
Occupancy by Ownership in Midway
Of the total 1,103 dwellings in Midway, owner-occupied units account for 978 (88.7%), while renter-occupied units make up 125 (11.3%).
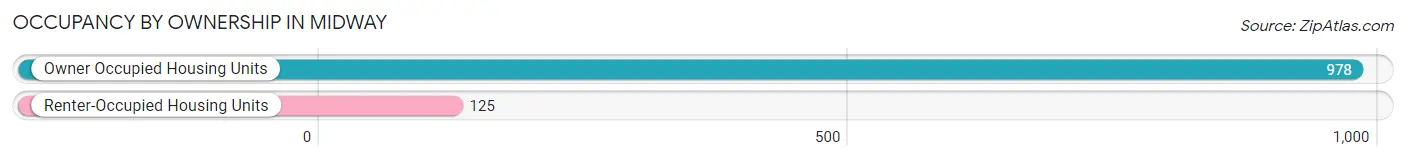
| Occupancy | # Housing Units | % Housing Units |
| Owner Occupied Housing Units | 978 | 88.7% |
| Renter-Occupied Housing Units | 125 | 11.3% |
| Total Occupied Housing Units | 1,103 | 100.0% |
Occupancy by Household Size in Midway
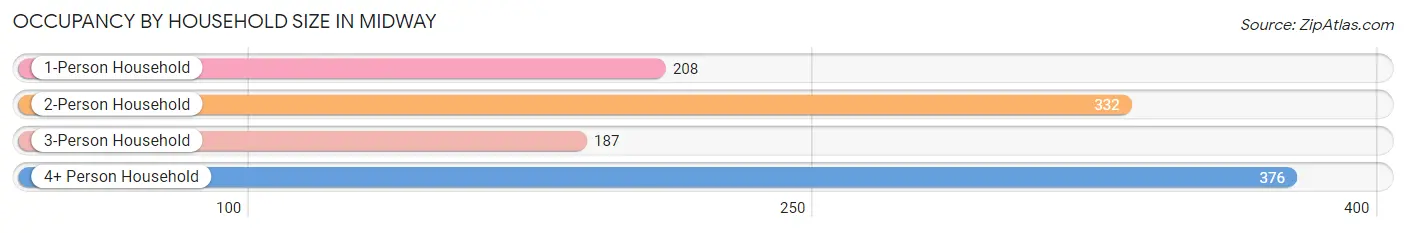
| Household Size | # Housing Units | % Housing Units |
| 1-Person Household | 208 | 18.9% |
| 2-Person Household | 332 | 30.1% |
| 3-Person Household | 187 | 17.0% |
| 4+ Person Household | 376 | 34.1% |
| Total Housing Units | 1,103 | 100.0% |
Occupancy by Ownership by Household Size in Midway
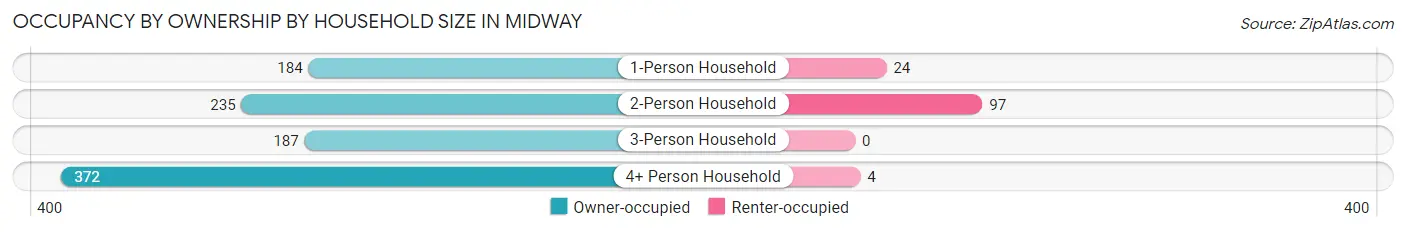
| Household Size | Owner-occupied | Renter-occupied |
| 1-Person Household | 184 (88.5%) | 24 (11.5%) |
| 2-Person Household | 235 (70.8%) | 97 (29.2%) |
| 3-Person Household | 187 (100.0%) | 0 (0.0%) |
| 4+ Person Household | 372 (98.9%) | 4 (1.1%) |
| Total Housing Units | 978 (88.7%) | 125 (11.3%) |
Occupancy by Educational Attainment in Midway
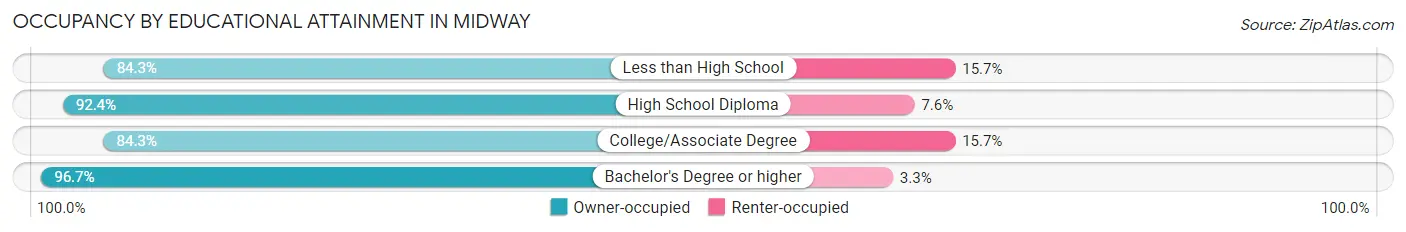
| Household Size | Owner-occupied | Renter-occupied |
| Less than High School | 86 (84.3%) | 16 (15.7%) |
| High School Diploma | 207 (92.4%) | 17 (7.6%) |
| College/Associate Degree | 452 (84.3%) | 84 (15.7%) |
| Bachelor's Degree or higher | 233 (96.7%) | 8 (3.3%) |
Occupancy by Age of Householder in Midway
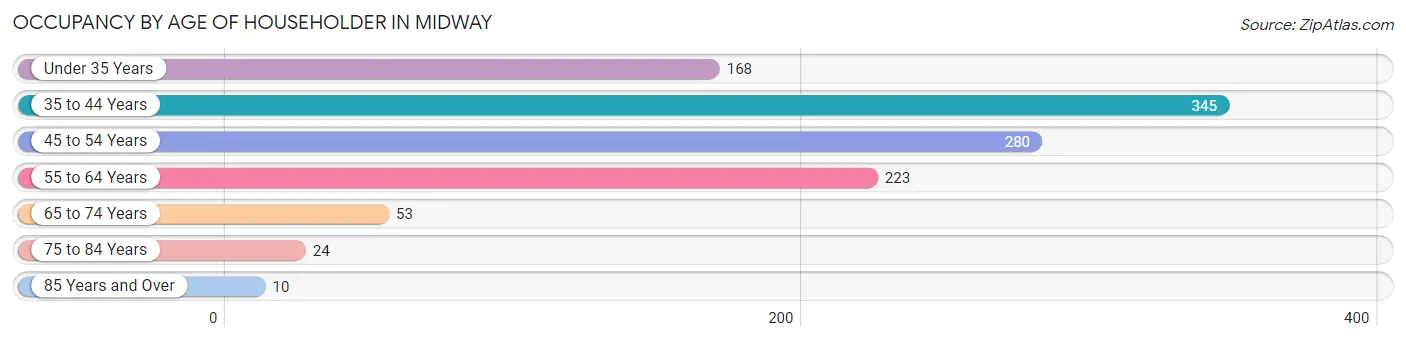
| Age Bracket | # Households | % Households |
| Under 35 Years | 168 | 15.2% |
| 35 to 44 Years | 345 | 31.3% |
| 45 to 54 Years | 280 | 25.4% |
| 55 to 64 Years | 223 | 20.2% |
| 65 to 74 Years | 53 | 4.8% |
| 75 to 84 Years | 24 | 2.2% |
| 85 Years and Over | 10 | 0.9% |
| Total | 1,103 | 100.0% |
Housing Finances in Midway
Median Income by Occupancy in Midway
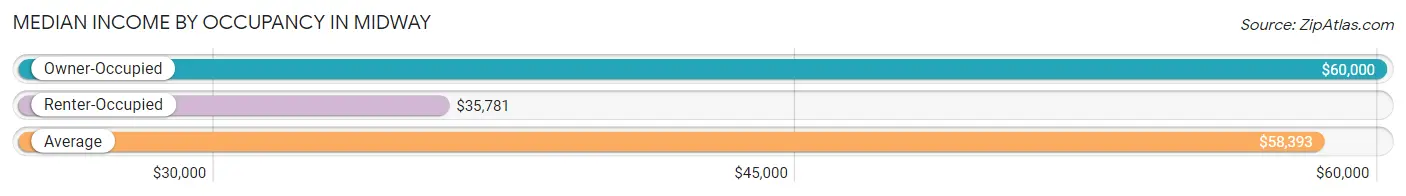
| Occupancy Type | # Households | Median Income |
| Owner-Occupied | 978 (88.7%) | $60,000 |
| Renter-Occupied | 125 (11.3%) | $35,781 |
| Average | 1,103 (100.0%) | $58,393 |
Occupancy by Householder Income Bracket in Midway
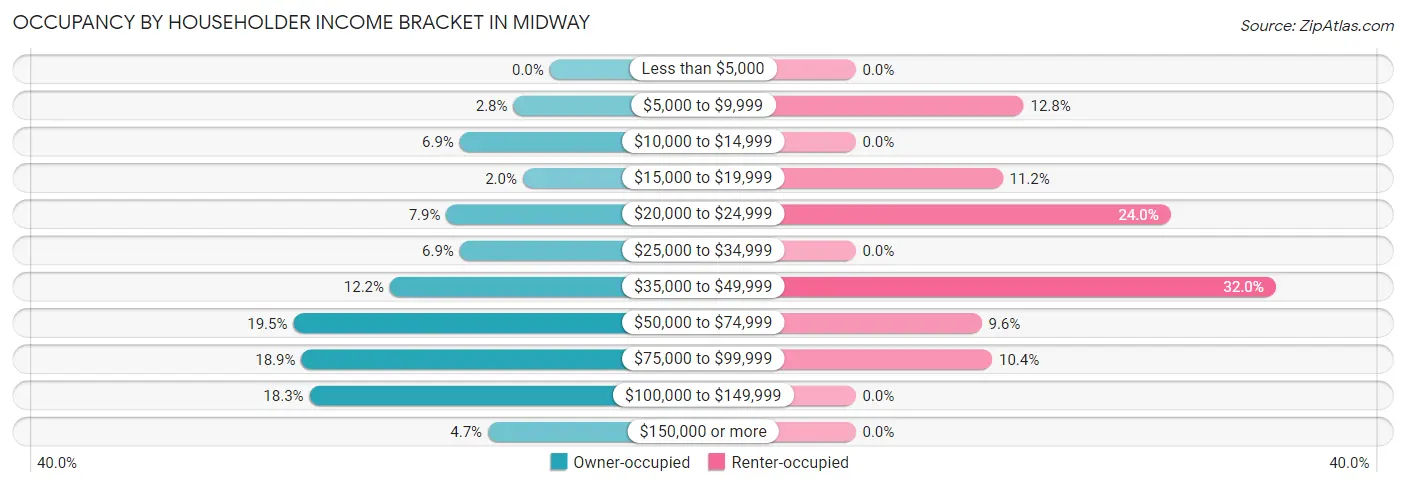
| Income Bracket | Owner-occupied | Renter-occupied |
| Less than $5,000 | 0 (0.0%) | 0 (0.0%) |
| $5,000 to $9,999 | 27 (2.8%) | 16 (12.8%) |
| $10,000 to $14,999 | 67 (6.9%) | 0 (0.0%) |
| $15,000 to $19,999 | 20 (2.0%) | 14 (11.2%) |
| $20,000 to $24,999 | 77 (7.9%) | 30 (24.0%) |
| $25,000 to $34,999 | 67 (6.9%) | 0 (0.0%) |
| $35,000 to $49,999 | 119 (12.2%) | 40 (32.0%) |
| $50,000 to $74,999 | 191 (19.5%) | 12 (9.6%) |
| $75,000 to $99,999 | 185 (18.9%) | 13 (10.4%) |
| $100,000 to $149,999 | 179 (18.3%) | 0 (0.0%) |
| $150,000 or more | 46 (4.7%) | 0 (0.0%) |
| Total | 978 (100.0%) | 125 (100.0%) |
Monthly Housing Cost Tiers in Midway
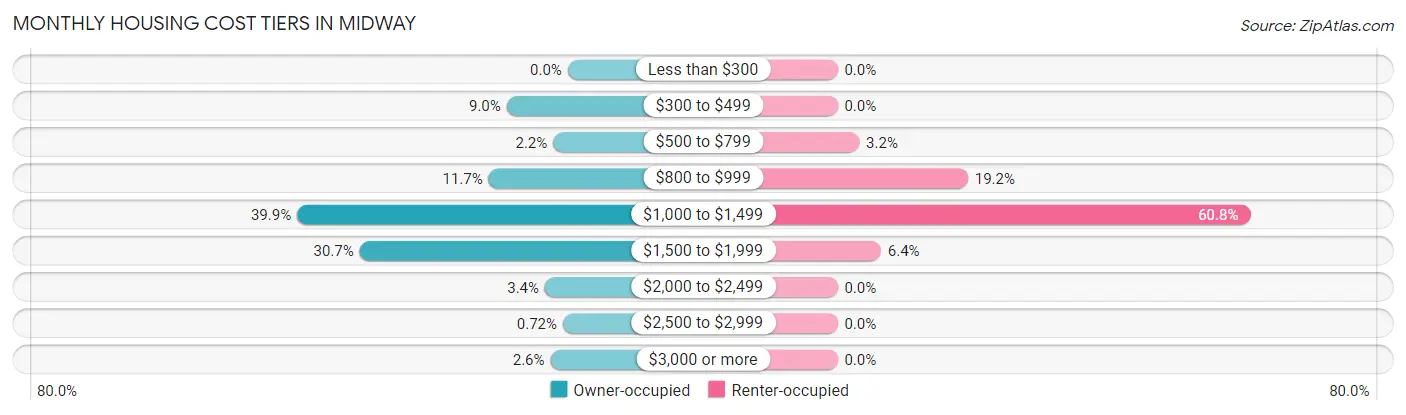
| Monthly Cost | Owner-occupied | Renter-occupied |
| Less than $300 | 0 (0.0%) | 0 (0.0%) |
| $300 to $499 | 88 (9.0%) | 0 (0.0%) |
| $500 to $799 | 21 (2.1%) | 4 (3.2%) |
| $800 to $999 | 114 (11.7%) | 24 (19.2%) |
| $1,000 to $1,499 | 390 (39.9%) | 76 (60.8%) |
| $1,500 to $1,999 | 300 (30.7%) | 8 (6.4%) |
| $2,000 to $2,499 | 33 (3.4%) | 0 (0.0%) |
| $2,500 to $2,999 | 7 (0.7%) | 0 (0.0%) |
| $3,000 or more | 25 (2.6%) | 0 (0.0%) |
| Total | 978 (100.0%) | 125 (100.0%) |
Physical Housing Characteristics in Midway
Housing Structures in Midway
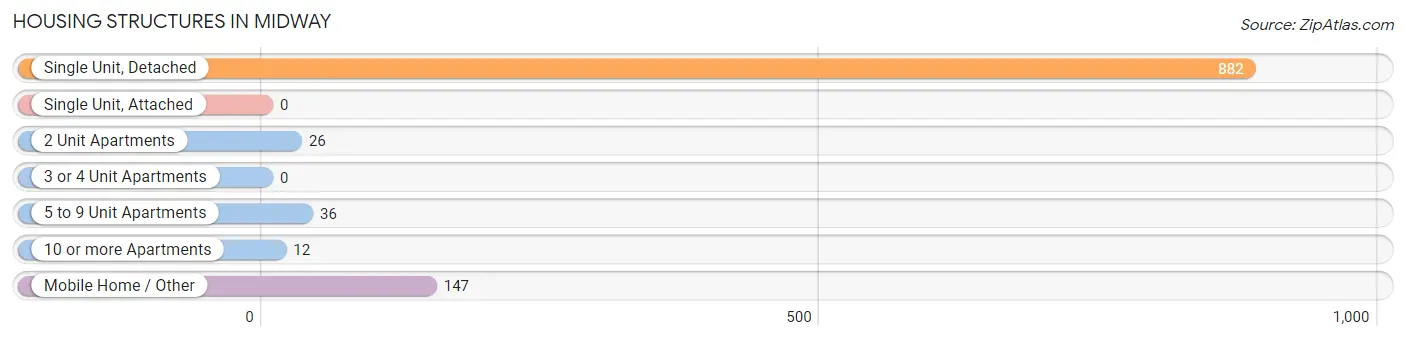
| Structure Type | # Housing Units | % Housing Units |
| Single Unit, Detached | 882 | 80.0% |
| Single Unit, Attached | 0 | 0.0% |
| 2 Unit Apartments | 26 | 2.4% |
| 3 or 4 Unit Apartments | 0 | 0.0% |
| 5 to 9 Unit Apartments | 36 | 3.3% |
| 10 or more Apartments | 12 | 1.1% |
| Mobile Home / Other | 147 | 13.3% |
| Total | 1,103 | 100.0% |
Housing Structures by Occupancy in Midway
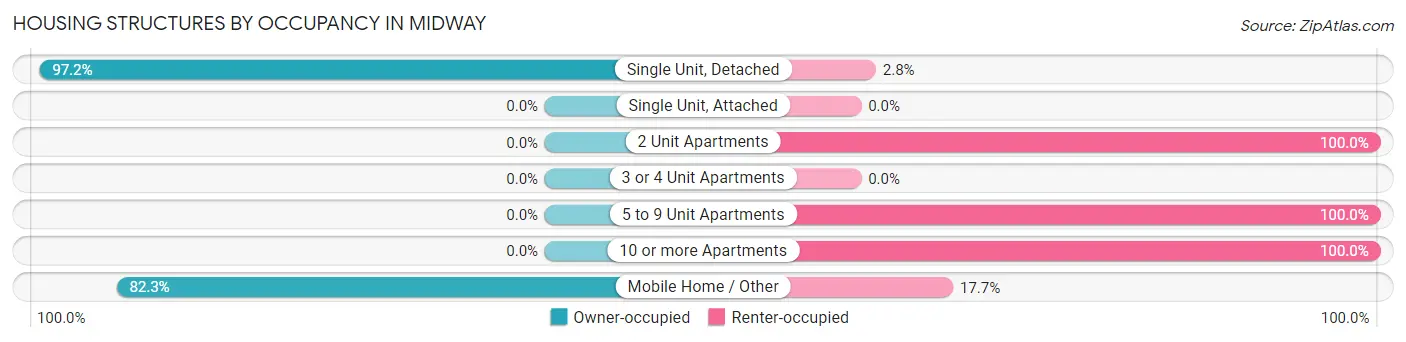
| Structure Type | Owner-occupied | Renter-occupied |
| Single Unit, Detached | 857 (97.2%) | 25 (2.8%) |
| Single Unit, Attached | 0 (0.0%) | 0 (0.0%) |
| 2 Unit Apartments | 0 (0.0%) | 26 (100.0%) |
| 3 or 4 Unit Apartments | 0 (0.0%) | 0 (0.0%) |
| 5 to 9 Unit Apartments | 0 (0.0%) | 36 (100.0%) |
| 10 or more Apartments | 0 (0.0%) | 12 (100.0%) |
| Mobile Home / Other | 121 (82.3%) | 26 (17.7%) |
| Total | 978 (88.7%) | 125 (11.3%) |
Housing Structures by Number of Rooms in Midway
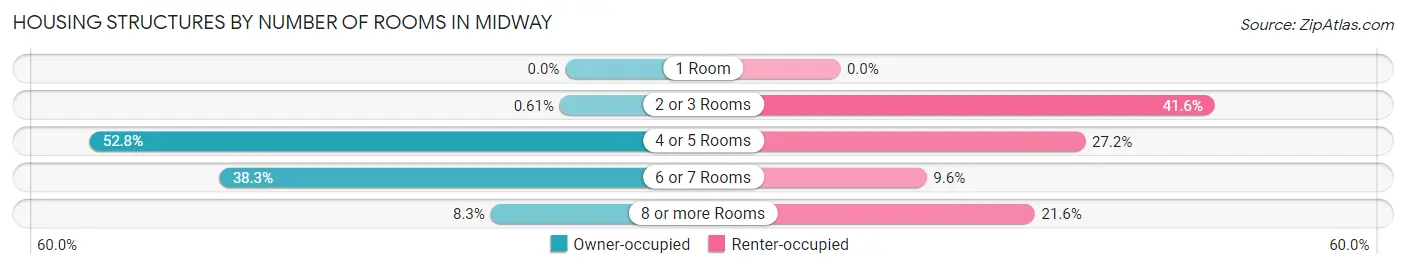
| Number of Rooms | Owner-occupied | Renter-occupied |
| 1 Room | 0 (0.0%) | 0 (0.0%) |
| 2 or 3 Rooms | 6 (0.6%) | 52 (41.6%) |
| 4 or 5 Rooms | 516 (52.8%) | 34 (27.2%) |
| 6 or 7 Rooms | 375 (38.3%) | 12 (9.6%) |
| 8 or more Rooms | 81 (8.3%) | 27 (21.6%) |
| Total | 978 (100.0%) | 125 (100.0%) |
Housing Structure by Heating Type in Midway
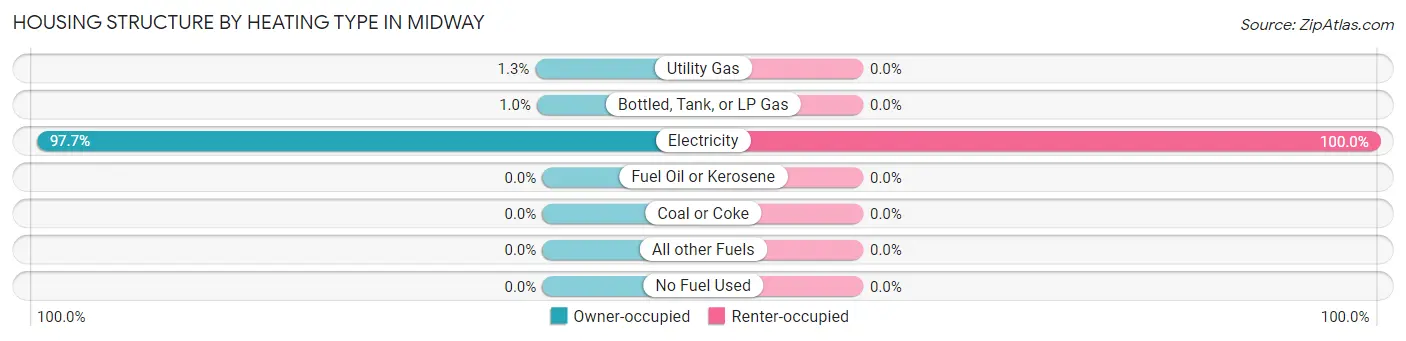
| Heating Type | Owner-occupied | Renter-occupied |
| Utility Gas | 13 (1.3%) | 0 (0.0%) |
| Bottled, Tank, or LP Gas | 10 (1.0%) | 0 (0.0%) |
| Electricity | 955 (97.7%) | 125 (100.0%) |
| Fuel Oil or Kerosene | 0 (0.0%) | 0 (0.0%) |
| Coal or Coke | 0 (0.0%) | 0 (0.0%) |
| All other Fuels | 0 (0.0%) | 0 (0.0%) |
| No Fuel Used | 0 (0.0%) | 0 (0.0%) |
| Total | 978 (100.0%) | 125 (100.0%) |
Household Vehicle Usage in Midway
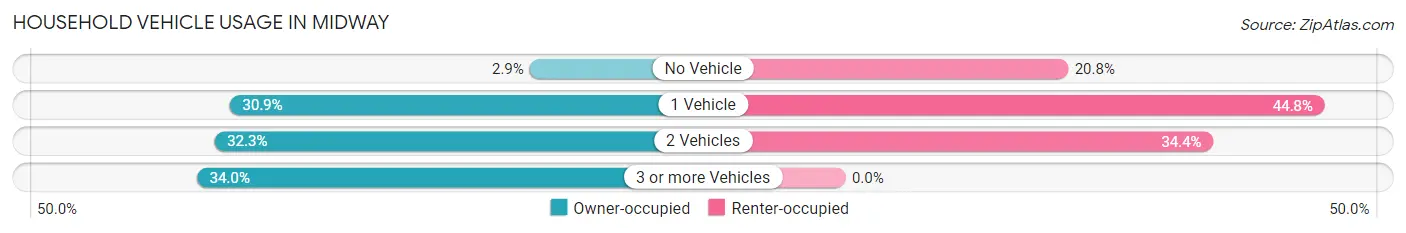
| Vehicles per Household | Owner-occupied | Renter-occupied |
| No Vehicle | 28 (2.9%) | 26 (20.8%) |
| 1 Vehicle | 302 (30.9%) | 56 (44.8%) |
| 2 Vehicles | 316 (32.3%) | 43 (34.4%) |
| 3 or more Vehicles | 332 (34.0%) | 0 (0.0%) |
| Total | 978 (100.0%) | 125 (100.0%) |
Real Estate & Mortgages in Midway
Real Estate and Mortgage Overview in Midway
| Characteristic | Without Mortgage | With Mortgage |
| Housing Units | 90 | 888 |
| Median Property Value | $75,900 | $189,200 |
| Median Household Income | $23,286 | $46 |
| Monthly Housing Costs | $449 | $25 |
| Real Estate Taxes | - | - |
Property Value by Mortgage Status in Midway
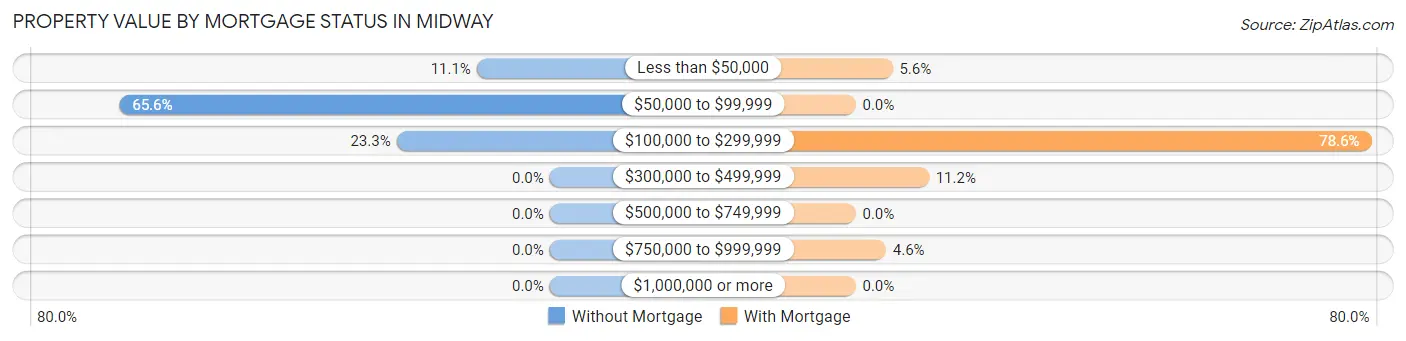
| Property Value | Without Mortgage | With Mortgage |
| Less than $50,000 | 10 (11.1%) | 50 (5.6%) |
| $50,000 to $99,999 | 59 (65.6%) | 0 (0.0%) |
| $100,000 to $299,999 | 21 (23.3%) | 698 (78.6%) |
| $300,000 to $499,999 | 0 (0.0%) | 99 (11.2%) |
| $500,000 to $749,999 | 0 (0.0%) | 0 (0.0%) |
| $750,000 to $999,999 | 0 (0.0%) | 41 (4.6%) |
| $1,000,000 or more | 0 (0.0%) | 0 (0.0%) |
| Total | 90 (100.0%) | 888 (100.0%) |
Household Income by Mortgage Status in Midway
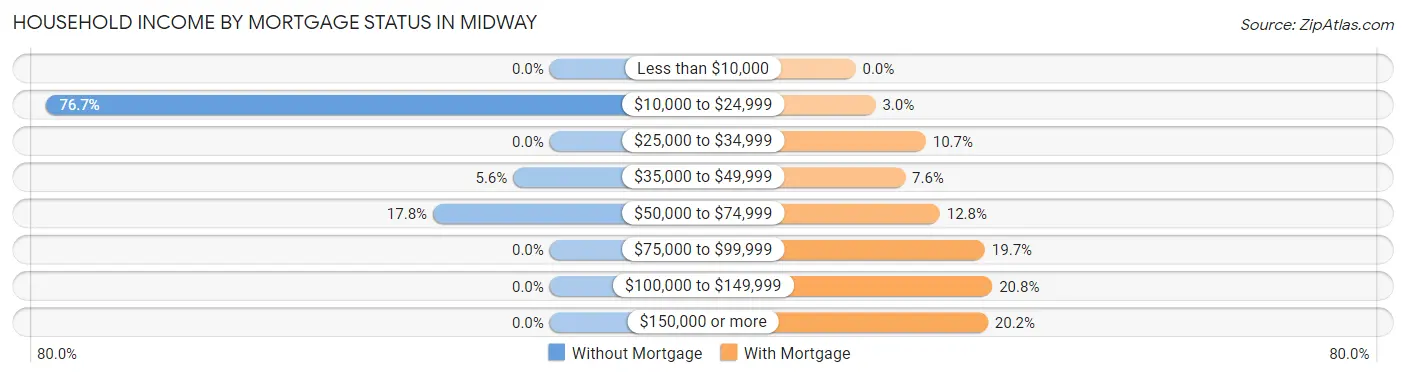
| Household Income | Without Mortgage | With Mortgage |
| Less than $10,000 | 0 (0.0%) | 0 (0.0%) |
| $10,000 to $24,999 | 69 (76.7%) | 27 (3.0%) |
| $25,000 to $34,999 | 0 (0.0%) | 95 (10.7%) |
| $35,000 to $49,999 | 5 (5.6%) | 67 (7.5%) |
| $50,000 to $74,999 | 16 (17.8%) | 114 (12.8%) |
| $75,000 to $99,999 | 0 (0.0%) | 175 (19.7%) |
| $100,000 to $149,999 | 0 (0.0%) | 185 (20.8%) |
| $150,000 or more | 0 (0.0%) | 179 (20.2%) |
| Total | 90 (100.0%) | 888 (100.0%) |
Property Value to Household Income Ratio in Midway
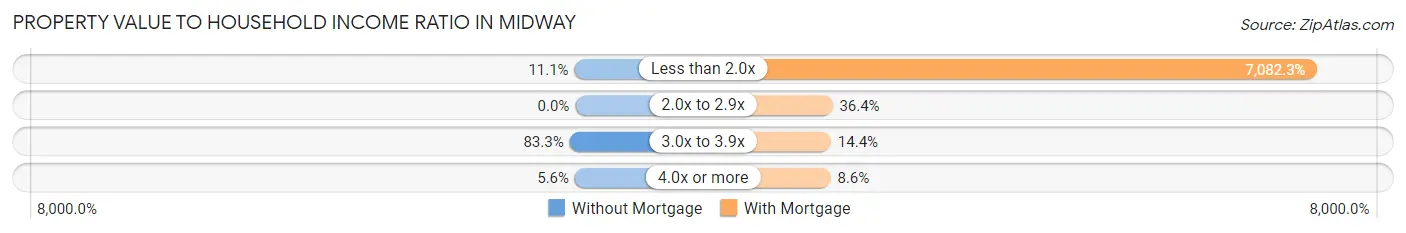
| Value-to-Income Ratio | Without Mortgage | With Mortgage |
| Less than 2.0x | 10 (11.1%) | 62,891 (7,082.3%) |
| 2.0x to 2.9x | 0 (0.0%) | 323 (36.4%) |
| 3.0x to 3.9x | 75 (83.3%) | 128 (14.4%) |
| 4.0x or more | 5 (5.6%) | 76 (8.6%) |
| Total | 90 (100.0%) | 888 (100.0%) |
Real Estate Taxes by Mortgage Status in Midway
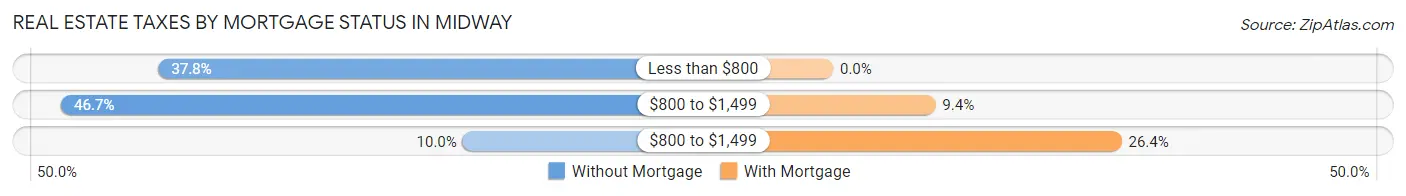
| Property Taxes | Without Mortgage | With Mortgage |
| Less than $800 | 34 (37.8%) | 0 (0.0%) |
| $800 to $1,499 | 42 (46.7%) | 83 (9.3%) |
| $800 to $1,499 | 9 (10.0%) | 234 (26.4%) |
| Total | 90 (100.0%) | 888 (100.0%) |
Health & Disability in Midway
Health Insurance Coverage by Age in Midway
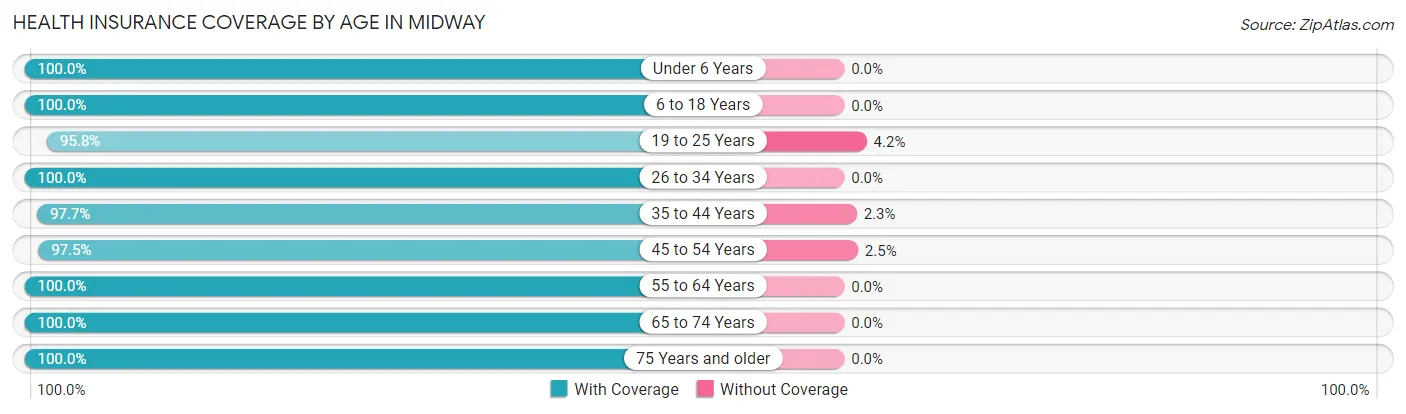
| Age Bracket | With Coverage | Without Coverage |
| Under 6 Years | 425 (100.0%) | 0 (0.0%) |
| 6 to 18 Years | 1,076 (100.0%) | 0 (0.0%) |
| 19 to 25 Years | 161 (95.8%) | 7 (4.2%) |
| 26 to 34 Years | 218 (100.0%) | 0 (0.0%) |
| 35 to 44 Years | 548 (97.7%) | 13 (2.3%) |
| 45 to 54 Years | 499 (97.5%) | 13 (2.5%) |
| 55 to 64 Years | 411 (100.0%) | 0 (0.0%) |
| 65 to 74 Years | 88 (100.0%) | 0 (0.0%) |
| 75 Years and older | 41 (100.0%) | 0 (0.0%) |
| Total | 3,467 (99.1%) | 33 (0.9%) |
Health Insurance Coverage by Citizenship Status in Midway
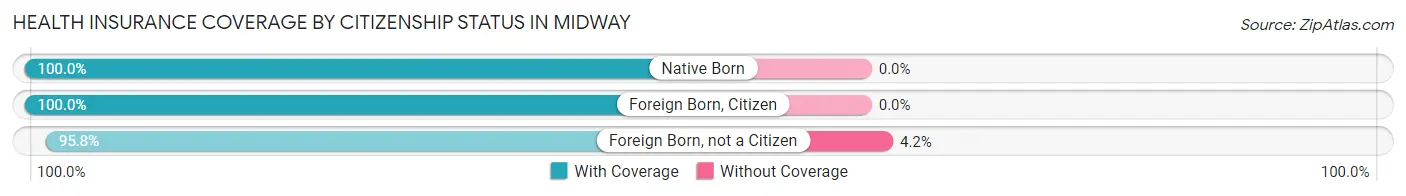
| Citizenship Status | With Coverage | Without Coverage |
| Native Born | 425 (100.0%) | 0 (0.0%) |
| Foreign Born, Citizen | 1,076 (100.0%) | 0 (0.0%) |
| Foreign Born, not a Citizen | 161 (95.8%) | 7 (4.2%) |
Health Insurance Coverage by Household Income in Midway
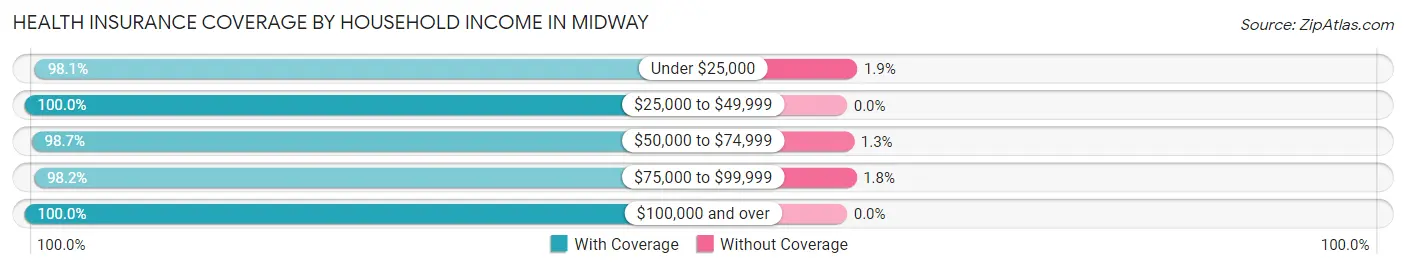
| Household Income | With Coverage | Without Coverage |
| Under $25,000 | 668 (98.1%) | 13 (1.9%) |
| $25,000 to $49,999 | 604 (100.0%) | 0 (0.0%) |
| $50,000 to $74,999 | 599 (98.7%) | 8 (1.3%) |
| $75,000 to $99,999 | 669 (98.2%) | 12 (1.8%) |
| $100,000 and over | 927 (100.0%) | 0 (0.0%) |
Public vs Private Health Insurance Coverage by Age in Midway
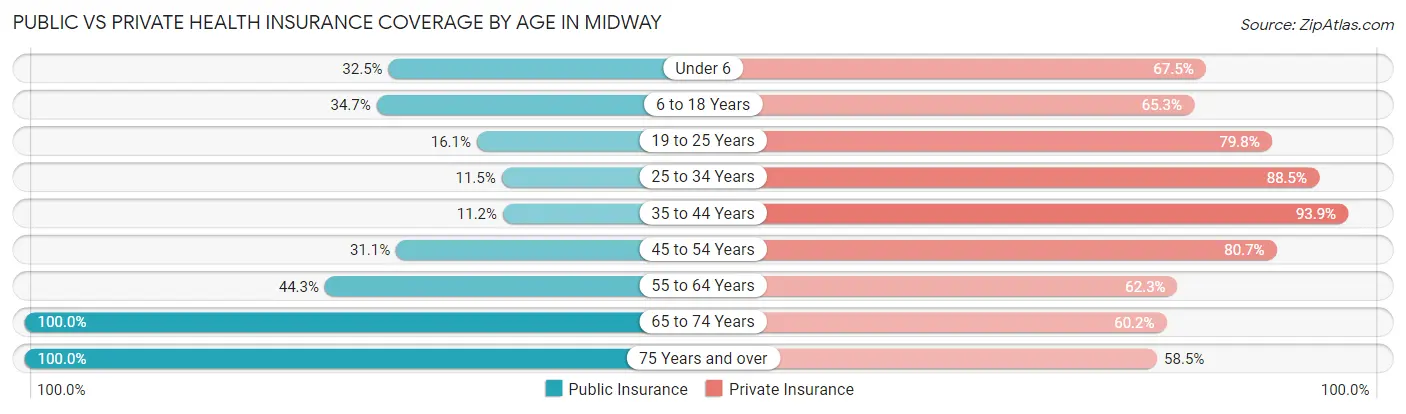
| Age Bracket | Public Insurance | Private Insurance |
| Under 6 | 138 (32.5%) | 287 (67.5%) |
| 6 to 18 Years | 373 (34.7%) | 703 (65.3%) |
| 19 to 25 Years | 27 (16.1%) | 134 (79.8%) |
| 25 to 34 Years | 25 (11.5%) | 193 (88.5%) |
| 35 to 44 Years | 63 (11.2%) | 527 (93.9%) |
| 45 to 54 Years | 159 (31.0%) | 413 (80.7%) |
| 55 to 64 Years | 182 (44.3%) | 256 (62.3%) |
| 65 to 74 Years | 88 (100.0%) | 53 (60.2%) |
| 75 Years and over | 41 (100.0%) | 24 (58.5%) |
| Total | 1,096 (31.3%) | 2,590 (74.0%) |
Disability Status by Sex by Age in Midway
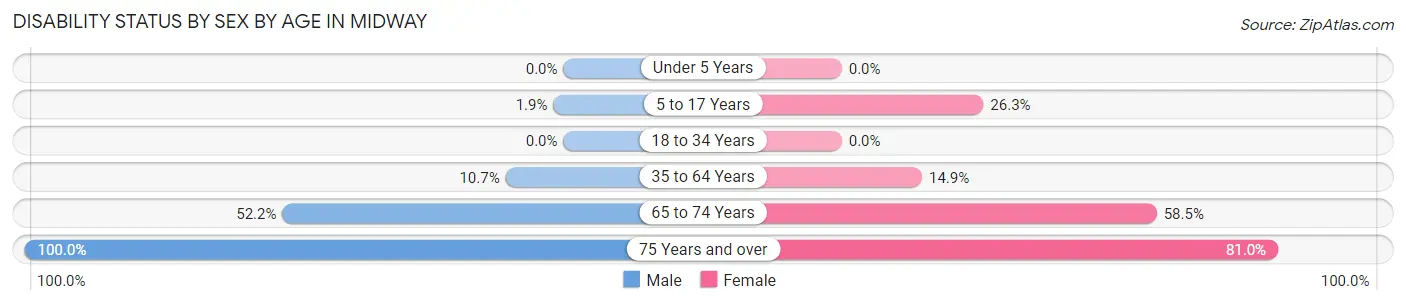
| Age Bracket | Male | Female |
| Under 5 Years | 0 (0.0%) | 0 (0.0%) |
| 5 to 17 Years | 8 (1.9%) | 164 (26.3%) |
| 18 to 34 Years | 0 (0.0%) | 0 (0.0%) |
| 35 to 64 Years | 70 (10.7%) | 124 (14.9%) |
| 65 to 74 Years | 12 (52.2%) | 38 (58.5%) |
| 75 Years and over | 20 (100.0%) | 17 (80.9%) |
Disability Class by Sex by Age in Midway
Disability Class: Hearing Difficulty
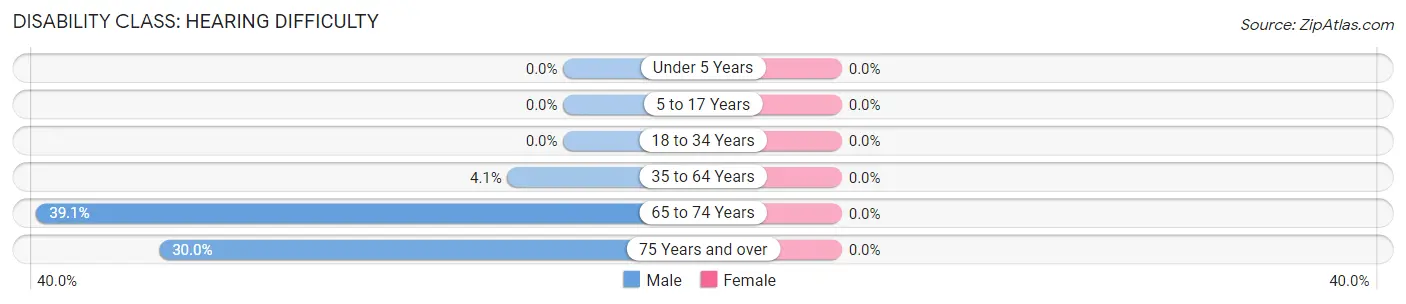
| Age Bracket | Male | Female |
| Under 5 Years | 0 (0.0%) | 0 (0.0%) |
| 5 to 17 Years | 0 (0.0%) | 0 (0.0%) |
| 18 to 34 Years | 0 (0.0%) | 0 (0.0%) |
| 35 to 64 Years | 27 (4.1%) | 0 (0.0%) |
| 65 to 74 Years | 9 (39.1%) | 0 (0.0%) |
| 75 Years and over | 6 (30.0%) | 0 (0.0%) |
Disability Class: Vision Difficulty
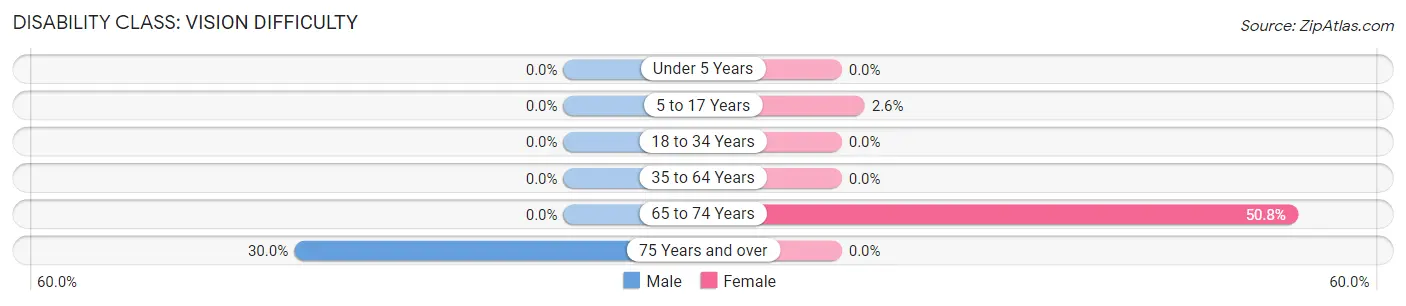
| Age Bracket | Male | Female |
| Under 5 Years | 0 (0.0%) | 0 (0.0%) |
| 5 to 17 Years | 0 (0.0%) | 16 (2.6%) |
| 18 to 34 Years | 0 (0.0%) | 0 (0.0%) |
| 35 to 64 Years | 0 (0.0%) | 0 (0.0%) |
| 65 to 74 Years | 0 (0.0%) | 33 (50.8%) |
| 75 Years and over | 6 (30.0%) | 0 (0.0%) |
Disability Class: Cognitive Difficulty
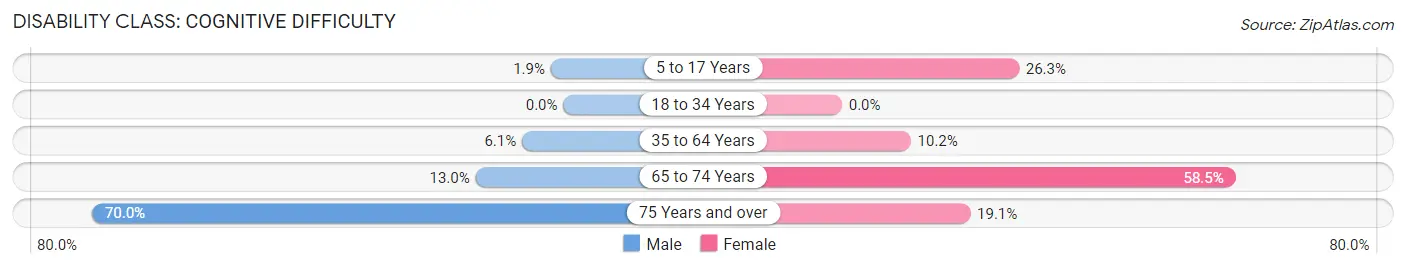
| Age Bracket | Male | Female |
| 5 to 17 Years | 8 (1.9%) | 164 (26.3%) |
| 18 to 34 Years | 0 (0.0%) | 0 (0.0%) |
| 35 to 64 Years | 40 (6.1%) | 85 (10.2%) |
| 65 to 74 Years | 3 (13.0%) | 38 (58.5%) |
| 75 Years and over | 14 (70.0%) | 4 (19.1%) |
Disability Class: Ambulatory Difficulty
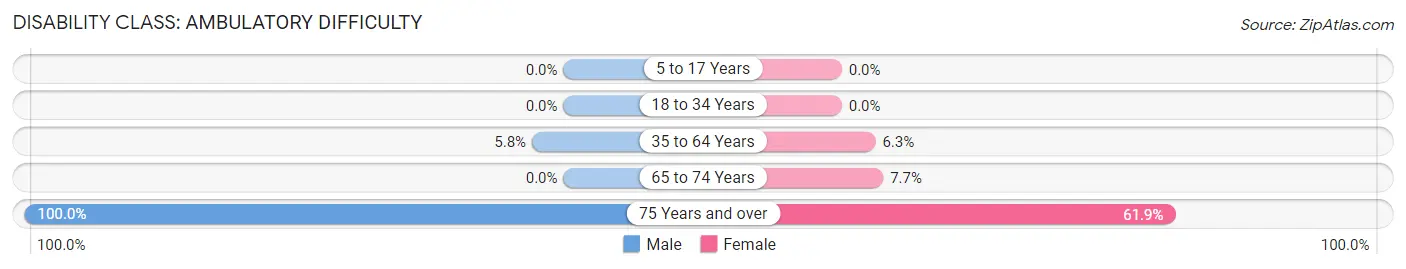
| Age Bracket | Male | Female |
| 5 to 17 Years | 0 (0.0%) | 0 (0.0%) |
| 18 to 34 Years | 0 (0.0%) | 0 (0.0%) |
| 35 to 64 Years | 38 (5.8%) | 52 (6.2%) |
| 65 to 74 Years | 0 (0.0%) | 5 (7.7%) |
| 75 Years and over | 20 (100.0%) | 13 (61.9%) |
Disability Class: Self-Care Difficulty

| Age Bracket | Male | Female |
| 5 to 17 Years | 0 (0.0%) | 0 (0.0%) |
| 18 to 34 Years | 0 (0.0%) | 0 (0.0%) |
| 35 to 64 Years | 21 (3.2%) | 0 (0.0%) |
| 65 to 74 Years | 0 (0.0%) | 5 (7.7%) |
| 75 Years and over | 20 (100.0%) | 4 (19.1%) |
Technology Access in Midway
Computing Device Access in Midway
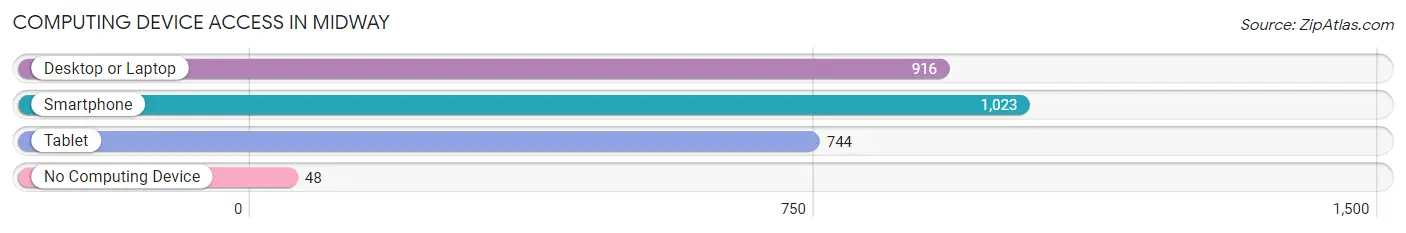
| Device Type | # Households | % Households |
| Desktop or Laptop | 916 | 83.1% |
| Smartphone | 1,023 | 92.7% |
| Tablet | 744 | 67.4% |
| No Computing Device | 48 | 4.3% |
| Total | 1,103 | 100.0% |
Internet Access in Midway
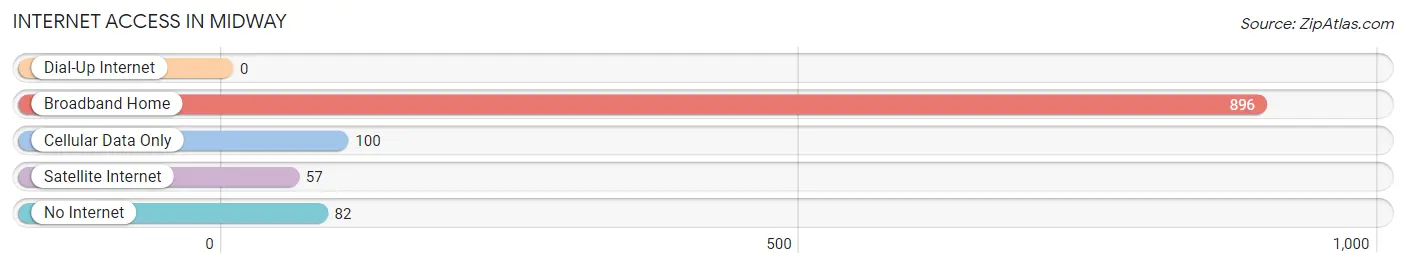
| Internet Type | # Households | % Households |
| Dial-Up Internet | 0 | 0.0% |
| Broadband Home | 896 | 81.2% |
| Cellular Data Only | 100 | 9.1% |
| Satellite Internet | 57 | 5.2% |
| No Internet | 82 | 7.4% |
| Total | 1,103 | 100.0% |
Midway Summary
Midway is a small city located in Gadsden County, Florida. It is situated in the panhandle region of the state, approximately 20 miles west of Tallahassee. The city is home to a population of approximately 2,500 people, and is part of the Tallahassee Metropolitan Statistical Area.
History
Midway was founded in 1825 by settlers from Georgia and South Carolina. The city was named after the Battle of Midway, which took place during the Revolutionary War. The city was originally a farming community, and the main crops grown were cotton, corn, and tobacco. In the late 19th century, the city began to grow as a railroad hub, and the population began to increase.
In the early 20th century, Midway became a popular tourist destination, and many people from the surrounding areas would come to visit the city. The city was also home to a number of businesses, including a sawmill, a grist mill, and a cotton gin.
In the 1950s, the city began to experience a decline in population, as many people moved away to larger cities. However, in the late 1990s, the city began to experience a resurgence, as new businesses and industries began to move into the area.
Geography
Midway is located in the panhandle region of Florida, approximately 20 miles west of Tallahassee. The city is situated on the banks of the Ochlockonee River, and is surrounded by a number of small towns and villages. The city is located in a rural area, and is surrounded by forests and farmland.
The climate in Midway is humid subtropical, with hot summers and mild winters. The average temperature in the summer is around 90 degrees Fahrenheit, and the average temperature in the winter is around 50 degrees Fahrenheit.
Economy
The economy of Midway is largely based on agriculture and tourism. The city is home to a number of farms, which produce a variety of crops, including cotton, corn, and tobacco. The city is also home to a number of tourist attractions, including the Ochlockonee River State Park and the Midway Historic District.
In addition to agriculture and tourism, Midway is also home to a number of businesses, including a sawmill, a grist mill, and a cotton gin. The city is also home to a number of manufacturing companies, which produce a variety of products, including furniture, clothing, and electronics.
Demographics
As of the 2010 census, the population of Midway was 2,500. The racial makeup of the city was 79.2% White, 16.2% African American, 0.8% Native American, 0.4% Asian, 0.1% Pacific Islander, and 3.3% from other races. The median household income in Midway was $31,250, and the median family income was $37,500. The per capita income in Midway was $15,845.
Conclusion
Midway is a small city located in Gadsden County, Florida. It is situated in the panhandle region of the state, approximately 20 miles west of Tallahassee. The city is home to a population of approximately 2,500 people, and is part of the Tallahassee Metropolitan Statistical Area. The economy of Midway is largely based on agriculture and tourism, and the city is home to a number of businesses, including a sawmill, a grist mill, and a cotton gin. The racial makeup of the city is 79.2% White, 16.2% African American, 0.8% Native American, 0.4% Asian, 0.1% Pacific Islander, and 3.3% from other races. The median household income in Midway was $31,250, and the median family income was $37,500. The per capita income in Midway was $15,845.
Common Questions
What is the Total Population of Midway?
Total Population of Midway is 3,500.
What is the Total Male Population of Midway?
Total Male Population of Midway is 1,428.
What is the Total Female Population of Midway?
Total Female Population of Midway is 2,072.
What is the Ratio of Males per 100 Females in Midway?
There are 68.92 Males per 100 Females in Midway.
What is the Ratio of Females per 100 Males in Midway?
There are 145.10 Females per 100 Males in Midway.
What is the Median Population Age in Midway?
Median Population Age in Midway is 31.1 Years.
What is the Average Family Size in Midway
Average Family Size in Midway is 3.7 People.
What is the Average Household Size in Midway
Average Household Size in Midway is 3.2 People.
What is Per Capita Income in Midway?
Per Capita income in Midway is $23,289.
What is the Median Family Income in Midway?
Median Family Income in Midway is $67,679.
What is the Median Household income in Midway?
Median Household Income in Midway is $58,393.
What is Income or Wage Gap in Midway?
Income or Wage Gap in Midway is 29.3%.
Women in Midway earn 70.7 cents for every dollar earned by a man.
What is Inequality or Gini Index in Midway?
Inequality or Gini Index in Midway is 0.43.
How Large is the Labor Force in Midway?
There are 1,612 People in the Labor Forcein in Midway.
What is the Percentage of People in the Labor Force in Midway?
69.3% of People are in the Labor Force in Midway.
What is the Unemployment Rate in Midway?
Unemployment Rate in Midway is 4.5%.