Zip Codes with the Highest Percentage of Population Employed in Professional & Scientific Services in Delaware
RELATED REPORTS & OPTIONS
Professional & Scientific Services
Delaware
Compare Zip Codes
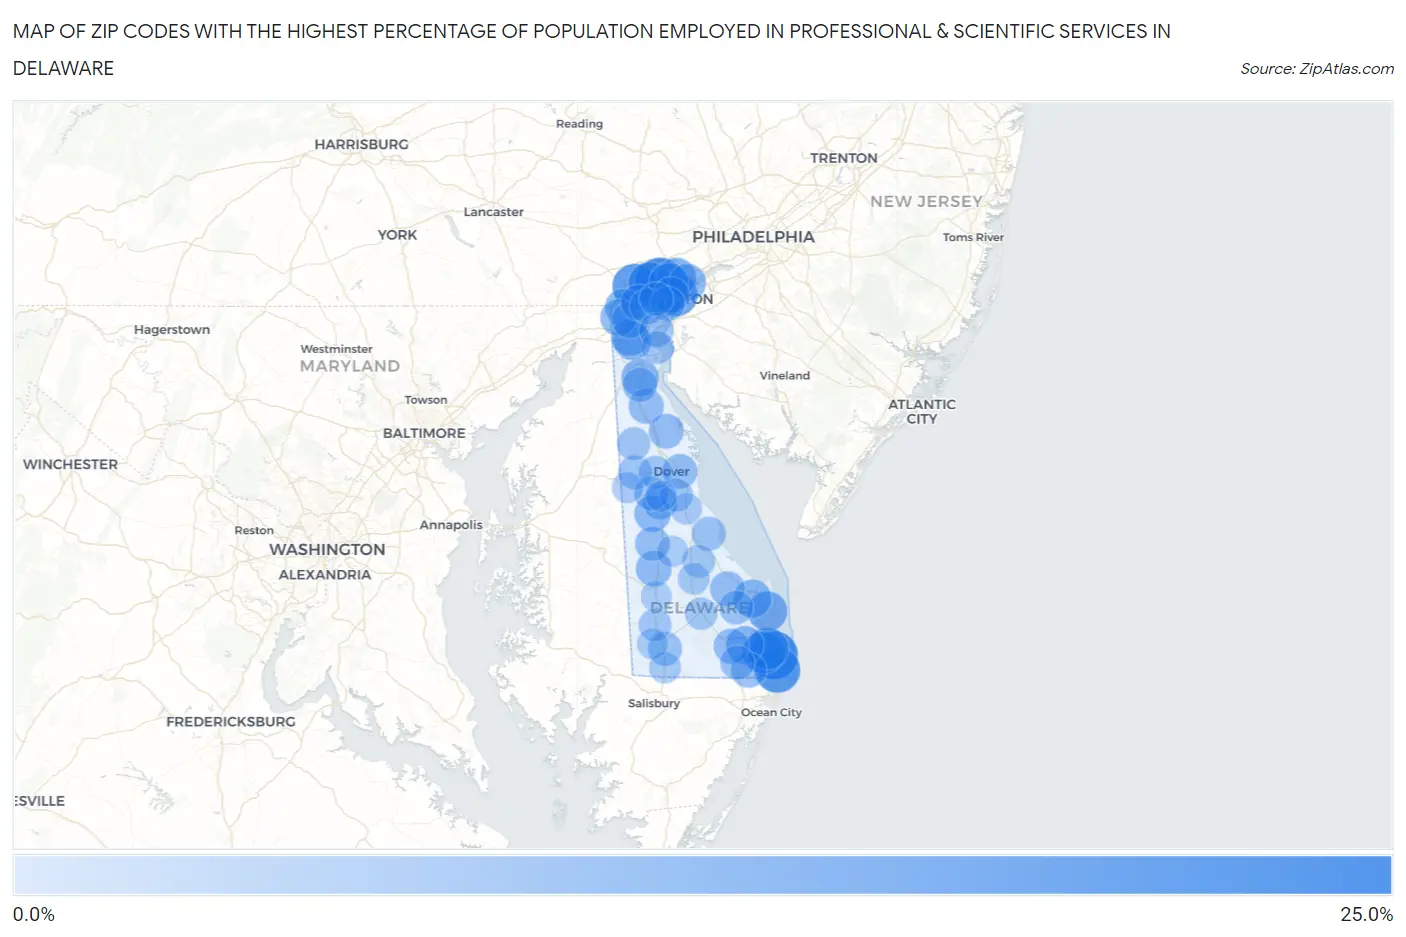
Map of Zip Codes with the Highest Percentage of Population Employed in Professional & Scientific Services in Delaware
0.0%
25.0%
Zip Codes with the Highest Percentage of Population Employed in Professional & Scientific Services in Delaware
| Zip Code | % Employed | vs State | vs National | |
| 1. | 19732 | 21.5% | 6.6%(+14.9)#1 | 7.8%(+13.6)#723 |
| 2. | 19930 | 20.1% | 6.6%(+13.6)#2 | 7.8%(+12.3)#870 |
| 3. | 19806 | 17.2% | 6.6%(+10.6)#3 | 7.8%(+9.39)#1,311 |
| 4. | 19944 | 17.1% | 6.6%(+10.5)#4 | 7.8%(+9.23)#1,340 |
| 5. | 19707 | 16.5% | 6.6%(+9.86)#5 | 7.8%(+8.60)#1,500 |
| 6. | 19807 | 14.8% | 6.6%(+8.20)#6 | 7.8%(+6.94)#1,982 |
| 7. | 19809 | 13.7% | 6.6%(+7.09)#7 | 7.8%(+5.83)#2,399 |
| 8. | 19967 | 13.4% | 6.6%(+6.78)#8 | 7.8%(+5.53)#2,549 |
| 9. | 19970 | 13.0% | 6.6%(+6.42)#9 | 7.8%(+5.17)#2,709 |
| 10. | 19971 | 10.5% | 6.6%(+3.91)#10 | 7.8%(+2.66)#4,191 |
| 11. | 19810 | 10.1% | 6.6%(+3.54)#11 | 7.8%(+2.29)#4,472 |
| 12. | 19803 | 10.0% | 6.6%(+3.38)#12 | 7.8%(+2.13)#4,596 |
| 13. | 19958 | 8.8% | 6.6%(+2.20)#13 | 7.8%(+0.950)#5,704 |
| 14. | 19939 | 8.2% | 6.6%(+1.64)#14 | 7.8%(+0.387)#6,367 |
| 15. | 19701 | 8.2% | 6.6%(+1.59)#15 | 7.8%(+0.337)#6,428 |
| 16. | 19711 | 7.9% | 6.6%(+1.32)#16 | 7.8%(+0.064)#6,778 |
| 17. | 19709 | 7.8% | 6.6%(+1.23)#17 | 7.8%(-0.025)#6,895 |
| 18. | 19702 | 7.8% | 6.6%(+1.19)#18 | 7.8%(-0.057)#6,940 |
| 19. | 19703 | 7.6% | 6.6%(+1.05)#19 | 7.8%(-0.198)#7,135 |
| 20. | 19717 | 7.3% | 6.6%(+0.703)#20 | 7.8%(-0.549)#7,666 |
| 21. | 19713 | 6.8% | 6.6%(+0.190)#21 | 7.8%(-1.06)#8,511 |
| 22. | 19943 | 6.7% | 6.6%(+0.108)#22 | 7.8%(-1.14)#8,651 |
| 23. | 19802 | 6.6% | 6.6%(+0.015)#23 | 7.8%(-1.24)#8,816 |
| 24. | 19808 | 6.5% | 6.6%(-0.054)#24 | 7.8%(-1.31)#8,954 |
| 25. | 19950 | 6.1% | 6.6%(-0.460)#25 | 7.8%(-1.71)#9,716 |
| 26. | 19975 | 5.8% | 6.6%(-0.752)#26 | 7.8%(-2.00)#10,276 |
| 27. | 19804 | 5.8% | 6.6%(-0.829)#27 | 7.8%(-2.08)#10,423 |
| 28. | 19734 | 5.4% | 6.6%(-1.16)#28 | 7.8%(-2.41)#11,234 |
| 29. | 19966 | 5.4% | 6.6%(-1.17)#29 | 7.8%(-2.42)#11,252 |
| 30. | 19968 | 5.2% | 6.6%(-1.44)#30 | 7.8%(-2.69)#11,927 |
| 31. | 19977 | 5.1% | 6.6%(-1.46)#31 | 7.8%(-2.72)#11,995 |
| 32. | 19952 | 4.9% | 6.6%(-1.69)#32 | 7.8%(-2.94)#12,551 |
| 33. | 19901 | 4.9% | 6.6%(-1.74)#33 | 7.8%(-2.99)#12,681 |
| 34. | 19801 | 4.8% | 6.6%(-1.78)#34 | 7.8%(-3.03)#12,773 |
| 35. | 19979 | 4.8% | 6.6%(-1.83)#35 | 7.8%(-3.09)#12,939 |
| 36. | 19720 | 4.7% | 6.6%(-1.91)#36 | 7.8%(-3.16)#13,143 |
| 37. | 19730 | 4.6% | 6.6%(-2.02)#37 | 7.8%(-3.27)#13,416 |
| 38. | 19945 | 4.5% | 6.6%(-2.13)#38 | 7.8%(-3.39)#13,788 |
| 39. | 19956 | 4.3% | 6.6%(-2.34)#39 | 7.8%(-3.59)#14,350 |
| 40. | 19963 | 4.2% | 6.6%(-2.38)#40 | 7.8%(-3.63)#14,479 |
| 41. | 19805 | 4.0% | 6.6%(-2.55)#41 | 7.8%(-3.80)#14,972 |
| 42. | 19934 | 4.0% | 6.6%(-2.63)#42 | 7.8%(-3.88)#15,203 |
| 43. | 19951 | 3.9% | 6.6%(-2.71)#43 | 7.8%(-3.96)#15,461 |
| 44. | 19953 | 3.8% | 6.6%(-2.79)#44 | 7.8%(-4.05)#15,718 |
| 45. | 19962 | 3.4% | 6.6%(-3.24)#45 | 7.8%(-4.49)#17,199 |
| 46. | 19938 | 3.3% | 6.6%(-3.29)#46 | 7.8%(-4.54)#17,383 |
| 47. | 19904 | 3.3% | 6.6%(-3.34)#47 | 7.8%(-4.59)#17,545 |
| 48. | 19706 | 3.0% | 6.6%(-3.59)#48 | 7.8%(-4.84)#18,442 |
| 49. | 19973 | 2.9% | 6.6%(-3.69)#49 | 7.8%(-4.94)#18,768 |
| 50. | 19960 | 2.9% | 6.6%(-3.69)#50 | 7.8%(-4.94)#18,775 |
| 51. | 19947 | 2.4% | 6.6%(-4.16)#51 | 7.8%(-5.41)#20,418 |
| 52. | 19940 | 1.7% | 6.6%(-4.87)#52 | 7.8%(-6.12)#22,826 |
| 53. | 19941 | 1.7% | 6.6%(-4.93)#53 | 7.8%(-6.18)#22,994 |
| 54. | 19946 | 1.4% | 6.6%(-5.23)#54 | 7.8%(-6.49)#23,983 |
| 55. | 19964 | 1.2% | 6.6%(-5.35)#55 | 7.8%(-6.60)#24,356 |
| 56. | 19954 | 1.2% | 6.6%(-5.37)#56 | 7.8%(-6.62)#24,405 |
| 57. | 19980 | 1.0% | 6.6%(-5.55)#57 | 7.8%(-6.81)#24,920 |
| 58. | 19931 | 0.84% | 6.6%(-5.76)#58 | 7.8%(-7.01)#25,462 |
| 59. | 19933 | 0.76% | 6.6%(-5.83)#59 | 7.8%(-7.08)#25,622 |
1
Common Questions
What are the Top 10 Zip Codes with the Highest Percentage of Population Employed in Professional & Scientific Services in Delaware?
Top 10 Zip Codes with the Highest Percentage of Population Employed in Professional & Scientific Services in Delaware are:
What zip code has the Highest Percentage of Population Employed in Professional & Scientific Services in Delaware?
19732 has the Highest Percentage of Population Employed in Professional & Scientific Services in Delaware with 21.5%.
What is the Percentage of Population Employed in Professional & Scientific Services in the State of Delaware?
Percentage of Population Employed in Professional & Scientific Services in Delaware is 6.6%.
What is the Percentage of Population Employed in Professional & Scientific Services in the United States?
Percentage of Population Employed in Professional & Scientific Services in the United States is 7.8%.