Sierra City, CA
Sierra City Map
Sierra City Overview
221
TOTAL POPULATION
117
MALE POPULATION
104
FEMALE POPULATION
112.50
MALES / 100 FEMALES
88.89
FEMALES / 100 MALES
69.7
MEDIAN AGE
1.9
AVG FAMILY SIZE
1.6
AVG HOUSEHOLD SIZE
$55,934
PER CAPITA INCOME
$88,534
AVG FAMILY INCOME
$87,759
AVG HOUSEHOLD INCOME
0.29
INEQUALITY / GINI INDEX
95
LABOR FORCE [ PEOPLE ]
43.0%
PERCENT IN LABOR FORCE
Sierra City Zip Codes
Sierra City Area Codes
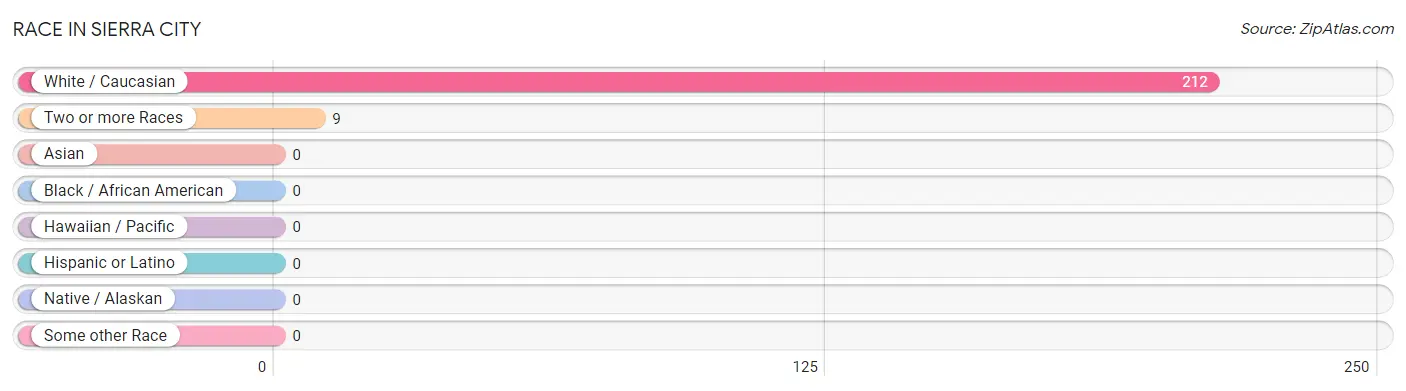
Race in Sierra City
The most populous races in Sierra City are White / Caucasian (212 | 95.9%), and Two or more Races (9 | 4.1%).
| Race | # Population | % Population |
| Asian | 0 | 0.0% |
| Black / African American | 0 | 0.0% |
| Hawaiian / Pacific | 0 | 0.0% |
| Hispanic or Latino | 0 | 0.0% |
| Native / Alaskan | 0 | 0.0% |
| White / Caucasian | 212 | 95.9% |
| Two or more Races | 9 | 4.1% |
| Some other Race | 0 | 0.0% |
| Total | 221 | 100.0% |
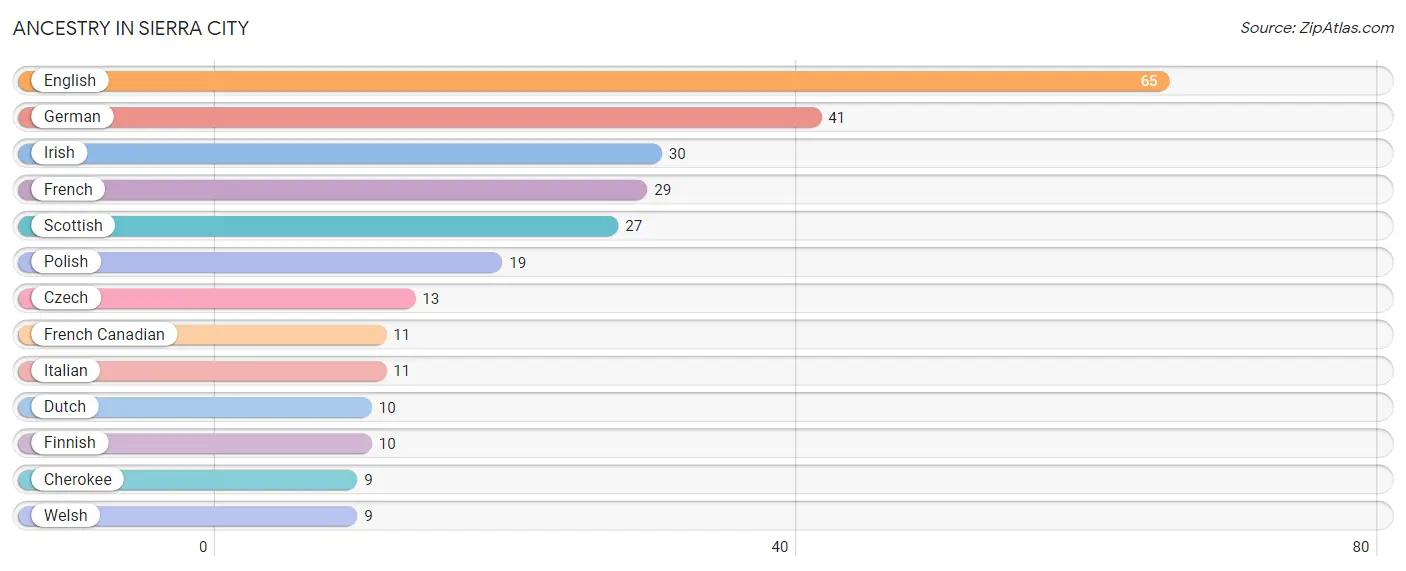
Ancestry in Sierra City
The most populous ancestries reported in Sierra City are English (65 | 29.4%), German (41 | 18.5%), Irish (30 | 13.6%), French (29 | 13.1%), and Scottish (27 | 12.2%), together accounting for 86.9% of all Sierra City residents.
| Ancestry | # Population | % Population |
| Cherokee | 9 | 4.1% |
| Czech | 13 | 5.9% |
| Dutch | 10 | 4.5% |
| English | 65 | 29.4% |
| Finnish | 10 | 4.5% |
| French | 29 | 13.1% |
| French Canadian | 11 | 5.0% |
| German | 41 | 18.5% |
| Irish | 30 | 13.6% |
| Italian | 11 | 5.0% |
| Polish | 19 | 8.6% |
| Scottish | 27 | 12.2% |
| Welsh | 9 | 4.1% | View All 13 Rows |
Immigrants in Sierra City

| Immigration Origin | # Population | % Population | View All 0 Rows |
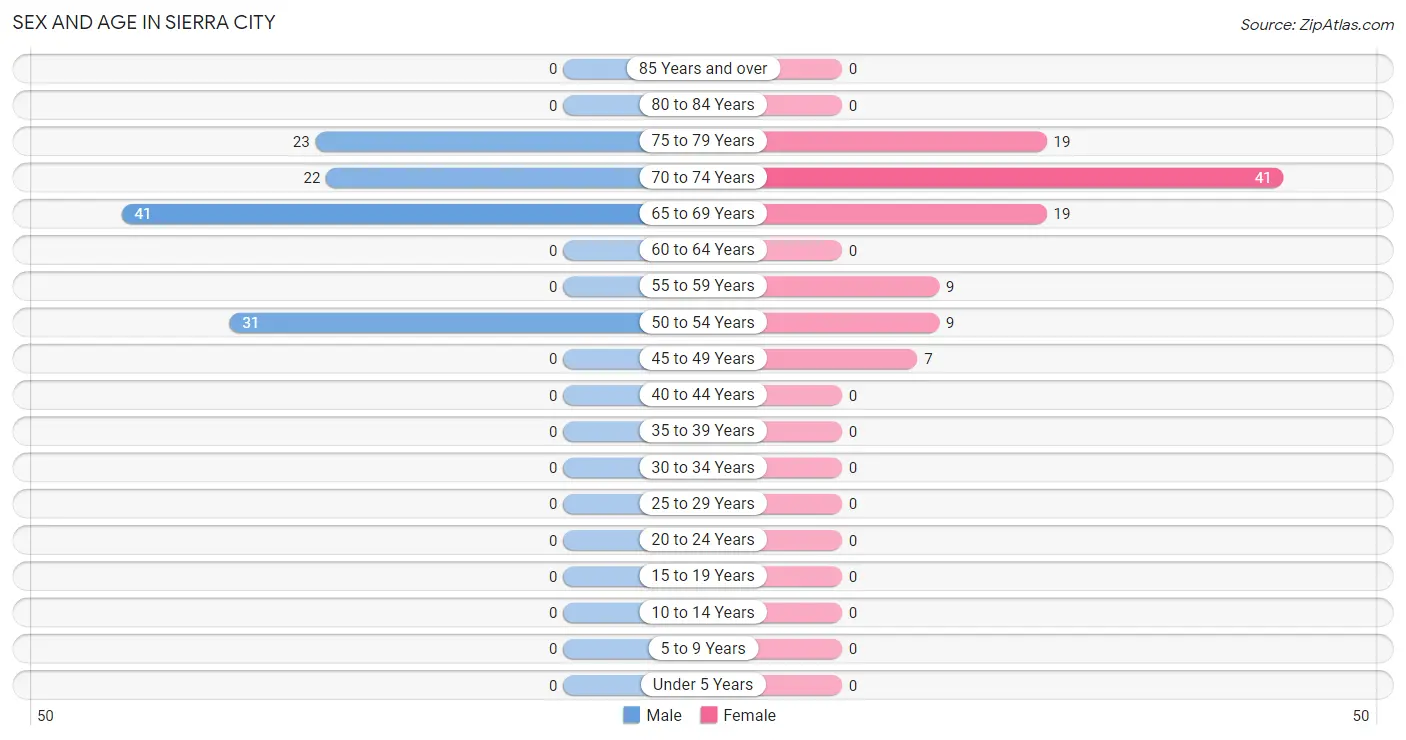
Sex and Age in Sierra City
Sex and Age in Sierra City
The most populous age groups in Sierra City are 65 to 69 Years (41 | 35.0%) for men and 70 to 74 Years (41 | 39.4%) for women.
| Age Bracket | Male | Female |
| Under 5 Years | 0 (0.0%) | 0 (0.0%) |
| 5 to 9 Years | 0 (0.0%) | 0 (0.0%) |
| 10 to 14 Years | 0 (0.0%) | 0 (0.0%) |
| 15 to 19 Years | 0 (0.0%) | 0 (0.0%) |
| 20 to 24 Years | 0 (0.0%) | 0 (0.0%) |
| 25 to 29 Years | 0 (0.0%) | 0 (0.0%) |
| 30 to 34 Years | 0 (0.0%) | 0 (0.0%) |
| 35 to 39 Years | 0 (0.0%) | 0 (0.0%) |
| 40 to 44 Years | 0 (0.0%) | 0 (0.0%) |
| 45 to 49 Years | 0 (0.0%) | 7 (6.7%) |
| 50 to 54 Years | 31 (26.5%) | 9 (8.6%) |
| 55 to 59 Years | 0 (0.0%) | 9 (8.6%) |
| 60 to 64 Years | 0 (0.0%) | 0 (0.0%) |
| 65 to 69 Years | 41 (35.0%) | 19 (18.3%) |
| 70 to 74 Years | 22 (18.8%) | 41 (39.4%) |
| 75 to 79 Years | 23 (19.7%) | 19 (18.3%) |
| 80 to 84 Years | 0 (0.0%) | 0 (0.0%) |
| 85 Years and over | 0 (0.0%) | 0 (0.0%) |
| Total | 117 (100.0%) | 104 (100.0%) |
Families and Households in Sierra City
Median Family Size in Sierra City
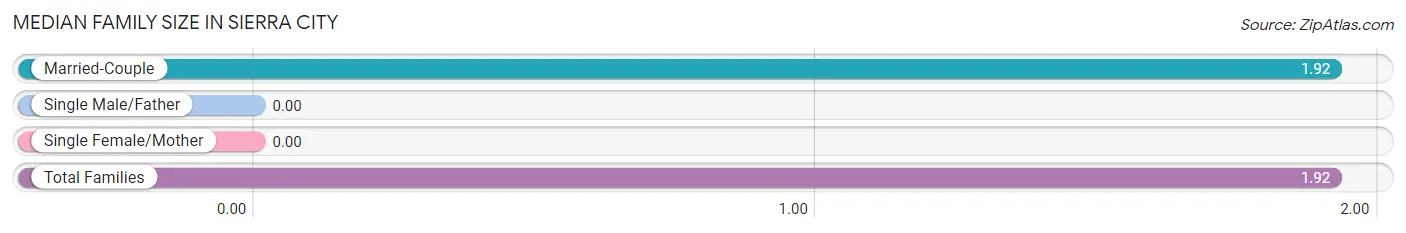
| Family Type | # Families | Family Size |
| Married-Couple | 92 (100.0%) | 1.92 |
| Single Male/Father | 0 (0.0%) | - |
| Single Female/Mother | 0 (0.0%) | - |
| Total Families | 92 (100.0%) | 1.92 |
Median Household Size in Sierra City
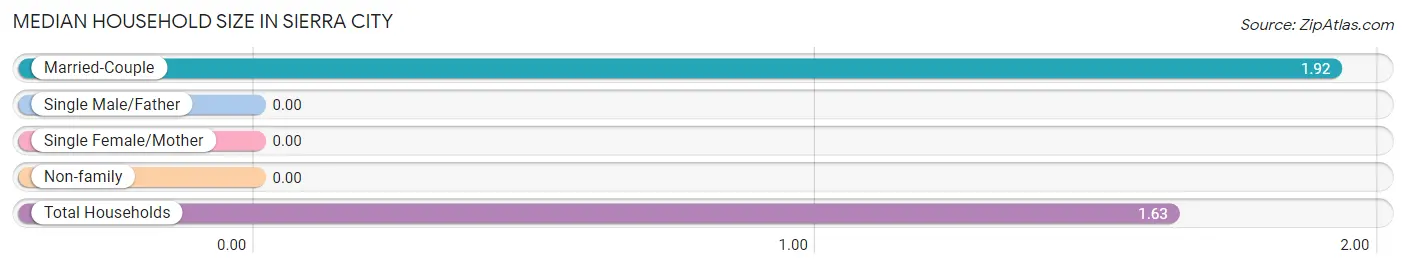
| Household Type | # Households | Household Size |
| Married-Couple | 92 (67.6%) | 1.92 |
| Single Male/Father | 0 (0.0%) | - |
| Single Female/Mother | 0 (0.0%) | - |
| Non-family | 44 (32.4%) | - |
| Total Households | 136 (100.0%) | 1.63 |
Household Size by Marriage Status in Sierra City
Out of a total of 136 households in Sierra City, 92 (67.6%) are family households, while 44 (32.4%) are nonfamily households. The most numerous type of family households are 2-person households, comprising 92, and the most common type of nonfamily households are 1-person households, comprising 44.
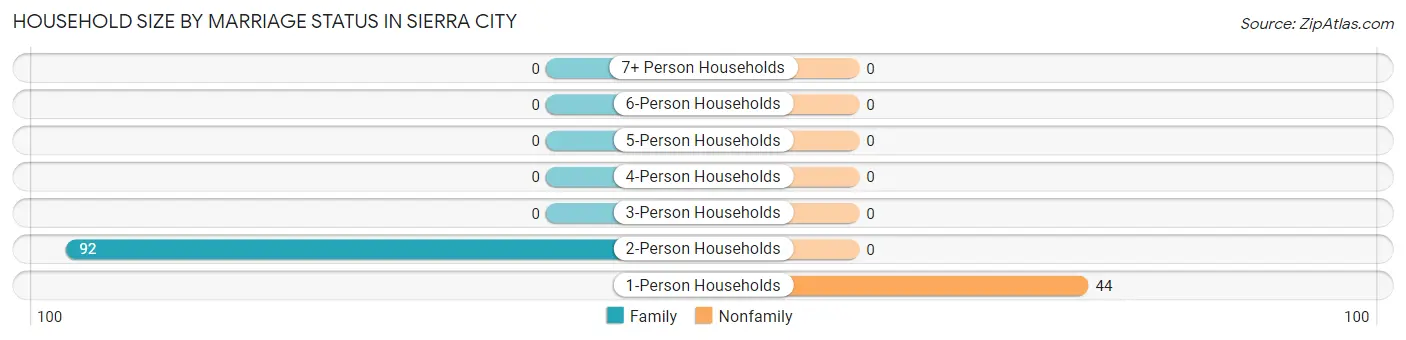
| Household Size | Family Households | Nonfamily Households |
| 1-Person Households | - | 44 (32.4%) |
| 2-Person Households | 92 (67.6%) | 0 (0.0%) |
| 3-Person Households | 0 (0.0%) | 0 (0.0%) |
| 4-Person Households | 0 (0.0%) | 0 (0.0%) |
| 5-Person Households | 0 (0.0%) | 0 (0.0%) |
| 6-Person Households | 0 (0.0%) | 0 (0.0%) |
| 7+ Person Households | 0 (0.0%) | 0 (0.0%) |
| Total | 92 (67.6%) | 44 (32.4%) |
Female Fertility in Sierra City
Fertility by Age in Sierra City
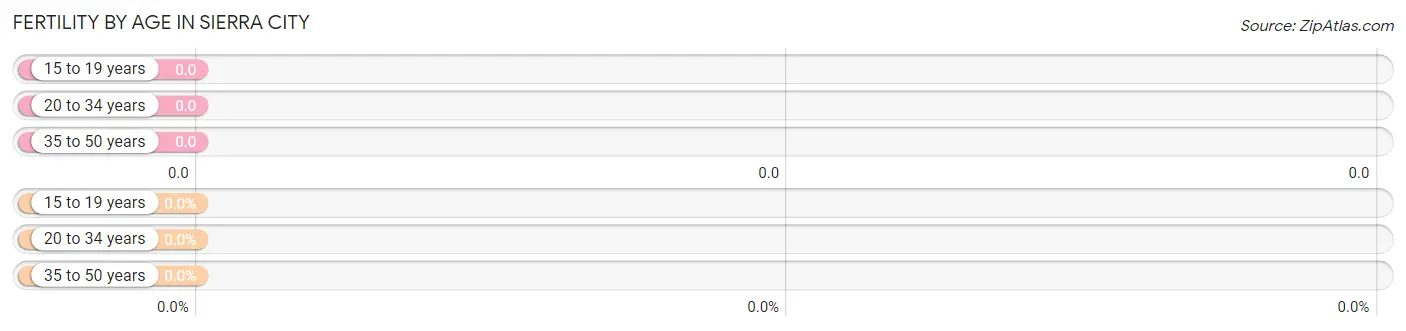
| Age Bracket | Women with Births | Births / 1,000 Women |
| 15 to 19 years | 0 (0.0%) | 0.0 |
| 20 to 34 years | 0 (0.0%) | 0.0 |
| 35 to 50 years | 0 (0.0%) | 0.0 |
| Total | 0 (0.0%) | 0.0 |
Fertility by Age by Marriage Status in Sierra City
| Age Bracket | Married | Unmarried |
| 15 to 19 years | 0 (0.0%) | 0 (0.0%) |
| 20 to 34 years | 0 (0.0%) | 0 (0.0%) |
| 35 to 50 years | 0 (0.0%) | 0 (0.0%) |
| Total | 0 (0.0%) | 0 (0.0%) |
Fertility by Education in Sierra City
| Educational Attainment | Women with Births | Births / 1,000 Women |
| Less than High School | 0 (0.0%) | 0.0 |
| High School Diploma | 0 (0.0%) | 0.0 |
| College or Associate's Degree | 0 (0.0%) | 0.0 |
| Bachelor's Degree | 0 (0.0%) | 0.0 |
| Graduate Degree | 0 (0.0%) | 0.0 |
| Total | 0 (0.0%) | 0.0 |
Fertility by Education by Marriage Status in Sierra City
| Educational Attainment | Married | Unmarried |
| Less than High School | 0 (0.0%) | 0 (0.0%) |
| High School Diploma | 0 (0.0%) | 0 (0.0%) |
| College or Associate's Degree | 0 (0.0%) | 0 (0.0%) |
| Bachelor's Degree | 0 (0.0%) | 0 (0.0%) |
| Graduate Degree | 0 (0.0%) | 0 (0.0%) |
| Total | 0 (0.0%) | 0 (0.0%) |
Income in Sierra City
Income Overview in Sierra City
Per Capita Income in Sierra City is $55,934, while median incomes of families and households are $88,534 and $87,759 respectively.
| Characteristic | Number | Measure |
| Per Capita Income | 221 | $55,934 |
| Median Family Income | 92 | $88,534 |
| Mean Family Income | 92 | $105,977 |
| Median Household Income | 136 | $87,759 |
| Mean Household Income | 136 | $91,325 |
| Income Deficit | 92 | $0 |
| Wage / Income Gap (%) | 221 | 0.00% |
| Wage / Income Gap ($) | 221 | 100.00¢ per $1 |
| Gini / Inequality Index | 221 | 0.29 |
Earnings by Sex in Sierra City
| Sex | Number | Average Earnings |
| Male | 60 (63.2%) | $0 |
| Female | 35 (36.8%) | $0 |
| Total | 95 (100.0%) | $0 |
Earnings by Sex by Income Bracket in Sierra City
The most common earnings brackets in Sierra City are $40,000 to $44,999 for men (31 | 51.7%) and $30,000 to $34,999 for women (10 | 28.6%).
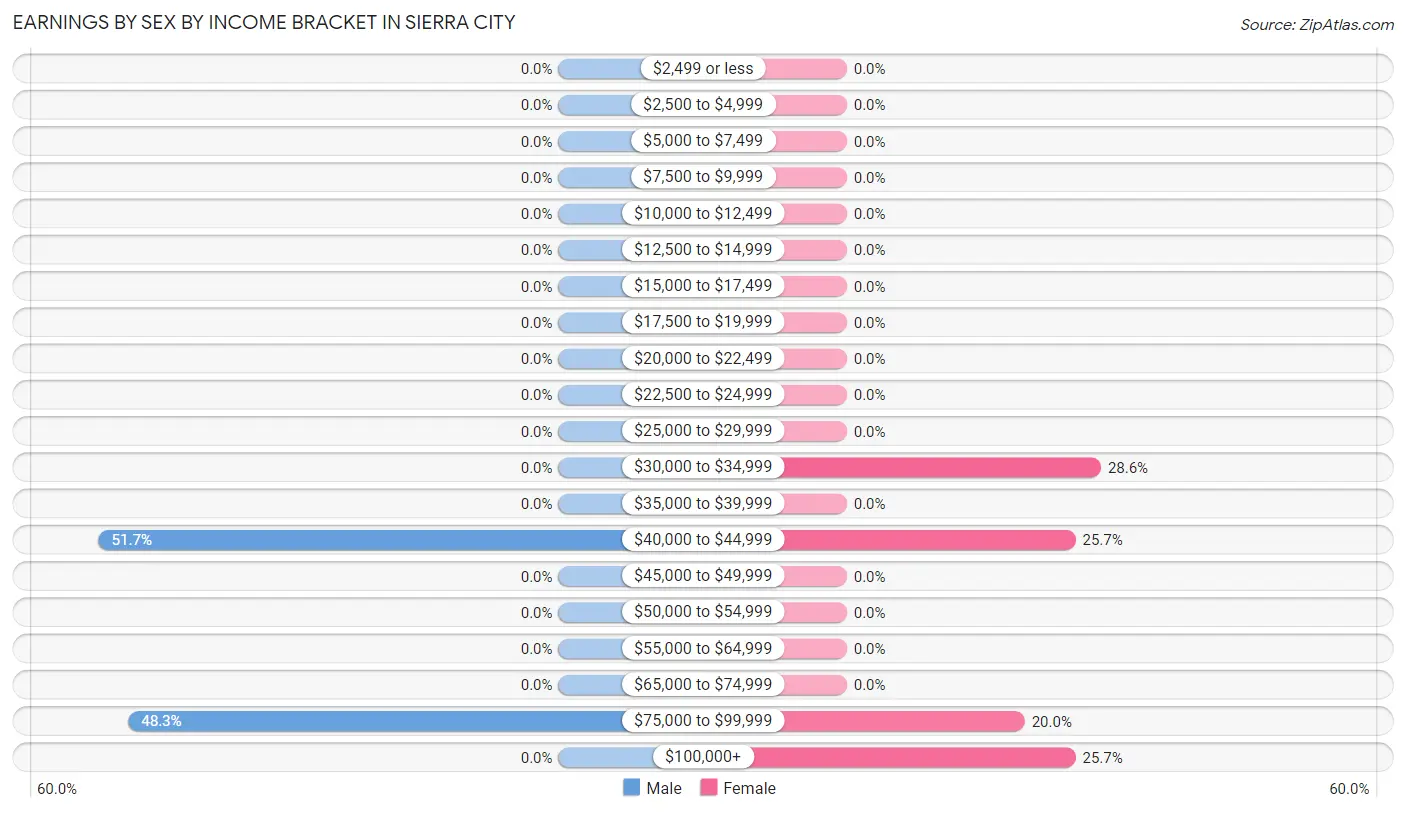
| Income | Male | Female |
| $2,499 or less | 0 (0.0%) | 0 (0.0%) |
| $2,500 to $4,999 | 0 (0.0%) | 0 (0.0%) |
| $5,000 to $7,499 | 0 (0.0%) | 0 (0.0%) |
| $7,500 to $9,999 | 0 (0.0%) | 0 (0.0%) |
| $10,000 to $12,499 | 0 (0.0%) | 0 (0.0%) |
| $12,500 to $14,999 | 0 (0.0%) | 0 (0.0%) |
| $15,000 to $17,499 | 0 (0.0%) | 0 (0.0%) |
| $17,500 to $19,999 | 0 (0.0%) | 0 (0.0%) |
| $20,000 to $22,499 | 0 (0.0%) | 0 (0.0%) |
| $22,500 to $24,999 | 0 (0.0%) | 0 (0.0%) |
| $25,000 to $29,999 | 0 (0.0%) | 0 (0.0%) |
| $30,000 to $34,999 | 0 (0.0%) | 10 (28.6%) |
| $35,000 to $39,999 | 0 (0.0%) | 0 (0.0%) |
| $40,000 to $44,999 | 31 (51.7%) | 9 (25.7%) |
| $45,000 to $49,999 | 0 (0.0%) | 0 (0.0%) |
| $50,000 to $54,999 | 0 (0.0%) | 0 (0.0%) |
| $55,000 to $64,999 | 0 (0.0%) | 0 (0.0%) |
| $65,000 to $74,999 | 0 (0.0%) | 0 (0.0%) |
| $75,000 to $99,999 | 29 (48.3%) | 7 (20.0%) |
| $100,000+ | 0 (0.0%) | 9 (25.7%) |
| Total | 60 (100.0%) | 35 (100.0%) |
Earnings by Sex by Educational Attainment in Sierra City
| Educational Attainment | Male Income | Female Income |
| Less than High School | - | - |
| High School Diploma | - | - |
| College or Associate's Degree | - | - |
| Bachelor's Degree | - | - |
| Graduate Degree | - | - |
| Total | - | - |
Family Income in Sierra City
Family Income Brackets in Sierra City
According to the Sierra City family income data, there are 29 families falling into the $75,000 to $99,999 income range, which is the most common income bracket and makes up 31.5% of all families.
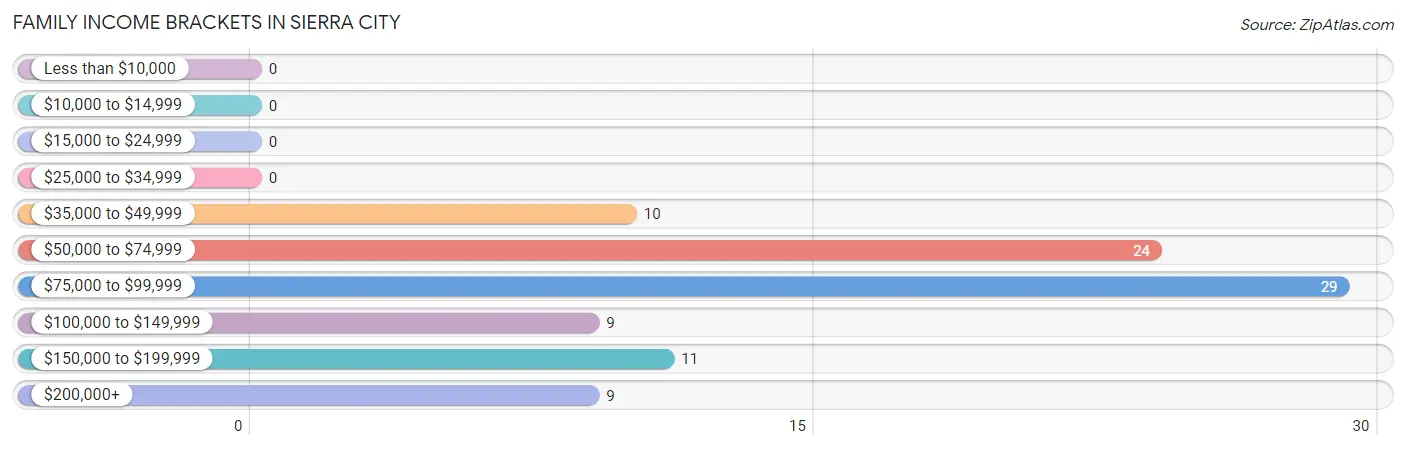
| Income Bracket | # Families | % Families |
| Less than $10,000 | 0 | 0.0% |
| $10,000 to $14,999 | 0 | 0.0% |
| $15,000 to $24,999 | 0 | 0.0% |
| $25,000 to $34,999 | 0 | 0.0% |
| $35,000 to $49,999 | 10 | 10.9% |
| $50,000 to $74,999 | 24 | 26.1% |
| $75,000 to $99,999 | 29 | 31.5% |
| $100,000 to $149,999 | 9 | 9.8% |
| $150,000 to $199,999 | 11 | 12.0% |
| $200,000+ | 9 | 9.8% |
Family Income by Famaliy Size in Sierra City
2-person families (92 | 100.0%) account for the highest median family income in Sierra City with $88,534 per family, while 2-person families (92 | 100.0%) have the highest median income of $44,267 per family member.
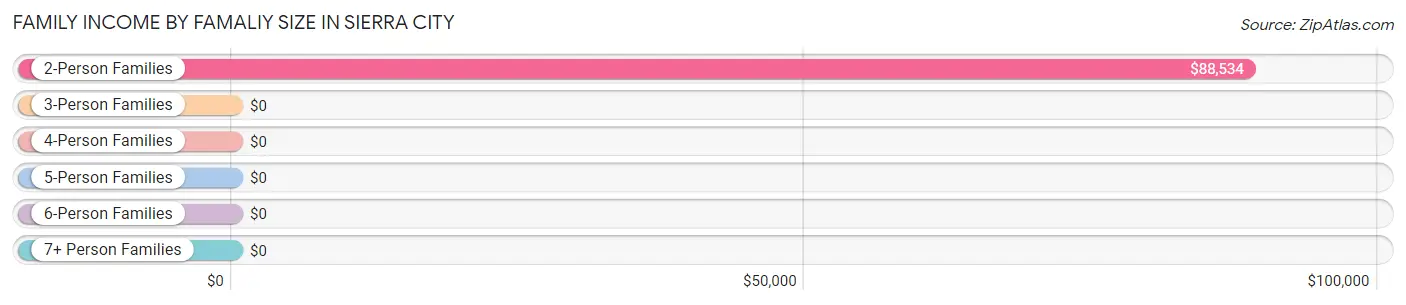
| Income Bracket | # Families | Median Income |
| 2-Person Families | 92 (100.0%) | $88,534 |
| 3-Person Families | 0 (0.0%) | $0 |
| 4-Person Families | 0 (0.0%) | $0 |
| 5-Person Families | 0 (0.0%) | $0 |
| 6-Person Families | 0 (0.0%) | $0 |
| 7+ Person Families | 0 (0.0%) | $0 |
| Total | 92 (100.0%) | $88,534 |
Family Income by Number of Earners in Sierra City
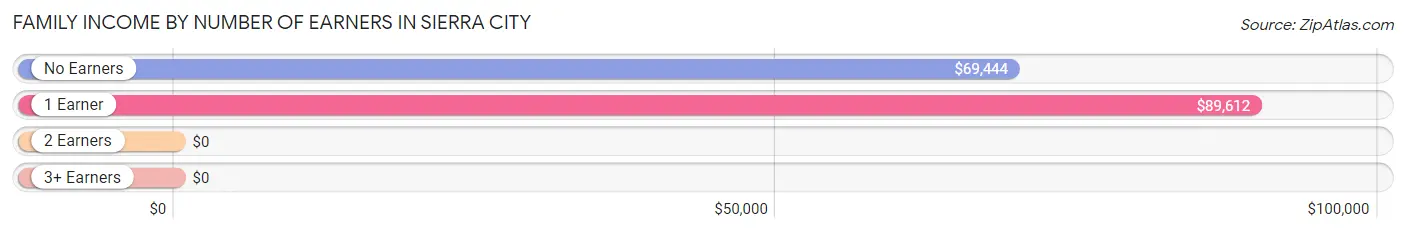
| Number of Earners | # Families | Median Income |
| No Earners | 34 (37.0%) | $69,444 |
| 1 Earner | 49 (53.3%) | $89,612 |
| 2 Earners | 9 (9.8%) | $0 |
| 3+ Earners | 0 (0.0%) | $0 |
| Total | 92 (100.0%) | $88,534 |
Household Income in Sierra City
Household Income Brackets in Sierra City
With 41 households falling in the category, the $35,000 to $49,999 income range is the most frequent in Sierra City, accounting for 30.1% of all households.
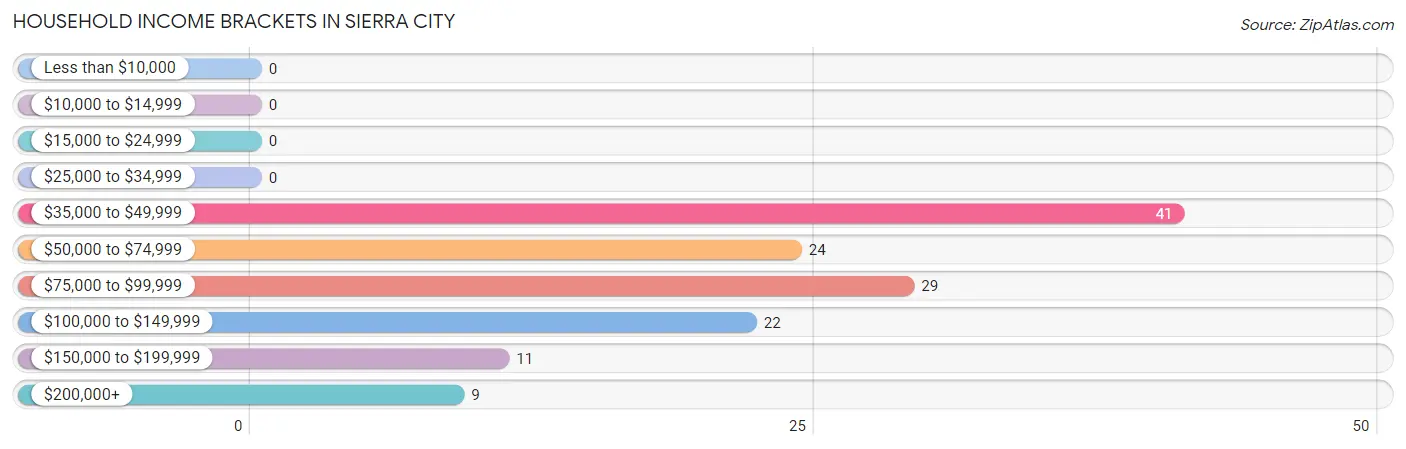
| Income Bracket | # Households | % Households |
| Less than $10,000 | 0 | 0.0% |
| $10,000 to $14,999 | 0 | 0.0% |
| $15,000 to $24,999 | 0 | 0.0% |
| $25,000 to $34,999 | 0 | 0.0% |
| $35,000 to $49,999 | 41 | 30.1% |
| $50,000 to $74,999 | 24 | 17.6% |
| $75,000 to $99,999 | 29 | 21.3% |
| $100,000 to $149,999 | 22 | 16.2% |
| $150,000 to $199,999 | 11 | 8.1% |
| $200,000+ | 9 | 6.6% |
Household Income by Householder Age in Sierra City
The median household income in Sierra City is $87,759, with the highest median household income of $89,095 found in the 65+ years age bracket for the primary householder. A total of 87 households (64.0%) fall into this category.
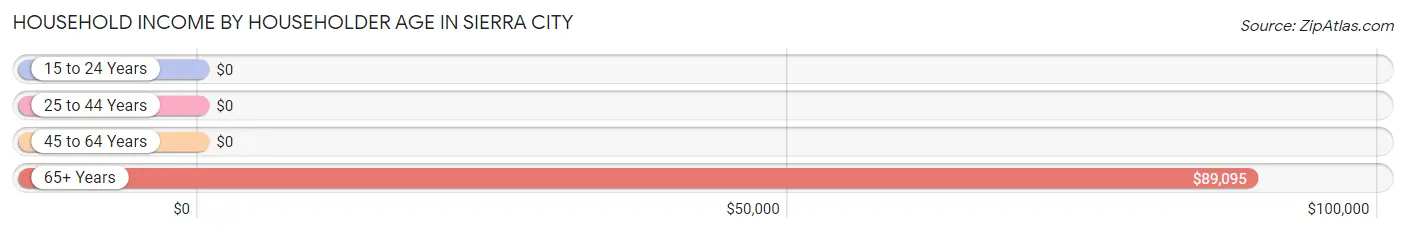
| Income Bracket | # Households | Median Income |
| 15 to 24 Years | 0 (0.0%) | $0 |
| 25 to 44 Years | 0 (0.0%) | $0 |
| 45 to 64 Years | 49 (36.0%) | $0 |
| 65+ Years | 87 (64.0%) | $89,095 |
| Total | 136 (100.0%) | $87,759 |
Poverty in Sierra City
Income Below Poverty by Sex and Age in Sierra City
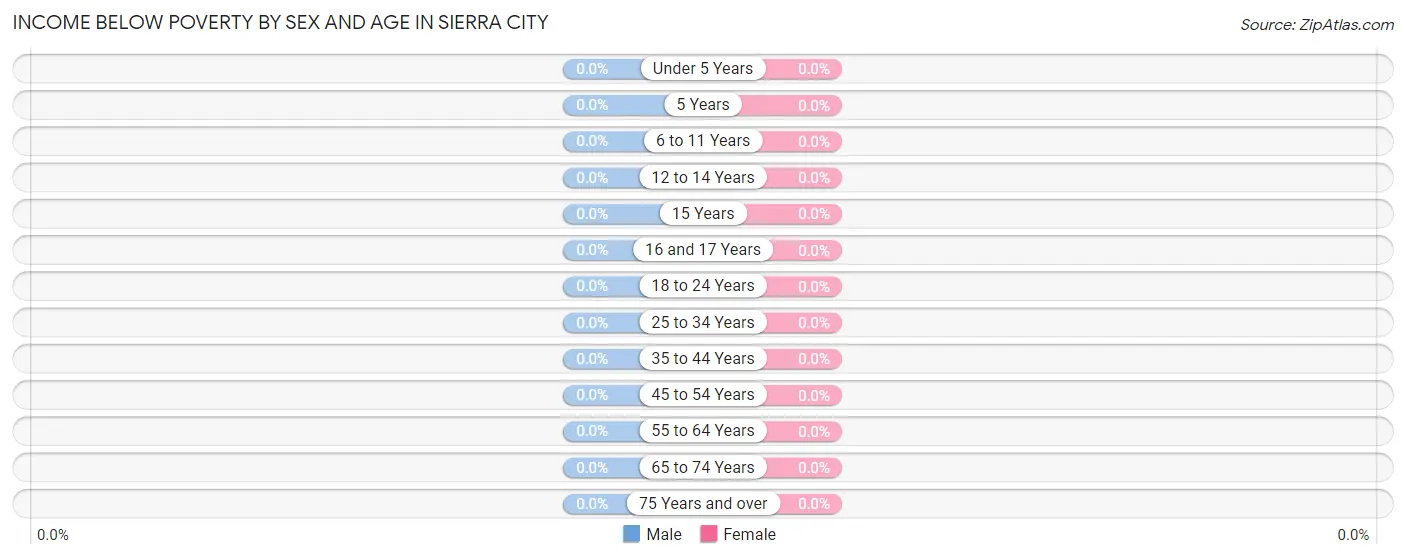
| Age Bracket | Male | Female |
| Under 5 Years | 0 (0.0%) | 0 (0.0%) |
| 5 Years | 0 (0.0%) | 0 (0.0%) |
| 6 to 11 Years | 0 (0.0%) | 0 (0.0%) |
| 12 to 14 Years | 0 (0.0%) | 0 (0.0%) |
| 15 Years | 0 (0.0%) | 0 (0.0%) |
| 16 and 17 Years | 0 (0.0%) | 0 (0.0%) |
| 18 to 24 Years | 0 (0.0%) | 0 (0.0%) |
| 25 to 34 Years | 0 (0.0%) | 0 (0.0%) |
| 35 to 44 Years | 0 (0.0%) | 0 (0.0%) |
| 45 to 54 Years | 0 (0.0%) | 0 (0.0%) |
| 55 to 64 Years | 0 (0.0%) | 0 (0.0%) |
| 65 to 74 Years | 0 (0.0%) | 0 (0.0%) |
| 75 Years and over | 0 (0.0%) | 0 (0.0%) |
| Total | 0 (0.0%) | 0 (0.0%) |
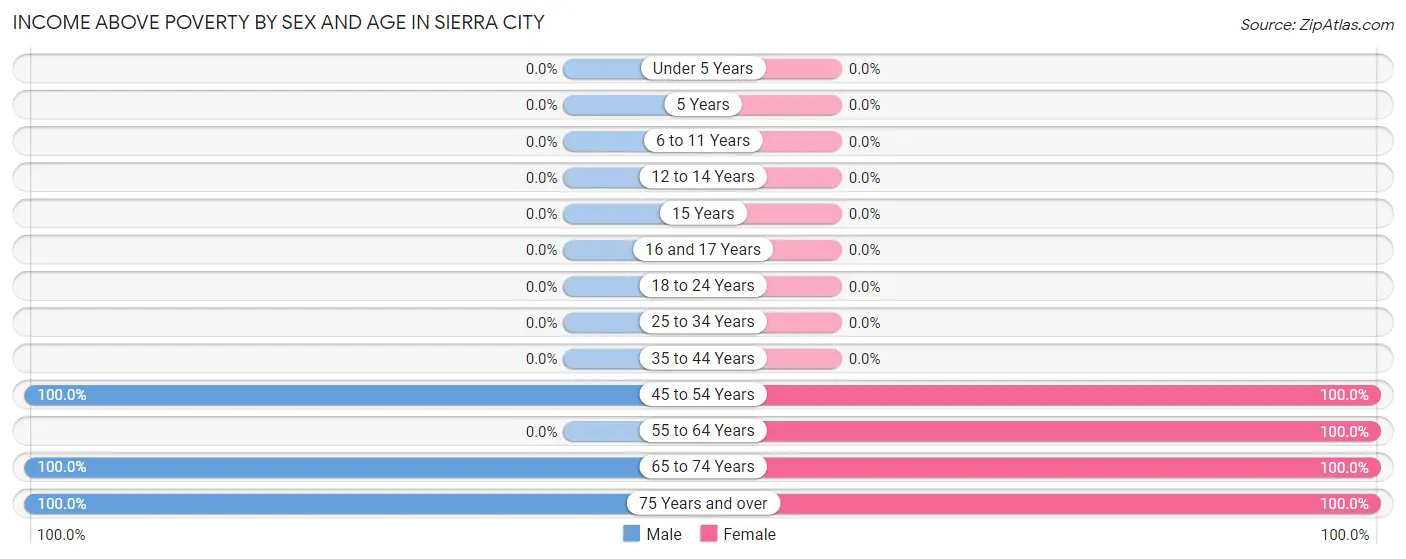
Income Above Poverty by Sex and Age in Sierra City
According to the poverty statistics in Sierra City, males aged 45 to 54 years and females aged 45 to 54 years are the age groups that are most secure financially, with 100.0% of males and 100.0% of females in these age groups living above the poverty line.
| Age Bracket | Male | Female |
| Under 5 Years | 0 (0.0%) | 0 (0.0%) |
| 5 Years | 0 (0.0%) | 0 (0.0%) |
| 6 to 11 Years | 0 (0.0%) | 0 (0.0%) |
| 12 to 14 Years | 0 (0.0%) | 0 (0.0%) |
| 15 Years | 0 (0.0%) | 0 (0.0%) |
| 16 and 17 Years | 0 (0.0%) | 0 (0.0%) |
| 18 to 24 Years | 0 (0.0%) | 0 (0.0%) |
| 25 to 34 Years | 0 (0.0%) | 0 (0.0%) |
| 35 to 44 Years | 0 (0.0%) | 0 (0.0%) |
| 45 to 54 Years | 31 (100.0%) | 16 (100.0%) |
| 55 to 64 Years | 0 (0.0%) | 9 (100.0%) |
| 65 to 74 Years | 63 (100.0%) | 60 (100.0%) |
| 75 Years and over | 23 (100.0%) | 19 (100.0%) |
| Total | 117 (100.0%) | 104 (100.0%) |
Income Below Poverty Among Married-Couple Families in Sierra City
| Children | Above Poverty | Below Poverty |
| No Children | 92 (100.0%) | 0 (0.0%) |
| 1 or 2 Children | 0 (0.0%) | 0 (0.0%) |
| 3 or 4 Children | 0 (0.0%) | 0 (0.0%) |
| 5 or more Children | 0 (0.0%) | 0 (0.0%) |
| Total | 92 (100.0%) | 0 (0.0%) |
Income Below Poverty Among Single-Parent Households in Sierra City
| Children | Single Father | Single Mother |
| No Children | 0 (0.0%) | 0 (0.0%) |
| 1 or 2 Children | 0 (0.0%) | 0 (0.0%) |
| 3 or 4 Children | 0 (0.0%) | 0 (0.0%) |
| 5 or more Children | 0 (0.0%) | 0 (0.0%) |
| Total | 0 (0.0%) | 0 (0.0%) |
Income Below Poverty Among Married-Couple vs Single-Parent Households in Sierra City
| Children | Married-Couple Families | Single-Parent Households |
| No Children | 0 (0.0%) | 0 (0.0%) |
| 1 or 2 Children | 0 (0.0%) | 0 (0.0%) |
| 3 or 4 Children | 0 (0.0%) | 0 (0.0%) |
| 5 or more Children | 0 (0.0%) | 0 (0.0%) |
| Total | 0 (0.0%) | 0 (0.0%) |
Employment Characteristics in Sierra City
Employment by Class of Employer in Sierra City
Among the 95 employed individuals in Sierra City, private company employees (60 | 63.2%), local government employees (18 | 19.0%), and self-employed (not incorporated) (10 | 10.5%) make up the most common classes of employment.
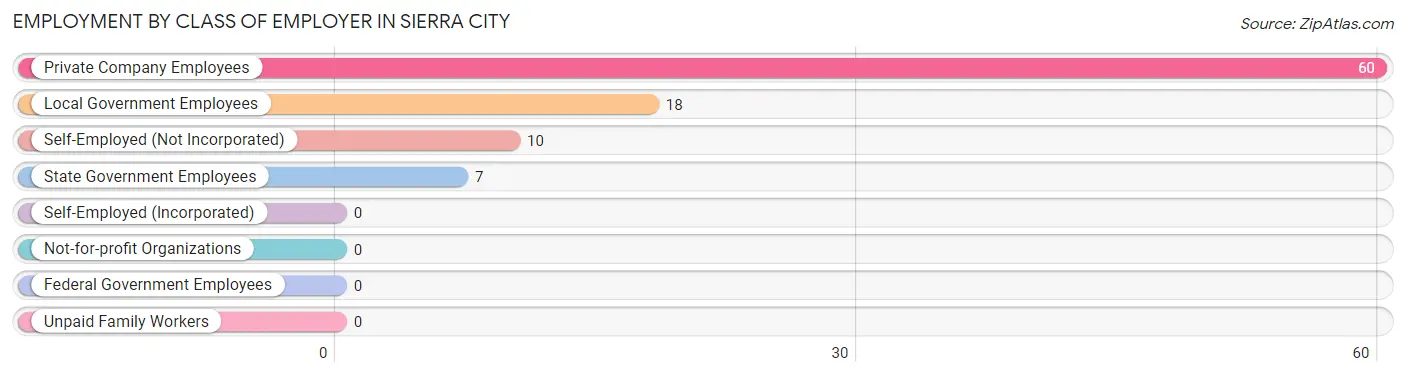
| Employer Class | # Employees | % Employees |
| Private Company Employees | 60 | 63.2% |
| Self-Employed (Incorporated) | 0 | 0.0% |
| Self-Employed (Not Incorporated) | 10 | 10.5% |
| Not-for-profit Organizations | 0 | 0.0% |
| Local Government Employees | 18 | 19.0% |
| State Government Employees | 7 | 7.4% |
| Federal Government Employees | 0 | 0.0% |
| Unpaid Family Workers | 0 | 0.0% |
| Total | 95 | 100.0% |
Employment Status by Age in Sierra City
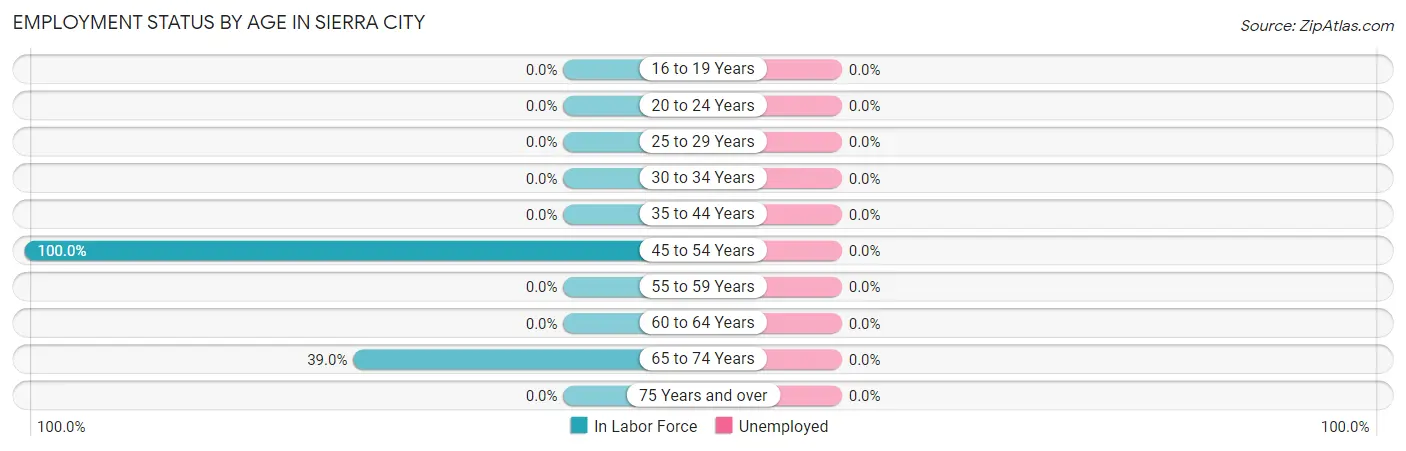
| Age Bracket | In Labor Force | Unemployed |
| 16 to 19 Years | 0 (0.0%) | 0 (0.0%) |
| 20 to 24 Years | 0 (0.0%) | 0 (0.0%) |
| 25 to 29 Years | 0 (0.0%) | 0 (0.0%) |
| 30 to 34 Years | 0 (0.0%) | 0 (0.0%) |
| 35 to 44 Years | 0 (0.0%) | 0 (0.0%) |
| 45 to 54 Years | 47 (100.0%) | 0 (0.0%) |
| 55 to 59 Years | 0 (0.0%) | 0 (0.0%) |
| 60 to 64 Years | 0 (0.0%) | 0 (0.0%) |
| 65 to 74 Years | 48 (39.0%) | 0 (0.0%) |
| 75 Years and over | 0 (0.0%) | 0 (0.0%) |
| Total | 95 (43.0%) | 0 (0.0%) |
Employment Status by Educational Attainment in Sierra City
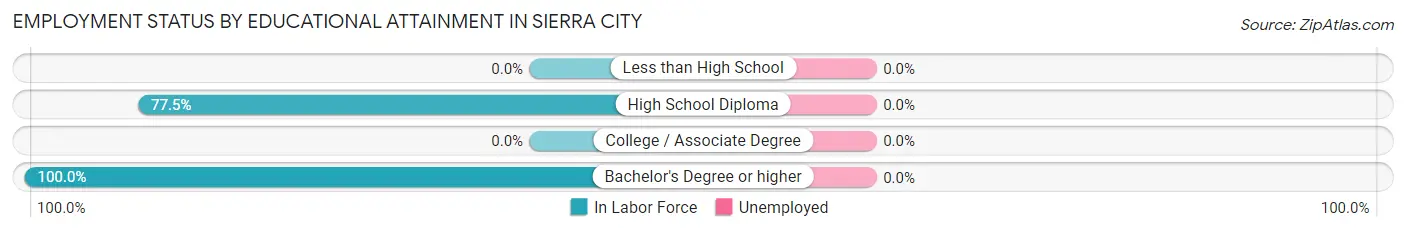
| Educational Attainment | In Labor Force | Unemployed |
| Less than High School | 0 (0.0%) | 0 (0.0%) |
| High School Diploma | 31 (77.5%) | 0 (0.0%) |
| College / Associate Degree | 0 (0.0%) | 0 (0.0%) |
| Bachelor's Degree or higher | 16 (100.0%) | 0 (0.0%) |
| Total | 47 (83.9%) | 0 (0.0%) |
Employment Occupations by Sex in Sierra City
Management, Business, Science and Arts Occupations
The most common Management, Business, Science and Arts occupations in Sierra City are , and Management (16 | 16.8%).
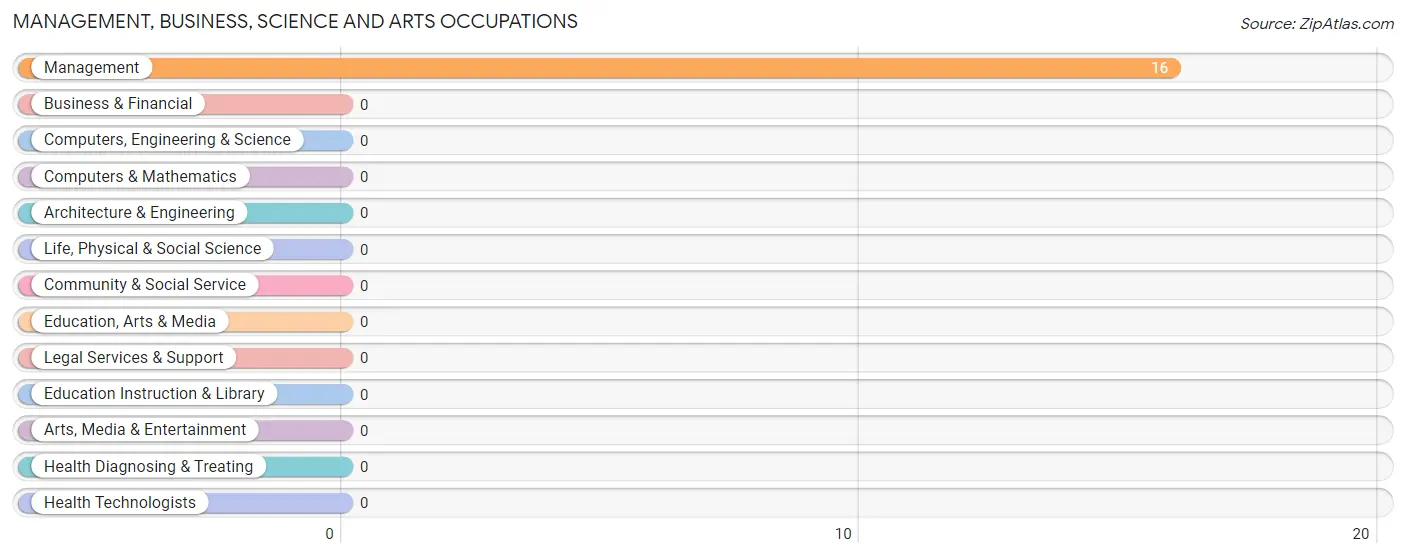
Management, Business, Science and Arts Occupations by Sex
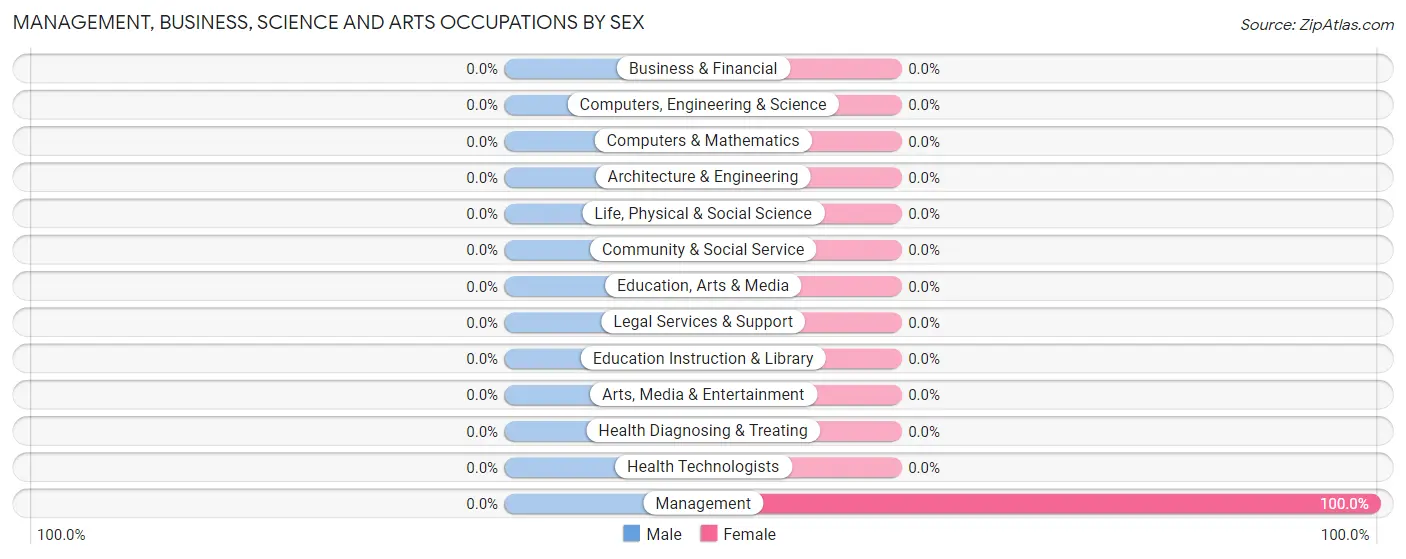
| Occupation | Male | Female |
| Management | 0 (0.0%) | 16 (100.0%) |
| Business & Financial | 0 (0.0%) | 0 (0.0%) |
| Computers, Engineering & Science | 0 (0.0%) | 0 (0.0%) |
| Computers & Mathematics | 0 (0.0%) | 0 (0.0%) |
| Architecture & Engineering | 0 (0.0%) | 0 (0.0%) |
| Life, Physical & Social Science | 0 (0.0%) | 0 (0.0%) |
| Community & Social Service | 0 (0.0%) | 0 (0.0%) |
| Education, Arts & Media | 0 (0.0%) | 0 (0.0%) |
| Legal Services & Support | 0 (0.0%) | 0 (0.0%) |
| Education Instruction & Library | 0 (0.0%) | 0 (0.0%) |
| Arts, Media & Entertainment | 0 (0.0%) | 0 (0.0%) |
| Health Diagnosing & Treating | 0 (0.0%) | 0 (0.0%) |
| Health Technologists | 0 (0.0%) | 0 (0.0%) |
| Total (Category) | 0 (0.0%) | 16 (100.0%) |
| Total (Overall) | 60 (63.2%) | 35 (36.8%) |
Services Occupations
The most common Services occupations in Sierra City are , and Personal Care & Service (19 | 20.0%).
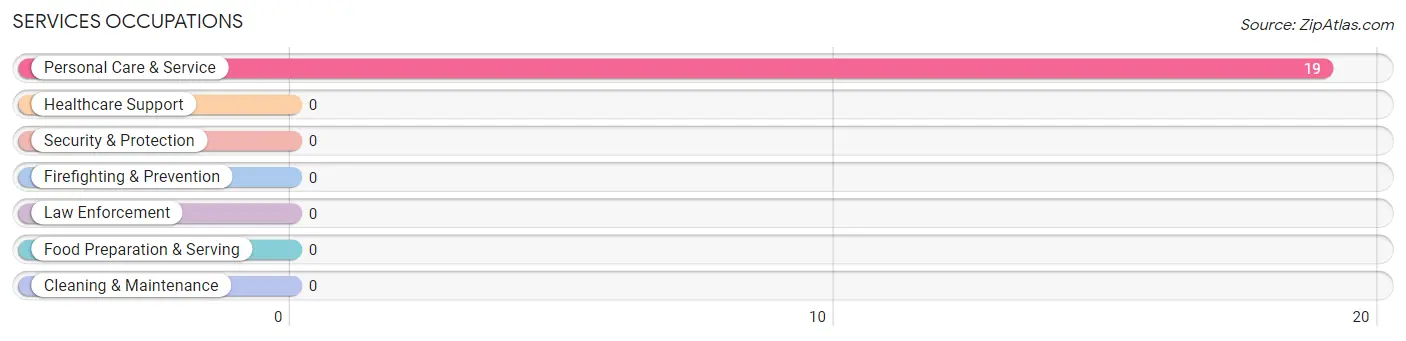
Services Occupations by Sex
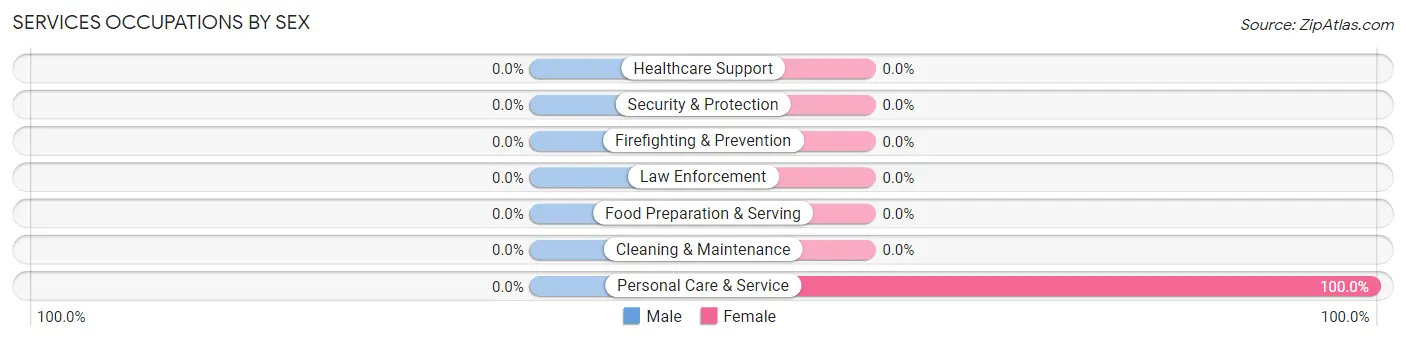
| Occupation | Male | Female |
| Healthcare Support | 0 (0.0%) | 0 (0.0%) |
| Security & Protection | 0 (0.0%) | 0 (0.0%) |
| Firefighting & Prevention | 0 (0.0%) | 0 (0.0%) |
| Law Enforcement | 0 (0.0%) | 0 (0.0%) |
| Food Preparation & Serving | 0 (0.0%) | 0 (0.0%) |
| Cleaning & Maintenance | 0 (0.0%) | 0 (0.0%) |
| Personal Care & Service | 0 (0.0%) | 19 (100.0%) |
| Total (Category) | 0 (0.0%) | 19 (100.0%) |
| Total (Overall) | 60 (63.2%) | 35 (36.8%) |
Sales and Office Occupations
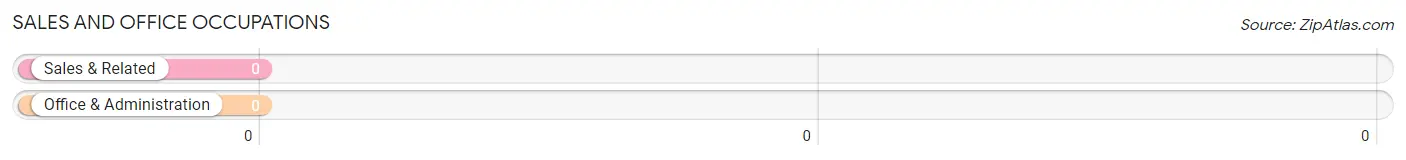
Sales and Office Occupations by Sex
| Occupation | Male | Female |
| Sales & Related | 0 (0.0%) | 0 (0.0%) |
| Office & Administration | 0 (0.0%) | 0 (0.0%) |
| Total (Category) | 0 (0.0%) | 0 (0.0%) |
| Total (Overall) | 60 (63.2%) | 35 (36.8%) |
Natural Resources, Construction and Maintenance Occupations
Natural Resources, Construction and Maintenance Occupations by Sex
| Occupation | Male | Female |
| Farming, Fishing & Forestry | 0 (0.0%) | 0 (0.0%) |
| Construction & Extraction | 0 (0.0%) | 0 (0.0%) |
| Installation, Maintenance & Repair | 0 (0.0%) | 0 (0.0%) |
| Total (Category) | 0 (0.0%) | 0 (0.0%) |
| Total (Overall) | 60 (63.2%) | 35 (36.8%) |
Production, Transportation and Moving Occupations
The most common Production, Transportation and Moving occupations in Sierra City are Transportation (31 | 32.6%), and Production (29 | 30.5%).
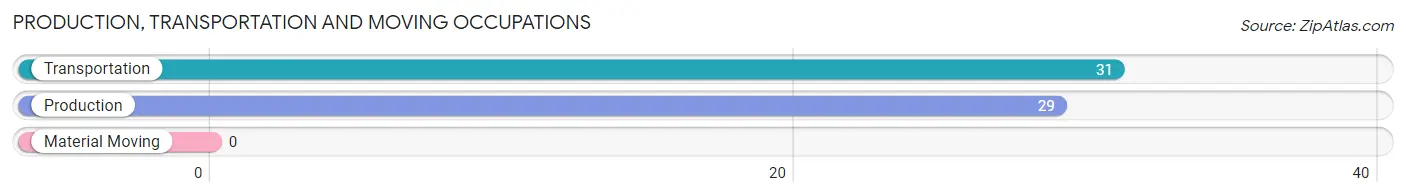
Production, Transportation and Moving Occupations by Sex
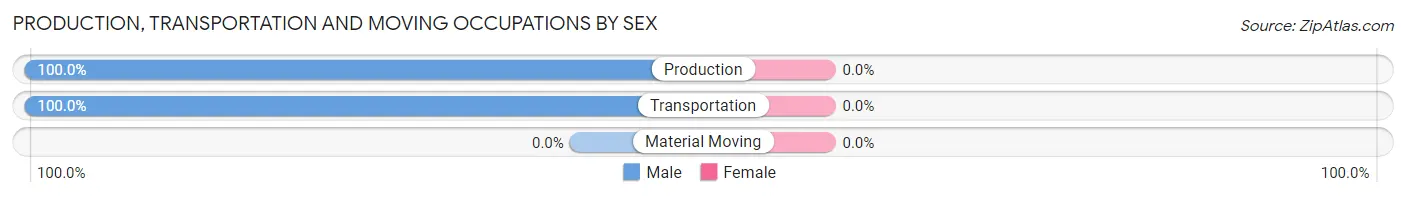
| Occupation | Male | Female |
| Production | 29 (100.0%) | 0 (0.0%) |
| Transportation | 31 (100.0%) | 0 (0.0%) |
| Material Moving | 0 (0.0%) | 0 (0.0%) |
| Total (Category) | 60 (100.0%) | 0 (0.0%) |
| Total (Overall) | 60 (63.2%) | 35 (36.8%) |
Employment Industries by Sex in Sierra City
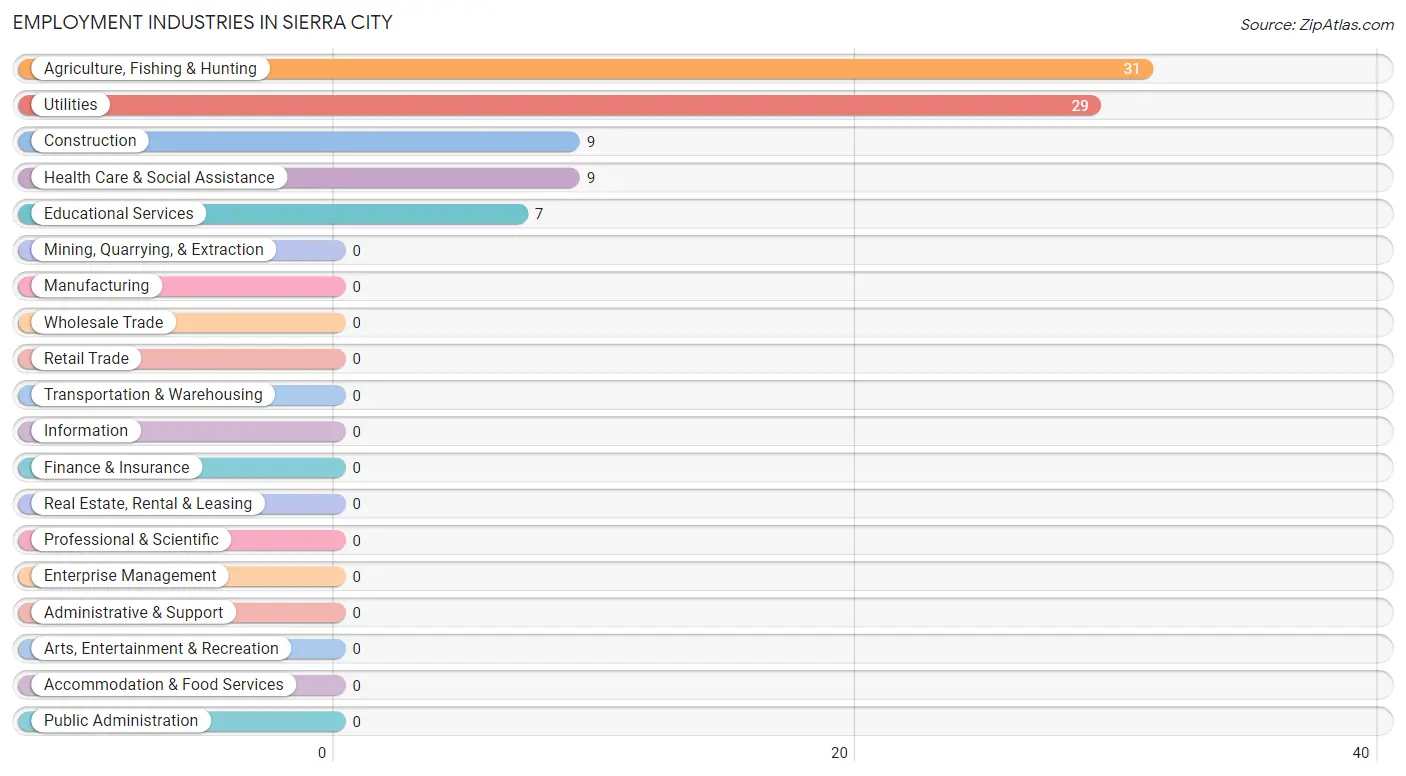
Employment Industries in Sierra City
The major employment industries in Sierra City include Agriculture, Fishing & Hunting (31 | 32.6%), Utilities (29 | 30.5%), Construction (9 | 9.5%), Health Care & Social Assistance (9 | 9.5%), and Educational Services (7 | 7.4%).
Employment Industries by Sex in Sierra City
The Sierra City industries that see more men than women are Agriculture, Fishing & Hunting (100.0%), and Utilities (100.0%), whereas the industries that tend to have a higher number of women are Construction (100.0%), Educational Services (100.0%), and Health Care & Social Assistance (100.0%).
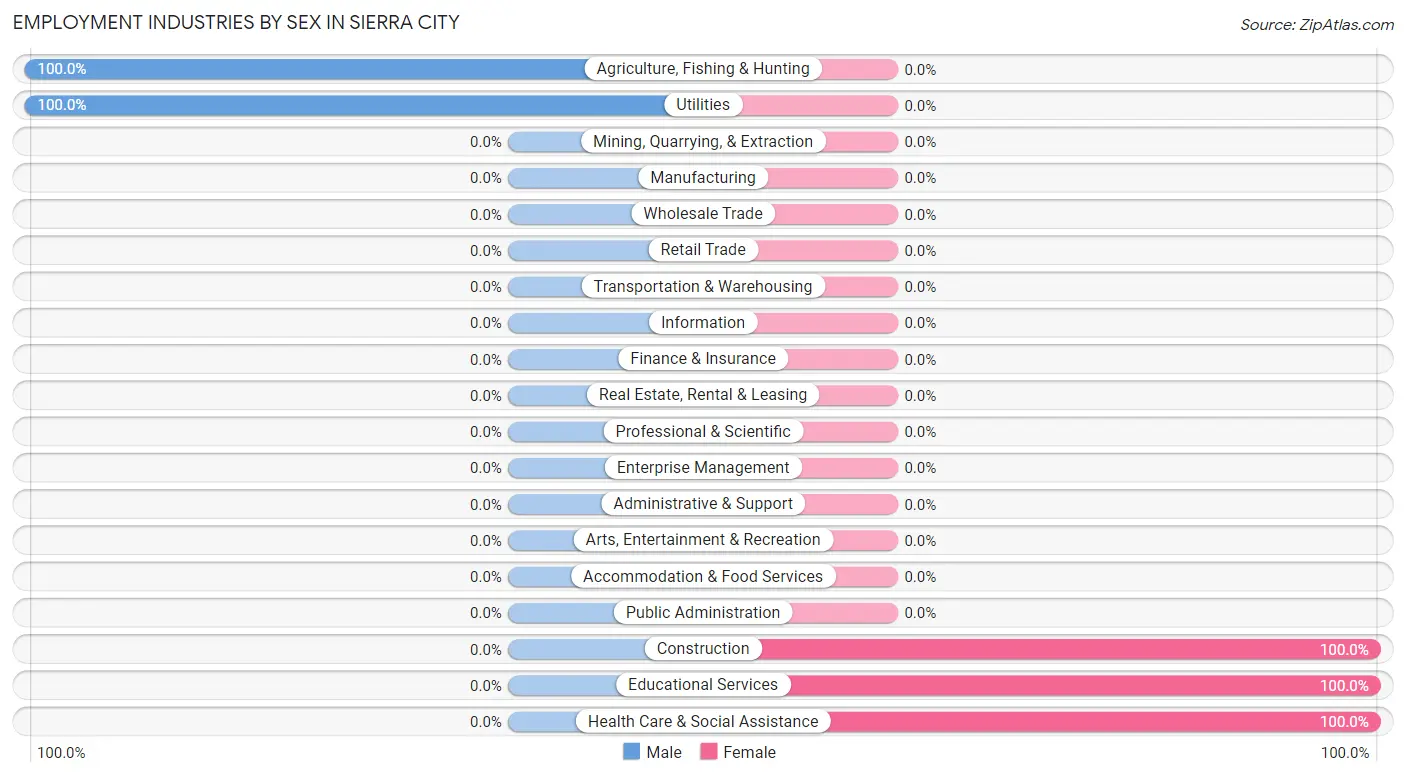
| Industry | Male | Female |
| Agriculture, Fishing & Hunting | 31 (100.0%) | 0 (0.0%) |
| Mining, Quarrying, & Extraction | 0 (0.0%) | 0 (0.0%) |
| Construction | 0 (0.0%) | 9 (100.0%) |
| Manufacturing | 0 (0.0%) | 0 (0.0%) |
| Wholesale Trade | 0 (0.0%) | 0 (0.0%) |
| Retail Trade | 0 (0.0%) | 0 (0.0%) |
| Transportation & Warehousing | 0 (0.0%) | 0 (0.0%) |
| Utilities | 29 (100.0%) | 0 (0.0%) |
| Information | 0 (0.0%) | 0 (0.0%) |
| Finance & Insurance | 0 (0.0%) | 0 (0.0%) |
| Real Estate, Rental & Leasing | 0 (0.0%) | 0 (0.0%) |
| Professional & Scientific | 0 (0.0%) | 0 (0.0%) |
| Enterprise Management | 0 (0.0%) | 0 (0.0%) |
| Administrative & Support | 0 (0.0%) | 0 (0.0%) |
| Educational Services | 0 (0.0%) | 7 (100.0%) |
| Health Care & Social Assistance | 0 (0.0%) | 9 (100.0%) |
| Arts, Entertainment & Recreation | 0 (0.0%) | 0 (0.0%) |
| Accommodation & Food Services | 0 (0.0%) | 0 (0.0%) |
| Public Administration | 0 (0.0%) | 0 (0.0%) |
| Total | 60 (63.2%) | 35 (36.8%) |
Education in Sierra City
School Enrollment in Sierra City
| School Level | # Students | % Students |
| Nursery / Preschool | 0 | 0.0% |
| Kindergarten | 0 | 0.0% |
| Elementary School | 0 | 0.0% |
| Middle School | 0 | 0.0% |
| High School | 0 | 0.0% |
| College / Undergraduate | 0 | 0.0% |
| Graduate / Professional | 0 | 0.0% |
| Total | 0 | 0.0% |
School Enrollment by Age by Funding Source in Sierra City
| Age Bracket | Public School | Private School |
| 3 to 4 Year Olds | 0 (0.0%) | 0 (0.0%) |
| 5 to 9 Year Old | 0 (0.0%) | 0 (0.0%) |
| 10 to 14 Year Olds | 0 (0.0%) | 0 (0.0%) |
| 15 to 17 Year Olds | 0 (0.0%) | 0 (0.0%) |
| 18 to 19 Year Olds | 0 (0.0%) | 0 (0.0%) |
| 20 to 24 Year Olds | 0 (0.0%) | 0 (0.0%) |
| 25 to 34 Year Olds | 0 (0.0%) | 0 (0.0%) |
| 35 Years and over | 0 (0.0%) | 0 (0.0%) |
| Total | 0 (0.0%) | 0 (0.0%) |
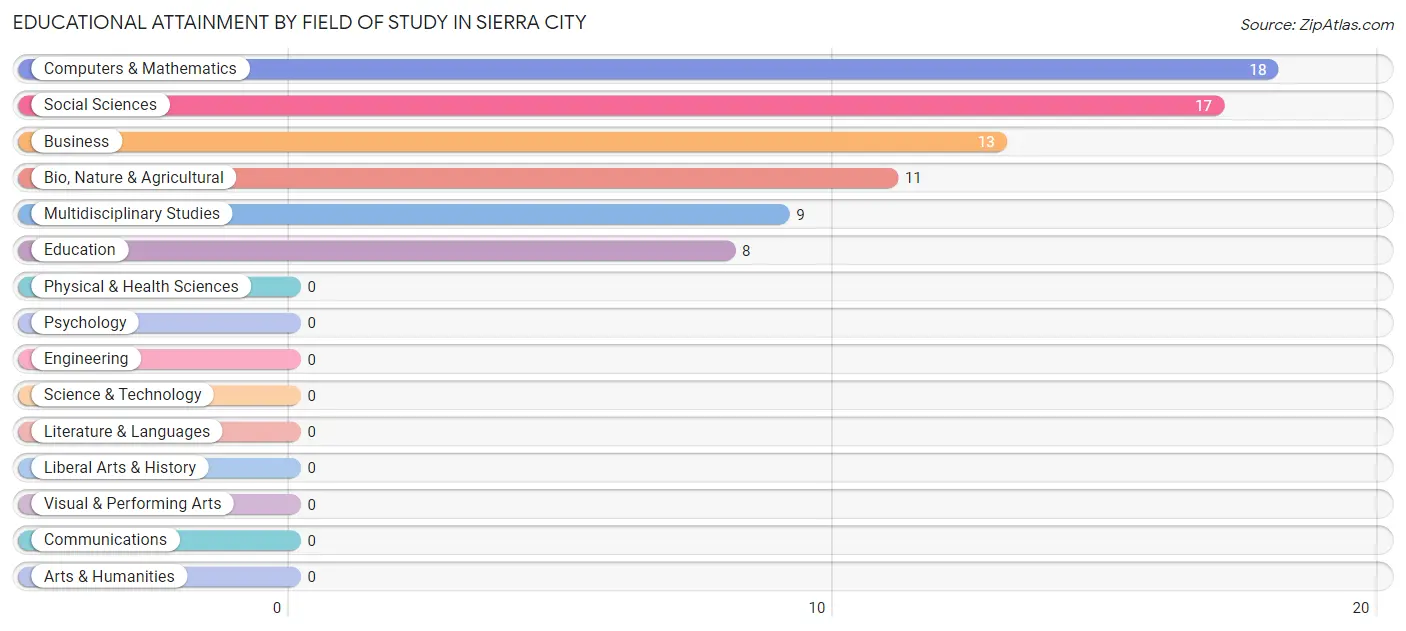
Educational Attainment by Field of Study in Sierra City
Computers & mathematics (18 | 23.7%), social sciences (17 | 22.4%), business (13 | 17.1%), bio, nature & agricultural (11 | 14.5%), and multidisciplinary studies (9 | 11.8%) are the most common fields of study among 76 individuals in Sierra City who have obtained a bachelor's degree or higher.
| Field of Study | # Graduates | % Graduates |
| Computers & Mathematics | 18 | 23.7% |
| Bio, Nature & Agricultural | 11 | 14.5% |
| Physical & Health Sciences | 0 | 0.0% |
| Psychology | 0 | 0.0% |
| Social Sciences | 17 | 22.4% |
| Engineering | 0 | 0.0% |
| Multidisciplinary Studies | 9 | 11.8% |
| Science & Technology | 0 | 0.0% |
| Business | 13 | 17.1% |
| Education | 8 | 10.5% |
| Literature & Languages | 0 | 0.0% |
| Liberal Arts & History | 0 | 0.0% |
| Visual & Performing Arts | 0 | 0.0% |
| Communications | 0 | 0.0% |
| Arts & Humanities | 0 | 0.0% |
| Total | 76 | 100.0% |
Transportation & Commute in Sierra City
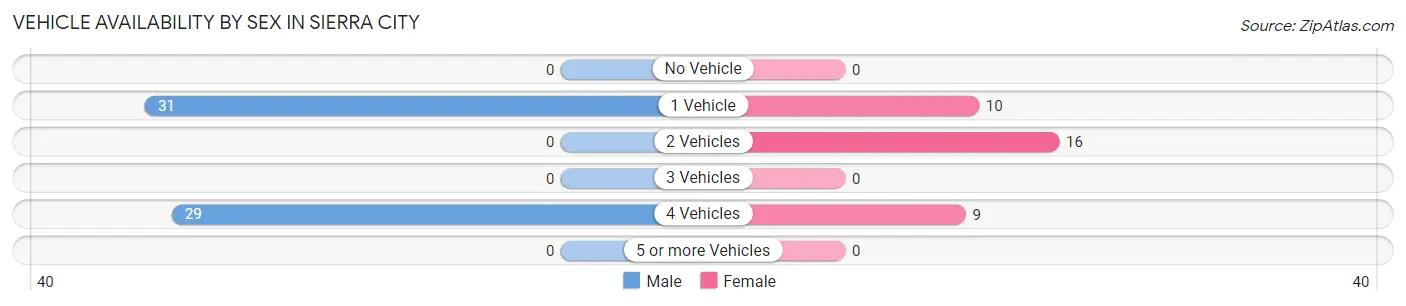
Vehicle Availability by Sex in Sierra City
The most prevalent vehicle ownership categories in Sierra City are males with 1 vehicle (31, accounting for 51.7%) and females with 1 vehicle (10, making up 88.6%).
| Vehicles Available | Male | Female |
| No Vehicle | 0 (0.0%) | 0 (0.0%) |
| 1 Vehicle | 31 (51.7%) | 10 (28.6%) |
| 2 Vehicles | 0 (0.0%) | 16 (45.7%) |
| 3 Vehicles | 0 (0.0%) | 0 (0.0%) |
| 4 Vehicles | 29 (48.3%) | 9 (25.7%) |
| 5 or more Vehicles | 0 (0.0%) | 0 (0.0%) |
| Total | 60 (100.0%) | 35 (100.0%) |
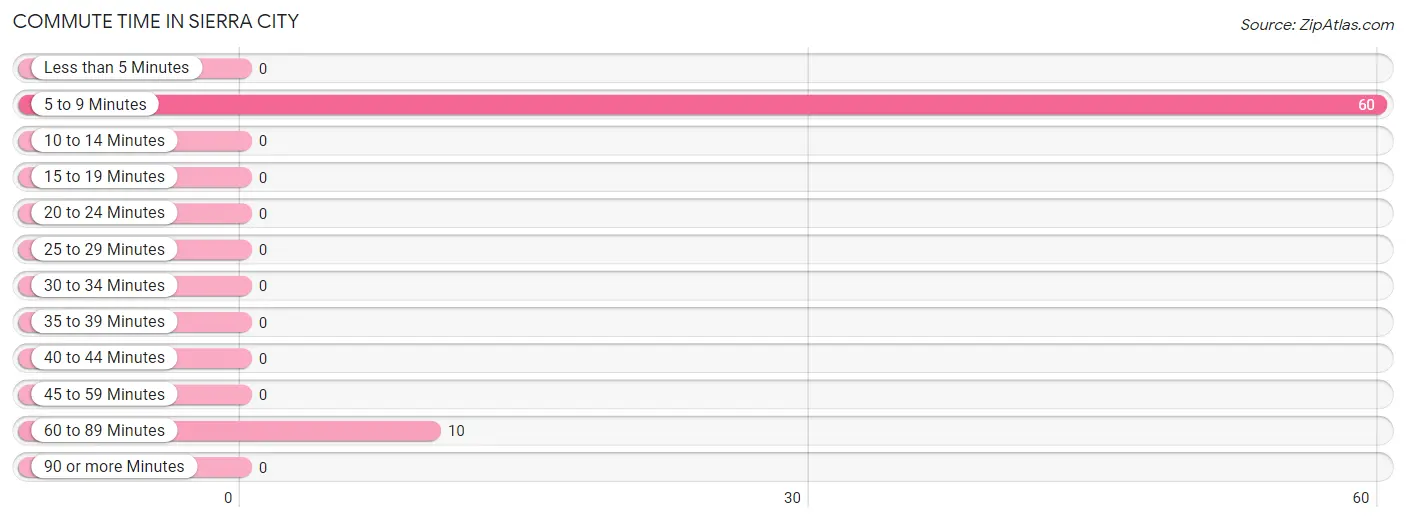
Commute Time in Sierra City
The most frequently occuring commute durations in Sierra City are 5 to 9 minutes (60 commuters, 85.7%), 60 to 89 minutes (10 commuters, 14.3%), and less than 5 minutes (0 commuters, 0.0%).
| Commute Time | # Commuters | % Commuters |
| Less than 5 Minutes | 0 | 0.0% |
| 5 to 9 Minutes | 60 | 85.7% |
| 10 to 14 Minutes | 0 | 0.0% |
| 15 to 19 Minutes | 0 | 0.0% |
| 20 to 24 Minutes | 0 | 0.0% |
| 25 to 29 Minutes | 0 | 0.0% |
| 30 to 34 Minutes | 0 | 0.0% |
| 35 to 39 Minutes | 0 | 0.0% |
| 40 to 44 Minutes | 0 | 0.0% |
| 45 to 59 Minutes | 0 | 0.0% |
| 60 to 89 Minutes | 10 | 14.3% |
| 90 or more Minutes | 0 | 0.0% |
Commute Time by Sex in Sierra City
The most common commute times in Sierra City are 5 to 9 minutes (60 commuters, 100.0%) for males and 60 to 89 minutes (10 commuters, 100.0%) for females.
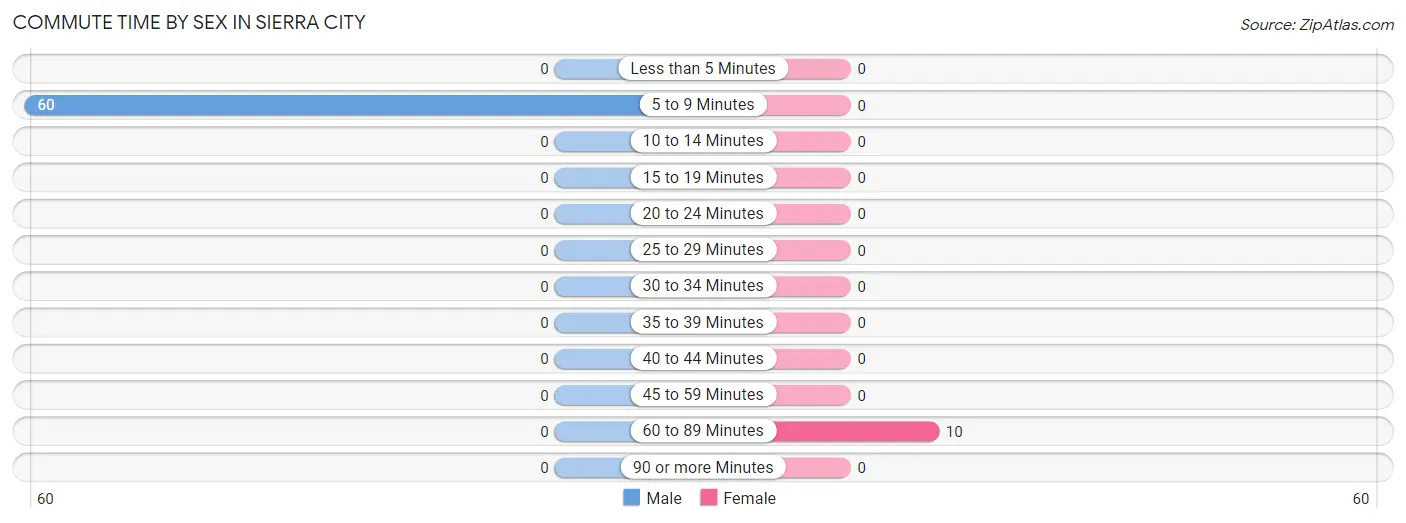
| Commute Time | Male | Female |
| Less than 5 Minutes | 0 (0.0%) | 0 (0.0%) |
| 5 to 9 Minutes | 60 (100.0%) | 0 (0.0%) |
| 10 to 14 Minutes | 0 (0.0%) | 0 (0.0%) |
| 15 to 19 Minutes | 0 (0.0%) | 0 (0.0%) |
| 20 to 24 Minutes | 0 (0.0%) | 0 (0.0%) |
| 25 to 29 Minutes | 0 (0.0%) | 0 (0.0%) |
| 30 to 34 Minutes | 0 (0.0%) | 0 (0.0%) |
| 35 to 39 Minutes | 0 (0.0%) | 0 (0.0%) |
| 40 to 44 Minutes | 0 (0.0%) | 0 (0.0%) |
| 45 to 59 Minutes | 0 (0.0%) | 0 (0.0%) |
| 60 to 89 Minutes | 0 (0.0%) | 10 (100.0%) |
| 90 or more Minutes | 0 (0.0%) | 0 (0.0%) |
Time of Departure to Work by Sex in Sierra City
The most frequent times of departure to work in Sierra City are 12:00 AM to 4:59 AM (31, 51.7%) for males and 8:00 AM to 8:29 AM (10, 100.0%) for females.
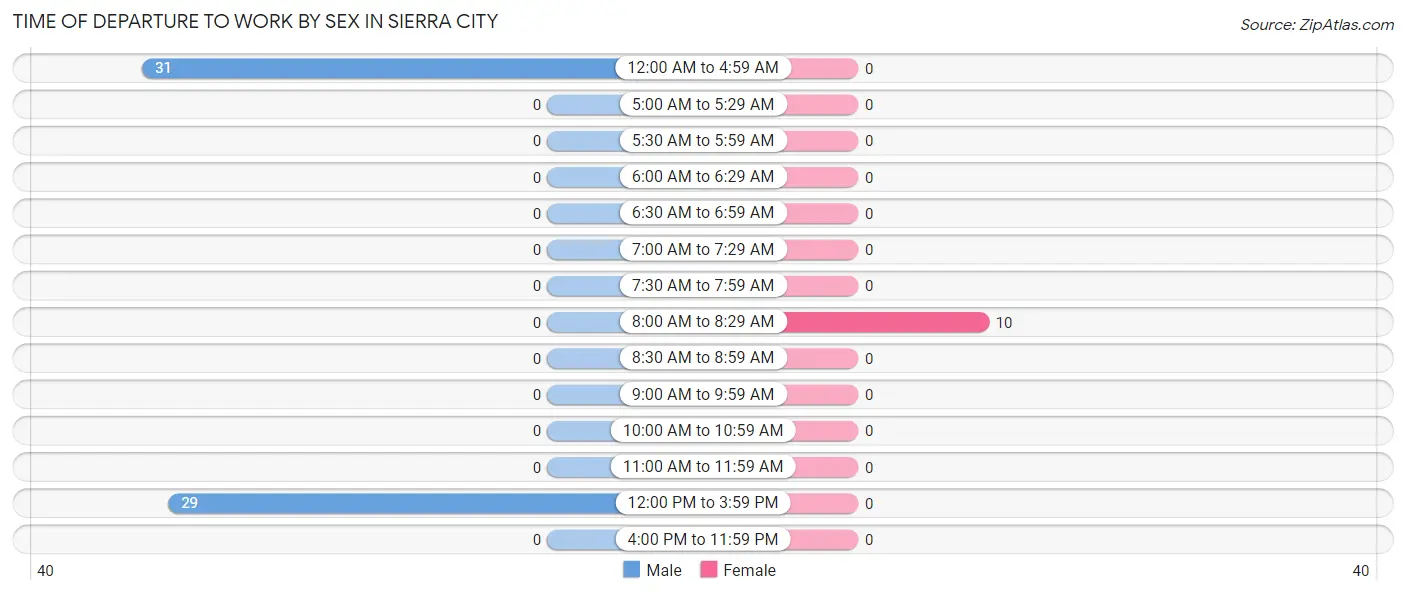
| Time of Departure | Male | Female |
| 12:00 AM to 4:59 AM | 31 (51.7%) | 0 (0.0%) |
| 5:00 AM to 5:29 AM | 0 (0.0%) | 0 (0.0%) |
| 5:30 AM to 5:59 AM | 0 (0.0%) | 0 (0.0%) |
| 6:00 AM to 6:29 AM | 0 (0.0%) | 0 (0.0%) |
| 6:30 AM to 6:59 AM | 0 (0.0%) | 0 (0.0%) |
| 7:00 AM to 7:29 AM | 0 (0.0%) | 0 (0.0%) |
| 7:30 AM to 7:59 AM | 0 (0.0%) | 0 (0.0%) |
| 8:00 AM to 8:29 AM | 0 (0.0%) | 10 (100.0%) |
| 8:30 AM to 8:59 AM | 0 (0.0%) | 0 (0.0%) |
| 9:00 AM to 9:59 AM | 0 (0.0%) | 0 (0.0%) |
| 10:00 AM to 10:59 AM | 0 (0.0%) | 0 (0.0%) |
| 11:00 AM to 11:59 AM | 0 (0.0%) | 0 (0.0%) |
| 12:00 PM to 3:59 PM | 29 (48.3%) | 0 (0.0%) |
| 4:00 PM to 11:59 PM | 0 (0.0%) | 0 (0.0%) |
| Total | 60 (100.0%) | 10 (100.0%) |
Housing Occupancy in Sierra City
Occupancy by Ownership in Sierra City
Of the total 136 dwellings in Sierra City, owner-occupied units account for 136 (100.0%), while renter-occupied units make up 0 (0.0%).
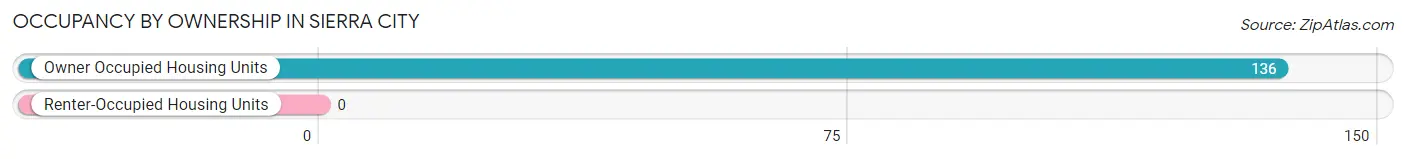
| Occupancy | # Housing Units | % Housing Units |
| Owner Occupied Housing Units | 136 | 100.0% |
| Renter-Occupied Housing Units | 0 | 0.0% |
| Total Occupied Housing Units | 136 | 100.0% |
Occupancy by Household Size in Sierra City
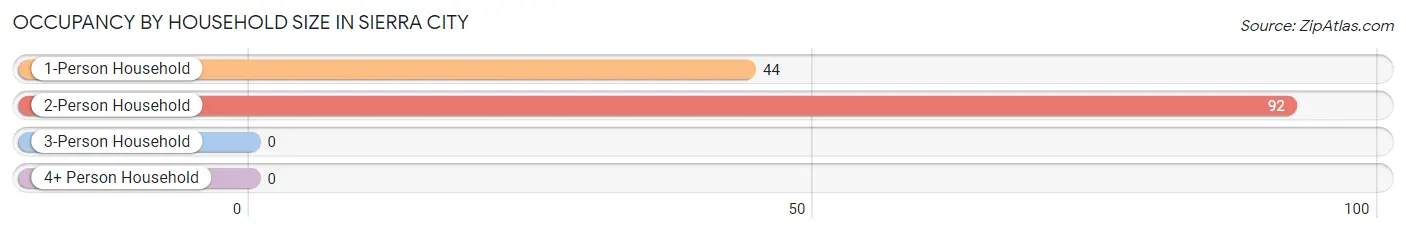
| Household Size | # Housing Units | % Housing Units |
| 1-Person Household | 44 | 32.4% |
| 2-Person Household | 92 | 67.6% |
| 3-Person Household | 0 | 0.0% |
| 4+ Person Household | 0 | 0.0% |
| Total Housing Units | 136 | 100.0% |
Occupancy by Ownership by Household Size in Sierra City
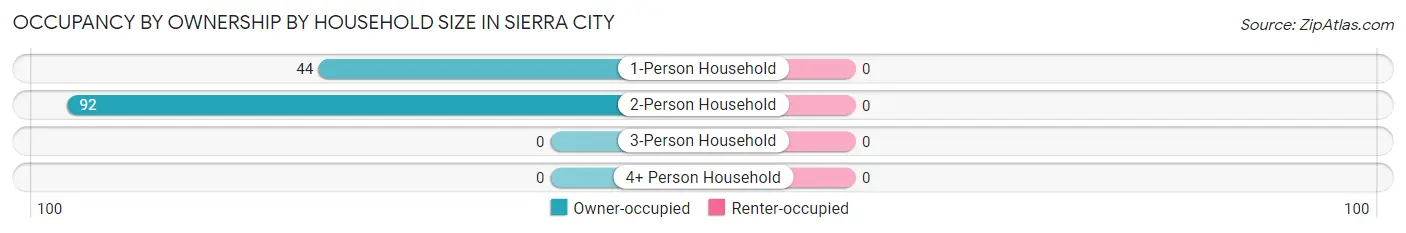
| Household Size | Owner-occupied | Renter-occupied |
| 1-Person Household | 44 (100.0%) | 0 (0.0%) |
| 2-Person Household | 92 (100.0%) | 0 (0.0%) |
| 3-Person Household | 0 (0.0%) | 0 (0.0%) |
| 4+ Person Household | 0 (0.0%) | 0 (0.0%) |
| Total Housing Units | 136 (100.0%) | 0 (0.0%) |
Occupancy by Educational Attainment in Sierra City
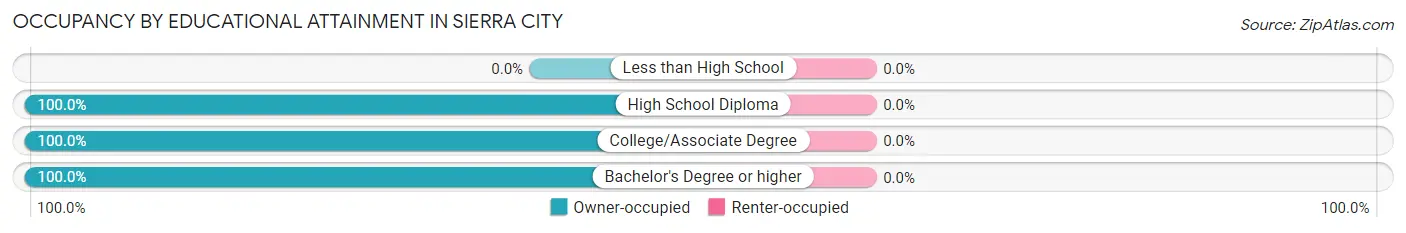
| Household Size | Owner-occupied | Renter-occupied |
| Less than High School | 0 (0.0%) | 0 (0.0%) |
| High School Diploma | 69 (100.0%) | 0 (0.0%) |
| College/Associate Degree | 35 (100.0%) | 0 (0.0%) |
| Bachelor's Degree or higher | 32 (100.0%) | 0 (0.0%) |
Occupancy by Age of Householder in Sierra City
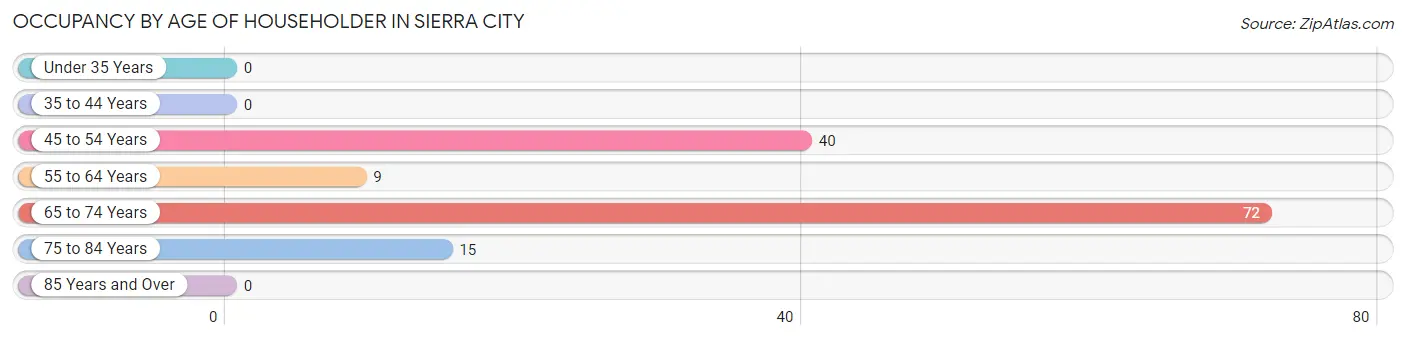
| Age Bracket | # Households | % Households |
| Under 35 Years | 0 | 0.0% |
| 35 to 44 Years | 0 | 0.0% |
| 45 to 54 Years | 40 | 29.4% |
| 55 to 64 Years | 9 | 6.6% |
| 65 to 74 Years | 72 | 52.9% |
| 75 to 84 Years | 15 | 11.0% |
| 85 Years and Over | 0 | 0.0% |
| Total | 136 | 100.0% |
Housing Finances in Sierra City
Median Income by Occupancy in Sierra City
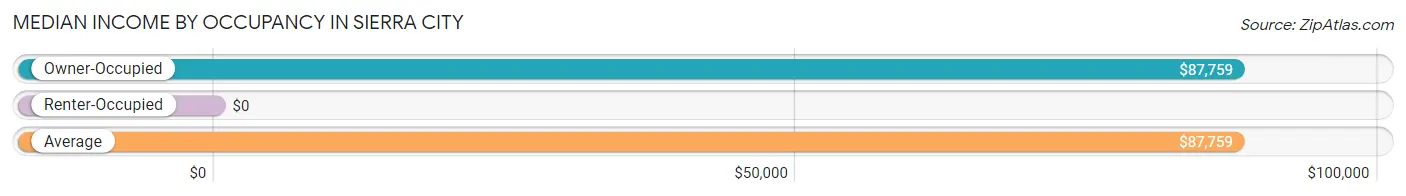
| Occupancy Type | # Households | Median Income |
| Owner-Occupied | 136 (100.0%) | $87,759 |
| Renter-Occupied | 0 (0.0%) | $0 |
| Average | 136 (100.0%) | $87,759 |
Occupancy by Householder Income Bracket in Sierra City
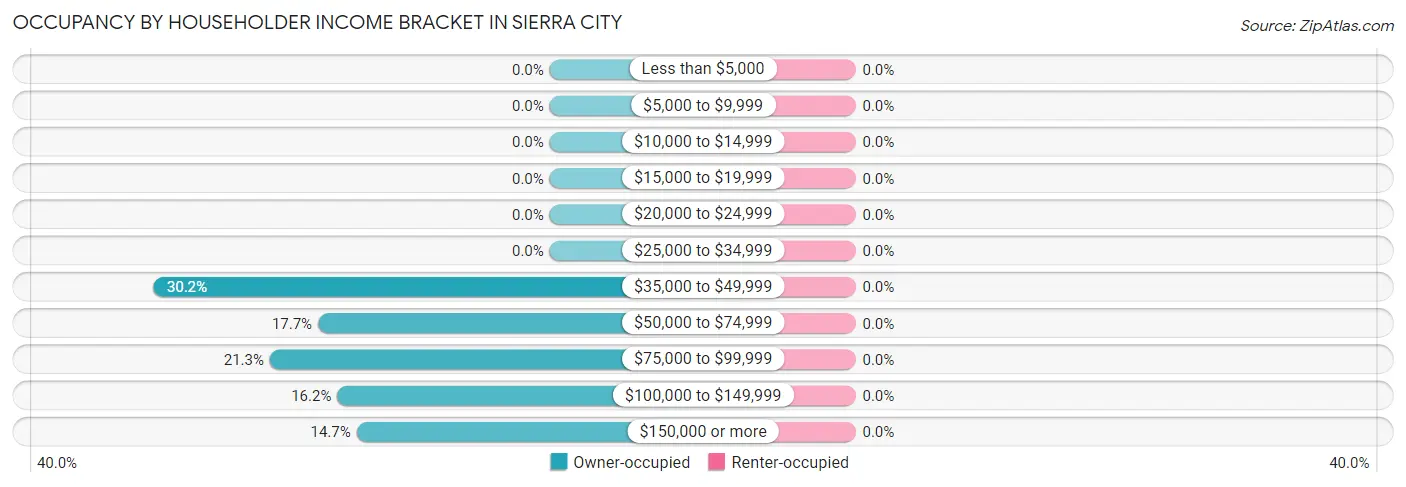
| Income Bracket | Owner-occupied | Renter-occupied |
| Less than $5,000 | 0 (0.0%) | 0 (0.0%) |
| $5,000 to $9,999 | 0 (0.0%) | 0 (0.0%) |
| $10,000 to $14,999 | 0 (0.0%) | 0 (0.0%) |
| $15,000 to $19,999 | 0 (0.0%) | 0 (0.0%) |
| $20,000 to $24,999 | 0 (0.0%) | 0 (0.0%) |
| $25,000 to $34,999 | 0 (0.0%) | 0 (0.0%) |
| $35,000 to $49,999 | 41 (30.1%) | 0 (0.0%) |
| $50,000 to $74,999 | 24 (17.6%) | 0 (0.0%) |
| $75,000 to $99,999 | 29 (21.3%) | 0 (0.0%) |
| $100,000 to $149,999 | 22 (16.2%) | 0 (0.0%) |
| $150,000 or more | 20 (14.7%) | 0 (0.0%) |
| Total | 136 (100.0%) | 0 (0.0%) |
Monthly Housing Cost Tiers in Sierra City
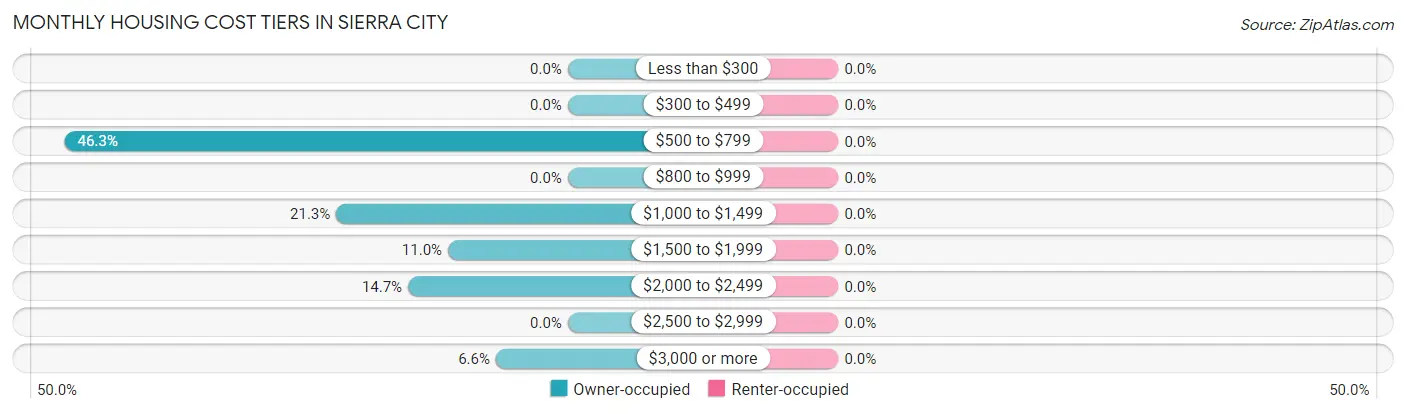
| Monthly Cost | Owner-occupied | Renter-occupied |
| Less than $300 | 0 (0.0%) | 0 (0.0%) |
| $300 to $499 | 0 (0.0%) | 0 (0.0%) |
| $500 to $799 | 63 (46.3%) | 0 (0.0%) |
| $800 to $999 | 0 (0.0%) | 0 (0.0%) |
| $1,000 to $1,499 | 29 (21.3%) | 0 (0.0%) |
| $1,500 to $1,999 | 15 (11.0%) | 0 (0.0%) |
| $2,000 to $2,499 | 20 (14.7%) | 0 (0.0%) |
| $2,500 to $2,999 | 0 (0.0%) | 0 (0.0%) |
| $3,000 or more | 9 (6.6%) | 0 (0.0%) |
| Total | 136 (100.0%) | 0 (0.0%) |
Physical Housing Characteristics in Sierra City
Housing Structures in Sierra City
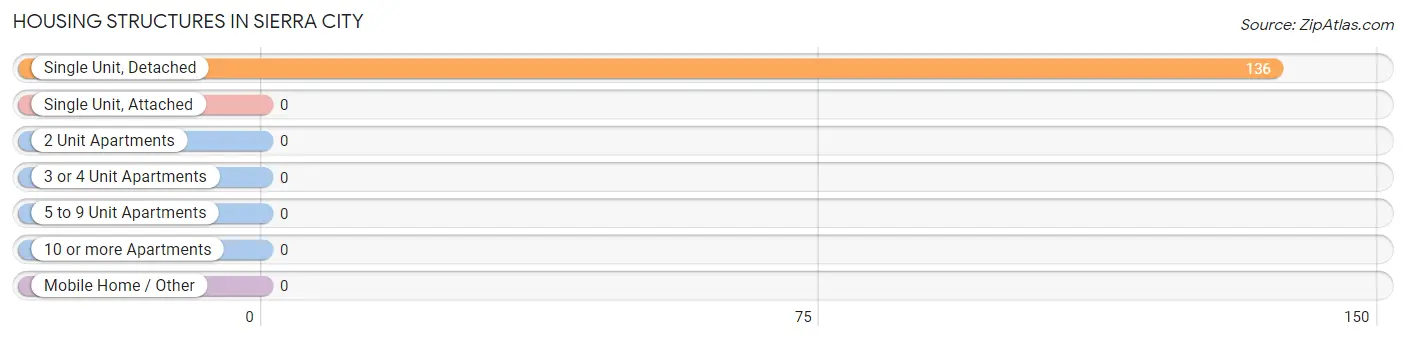
| Structure Type | # Housing Units | % Housing Units |
| Single Unit, Detached | 136 | 100.0% |
| Single Unit, Attached | 0 | 0.0% |
| 2 Unit Apartments | 0 | 0.0% |
| 3 or 4 Unit Apartments | 0 | 0.0% |
| 5 to 9 Unit Apartments | 0 | 0.0% |
| 10 or more Apartments | 0 | 0.0% |
| Mobile Home / Other | 0 | 0.0% |
| Total | 136 | 100.0% |
Housing Structures by Occupancy in Sierra City
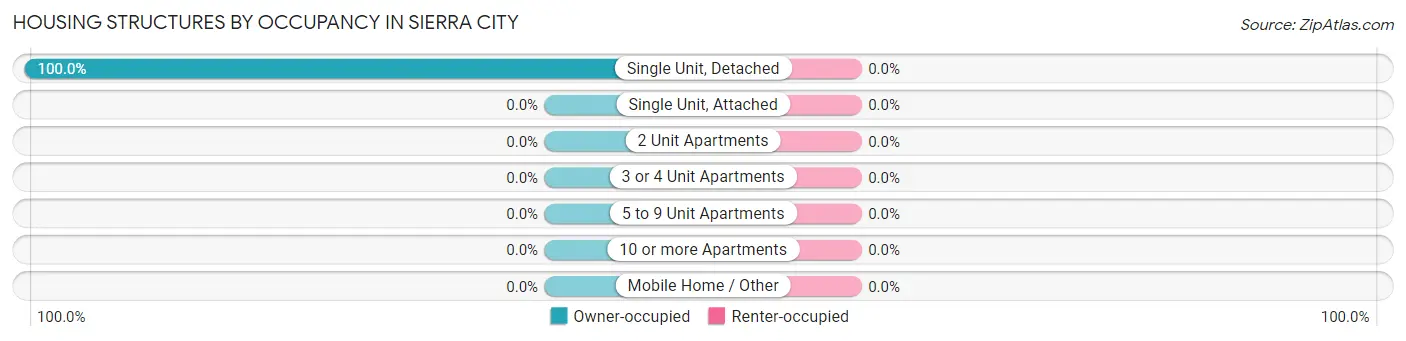
| Structure Type | Owner-occupied | Renter-occupied |
| Single Unit, Detached | 136 (100.0%) | 0 (0.0%) |
| Single Unit, Attached | 0 (0.0%) | 0 (0.0%) |
| 2 Unit Apartments | 0 (0.0%) | 0 (0.0%) |
| 3 or 4 Unit Apartments | 0 (0.0%) | 0 (0.0%) |
| 5 to 9 Unit Apartments | 0 (0.0%) | 0 (0.0%) |
| 10 or more Apartments | 0 (0.0%) | 0 (0.0%) |
| Mobile Home / Other | 0 (0.0%) | 0 (0.0%) |
| Total | 136 (100.0%) | 0 (0.0%) |
Housing Structures by Number of Rooms in Sierra City
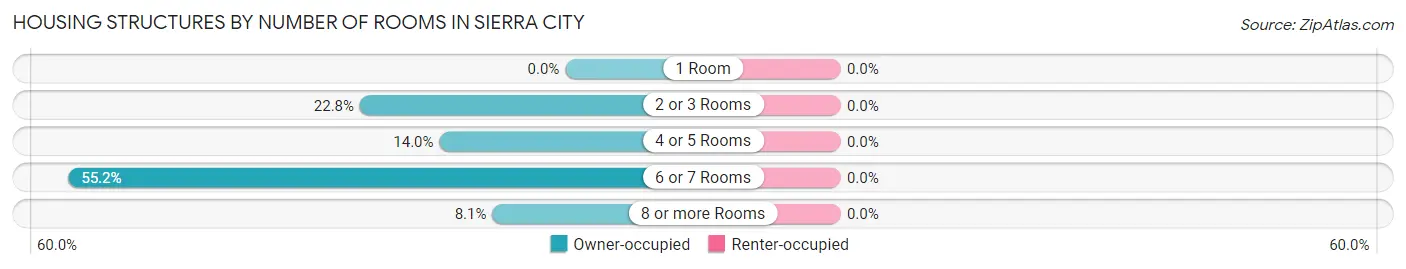
| Number of Rooms | Owner-occupied | Renter-occupied |
| 1 Room | 0 (0.0%) | 0 (0.0%) |
| 2 or 3 Rooms | 31 (22.8%) | 0 (0.0%) |
| 4 or 5 Rooms | 19 (14.0%) | 0 (0.0%) |
| 6 or 7 Rooms | 75 (55.1%) | 0 (0.0%) |
| 8 or more Rooms | 11 (8.1%) | 0 (0.0%) |
| Total | 136 (100.0%) | 0 (0.0%) |
Housing Structure by Heating Type in Sierra City
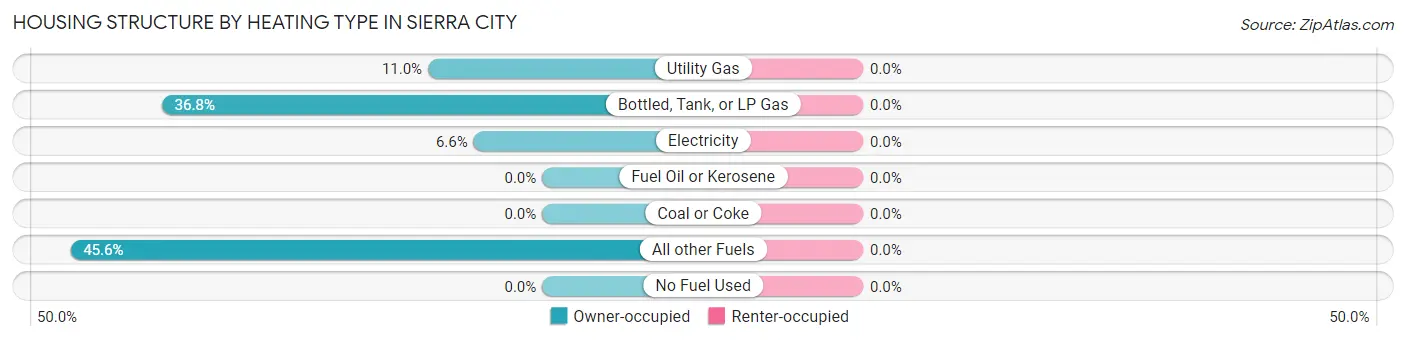
| Heating Type | Owner-occupied | Renter-occupied |
| Utility Gas | 15 (11.0%) | 0 (0.0%) |
| Bottled, Tank, or LP Gas | 50 (36.8%) | 0 (0.0%) |
| Electricity | 9 (6.6%) | 0 (0.0%) |
| Fuel Oil or Kerosene | 0 (0.0%) | 0 (0.0%) |
| Coal or Coke | 0 (0.0%) | 0 (0.0%) |
| All other Fuels | 62 (45.6%) | 0 (0.0%) |
| No Fuel Used | 0 (0.0%) | 0 (0.0%) |
| Total | 136 (100.0%) | 0 (0.0%) |
Household Vehicle Usage in Sierra City
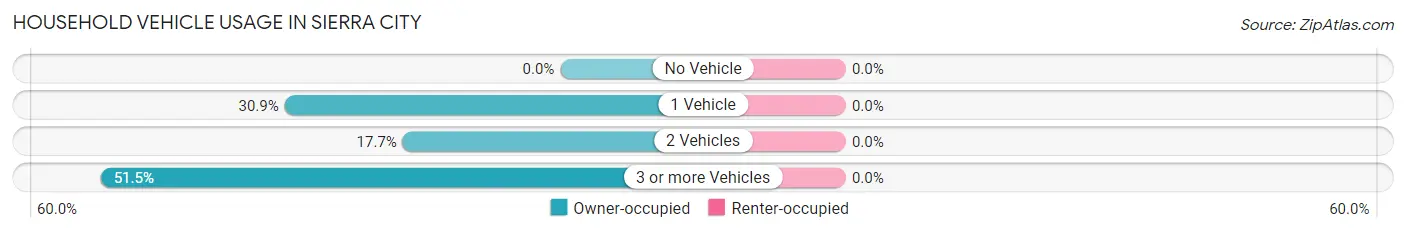
| Vehicles per Household | Owner-occupied | Renter-occupied |
| No Vehicle | 0 (0.0%) | 0 (0.0%) |
| 1 Vehicle | 42 (30.9%) | 0 (0.0%) |
| 2 Vehicles | 24 (17.6%) | 0 (0.0%) |
| 3 or more Vehicles | 70 (51.5%) | 0 (0.0%) |
| Total | 136 (100.0%) | 0 (0.0%) |
Real Estate & Mortgages in Sierra City
Real Estate and Mortgage Overview in Sierra City
| Characteristic | Without Mortgage | With Mortgage |
| Housing Units | 63 | 73 |
| Median Property Value | $378,800 | $405,200 |
| Median Household Income | $45,125 | $20 |
| Monthly Housing Costs | $721 | $9 |
| Real Estate Taxes | $2,038 | $0 |
Property Value by Mortgage Status in Sierra City
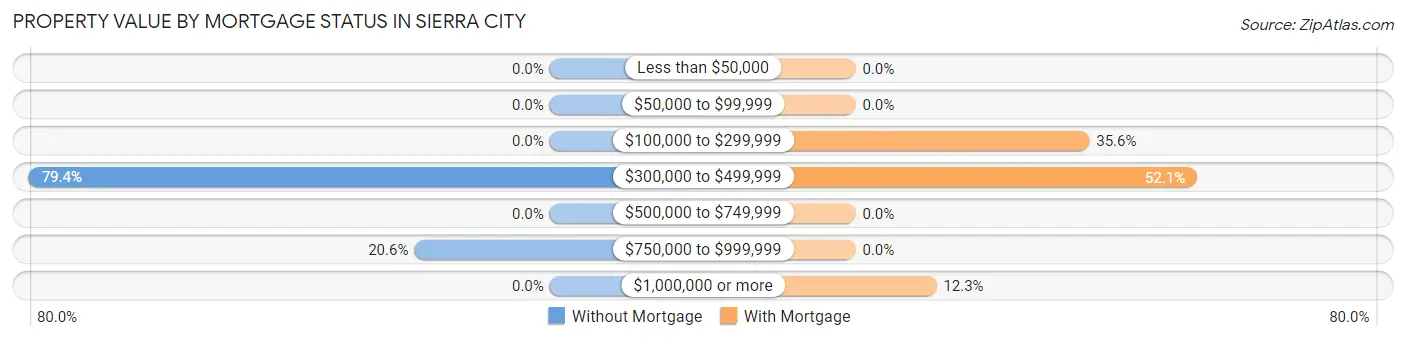
| Property Value | Without Mortgage | With Mortgage |
| Less than $50,000 | 0 (0.0%) | 0 (0.0%) |
| $50,000 to $99,999 | 0 (0.0%) | 0 (0.0%) |
| $100,000 to $299,999 | 0 (0.0%) | 26 (35.6%) |
| $300,000 to $499,999 | 50 (79.4%) | 38 (52.0%) |
| $500,000 to $749,999 | 0 (0.0%) | 0 (0.0%) |
| $750,000 to $999,999 | 13 (20.6%) | 0 (0.0%) |
| $1,000,000 or more | 0 (0.0%) | 9 (12.3%) |
| Total | 63 (100.0%) | 73 (100.0%) |
Household Income by Mortgage Status in Sierra City
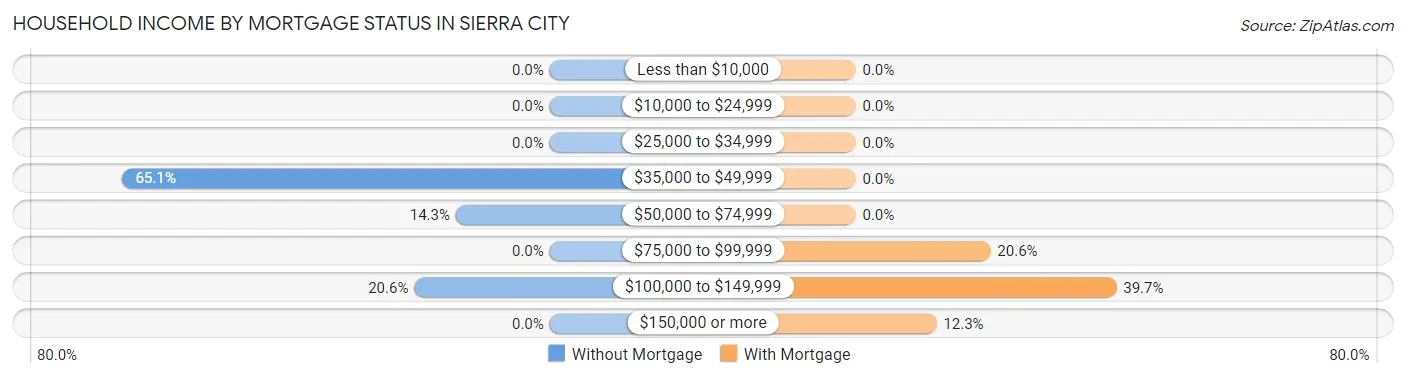
| Household Income | Without Mortgage | With Mortgage |
| Less than $10,000 | 0 (0.0%) | 0 (0.0%) |
| $10,000 to $24,999 | 0 (0.0%) | 0 (0.0%) |
| $25,000 to $34,999 | 0 (0.0%) | 0 (0.0%) |
| $35,000 to $49,999 | 41 (65.1%) | 0 (0.0%) |
| $50,000 to $74,999 | 9 (14.3%) | 0 (0.0%) |
| $75,000 to $99,999 | 0 (0.0%) | 15 (20.5%) |
| $100,000 to $149,999 | 13 (20.6%) | 29 (39.7%) |
| $150,000 or more | 0 (0.0%) | 9 (12.3%) |
| Total | 63 (100.0%) | 73 (100.0%) |
Property Value to Household Income Ratio in Sierra City
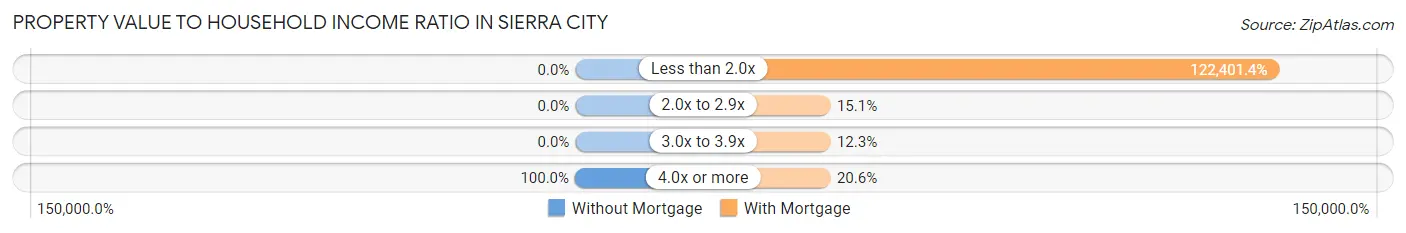
| Value-to-Income Ratio | Without Mortgage | With Mortgage |
| Less than 2.0x | 0 (0.0%) | 89,353 (122,401.4%) |
| 2.0x to 2.9x | 0 (0.0%) | 11 (15.1%) |
| 3.0x to 3.9x | 0 (0.0%) | 9 (12.3%) |
| 4.0x or more | 63 (100.0%) | 15 (20.5%) |
| Total | 63 (100.0%) | 73 (100.0%) |
Real Estate Taxes by Mortgage Status in Sierra City
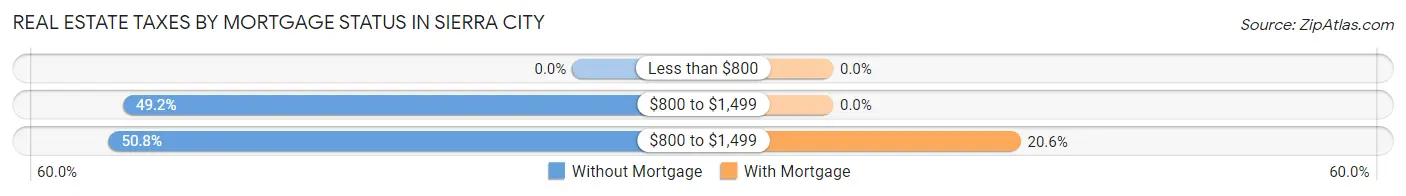
| Property Taxes | Without Mortgage | With Mortgage |
| Less than $800 | 0 (0.0%) | 0 (0.0%) |
| $800 to $1,499 | 31 (49.2%) | 0 (0.0%) |
| $800 to $1,499 | 32 (50.8%) | 15 (20.5%) |
| Total | 63 (100.0%) | 73 (100.0%) |
Health & Disability in Sierra City
Health Insurance Coverage by Age in Sierra City
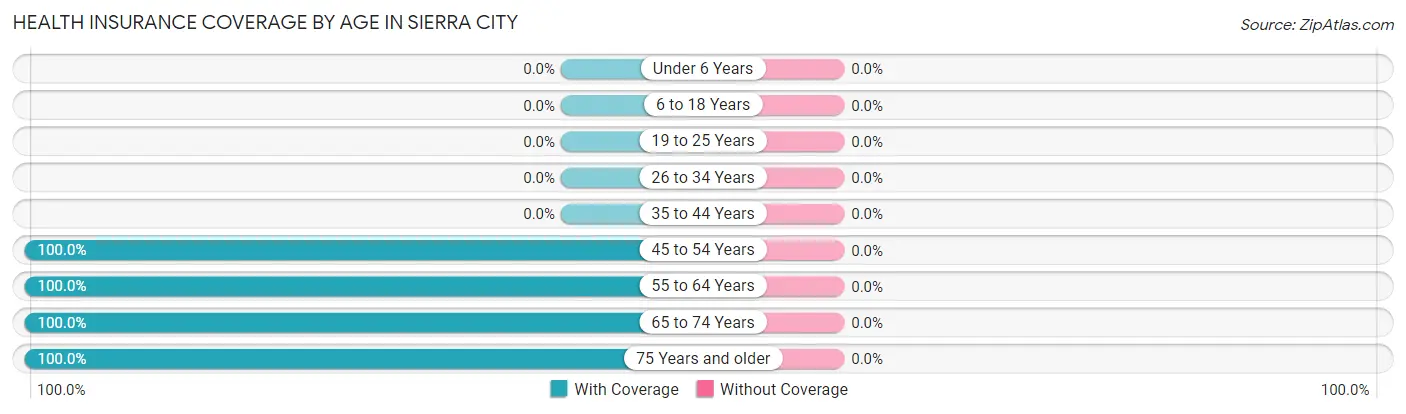
| Age Bracket | With Coverage | Without Coverage |
| Under 6 Years | 0 (0.0%) | 0 (0.0%) |
| 6 to 18 Years | 0 (0.0%) | 0 (0.0%) |
| 19 to 25 Years | 0 (0.0%) | 0 (0.0%) |
| 26 to 34 Years | 0 (0.0%) | 0 (0.0%) |
| 35 to 44 Years | 0 (0.0%) | 0 (0.0%) |
| 45 to 54 Years | 47 (100.0%) | 0 (0.0%) |
| 55 to 64 Years | 9 (100.0%) | 0 (0.0%) |
| 65 to 74 Years | 123 (100.0%) | 0 (0.0%) |
| 75 Years and older | 42 (100.0%) | 0 (0.0%) |
| Total | 221 (100.0%) | 0 (0.0%) |
Health Insurance Coverage by Citizenship Status in Sierra City
| Citizenship Status | With Coverage | Without Coverage |
| Native Born | 0 (0.0%) | 0 (0.0%) |
| Foreign Born, Citizen | 0 (0.0%) | 0 (0.0%) |
| Foreign Born, not a Citizen | 0 (0.0%) | 0 (0.0%) |
Health Insurance Coverage by Household Income in Sierra City
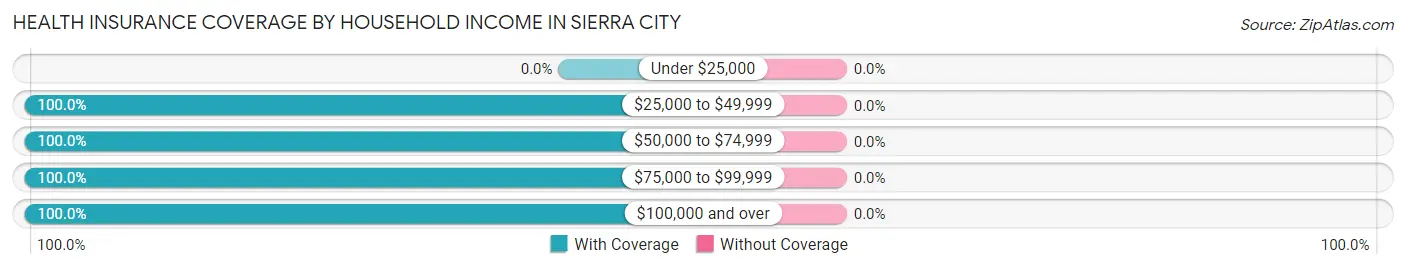
| Household Income | With Coverage | Without Coverage |
| Under $25,000 | 0 (0.0%) | 0 (0.0%) |
| $25,000 to $49,999 | 52 (100.0%) | 0 (0.0%) |
| $50,000 to $74,999 | 54 (100.0%) | 0 (0.0%) |
| $75,000 to $99,999 | 48 (100.0%) | 0 (0.0%) |
| $100,000 and over | 67 (100.0%) | 0 (0.0%) |
Public vs Private Health Insurance Coverage by Age in Sierra City
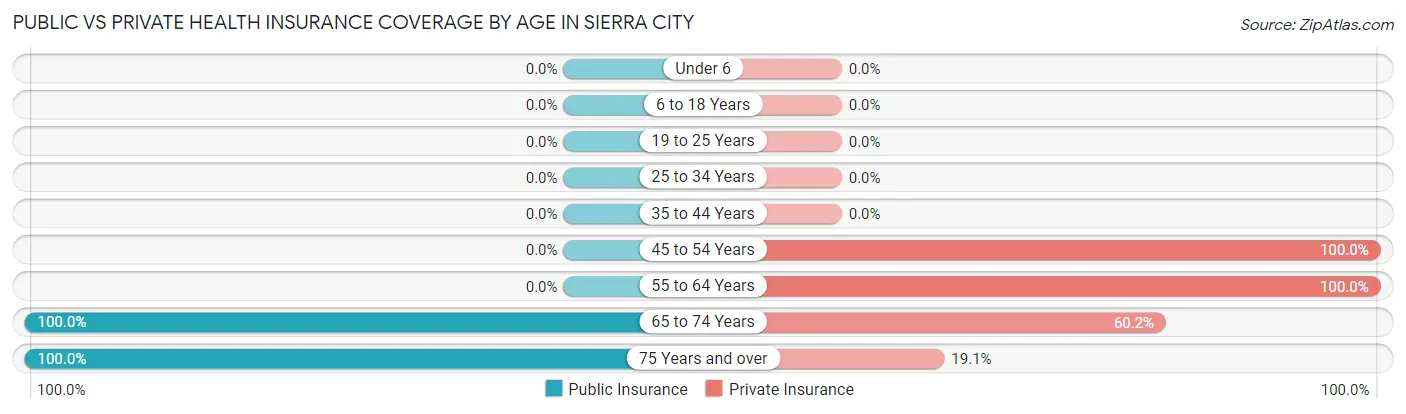
| Age Bracket | Public Insurance | Private Insurance |
| Under 6 | 0 (0.0%) | 0 (0.0%) |
| 6 to 18 Years | 0 (0.0%) | 0 (0.0%) |
| 19 to 25 Years | 0 (0.0%) | 0 (0.0%) |
| 25 to 34 Years | 0 (0.0%) | 0 (0.0%) |
| 35 to 44 Years | 0 (0.0%) | 0 (0.0%) |
| 45 to 54 Years | 0 (0.0%) | 47 (100.0%) |
| 55 to 64 Years | 0 (0.0%) | 9 (100.0%) |
| 65 to 74 Years | 123 (100.0%) | 74 (60.2%) |
| 75 Years and over | 42 (100.0%) | 8 (19.1%) |
| Total | 165 (74.7%) | 138 (62.4%) |
Disability Status by Sex by Age in Sierra City
| Age Bracket | Male | Female |
| Under 5 Years | 0 (0.0%) | 0 (0.0%) |
| 5 to 17 Years | 0 (0.0%) | 0 (0.0%) |
| 18 to 34 Years | 0 (0.0%) | 0 (0.0%) |
| 35 to 64 Years | 0 (0.0%) | 0 (0.0%) |
| 65 to 74 Years | 0 (0.0%) | 0 (0.0%) |
| 75 Years and over | 0 (0.0%) | 0 (0.0%) |
Disability Class by Sex by Age in Sierra City
Disability Class: Hearing Difficulty
| Age Bracket | Male | Female |
| Under 5 Years | 0 (0.0%) | 0 (0.0%) |
| 5 to 17 Years | 0 (0.0%) | 0 (0.0%) |
| 18 to 34 Years | 0 (0.0%) | 0 (0.0%) |
| 35 to 64 Years | 0 (0.0%) | 0 (0.0%) |
| 65 to 74 Years | 0 (0.0%) | 0 (0.0%) |
| 75 Years and over | 0 (0.0%) | 0 (0.0%) |
Disability Class: Vision Difficulty
| Age Bracket | Male | Female |
| Under 5 Years | 0 (0.0%) | 0 (0.0%) |
| 5 to 17 Years | 0 (0.0%) | 0 (0.0%) |
| 18 to 34 Years | 0 (0.0%) | 0 (0.0%) |
| 35 to 64 Years | 0 (0.0%) | 0 (0.0%) |
| 65 to 74 Years | 0 (0.0%) | 0 (0.0%) |
| 75 Years and over | 0 (0.0%) | 0 (0.0%) |
Disability Class: Cognitive Difficulty
| Age Bracket | Male | Female |
| 5 to 17 Years | 0 (0.0%) | 0 (0.0%) |
| 18 to 34 Years | 0 (0.0%) | 0 (0.0%) |
| 35 to 64 Years | 0 (0.0%) | 0 (0.0%) |
| 65 to 74 Years | 0 (0.0%) | 0 (0.0%) |
| 75 Years and over | 0 (0.0%) | 0 (0.0%) |
Disability Class: Ambulatory Difficulty
| Age Bracket | Male | Female |
| 5 to 17 Years | 0 (0.0%) | 0 (0.0%) |
| 18 to 34 Years | 0 (0.0%) | 0 (0.0%) |
| 35 to 64 Years | 0 (0.0%) | 0 (0.0%) |
| 65 to 74 Years | 0 (0.0%) | 0 (0.0%) |
| 75 Years and over | 0 (0.0%) | 0 (0.0%) |
Disability Class: Self-Care Difficulty
| Age Bracket | Male | Female |
| 5 to 17 Years | 0 (0.0%) | 0 (0.0%) |
| 18 to 34 Years | 0 (0.0%) | 0 (0.0%) |
| 35 to 64 Years | 0 (0.0%) | 0 (0.0%) |
| 65 to 74 Years | 0 (0.0%) | 0 (0.0%) |
| 75 Years and over | 0 (0.0%) | 0 (0.0%) |
Technology Access in Sierra City
Computing Device Access in Sierra City
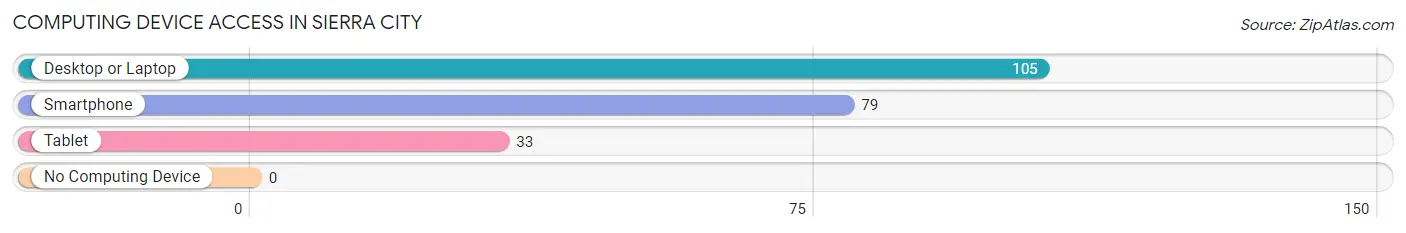
| Device Type | # Households | % Households |
| Desktop or Laptop | 105 | 77.2% |
| Smartphone | 79 | 58.1% |
| Tablet | 33 | 24.3% |
| No Computing Device | 0 | 0.0% |
| Total | 136 | 100.0% |
Internet Access in Sierra City
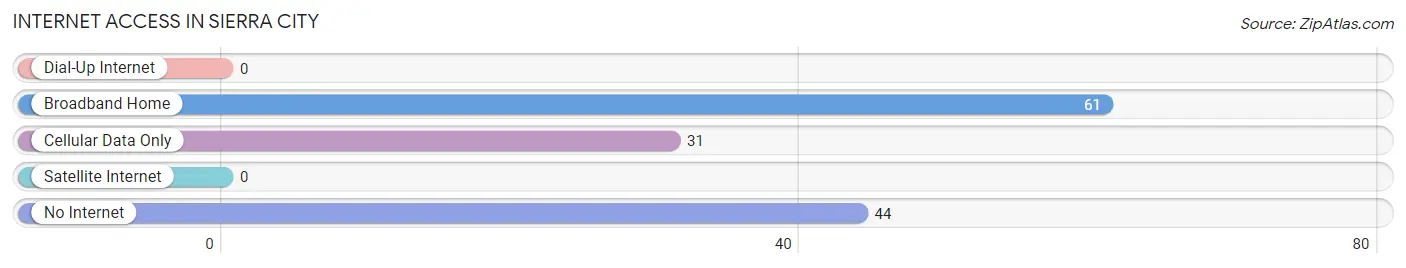
| Internet Type | # Households | % Households |
| Dial-Up Internet | 0 | 0.0% |
| Broadband Home | 61 | 44.9% |
| Cellular Data Only | 31 | 22.8% |
| Satellite Internet | 0 | 0.0% |
| No Internet | 44 | 32.4% |
| Total | 136 | 100.0% |
Sierra City Summary
Sierra City is a small town located in Sierra County, California, United States. It is situated in the Sierra Nevada Mountains, about 50 miles northeast of Sacramento. The town has a population of approximately 200 people and is a popular destination for outdoor recreation.
History
Sierra City was founded in 1852 by a group of miners who were searching for gold in the area. The town was originally called “Sierraville”, but the name was changed to Sierra City in 1854. The town was a major hub for the mining industry in the area, and it was also a popular stop for travelers on the California Trail.
In the late 19th century, Sierra City became a popular destination for tourists, and it was known for its hot springs and scenic beauty. The town was also home to a number of hotels and resorts, and it was a popular destination for fishing and hunting.
In the early 20th century, Sierra City began to decline as the mining industry in the area declined. The town was largely abandoned by the 1950s, but it has since seen a resurgence in popularity as a tourist destination.
Geography
Sierra City is located in the Sierra Nevada Mountains, about 50 miles northeast of Sacramento. The town is situated at an elevation of 4,000 feet, and it is surrounded by the Sierra National Forest. The town is located on the banks of the Yuba River, and it is close to several lakes, including Bullards Bar Reservoir and Lake Davis.
The climate in Sierra City is generally mild, with hot summers and cold winters. The average annual temperature is around 50 degrees Fahrenheit, and the average annual precipitation is around 20 inches.
Economy
The economy of Sierra City is largely based on tourism. The town is a popular destination for outdoor recreation, and it is home to several resorts and hotels. The town is also home to a number of restaurants and shops, and it is a popular destination for fishing and hunting.
Demographics
As of the 2010 census, Sierra City had a population of 200 people. The racial makeup of the town was 95.5% White, 0.5% African American, 0.5% Native American, 0.5% Asian, and 2.5% from other races. The median household income in Sierra City was $37,500, and the median family income was $41,250. The per capita income in Sierra City was $19,000.
Conclusion
Sierra City is a small town located in Sierra County, California, United States. It is situated in the Sierra Nevada Mountains, about 50 miles northeast of Sacramento. The town has a population of approximately 200 people and is a popular destination for outdoor recreation. The economy of Sierra City is largely based on tourism, and the town is home to several resorts and hotels. The racial makeup of the town is mostly White, with a small percentage of African American, Native American, and Asian residents. The median household income in Sierra City is $37,500, and the per capita income is $19,000.
Common Questions
What is the Total Population of Sierra City?
Total Population of Sierra City is 221.
What is the Total Male Population of Sierra City?
Total Male Population of Sierra City is 117.
What is the Total Female Population of Sierra City?
Total Female Population of Sierra City is 104.
What is the Ratio of Males per 100 Females in Sierra City?
There are 112.50 Males per 100 Females in Sierra City.
What is the Ratio of Females per 100 Males in Sierra City?
There are 88.89 Females per 100 Males in Sierra City.
What is the Median Population Age in Sierra City?
Median Population Age in Sierra City is 69.7 Years.
What is the Average Family Size in Sierra City
Average Family Size in Sierra City is 1.9 People.
What is the Average Household Size in Sierra City
Average Household Size in Sierra City is 1.6 People.
What is Per Capita Income in Sierra City?
Per Capita income in Sierra City is $55,934.
What is the Median Family Income in Sierra City?
Median Family Income in Sierra City is $88,534.
What is the Median Household income in Sierra City?
Median Household Income in Sierra City is $87,759.
What is Inequality or Gini Index in Sierra City?
Inequality or Gini Index in Sierra City is 0.29.
How Large is the Labor Force in Sierra City?
There are 95 People in the Labor Forcein in Sierra City.
What is the Percentage of People in the Labor Force in Sierra City?
43.0% of People are in the Labor Force in Sierra City.