Palo Alto, CA
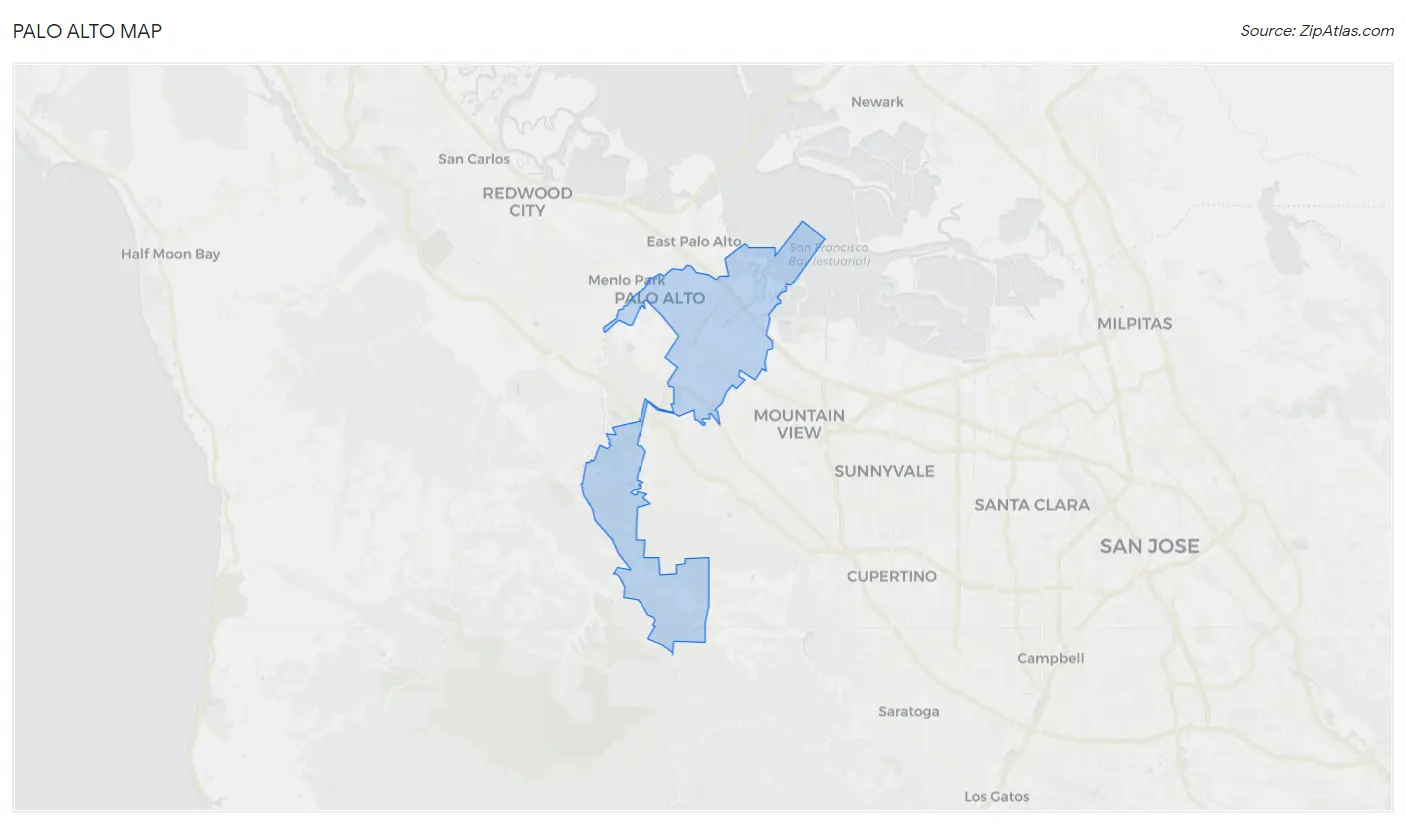
Palo Alto Map
Palo Alto Overview
67,901
TOTAL POPULATION
32,789
MALE POPULATION
35,112
FEMALE POPULATION
93.38
MALES / 100 FEMALES
107.08
FEMALES / 100 MALES
42.3
MEDIAN AGE
3.1
AVG FAMILY SIZE
2.6
AVG HOUSEHOLD SIZE
$117,476
PER CAPITA INCOME
$250,001
AVG FAMILY INCOME
$214,118
AVG HOUSEHOLD INCOME
44.0%
WAGE / INCOME GAP [ % ]
56.0¢/ $1
WAGE / INCOME GAP [ $ ]
$9,220
FAMILY INCOME DEFICIT
0.50
INEQUALITY / GINI INDEX
34,812
LABOR FORCE [ PEOPLE ]
63.4%
PERCENT IN LABOR FORCE
3.3%
UNEMPLOYMENT RATE
Palo Alto Area Codes
Race in Palo Alto
The most populous races in Palo Alto are White / Caucasian (34,588 | 50.9%), Asian (23,647 | 34.8%), and Two or more Races (6,064 | 8.9%).
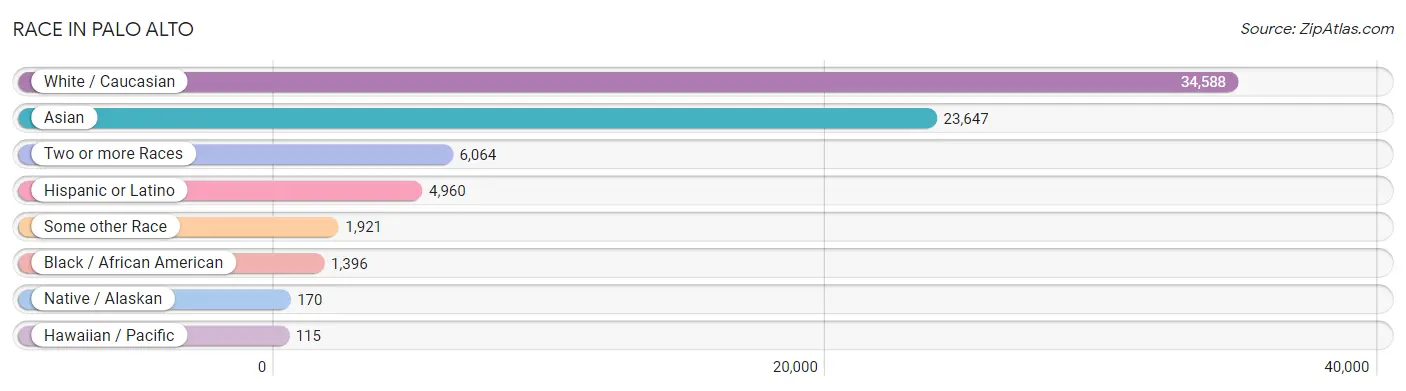
| Race | # Population | % Population |
| Asian | 23,647 | 34.8% |
| Black / African American | 1,396 | 2.1% |
| Hawaiian / Pacific | 115 | 0.2% |
| Hispanic or Latino | 4,960 | 7.3% |
| Native / Alaskan | 170 | 0.3% |
| White / Caucasian | 34,588 | 50.9% |
| Two or more Races | 6,064 | 8.9% |
| Some other Race | 1,921 | 2.8% |
| Total | 67,901 | 100.0% |
Ancestry in Palo Alto
The most populous ancestries reported in Palo Alto are Indian (Asian) (14,573 | 21.5%), English (6,502 | 9.6%), German (6,025 | 8.9%), Thai (4,903 | 7.2%), and Irish (4,271 | 6.3%), together accounting for 53.4% of all Palo Alto residents.
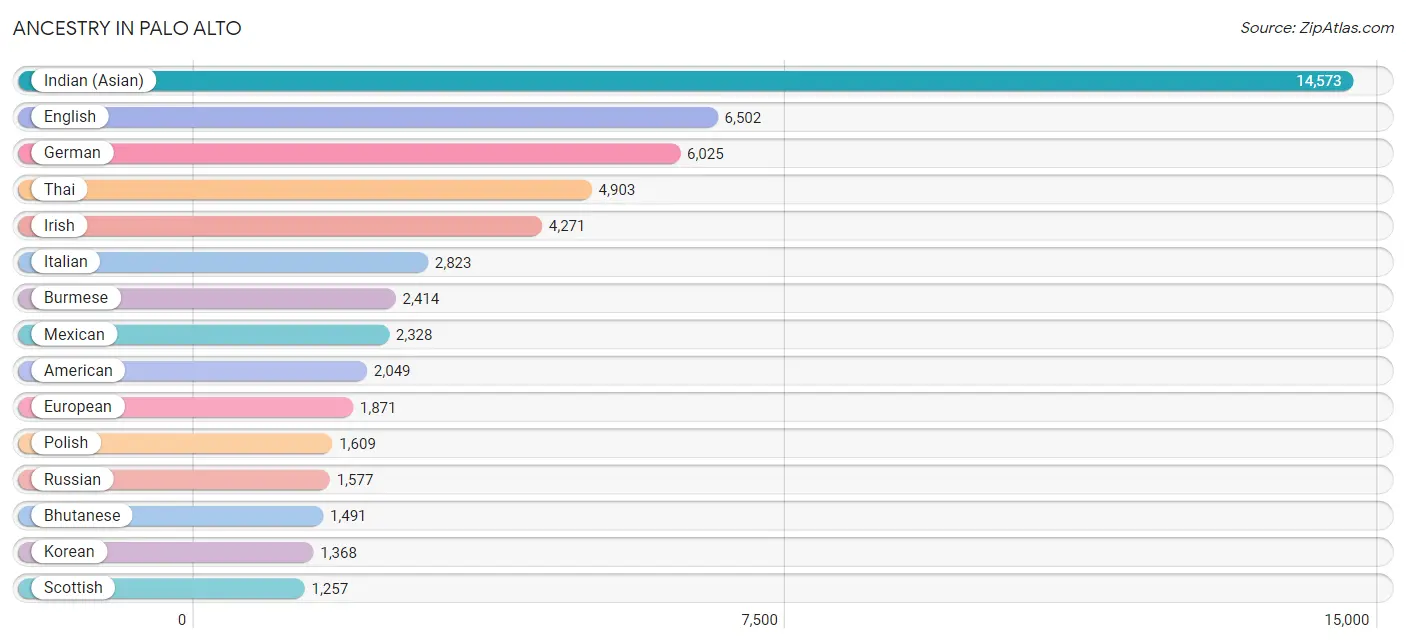
| Ancestry | # Population | % Population |
| African | 45 | 0.1% |
| Alsatian | 18 | 0.0% |
| American | 2,049 | 3.0% |
| Apache | 5 | 0.0% |
| Arab | 809 | 1.2% |
| Argentinean | 226 | 0.3% |
| Armenian | 142 | 0.2% |
| Assyrian / Chaldean / Syriac | 22 | 0.0% |
| Australian | 73 | 0.1% |
| Austrian | 279 | 0.4% |
| Bahamian | 43 | 0.1% |
| Bangladeshi | 71 | 0.1% |
| Barbadian | 3 | 0.0% |
| Basque | 10 | 0.0% |
| Belgian | 101 | 0.2% |
| Bhutanese | 1,491 | 2.2% |
| Bolivian | 45 | 0.1% |
| Brazilian | 121 | 0.2% |
| British | 641 | 0.9% |
| Bulgarian | 83 | 0.1% |
| Burmese | 2,414 | 3.6% |
| Canadian | 231 | 0.3% |
| Celtic | 13 | 0.0% |
| Central American | 1,048 | 1.5% |
| Central American Indian | 59 | 0.1% |
| Cherokee | 41 | 0.1% |
| Chilean | 28 | 0.0% |
| Chippewa | 9 | 0.0% |
| Choctaw | 18 | 0.0% |
| Colombian | 110 | 0.2% |
| Comanche | 17 | 0.0% |
| Croatian | 49 | 0.1% |
| Cuban | 157 | 0.2% |
| Czech | 291 | 0.4% |
| Czechoslovakian | 25 | 0.0% |
| Danish | 431 | 0.6% |
| Dominican | 20 | 0.0% |
| Dutch | 626 | 0.9% |
| Eastern European | 391 | 0.6% |
| Ecuadorian | 18 | 0.0% |
| Egyptian | 48 | 0.1% |
| English | 6,502 | 9.6% |
| Estonian | 32 | 0.1% |
| European | 1,871 | 2.8% |
| Filipino | 996 | 1.5% |
| Finnish | 98 | 0.1% |
| French | 1,170 | 1.7% |
| French Canadian | 277 | 0.4% |
| German | 6,025 | 8.9% |
| Ghanaian | 16 | 0.0% |
| Greek | 372 | 0.5% |
| Guatemalan | 722 | 1.1% |
| Haitian | 10 | 0.0% |
| Honduran | 9 | 0.0% |
| Hungarian | 334 | 0.5% |
| Icelander | 89 | 0.1% |
| Indian (Asian) | 14,573 | 21.5% |
| Iranian | 865 | 1.3% |
| Iraqi | 290 | 0.4% |
| Irish | 4,271 | 6.3% |
| Israeli | 305 | 0.4% |
| Italian | 2,823 | 4.2% |
| Jamaican | 70 | 0.1% |
| Japanese | 140 | 0.2% |
| Jordanian | 37 | 0.1% |
| Kenyan | 5 | 0.0% |
| Korean | 1,368 | 2.0% |
| Laotian | 236 | 0.4% |
| Latvian | 46 | 0.1% |
| Lebanese | 128 | 0.2% |
| Lithuanian | 298 | 0.4% |
| Malaysian | 69 | 0.1% |
| Mexican | 2,328 | 3.4% |
| Mexican American Indian | 105 | 0.2% |
| Mongolian | 84 | 0.1% |
| Moroccan | 20 | 0.0% |
| Native Hawaiian | 297 | 0.4% |
| New Zealander | 32 | 0.1% |
| Nicaraguan | 80 | 0.1% |
| Nigerian | 13 | 0.0% |
| Northern European | 248 | 0.4% |
| Norwegian | 1,246 | 1.8% |
| Okinawan | 82 | 0.1% |
| Pakistani | 165 | 0.2% |
| Panamanian | 98 | 0.1% |
| Peruvian | 150 | 0.2% |
| Polish | 1,609 | 2.4% |
| Portuguese | 443 | 0.6% |
| Potawatomi | 32 | 0.1% |
| Puerto Rican | 50 | 0.1% |
| Romanian | 278 | 0.4% |
| Russian | 1,577 | 2.3% |
| Salvadoran | 139 | 0.2% |
| Samoan | 73 | 0.1% |
| Scandinavian | 269 | 0.4% |
| Scotch-Irish | 467 | 0.7% |
| Scottish | 1,257 | 1.8% |
| Serbian | 113 | 0.2% |
| Sioux | 5 | 0.0% |
| Slavic | 7 | 0.0% |
| Slovak | 139 | 0.2% |
| Slovene | 39 | 0.1% |
| South African | 53 | 0.1% |
| South American | 832 | 1.2% |
| South American Indian | 32 | 0.1% |
| Spaniard | 282 | 0.4% |
| Spanish | 105 | 0.2% |
| Sri Lankan | 633 | 0.9% |
| Subsaharan African | 132 | 0.2% |
| Swedish | 1,201 | 1.8% |
| Swiss | 703 | 1.0% |
| Syrian | 52 | 0.1% |
| Thai | 4,903 | 7.2% |
| Tongan | 28 | 0.0% |
| Turkish | 131 | 0.2% |
| Ukrainian | 469 | 0.7% |
| Venezuelan | 255 | 0.4% |
| Welsh | 253 | 0.4% |
| West Indian | 34 | 0.1% |
| Yugoslavian | 48 | 0.1% | View All 120 Rows |
Immigrants in Palo Alto
The most numerous immigrant groups reported in Palo Alto came from Asia (14,957 | 22.0%), Eastern Asia (9,679 | 14.2%), China (7,747 | 11.4%), Europe (4,879 | 7.2%), and South Central Asia (3,446 | 5.1%), together accounting for 60.0% of all Palo Alto residents.
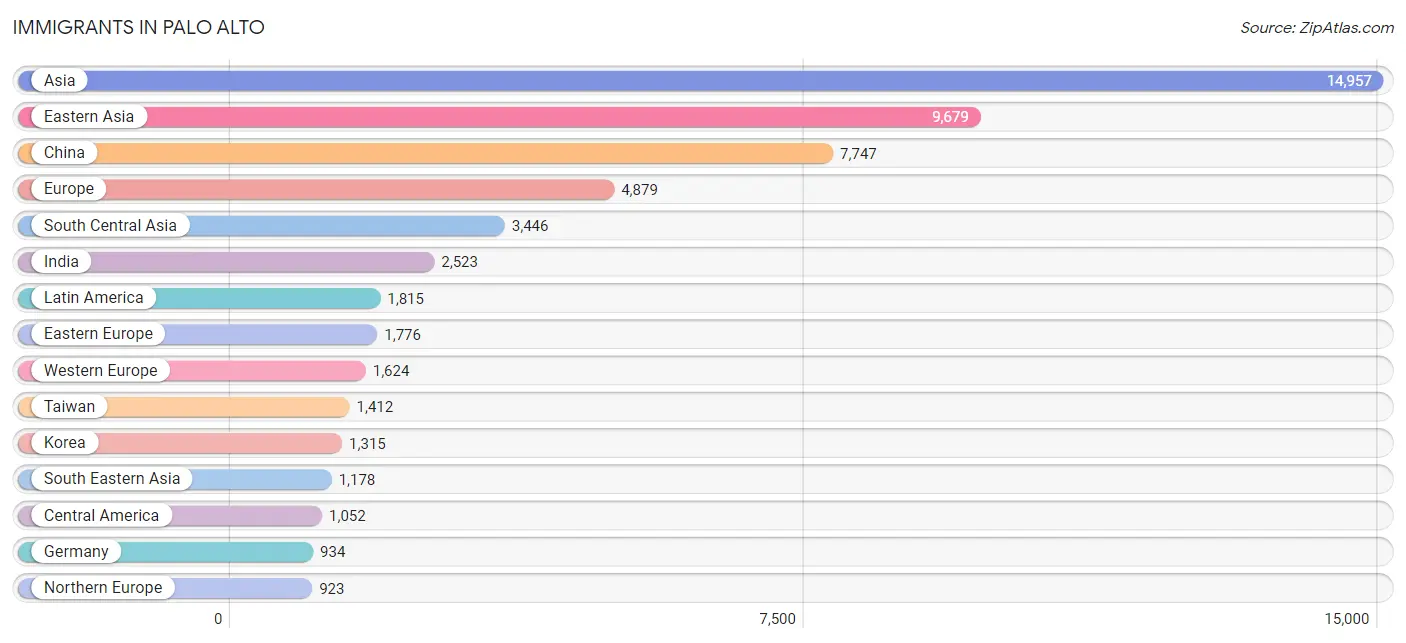
| Immigration Origin | # Population | % Population |
| Africa | 428 | 0.6% |
| Argentina | 120 | 0.2% |
| Asia | 14,957 | 22.0% |
| Australia | 262 | 0.4% |
| Austria | 32 | 0.1% |
| Belarus | 28 | 0.0% |
| Belgium | 35 | 0.1% |
| Belize | 5 | 0.0% |
| Bolivia | 7 | 0.0% |
| Bosnia and Herzegovina | 21 | 0.0% |
| Brazil | 242 | 0.4% |
| Bulgaria | 49 | 0.1% |
| Cambodia | 7 | 0.0% |
| Canada | 830 | 1.2% |
| Caribbean | 78 | 0.1% |
| Central America | 1,052 | 1.5% |
| Chile | 19 | 0.0% |
| China | 7,747 | 11.4% |
| Colombia | 49 | 0.1% |
| Croatia | 3 | 0.0% |
| Cuba | 11 | 0.0% |
| Czechoslovakia | 46 | 0.1% |
| Denmark | 43 | 0.1% |
| Dominica | 15 | 0.0% |
| Eastern Asia | 9,679 | 14.2% |
| Eastern Europe | 1,776 | 2.6% |
| Ecuador | 18 | 0.0% |
| Egypt | 64 | 0.1% |
| El Salvador | 71 | 0.1% |
| England | 124 | 0.2% |
| Europe | 4,879 | 7.2% |
| Fiji | 7 | 0.0% |
| France | 266 | 0.4% |
| Germany | 934 | 1.4% |
| Greece | 138 | 0.2% |
| Guatemala | 303 | 0.4% |
| Haiti | 10 | 0.0% |
| Honduras | 15 | 0.0% |
| Hong Kong | 819 | 1.2% |
| Hungary | 64 | 0.1% |
| India | 2,523 | 3.7% |
| Indonesia | 66 | 0.1% |
| Iran | 645 | 0.9% |
| Iraq | 25 | 0.0% |
| Ireland | 93 | 0.1% |
| Israel | 282 | 0.4% |
| Italy | 150 | 0.2% |
| Jamaica | 13 | 0.0% |
| Japan | 617 | 0.9% |
| Jordan | 35 | 0.1% |
| Kazakhstan | 35 | 0.1% |
| Korea | 1,315 | 1.9% |
| Kuwait | 7 | 0.0% |
| Latin America | 1,815 | 2.7% |
| Lebanon | 72 | 0.1% |
| Lithuania | 33 | 0.1% |
| Malaysia | 126 | 0.2% |
| Mexico | 590 | 0.9% |
| Moldova | 10 | 0.0% |
| Morocco | 8 | 0.0% |
| Nepal | 14 | 0.0% |
| Netherlands | 92 | 0.1% |
| Nicaragua | 43 | 0.1% |
| Nigeria | 127 | 0.2% |
| Northern Africa | 110 | 0.2% |
| Northern Europe | 923 | 1.4% |
| Norway | 26 | 0.0% |
| Oceania | 338 | 0.5% |
| Pakistan | 135 | 0.2% |
| Panama | 25 | 0.0% |
| Peru | 113 | 0.2% |
| Philippines | 410 | 0.6% |
| Poland | 249 | 0.4% |
| Portugal | 72 | 0.1% |
| Romania | 87 | 0.1% |
| Russia | 677 | 1.0% |
| Saudi Arabia | 18 | 0.0% |
| Scotland | 13 | 0.0% |
| Serbia | 79 | 0.1% |
| Singapore | 200 | 0.3% |
| South Africa | 149 | 0.2% |
| South America | 685 | 1.0% |
| South Central Asia | 3,446 | 5.1% |
| South Eastern Asia | 1,178 | 1.7% |
| Southern Europe | 538 | 0.8% |
| Spain | 171 | 0.3% |
| Sri Lanka | 76 | 0.1% |
| Sweden | 177 | 0.3% |
| Switzerland | 265 | 0.4% |
| Taiwan | 1,412 | 2.1% |
| Thailand | 44 | 0.1% |
| Trinidad and Tobago | 14 | 0.0% |
| Turkey | 93 | 0.1% |
| Ukraine | 323 | 0.5% |
| Uzbekistan | 18 | 0.0% |
| Venezuela | 117 | 0.2% |
| Vietnam | 309 | 0.5% |
| Western Africa | 139 | 0.2% |
| Western Asia | 560 | 0.8% |
| Western Europe | 1,624 | 2.4% | View All 100 Rows |
Sex and Age in Palo Alto
Sex and Age in Palo Alto
The most populous age groups in Palo Alto are 45 to 49 Years (2,531 | 7.7%) for men and 50 to 54 Years (2,630 | 7.5%) for women.
| Age Bracket | Male | Female |
| Under 5 Years | 1,369 (4.2%) | 1,881 (5.4%) |
| 5 to 9 Years | 2,038 (6.2%) | 1,627 (4.6%) |
| 10 to 14 Years | 2,389 (7.3%) | 2,521 (7.2%) |
| 15 to 19 Years | 2,302 (7.0%) | 2,354 (6.7%) |
| 20 to 24 Years | 1,747 (5.3%) | 1,438 (4.1%) |
| 25 to 29 Years | 2,129 (6.5%) | 1,836 (5.2%) |
| 30 to 34 Years | 1,952 (5.9%) | 1,890 (5.4%) |
| 35 to 39 Years | 1,963 (6.0%) | 2,182 (6.2%) |
| 40 to 44 Years | 2,103 (6.4%) | 2,246 (6.4%) |
| 45 to 49 Years | 2,531 (7.7%) | 2,301 (6.6%) |
| 50 to 54 Years | 2,486 (7.6%) | 2,630 (7.5%) |
| 55 to 59 Years | 2,426 (7.4%) | 2,493 (7.1%) |
| 60 to 64 Years | 1,891 (5.8%) | 2,092 (6.0%) |
| 65 to 69 Years | 1,571 (4.8%) | 1,619 (4.6%) |
| 70 to 74 Years | 1,140 (3.5%) | 1,451 (4.1%) |
| 75 to 79 Years | 938 (2.9%) | 1,286 (3.7%) |
| 80 to 84 Years | 829 (2.5%) | 1,206 (3.4%) |
| 85 Years and over | 985 (3.0%) | 2,059 (5.9%) |
| Total | 32,789 (100.0%) | 35,112 (100.0%) |
Families and Households in Palo Alto
Median Family Size in Palo Alto
The median family size in Palo Alto is 3.14 persons per family, with married-couple families (14,974 | 85.5%) accounting for the largest median family size of 3.2 persons per family. On the other hand, single male/father families (724 | 4.1%) represent the smallest median family size with 2.75 persons per family.

| Family Type | # Families | Family Size |
| Married-Couple | 14,974 (85.5%) | 3.20 |
| Single Male/Father | 724 (4.1%) | 2.75 |
| Single Female/Mother | 1,820 (10.4%) | 2.81 |
| Total Families | 17,518 (100.0%) | 3.14 |
Median Household Size in Palo Alto
The median household size in Palo Alto is 2.58 persons per household, with married-couple households (14,974 | 57.5%) accounting for the largest median household size of 3.23 persons per household. non-family households (8,546 | 32.8%) represent the smallest median household size with 1.31 persons per household.
| Household Type | # Households | Household Size |
| Married-Couple | 14,974 (57.5%) | 3.23 |
| Single Male/Father | 724 (2.8%) | 3.02 |
| Single Female/Mother | 1,820 (7.0%) | 2.95 |
| Non-family | 8,546 (32.8%) | 1.31 |
| Total Households | 26,064 (100.0%) | 2.58 |
Household Size by Marriage Status in Palo Alto
Out of a total of 26,064 households in Palo Alto, 17,518 (67.2%) are family households, while 8,546 (32.8%) are nonfamily households. The most numerous type of family households are 2-person households, comprising 7,056, and the most common type of nonfamily households are 1-person households, comprising 6,479.
| Household Size | Family Households | Nonfamily Households |
| 1-Person Households | - | 6,479 (24.9%) |
| 2-Person Households | 7,056 (27.1%) | 1,826 (7.0%) |
| 3-Person Households | 4,453 (17.1%) | 119 (0.5%) |
| 4-Person Households | 4,101 (15.7%) | 115 (0.4%) |
| 5-Person Households | 1,503 (5.8%) | 0 (0.0%) |
| 6-Person Households | 302 (1.2%) | 0 (0.0%) |
| 7+ Person Households | 103 (0.4%) | 7 (0.0%) |
| Total | 17,518 (67.2%) | 8,546 (32.8%) |
Female Fertility in Palo Alto
Fertility by Age in Palo Alto
Average fertility rate in Palo Alto is 35.0 births per 1,000 women. Women in the age bracket of 35 to 50 years have the highest fertility rate with 44.0 births per 1,000 women. Women in the age bracket of 35 to 50 years acount for 61.4% of all women with births.
| Age Bracket | Women with Births | Births / 1,000 Women |
| 15 to 19 years | 0 (0.0%) | 0.0 |
| 20 to 34 years | 201 (38.7%) | 39.0 |
| 35 to 50 years | 319 (61.4%) | 44.0 |
| Total | 520 (100.0%) | 35.0 |
Fertility by Age by Marriage Status in Palo Alto
99.6% of women with births (520) in Palo Alto are married. The highest percentage of unmarried women with births falls into 20 to 34 years age bracket with 1.0% of them unmarried at the time of birth, while the lowest percentage of unmarried women with births belong to 35 to 50 years age bracket with 0.0% of them unmarried.
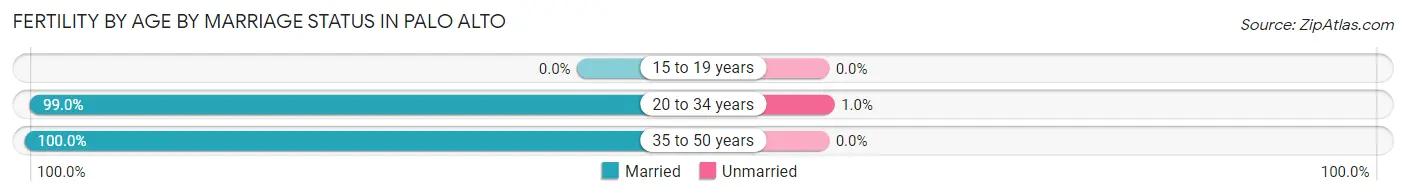
| Age Bracket | Married | Unmarried |
| 15 to 19 years | 0 (0.0%) | 0 (0.0%) |
| 20 to 34 years | 199 (99.0%) | 2 (1.0%) |
| 35 to 50 years | 319 (100.0%) | 0 (0.0%) |
| Total | 518 (99.6%) | 2 (0.4%) |
Fertility by Education in Palo Alto
Average fertility rate in Palo Alto is 35.0 births per 1,000 women. Women with the education attainment of graduate degree have the highest fertility rate of 48.0 births per 1,000 women, while women with the education attainment of high school diploma have the lowest fertility at 3.0 births per 1,000 women. Women with the education attainment of graduate degree represent 58.7% of all women with births.
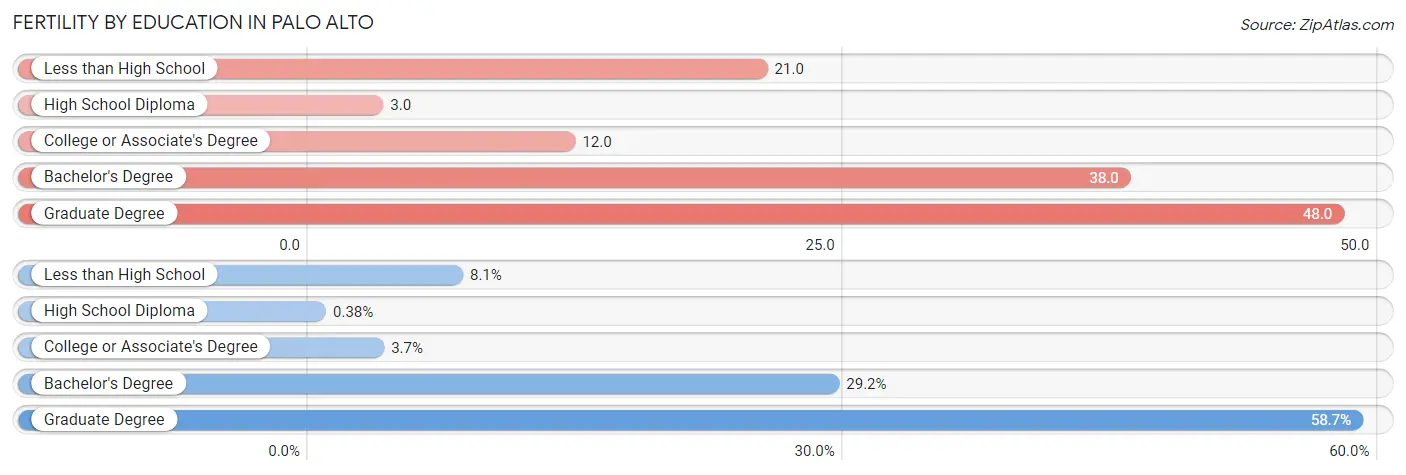
| Educational Attainment | Women with Births | Births / 1,000 Women |
| Less than High School | 42 (8.1%) | 21.0 |
| High School Diploma | 2 (0.4%) | 3.0 |
| College or Associate's Degree | 19 (3.6%) | 12.0 |
| Bachelor's Degree | 152 (29.2%) | 38.0 |
| Graduate Degree | 305 (58.7%) | 48.0 |
| Total | 520 (100.0%) | 35.0 |
Fertility by Education by Marriage Status in Palo Alto
0.4% of women with births in Palo Alto are unmarried. Women with the educational attainment of less than high school are most likely to be married with 100.0% of them married at childbirth, while women with the educational attainment of high school diploma are least likely to be married with 100.0% of them unmarried at childbirth.
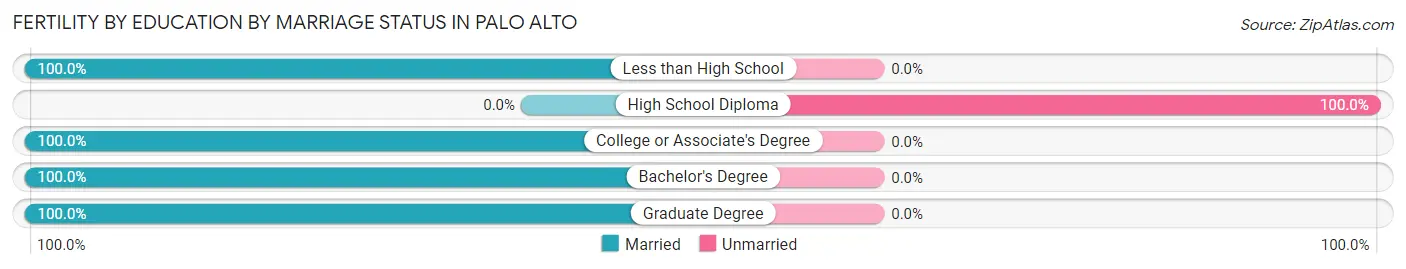
| Educational Attainment | Married | Unmarried |
| Less than High School | 42 (100.0%) | 0 (0.0%) |
| High School Diploma | 0 (0.0%) | 2 (100.0%) |
| College or Associate's Degree | 19 (100.0%) | 0 (0.0%) |
| Bachelor's Degree | 152 (100.0%) | 0 (0.0%) |
| Graduate Degree | 305 (100.0%) | 0 (0.0%) |
| Total | 518 (99.6%) | 2 (0.4%) |
Income in Palo Alto
Income Overview in Palo Alto
Per Capita Income in Palo Alto is $117,476, while median incomes of families and households are $250,001 and $214,118 respectively.
| Characteristic | Number | Measure |
| Per Capita Income | 67,901 | $117,476 |
| Median Family Income | 17,518 | $250,001 |
| Mean Family Income | 17,518 | $355,793 |
| Median Household Income | 26,064 | $214,118 |
| Mean Household Income | 26,064 | $301,226 |
| Income Deficit | 17,518 | $9,220 |
| Wage / Income Gap (%) | 67,901 | 44.05% |
| Wage / Income Gap ($) | 67,901 | 55.95¢ per $1 |
| Gini / Inequality Index | 67,901 | 0.50 |
Earnings by Sex in Palo Alto
Average Earnings in Palo Alto are $119,009, $147,919 for men and $82,767 for women, a difference of 44.1%.
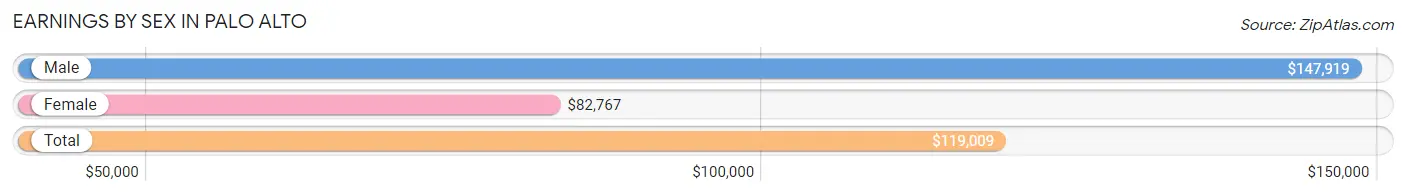
| Sex | Number | Average Earnings |
| Male | 19,622 (53.6%) | $147,919 |
| Female | 17,008 (46.4%) | $82,767 |
| Total | 36,630 (100.0%) | $119,009 |
Earnings by Sex by Income Bracket in Palo Alto
The most common earnings brackets in Palo Alto are $100,000+ for men (12,471 | 63.6%) and $100,000+ for women (7,758 | 45.6%).
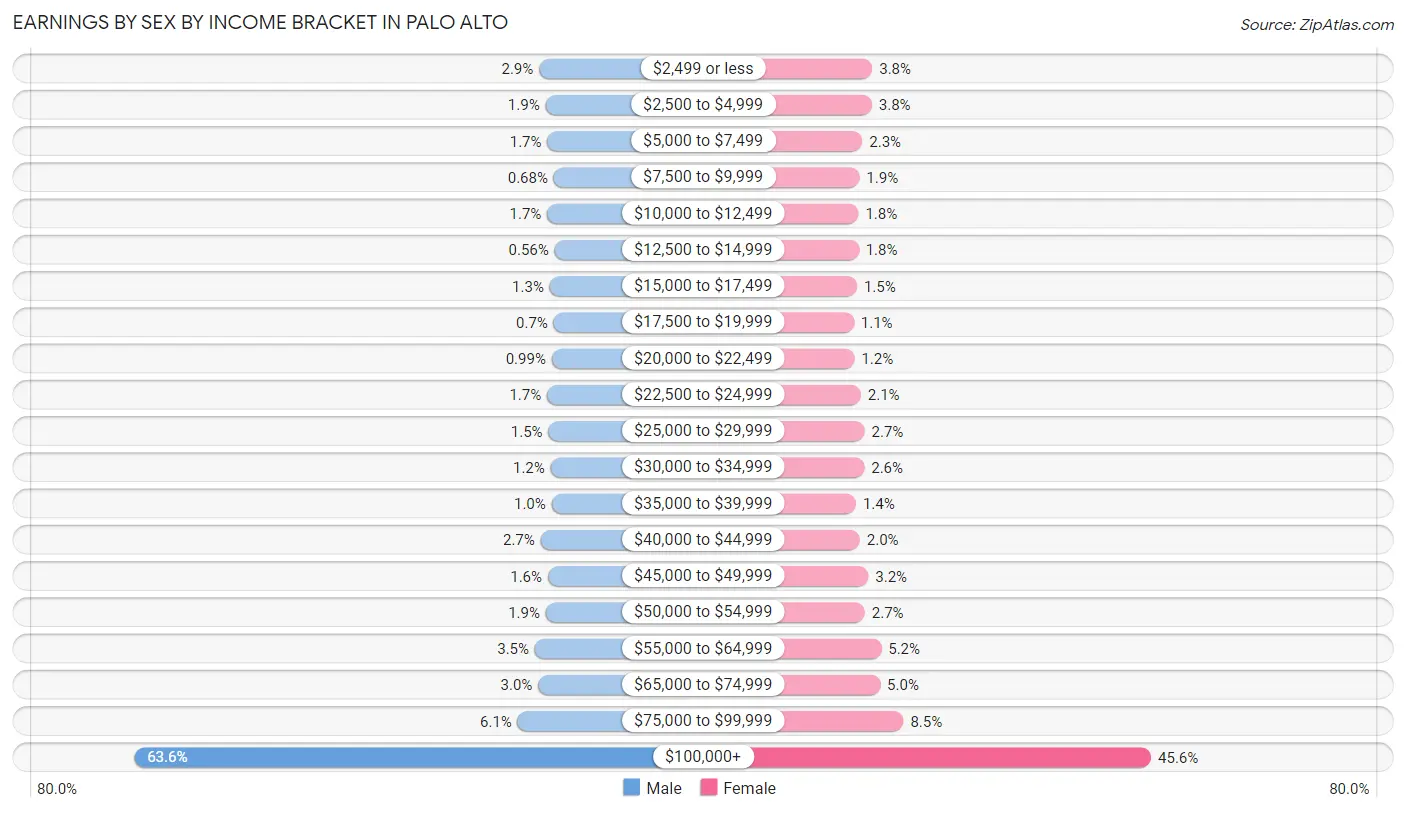
| Income | Male | Female |
| $2,499 or less | 566 (2.9%) | 649 (3.8%) |
| $2,500 to $4,999 | 379 (1.9%) | 637 (3.7%) |
| $5,000 to $7,499 | 323 (1.7%) | 397 (2.3%) |
| $7,500 to $9,999 | 133 (0.7%) | 322 (1.9%) |
| $10,000 to $12,499 | 328 (1.7%) | 297 (1.8%) |
| $12,500 to $14,999 | 110 (0.6%) | 303 (1.8%) |
| $15,000 to $17,499 | 254 (1.3%) | 260 (1.5%) |
| $17,500 to $19,999 | 138 (0.7%) | 180 (1.1%) |
| $20,000 to $22,499 | 194 (1.0%) | 195 (1.1%) |
| $22,500 to $24,999 | 331 (1.7%) | 359 (2.1%) |
| $25,000 to $29,999 | 292 (1.5%) | 454 (2.7%) |
| $30,000 to $34,999 | 228 (1.2%) | 445 (2.6%) |
| $35,000 to $39,999 | 198 (1.0%) | 235 (1.4%) |
| $40,000 to $44,999 | 521 (2.7%) | 334 (2.0%) |
| $45,000 to $49,999 | 308 (1.6%) | 549 (3.2%) |
| $50,000 to $54,999 | 369 (1.9%) | 459 (2.7%) |
| $55,000 to $64,999 | 690 (3.5%) | 880 (5.2%) |
| $65,000 to $74,999 | 592 (3.0%) | 851 (5.0%) |
| $75,000 to $99,999 | 1,197 (6.1%) | 1,444 (8.5%) |
| $100,000+ | 12,471 (63.6%) | 7,758 (45.6%) |
| Total | 19,622 (100.0%) | 17,008 (100.0%) |
Earnings by Sex by Educational Attainment in Palo Alto
Average earnings in Palo Alto are $168,378 for men and $100,417 for women, a difference of 40.4%. Men with an educational attainment of graduate degree enjoy the highest average annual earnings of $204,145, while those with less than high school education earn the least with $42,042. Women with an educational attainment of graduate degree earn the most with the average annual earnings of $135,980, while those with high school diploma education have the smallest earnings of $23,481.
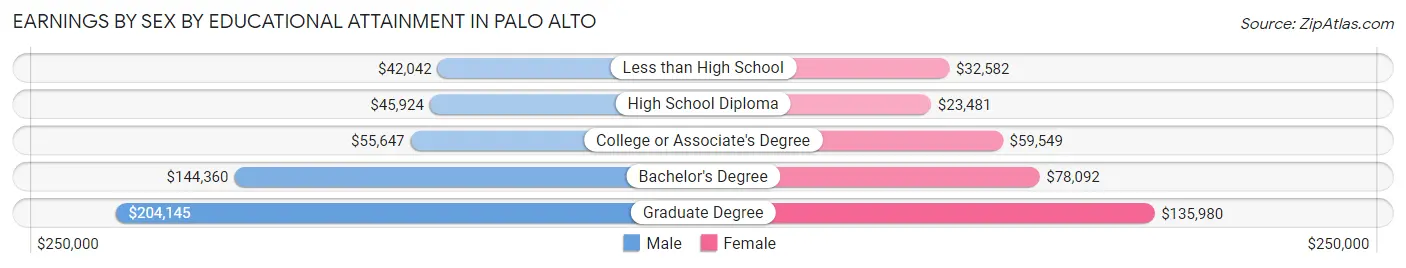
| Educational Attainment | Male Income | Female Income |
| Less than High School | $42,042 | $32,582 |
| High School Diploma | $45,924 | $23,481 |
| College or Associate's Degree | $55,647 | $59,549 |
| Bachelor's Degree | $144,360 | $78,092 |
| Graduate Degree | $204,145 | $135,980 |
| Total | $168,378 | $100,417 |
Family Income in Palo Alto
Family Income Brackets in Palo Alto
According to the Palo Alto family income data, there are 10,844 families falling into the $200,000+ income range, which is the most common income bracket and makes up 61.9% of all families. Conversely, the $10,000 to $14,999 income bracket is the least frequent group with only 105 families (0.6%) belonging to this category.
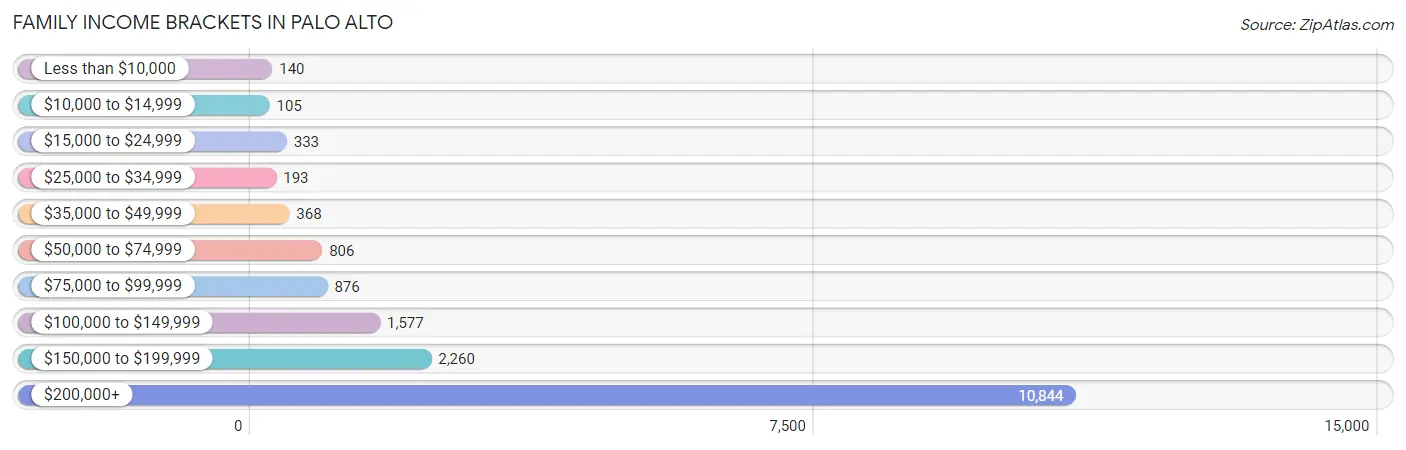
| Income Bracket | # Families | % Families |
| Less than $10,000 | 140 | 0.8% |
| $10,000 to $14,999 | 105 | 0.6% |
| $15,000 to $24,999 | 333 | 1.9% |
| $25,000 to $34,999 | 193 | 1.1% |
| $35,000 to $49,999 | 368 | 2.1% |
| $50,000 to $74,999 | 806 | 4.6% |
| $75,000 to $99,999 | 876 | 5.0% |
| $100,000 to $149,999 | 1,577 | 9.0% |
| $150,000 to $199,999 | 2,260 | 12.9% |
| $200,000+ | 10,844 | 61.9% |
Family Income by Famaliy Size in Palo Alto
3-person families (4,276 | 24.4%) account for the highest median family income in Palo Alto with $250,001 per family, while 2-person families (7,433 | 42.4%) have the highest median income of $94,638 per family member.
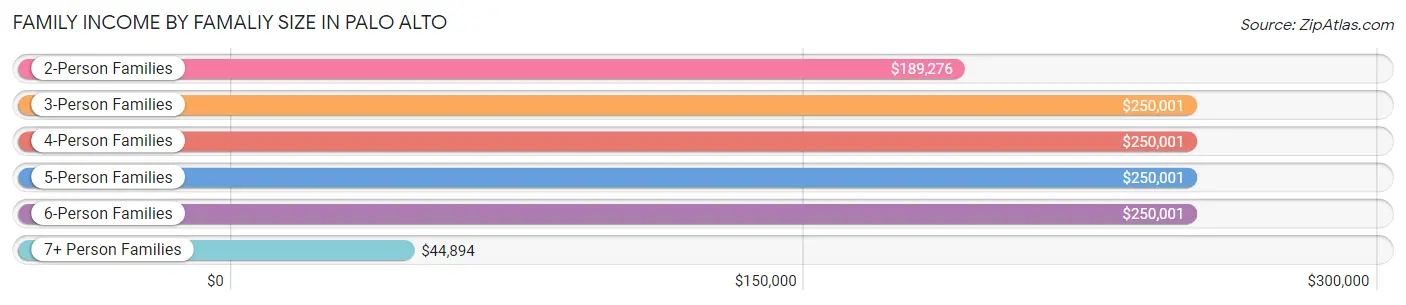
| Income Bracket | # Families | Median Income |
| 2-Person Families | 7,433 (42.4%) | $189,276 |
| 3-Person Families | 4,276 (24.4%) | $250,001 |
| 4-Person Families | 4,123 (23.5%) | $250,001 |
| 5-Person Families | 1,296 (7.4%) | $250,001 |
| 6-Person Families | 300 (1.7%) | $250,001 |
| 7+ Person Families | 90 (0.5%) | $44,894 |
| Total | 17,518 (100.0%) | $250,001 |
Family Income by Number of Earners in Palo Alto
The median family income in Palo Alto is $250,001, with families comprising 2 earners (8,330) having the highest median family income of $250,001, while families with no earners (2,469) have the lowest median family income of $104,886, accounting for 47.5% and 14.1% of families, respectively.
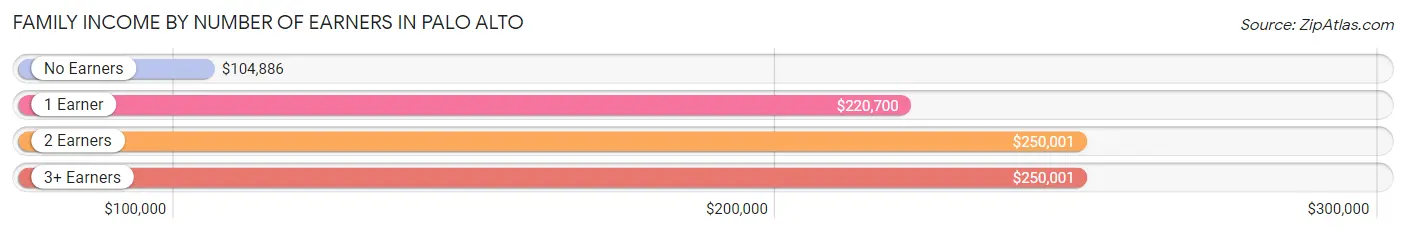
| Number of Earners | # Families | Median Income |
| No Earners | 2,469 (14.1%) | $104,886 |
| 1 Earner | 5,047 (28.8%) | $220,700 |
| 2 Earners | 8,330 (47.5%) | $250,001 |
| 3+ Earners | 1,672 (9.5%) | $250,001 |
| Total | 17,518 (100.0%) | $250,001 |
Household Income in Palo Alto
Household Income Brackets in Palo Alto
With 13,553 households falling in the category, the $200,000+ income range is the most frequent in Palo Alto, accounting for 52.0% of all households. In contrast, only 417 households (1.6%) fall into the $10,000 to $14,999 income bracket, making it the least populous group.
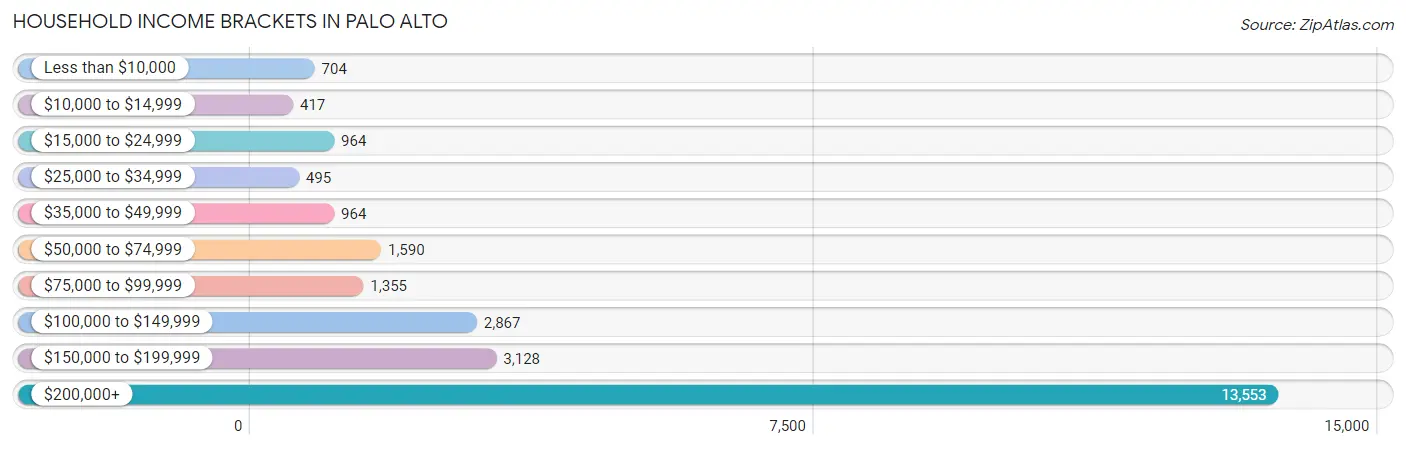
| Income Bracket | # Households | % Households |
| Less than $10,000 | 704 | 2.7% |
| $10,000 to $14,999 | 417 | 1.6% |
| $15,000 to $24,999 | 964 | 3.7% |
| $25,000 to $34,999 | 495 | 1.9% |
| $35,000 to $49,999 | 964 | 3.7% |
| $50,000 to $74,999 | 1,590 | 6.1% |
| $75,000 to $99,999 | 1,355 | 5.2% |
| $100,000 to $149,999 | 2,867 | 11.0% |
| $150,000 to $199,999 | 3,128 | 12.0% |
| $200,000+ | 13,553 | 52.0% |
Household Income by Householder Age in Palo Alto
The median household income in Palo Alto is $214,118, with the highest median household income of $250,001 found in the 45 to 64 years age bracket for the primary householder. A total of 10,398 households (39.9%) fall into this category. Meanwhile, the 15 to 24 years age bracket for the primary householder has the lowest median household income of $106,875, with 567 households (2.2%) in this group.
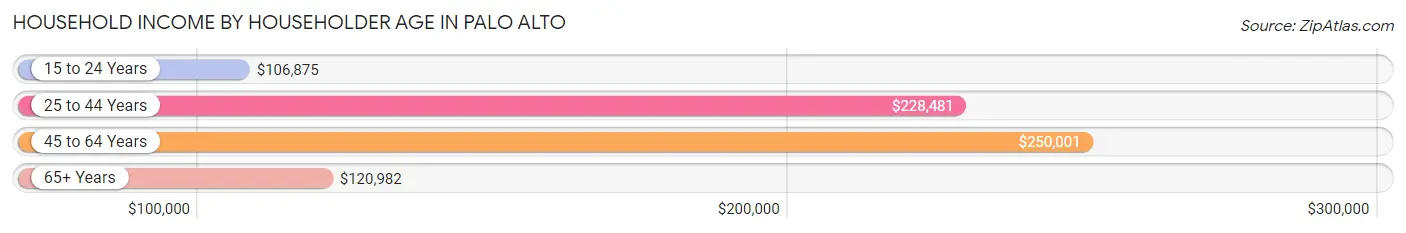
| Income Bracket | # Households | Median Income |
| 15 to 24 Years | 567 (2.2%) | $106,875 |
| 25 to 44 Years | 7,287 (28.0%) | $228,481 |
| 45 to 64 Years | 10,398 (39.9%) | $250,001 |
| 65+ Years | 7,812 (30.0%) | $120,982 |
| Total | 26,064 (100.0%) | $214,118 |
Poverty in Palo Alto
Income Below Poverty by Sex and Age in Palo Alto
With 3.5% poverty level for males and 5.8% for females among the residents of Palo Alto, 18 to 24 year old males and 15 year old females are the most vulnerable to poverty, with 222 males (9.8%) and 49 females (11.1%) in their respective age groups living below the poverty level.
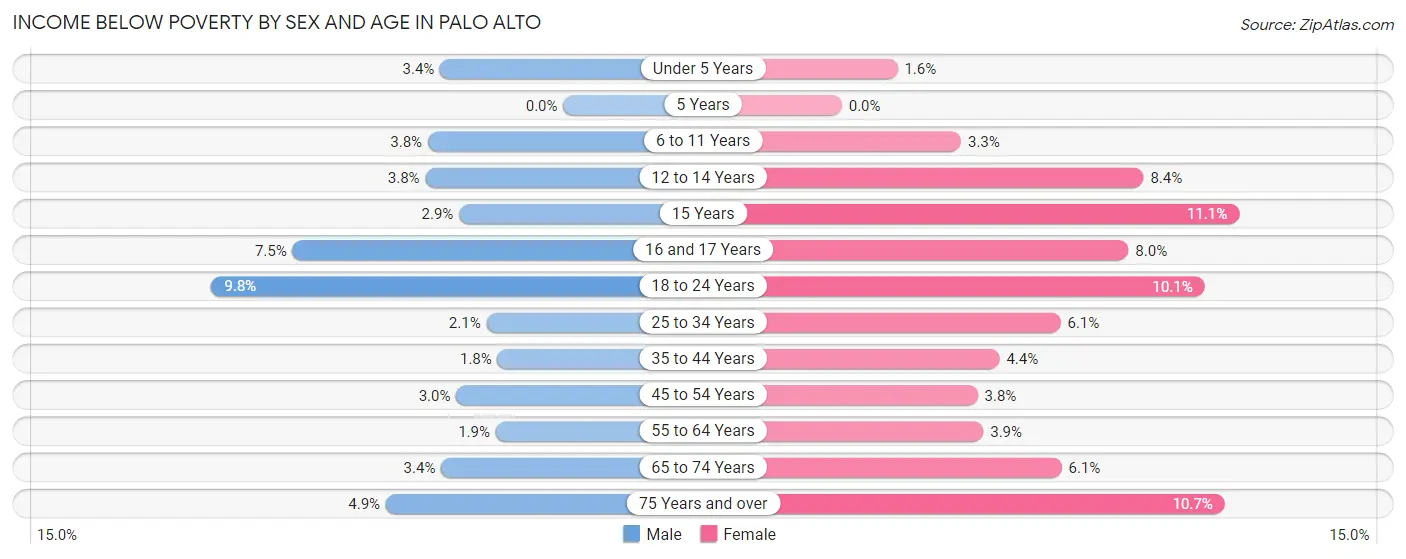
| Age Bracket | Male | Female |
| Under 5 Years | 47 (3.4%) | 29 (1.5%) |
| 5 Years | 0 (0.0%) | 0 (0.0%) |
| 6 to 11 Years | 98 (3.8%) | 71 (3.3%) |
| 12 to 14 Years | 61 (3.8%) | 131 (8.4%) |
| 15 Years | 21 (2.9%) | 49 (11.1%) |
| 16 and 17 Years | 78 (7.5%) | 95 (8.0%) |
| 18 to 24 Years | 222 (9.8%) | 218 (10.1%) |
| 25 to 34 Years | 87 (2.1%) | 227 (6.1%) |
| 35 to 44 Years | 74 (1.8%) | 194 (4.4%) |
| 45 to 54 Years | 149 (3.0%) | 186 (3.8%) |
| 55 to 64 Years | 81 (1.9%) | 179 (3.9%) |
| 65 to 74 Years | 90 (3.4%) | 187 (6.1%) |
| 75 Years and over | 131 (4.9%) | 462 (10.7%) |
| Total | 1,139 (3.5%) | 2,028 (5.8%) |
Income Above Poverty by Sex and Age in Palo Alto
According to the poverty statistics in Palo Alto, males aged 5 years and females aged 5 years are the age groups that are most secure financially, with 100.0% of males and 100.0% of females in these age groups living above the poverty line.
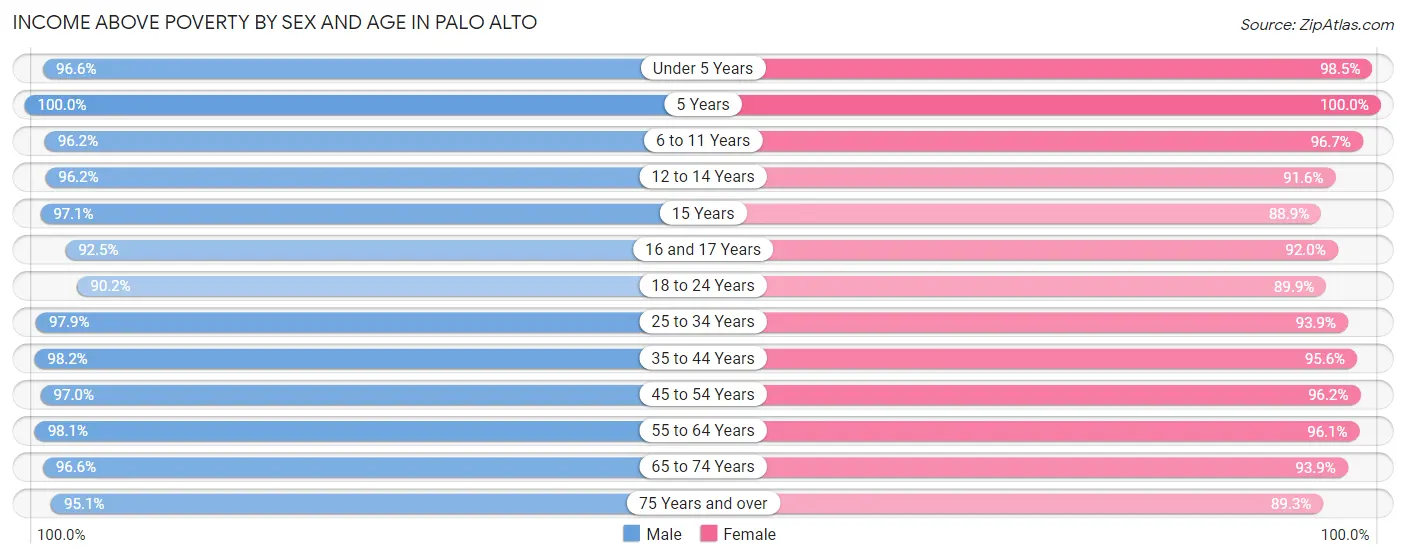
| Age Bracket | Male | Female |
| Under 5 Years | 1,322 (96.6%) | 1,848 (98.5%) |
| 5 Years | 238 (100.0%) | 452 (100.0%) |
| 6 to 11 Years | 2,502 (96.2%) | 2,065 (96.7%) |
| 12 to 14 Years | 1,528 (96.2%) | 1,429 (91.6%) |
| 15 Years | 703 (97.1%) | 394 (88.9%) |
| 16 and 17 Years | 957 (92.5%) | 1,095 (92.0%) |
| 18 to 24 Years | 2,043 (90.2%) | 1,941 (89.9%) |
| 25 to 34 Years | 3,979 (97.9%) | 3,499 (93.9%) |
| 35 to 44 Years | 3,979 (98.2%) | 4,225 (95.6%) |
| 45 to 54 Years | 4,856 (97.0%) | 4,734 (96.2%) |
| 55 to 64 Years | 4,218 (98.1%) | 4,369 (96.1%) |
| 65 to 74 Years | 2,560 (96.6%) | 2,867 (93.9%) |
| 75 Years and over | 2,522 (95.1%) | 3,873 (89.3%) |
| Total | 31,407 (96.5%) | 32,791 (94.2%) |
Income Below Poverty Among Married-Couple Families in Palo Alto
The poverty statistics for married-couple families in Palo Alto show that 1.3% or 200 of the total 14,974 families live below the poverty line. Families with 3 or 4 children have the highest poverty rate of 4.7%, comprising of 47 families. On the other hand, families with 5 or more children have the lowest poverty rate of 0.0%, which includes 0 families.
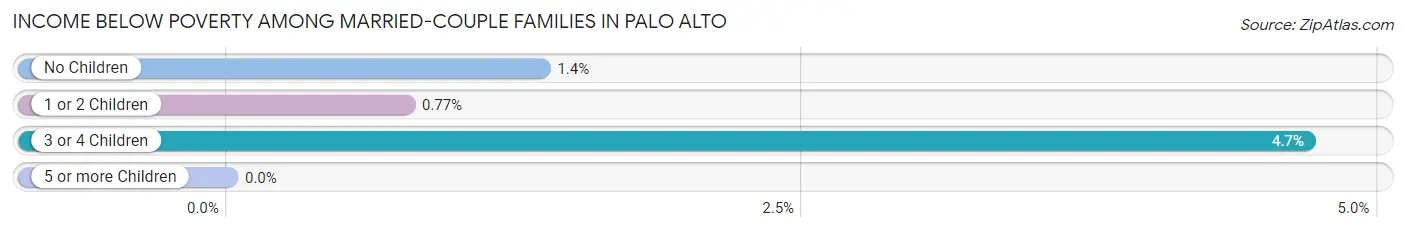
| Children | Above Poverty | Below Poverty |
| No Children | 7,608 (98.6%) | 105 (1.4%) |
| 1 or 2 Children | 6,193 (99.2%) | 48 (0.8%) |
| 3 or 4 Children | 955 (95.3%) | 47 (4.7%) |
| 5 or more Children | 18 (100.0%) | 0 (0.0%) |
| Total | 14,774 (98.7%) | 200 (1.3%) |
Income Below Poverty Among Single-Parent Households in Palo Alto
According to the poverty data in Palo Alto, 7.0% or 51 single-father households and 11.8% or 214 single-mother households are living below the poverty line. Among single-father households, those with 3 or 4 children have the highest poverty rate, with 12 households (22.6%) experiencing poverty. Likewise, among single-mother households, those with 3 or 4 children have the highest poverty rate, with 51 households (85.0%) falling below the poverty line.
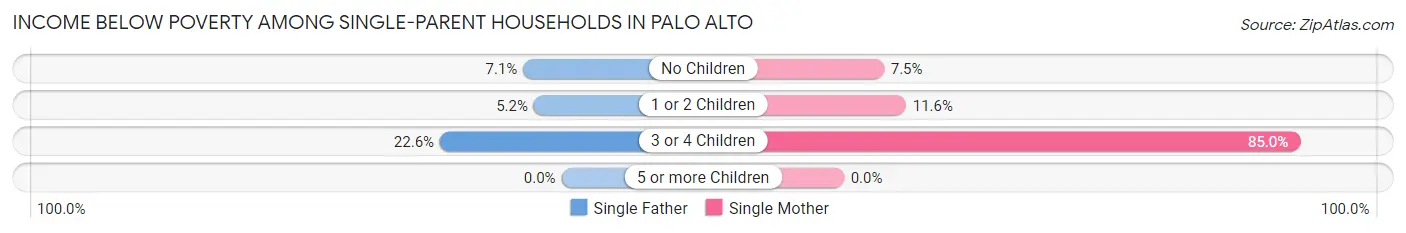
| Children | Single Father | Single Mother |
| No Children | 16 (7.1%) | 74 (7.5%) |
| 1 or 2 Children | 23 (5.1%) | 89 (11.6%) |
| 3 or 4 Children | 12 (22.6%) | 51 (85.0%) |
| 5 or more Children | 0 (0.0%) | 0 (0.0%) |
| Total | 51 (7.0%) | 214 (11.8%) |
Income Below Poverty Among Married-Couple vs Single-Parent Households in Palo Alto
The poverty data for Palo Alto shows that 200 of the married-couple family households (1.3%) and 265 of the single-parent households (10.4%) are living below the poverty level. Within the married-couple family households, those with 3 or 4 children have the highest poverty rate, with 47 households (4.7%) falling below the poverty line. Among the single-parent households, those with 3 or 4 children have the highest poverty rate, with 63 household (55.7%) living below poverty.
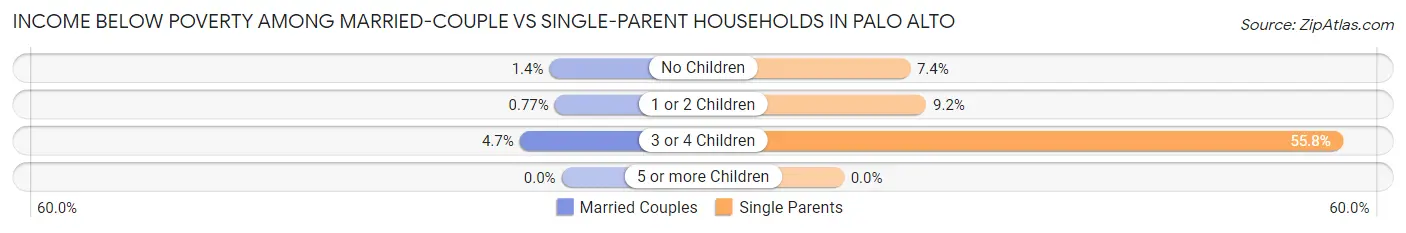
| Children | Married-Couple Families | Single-Parent Households |
| No Children | 105 (1.4%) | 90 (7.4%) |
| 1 or 2 Children | 48 (0.8%) | 112 (9.2%) |
| 3 or 4 Children | 47 (4.7%) | 63 (55.7%) |
| 5 or more Children | 0 (0.0%) | 0 (0.0%) |
| Total | 200 (1.3%) | 265 (10.4%) |
Employment Characteristics in Palo Alto
Employment by Class of Employer in Palo Alto
Among the 33,104 employed individuals in Palo Alto, private company employees (21,463 | 64.8%), not-for-profit organizations (5,390 | 16.3%), and self-employed (not incorporated) (2,607 | 7.9%) make up the most common classes of employment.
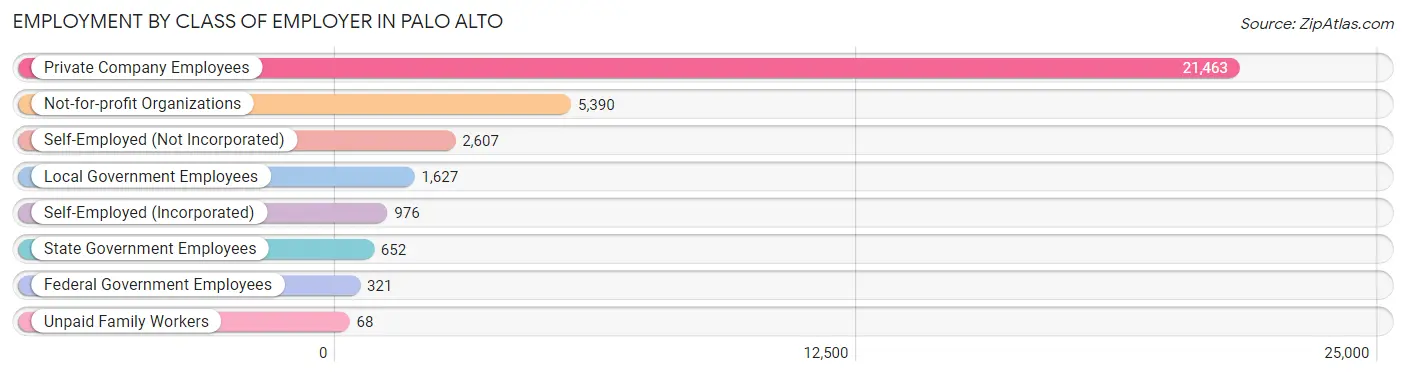
| Employer Class | # Employees | % Employees |
| Private Company Employees | 21,463 | 64.8% |
| Self-Employed (Incorporated) | 976 | 2.9% |
| Self-Employed (Not Incorporated) | 2,607 | 7.9% |
| Not-for-profit Organizations | 5,390 | 16.3% |
| Local Government Employees | 1,627 | 4.9% |
| State Government Employees | 652 | 2.0% |
| Federal Government Employees | 321 | 1.0% |
| Unpaid Family Workers | 68 | 0.2% |
| Total | 33,104 | 100.0% |
Employment Status by Age in Palo Alto
According to the labor force statistics for Palo Alto, out of the total population over 16 years of age (54,909), 63.4% or 34,812 individuals are in the labor force, with 3.3% or 1,149 of them unemployed. The age group with the highest labor force participation rate is 25 to 29 years, with 91.7% or 3,636 individuals in the labor force. Within the labor force, the 16 to 19 years age range has the highest percentage of unemployed individuals, with 10.0% or 59 of them being unemployed.
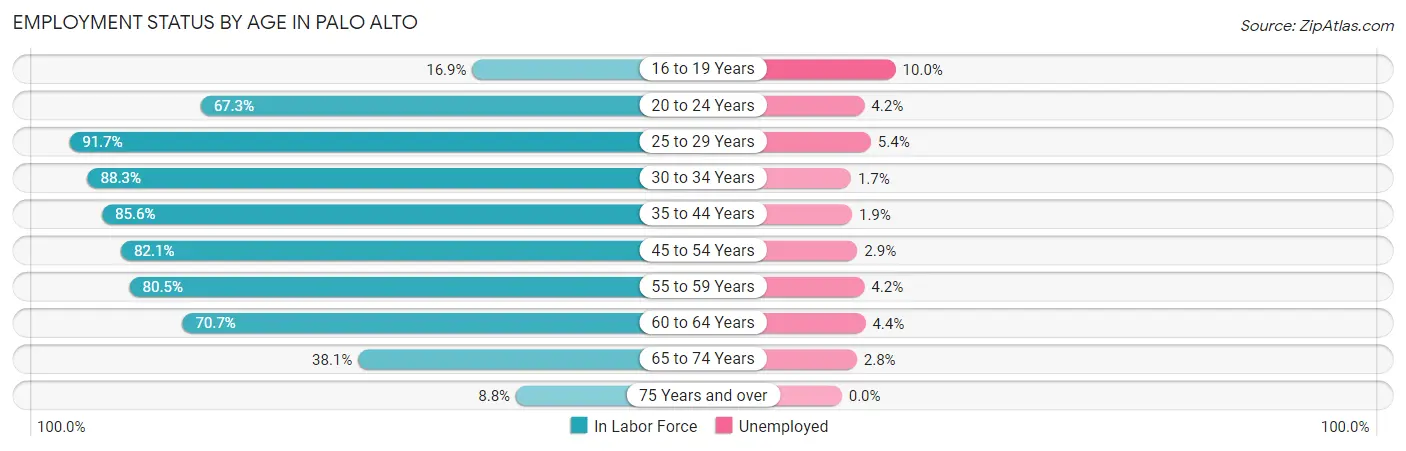
| Age Bracket | In Labor Force | Unemployed |
| 16 to 19 Years | 590 (16.9%) | 59 (10.0%) |
| 20 to 24 Years | 2,144 (67.3%) | 90 (4.2%) |
| 25 to 29 Years | 3,636 (91.7%) | 196 (5.4%) |
| 30 to 34 Years | 3,392 (88.3%) | 58 (1.7%) |
| 35 to 44 Years | 7,271 (85.6%) | 138 (1.9%) |
| 45 to 54 Years | 8,167 (82.1%) | 237 (2.9%) |
| 55 to 59 Years | 3,960 (80.5%) | 166 (4.2%) |
| 60 to 64 Years | 2,816 (70.7%) | 124 (4.4%) |
| 65 to 74 Years | 2,203 (38.1%) | 62 (2.8%) |
| 75 Years and over | 643 (8.8%) | 0 (0.0%) |
| Total | 34,812 (63.4%) | 1,149 (3.3%) |
Employment Status by Educational Attainment in Palo Alto
According to labor force statistics for Palo Alto, 83.2% of individuals (29,246) out of the total population between 25 and 64 years of age (35,151) are in the labor force, with 3.2% or 936 of them being unemployed. The group with the highest labor force participation rate are those with the educational attainment of bachelor's degree or higher, with 85.5% or 25,925 individuals in the labor force. Within the labor force, individuals with high school diploma education have the highest percentage of unemployment, with 13.2% or 96 of them being unemployed.
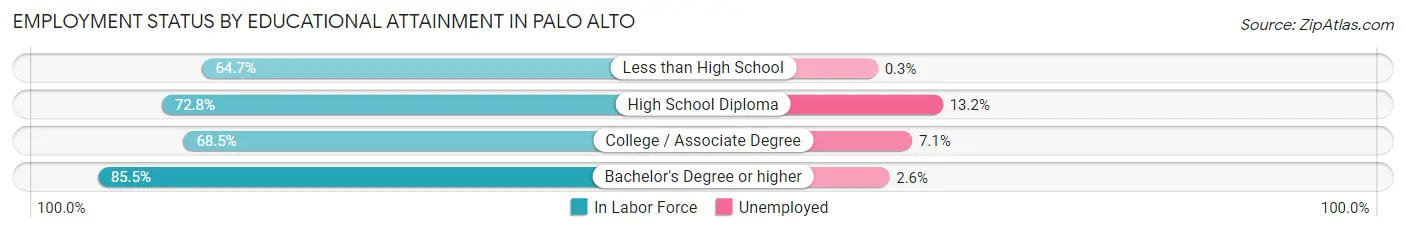
| Educational Attainment | In Labor Force | Unemployed |
| Less than High School | 608 (64.7%) | 3 (0.3%) |
| High School Diploma | 729 (72.8%) | 132 (13.2%) |
| College / Associate Degree | 1,979 (68.5%) | 205 (7.1%) |
| Bachelor's Degree or higher | 25,925 (85.5%) | 788 (2.6%) |
| Total | 29,246 (83.2%) | 1,125 (3.2%) |
Employment Occupations by Sex in Palo Alto
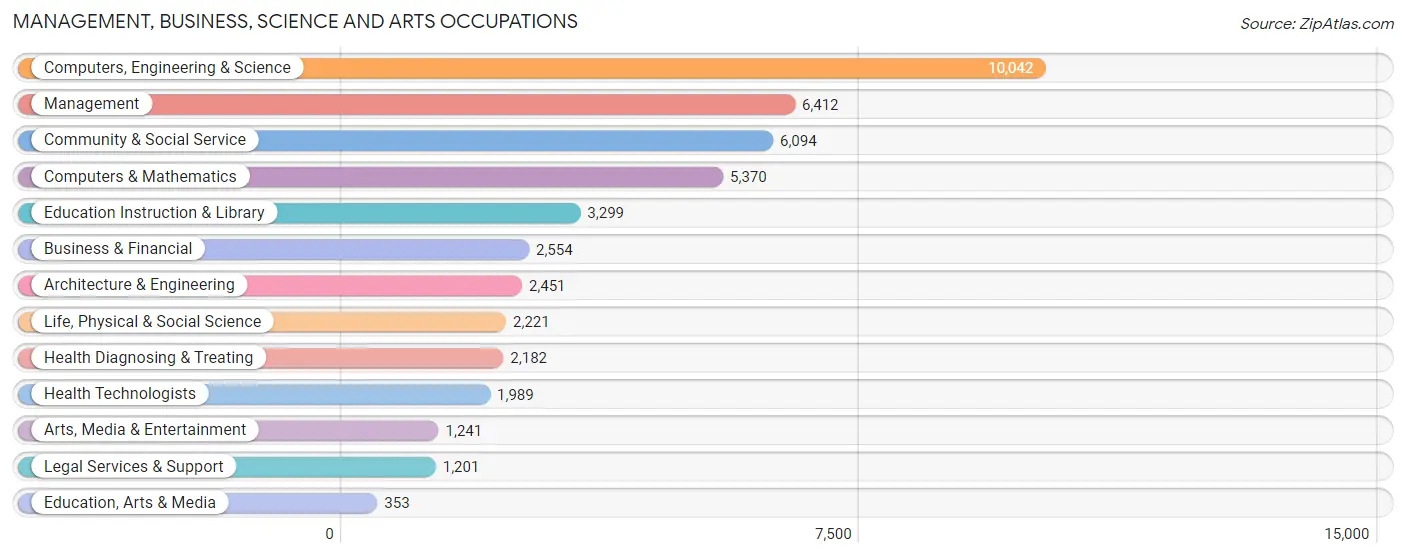
Management, Business, Science and Arts Occupations
The most common Management, Business, Science and Arts occupations in Palo Alto are Computers, Engineering & Science (10,042 | 29.8%), Management (6,412 | 19.1%), Community & Social Service (6,094 | 18.1%), Computers & Mathematics (5,370 | 16.0%), and Education Instruction & Library (3,299 | 9.8%).
Management, Business, Science and Arts Occupations by Sex
Within the Management, Business, Science and Arts occupations in Palo Alto, the most male-oriented occupations are Computers & Mathematics (75.1%), Architecture & Engineering (74.9%), and Computers, Engineering & Science (70.1%), while the most female-oriented occupations are Legal Services & Support (61.6%), Health Diagnosing & Treating (61.6%), and Education Instruction & Library (60.6%).
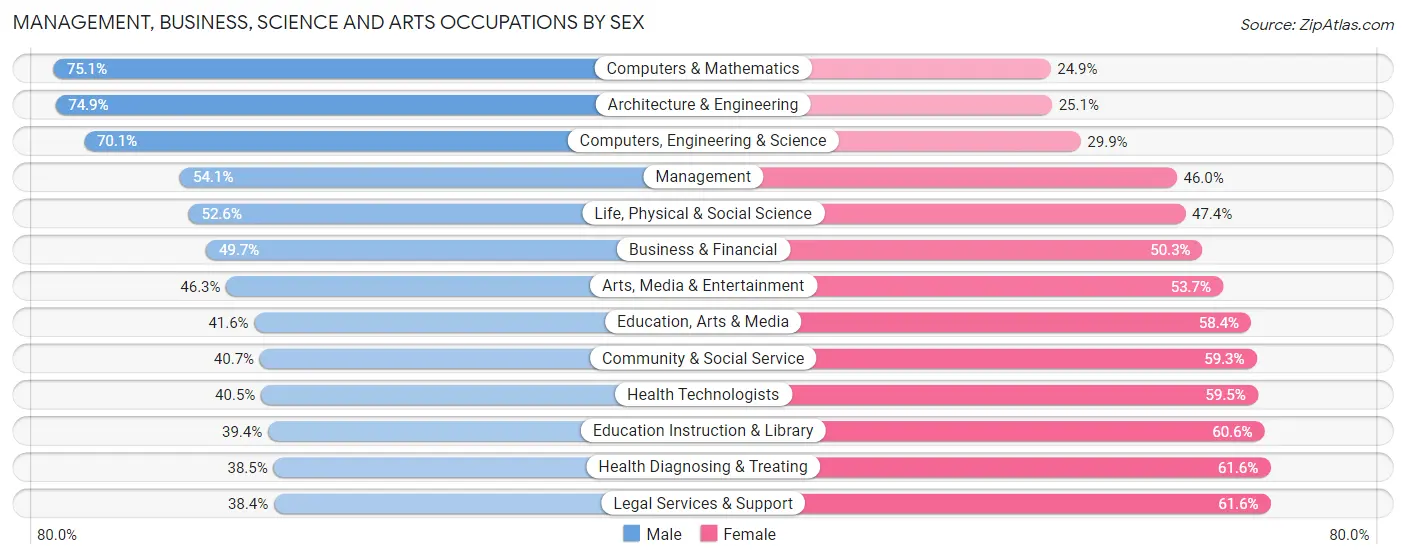
| Occupation | Male | Female |
| Management | 3,466 (54.0%) | 2,946 (46.0%) |
| Business & Financial | 1,270 (49.7%) | 1,284 (50.3%) |
| Computers, Engineering & Science | 7,038 (70.1%) | 3,004 (29.9%) |
| Computers & Mathematics | 4,034 (75.1%) | 1,336 (24.9%) |
| Architecture & Engineering | 1,835 (74.9%) | 616 (25.1%) |
| Life, Physical & Social Science | 1,169 (52.6%) | 1,052 (47.4%) |
| Community & Social Service | 2,482 (40.7%) | 3,612 (59.3%) |
| Education, Arts & Media | 147 (41.6%) | 206 (58.4%) |
| Legal Services & Support | 461 (38.4%) | 740 (61.6%) |
| Education Instruction & Library | 1,299 (39.4%) | 2,000 (60.6%) |
| Arts, Media & Entertainment | 575 (46.3%) | 666 (53.7%) |
| Health Diagnosing & Treating | 839 (38.5%) | 1,343 (61.6%) |
| Health Technologists | 806 (40.5%) | 1,183 (59.5%) |
| Total (Category) | 15,095 (55.3%) | 12,189 (44.7%) |
| Total (Overall) | 18,159 (53.9%) | 15,501 (46.1%) |
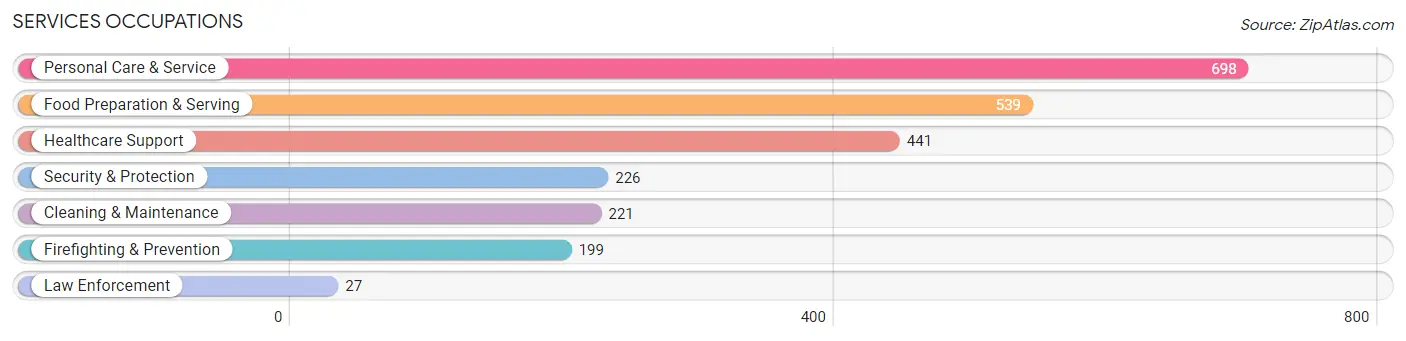
Services Occupations
The most common Services occupations in Palo Alto are Personal Care & Service (698 | 2.1%), Food Preparation & Serving (539 | 1.6%), Healthcare Support (441 | 1.3%), Security & Protection (226 | 0.7%), and Cleaning & Maintenance (221 | 0.7%).
Services Occupations by Sex
Within the Services occupations in Palo Alto, the most male-oriented occupations are Law Enforcement (100.0%), Security & Protection (77.0%), and Firefighting & Prevention (73.9%), while the most female-oriented occupations are Healthcare Support (83.0%), Personal Care & Service (76.1%), and Food Preparation & Serving (51.8%).
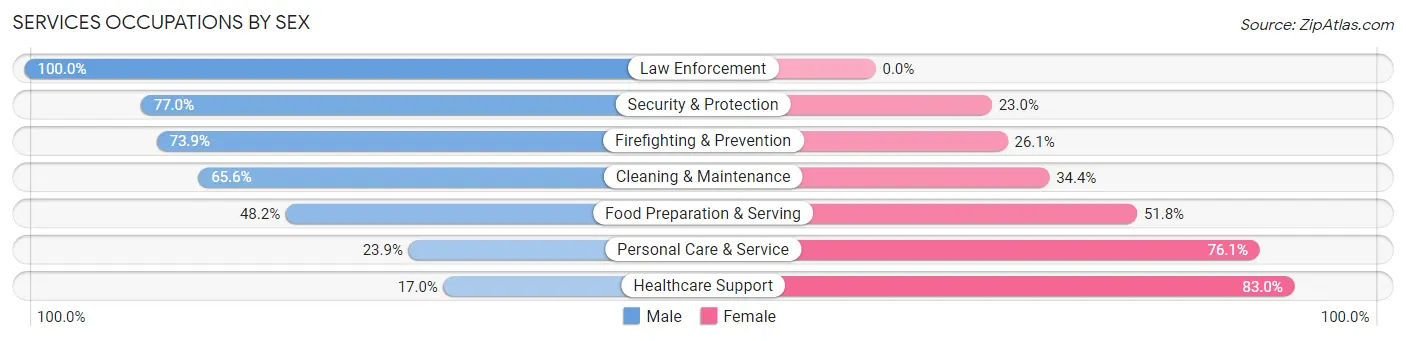
| Occupation | Male | Female |
| Healthcare Support | 75 (17.0%) | 366 (83.0%) |
| Security & Protection | 174 (77.0%) | 52 (23.0%) |
| Firefighting & Prevention | 147 (73.9%) | 52 (26.1%) |
| Law Enforcement | 27 (100.0%) | 0 (0.0%) |
| Food Preparation & Serving | 260 (48.2%) | 279 (51.8%) |
| Cleaning & Maintenance | 145 (65.6%) | 76 (34.4%) |
| Personal Care & Service | 167 (23.9%) | 531 (76.1%) |
| Total (Category) | 821 (38.6%) | 1,304 (61.4%) |
| Total (Overall) | 18,159 (53.9%) | 15,501 (46.1%) |
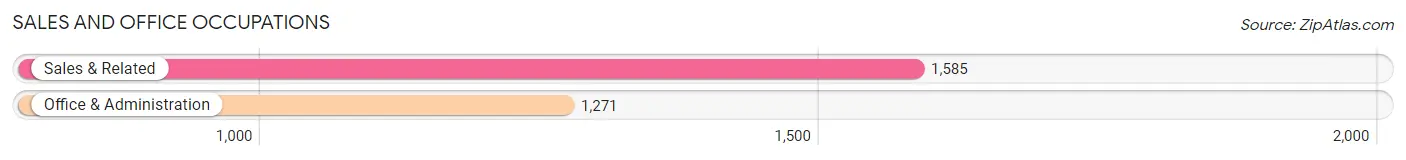
Sales and Office Occupations
The most common Sales and Office occupations in Palo Alto are Sales & Related (1,585 | 4.7%), and Office & Administration (1,271 | 3.8%).
Sales and Office Occupations by Sex
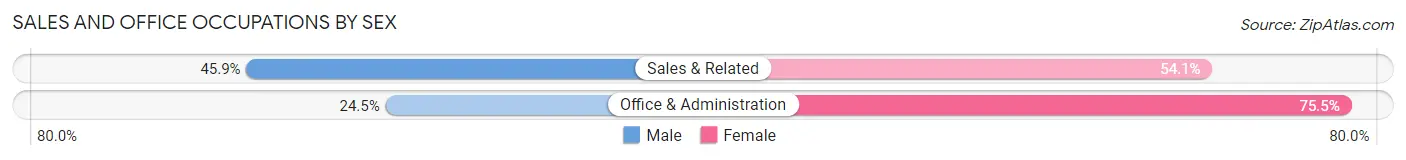
| Occupation | Male | Female |
| Sales & Related | 727 (45.9%) | 858 (54.1%) |
| Office & Administration | 311 (24.5%) | 960 (75.5%) |
| Total (Category) | 1,038 (36.3%) | 1,818 (63.7%) |
| Total (Overall) | 18,159 (53.9%) | 15,501 (46.1%) |
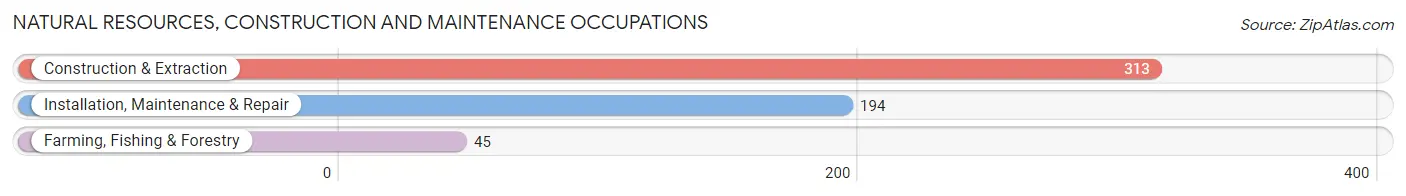
Natural Resources, Construction and Maintenance Occupations
The most common Natural Resources, Construction and Maintenance occupations in Palo Alto are Construction & Extraction (313 | 0.9%), Installation, Maintenance & Repair (194 | 0.6%), and Farming, Fishing & Forestry (45 | 0.1%).
Natural Resources, Construction and Maintenance Occupations by Sex
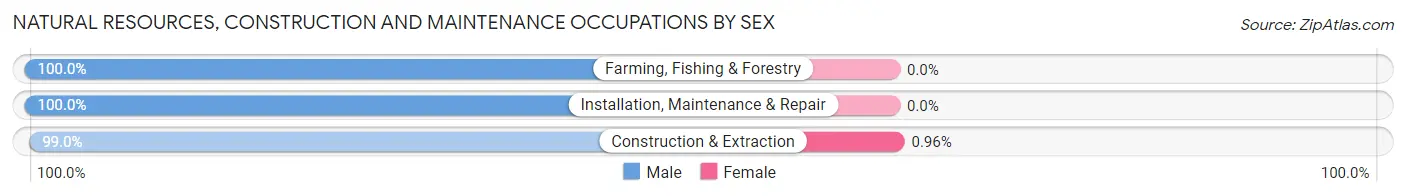
| Occupation | Male | Female |
| Farming, Fishing & Forestry | 45 (100.0%) | 0 (0.0%) |
| Construction & Extraction | 310 (99.0%) | 3 (1.0%) |
| Installation, Maintenance & Repair | 194 (100.0%) | 0 (0.0%) |
| Total (Category) | 549 (99.5%) | 3 (0.5%) |
| Total (Overall) | 18,159 (53.9%) | 15,501 (46.1%) |
Production, Transportation and Moving Occupations
The most common Production, Transportation and Moving occupations in Palo Alto are Production (376 | 1.1%), Material Moving (241 | 0.7%), and Transportation (226 | 0.7%).
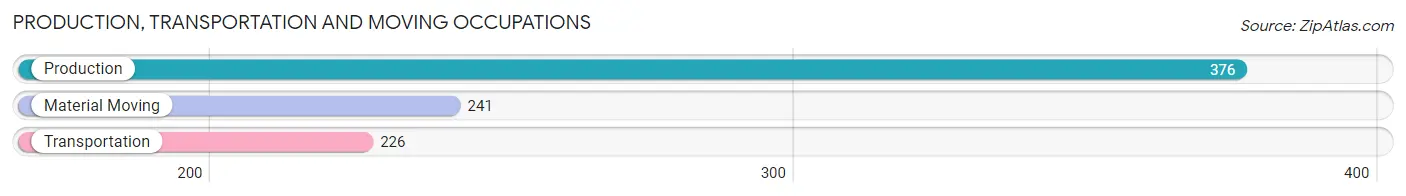
Production, Transportation and Moving Occupations by Sex
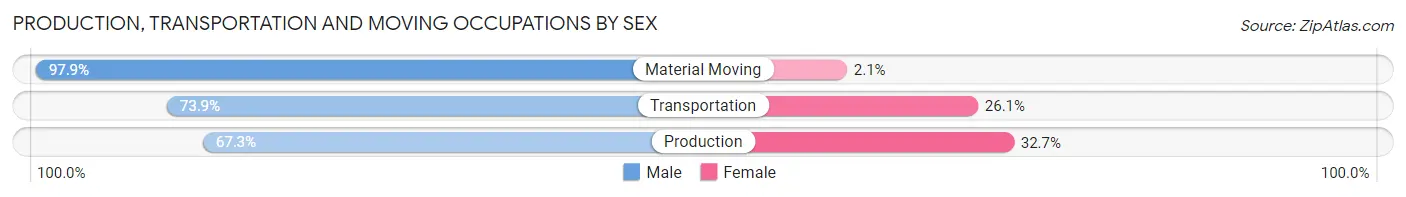
| Occupation | Male | Female |
| Production | 253 (67.3%) | 123 (32.7%) |
| Transportation | 167 (73.9%) | 59 (26.1%) |
| Material Moving | 236 (97.9%) | 5 (2.1%) |
| Total (Category) | 656 (77.8%) | 187 (22.2%) |
| Total (Overall) | 18,159 (53.9%) | 15,501 (46.1%) |
Employment Industries by Sex in Palo Alto
Employment Industries in Palo Alto
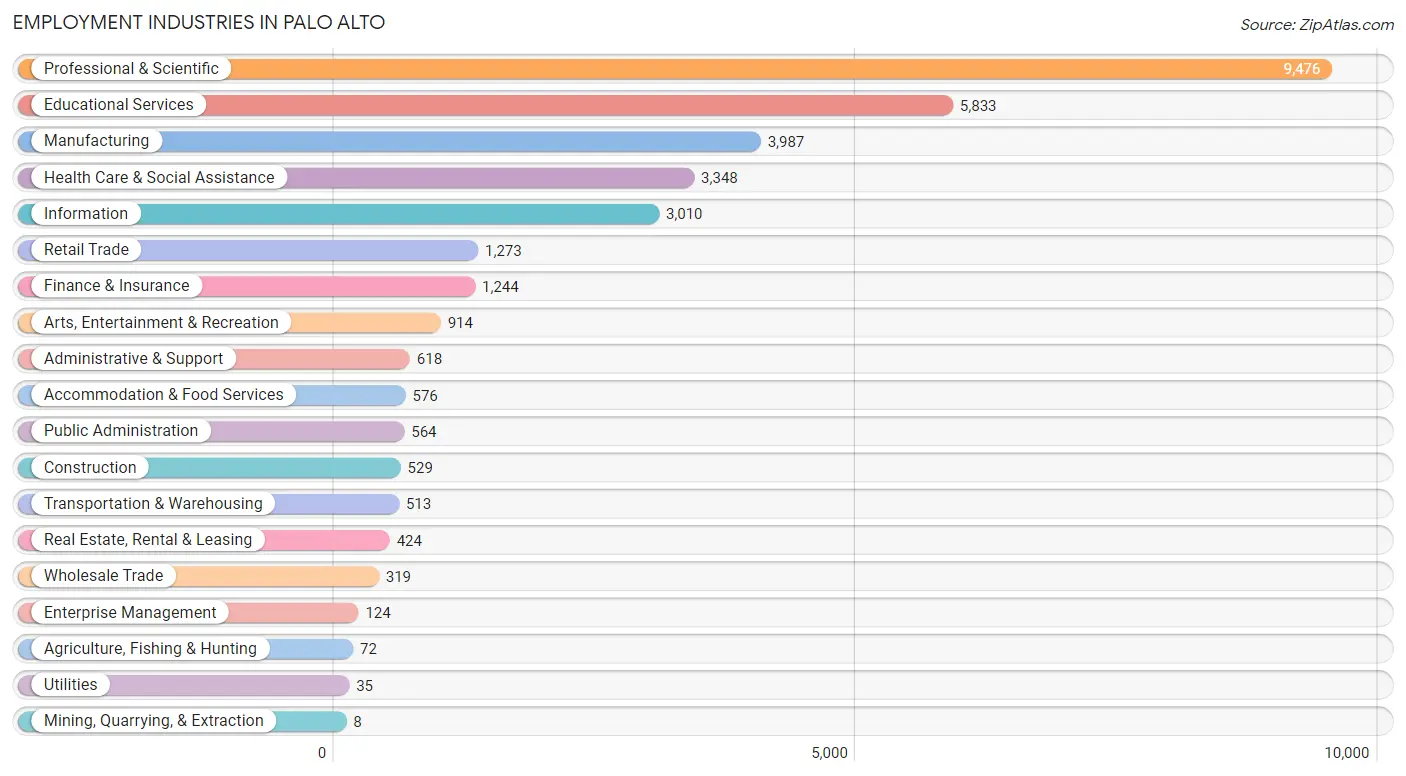
The major employment industries in Palo Alto include Professional & Scientific (9,476 | 28.1%), Educational Services (5,833 | 17.3%), Manufacturing (3,987 | 11.8%), Health Care & Social Assistance (3,348 | 10.0%), and Information (3,010 | 8.9%).
Employment Industries by Sex in Palo Alto
The Palo Alto industries that see more men than women are Mining, Quarrying, & Extraction (100.0%), Construction (91.5%), and Transportation & Warehousing (72.3%), whereas the industries that tend to have a higher number of women are Public Administration (68.3%), Health Care & Social Assistance (68.1%), and Real Estate, Rental & Leasing (59.9%).
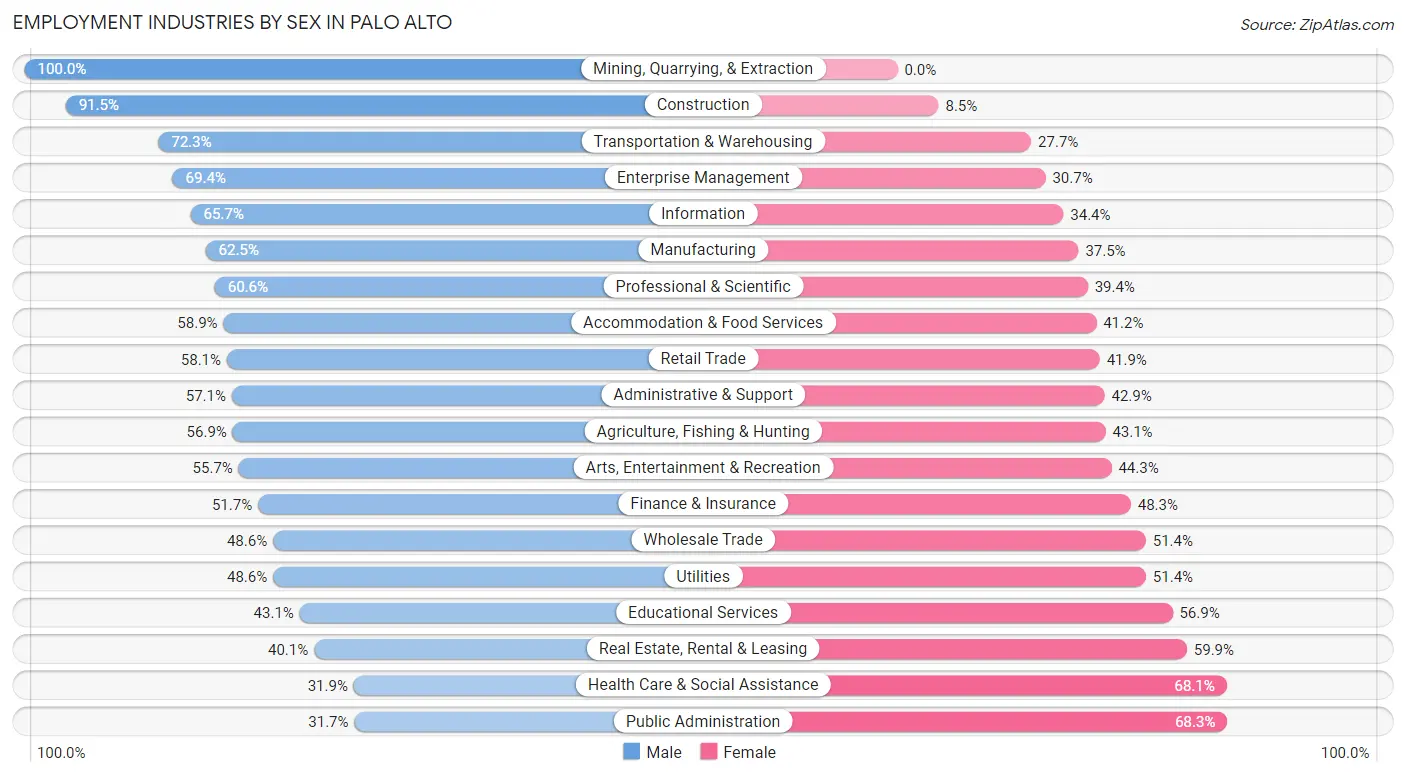
| Industry | Male | Female |
| Agriculture, Fishing & Hunting | 41 (56.9%) | 31 (43.1%) |
| Mining, Quarrying, & Extraction | 8 (100.0%) | 0 (0.0%) |
| Construction | 484 (91.5%) | 45 (8.5%) |
| Manufacturing | 2,493 (62.5%) | 1,494 (37.5%) |
| Wholesale Trade | 155 (48.6%) | 164 (51.4%) |
| Retail Trade | 740 (58.1%) | 533 (41.9%) |
| Transportation & Warehousing | 371 (72.3%) | 142 (27.7%) |
| Utilities | 17 (48.6%) | 18 (51.4%) |
| Information | 1,976 (65.6%) | 1,034 (34.4%) |
| Finance & Insurance | 643 (51.7%) | 601 (48.3%) |
| Real Estate, Rental & Leasing | 170 (40.1%) | 254 (59.9%) |
| Professional & Scientific | 5,744 (60.6%) | 3,732 (39.4%) |
| Enterprise Management | 86 (69.4%) | 38 (30.6%) |
| Administrative & Support | 353 (57.1%) | 265 (42.9%) |
| Educational Services | 2,512 (43.1%) | 3,321 (56.9%) |
| Health Care & Social Assistance | 1,067 (31.9%) | 2,281 (68.1%) |
| Arts, Entertainment & Recreation | 509 (55.7%) | 405 (44.3%) |
| Accommodation & Food Services | 339 (58.9%) | 237 (41.1%) |
| Public Administration | 179 (31.7%) | 385 (68.3%) |
| Total | 18,159 (53.9%) | 15,501 (46.1%) |
Education in Palo Alto
School Enrollment in Palo Alto
The most common levels of schooling among the 17,092 students in Palo Alto are high school (4,369 | 25.6%), middle school (4,033 | 23.6%), and elementary school (2,878 | 16.8%).
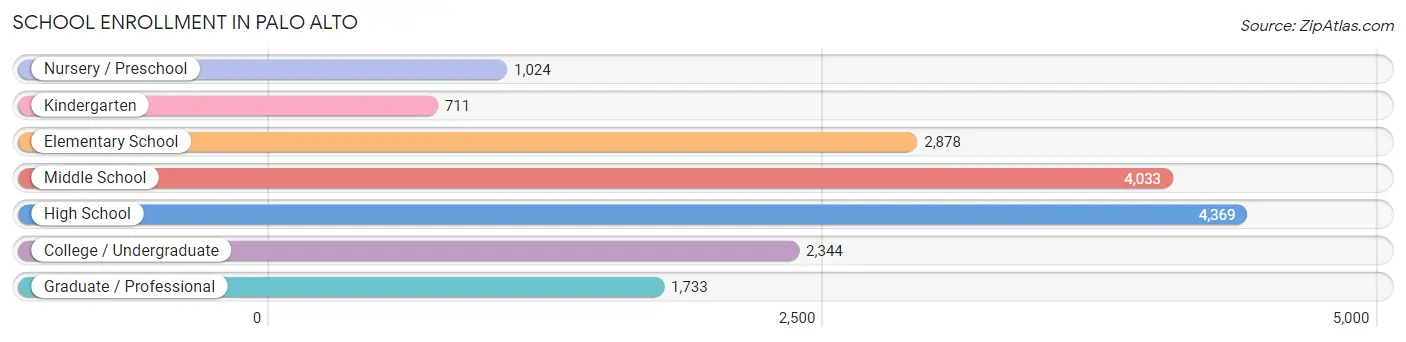
| School Level | # Students | % Students |
| Nursery / Preschool | 1,024 | 6.0% |
| Kindergarten | 711 | 4.2% |
| Elementary School | 2,878 | 16.8% |
| Middle School | 4,033 | 23.6% |
| High School | 4,369 | 25.6% |
| College / Undergraduate | 2,344 | 13.7% |
| Graduate / Professional | 1,733 | 10.1% |
| Total | 17,092 | 100.0% |
School Enrollment by Age by Funding Source in Palo Alto
Out of a total of 17,092 students who are enrolled in schools in Palo Alto, 4,512 (26.4%) attend a private institution, while the remaining 12,580 (73.6%) are enrolled in public schools. The age group of 3 to 4 year olds has the highest likelihood of being enrolled in private schools, with 801 (97.3% in the age bracket) enrolled. Conversely, the age group of 15 to 17 year olds has the lowest likelihood of being enrolled in a private school, with 3,036 (90.2% in the age bracket) attending a public institution.
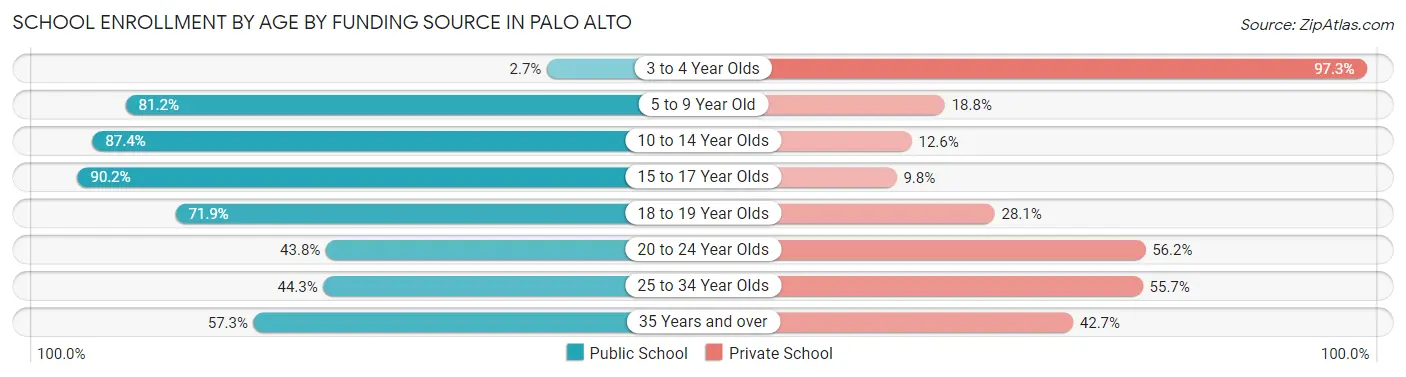
| Age Bracket | Public School | Private School |
| 3 to 4 Year Olds | 22 (2.7%) | 801 (97.3%) |
| 5 to 9 Year Old | 2,836 (81.2%) | 658 (18.8%) |
| 10 to 14 Year Olds | 4,273 (87.4%) | 618 (12.6%) |
| 15 to 17 Year Olds | 3,036 (90.2%) | 331 (9.8%) |
| 18 to 19 Year Olds | 842 (71.9%) | 329 (28.1%) |
| 20 to 24 Year Olds | 604 (43.8%) | 774 (56.2%) |
| 25 to 34 Year Olds | 566 (44.3%) | 711 (55.7%) |
| 35 Years and over | 396 (57.3%) | 295 (42.7%) |
| Total | 12,580 (73.6%) | 4,512 (26.4%) |
Educational Attainment by Field of Study in Palo Alto
Engineering (8,304 | 19.2%), computers & mathematics (5,508 | 12.7%), social sciences (5,256 | 12.1%), bio, nature & agricultural (3,835 | 8.8%), and business (3,624 | 8.4%) are the most common fields of study among 43,368 individuals in Palo Alto who have obtained a bachelor's degree or higher.
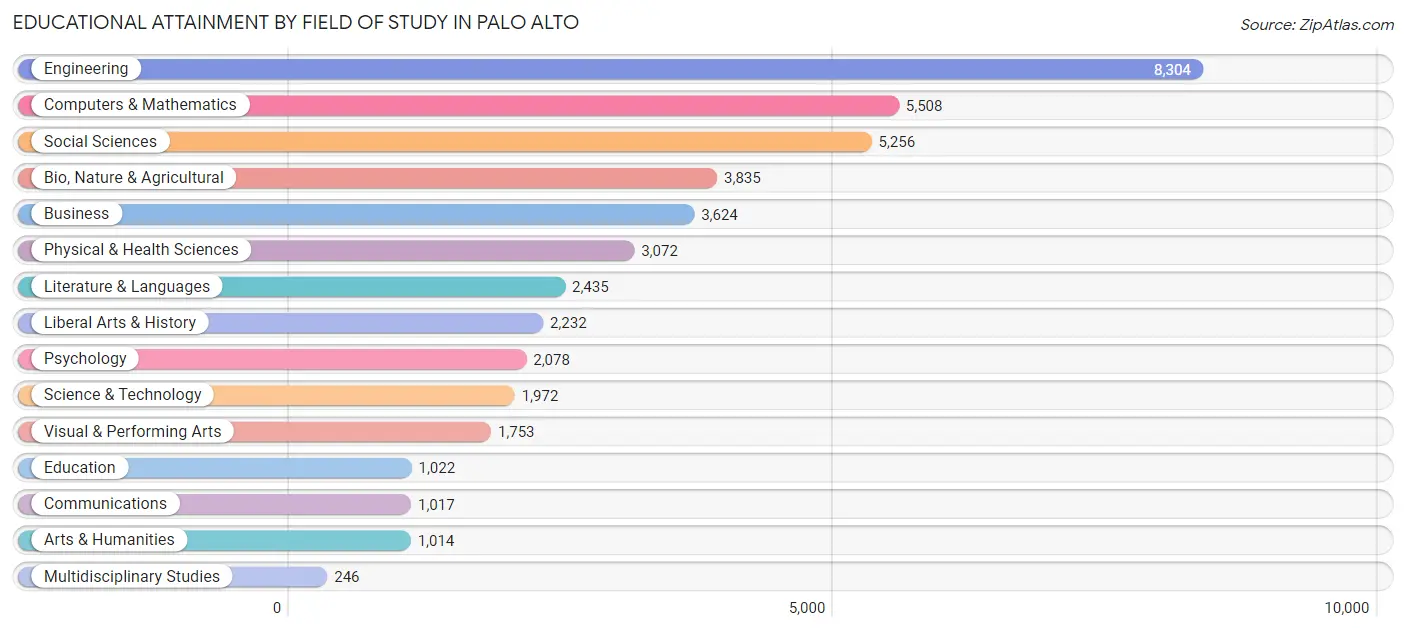
| Field of Study | # Graduates | % Graduates |
| Computers & Mathematics | 5,508 | 12.7% |
| Bio, Nature & Agricultural | 3,835 | 8.8% |
| Physical & Health Sciences | 3,072 | 7.1% |
| Psychology | 2,078 | 4.8% |
| Social Sciences | 5,256 | 12.1% |
| Engineering | 8,304 | 19.2% |
| Multidisciplinary Studies | 246 | 0.6% |
| Science & Technology | 1,972 | 4.5% |
| Business | 3,624 | 8.4% |
| Education | 1,022 | 2.4% |
| Literature & Languages | 2,435 | 5.6% |
| Liberal Arts & History | 2,232 | 5.1% |
| Visual & Performing Arts | 1,753 | 4.0% |
| Communications | 1,017 | 2.4% |
| Arts & Humanities | 1,014 | 2.3% |
| Total | 43,368 | 100.0% |
Transportation & Commute in Palo Alto
Vehicle Availability by Sex in Palo Alto
The most prevalent vehicle ownership categories in Palo Alto are males with 2 vehicles (7,771, accounting for 43.4%) and females with 2 vehicles (6,611, making up 51.2%).
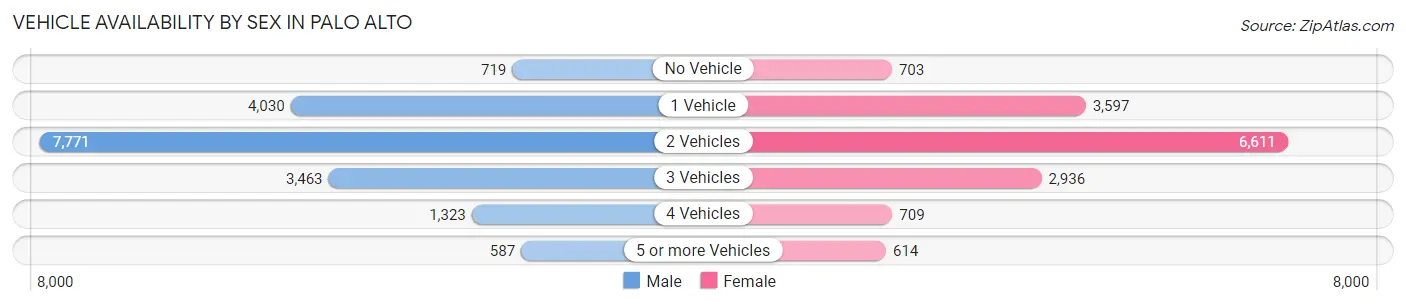
| Vehicles Available | Male | Female |
| No Vehicle | 719 (4.0%) | 703 (4.6%) |
| 1 Vehicle | 4,030 (22.5%) | 3,597 (23.7%) |
| 2 Vehicles | 7,771 (43.4%) | 6,611 (43.6%) |
| 3 Vehicles | 3,463 (19.4%) | 2,936 (19.4%) |
| 4 Vehicles | 1,323 (7.4%) | 709 (4.7%) |
| 5 or more Vehicles | 587 (3.3%) | 614 (4.1%) |
| Total | 17,893 (100.0%) | 15,170 (100.0%) |
Commute Time in Palo Alto
The most frequently occuring commute durations in Palo Alto are 20 to 24 minutes (5,112 commuters, 21.7%), 15 to 19 minutes (4,646 commuters, 19.7%), and 10 to 14 minutes (3,321 commuters, 14.1%).
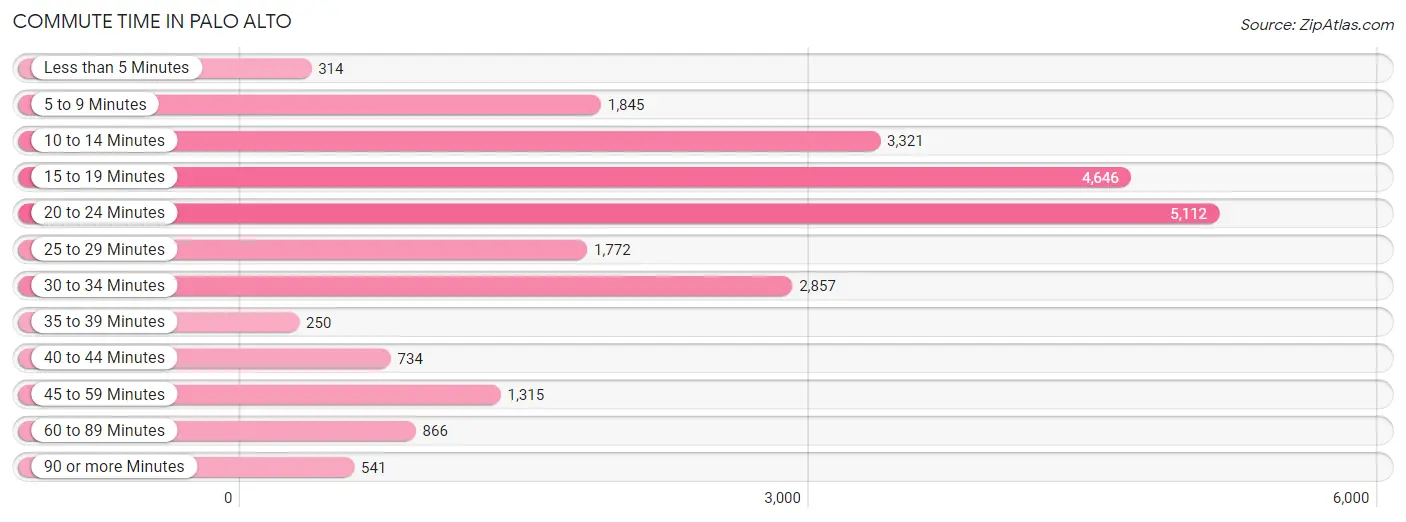
| Commute Time | # Commuters | % Commuters |
| Less than 5 Minutes | 314 | 1.3% |
| 5 to 9 Minutes | 1,845 | 7.8% |
| 10 to 14 Minutes | 3,321 | 14.1% |
| 15 to 19 Minutes | 4,646 | 19.7% |
| 20 to 24 Minutes | 5,112 | 21.7% |
| 25 to 29 Minutes | 1,772 | 7.5% |
| 30 to 34 Minutes | 2,857 | 12.1% |
| 35 to 39 Minutes | 250 | 1.1% |
| 40 to 44 Minutes | 734 | 3.1% |
| 45 to 59 Minutes | 1,315 | 5.6% |
| 60 to 89 Minutes | 866 | 3.7% |
| 90 or more Minutes | 541 | 2.3% |
Commute Time by Sex in Palo Alto
The most common commute times in Palo Alto are 20 to 24 minutes (2,809 commuters, 21.8%) for males and 20 to 24 minutes (2,303 commuters, 21.6%) for females.
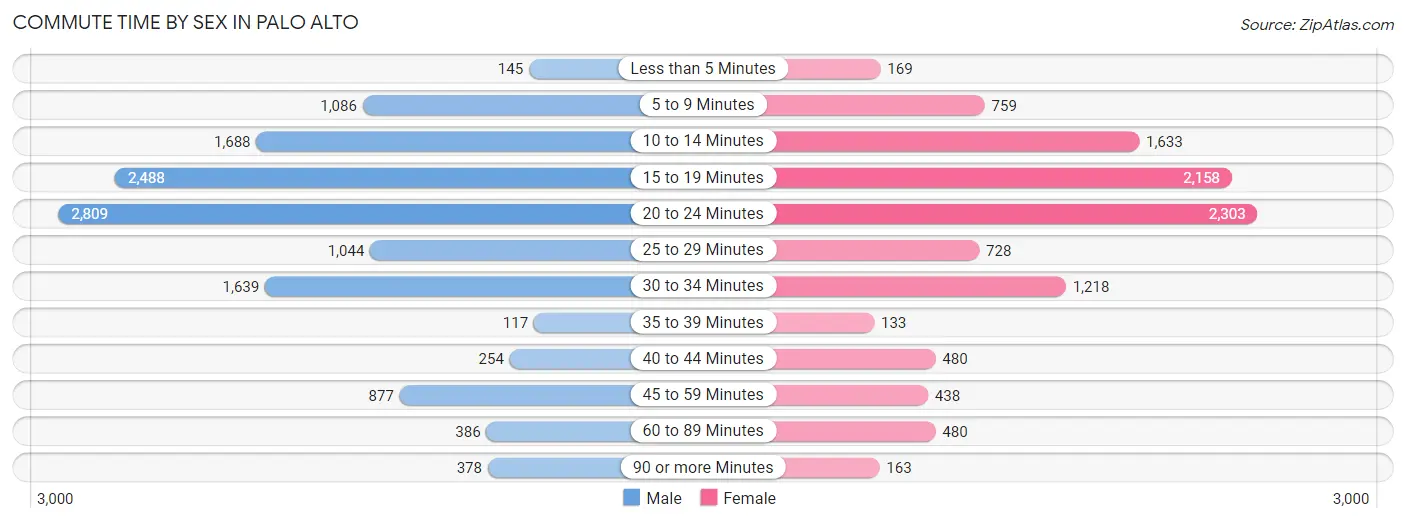
| Commute Time | Male | Female |
| Less than 5 Minutes | 145 (1.1%) | 169 (1.6%) |
| 5 to 9 Minutes | 1,086 (8.4%) | 759 (7.1%) |
| 10 to 14 Minutes | 1,688 (13.1%) | 1,633 (15.3%) |
| 15 to 19 Minutes | 2,488 (19.3%) | 2,158 (20.2%) |
| 20 to 24 Minutes | 2,809 (21.8%) | 2,303 (21.6%) |
| 25 to 29 Minutes | 1,044 (8.1%) | 728 (6.8%) |
| 30 to 34 Minutes | 1,639 (12.7%) | 1,218 (11.4%) |
| 35 to 39 Minutes | 117 (0.9%) | 133 (1.3%) |
| 40 to 44 Minutes | 254 (2.0%) | 480 (4.5%) |
| 45 to 59 Minutes | 877 (6.8%) | 438 (4.1%) |
| 60 to 89 Minutes | 386 (3.0%) | 480 (4.5%) |
| 90 or more Minutes | 378 (2.9%) | 163 (1.5%) |
Time of Departure to Work by Sex in Palo Alto
The most frequent times of departure to work in Palo Alto are 9:00 AM to 9:59 AM (2,958, 22.9%) for males and 8:00 AM to 8:29 AM (2,471, 23.2%) for females.
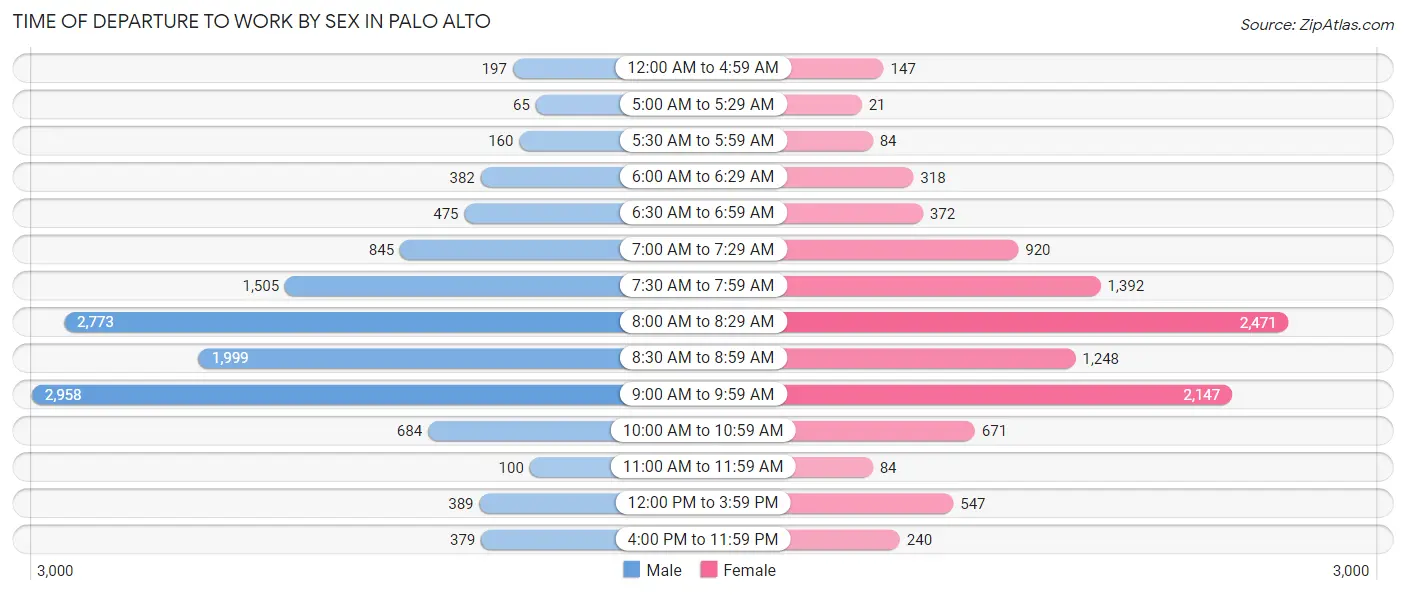
| Time of Departure | Male | Female |
| 12:00 AM to 4:59 AM | 197 (1.5%) | 147 (1.4%) |
| 5:00 AM to 5:29 AM | 65 (0.5%) | 21 (0.2%) |
| 5:30 AM to 5:59 AM | 160 (1.2%) | 84 (0.8%) |
| 6:00 AM to 6:29 AM | 382 (3.0%) | 318 (3.0%) |
| 6:30 AM to 6:59 AM | 475 (3.7%) | 372 (3.5%) |
| 7:00 AM to 7:29 AM | 845 (6.5%) | 920 (8.6%) |
| 7:30 AM to 7:59 AM | 1,505 (11.7%) | 1,392 (13.1%) |
| 8:00 AM to 8:29 AM | 2,773 (21.5%) | 2,471 (23.2%) |
| 8:30 AM to 8:59 AM | 1,999 (15.5%) | 1,248 (11.7%) |
| 9:00 AM to 9:59 AM | 2,958 (22.9%) | 2,147 (20.1%) |
| 10:00 AM to 10:59 AM | 684 (5.3%) | 671 (6.3%) |
| 11:00 AM to 11:59 AM | 100 (0.8%) | 84 (0.8%) |
| 12:00 PM to 3:59 PM | 389 (3.0%) | 547 (5.1%) |
| 4:00 PM to 11:59 PM | 379 (2.9%) | 240 (2.2%) |
| Total | 12,911 (100.0%) | 10,662 (100.0%) |
Housing Occupancy in Palo Alto
Occupancy by Ownership in Palo Alto
Of the total 26,064 dwellings in Palo Alto, owner-occupied units account for 14,587 (56.0%), while renter-occupied units make up 11,477 (44.0%).
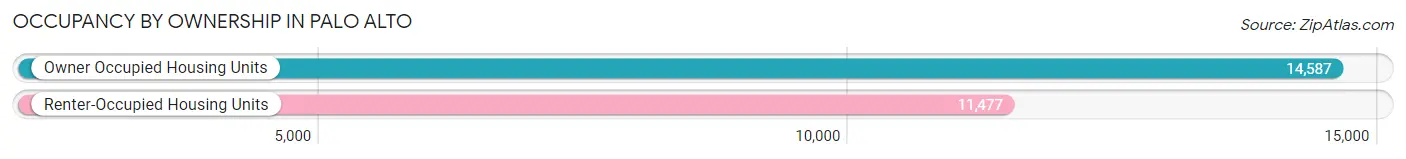
| Occupancy | # Housing Units | % Housing Units |
| Owner Occupied Housing Units | 14,587 | 56.0% |
| Renter-Occupied Housing Units | 11,477 | 44.0% |
| Total Occupied Housing Units | 26,064 | 100.0% |
Occupancy by Household Size in Palo Alto
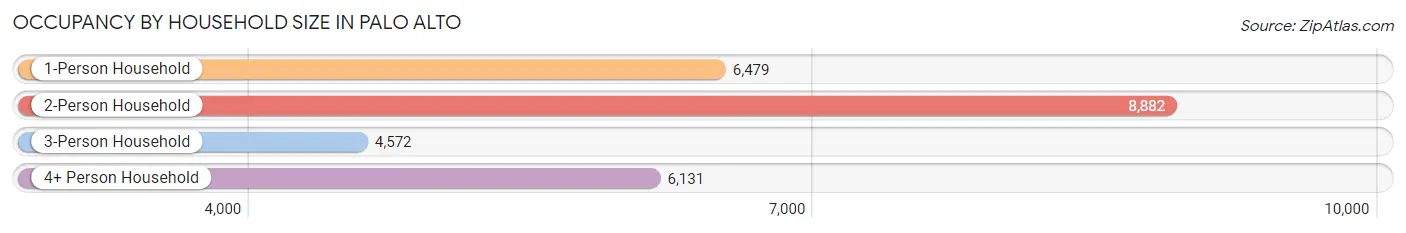
| Household Size | # Housing Units | % Housing Units |
| 1-Person Household | 6,479 | 24.9% |
| 2-Person Household | 8,882 | 34.1% |
| 3-Person Household | 4,572 | 17.5% |
| 4+ Person Household | 6,131 | 23.5% |
| Total Housing Units | 26,064 | 100.0% |
Occupancy by Ownership by Household Size in Palo Alto
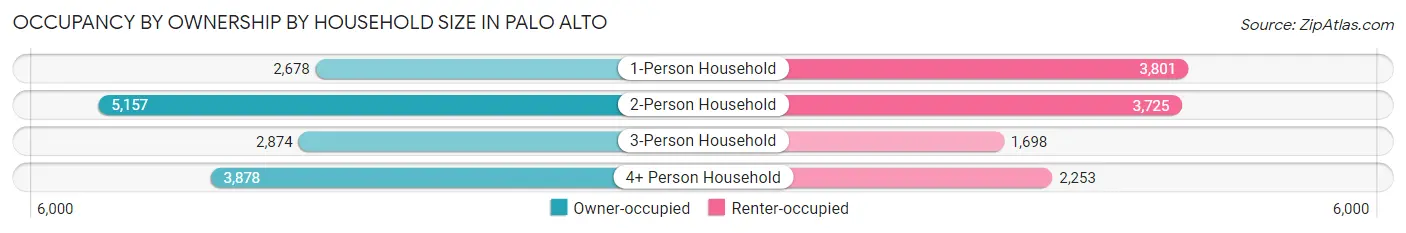
| Household Size | Owner-occupied | Renter-occupied |
| 1-Person Household | 2,678 (41.3%) | 3,801 (58.7%) |
| 2-Person Household | 5,157 (58.1%) | 3,725 (41.9%) |
| 3-Person Household | 2,874 (62.9%) | 1,698 (37.1%) |
| 4+ Person Household | 3,878 (63.2%) | 2,253 (36.7%) |
| Total Housing Units | 14,587 (56.0%) | 11,477 (44.0%) |
Occupancy by Educational Attainment in Palo Alto
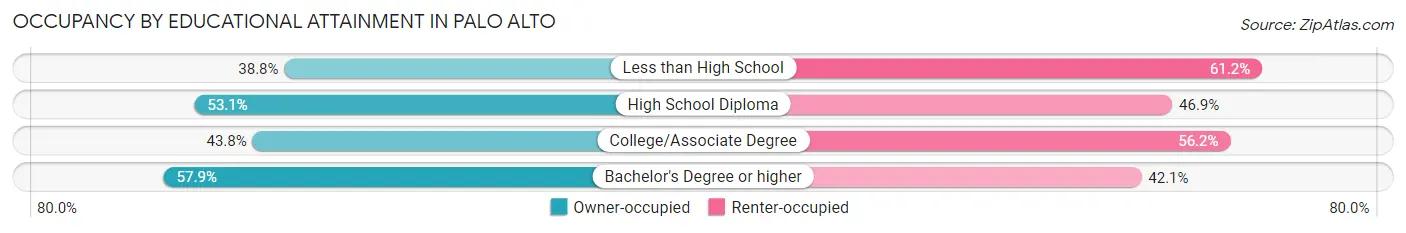
| Household Size | Owner-occupied | Renter-occupied |
| Less than High School | 239 (38.8%) | 377 (61.2%) |
| High School Diploma | 486 (53.1%) | 430 (46.9%) |
| College/Associate Degree | 1,092 (43.8%) | 1,399 (56.2%) |
| Bachelor's Degree or higher | 12,770 (57.9%) | 9,271 (42.1%) |
Occupancy by Age of Householder in Palo Alto
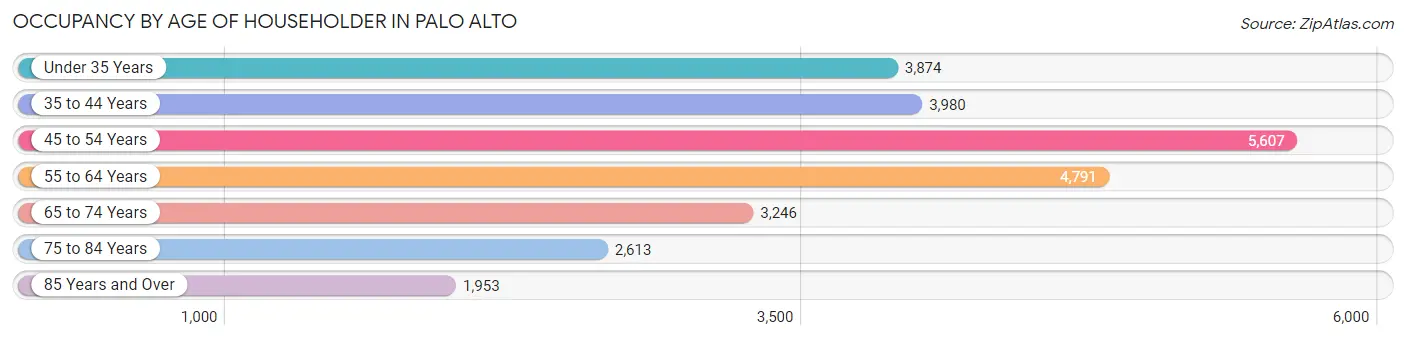
| Age Bracket | # Households | % Households |
| Under 35 Years | 3,874 | 14.9% |
| 35 to 44 Years | 3,980 | 15.3% |
| 45 to 54 Years | 5,607 | 21.5% |
| 55 to 64 Years | 4,791 | 18.4% |
| 65 to 74 Years | 3,246 | 12.4% |
| 75 to 84 Years | 2,613 | 10.0% |
| 85 Years and Over | 1,953 | 7.5% |
| Total | 26,064 | 100.0% |
Housing Finances in Palo Alto
Median Income by Occupancy in Palo Alto
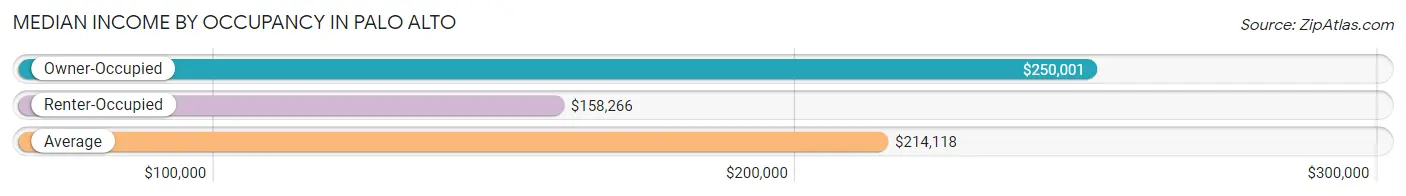
| Occupancy Type | # Households | Median Income |
| Owner-Occupied | 14,587 (56.0%) | $250,001 |
| Renter-Occupied | 11,477 (44.0%) | $158,266 |
| Average | 26,064 (100.0%) | $214,118 |
Occupancy by Householder Income Bracket in Palo Alto
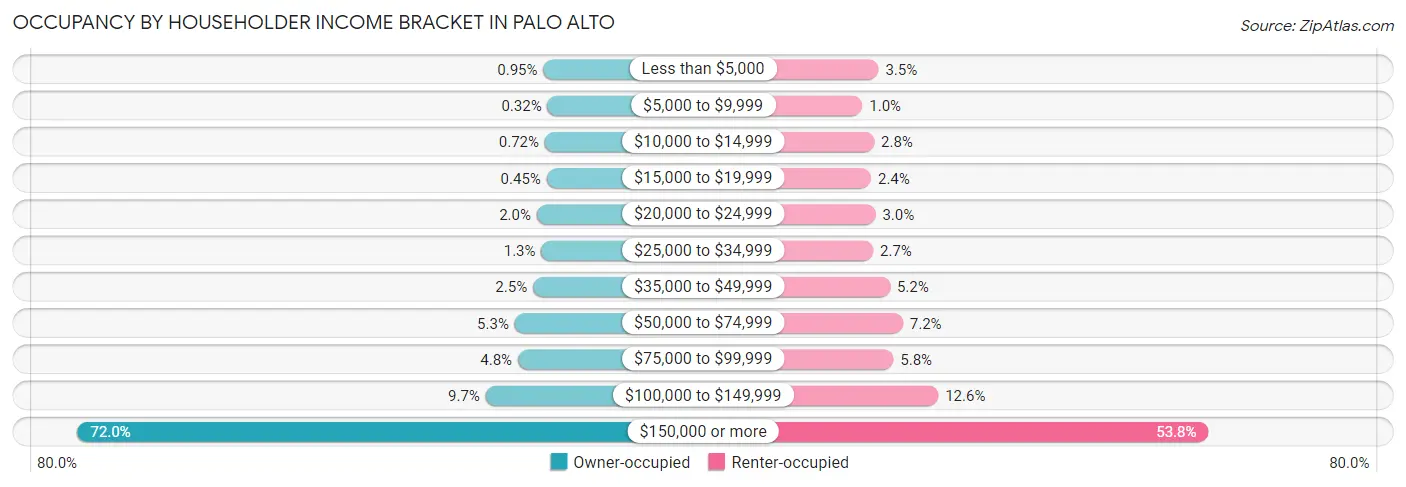
| Income Bracket | Owner-occupied | Renter-occupied |
| Less than $5,000 | 138 (0.9%) | 401 (3.5%) |
| $5,000 to $9,999 | 47 (0.3%) | 119 (1.0%) |
| $10,000 to $14,999 | 105 (0.7%) | 325 (2.8%) |
| $15,000 to $19,999 | 66 (0.4%) | 271 (2.4%) |
| $20,000 to $24,999 | 284 (1.9%) | 349 (3.0%) |
| $25,000 to $34,999 | 182 (1.3%) | 308 (2.7%) |
| $35,000 to $49,999 | 369 (2.5%) | 601 (5.2%) |
| $50,000 to $74,999 | 774 (5.3%) | 827 (7.2%) |
| $75,000 to $99,999 | 705 (4.8%) | 661 (5.8%) |
| $100,000 to $149,999 | 1,421 (9.7%) | 1,446 (12.6%) |
| $150,000 or more | 10,496 (72.0%) | 6,169 (53.7%) |
| Total | 14,587 (100.0%) | 11,477 (100.0%) |
Monthly Housing Cost Tiers in Palo Alto
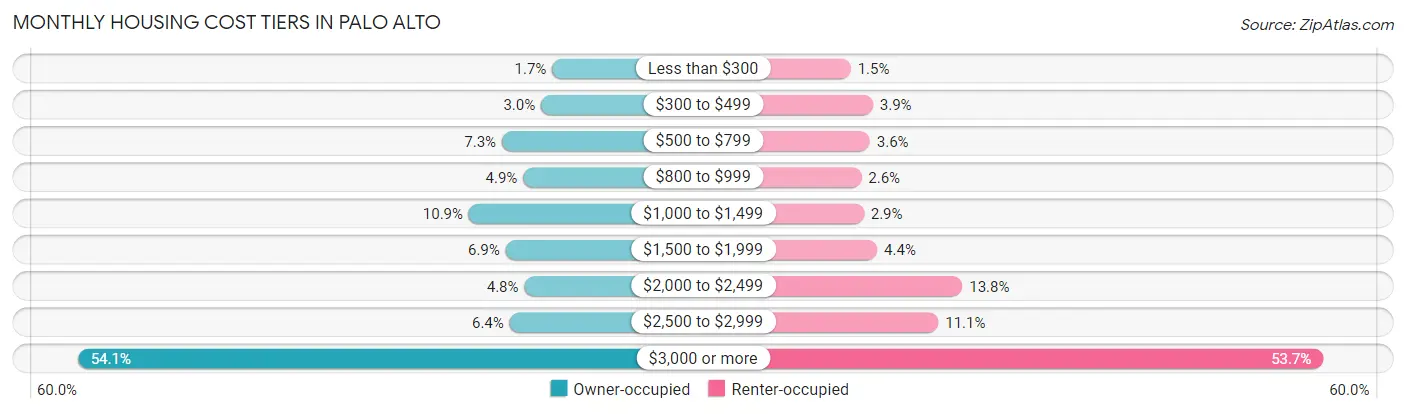
| Monthly Cost | Owner-occupied | Renter-occupied |
| Less than $300 | 251 (1.7%) | 169 (1.5%) |
| $300 to $499 | 431 (2.9%) | 449 (3.9%) |
| $500 to $799 | 1,061 (7.3%) | 411 (3.6%) |
| $800 to $999 | 718 (4.9%) | 303 (2.6%) |
| $1,000 to $1,499 | 1,593 (10.9%) | 334 (2.9%) |
| $1,500 to $1,999 | 1,001 (6.9%) | 504 (4.4%) |
| $2,000 to $2,499 | 699 (4.8%) | 1,584 (13.8%) |
| $2,500 to $2,999 | 937 (6.4%) | 1,278 (11.1%) |
| $3,000 or more | 7,896 (54.1%) | 6,159 (53.7%) |
| Total | 14,587 (100.0%) | 11,477 (100.0%) |
Physical Housing Characteristics in Palo Alto
Housing Structures in Palo Alto
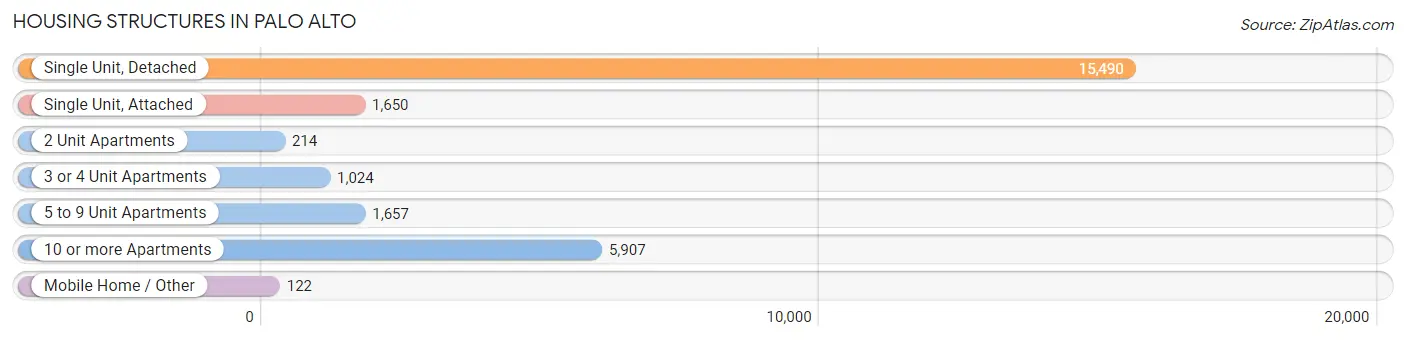
| Structure Type | # Housing Units | % Housing Units |
| Single Unit, Detached | 15,490 | 59.4% |
| Single Unit, Attached | 1,650 | 6.3% |
| 2 Unit Apartments | 214 | 0.8% |
| 3 or 4 Unit Apartments | 1,024 | 3.9% |
| 5 to 9 Unit Apartments | 1,657 | 6.4% |
| 10 or more Apartments | 5,907 | 22.7% |
| Mobile Home / Other | 122 | 0.5% |
| Total | 26,064 | 100.0% |
Housing Structures by Occupancy in Palo Alto
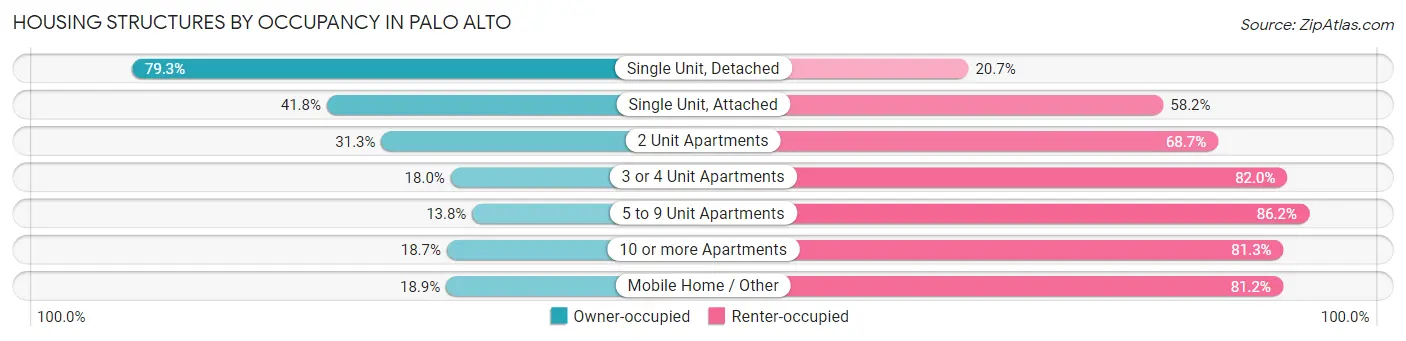
| Structure Type | Owner-occupied | Renter-occupied |
| Single Unit, Detached | 12,289 (79.3%) | 3,201 (20.7%) |
| Single Unit, Attached | 690 (41.8%) | 960 (58.2%) |
| 2 Unit Apartments | 67 (31.3%) | 147 (68.7%) |
| 3 or 4 Unit Apartments | 184 (18.0%) | 840 (82.0%) |
| 5 to 9 Unit Apartments | 229 (13.8%) | 1,428 (86.2%) |
| 10 or more Apartments | 1,105 (18.7%) | 4,802 (81.3%) |
| Mobile Home / Other | 23 (18.9%) | 99 (81.1%) |
| Total | 14,587 (56.0%) | 11,477 (44.0%) |
Housing Structures by Number of Rooms in Palo Alto
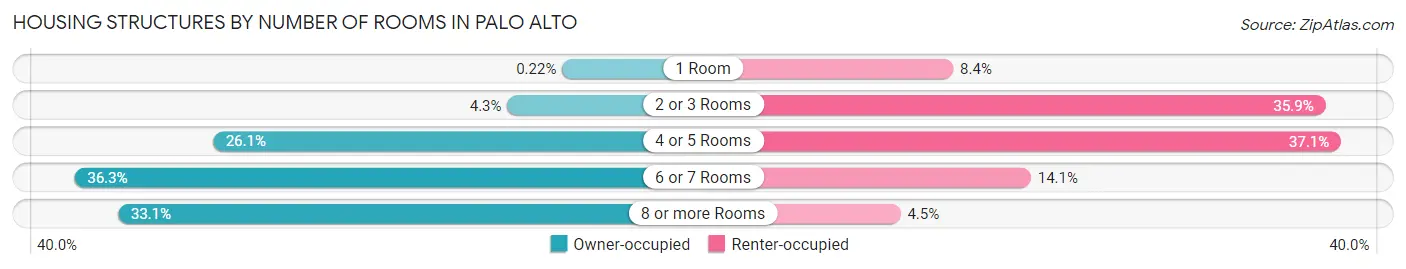
| Number of Rooms | Owner-occupied | Renter-occupied |
| 1 Room | 32 (0.2%) | 962 (8.4%) |
| 2 or 3 Rooms | 624 (4.3%) | 4,124 (35.9%) |
| 4 or 5 Rooms | 3,805 (26.1%) | 4,256 (37.1%) |
| 6 or 7 Rooms | 5,298 (36.3%) | 1,621 (14.1%) |
| 8 or more Rooms | 4,828 (33.1%) | 514 (4.5%) |
| Total | 14,587 (100.0%) | 11,477 (100.0%) |
Housing Structure by Heating Type in Palo Alto
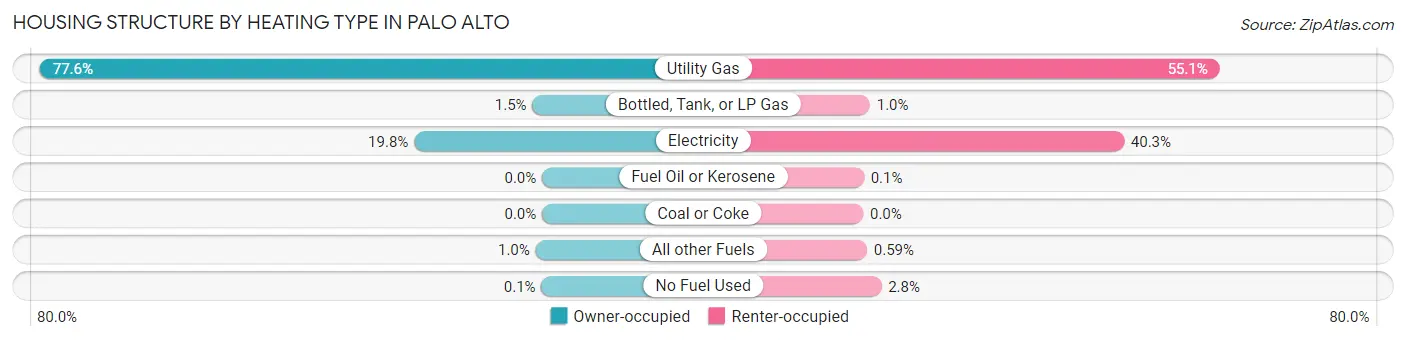
| Heating Type | Owner-occupied | Renter-occupied |
| Utility Gas | 11,325 (77.6%) | 6,327 (55.1%) |
| Bottled, Tank, or LP Gas | 217 (1.5%) | 119 (1.0%) |
| Electricity | 2,885 (19.8%) | 4,628 (40.3%) |
| Fuel Oil or Kerosene | 0 (0.0%) | 12 (0.1%) |
| Coal or Coke | 0 (0.0%) | 0 (0.0%) |
| All other Fuels | 146 (1.0%) | 68 (0.6%) |
| No Fuel Used | 14 (0.1%) | 323 (2.8%) |
| Total | 14,587 (100.0%) | 11,477 (100.0%) |
Household Vehicle Usage in Palo Alto
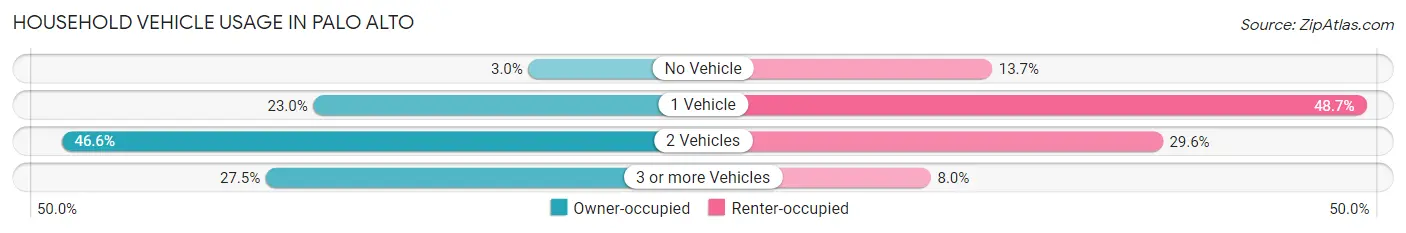
| Vehicles per Household | Owner-occupied | Renter-occupied |
| No Vehicle | 431 (2.9%) | 1,573 (13.7%) |
| 1 Vehicle | 3,360 (23.0%) | 5,585 (48.7%) |
| 2 Vehicles | 6,790 (46.6%) | 3,402 (29.6%) |
| 3 or more Vehicles | 4,006 (27.5%) | 917 (8.0%) |
| Total | 14,587 (100.0%) | 11,477 (100.0%) |
Real Estate & Mortgages in Palo Alto
Real Estate and Mortgage Overview in Palo Alto
| Characteristic | Without Mortgage | With Mortgage |
| Housing Units | 6,081 | 8,506 |
| Median Property Value | $2,000,001 | $2,000,001 |
| Median Household Income | $179,906 | $7,042 |
| Monthly Housing Costs | $1,188 | $7,303 |
| Real Estate Taxes | $8,014 | $45 |
Property Value by Mortgage Status in Palo Alto
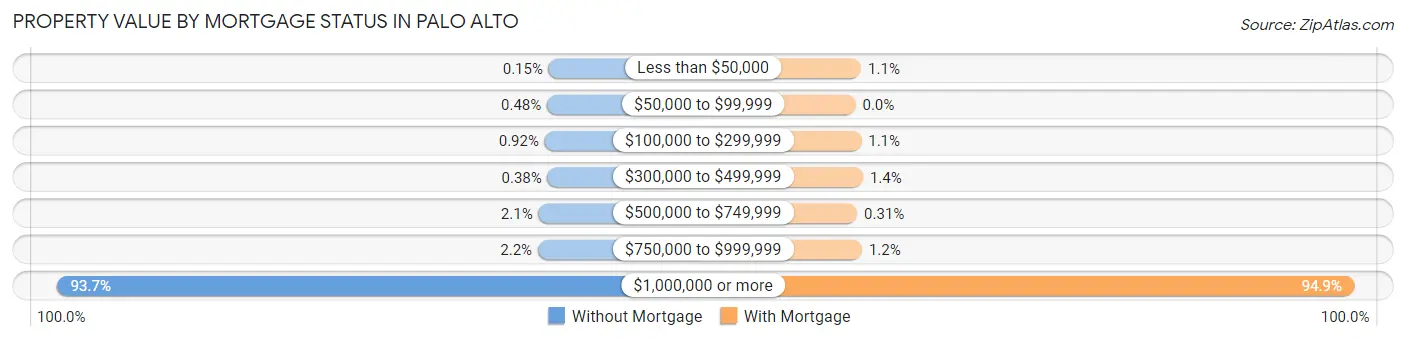
| Property Value | Without Mortgage | With Mortgage |
| Less than $50,000 | 9 (0.2%) | 91 (1.1%) |
| $50,000 to $99,999 | 29 (0.5%) | 0 (0.0%) |
| $100,000 to $299,999 | 56 (0.9%) | 93 (1.1%) |
| $300,000 to $499,999 | 23 (0.4%) | 120 (1.4%) |
| $500,000 to $749,999 | 129 (2.1%) | 26 (0.3%) |
| $750,000 to $999,999 | 135 (2.2%) | 104 (1.2%) |
| $1,000,000 or more | 5,700 (93.7%) | 8,072 (94.9%) |
| Total | 6,081 (100.0%) | 8,506 (100.0%) |
Household Income by Mortgage Status in Palo Alto
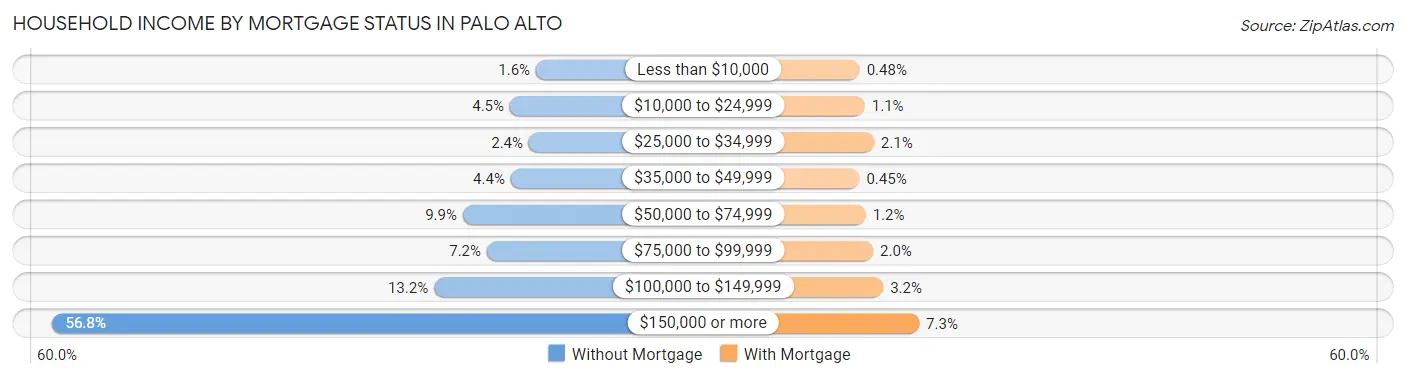
| Household Income | Without Mortgage | With Mortgage |
| Less than $10,000 | 95 (1.6%) | 41 (0.5%) |
| $10,000 to $24,999 | 276 (4.5%) | 90 (1.1%) |
| $25,000 to $34,999 | 144 (2.4%) | 179 (2.1%) |
| $35,000 to $49,999 | 270 (4.4%) | 38 (0.4%) |
| $50,000 to $74,999 | 603 (9.9%) | 99 (1.2%) |
| $75,000 to $99,999 | 436 (7.2%) | 171 (2.0%) |
| $100,000 to $149,999 | 803 (13.2%) | 269 (3.2%) |
| $150,000 or more | 3,454 (56.8%) | 618 (7.3%) |
| Total | 6,081 (100.0%) | 8,506 (100.0%) |
Property Value to Household Income Ratio in Palo Alto
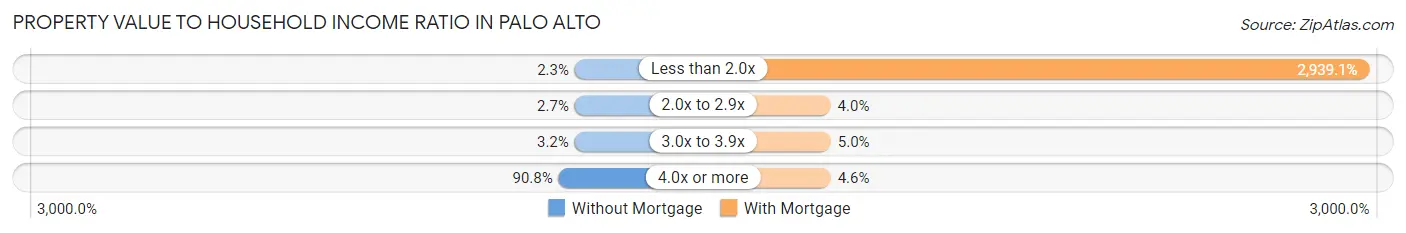
| Value-to-Income Ratio | Without Mortgage | With Mortgage |
| Less than 2.0x | 139 (2.3%) | 250,001 (2,939.1%) |
| 2.0x to 2.9x | 166 (2.7%) | 342 (4.0%) |
| 3.0x to 3.9x | 197 (3.2%) | 425 (5.0%) |
| 4.0x or more | 5,524 (90.8%) | 388 (4.6%) |
| Total | 6,081 (100.0%) | 8,506 (100.0%) |
Real Estate Taxes by Mortgage Status in Palo Alto
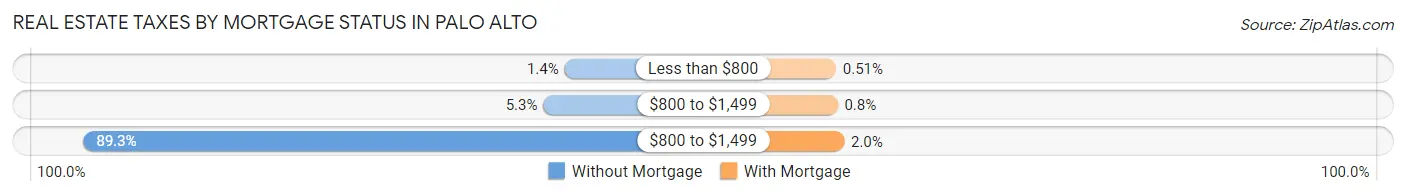
| Property Taxes | Without Mortgage | With Mortgage |
| Less than $800 | 84 (1.4%) | 43 (0.5%) |
| $800 to $1,499 | 320 (5.3%) | 68 (0.8%) |
| $800 to $1,499 | 5,429 (89.3%) | 171 (2.0%) |
| Total | 6,081 (100.0%) | 8,506 (100.0%) |
Health & Disability in Palo Alto
Health Insurance Coverage by Age in Palo Alto
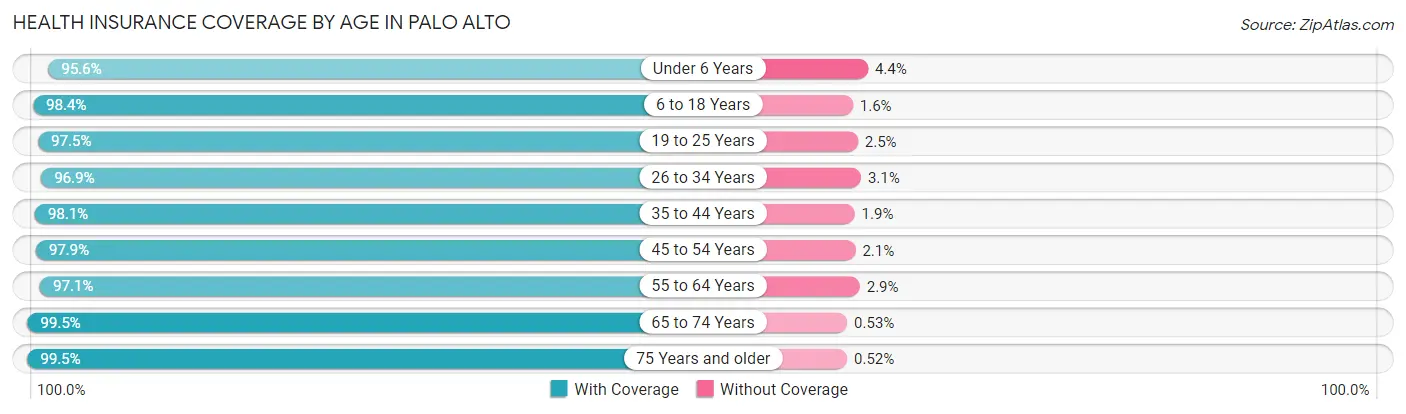
| Age Bracket | With Coverage | Without Coverage |
| Under 6 Years | 3,766 (95.6%) | 174 (4.4%) |
| 6 to 18 Years | 11,772 (98.4%) | 190 (1.6%) |
| 19 to 25 Years | 4,462 (97.5%) | 116 (2.5%) |
| 26 to 34 Years | 6,737 (96.9%) | 216 (3.1%) |
| 35 to 44 Years | 8,285 (98.1%) | 163 (1.9%) |
| 45 to 54 Years | 9,718 (97.9%) | 207 (2.1%) |
| 55 to 64 Years | 8,591 (97.1%) | 256 (2.9%) |
| 65 to 74 Years | 5,674 (99.5%) | 30 (0.5%) |
| 75 Years and older | 6,952 (99.5%) | 36 (0.5%) |
| Total | 65,957 (97.9%) | 1,388 (2.1%) |
Health Insurance Coverage by Citizenship Status in Palo Alto
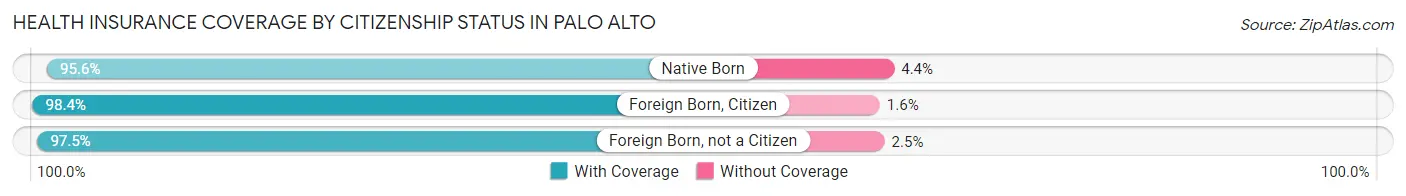
| Citizenship Status | With Coverage | Without Coverage |
| Native Born | 3,766 (95.6%) | 174 (4.4%) |
| Foreign Born, Citizen | 11,772 (98.4%) | 190 (1.6%) |
| Foreign Born, not a Citizen | 4,462 (97.5%) | 116 (2.5%) |
Health Insurance Coverage by Household Income in Palo Alto
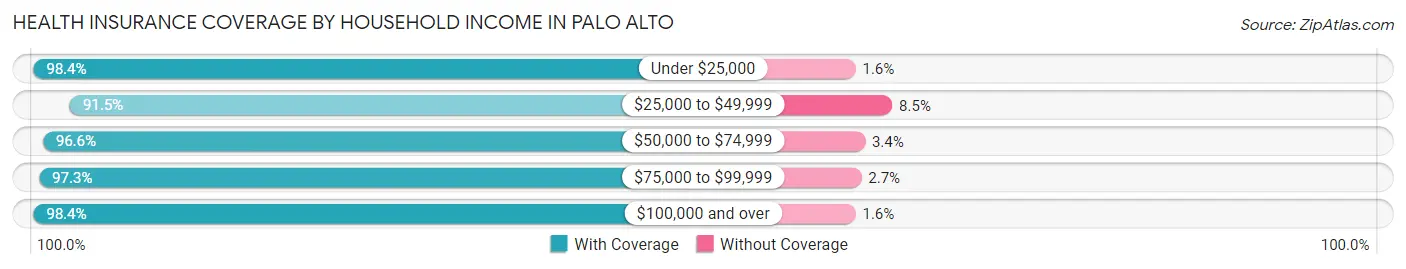
| Household Income | With Coverage | Without Coverage |
| Under $25,000 | 2,991 (98.4%) | 50 (1.6%) |
| $25,000 to $49,999 | 2,412 (91.5%) | 224 (8.5%) |
| $50,000 to $74,999 | 3,177 (96.6%) | 112 (3.4%) |
| $75,000 to $99,999 | 2,857 (97.3%) | 80 (2.7%) |
| $100,000 and over | 54,390 (98.4%) | 909 (1.6%) |
Public vs Private Health Insurance Coverage by Age in Palo Alto
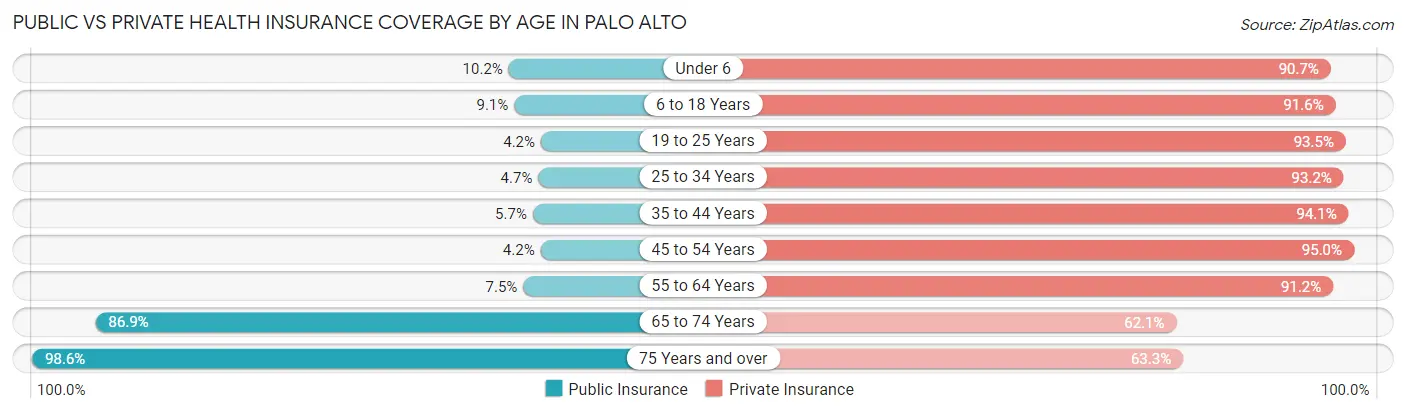
| Age Bracket | Public Insurance | Private Insurance |
| Under 6 | 400 (10.2%) | 3,575 (90.7%) |
| 6 to 18 Years | 1,093 (9.1%) | 10,961 (91.6%) |
| 19 to 25 Years | 191 (4.2%) | 4,282 (93.5%) |
| 25 to 34 Years | 324 (4.7%) | 6,477 (93.1%) |
| 35 to 44 Years | 480 (5.7%) | 7,945 (94.1%) |
| 45 to 54 Years | 421 (4.2%) | 9,433 (95.0%) |
| 55 to 64 Years | 659 (7.4%) | 8,068 (91.2%) |
| 65 to 74 Years | 4,954 (86.9%) | 3,541 (62.1%) |
| 75 Years and over | 6,892 (98.6%) | 4,425 (63.3%) |
| Total | 15,414 (22.9%) | 58,707 (87.2%) |
Disability Status by Sex by Age in Palo Alto
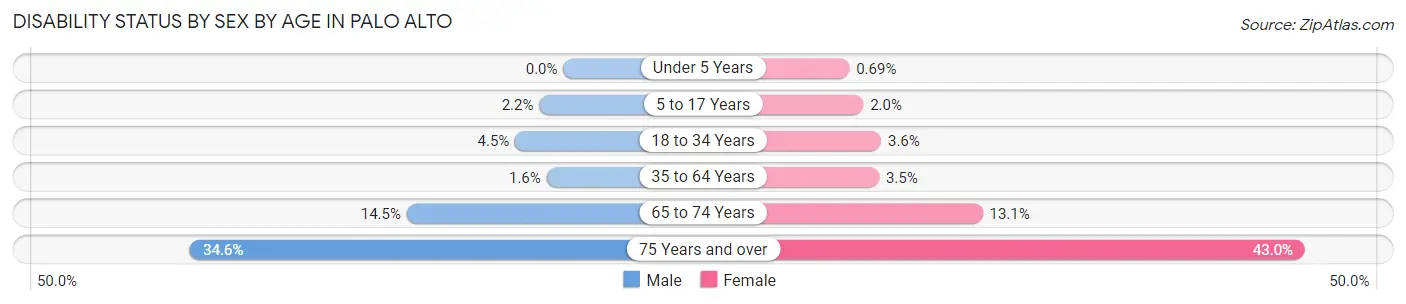
| Age Bracket | Male | Female |
| Under 5 Years | 0 (0.0%) | 13 (0.7%) |
| 5 to 17 Years | 138 (2.2%) | 115 (2.0%) |
| 18 to 34 Years | 283 (4.5%) | 214 (3.6%) |
| 35 to 64 Years | 206 (1.5%) | 479 (3.5%) |
| 65 to 74 Years | 385 (14.5%) | 399 (13.1%) |
| 75 Years and over | 919 (34.6%) | 1,863 (43.0%) |
Disability Class by Sex by Age in Palo Alto
Disability Class: Hearing Difficulty
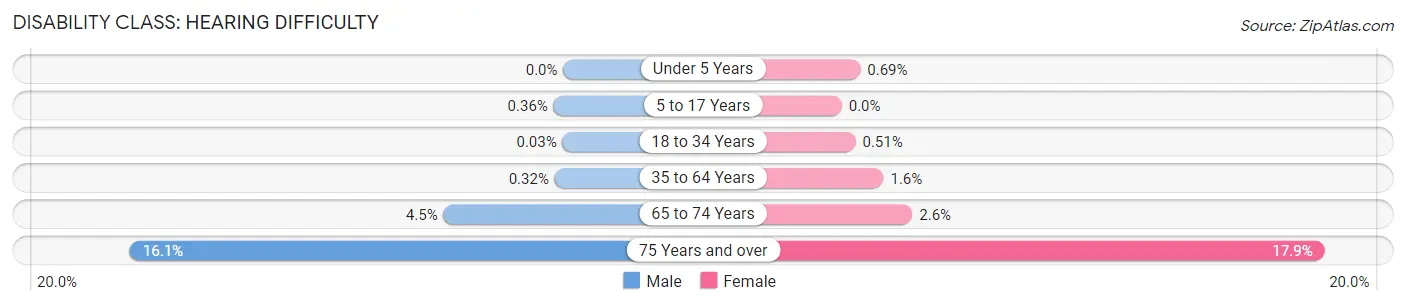
| Age Bracket | Male | Female |
| Under 5 Years | 0 (0.0%) | 13 (0.7%) |
| 5 to 17 Years | 22 (0.4%) | 0 (0.0%) |
| 18 to 34 Years | 2 (0.0%) | 30 (0.5%) |
| 35 to 64 Years | 43 (0.3%) | 215 (1.5%) |
| 65 to 74 Years | 118 (4.4%) | 80 (2.6%) |
| 75 Years and over | 427 (16.1%) | 777 (17.9%) |
Disability Class: Vision Difficulty
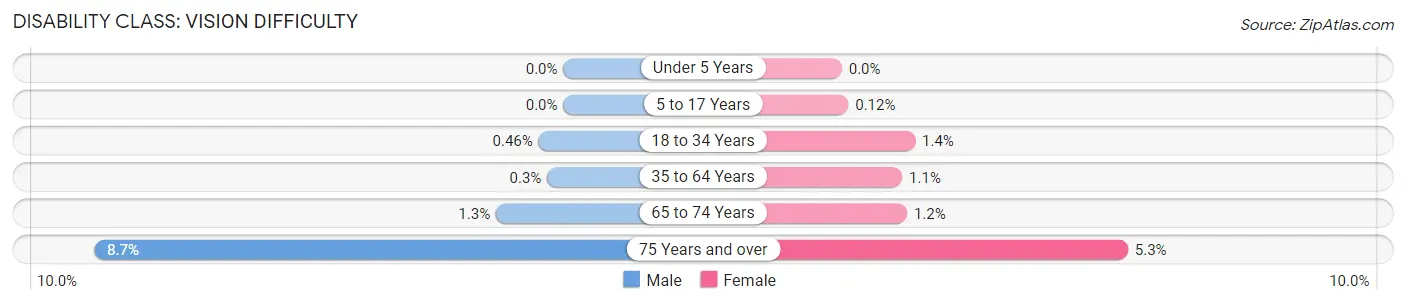
| Age Bracket | Male | Female |
| Under 5 Years | 0 (0.0%) | 0 (0.0%) |
| 5 to 17 Years | 0 (0.0%) | 7 (0.1%) |
| 18 to 34 Years | 29 (0.5%) | 80 (1.4%) |
| 35 to 64 Years | 40 (0.3%) | 156 (1.1%) |
| 65 to 74 Years | 33 (1.3%) | 37 (1.2%) |
| 75 Years and over | 231 (8.7%) | 230 (5.3%) |
Disability Class: Cognitive Difficulty
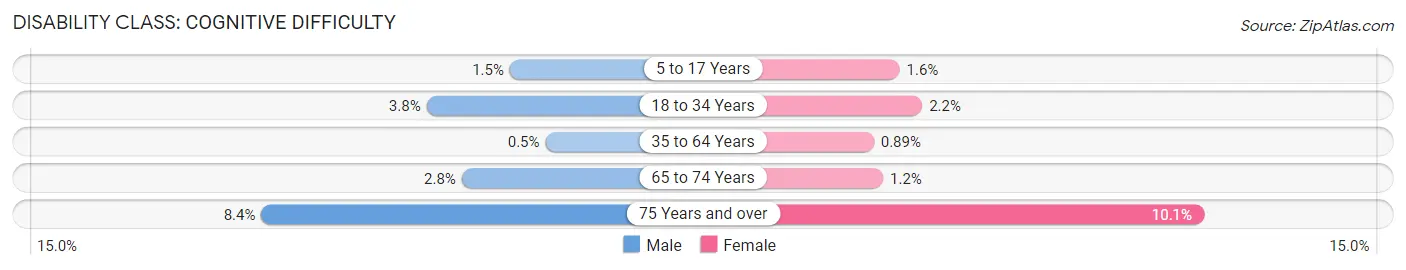
| Age Bracket | Male | Female |
| 5 to 17 Years | 92 (1.5%) | 93 (1.6%) |
| 18 to 34 Years | 241 (3.8%) | 132 (2.2%) |
| 35 to 64 Years | 67 (0.5%) | 123 (0.9%) |
| 65 to 74 Years | 75 (2.8%) | 35 (1.1%) |
| 75 Years and over | 223 (8.4%) | 437 (10.1%) |
Disability Class: Ambulatory Difficulty
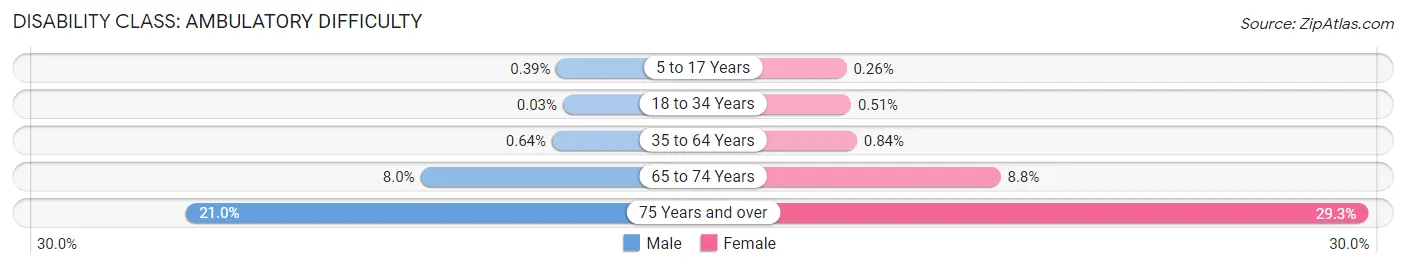
| Age Bracket | Male | Female |
| 5 to 17 Years | 24 (0.4%) | 15 (0.3%) |
| 18 to 34 Years | 2 (0.0%) | 30 (0.5%) |
| 35 to 64 Years | 85 (0.6%) | 117 (0.8%) |
| 65 to 74 Years | 211 (8.0%) | 270 (8.8%) |
| 75 Years and over | 557 (21.0%) | 1,270 (29.3%) |
Disability Class: Self-Care Difficulty
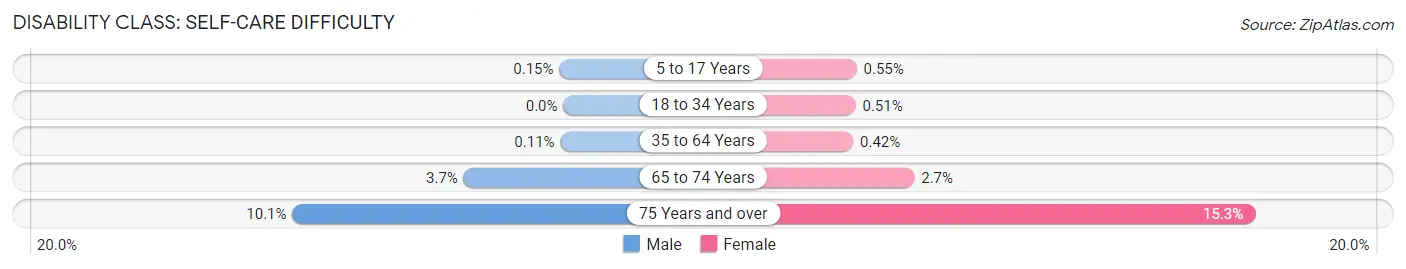
| Age Bracket | Male | Female |
| 5 to 17 Years | 9 (0.2%) | 32 (0.5%) |
| 18 to 34 Years | 0 (0.0%) | 30 (0.5%) |
| 35 to 64 Years | 15 (0.1%) | 59 (0.4%) |
| 65 to 74 Years | 98 (3.7%) | 82 (2.7%) |
| 75 Years and over | 267 (10.1%) | 665 (15.3%) |
Technology Access in Palo Alto
Computing Device Access in Palo Alto
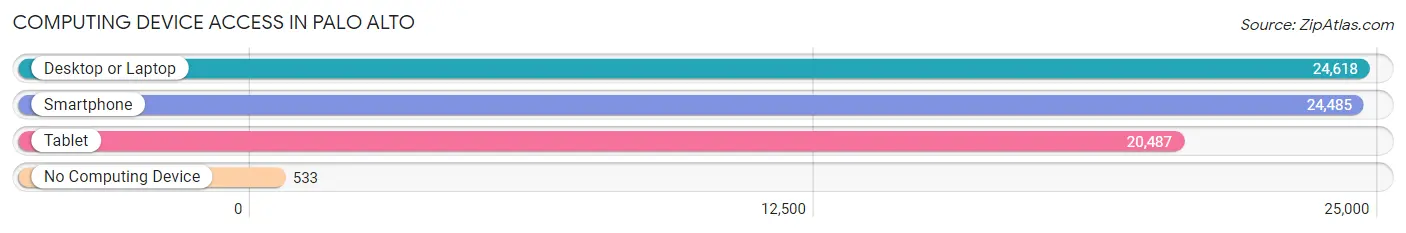
| Device Type | # Households | % Households |
| Desktop or Laptop | 24,618 | 94.5% |
| Smartphone | 24,485 | 93.9% |
| Tablet | 20,487 | 78.6% |
| No Computing Device | 533 | 2.0% |
| Total | 26,064 | 100.0% |
Internet Access in Palo Alto
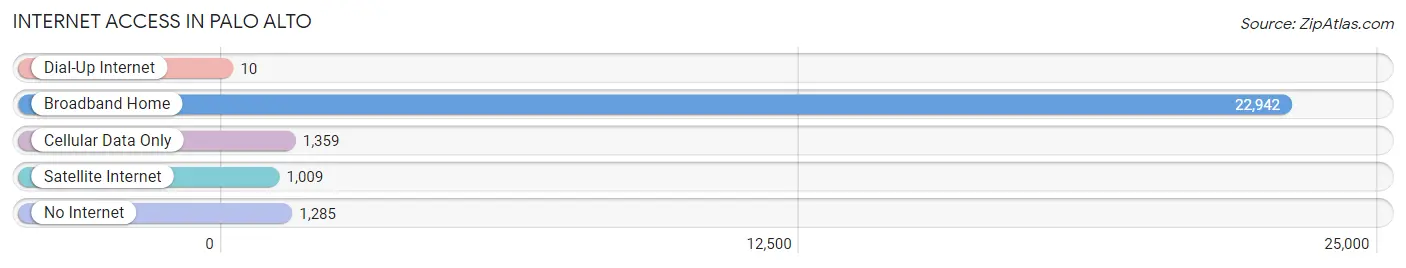
| Internet Type | # Households | % Households |
| Dial-Up Internet | 10 | 0.0% |
| Broadband Home | 22,942 | 88.0% |
| Cellular Data Only | 1,359 | 5.2% |
| Satellite Internet | 1,009 | 3.9% |
| No Internet | 1,285 | 4.9% |
| Total | 26,064 | 100.0% |
Palo Alto Summary
Palo Alto is a city located in the San Francisco Bay Area of California. It is situated in the northwest corner of Santa Clara County, and is bordered by the cities of East Palo Alto, Menlo Park, Mountain View, Los Altos, and Stanford. The city is home to Stanford University, and is known for its high-tech industry, which has earned it the nickname “Silicon Valley.”
History
Palo Alto was founded in 1894 by Leland Stanford, the founder of Stanford University. The city was named after a tall redwood tree, El Palo Alto, which was located near the San Francisquito Creek. The city was incorporated in 1894, and was the first city in Santa Clara County to be incorporated.
In the early 1900s, Palo Alto was a rural farming community, and the city’s economy was largely based on agriculture. The city’s population grew rapidly in the 1920s and 1930s, as the city became a popular destination for people looking to escape the hustle and bustle of San Francisco.
In the 1950s, the city began to experience a shift in its economy, as the high-tech industry began to move into the area. This shift was largely due to the presence of Stanford University, which attracted many high-tech companies to the area.
Geography
Palo Alto is located in the northwest corner of Santa Clara County, and is bordered by the cities of East Palo Alto, Menlo Park, Mountain View, Los Altos, and Stanford. The city is situated on the San Francisco Peninsula, and is located about 30 miles south of San Francisco.
The city has a total area of 25.3 square miles, of which 24.7 square miles is land and 0.6 square miles is water. The city is located at an elevation of about 82 feet above sea level.
Economy
Palo Alto’s economy is largely based on the high-tech industry, which has earned it the nickname “Silicon Valley.” The city is home to many high-tech companies, such as Hewlett-Packard, Google, and Facebook.
The city also has a thriving retail sector, with many shops and restaurants located in the downtown area. The city is also home to Stanford University, which is a major employer in the area.
Demographics
As of the 2010 census, the population of Palo Alto was 64,403. The racial makeup of the city was 68.2% White, 17.2% Asian, 8.2% Hispanic or Latino, and 4.2% African American.
The median household income in the city was $118,844, and the median family income was $140,936. The per capita income in the city was $60,945.
Conclusion
Palo Alto is a city located in the San Francisco Bay Area of California. It is situated in the northwest corner of Santa Clara County, and is bordered by the cities of East Palo Alto, Menlo Park, Mountain View, Los Altos, and Stanford. The city is home to Stanford University, and is known for its high-tech industry, which has earned it the nickname “Silicon Valley.” The city has a total area of 25.3 square miles, and the population was 64,403 as of the 2010 census. The city’s economy is largely based on the high-tech industry, and the median household income in the city was $118,844.
Common Questions
What is the Total Population of Palo Alto?
Total Population of Palo Alto is 67,901.
What is the Total Male Population of Palo Alto?
Total Male Population of Palo Alto is 32,789.
What is the Total Female Population of Palo Alto?
Total Female Population of Palo Alto is 35,112.
What is the Ratio of Males per 100 Females in Palo Alto?
There are 93.38 Males per 100 Females in Palo Alto.
What is the Ratio of Females per 100 Males in Palo Alto?
There are 107.08 Females per 100 Males in Palo Alto.
What is the Median Population Age in Palo Alto?
Median Population Age in Palo Alto is 42.3 Years.
What is the Average Family Size in Palo Alto
Average Family Size in Palo Alto is 3.1 People.
What is the Average Household Size in Palo Alto
Average Household Size in Palo Alto is 2.6 People.
What is Per Capita Income in Palo Alto?
Per Capita income in Palo Alto is $117,476.
What is the Median Family Income in Palo Alto?
Median Family Income in Palo Alto is $250,001.
What is the Median Household income in Palo Alto?
Median Household Income in Palo Alto is $214,118.
What is Income or Wage Gap in Palo Alto?
Income or Wage Gap in Palo Alto is 44.0%.
Women in Palo Alto earn 56.0 cents for every dollar earned by a man.
What is Family Income Deficit in Palo Alto?
Family Income Deficit in Palo Alto is $9,220.
Families that are below poverty line in Palo Alto earn $9,220 less on average than the poverty threshold level.
What is Inequality or Gini Index in Palo Alto?
Inequality or Gini Index in Palo Alto is 0.50.
How Large is the Labor Force in Palo Alto?
There are 34,812 People in the Labor Forcein in Palo Alto.
What is the Percentage of People in the Labor Force in Palo Alto?
63.4% of People are in the Labor Force in Palo Alto.
What is the Unemployment Rate in Palo Alto?
Unemployment Rate in Palo Alto is 3.3%.