Davis, CA
Davis Map
Davis Overview
67,203
TOTAL POPULATION
31,888
MALE POPULATION
35,315
FEMALE POPULATION
90.30
MALES / 100 FEMALES
110.75
FEMALES / 100 MALES
26.3
MEDIAN AGE
2.9
AVG FAMILY SIZE
2.5
AVG HOUSEHOLD SIZE
$46,899
PER CAPITA INCOME
$152,155
AVG FAMILY INCOME
$83,592
AVG HOUSEHOLD INCOME
35.5%
WAGE / INCOME GAP [ % ]
64.5¢/ $1
WAGE / INCOME GAP [ $ ]
$11,499
FAMILY INCOME DEFICIT
0.52
INEQUALITY / GINI INDEX
34,328
LABOR FORCE [ PEOPLE ]
58.2%
PERCENT IN LABOR FORCE
5.8%
UNEMPLOYMENT RATE
Davis Area Codes
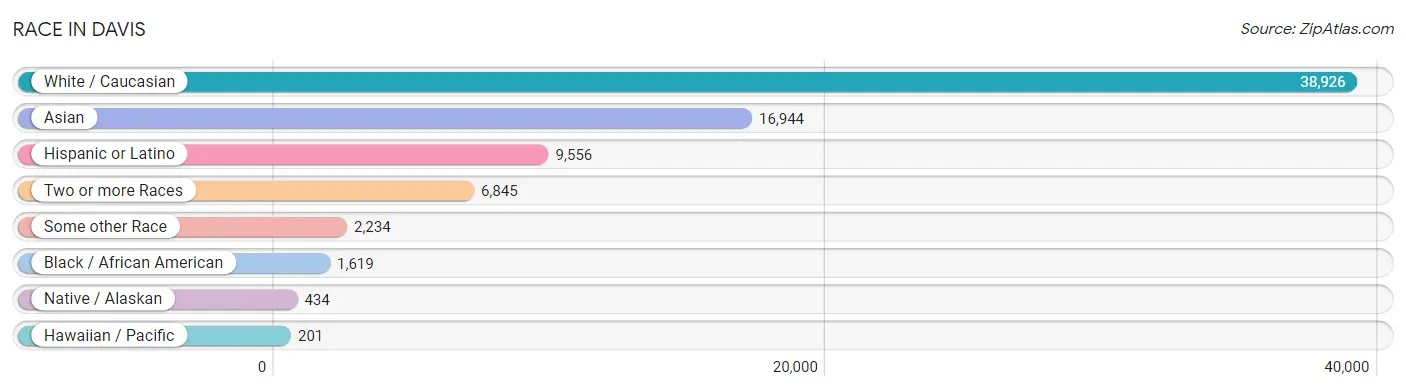
Race in Davis
The most populous races in Davis are White / Caucasian (38,926 | 57.9%), Asian (16,944 | 25.2%), and Hispanic or Latino (9,556 | 14.2%).
| Race | # Population | % Population |
| Asian | 16,944 | 25.2% |
| Black / African American | 1,619 | 2.4% |
| Hawaiian / Pacific | 201 | 0.3% |
| Hispanic or Latino | 9,556 | 14.2% |
| Native / Alaskan | 434 | 0.6% |
| White / Caucasian | 38,926 | 57.9% |
| Two or more Races | 6,845 | 10.2% |
| Some other Race | 2,234 | 3.3% |
| Total | 67,203 | 100.0% |
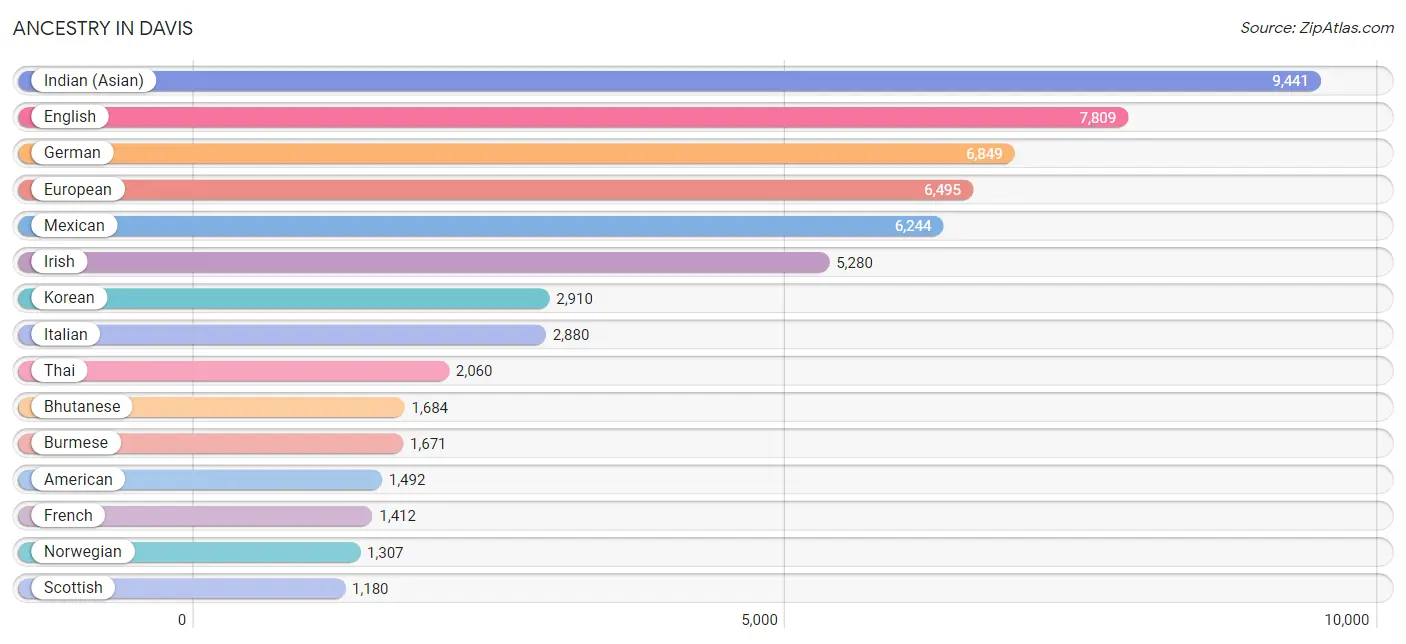
Ancestry in Davis
The most populous ancestries reported in Davis are Indian (Asian) (9,441 | 14.1%), English (7,809 | 11.6%), German (6,849 | 10.2%), European (6,495 | 9.7%), and Mexican (6,244 | 9.3%), together accounting for 54.8% of all Davis residents.
| Ancestry | # Population | % Population |
| Afghan | 82 | 0.1% |
| African | 453 | 0.7% |
| Alsatian | 9 | 0.0% |
| American | 1,492 | 2.2% |
| Apache | 22 | 0.0% |
| Arab | 584 | 0.9% |
| Argentinean | 187 | 0.3% |
| Armenian | 101 | 0.2% |
| Assyrian / Chaldean / Syriac | 14 | 0.0% |
| Australian | 11 | 0.0% |
| Austrian | 247 | 0.4% |
| Bangladeshi | 247 | 0.4% |
| Basque | 24 | 0.0% |
| Belgian | 74 | 0.1% |
| Bhutanese | 1,684 | 2.5% |
| Blackfeet | 48 | 0.1% |
| Bolivian | 4 | 0.0% |
| Brazilian | 78 | 0.1% |
| British | 578 | 0.9% |
| Bulgarian | 62 | 0.1% |
| Burmese | 1,671 | 2.5% |
| Canadian | 229 | 0.3% |
| Central American | 768 | 1.1% |
| Central American Indian | 245 | 0.4% |
| Cherokee | 100 | 0.2% |
| Chilean | 396 | 0.6% |
| Chinese | 23 | 0.0% |
| Choctaw | 100 | 0.2% |
| Colombian | 288 | 0.4% |
| Colville | 88 | 0.1% |
| Costa Rican | 20 | 0.0% |
| Cree | 15 | 0.0% |
| Croatian | 115 | 0.2% |
| Crow | 9 | 0.0% |
| Cuban | 198 | 0.3% |
| Czech | 257 | 0.4% |
| Czechoslovakian | 57 | 0.1% |
| Danish | 451 | 0.7% |
| Dutch | 518 | 0.8% |
| Eastern European | 296 | 0.4% |
| Egyptian | 35 | 0.1% |
| English | 7,809 | 11.6% |
| Estonian | 26 | 0.0% |
| Ethiopian | 33 | 0.1% |
| European | 6,495 | 9.7% |
| Filipino | 582 | 0.9% |
| Finnish | 175 | 0.3% |
| French | 1,412 | 2.1% |
| French Canadian | 358 | 0.5% |
| German | 6,849 | 10.2% |
| German Russian | 10 | 0.0% |
| Ghanaian | 34 | 0.1% |
| Greek | 109 | 0.2% |
| Guamanian / Chamorro | 49 | 0.1% |
| Guatemalan | 152 | 0.2% |
| Guyanese | 20 | 0.0% |
| Honduran | 96 | 0.1% |
| Hopi | 29 | 0.0% |
| Hungarian | 191 | 0.3% |
| Icelander | 31 | 0.1% |
| Indian (Asian) | 9,441 | 14.1% |
| Indonesian | 24 | 0.0% |
| Iranian | 597 | 0.9% |
| Iraqi | 9 | 0.0% |
| Irish | 5,280 | 7.9% |
| Iroquois | 16 | 0.0% |
| Israeli | 53 | 0.1% |
| Italian | 2,880 | 4.3% |
| Jamaican | 12 | 0.0% |
| Japanese | 245 | 0.4% |
| Jordanian | 10 | 0.0% |
| Korean | 2,910 | 4.3% |
| Laotian | 232 | 0.4% |
| Latvian | 42 | 0.1% |
| Lebanese | 229 | 0.3% |
| Lithuanian | 41 | 0.1% |
| Macedonian | 8 | 0.0% |
| Malaysian | 34 | 0.1% |
| Mexican | 6,244 | 9.3% |
| Mexican American Indian | 314 | 0.5% |
| Mongolian | 19 | 0.0% |
| Native Hawaiian | 141 | 0.2% |
| Navajo | 68 | 0.1% |
| New Zealander | 28 | 0.0% |
| Nicaraguan | 71 | 0.1% |
| Nigerian | 48 | 0.1% |
| Northern European | 339 | 0.5% |
| Norwegian | 1,307 | 1.9% |
| Okinawan | 28 | 0.0% |
| Pakistani | 33 | 0.1% |
| Palestinian | 29 | 0.0% |
| Panamanian | 19 | 0.0% |
| Paraguayan | 33 | 0.1% |
| Peruvian | 125 | 0.2% |
| Polish | 1,113 | 1.7% |
| Portuguese | 411 | 0.6% |
| Pueblo | 47 | 0.1% |
| Puerto Rican | 135 | 0.2% |
| Romanian | 83 | 0.1% |
| Russian | 517 | 0.8% |
| Salvadoran | 410 | 0.6% |
| Samoan | 166 | 0.3% |
| Scandinavian | 253 | 0.4% |
| Scotch-Irish | 708 | 1.1% |
| Scottish | 1,180 | 1.8% |
| Seminole | 7 | 0.0% |
| Senegalese | 6 | 0.0% |
| Serbian | 34 | 0.1% |
| Sioux | 22 | 0.0% |
| Slavic | 29 | 0.0% |
| Slovak | 67 | 0.1% |
| Slovene | 67 | 0.1% |
| Somali | 15 | 0.0% |
| South African | 29 | 0.0% |
| South American | 1,046 | 1.6% |
| South American Indian | 8 | 0.0% |
| Spaniard | 459 | 0.7% |
| Spanish | 416 | 0.6% |
| Sri Lankan | 998 | 1.5% |
| Subsaharan African | 858 | 1.3% |
| Sudanese | 105 | 0.2% |
| Swedish | 1,085 | 1.6% |
| Swiss | 585 | 0.9% |
| Syrian | 6 | 0.0% |
| Thai | 2,060 | 3.1% |
| Tlingit-Haida | 20 | 0.0% |
| Tongan | 90 | 0.1% |
| Turkish | 271 | 0.4% |
| Ukrainian | 199 | 0.3% |
| Venezuelan | 13 | 0.0% |
| Vietnamese | 71 | 0.1% |
| Welsh | 254 | 0.4% |
| Yakama | 17 | 0.0% |
| Yaqui | 68 | 0.1% |
| Yugoslavian | 24 | 0.0% | View All 135 Rows |
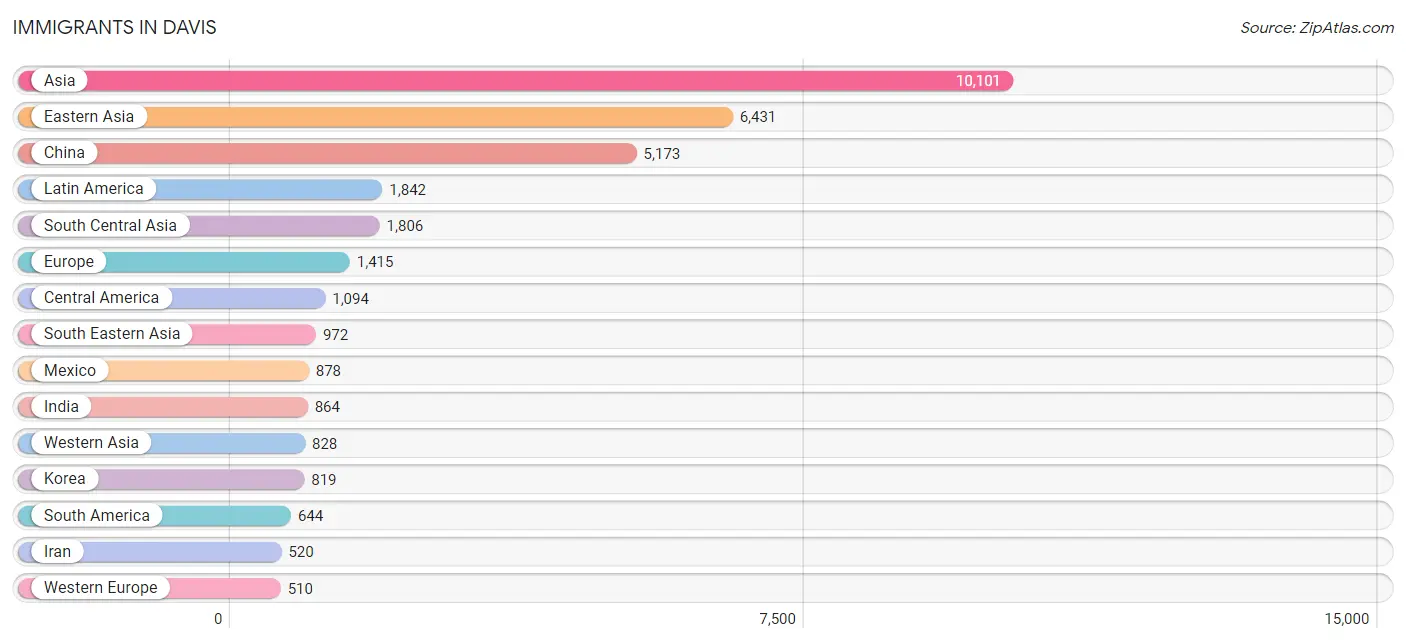
Immigrants in Davis
The most numerous immigrant groups reported in Davis came from Asia (10,101 | 15.0%), Eastern Asia (6,431 | 9.6%), China (5,173 | 7.7%), Latin America (1,842 | 2.7%), and South Central Asia (1,806 | 2.7%), together accounting for 37.7% of all Davis residents.
| Immigration Origin | # Population | % Population |
| Afghanistan | 35 | 0.1% |
| Africa | 326 | 0.5% |
| Argentina | 120 | 0.2% |
| Asia | 10,101 | 15.0% |
| Australia | 50 | 0.1% |
| Austria | 24 | 0.0% |
| Azores | 20 | 0.0% |
| Bangladesh | 194 | 0.3% |
| Belgium | 5 | 0.0% |
| Bolivia | 15 | 0.0% |
| Brazil | 69 | 0.1% |
| Bulgaria | 40 | 0.1% |
| Cambodia | 37 | 0.1% |
| Canada | 348 | 0.5% |
| Caribbean | 104 | 0.2% |
| Central America | 1,094 | 1.6% |
| Chile | 237 | 0.4% |
| China | 5,173 | 7.7% |
| Colombia | 103 | 0.2% |
| Cuba | 37 | 0.1% |
| Czechoslovakia | 16 | 0.0% |
| Denmark | 15 | 0.0% |
| Eastern Africa | 116 | 0.2% |
| Eastern Asia | 6,431 | 9.6% |
| Eastern Europe | 329 | 0.5% |
| El Salvador | 120 | 0.2% |
| England | 94 | 0.1% |
| Ethiopia | 26 | 0.0% |
| Europe | 1,415 | 2.1% |
| France | 125 | 0.2% |
| Germany | 159 | 0.2% |
| Ghana | 12 | 0.0% |
| Greece | 36 | 0.1% |
| Guatemala | 96 | 0.1% |
| Guyana | 9 | 0.0% |
| Hong Kong | 138 | 0.2% |
| Hungary | 22 | 0.0% |
| India | 864 | 1.3% |
| Indonesia | 32 | 0.1% |
| Iran | 520 | 0.8% |
| Israel | 40 | 0.1% |
| Italy | 98 | 0.2% |
| Jamaica | 17 | 0.0% |
| Japan | 439 | 0.6% |
| Kenya | 19 | 0.0% |
| Korea | 819 | 1.2% |
| Laos | 19 | 0.0% |
| Latin America | 1,842 | 2.7% |
| Lebanon | 167 | 0.3% |
| Malaysia | 70 | 0.1% |
| Mexico | 878 | 1.3% |
| Middle Africa | 22 | 0.0% |
| Nepal | 149 | 0.2% |
| Netherlands | 77 | 0.1% |
| Nigeria | 39 | 0.1% |
| Northern Africa | 46 | 0.1% |
| Northern Europe | 281 | 0.4% |
| Norway | 38 | 0.1% |
| Oceania | 97 | 0.1% |
| Pakistan | 31 | 0.1% |
| Peru | 55 | 0.1% |
| Philippines | 419 | 0.6% |
| Poland | 42 | 0.1% |
| Portugal | 46 | 0.1% |
| Romania | 15 | 0.0% |
| Russia | 25 | 0.0% |
| Saudi Arabia | 106 | 0.2% |
| Scotland | 6 | 0.0% |
| Singapore | 20 | 0.0% |
| South Africa | 76 | 0.1% |
| South America | 644 | 1.0% |
| South Central Asia | 1,806 | 2.7% |
| South Eastern Asia | 972 | 1.5% |
| Southern Europe | 295 | 0.4% |
| Spain | 115 | 0.2% |
| Sri Lanka | 5 | 0.0% |
| Sudan | 34 | 0.1% |
| Sweden | 26 | 0.0% |
| Switzerland | 120 | 0.2% |
| Syria | 12 | 0.0% |
| Taiwan | 448 | 0.7% |
| Thailand | 118 | 0.2% |
| Turkey | 349 | 0.5% |
| Ukraine | 135 | 0.2% |
| Venezuela | 36 | 0.1% |
| Vietnam | 217 | 0.3% |
| Western Africa | 66 | 0.1% |
| Western Asia | 828 | 1.2% |
| Western Europe | 510 | 0.8% |
| Yemen | 12 | 0.0% |
| Zaire | 22 | 0.0% |
| Zimbabwe | 15 | 0.0% | View All 92 Rows |
Sex and Age in Davis
Sex and Age in Davis
The most populous age groups in Davis are 20 to 24 Years (8,331 | 26.1%) for men and 20 to 24 Years (9,900 | 28.0%) for women.
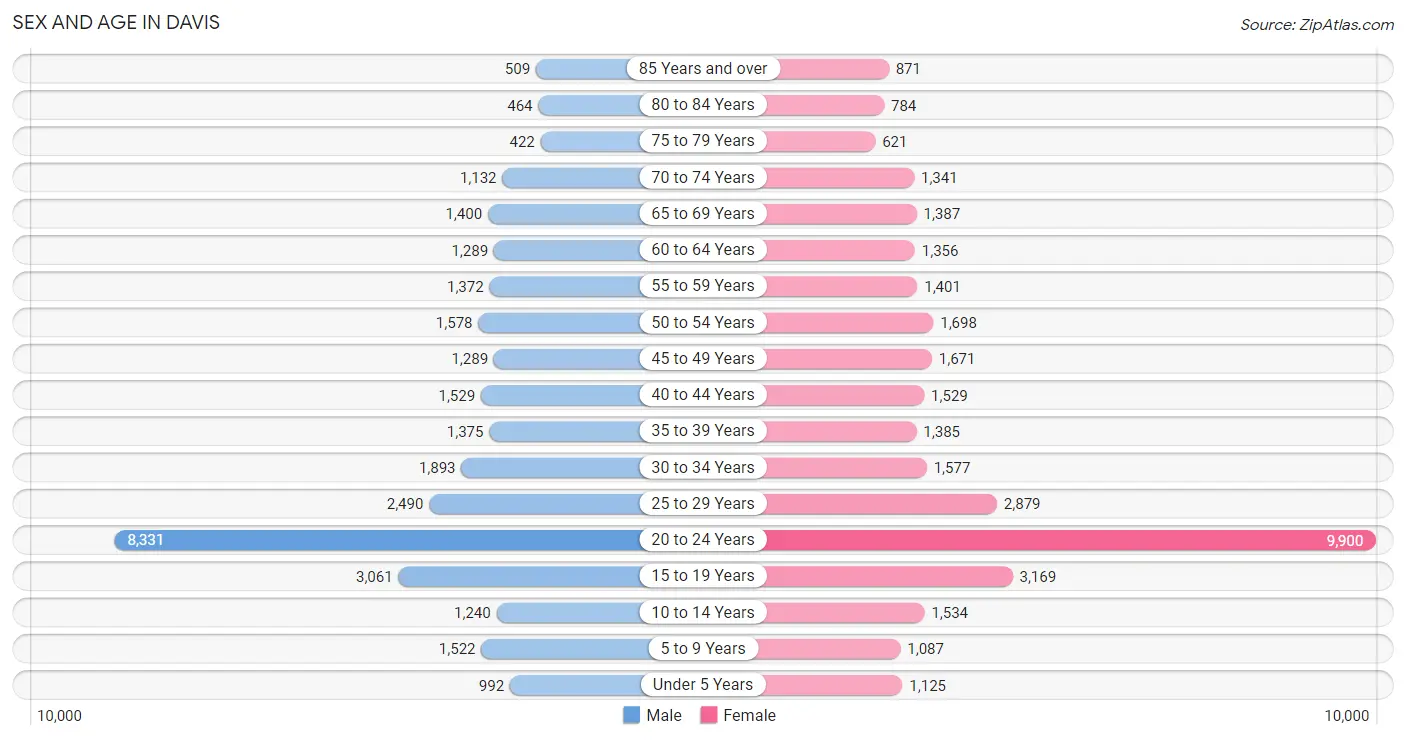
| Age Bracket | Male | Female |
| Under 5 Years | 992 (3.1%) | 1,125 (3.2%) |
| 5 to 9 Years | 1,522 (4.8%) | 1,087 (3.1%) |
| 10 to 14 Years | 1,240 (3.9%) | 1,534 (4.3%) |
| 15 to 19 Years | 3,061 (9.6%) | 3,169 (9.0%) |
| 20 to 24 Years | 8,331 (26.1%) | 9,900 (28.0%) |
| 25 to 29 Years | 2,490 (7.8%) | 2,879 (8.2%) |
| 30 to 34 Years | 1,893 (5.9%) | 1,577 (4.5%) |
| 35 to 39 Years | 1,375 (4.3%) | 1,385 (3.9%) |
| 40 to 44 Years | 1,529 (4.8%) | 1,529 (4.3%) |
| 45 to 49 Years | 1,289 (4.0%) | 1,671 (4.7%) |
| 50 to 54 Years | 1,578 (5.0%) | 1,698 (4.8%) |
| 55 to 59 Years | 1,372 (4.3%) | 1,401 (4.0%) |
| 60 to 64 Years | 1,289 (4.0%) | 1,356 (3.8%) |
| 65 to 69 Years | 1,400 (4.4%) | 1,387 (3.9%) |
| 70 to 74 Years | 1,132 (3.5%) | 1,341 (3.8%) |
| 75 to 79 Years | 422 (1.3%) | 621 (1.8%) |
| 80 to 84 Years | 464 (1.5%) | 784 (2.2%) |
| 85 Years and over | 509 (1.6%) | 871 (2.5%) |
| Total | 31,888 (100.0%) | 35,315 (100.0%) |
Families and Households in Davis
Median Family Size in Davis
The median family size in Davis is 2.93 persons per family, with single female/mother families (1,769 | 14.5%) accounting for the largest median family size of 3.02 persons per family. On the other hand, single male/father families (543 | 4.4%) represent the smallest median family size with 2.69 persons per family.
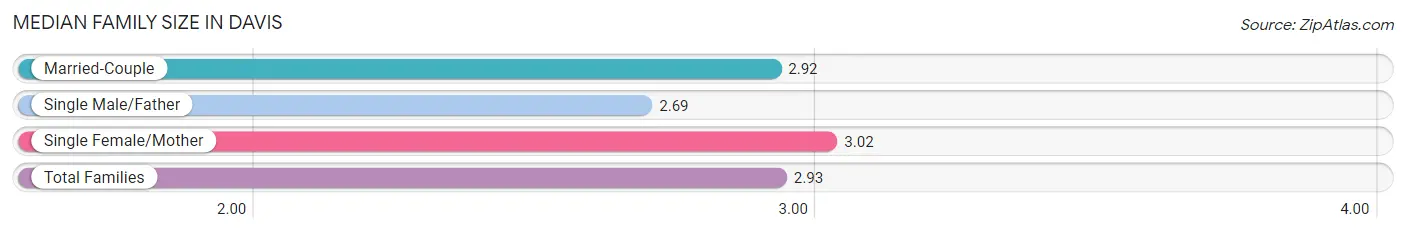
| Family Type | # Families | Family Size |
| Married-Couple | 9,923 (81.1%) | 2.92 |
| Single Male/Father | 543 (4.4%) | 2.69 |
| Single Female/Mother | 1,769 (14.5%) | 3.02 |
| Total Families | 12,235 (100.0%) | 2.93 |
Median Household Size in Davis
The median household size in Davis is 2.54 persons per household, with single female/mother households (1,769 | 6.9%) accounting for the largest median household size of 3.31 persons per household. non-family households (13,434 | 52.3%) represent the smallest median household size with 2.11 persons per household.
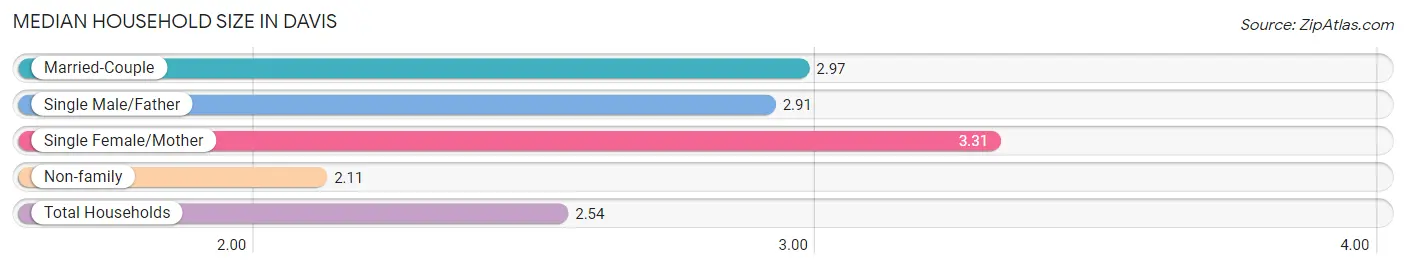
| Household Type | # Households | Household Size |
| Married-Couple | 9,923 (38.7%) | 2.97 |
| Single Male/Father | 543 (2.1%) | 2.91 |
| Single Female/Mother | 1,769 (6.9%) | 3.31 |
| Non-family | 13,434 (52.3%) | 2.11 |
| Total Households | 25,669 (100.0%) | 2.54 |
Household Size by Marriage Status in Davis
Out of a total of 25,669 households in Davis, 12,235 (47.7%) are family households, while 13,434 (52.3%) are nonfamily households. The most numerous type of family households are 2-person households, comprising 5,859, and the most common type of nonfamily households are 1-person households, comprising 6,304.
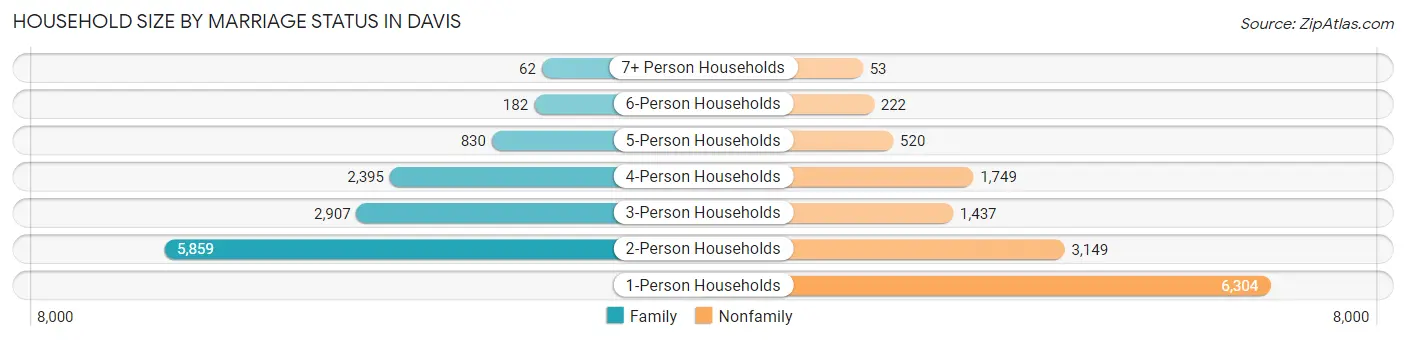
| Household Size | Family Households | Nonfamily Households |
| 1-Person Households | - | 6,304 (24.6%) |
| 2-Person Households | 5,859 (22.8%) | 3,149 (12.3%) |
| 3-Person Households | 2,907 (11.3%) | 1,437 (5.6%) |
| 4-Person Households | 2,395 (9.3%) | 1,749 (6.8%) |
| 5-Person Households | 830 (3.2%) | 520 (2.0%) |
| 6-Person Households | 182 (0.7%) | 222 (0.9%) |
| 7+ Person Households | 62 (0.2%) | 53 (0.2%) |
| Total | 12,235 (47.7%) | 13,434 (52.3%) |
Female Fertility in Davis
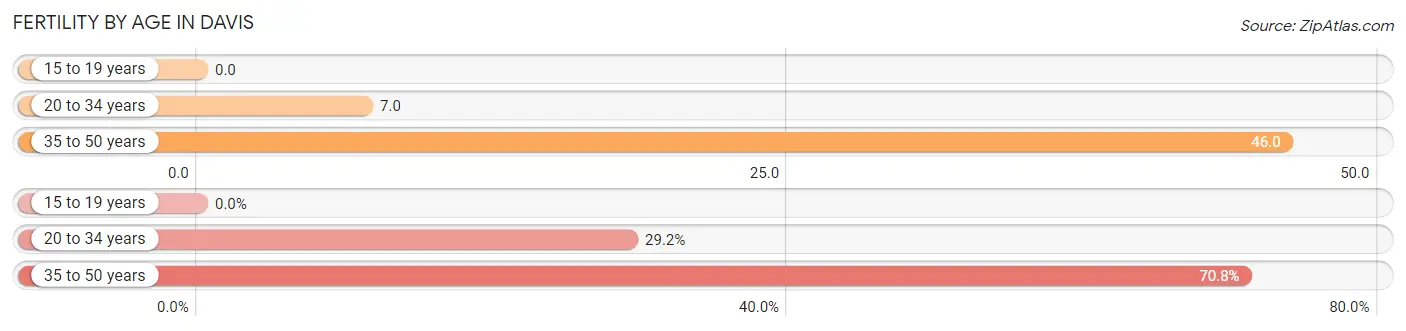
Fertility by Age in Davis
Average fertility rate in Davis is 14.0 births per 1,000 women. Women in the age bracket of 35 to 50 years have the highest fertility rate with 46.0 births per 1,000 women. Women in the age bracket of 35 to 50 years acount for 70.8% of all women with births.
| Age Bracket | Women with Births | Births / 1,000 Women |
| 15 to 19 years | 0 (0.0%) | 0.0 |
| 20 to 34 years | 94 (29.2%) | 7.0 |
| 35 to 50 years | 228 (70.8%) | 46.0 |
| Total | 322 (100.0%) | 14.0 |
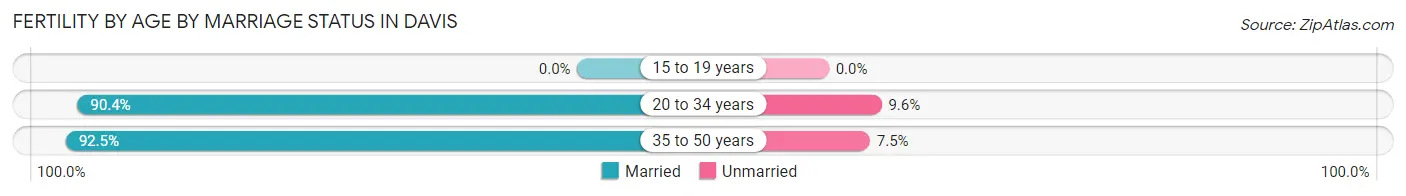
Fertility by Age by Marriage Status in Davis
91.9% of women with births (322) in Davis are married. The highest percentage of unmarried women with births falls into 20 to 34 years age bracket with 9.6% of them unmarried at the time of birth, while the lowest percentage of unmarried women with births belong to 35 to 50 years age bracket with 7.5% of them unmarried.
| Age Bracket | Married | Unmarried |
| 15 to 19 years | 0 (0.0%) | 0 (0.0%) |
| 20 to 34 years | 85 (90.4%) | 9 (9.6%) |
| 35 to 50 years | 211 (92.5%) | 17 (7.5%) |
| Total | 296 (91.9%) | 26 (8.1%) |
Fertility by Education in Davis
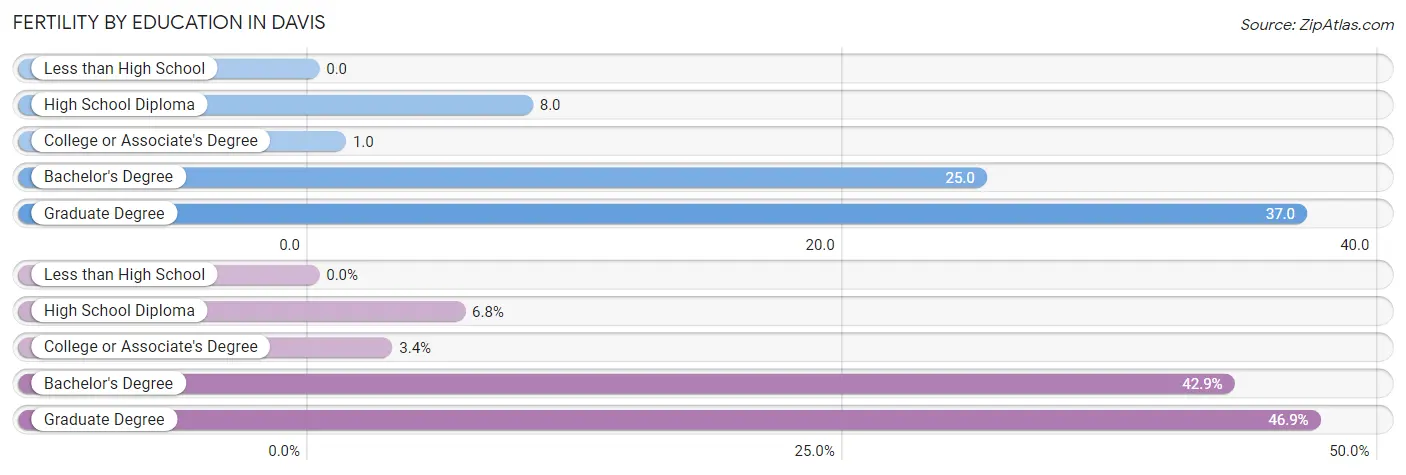
| Educational Attainment | Women with Births | Births / 1,000 Women |
| Less than High School | 0 (0.0%) | 0.0 |
| High School Diploma | 22 (6.8%) | 8.0 |
| College or Associate's Degree | 11 (3.4%) | 1.0 |
| Bachelor's Degree | 138 (42.9%) | 25.0 |
| Graduate Degree | 151 (46.9%) | 37.0 |
| Total | 322 (100.0%) | 14.0 |
Fertility by Education by Marriage Status in Davis
8.1% of women with births in Davis are unmarried. Women with the educational attainment of high school diploma are most likely to be married with 100.0% of them married at childbirth, while women with the educational attainment of college or associate's degree are least likely to be married with 100.0% of them unmarried at childbirth.
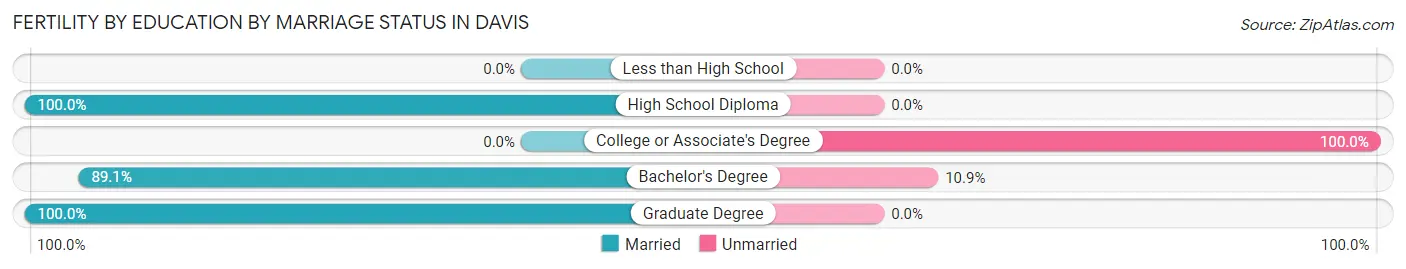
| Educational Attainment | Married | Unmarried |
| Less than High School | 0 (0.0%) | 0 (0.0%) |
| High School Diploma | 22 (100.0%) | 0 (0.0%) |
| College or Associate's Degree | 0 (0.0%) | 11 (100.0%) |
| Bachelor's Degree | 123 (89.1%) | 15 (10.9%) |
| Graduate Degree | 151 (100.0%) | 0 (0.0%) |
| Total | 296 (91.9%) | 26 (8.1%) |
Income in Davis
Income Overview in Davis
Per Capita Income in Davis is $46,899, while median incomes of families and households are $152,155 and $83,592 respectively.
| Characteristic | Number | Measure |
| Per Capita Income | 67,203 | $46,899 |
| Median Family Income | 12,235 | $152,155 |
| Mean Family Income | 12,235 | $183,172 |
| Median Household Income | 25,669 | $83,592 |
| Mean Household Income | 25,669 | $121,915 |
| Income Deficit | 12,235 | $11,499 |
| Wage / Income Gap (%) | 67,203 | 35.52% |
| Wage / Income Gap ($) | 67,203 | 64.48¢ per $1 |
| Gini / Inequality Index | 67,203 | 0.52 |
Earnings by Sex in Davis
Average Earnings in Davis are $34,418, $42,143 for men and $27,175 for women, a difference of 35.5%.
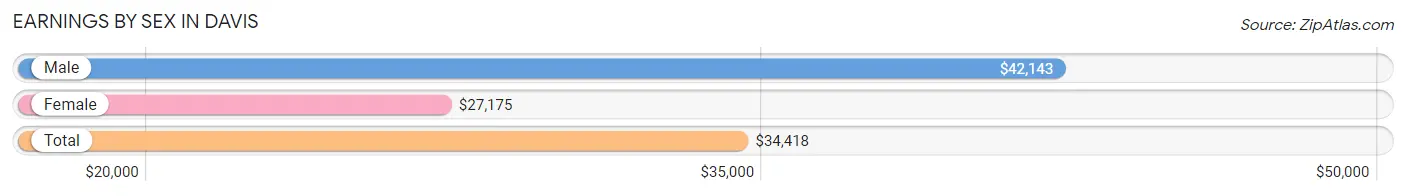
| Sex | Number | Average Earnings |
| Male | 18,012 (48.0%) | $42,143 |
| Female | 19,481 (52.0%) | $27,175 |
| Total | 37,493 (100.0%) | $34,418 |
Earnings by Sex by Income Bracket in Davis
The most common earnings brackets in Davis are $100,000+ for men (4,665 | 25.9%) and $100,000+ for women (3,122 | 16.0%).
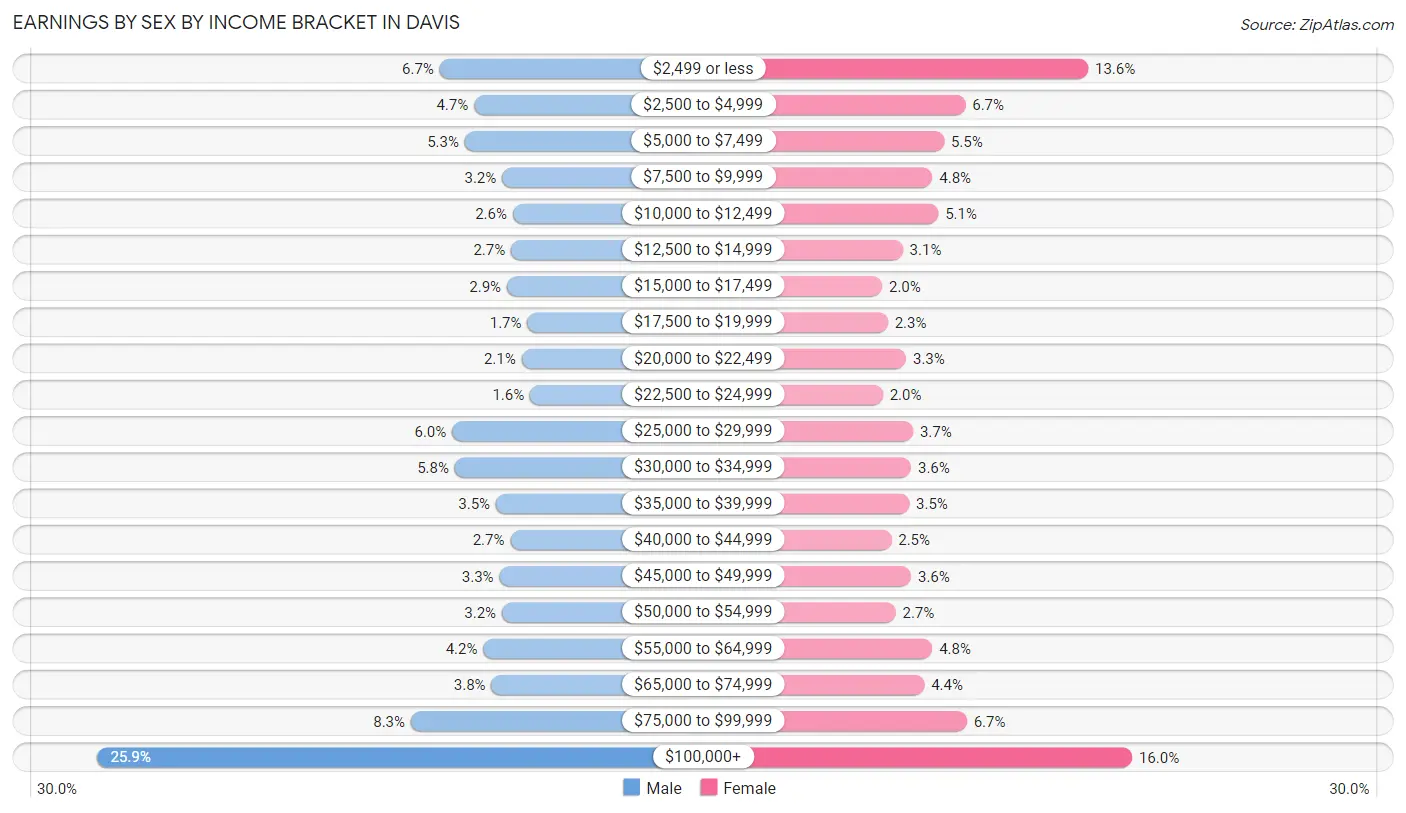
| Income | Male | Female |
| $2,499 or less | 1,201 (6.7%) | 2,641 (13.6%) |
| $2,500 to $4,999 | 854 (4.7%) | 1,297 (6.7%) |
| $5,000 to $7,499 | 948 (5.3%) | 1,064 (5.5%) |
| $7,500 to $9,999 | 569 (3.2%) | 938 (4.8%) |
| $10,000 to $12,499 | 461 (2.6%) | 1,001 (5.1%) |
| $12,500 to $14,999 | 479 (2.7%) | 612 (3.1%) |
| $15,000 to $17,499 | 521 (2.9%) | 385 (2.0%) |
| $17,500 to $19,999 | 313 (1.7%) | 448 (2.3%) |
| $20,000 to $22,499 | 372 (2.1%) | 649 (3.3%) |
| $22,500 to $24,999 | 286 (1.6%) | 394 (2.0%) |
| $25,000 to $29,999 | 1,076 (6.0%) | 725 (3.7%) |
| $30,000 to $34,999 | 1,048 (5.8%) | 703 (3.6%) |
| $35,000 to $39,999 | 632 (3.5%) | 682 (3.5%) |
| $40,000 to $44,999 | 487 (2.7%) | 487 (2.5%) |
| $45,000 to $49,999 | 597 (3.3%) | 703 (3.6%) |
| $50,000 to $54,999 | 571 (3.2%) | 533 (2.7%) |
| $55,000 to $64,999 | 761 (4.2%) | 936 (4.8%) |
| $65,000 to $74,999 | 677 (3.8%) | 848 (4.3%) |
| $75,000 to $99,999 | 1,494 (8.3%) | 1,313 (6.7%) |
| $100,000+ | 4,665 (25.9%) | 3,122 (16.0%) |
| Total | 18,012 (100.0%) | 19,481 (100.0%) |
Earnings by Sex by Educational Attainment in Davis
Average earnings in Davis are $76,996 for men and $56,302 for women, a difference of 26.9%. Men with an educational attainment of graduate degree enjoy the highest average annual earnings of $112,912, while those with high school diploma education earn the least with $34,250. Women with an educational attainment of graduate degree earn the most with the average annual earnings of $83,363, while those with high school diploma education have the smallest earnings of $24,526.
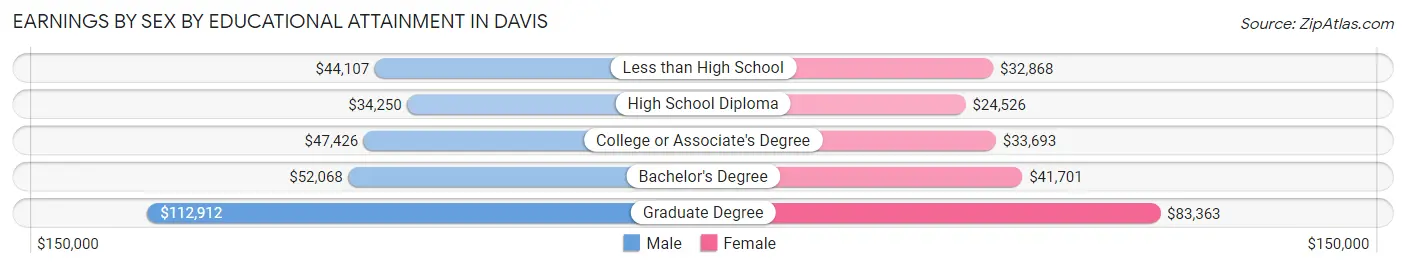
| Educational Attainment | Male Income | Female Income |
| Less than High School | $44,107 | $32,868 |
| High School Diploma | $34,250 | $24,526 |
| College or Associate's Degree | $47,426 | $33,693 |
| Bachelor's Degree | $52,068 | $41,701 |
| Graduate Degree | $112,912 | $83,363 |
| Total | $76,996 | $56,302 |
Family Income in Davis
Family Income Brackets in Davis
According to the Davis family income data, there are 4,356 families falling into the $200,000+ income range, which is the most common income bracket and makes up 35.6% of all families. Conversely, the $10,000 to $14,999 income bracket is the least frequent group with only 196 families (1.6%) belonging to this category.
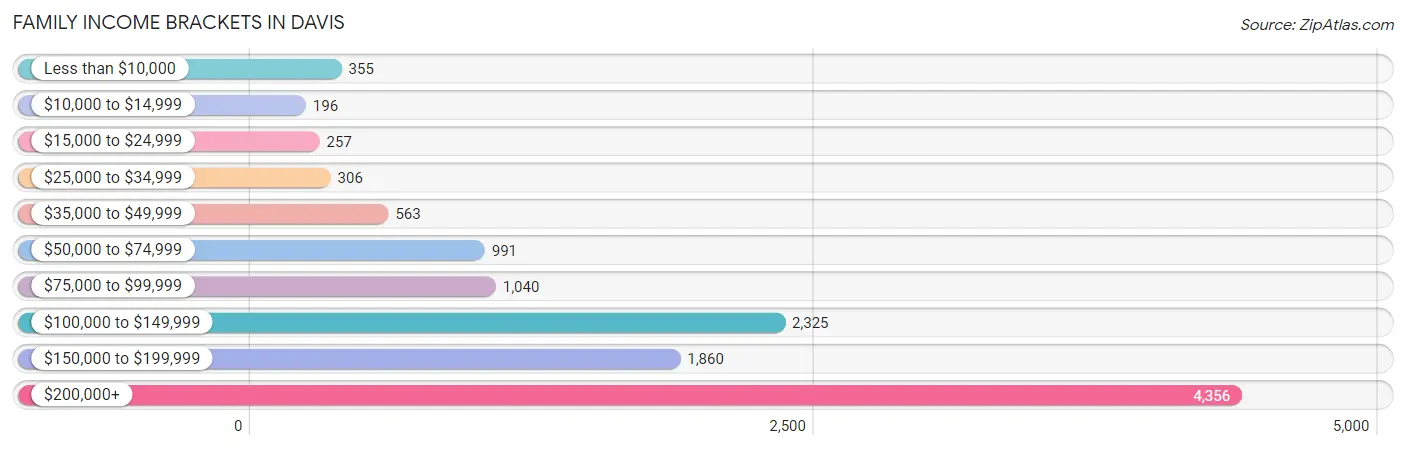
| Income Bracket | # Families | % Families |
| Less than $10,000 | 355 | 2.9% |
| $10,000 to $14,999 | 196 | 1.6% |
| $15,000 to $24,999 | 257 | 2.1% |
| $25,000 to $34,999 | 306 | 2.5% |
| $35,000 to $49,999 | 563 | 4.6% |
| $50,000 to $74,999 | 991 | 8.1% |
| $75,000 to $99,999 | 1,040 | 8.5% |
| $100,000 to $149,999 | 2,325 | 19.0% |
| $150,000 to $199,999 | 1,860 | 15.2% |
| $200,000+ | 4,356 | 35.6% |
Family Income by Famaliy Size in Davis
6-person families (121 | 1.0%) account for the highest median family income in Davis with $250,001 per family, while 2-person families (6,232 | 50.9%) have the highest median income of $60,655 per family member.
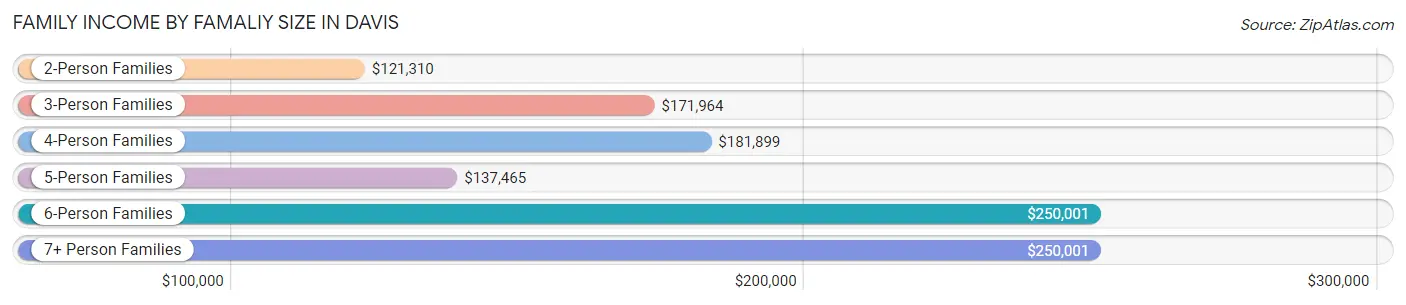
| Income Bracket | # Families | Median Income |
| 2-Person Families | 6,232 (50.9%) | $121,310 |
| 3-Person Families | 2,862 (23.4%) | $171,964 |
| 4-Person Families | 2,269 (18.5%) | $181,899 |
| 5-Person Families | 695 (5.7%) | $137,465 |
| 6-Person Families | 121 (1.0%) | $250,001 |
| 7+ Person Families | 56 (0.5%) | $250,001 |
| Total | 12,235 (100.0%) | $152,155 |
Family Income by Number of Earners in Davis
The median family income in Davis is $152,155, with families comprising 3+ earners (948) having the highest median family income of $222,308, while families with 1 earner (3,657) have the lowest median family income of $115,063, accounting for 7.7% and 29.9% of families, respectively.
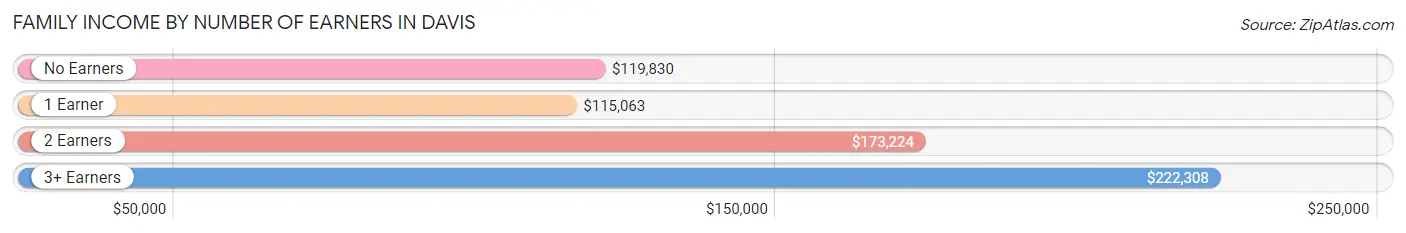
| Number of Earners | # Families | Median Income |
| No Earners | 2,193 (17.9%) | $119,830 |
| 1 Earner | 3,657 (29.9%) | $115,063 |
| 2 Earners | 5,437 (44.4%) | $173,224 |
| 3+ Earners | 948 (7.7%) | $222,308 |
| Total | 12,235 (100.0%) | $152,155 |
Household Income in Davis
Household Income Brackets in Davis
With 5,005 households falling in the category, the $200,000+ income range is the most frequent in Davis, accounting for 19.5% of all households. In contrast, only 950 households (3.7%) fall into the $10,000 to $14,999 income bracket, making it the least populous group.
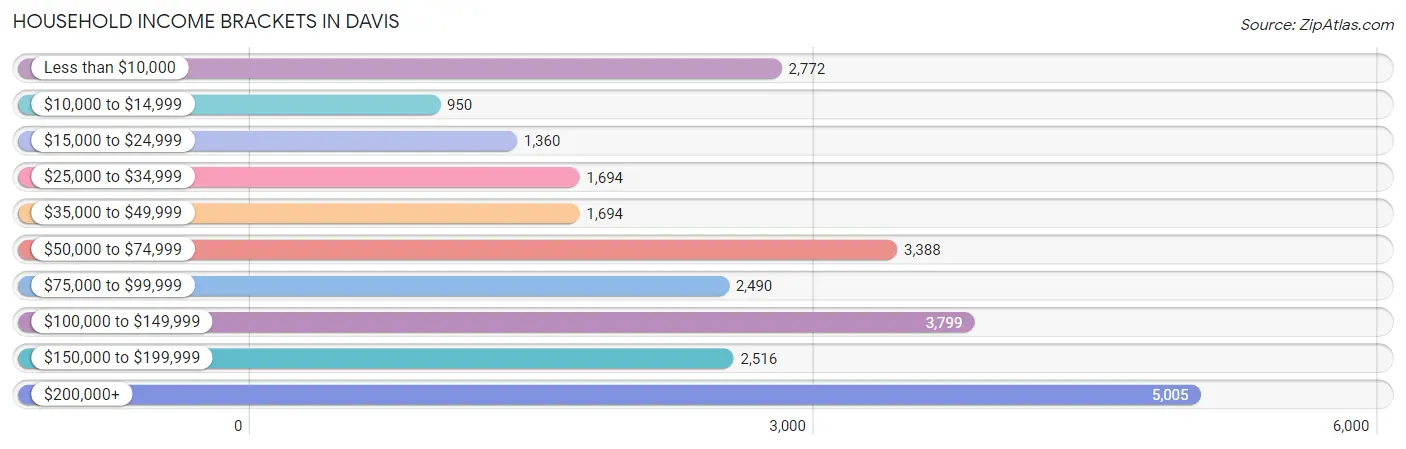
| Income Bracket | # Households | % Households |
| Less than $10,000 | 2,772 | 10.8% |
| $10,000 to $14,999 | 950 | 3.7% |
| $15,000 to $24,999 | 1,360 | 5.3% |
| $25,000 to $34,999 | 1,694 | 6.6% |
| $35,000 to $49,999 | 1,694 | 6.6% |
| $50,000 to $74,999 | 3,388 | 13.2% |
| $75,000 to $99,999 | 2,490 | 9.7% |
| $100,000 to $149,999 | 3,799 | 14.8% |
| $150,000 to $199,999 | 2,516 | 9.8% |
| $200,000+ | 5,005 | 19.5% |
Household Income by Householder Age in Davis
The median household income in Davis is $83,592, with the highest median household income of $154,434 found in the 45 to 64 years age bracket for the primary householder. A total of 6,448 households (25.1%) fall into this category. Meanwhile, the 15 to 24 years age bracket for the primary householder has the lowest median household income of $26,255, with 6,642 households (25.9%) in this group.
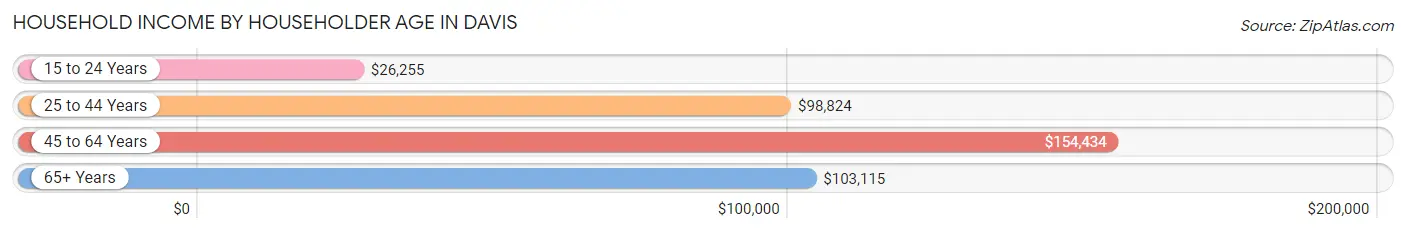
| Income Bracket | # Households | Median Income |
| 15 to 24 Years | 6,642 (25.9%) | $26,255 |
| 25 to 44 Years | 7,096 (27.6%) | $98,824 |
| 45 to 64 Years | 6,448 (25.1%) | $154,434 |
| 65+ Years | 5,483 (21.4%) | $103,115 |
| Total | 25,669 (100.0%) | $83,592 |
Poverty in Davis
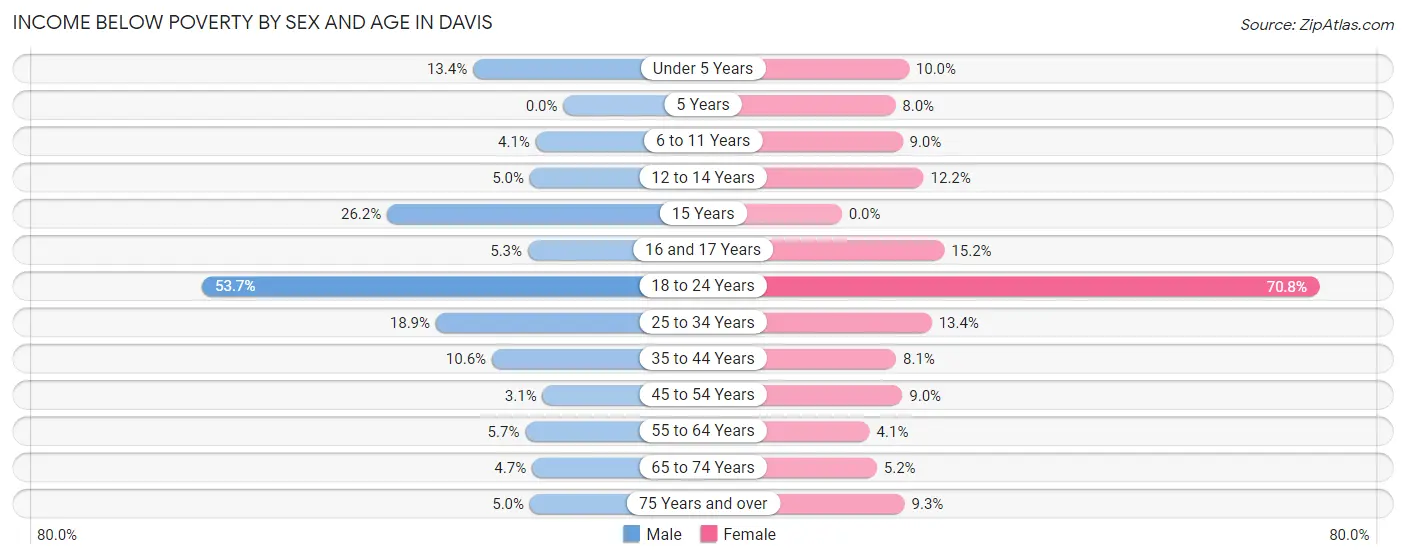
Income Below Poverty by Sex and Age in Davis
With 23.1% poverty level for males and 29.3% for females among the residents of Davis, 18 to 24 year old males and 18 to 24 year old females are the most vulnerable to poverty, with 5,224 males (53.6%) and 8,039 females (70.8%) in their respective age groups living below the poverty level.
| Age Bracket | Male | Female |
| Under 5 Years | 129 (13.4%) | 112 (10.0%) |
| 5 Years | 0 (0.0%) | 19 (8.0%) |
| 6 to 11 Years | 78 (4.1%) | 133 (9.0%) |
| 12 to 14 Years | 33 (5.0%) | 109 (12.1%) |
| 15 Years | 111 (26.2%) | 0 (0.0%) |
| 16 and 17 Years | 32 (5.3%) | 96 (15.2%) |
| 18 to 24 Years | 5,224 (53.6%) | 8,039 (70.8%) |
| 25 to 34 Years | 829 (18.9%) | 595 (13.4%) |
| 35 to 44 Years | 308 (10.6%) | 235 (8.1%) |
| 45 to 54 Years | 89 (3.1%) | 303 (9.0%) |
| 55 to 64 Years | 150 (5.7%) | 114 (4.1%) |
| 65 to 74 Years | 115 (4.7%) | 142 (5.2%) |
| 75 Years and over | 65 (5.0%) | 211 (9.3%) |
| Total | 7,163 (23.1%) | 10,108 (29.3%) |
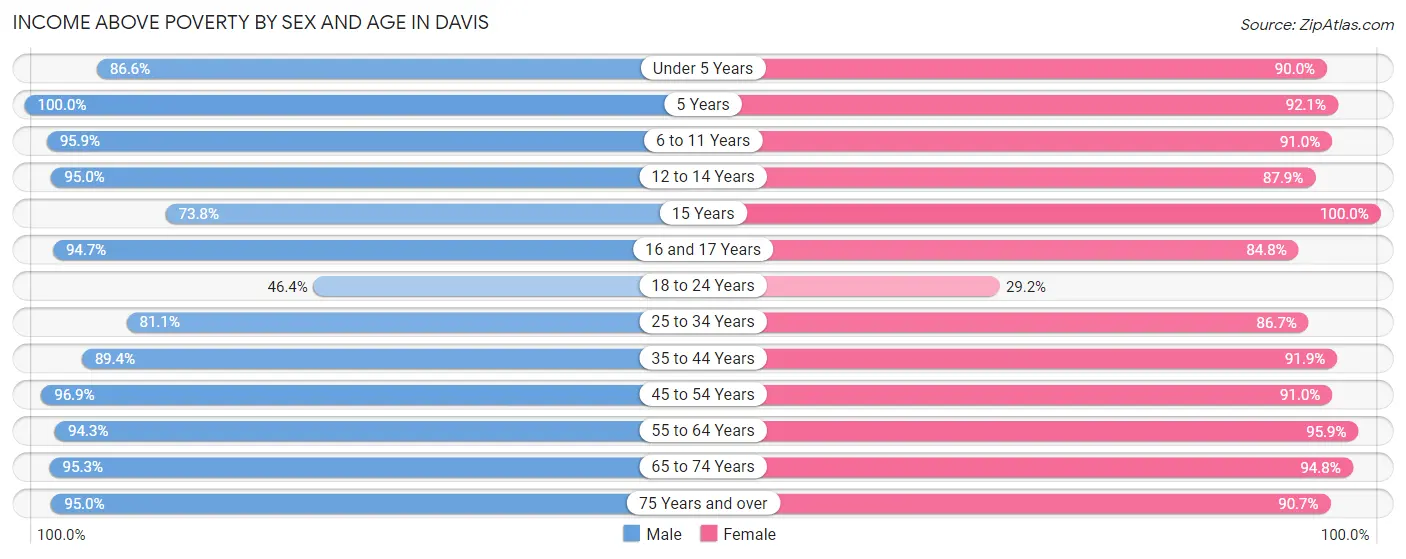
Income Above Poverty by Sex and Age in Davis
According to the poverty statistics in Davis, males aged 5 years and females aged 15 years are the age groups that are most secure financially, with 100.0% of males and 100.0% of females in these age groups living above the poverty line.
| Age Bracket | Male | Female |
| Under 5 Years | 832 (86.6%) | 1,013 (90.0%) |
| 5 Years | 192 (100.0%) | 220 (92.0%) |
| 6 to 11 Years | 1,822 (95.9%) | 1,342 (91.0%) |
| 12 to 14 Years | 629 (95.0%) | 788 (87.8%) |
| 15 Years | 313 (73.8%) | 296 (100.0%) |
| 16 and 17 Years | 575 (94.7%) | 534 (84.8%) |
| 18 to 24 Years | 4,513 (46.4%) | 3,311 (29.2%) |
| 25 to 34 Years | 3,551 (81.1%) | 3,861 (86.7%) |
| 35 to 44 Years | 2,596 (89.4%) | 2,679 (91.9%) |
| 45 to 54 Years | 2,778 (96.9%) | 3,066 (91.0%) |
| 55 to 64 Years | 2,502 (94.3%) | 2,639 (95.9%) |
| 65 to 74 Years | 2,353 (95.3%) | 2,581 (94.8%) |
| 75 Years and over | 1,242 (95.0%) | 2,051 (90.7%) |
| Total | 23,898 (76.9%) | 24,381 (70.7%) |
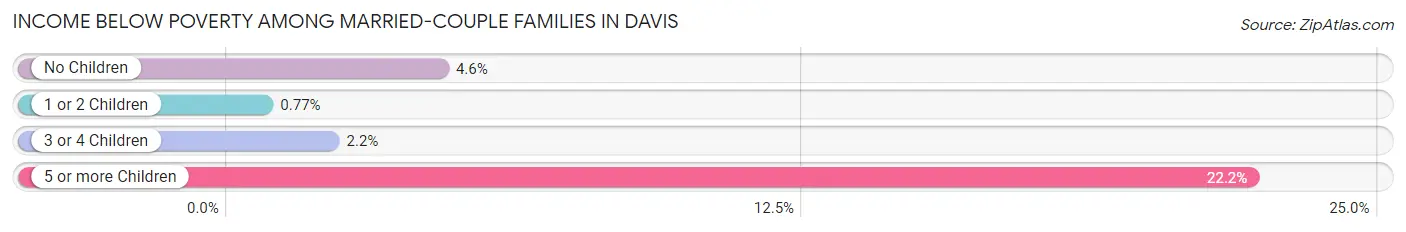
Income Below Poverty Among Married-Couple Families in Davis
The poverty statistics for married-couple families in Davis show that 3.2% or 319 of the total 9,923 families live below the poverty line. Families with 5 or more children have the highest poverty rate of 22.2%, comprising of 8 families. On the other hand, families with 1 or 2 children have the lowest poverty rate of 0.8%, which includes 27 families.
| Children | Above Poverty | Below Poverty |
| No Children | 5,719 (95.4%) | 275 (4.6%) |
| 1 or 2 Children | 3,459 (99.2%) | 27 (0.8%) |
| 3 or 4 Children | 398 (97.8%) | 9 (2.2%) |
| 5 or more Children | 28 (77.8%) | 8 (22.2%) |
| Total | 9,604 (96.8%) | 319 (3.2%) |
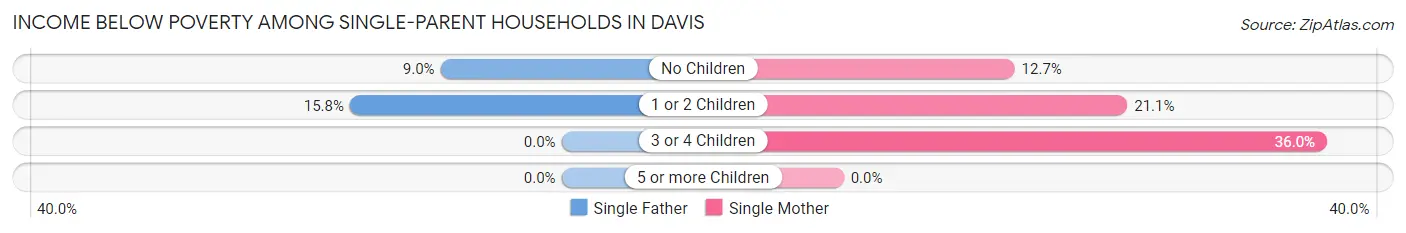
Income Below Poverty Among Single-Parent Households in Davis
According to the poverty data in Davis, 12.3% or 67 single-father households and 18.6% or 330 single-mother households are living below the poverty line. Among single-father households, those with 1 or 2 children have the highest poverty rate, with 44 households (15.8%) experiencing poverty. Likewise, among single-mother households, those with 3 or 4 children have the highest poverty rate, with 63 households (36.0%) falling below the poverty line.
| Children | Single Father | Single Mother |
| No Children | 23 (9.0%) | 106 (12.7%) |
| 1 or 2 Children | 44 (15.8%) | 161 (21.1%) |
| 3 or 4 Children | 0 (0.0%) | 63 (36.0%) |
| 5 or more Children | 0 (0.0%) | 0 (0.0%) |
| Total | 67 (12.3%) | 330 (18.6%) |
Income Below Poverty Among Married-Couple vs Single-Parent Households in Davis
The poverty data for Davis shows that 319 of the married-couple family households (3.2%) and 397 of the single-parent households (17.2%) are living below the poverty level. Within the married-couple family households, those with 5 or more children have the highest poverty rate, with 8 households (22.2%) falling below the poverty line. Among the single-parent households, those with 3 or 4 children have the highest poverty rate, with 63 household (36.0%) living below poverty.
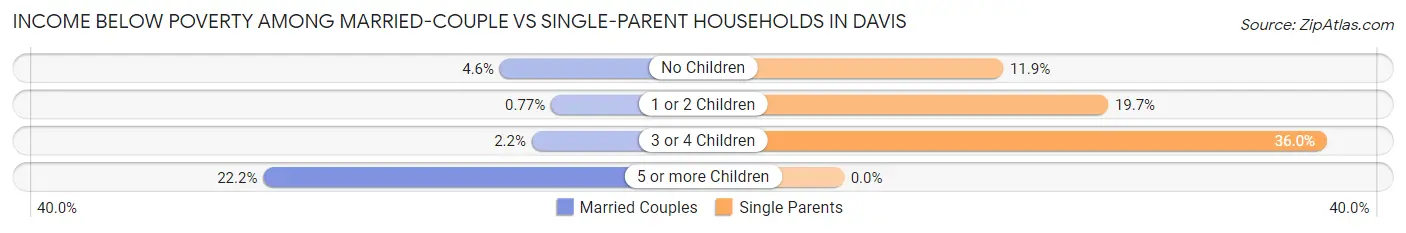
| Children | Married-Couple Families | Single-Parent Households |
| No Children | 275 (4.6%) | 129 (11.9%) |
| 1 or 2 Children | 27 (0.8%) | 205 (19.7%) |
| 3 or 4 Children | 9 (2.2%) | 63 (36.0%) |
| 5 or more Children | 8 (22.2%) | 0 (0.0%) |
| Total | 319 (3.2%) | 397 (17.2%) |
Employment Characteristics in Davis
Employment by Class of Employer in Davis
Among the 31,468 employed individuals in Davis, private company employees (13,734 | 43.6%), state government employees (8,562 | 27.2%), and not-for-profit organizations (3,060 | 9.7%) make up the most common classes of employment.
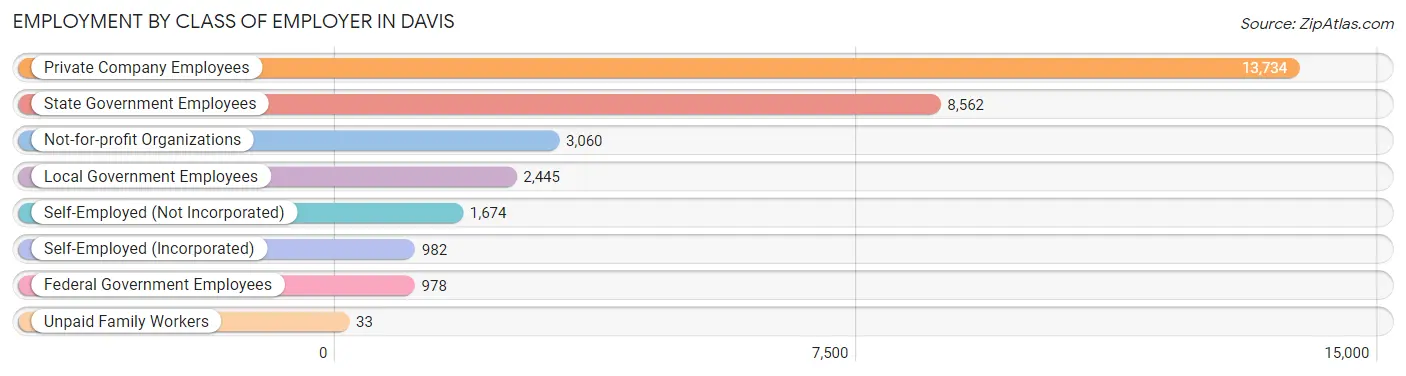
| Employer Class | # Employees | % Employees |
| Private Company Employees | 13,734 | 43.6% |
| Self-Employed (Incorporated) | 982 | 3.1% |
| Self-Employed (Not Incorporated) | 1,674 | 5.3% |
| Not-for-profit Organizations | 3,060 | 9.7% |
| Local Government Employees | 2,445 | 7.8% |
| State Government Employees | 8,562 | 27.2% |
| Federal Government Employees | 978 | 3.1% |
| Unpaid Family Workers | 33 | 0.1% |
| Total | 31,468 | 100.0% |
Employment Status by Age in Davis
According to the labor force statistics for Davis, out of the total population over 16 years of age (58,983), 58.2% or 34,328 individuals are in the labor force, with 5.8% or 1,991 of them unemployed. The age group with the highest labor force participation rate is 45 to 54 years, with 87.7% or 5,469 individuals in the labor force. Within the labor force, the 16 to 19 years age range has the highest percentage of unemployed individuals, with 14.7% or 242 of them being unemployed.
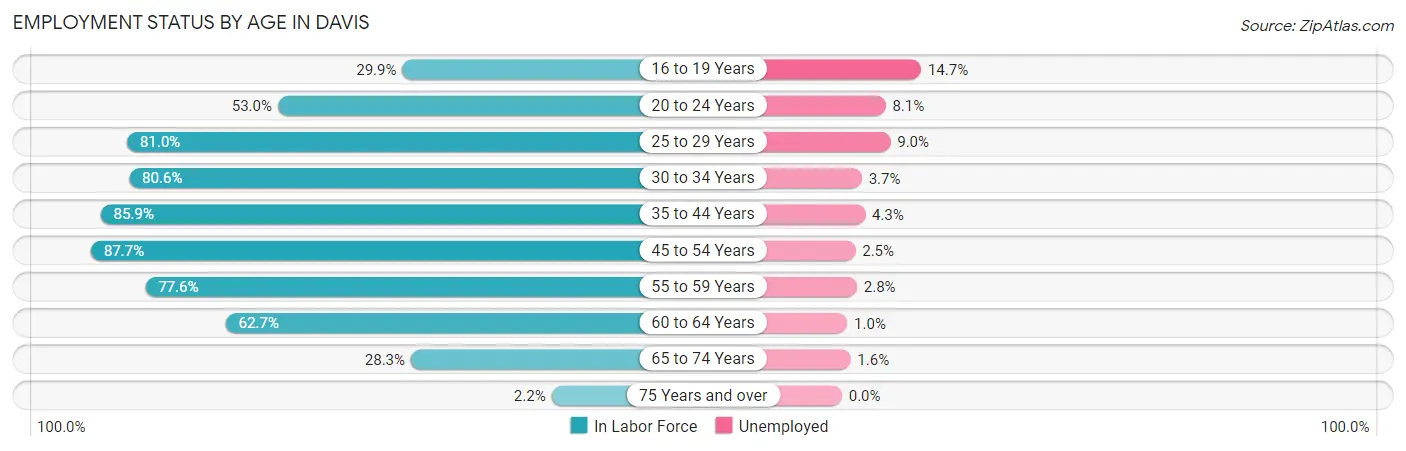
| Age Bracket | In Labor Force | Unemployed |
| 16 to 19 Years | 1,647 (29.9%) | 242 (14.7%) |
| 20 to 24 Years | 9,662 (53.0%) | 783 (8.1%) |
| 25 to 29 Years | 4,349 (81.0%) | 391 (9.0%) |
| 30 to 34 Years | 2,797 (80.6%) | 103 (3.7%) |
| 35 to 44 Years | 4,998 (85.9%) | 215 (4.3%) |
| 45 to 54 Years | 5,469 (87.7%) | 137 (2.5%) |
| 55 to 59 Years | 2,152 (77.6%) | 60 (2.8%) |
| 60 to 64 Years | 1,658 (62.7%) | 17 (1.0%) |
| 65 to 74 Years | 1,489 (28.3%) | 24 (1.6%) |
| 75 Years and over | 81 (2.2%) | 0 (0.0%) |
| Total | 34,328 (58.2%) | 1,991 (5.8%) |
Employment Status by Educational Attainment in Davis
According to labor force statistics for Davis, 81.4% of individuals (21,417) out of the total population between 25 and 64 years of age (26,311) are in the labor force, with 4.3% or 921 of them being unemployed. The group with the highest labor force participation rate are those with the educational attainment of bachelor's degree or higher, with 86.2% or 17,204 individuals in the labor force. Within the labor force, individuals with less than high school education have the highest percentage of unemployment, with 12.2% or 52 of them being unemployed.
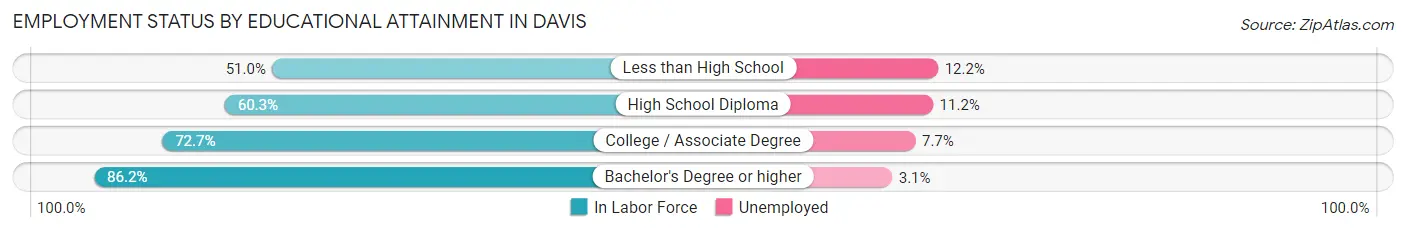
| Educational Attainment | In Labor Force | Unemployed |
| Less than High School | 427 (51.0%) | 102 (12.2%) |
| High School Diploma | 1,085 (60.3%) | 202 (11.2%) |
| College / Associate Degree | 2,702 (72.7%) | 286 (7.7%) |
| Bachelor's Degree or higher | 17,204 (86.2%) | 619 (3.1%) |
| Total | 21,417 (81.4%) | 1,131 (4.3%) |
Employment Occupations by Sex in Davis
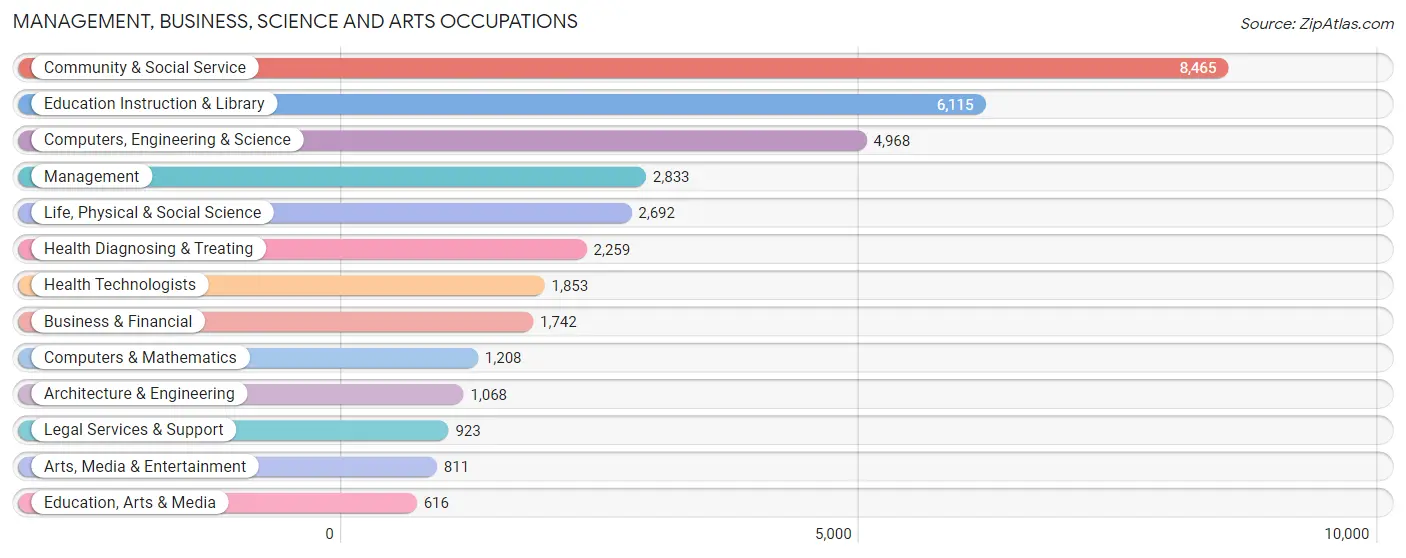
Management, Business, Science and Arts Occupations
The most common Management, Business, Science and Arts occupations in Davis are Community & Social Service (8,465 | 26.3%), Education Instruction & Library (6,115 | 19.0%), Computers, Engineering & Science (4,968 | 15.4%), Management (2,833 | 8.8%), and Life, Physical & Social Science (2,692 | 8.4%).
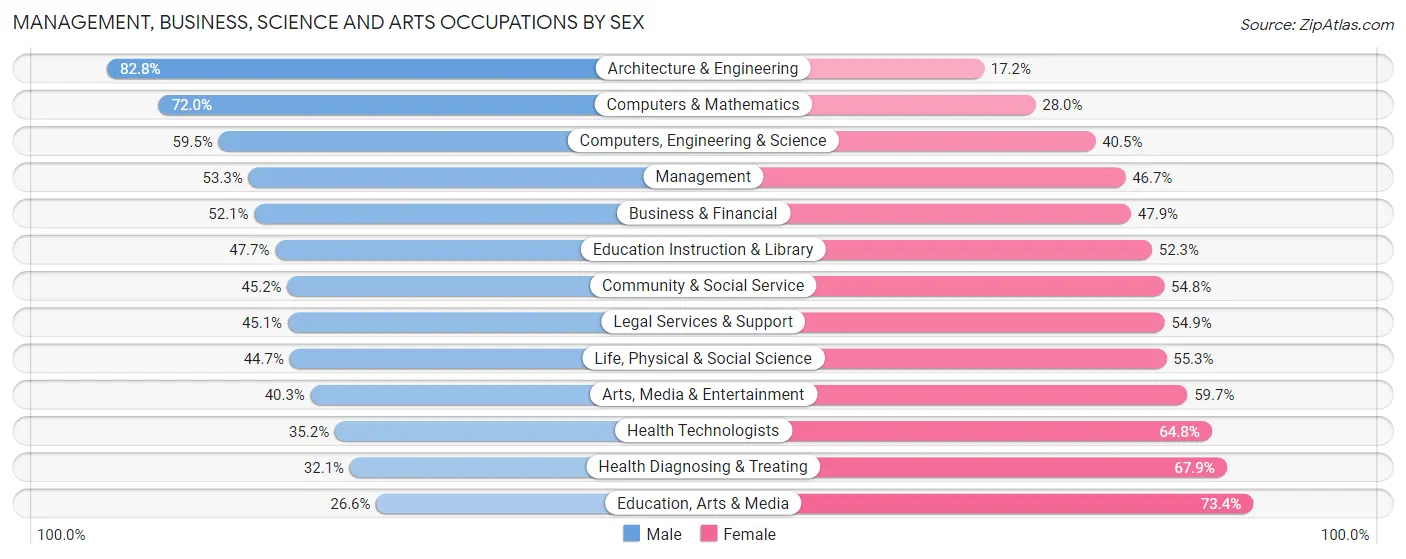
Management, Business, Science and Arts Occupations by Sex
Within the Management, Business, Science and Arts occupations in Davis, the most male-oriented occupations are Architecture & Engineering (82.8%), Computers & Mathematics (72.0%), and Computers, Engineering & Science (59.5%), while the most female-oriented occupations are Education, Arts & Media (73.4%), Health Diagnosing & Treating (67.9%), and Health Technologists (64.8%).
| Occupation | Male | Female |
| Management | 1,509 (53.3%) | 1,324 (46.7%) |
| Business & Financial | 907 (52.1%) | 835 (47.9%) |
| Computers, Engineering & Science | 2,957 (59.5%) | 2,011 (40.5%) |
| Computers & Mathematics | 870 (72.0%) | 338 (28.0%) |
| Architecture & Engineering | 884 (82.8%) | 184 (17.2%) |
| Life, Physical & Social Science | 1,203 (44.7%) | 1,489 (55.3%) |
| Community & Social Service | 3,824 (45.2%) | 4,641 (54.8%) |
| Education, Arts & Media | 164 (26.6%) | 452 (73.4%) |
| Legal Services & Support | 416 (45.1%) | 507 (54.9%) |
| Education Instruction & Library | 2,917 (47.7%) | 3,198 (52.3%) |
| Arts, Media & Entertainment | 327 (40.3%) | 484 (59.7%) |
| Health Diagnosing & Treating | 726 (32.1%) | 1,533 (67.9%) |
| Health Technologists | 653 (35.2%) | 1,200 (64.8%) |
| Total (Category) | 9,923 (49.0%) | 10,344 (51.0%) |
| Total (Overall) | 15,410 (47.8%) | 16,820 (52.2%) |
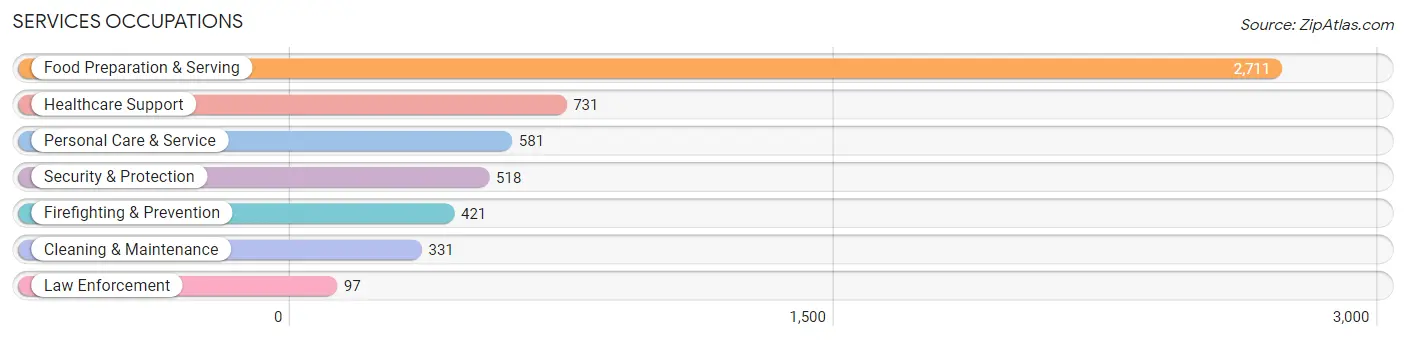
Services Occupations
The most common Services occupations in Davis are Food Preparation & Serving (2,711 | 8.4%), Healthcare Support (731 | 2.3%), Personal Care & Service (581 | 1.8%), Security & Protection (518 | 1.6%), and Firefighting & Prevention (421 | 1.3%).
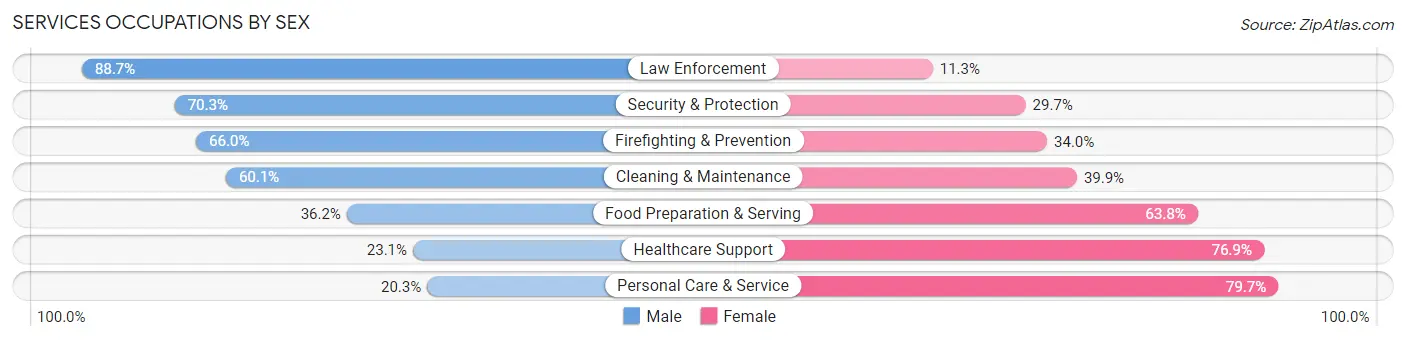
Services Occupations by Sex
Within the Services occupations in Davis, the most male-oriented occupations are Law Enforcement (88.7%), Security & Protection (70.3%), and Firefighting & Prevention (66.0%), while the most female-oriented occupations are Personal Care & Service (79.7%), Healthcare Support (76.9%), and Food Preparation & Serving (63.8%).
| Occupation | Male | Female |
| Healthcare Support | 169 (23.1%) | 562 (76.9%) |
| Security & Protection | 364 (70.3%) | 154 (29.7%) |
| Firefighting & Prevention | 278 (66.0%) | 143 (34.0%) |
| Law Enforcement | 86 (88.7%) | 11 (11.3%) |
| Food Preparation & Serving | 982 (36.2%) | 1,729 (63.8%) |
| Cleaning & Maintenance | 199 (60.1%) | 132 (39.9%) |
| Personal Care & Service | 118 (20.3%) | 463 (79.7%) |
| Total (Category) | 1,832 (37.6%) | 3,040 (62.4%) |
| Total (Overall) | 15,410 (47.8%) | 16,820 (52.2%) |
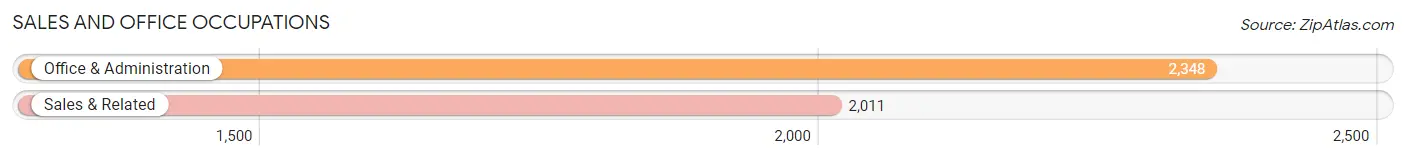
Sales and Office Occupations
The most common Sales and Office occupations in Davis are Office & Administration (2,348 | 7.3%), and Sales & Related (2,011 | 6.2%).
Sales and Office Occupations by Sex
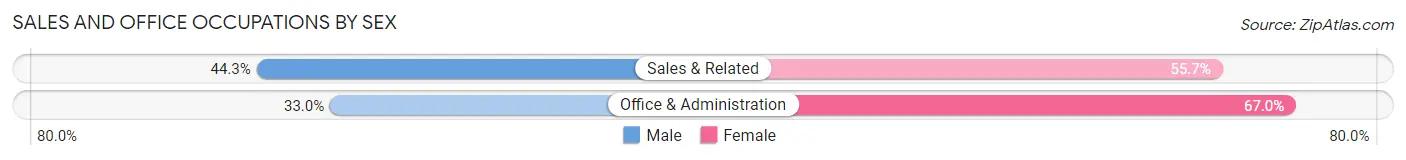
| Occupation | Male | Female |
| Sales & Related | 891 (44.3%) | 1,120 (55.7%) |
| Office & Administration | 775 (33.0%) | 1,573 (67.0%) |
| Total (Category) | 1,666 (38.2%) | 2,693 (61.8%) |
| Total (Overall) | 15,410 (47.8%) | 16,820 (52.2%) |
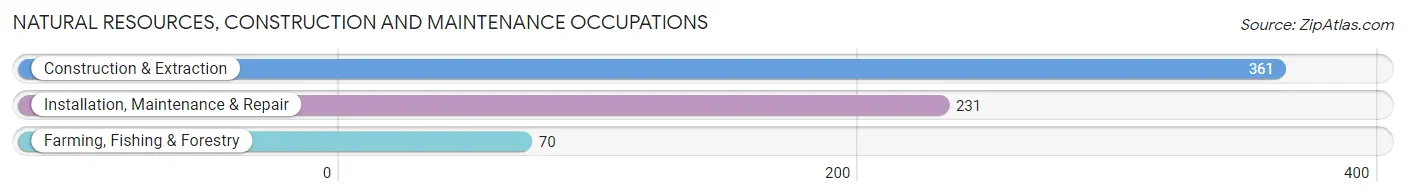
Natural Resources, Construction and Maintenance Occupations
The most common Natural Resources, Construction and Maintenance occupations in Davis are Construction & Extraction (361 | 1.1%), Installation, Maintenance & Repair (231 | 0.7%), and Farming, Fishing & Forestry (70 | 0.2%).
Natural Resources, Construction and Maintenance Occupations by Sex
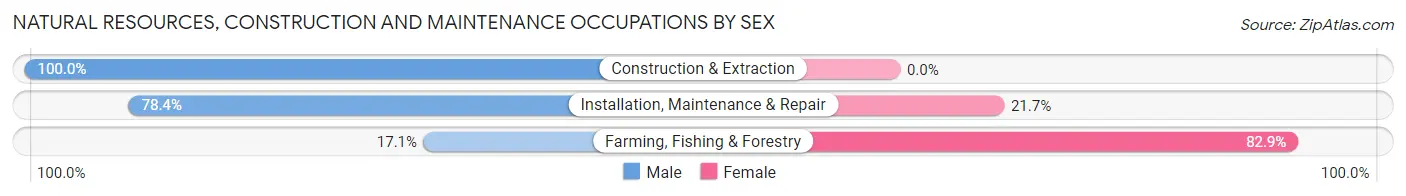
| Occupation | Male | Female |
| Farming, Fishing & Forestry | 12 (17.1%) | 58 (82.9%) |
| Construction & Extraction | 361 (100.0%) | 0 (0.0%) |
| Installation, Maintenance & Repair | 181 (78.3%) | 50 (21.6%) |
| Total (Category) | 554 (83.7%) | 108 (16.3%) |
| Total (Overall) | 15,410 (47.8%) | 16,820 (52.2%) |
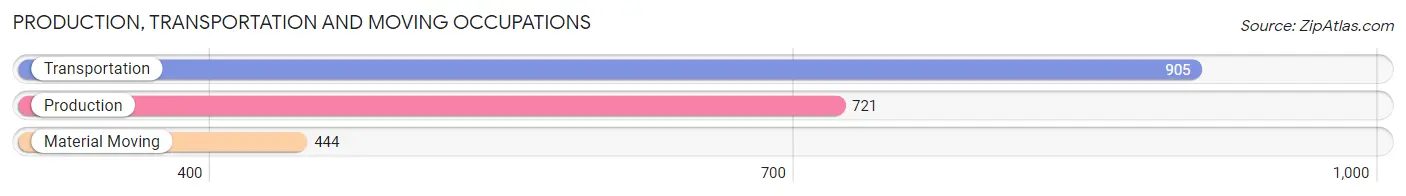
Production, Transportation and Moving Occupations
The most common Production, Transportation and Moving occupations in Davis are Transportation (905 | 2.8%), Production (721 | 2.2%), and Material Moving (444 | 1.4%).
Production, Transportation and Moving Occupations by Sex
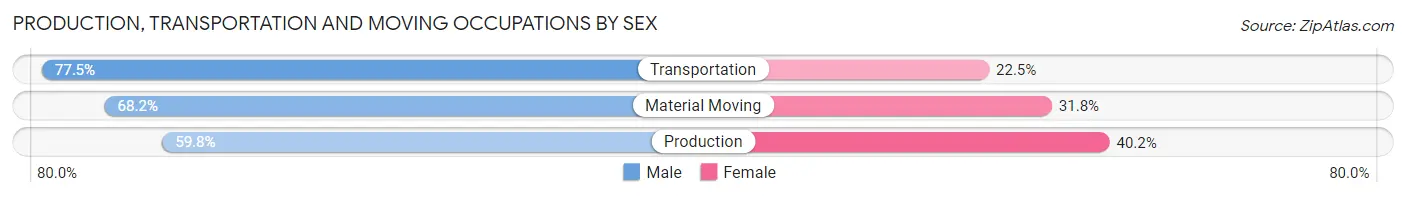
| Occupation | Male | Female |
| Production | 431 (59.8%) | 290 (40.2%) |
| Transportation | 701 (77.5%) | 204 (22.5%) |
| Material Moving | 303 (68.2%) | 141 (31.8%) |
| Total (Category) | 1,435 (69.3%) | 635 (30.7%) |
| Total (Overall) | 15,410 (47.8%) | 16,820 (52.2%) |
Employment Industries by Sex in Davis
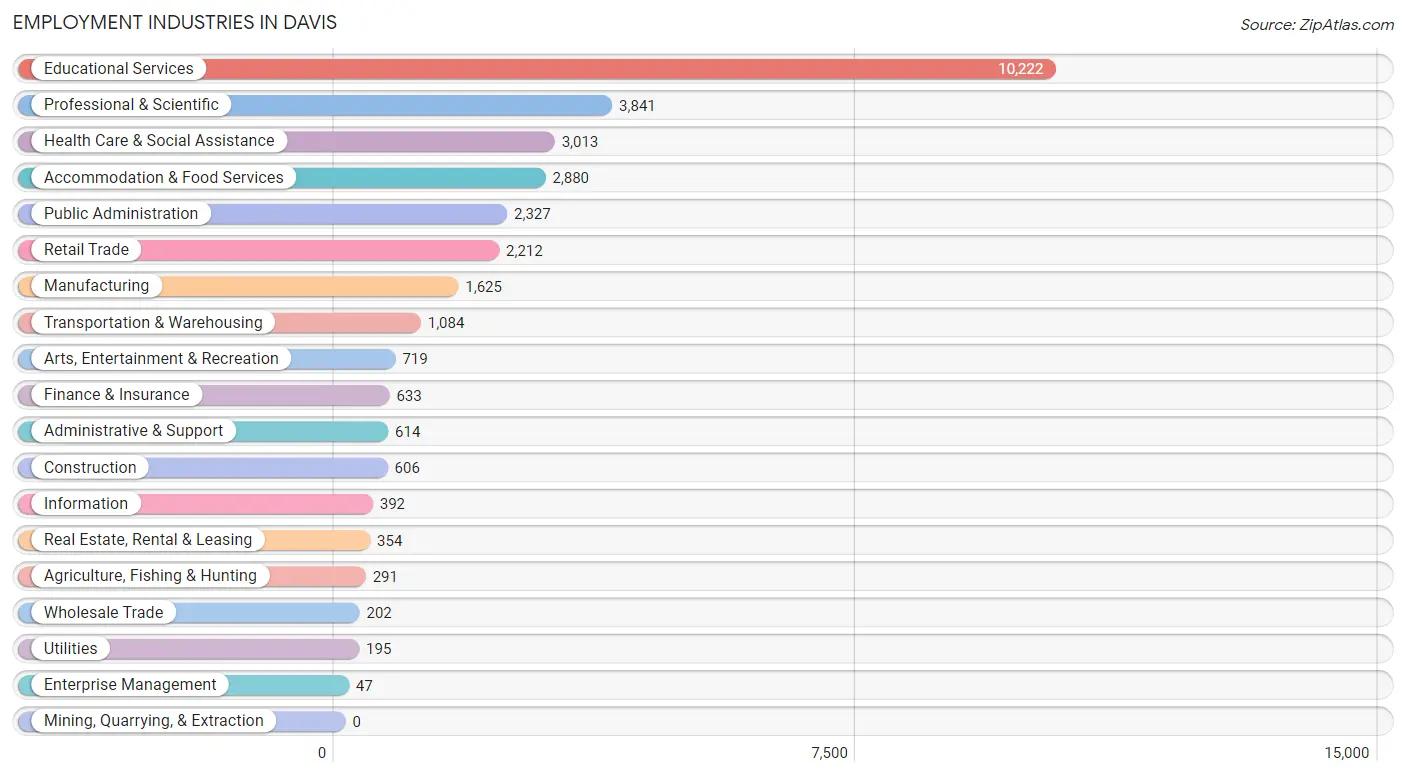
Employment Industries in Davis
The major employment industries in Davis include Educational Services (10,222 | 31.7%), Professional & Scientific (3,841 | 11.9%), Health Care & Social Assistance (3,013 | 9.3%), Accommodation & Food Services (2,880 | 8.9%), and Public Administration (2,327 | 7.2%).
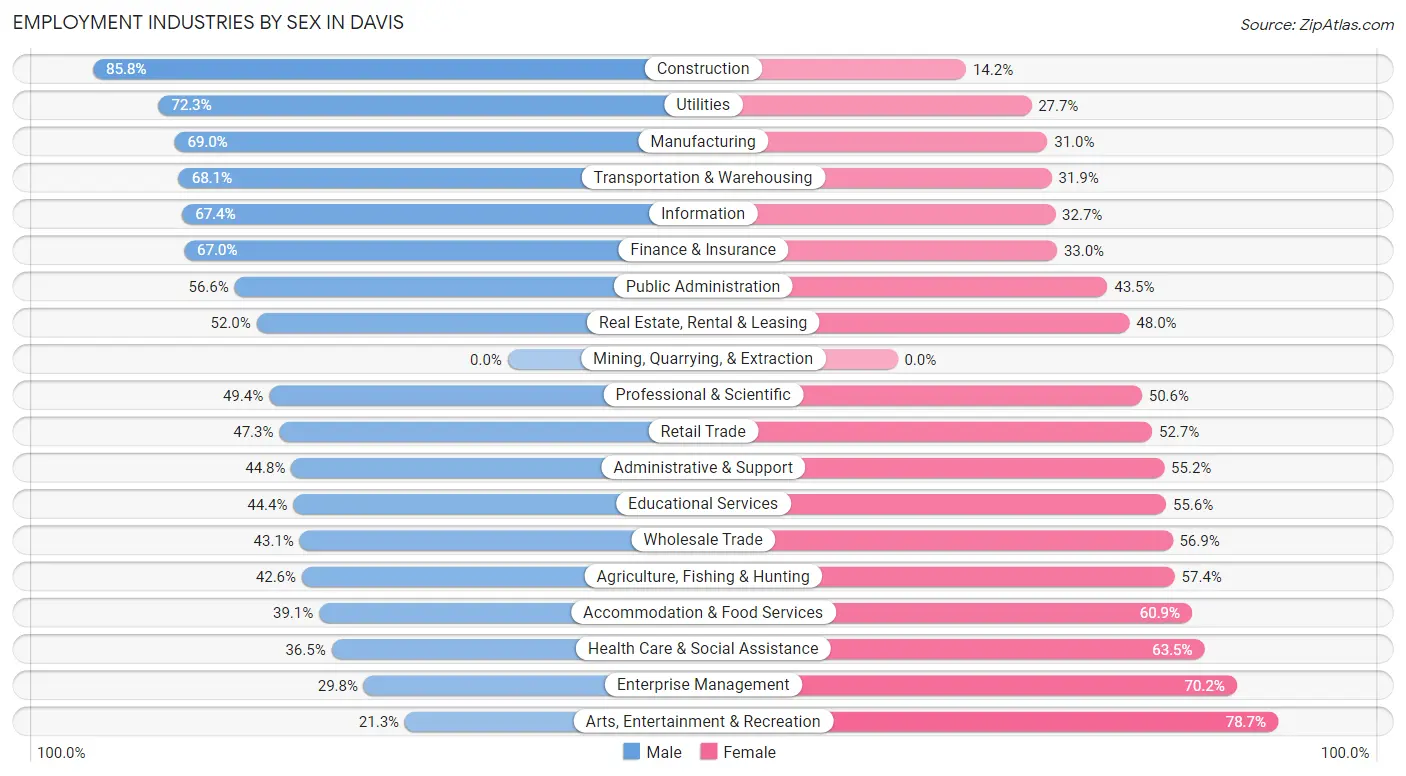
Employment Industries by Sex in Davis
The Davis industries that see more men than women are Construction (85.8%), Utilities (72.3%), and Manufacturing (69.0%), whereas the industries that tend to have a higher number of women are Arts, Entertainment & Recreation (78.7%), Enterprise Management (70.2%), and Health Care & Social Assistance (63.5%).
| Industry | Male | Female |
| Agriculture, Fishing & Hunting | 124 (42.6%) | 167 (57.4%) |
| Mining, Quarrying, & Extraction | 0 (0.0%) | 0 (0.0%) |
| Construction | 520 (85.8%) | 86 (14.2%) |
| Manufacturing | 1,121 (69.0%) | 504 (31.0%) |
| Wholesale Trade | 87 (43.1%) | 115 (56.9%) |
| Retail Trade | 1,046 (47.3%) | 1,166 (52.7%) |
| Transportation & Warehousing | 738 (68.1%) | 346 (31.9%) |
| Utilities | 141 (72.3%) | 54 (27.7%) |
| Information | 264 (67.3%) | 128 (32.7%) |
| Finance & Insurance | 424 (67.0%) | 209 (33.0%) |
| Real Estate, Rental & Leasing | 184 (52.0%) | 170 (48.0%) |
| Professional & Scientific | 1,898 (49.4%) | 1,943 (50.6%) |
| Enterprise Management | 14 (29.8%) | 33 (70.2%) |
| Administrative & Support | 275 (44.8%) | 339 (55.2%) |
| Educational Services | 4,538 (44.4%) | 5,684 (55.6%) |
| Health Care & Social Assistance | 1,099 (36.5%) | 1,914 (63.5%) |
| Arts, Entertainment & Recreation | 153 (21.3%) | 566 (78.7%) |
| Accommodation & Food Services | 1,125 (39.1%) | 1,755 (60.9%) |
| Public Administration | 1,316 (56.6%) | 1,011 (43.4%) |
| Total | 15,410 (47.8%) | 16,820 (52.2%) |
Education in Davis
School Enrollment in Davis
The most common levels of schooling among the 31,424 students in Davis are college / undergraduate (18,475 | 58.8%), graduate / professional (5,061 | 16.1%), and high school (2,372 | 7.5%).
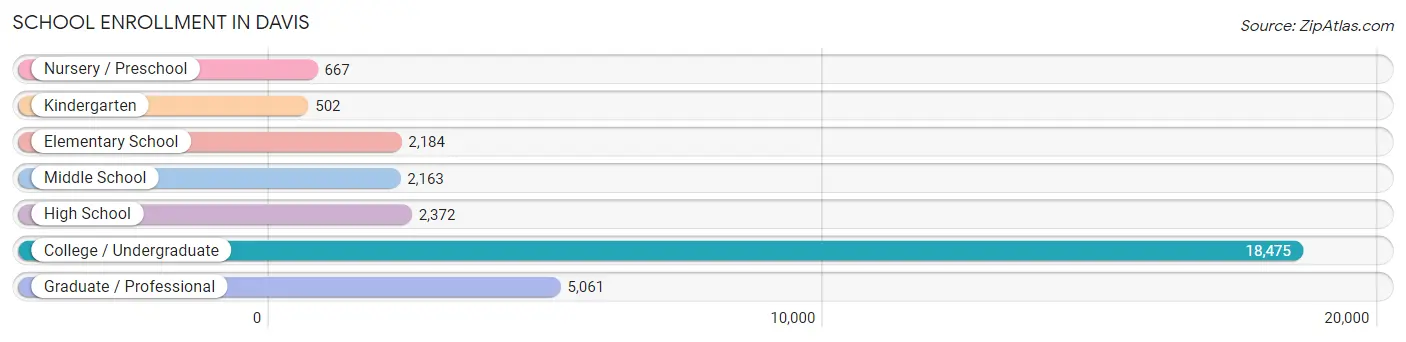
| School Level | # Students | % Students |
| Nursery / Preschool | 667 | 2.1% |
| Kindergarten | 502 | 1.6% |
| Elementary School | 2,184 | 7.0% |
| Middle School | 2,163 | 6.9% |
| High School | 2,372 | 7.5% |
| College / Undergraduate | 18,475 | 58.8% |
| Graduate / Professional | 5,061 | 16.1% |
| Total | 31,424 | 100.0% |
School Enrollment by Age by Funding Source in Davis
Out of a total of 31,424 students who are enrolled in schools in Davis, 1,854 (5.9%) attend a private institution, while the remaining 29,570 (94.1%) are enrolled in public schools. The age group of 3 to 4 year olds has the highest likelihood of being enrolled in private schools, with 307 (60.9% in the age bracket) enrolled. Conversely, the age group of 18 to 19 year olds has the lowest likelihood of being enrolled in a private school, with 4,087 (98.5% in the age bracket) attending a public institution.
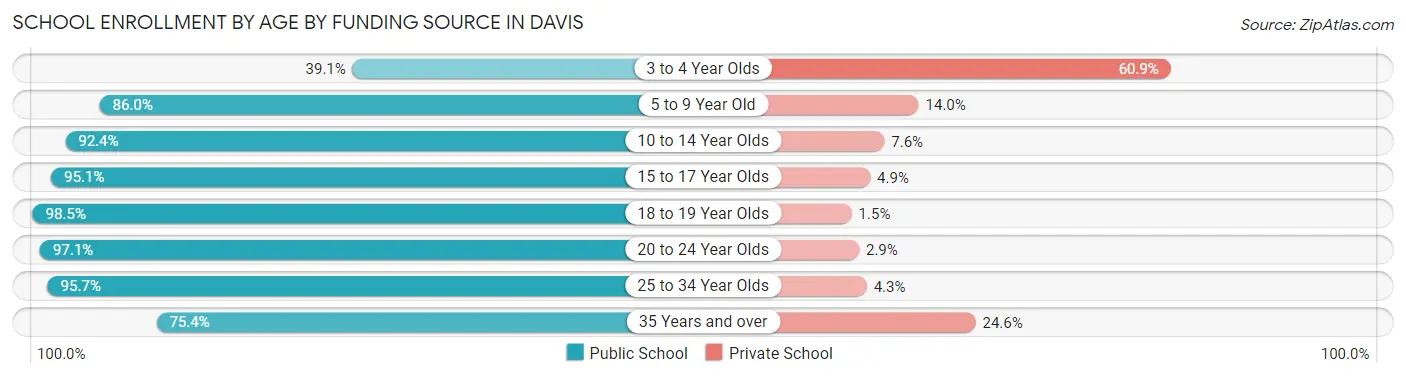
| Age Bracket | Public School | Private School |
| 3 to 4 Year Olds | 197 (39.1%) | 307 (60.9%) |
| 5 to 9 Year Old | 2,182 (86.0%) | 354 (14.0%) |
| 10 to 14 Year Olds | 2,499 (92.4%) | 205 (7.6%) |
| 15 to 17 Year Olds | 1,853 (95.1%) | 96 (4.9%) |
| 18 to 19 Year Olds | 4,087 (98.5%) | 62 (1.5%) |
| 20 to 24 Year Olds | 14,687 (97.1%) | 432 (2.9%) |
| 25 to 34 Year Olds | 3,344 (95.7%) | 150 (4.3%) |
| 35 Years and over | 731 (75.4%) | 238 (24.6%) |
| Total | 29,570 (94.1%) | 1,854 (5.9%) |
Educational Attainment by Field of Study in Davis
Bio, nature & agricultural (6,328 | 21.8%), social sciences (3,910 | 13.5%), engineering (2,236 | 7.7%), literature & languages (1,882 | 6.5%), and science & technology (1,807 | 6.2%) are the most common fields of study among 28,976 individuals in Davis who have obtained a bachelor's degree or higher.
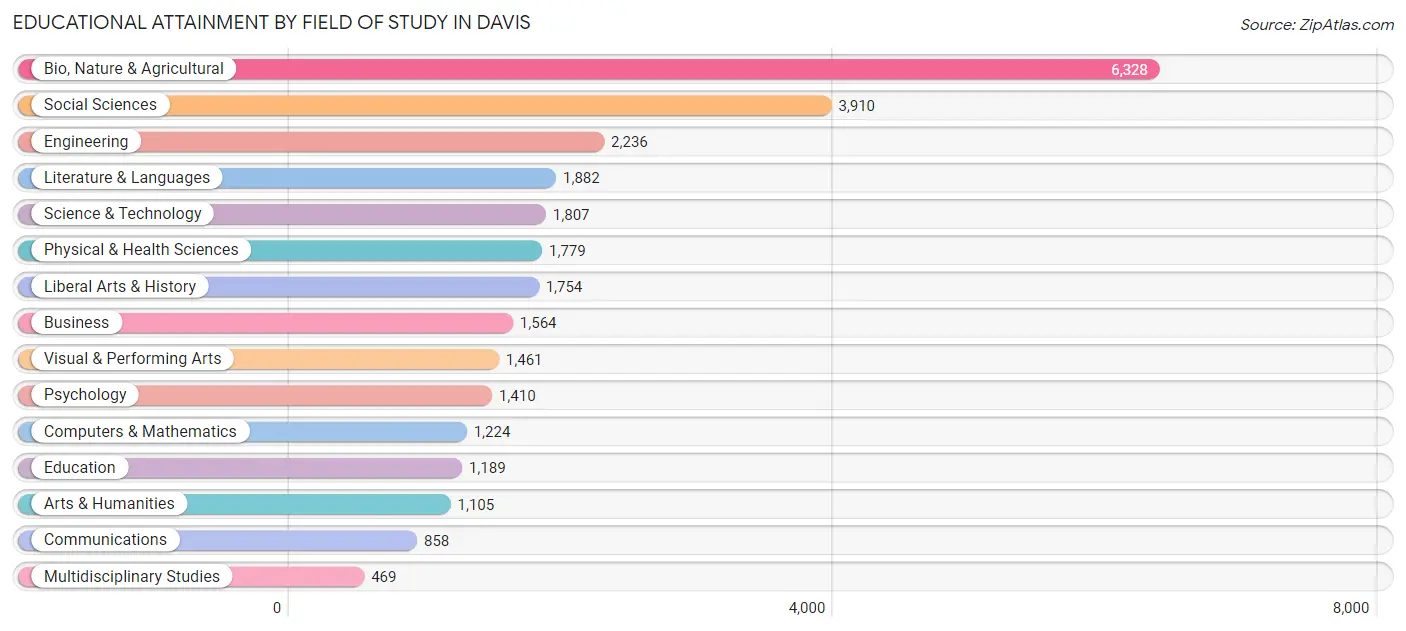
| Field of Study | # Graduates | % Graduates |
| Computers & Mathematics | 1,224 | 4.2% |
| Bio, Nature & Agricultural | 6,328 | 21.8% |
| Physical & Health Sciences | 1,779 | 6.1% |
| Psychology | 1,410 | 4.9% |
| Social Sciences | 3,910 | 13.5% |
| Engineering | 2,236 | 7.7% |
| Multidisciplinary Studies | 469 | 1.6% |
| Science & Technology | 1,807 | 6.2% |
| Business | 1,564 | 5.4% |
| Education | 1,189 | 4.1% |
| Literature & Languages | 1,882 | 6.5% |
| Liberal Arts & History | 1,754 | 6.0% |
| Visual & Performing Arts | 1,461 | 5.0% |
| Communications | 858 | 3.0% |
| Arts & Humanities | 1,105 | 3.8% |
| Total | 28,976 | 100.0% |
Transportation & Commute in Davis
Vehicle Availability by Sex in Davis
The most prevalent vehicle ownership categories in Davis are males with 2 vehicles (6,301, accounting for 41.2%) and females with 2 vehicles (7,036, making up 39.7%).
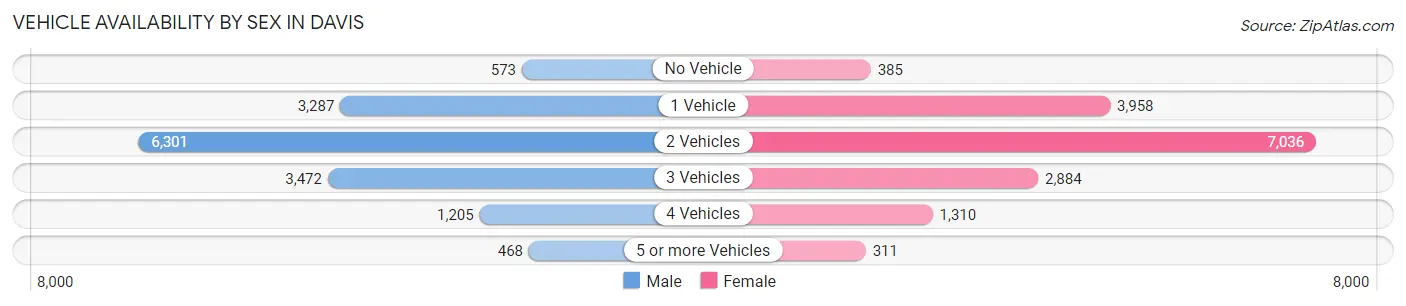
| Vehicles Available | Male | Female |
| No Vehicle | 573 (3.7%) | 385 (2.4%) |
| 1 Vehicle | 3,287 (21.5%) | 3,958 (24.9%) |
| 2 Vehicles | 6,301 (41.2%) | 7,036 (44.3%) |
| 3 Vehicles | 3,472 (22.7%) | 2,884 (18.2%) |
| 4 Vehicles | 1,205 (7.9%) | 1,310 (8.3%) |
| 5 or more Vehicles | 468 (3.1%) | 311 (2.0%) |
| Total | 15,306 (100.0%) | 15,884 (100.0%) |
Commute Time in Davis
The most frequently occuring commute durations in Davis are 10 to 14 minutes (5,472 commuters, 21.7%), 15 to 19 minutes (4,472 commuters, 17.8%), and 20 to 24 minutes (3,364 commuters, 13.4%).
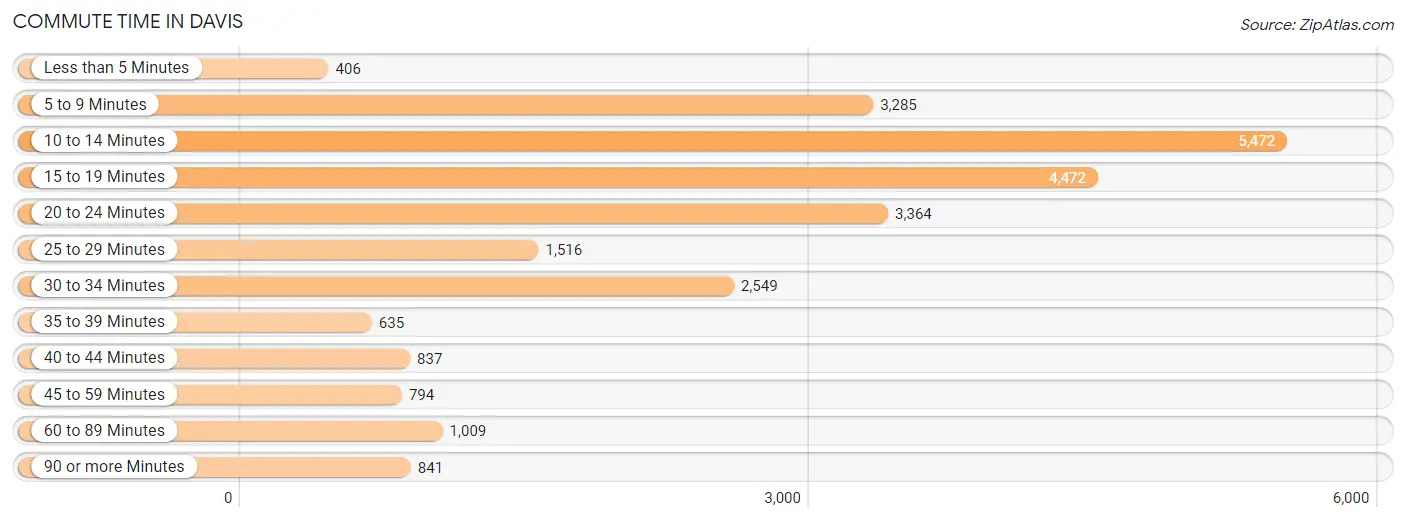
| Commute Time | # Commuters | % Commuters |
| Less than 5 Minutes | 406 | 1.6% |
| 5 to 9 Minutes | 3,285 | 13.1% |
| 10 to 14 Minutes | 5,472 | 21.7% |
| 15 to 19 Minutes | 4,472 | 17.8% |
| 20 to 24 Minutes | 3,364 | 13.4% |
| 25 to 29 Minutes | 1,516 | 6.0% |
| 30 to 34 Minutes | 2,549 | 10.1% |
| 35 to 39 Minutes | 635 | 2.5% |
| 40 to 44 Minutes | 837 | 3.3% |
| 45 to 59 Minutes | 794 | 3.2% |
| 60 to 89 Minutes | 1,009 | 4.0% |
| 90 or more Minutes | 841 | 3.3% |
Commute Time by Sex in Davis
The most common commute times in Davis are 10 to 14 minutes (2,171 commuters, 17.5%) for males and 10 to 14 minutes (3,301 commuters, 25.9%) for females.
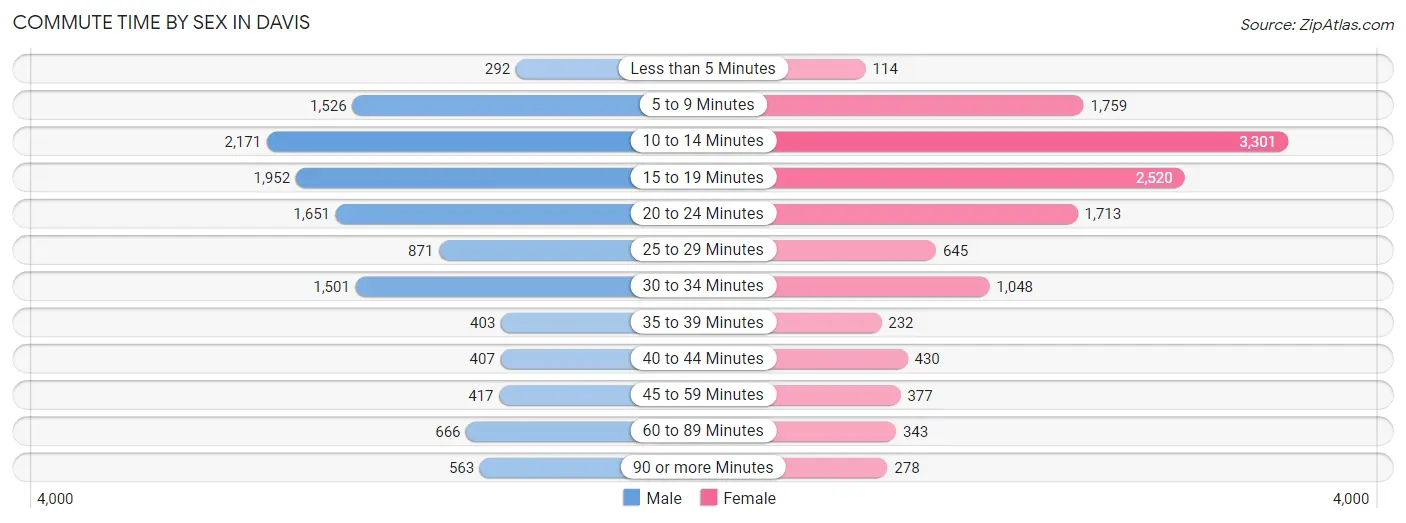
| Commute Time | Male | Female |
| Less than 5 Minutes | 292 (2.4%) | 114 (0.9%) |
| 5 to 9 Minutes | 1,526 (12.3%) | 1,759 (13.8%) |
| 10 to 14 Minutes | 2,171 (17.5%) | 3,301 (25.9%) |
| 15 to 19 Minutes | 1,952 (15.7%) | 2,520 (19.8%) |
| 20 to 24 Minutes | 1,651 (13.3%) | 1,713 (13.4%) |
| 25 to 29 Minutes | 871 (7.0%) | 645 (5.1%) |
| 30 to 34 Minutes | 1,501 (12.1%) | 1,048 (8.2%) |
| 35 to 39 Minutes | 403 (3.2%) | 232 (1.8%) |
| 40 to 44 Minutes | 407 (3.3%) | 430 (3.4%) |
| 45 to 59 Minutes | 417 (3.4%) | 377 (2.9%) |
| 60 to 89 Minutes | 666 (5.4%) | 343 (2.7%) |
| 90 or more Minutes | 563 (4.5%) | 278 (2.2%) |
Time of Departure to Work by Sex in Davis
The most frequent times of departure to work in Davis are 8:00 AM to 8:29 AM (2,003, 16.1%) for males and 8:00 AM to 8:29 AM (2,303, 18.0%) for females.
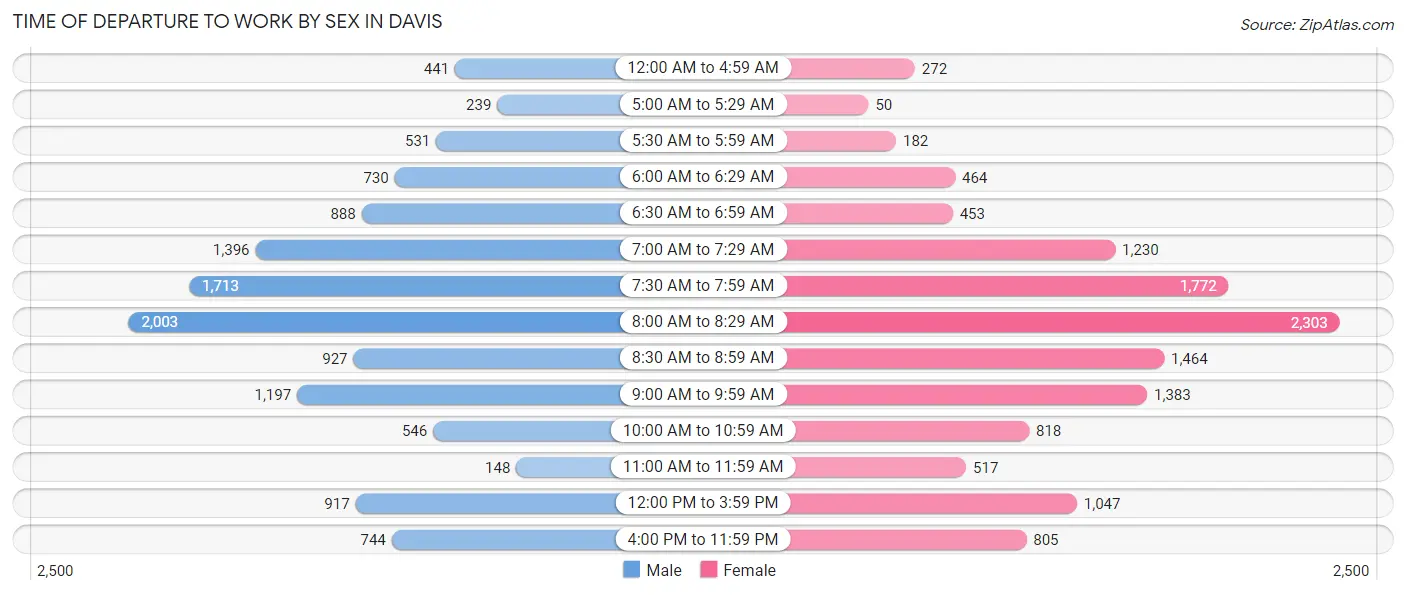
| Time of Departure | Male | Female |
| 12:00 AM to 4:59 AM | 441 (3.5%) | 272 (2.1%) |
| 5:00 AM to 5:29 AM | 239 (1.9%) | 50 (0.4%) |
| 5:30 AM to 5:59 AM | 531 (4.3%) | 182 (1.4%) |
| 6:00 AM to 6:29 AM | 730 (5.9%) | 464 (3.6%) |
| 6:30 AM to 6:59 AM | 888 (7.1%) | 453 (3.5%) |
| 7:00 AM to 7:29 AM | 1,396 (11.2%) | 1,230 (9.6%) |
| 7:30 AM to 7:59 AM | 1,713 (13.8%) | 1,772 (13.9%) |
| 8:00 AM to 8:29 AM | 2,003 (16.1%) | 2,303 (18.0%) |
| 8:30 AM to 8:59 AM | 927 (7.5%) | 1,464 (11.5%) |
| 9:00 AM to 9:59 AM | 1,197 (9.6%) | 1,383 (10.8%) |
| 10:00 AM to 10:59 AM | 546 (4.4%) | 818 (6.4%) |
| 11:00 AM to 11:59 AM | 148 (1.2%) | 517 (4.1%) |
| 12:00 PM to 3:59 PM | 917 (7.4%) | 1,047 (8.2%) |
| 4:00 PM to 11:59 PM | 744 (6.0%) | 805 (6.3%) |
| Total | 12,420 (100.0%) | 12,760 (100.0%) |
Housing Occupancy in Davis
Occupancy by Ownership in Davis
Of the total 25,669 dwellings in Davis, owner-occupied units account for 10,782 (42.0%), while renter-occupied units make up 14,887 (58.0%).
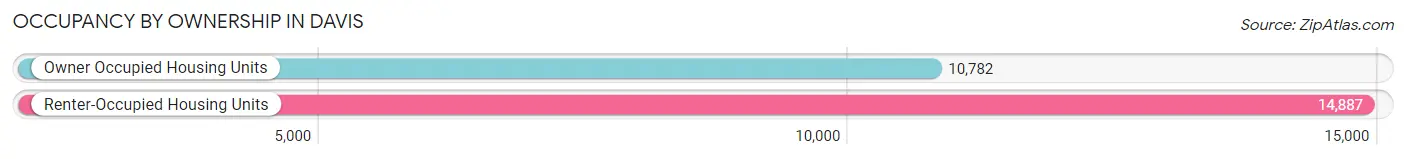
| Occupancy | # Housing Units | % Housing Units |
| Owner Occupied Housing Units | 10,782 | 42.0% |
| Renter-Occupied Housing Units | 14,887 | 58.0% |
| Total Occupied Housing Units | 25,669 | 100.0% |
Occupancy by Household Size in Davis
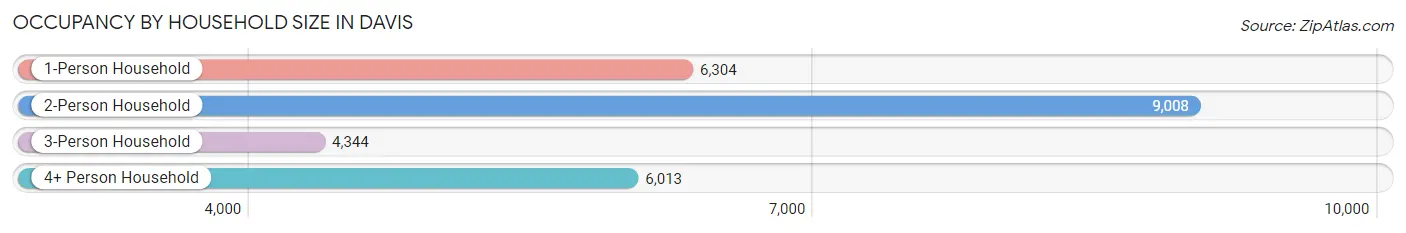
| Household Size | # Housing Units | % Housing Units |
| 1-Person Household | 6,304 | 24.6% |
| 2-Person Household | 9,008 | 35.1% |
| 3-Person Household | 4,344 | 16.9% |
| 4+ Person Household | 6,013 | 23.4% |
| Total Housing Units | 25,669 | 100.0% |
Occupancy by Ownership by Household Size in Davis
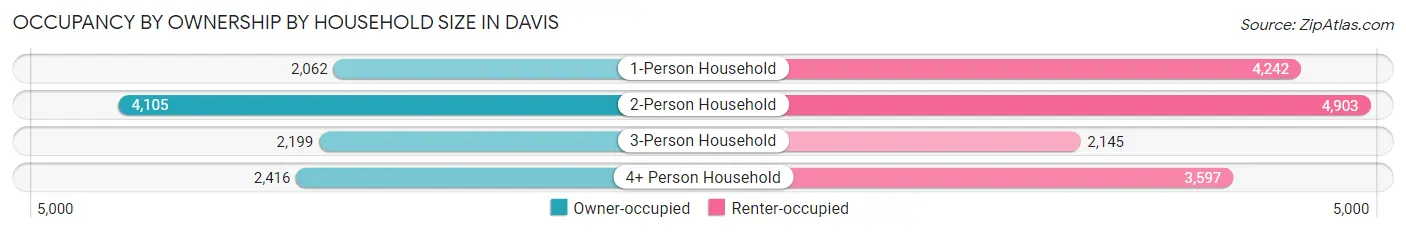
| Household Size | Owner-occupied | Renter-occupied |
| 1-Person Household | 2,062 (32.7%) | 4,242 (67.3%) |
| 2-Person Household | 4,105 (45.6%) | 4,903 (54.4%) |
| 3-Person Household | 2,199 (50.6%) | 2,145 (49.4%) |
| 4+ Person Household | 2,416 (40.2%) | 3,597 (59.8%) |
| Total Housing Units | 10,782 (42.0%) | 14,887 (58.0%) |
Occupancy by Educational Attainment in Davis
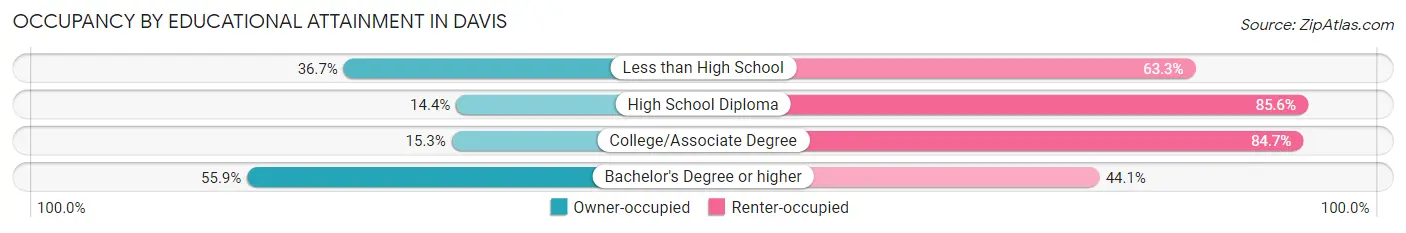
| Household Size | Owner-occupied | Renter-occupied |
| Less than High School | 119 (36.7%) | 205 (63.3%) |
| High School Diploma | 247 (14.4%) | 1,464 (85.6%) |
| College/Associate Degree | 1,056 (15.3%) | 5,828 (84.7%) |
| Bachelor's Degree or higher | 9,360 (55.9%) | 7,390 (44.1%) |
Occupancy by Age of Householder in Davis
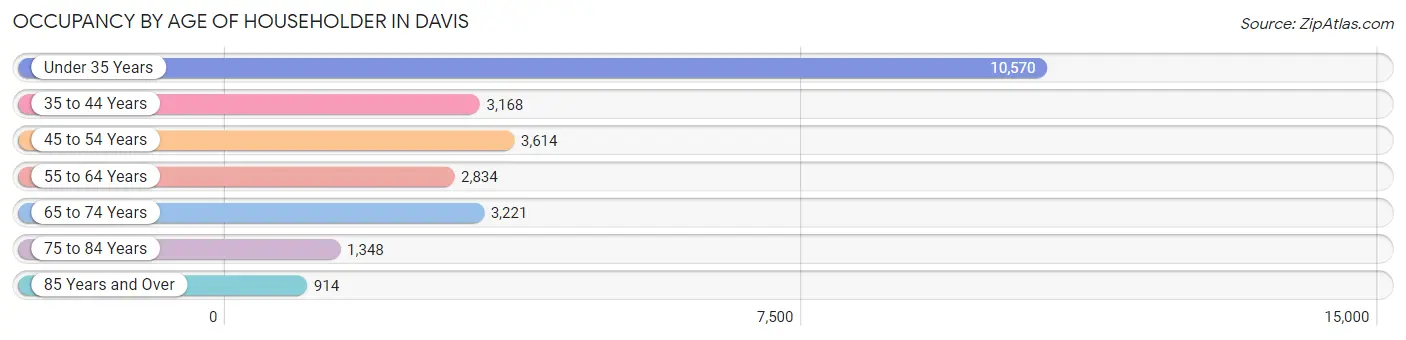
| Age Bracket | # Households | % Households |
| Under 35 Years | 10,570 | 41.2% |
| 35 to 44 Years | 3,168 | 12.3% |
| 45 to 54 Years | 3,614 | 14.1% |
| 55 to 64 Years | 2,834 | 11.0% |
| 65 to 74 Years | 3,221 | 12.6% |
| 75 to 84 Years | 1,348 | 5.2% |
| 85 Years and Over | 914 | 3.6% |
| Total | 25,669 | 100.0% |
Housing Finances in Davis
Median Income by Occupancy in Davis
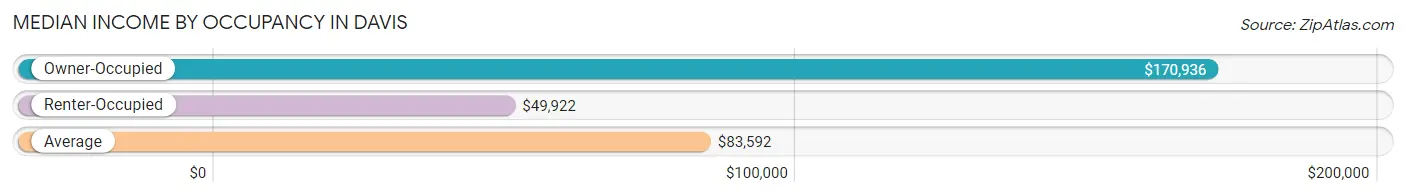
| Occupancy Type | # Households | Median Income |
| Owner-Occupied | 10,782 (42.0%) | $170,936 |
| Renter-Occupied | 14,887 (58.0%) | $49,922 |
| Average | 25,669 (100.0%) | $83,592 |
Occupancy by Householder Income Bracket in Davis
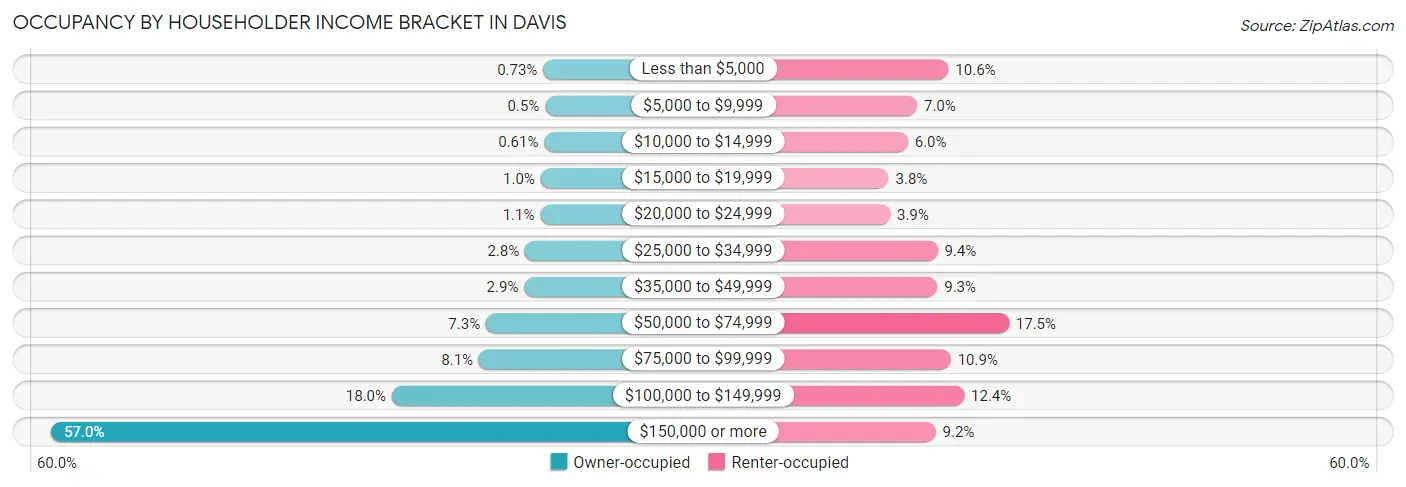
| Income Bracket | Owner-occupied | Renter-occupied |
| Less than $5,000 | 79 (0.7%) | 1,580 (10.6%) |
| $5,000 to $9,999 | 54 (0.5%) | 1,047 (7.0%) |
| $10,000 to $14,999 | 66 (0.6%) | 889 (6.0%) |
| $15,000 to $19,999 | 110 (1.0%) | 562 (3.8%) |
| $20,000 to $24,999 | 114 (1.1%) | 587 (3.9%) |
| $25,000 to $34,999 | 303 (2.8%) | 1,394 (9.4%) |
| $35,000 to $49,999 | 313 (2.9%) | 1,391 (9.3%) |
| $50,000 to $74,999 | 784 (7.3%) | 2,608 (17.5%) |
| $75,000 to $99,999 | 871 (8.1%) | 1,619 (10.9%) |
| $100,000 to $149,999 | 1,944 (18.0%) | 1,848 (12.4%) |
| $150,000 or more | 6,144 (57.0%) | 1,362 (9.1%) |
| Total | 10,782 (100.0%) | 14,887 (100.0%) |
Monthly Housing Cost Tiers in Davis
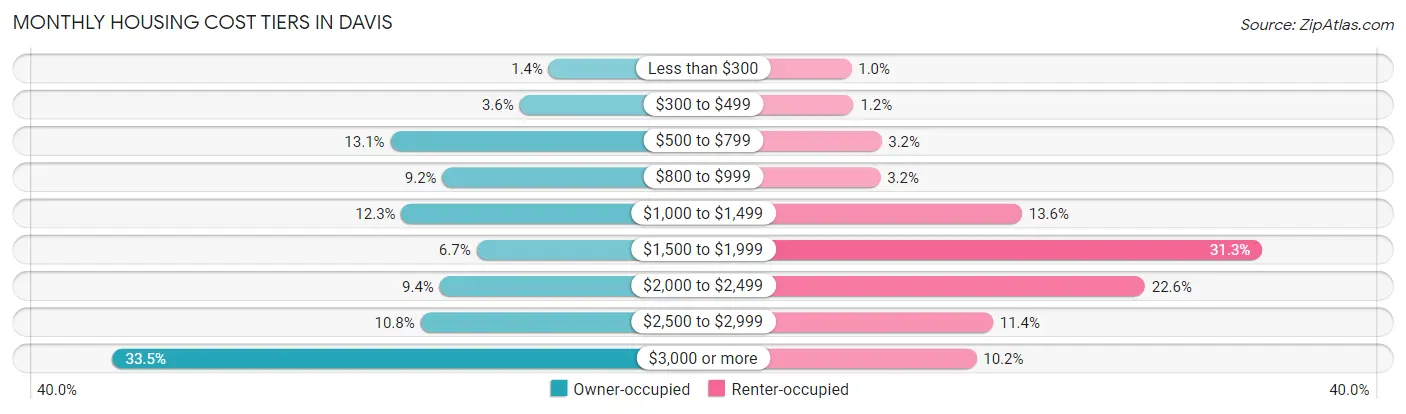
| Monthly Cost | Owner-occupied | Renter-occupied |
| Less than $300 | 150 (1.4%) | 152 (1.0%) |
| $300 to $499 | 383 (3.5%) | 176 (1.2%) |
| $500 to $799 | 1,408 (13.1%) | 481 (3.2%) |
| $800 to $999 | 995 (9.2%) | 469 (3.2%) |
| $1,000 to $1,499 | 1,321 (12.2%) | 2,021 (13.6%) |
| $1,500 to $1,999 | 725 (6.7%) | 4,657 (31.3%) |
| $2,000 to $2,499 | 1,017 (9.4%) | 3,370 (22.6%) |
| $2,500 to $2,999 | 1,169 (10.8%) | 1,703 (11.4%) |
| $3,000 or more | 3,614 (33.5%) | 1,523 (10.2%) |
| Total | 10,782 (100.0%) | 14,887 (100.0%) |
Physical Housing Characteristics in Davis
Housing Structures in Davis
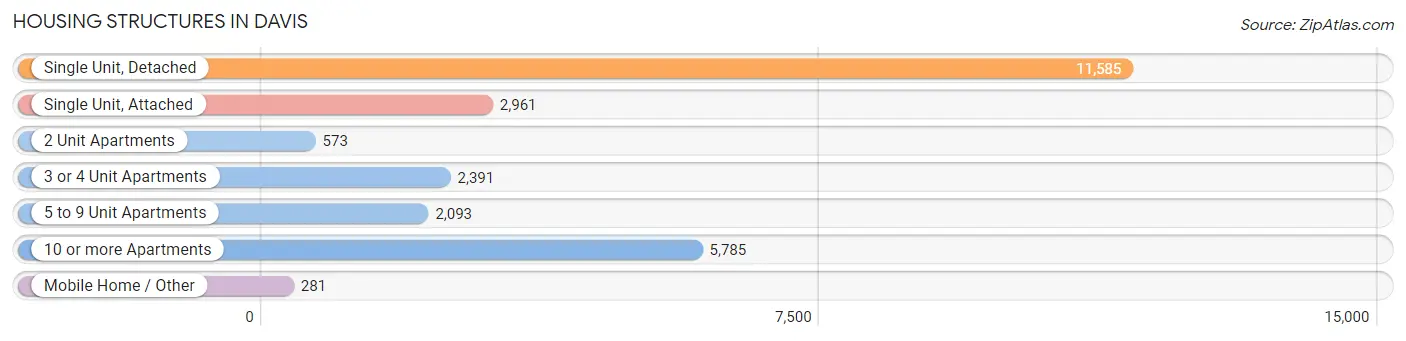
| Structure Type | # Housing Units | % Housing Units |
| Single Unit, Detached | 11,585 | 45.1% |
| Single Unit, Attached | 2,961 | 11.5% |
| 2 Unit Apartments | 573 | 2.2% |
| 3 or 4 Unit Apartments | 2,391 | 9.3% |
| 5 to 9 Unit Apartments | 2,093 | 8.2% |
| 10 or more Apartments | 5,785 | 22.5% |
| Mobile Home / Other | 281 | 1.1% |
| Total | 25,669 | 100.0% |
Housing Structures by Occupancy in Davis
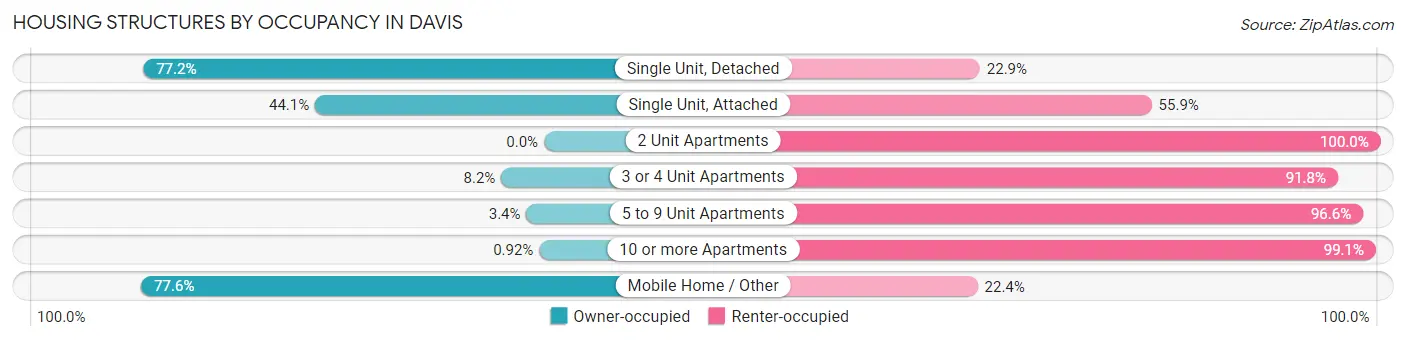
| Structure Type | Owner-occupied | Renter-occupied |
| Single Unit, Detached | 8,938 (77.1%) | 2,647 (22.9%) |
| Single Unit, Attached | 1,305 (44.1%) | 1,656 (55.9%) |
| 2 Unit Apartments | 0 (0.0%) | 573 (100.0%) |
| 3 or 4 Unit Apartments | 197 (8.2%) | 2,194 (91.8%) |
| 5 to 9 Unit Apartments | 71 (3.4%) | 2,022 (96.6%) |
| 10 or more Apartments | 53 (0.9%) | 5,732 (99.1%) |
| Mobile Home / Other | 218 (77.6%) | 63 (22.4%) |
| Total | 10,782 (42.0%) | 14,887 (58.0%) |
Housing Structures by Number of Rooms in Davis
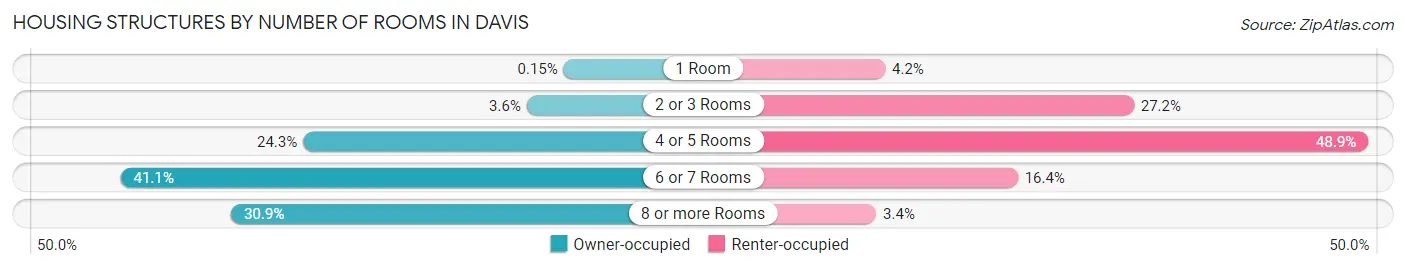
| Number of Rooms | Owner-occupied | Renter-occupied |
| 1 Room | 16 (0.2%) | 623 (4.2%) |
| 2 or 3 Rooms | 384 (3.6%) | 4,046 (27.2%) |
| 4 or 5 Rooms | 2,615 (24.2%) | 7,273 (48.8%) |
| 6 or 7 Rooms | 4,434 (41.1%) | 2,447 (16.4%) |
| 8 or more Rooms | 3,333 (30.9%) | 498 (3.4%) |
| Total | 10,782 (100.0%) | 14,887 (100.0%) |
Housing Structure by Heating Type in Davis
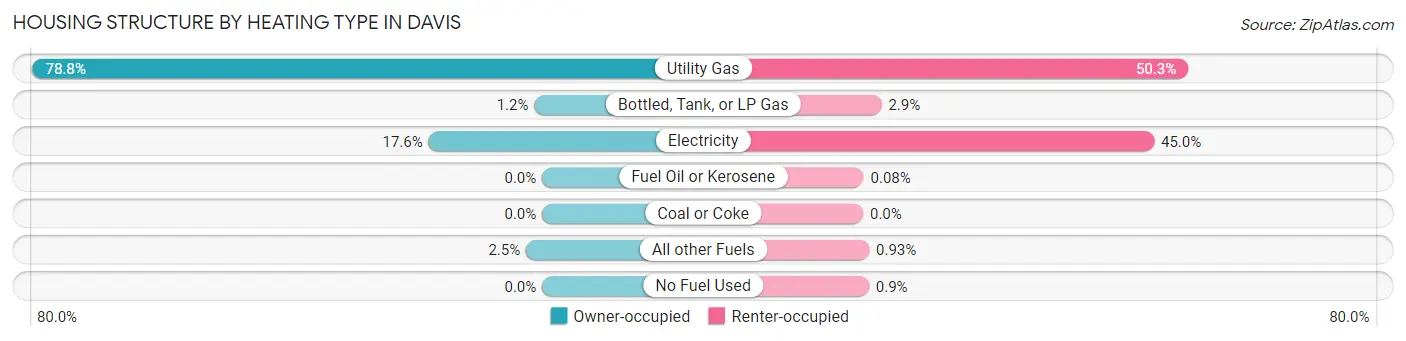
| Heating Type | Owner-occupied | Renter-occupied |
| Utility Gas | 8,492 (78.8%) | 7,481 (50.2%) |
| Bottled, Tank, or LP Gas | 131 (1.2%) | 424 (2.9%) |
| Electricity | 1,892 (17.5%) | 6,698 (45.0%) |
| Fuel Oil or Kerosene | 0 (0.0%) | 12 (0.1%) |
| Coal or Coke | 0 (0.0%) | 0 (0.0%) |
| All other Fuels | 267 (2.5%) | 138 (0.9%) |
| No Fuel Used | 0 (0.0%) | 134 (0.9%) |
| Total | 10,782 (100.0%) | 14,887 (100.0%) |
Household Vehicle Usage in Davis
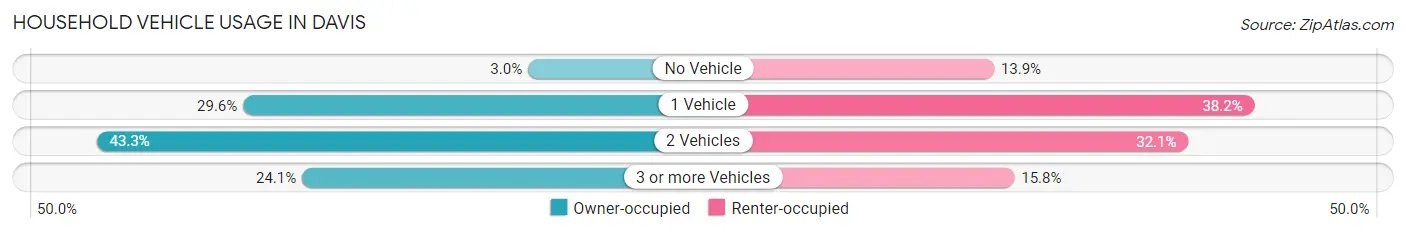
| Vehicles per Household | Owner-occupied | Renter-occupied |
| No Vehicle | 325 (3.0%) | 2,071 (13.9%) |
| 1 Vehicle | 3,191 (29.6%) | 5,691 (38.2%) |
| 2 Vehicles | 4,668 (43.3%) | 4,771 (32.1%) |
| 3 or more Vehicles | 2,598 (24.1%) | 2,354 (15.8%) |
| Total | 10,782 (100.0%) | 14,887 (100.0%) |
Real Estate & Mortgages in Davis
Real Estate and Mortgage Overview in Davis
| Characteristic | Without Mortgage | With Mortgage |
| Housing Units | 4,116 | 6,666 |
| Median Property Value | $771,300 | $821,000 |
| Median Household Income | $133,304 | $4,286 |
| Monthly Housing Costs | $857 | $3,614 |
| Real Estate Taxes | $4,686 | $56 |
Property Value by Mortgage Status in Davis
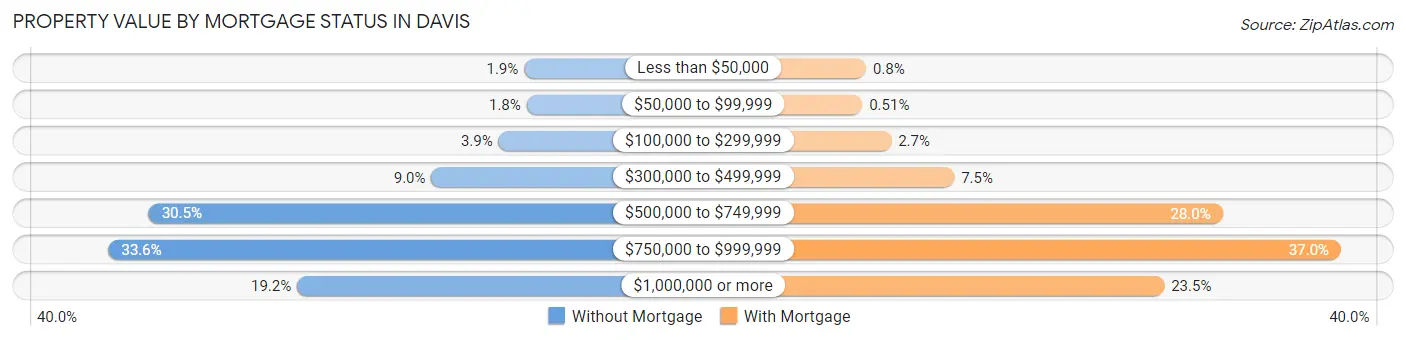
| Property Value | Without Mortgage | With Mortgage |
| Less than $50,000 | 80 (1.9%) | 53 (0.8%) |
| $50,000 to $99,999 | 72 (1.8%) | 34 (0.5%) |
| $100,000 to $299,999 | 160 (3.9%) | 181 (2.7%) |
| $300,000 to $499,999 | 371 (9.0%) | 501 (7.5%) |
| $500,000 to $749,999 | 1,257 (30.5%) | 1,864 (28.0%) |
| $750,000 to $999,999 | 1,384 (33.6%) | 2,465 (37.0%) |
| $1,000,000 or more | 792 (19.2%) | 1,568 (23.5%) |
| Total | 4,116 (100.0%) | 6,666 (100.0%) |
Household Income by Mortgage Status in Davis
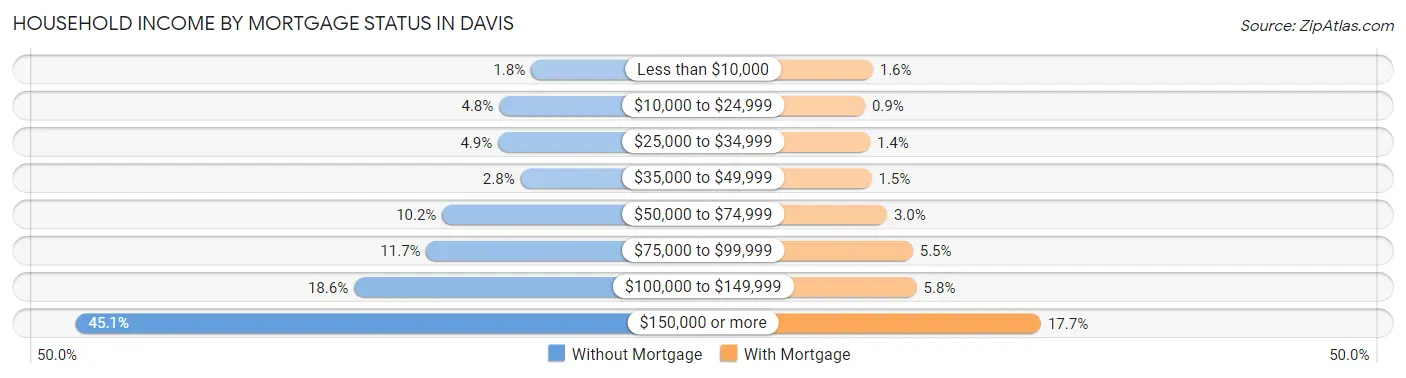
| Household Income | Without Mortgage | With Mortgage |
| Less than $10,000 | 73 (1.8%) | 109 (1.6%) |
| $10,000 to $24,999 | 198 (4.8%) | 60 (0.9%) |
| $25,000 to $34,999 | 202 (4.9%) | 92 (1.4%) |
| $35,000 to $49,999 | 114 (2.8%) | 101 (1.5%) |
| $50,000 to $74,999 | 421 (10.2%) | 199 (3.0%) |
| $75,000 to $99,999 | 483 (11.7%) | 363 (5.4%) |
| $100,000 to $149,999 | 767 (18.6%) | 388 (5.8%) |
| $150,000 or more | 1,858 (45.1%) | 1,177 (17.7%) |
| Total | 4,116 (100.0%) | 6,666 (100.0%) |
Property Value to Household Income Ratio in Davis
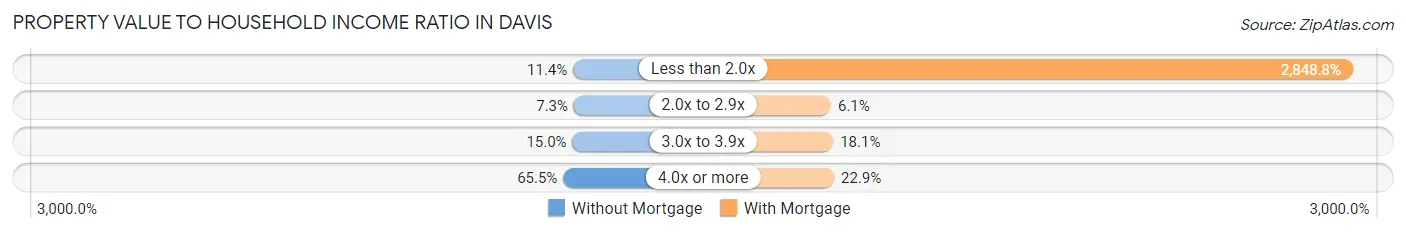
| Value-to-Income Ratio | Without Mortgage | With Mortgage |
| Less than 2.0x | 471 (11.4%) | 189,903 (2,848.8%) |
| 2.0x to 2.9x | 301 (7.3%) | 405 (6.1%) |
| 3.0x to 3.9x | 619 (15.0%) | 1,205 (18.1%) |
| 4.0x or more | 2,696 (65.5%) | 1,529 (22.9%) |
| Total | 4,116 (100.0%) | 6,666 (100.0%) |
Real Estate Taxes by Mortgage Status in Davis
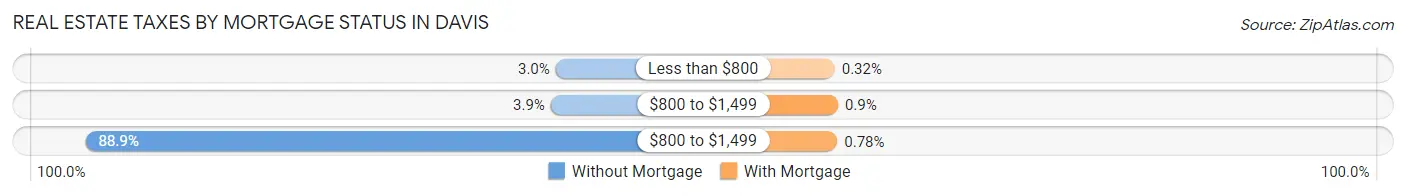
| Property Taxes | Without Mortgage | With Mortgage |
| Less than $800 | 124 (3.0%) | 21 (0.3%) |
| $800 to $1,499 | 161 (3.9%) | 60 (0.9%) |
| $800 to $1,499 | 3,658 (88.9%) | 52 (0.8%) |
| Total | 4,116 (100.0%) | 6,666 (100.0%) |
Health & Disability in Davis
Health Insurance Coverage by Age in Davis
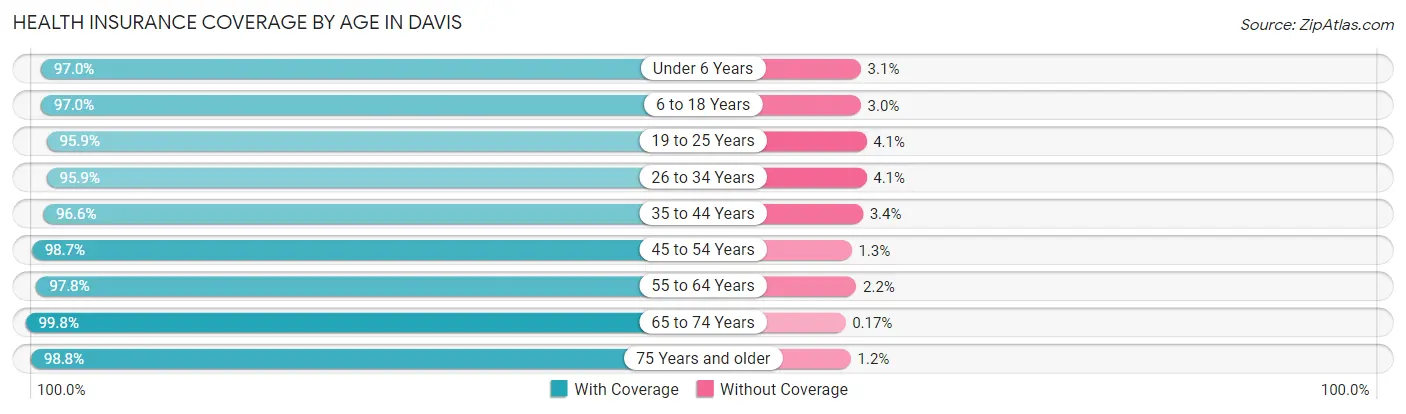
| Age Bracket | With Coverage | Without Coverage |
| Under 6 Years | 2,477 (97.0%) | 78 (3.0%) |
| 6 to 18 Years | 8,401 (97.0%) | 263 (3.0%) |
| 19 to 25 Years | 21,129 (95.9%) | 901 (4.1%) |
| 26 to 34 Years | 7,173 (95.9%) | 307 (4.1%) |
| 35 to 44 Years | 5,593 (96.6%) | 199 (3.4%) |
| 45 to 54 Years | 6,139 (98.7%) | 83 (1.3%) |
| 55 to 64 Years | 5,286 (97.8%) | 119 (2.2%) |
| 65 to 74 Years | 5,182 (99.8%) | 9 (0.2%) |
| 75 Years and older | 3,527 (98.8%) | 42 (1.2%) |
| Total | 64,907 (97.0%) | 2,001 (3.0%) |
Health Insurance Coverage by Citizenship Status in Davis
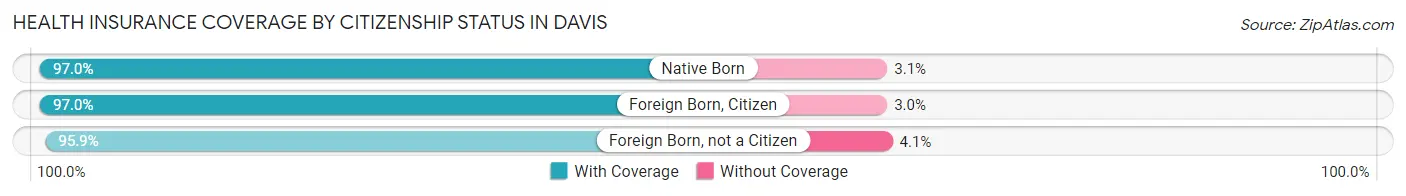
| Citizenship Status | With Coverage | Without Coverage |
| Native Born | 2,477 (97.0%) | 78 (3.0%) |
| Foreign Born, Citizen | 8,401 (97.0%) | 263 (3.0%) |
| Foreign Born, not a Citizen | 21,129 (95.9%) | 901 (4.1%) |
Health Insurance Coverage by Household Income in Davis
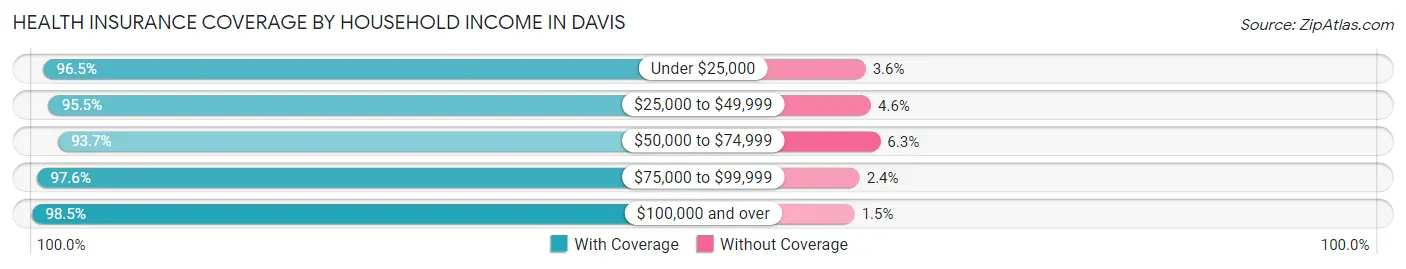
| Household Income | With Coverage | Without Coverage |
| Under $25,000 | 11,099 (96.5%) | 409 (3.5%) |
| $25,000 to $49,999 | 7,490 (95.5%) | 357 (4.5%) |
| $50,000 to $74,999 | 7,231 (93.7%) | 486 (6.3%) |
| $75,000 to $99,999 | 5,693 (97.6%) | 142 (2.4%) |
| $100,000 and over | 31,796 (98.5%) | 478 (1.5%) |
Public vs Private Health Insurance Coverage by Age in Davis
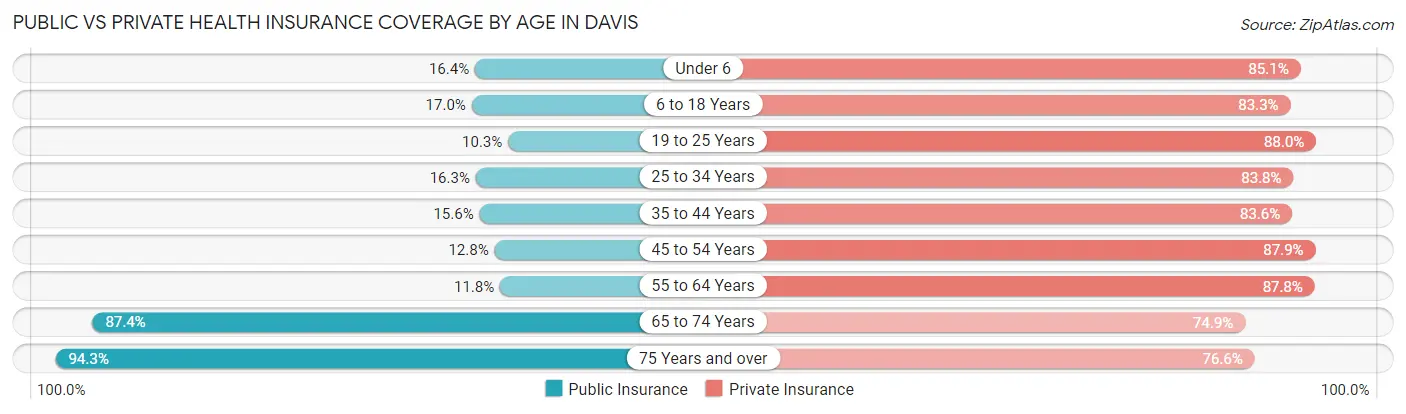
| Age Bracket | Public Insurance | Private Insurance |
| Under 6 | 419 (16.4%) | 2,175 (85.1%) |
| 6 to 18 Years | 1,475 (17.0%) | 7,214 (83.3%) |
| 19 to 25 Years | 2,257 (10.2%) | 19,396 (88.0%) |
| 25 to 34 Years | 1,216 (16.3%) | 6,269 (83.8%) |
| 35 to 44 Years | 902 (15.6%) | 4,840 (83.6%) |
| 45 to 54 Years | 795 (12.8%) | 5,469 (87.9%) |
| 55 to 64 Years | 635 (11.7%) | 4,744 (87.8%) |
| 65 to 74 Years | 4,537 (87.4%) | 3,886 (74.9%) |
| 75 Years and over | 3,364 (94.3%) | 2,735 (76.6%) |
| Total | 15,600 (23.3%) | 56,728 (84.8%) |
Disability Status by Sex by Age in Davis
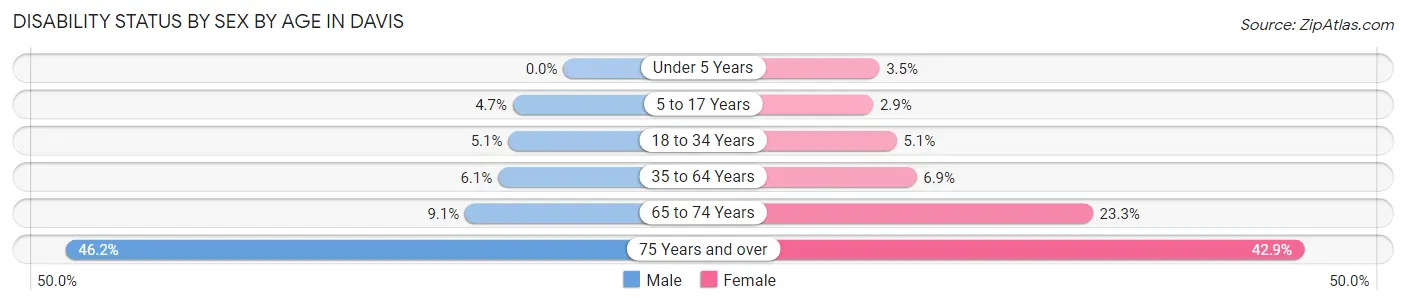
| Age Bracket | Male | Female |
| Under 5 Years | 0 (0.0%) | 39 (3.5%) |
| 5 to 17 Years | 178 (4.7%) | 103 (2.9%) |
| 18 to 34 Years | 751 (5.1%) | 841 (5.1%) |
| 35 to 64 Years | 508 (6.1%) | 624 (6.9%) |
| 65 to 74 Years | 225 (9.1%) | 634 (23.3%) |
| 75 Years and over | 604 (46.2%) | 970 (42.9%) |
Disability Class by Sex by Age in Davis
Disability Class: Hearing Difficulty
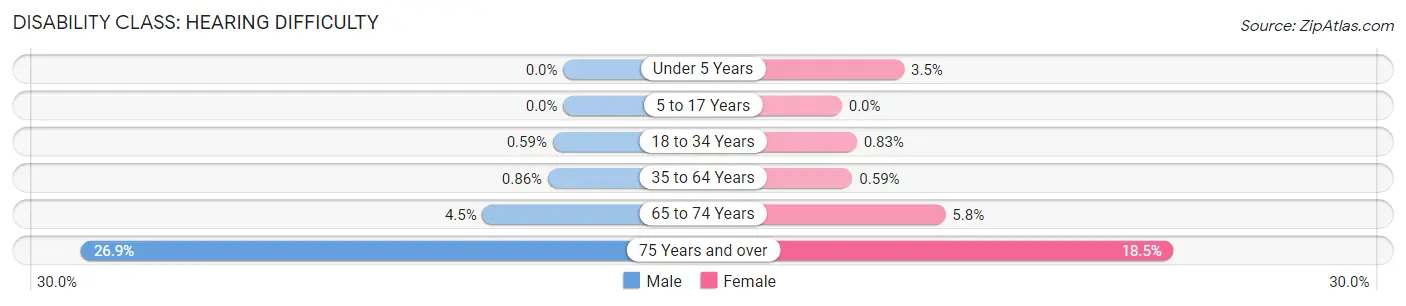
| Age Bracket | Male | Female |
| Under 5 Years | 0 (0.0%) | 39 (3.5%) |
| 5 to 17 Years | 0 (0.0%) | 0 (0.0%) |
| 18 to 34 Years | 87 (0.6%) | 138 (0.8%) |
| 35 to 64 Years | 72 (0.9%) | 53 (0.6%) |
| 65 to 74 Years | 111 (4.5%) | 157 (5.8%) |
| 75 Years and over | 351 (26.9%) | 418 (18.5%) |
Disability Class: Vision Difficulty
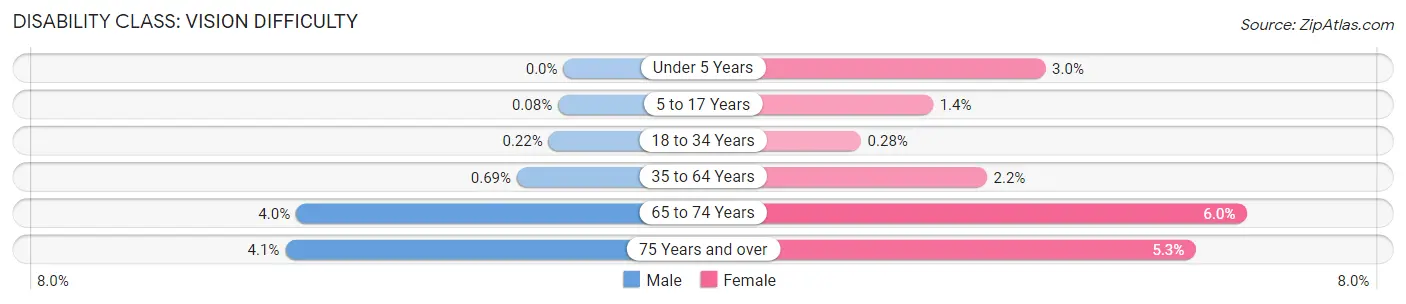
| Age Bracket | Male | Female |
| Under 5 Years | 0 (0.0%) | 34 (3.0%) |
| 5 to 17 Years | 3 (0.1%) | 48 (1.3%) |
| 18 to 34 Years | 32 (0.2%) | 46 (0.3%) |
| 35 to 64 Years | 58 (0.7%) | 194 (2.1%) |
| 65 to 74 Years | 98 (4.0%) | 164 (6.0%) |
| 75 Years and over | 54 (4.1%) | 119 (5.3%) |
Disability Class: Cognitive Difficulty
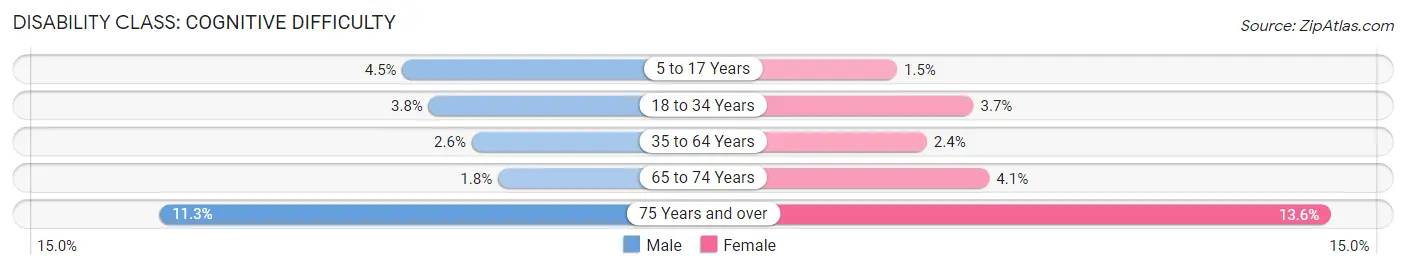
| Age Bracket | Male | Female |
| 5 to 17 Years | 170 (4.5%) | 55 (1.5%) |
| 18 to 34 Years | 552 (3.7%) | 608 (3.7%) |
| 35 to 64 Years | 214 (2.5%) | 214 (2.4%) |
| 65 to 74 Years | 45 (1.8%) | 112 (4.1%) |
| 75 Years and over | 147 (11.3%) | 308 (13.6%) |
Disability Class: Ambulatory Difficulty
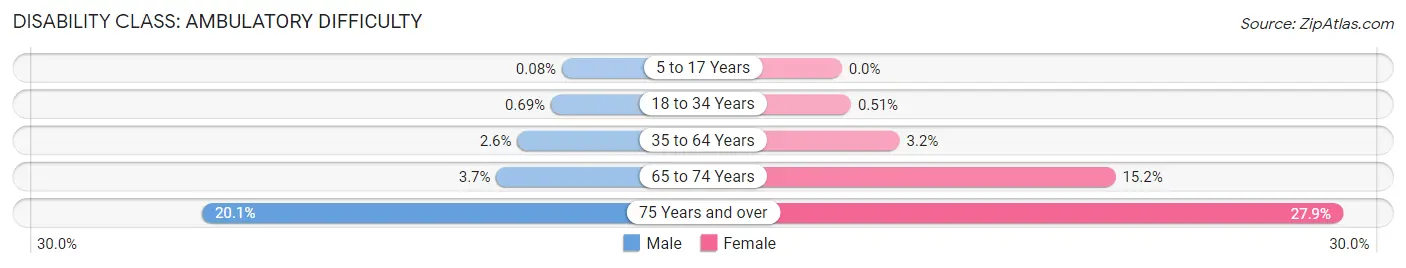
| Age Bracket | Male | Female |
| 5 to 17 Years | 3 (0.1%) | 0 (0.0%) |
| 18 to 34 Years | 101 (0.7%) | 84 (0.5%) |
| 35 to 64 Years | 215 (2.6%) | 291 (3.2%) |
| 65 to 74 Years | 92 (3.7%) | 415 (15.2%) |
| 75 Years and over | 263 (20.1%) | 631 (27.9%) |
Disability Class: Self-Care Difficulty
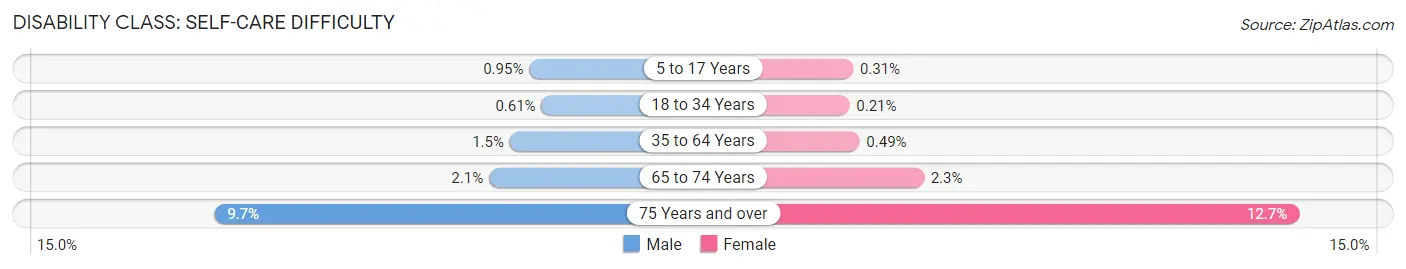
| Age Bracket | Male | Female |
| 5 to 17 Years | 36 (0.9%) | 11 (0.3%) |
| 18 to 34 Years | 89 (0.6%) | 35 (0.2%) |
| 35 to 64 Years | 125 (1.5%) | 44 (0.5%) |
| 65 to 74 Years | 51 (2.1%) | 62 (2.3%) |
| 75 Years and over | 127 (9.7%) | 288 (12.7%) |
Technology Access in Davis
Computing Device Access in Davis
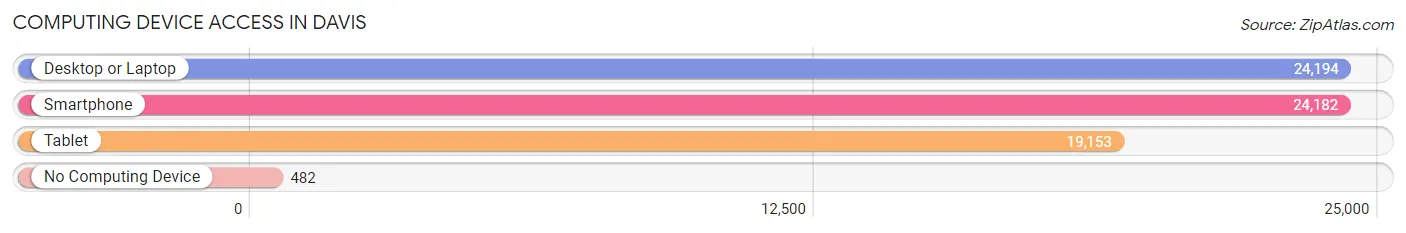
| Device Type | # Households | % Households |
| Desktop or Laptop | 24,194 | 94.3% |
| Smartphone | 24,182 | 94.2% |
| Tablet | 19,153 | 74.6% |
| No Computing Device | 482 | 1.9% |
| Total | 25,669 | 100.0% |
Internet Access in Davis
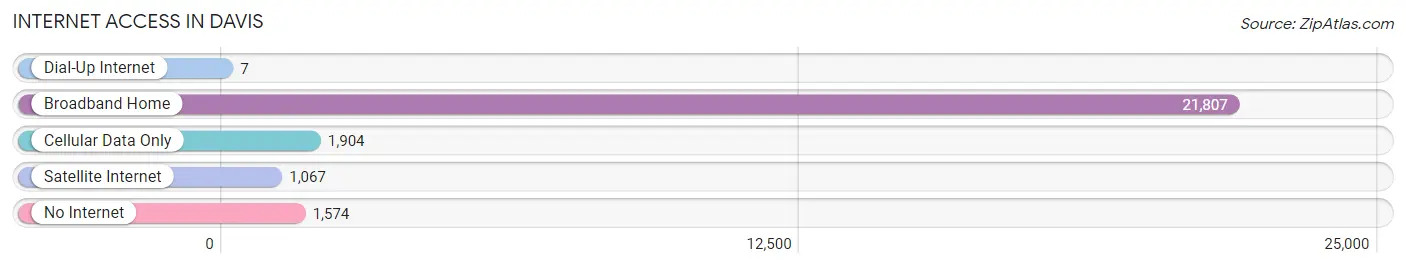
| Internet Type | # Households | % Households |
| Dial-Up Internet | 7 | 0.0% |
| Broadband Home | 21,807 | 85.0% |
| Cellular Data Only | 1,904 | 7.4% |
| Satellite Internet | 1,067 | 4.2% |
| No Internet | 1,574 | 6.1% |
| Total | 25,669 | 100.0% |
Davis Summary
Davis, California is a city located in Yolo County, California, United States. It is part of the Sacramento metropolitan area and is the home of the University of California, Davis. The city has a population of approximately 67,000 people and is known for its vibrant culture, diverse economy, and excellent quality of life.
Geography
Davis is located in the Central Valley of California, approximately 20 miles west of Sacramento. It is situated on the eastern edge of the Sacramento Valley, and is bordered by the cities of Woodland to the north, Dixon to the east, and Winters to the south. The city is located at an elevation of approximately 100 feet above sea level, and is surrounded by rolling hills and farmland. The city is also home to the Putah Creek State Wildlife Area, which is a popular destination for bird watching and other outdoor activities.
Economy
Davis is home to a diverse economy, with a variety of industries represented. The city is home to the University of California, Davis, which is the largest employer in the city. Other major employers include the Davis Joint Unified School District, the City of Davis, and the Davis Medical Center. The city is also home to a number of technology companies, including Intel, Hewlett-Packard, and Oracle. Additionally, Davis is home to a number of agricultural businesses, including the California Olive Oil Council, the California Rice Commission, and the California Tomato Growers Association.
Demographics
As of the 2010 census, the population of Davis was 65,622. The racial makeup of the city was 68.2% White, 11.3% Asian, 8.2% Hispanic or Latino, 6.2% African American, and 6.1% from other races. The median household income in Davis was $63,837, and the median family income was $77,837. The per capita income in Davis was $31,837.
The city is home to a large student population, with approximately 30,000 students enrolled at the University of California, Davis. Additionally, the city is home to a large number of young professionals, with a median age of 28.
Conclusion
Davis, California is a vibrant city located in Yolo County, California. It is home to the University of California, Davis, and is known for its diverse economy, excellent quality of life, and vibrant culture. The city has a population of approximately 67,000 people, and is home to a large student population and a large number of young professionals. Davis is a great place to live, work, and play, and is a great example of a thriving California city.
Common Questions
What is the Total Population of Davis?
Total Population of Davis is 67,203.
What is the Total Male Population of Davis?
Total Male Population of Davis is 31,888.
What is the Total Female Population of Davis?
Total Female Population of Davis is 35,315.
What is the Ratio of Males per 100 Females in Davis?
There are 90.30 Males per 100 Females in Davis.
What is the Ratio of Females per 100 Males in Davis?
There are 110.75 Females per 100 Males in Davis.
What is the Median Population Age in Davis?
Median Population Age in Davis is 26.3 Years.
What is the Average Family Size in Davis
Average Family Size in Davis is 2.9 People.
What is the Average Household Size in Davis
Average Household Size in Davis is 2.5 People.
What is Per Capita Income in Davis?
Per Capita income in Davis is $46,899.
What is the Median Family Income in Davis?
Median Family Income in Davis is $152,155.
What is the Median Household income in Davis?
Median Household Income in Davis is $83,592.
What is Income or Wage Gap in Davis?
Income or Wage Gap in Davis is 35.5%.
Women in Davis earn 64.5 cents for every dollar earned by a man.
What is Family Income Deficit in Davis?
Family Income Deficit in Davis is $11,499.
Families that are below poverty line in Davis earn $11,499 less on average than the poverty threshold level.
What is Inequality or Gini Index in Davis?
Inequality or Gini Index in Davis is 0.52.
How Large is the Labor Force in Davis?
There are 34,328 People in the Labor Forcein in Davis.
What is the Percentage of People in the Labor Force in Davis?
58.2% of People are in the Labor Force in Davis.
What is the Unemployment Rate in Davis?
Unemployment Rate in Davis is 5.8%.