Coloma, CA
Coloma Map
Coloma Overview
279
TOTAL POPULATION
84
MALE POPULATION
195
FEMALE POPULATION
43.08
MALES / 100 FEMALES
232.14
FEMALES / 100 MALES
27.5
MEDIAN AGE
2.4
AVG FAMILY SIZE
2.8
AVG HOUSEHOLD SIZE
$59,489
PER CAPITA INCOME
$250,001
AVG FAMILY INCOME
$114,201
AVG HOUSEHOLD INCOME
34.5%
WAGE / INCOME GAP [ % ]
65.5¢/ $1
WAGE / INCOME GAP [ $ ]
0.48
INEQUALITY / GINI INDEX
246
LABOR FORCE [ PEOPLE ]
88.8%
PERCENT IN LABOR FORCE
28.5%
UNEMPLOYMENT RATE
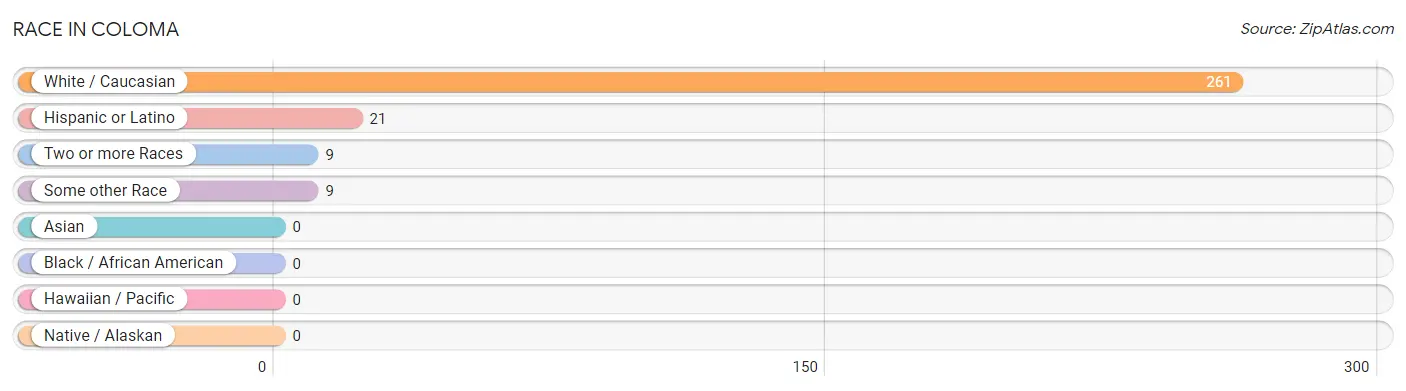
Race in Coloma
The most populous races in Coloma are White / Caucasian (261 | 93.5%), Hispanic or Latino (21 | 7.5%), and Two or more Races (9 | 3.2%).
| Race | # Population | % Population |
| Asian | 0 | 0.0% |
| Black / African American | 0 | 0.0% |
| Hawaiian / Pacific | 0 | 0.0% |
| Hispanic or Latino | 21 | 7.5% |
| Native / Alaskan | 0 | 0.0% |
| White / Caucasian | 261 | 93.5% |
| Two or more Races | 9 | 3.2% |
| Some other Race | 9 | 3.2% |
| Total | 279 | 100.0% |
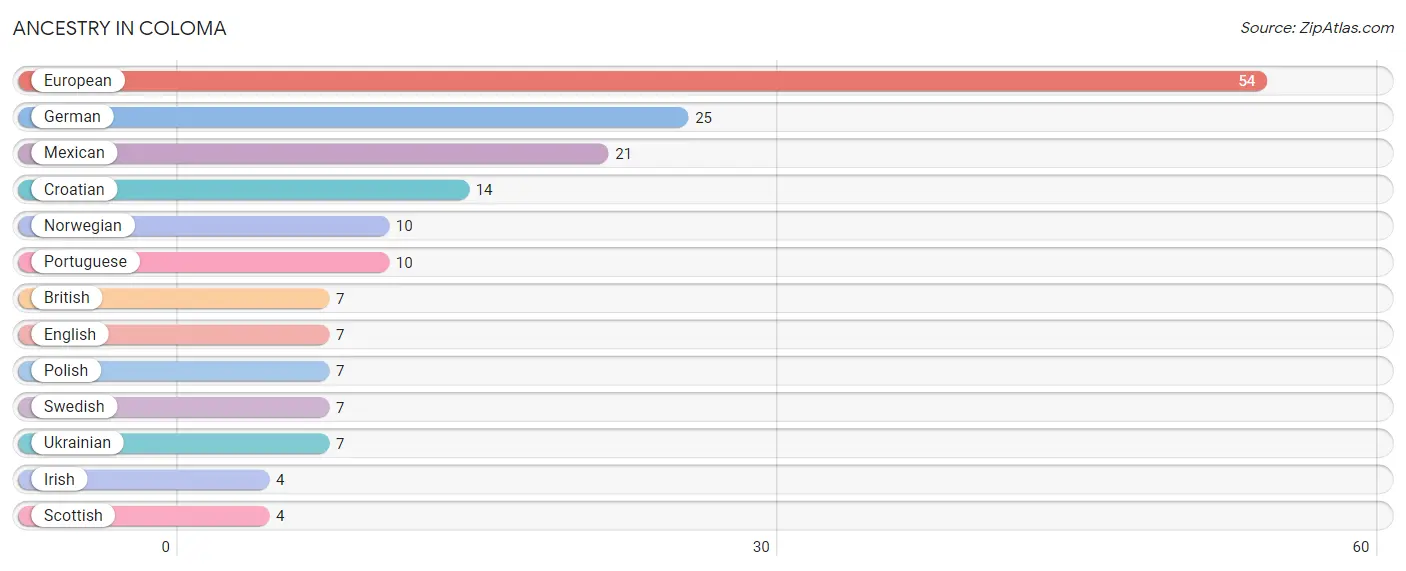
Ancestry in Coloma
The most populous ancestries reported in Coloma are European (54 | 19.4%), German (25 | 9.0%), Mexican (21 | 7.5%), Croatian (14 | 5.0%), and Norwegian (10 | 3.6%), together accounting for 44.4% of all Coloma residents.
| Ancestry | # Population | % Population |
| British | 7 | 2.5% |
| Croatian | 14 | 5.0% |
| English | 7 | 2.5% |
| European | 54 | 19.4% |
| German | 25 | 9.0% |
| Irish | 4 | 1.4% |
| Mexican | 21 | 7.5% |
| Norwegian | 10 | 3.6% |
| Polish | 7 | 2.5% |
| Portuguese | 10 | 3.6% |
| Scottish | 4 | 1.4% |
| Swedish | 7 | 2.5% |
| Ukrainian | 7 | 2.5% | View All 13 Rows |
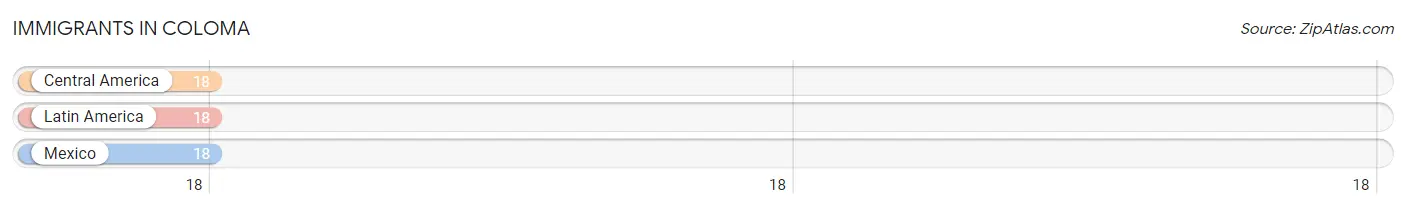
Immigrants in Coloma
The most numerous immigrant groups reported in Coloma came from Central America (18 | 6.5%), Latin America (18 | 6.5%), and Mexico (18 | 6.5%), together accounting for 19.4% of all Coloma residents.
| Immigration Origin | # Population | % Population |
| Central America | 18 | 6.5% |
| Latin America | 18 | 6.5% |
| Mexico | 18 | 6.5% | View All 3 Rows |
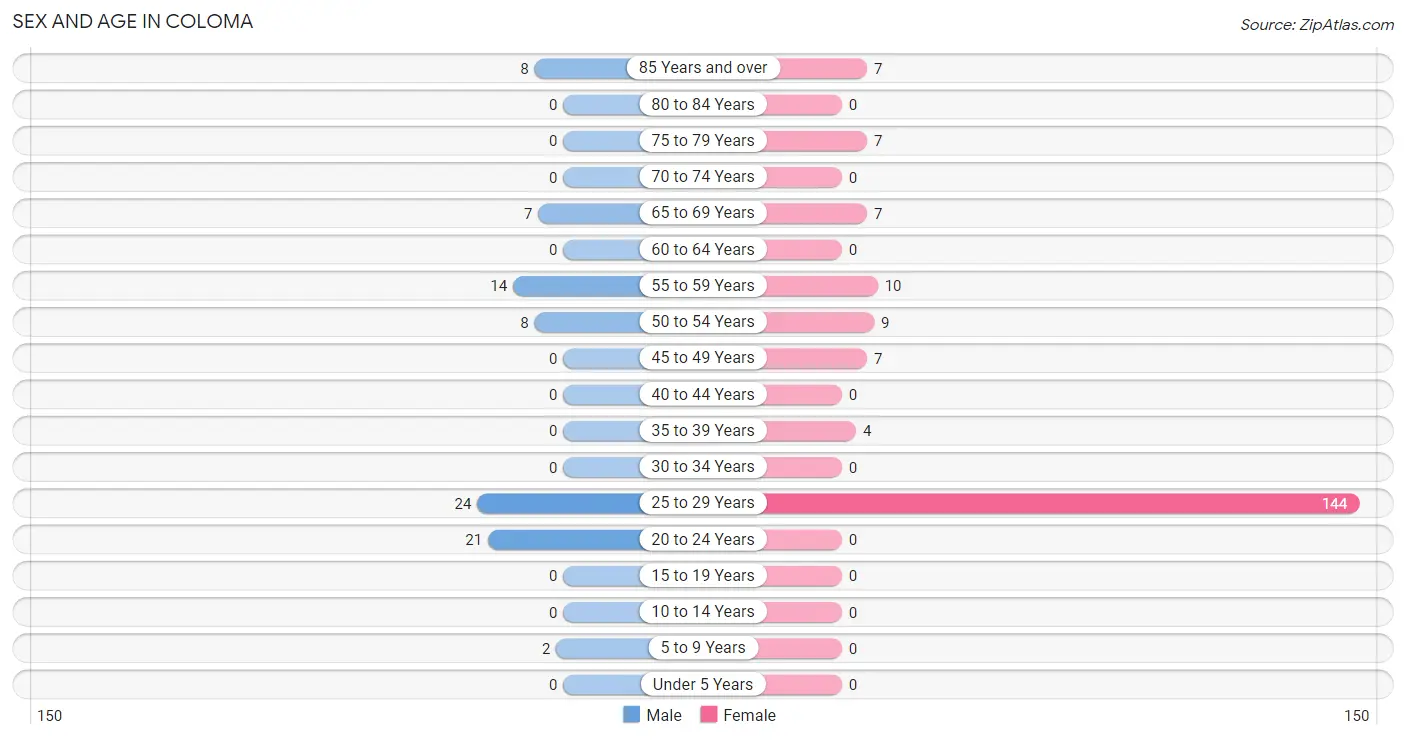
Sex and Age in Coloma
Sex and Age in Coloma
The most populous age groups in Coloma are 25 to 29 Years (24 | 28.6%) for men and 25 to 29 Years (144 | 73.9%) for women.
| Age Bracket | Male | Female |
| Under 5 Years | 0 (0.0%) | 0 (0.0%) |
| 5 to 9 Years | 2 (2.4%) | 0 (0.0%) |
| 10 to 14 Years | 0 (0.0%) | 0 (0.0%) |
| 15 to 19 Years | 0 (0.0%) | 0 (0.0%) |
| 20 to 24 Years | 21 (25.0%) | 0 (0.0%) |
| 25 to 29 Years | 24 (28.6%) | 144 (73.9%) |
| 30 to 34 Years | 0 (0.0%) | 0 (0.0%) |
| 35 to 39 Years | 0 (0.0%) | 4 (2.1%) |
| 40 to 44 Years | 0 (0.0%) | 0 (0.0%) |
| 45 to 49 Years | 0 (0.0%) | 7 (3.6%) |
| 50 to 54 Years | 8 (9.5%) | 9 (4.6%) |
| 55 to 59 Years | 14 (16.7%) | 10 (5.1%) |
| 60 to 64 Years | 0 (0.0%) | 0 (0.0%) |
| 65 to 69 Years | 7 (8.3%) | 7 (3.6%) |
| 70 to 74 Years | 0 (0.0%) | 0 (0.0%) |
| 75 to 79 Years | 0 (0.0%) | 7 (3.6%) |
| 80 to 84 Years | 0 (0.0%) | 0 (0.0%) |
| 85 Years and over | 8 (9.5%) | 7 (3.6%) |
| Total | 84 (100.0%) | 195 (100.0%) |
Families and Households in Coloma
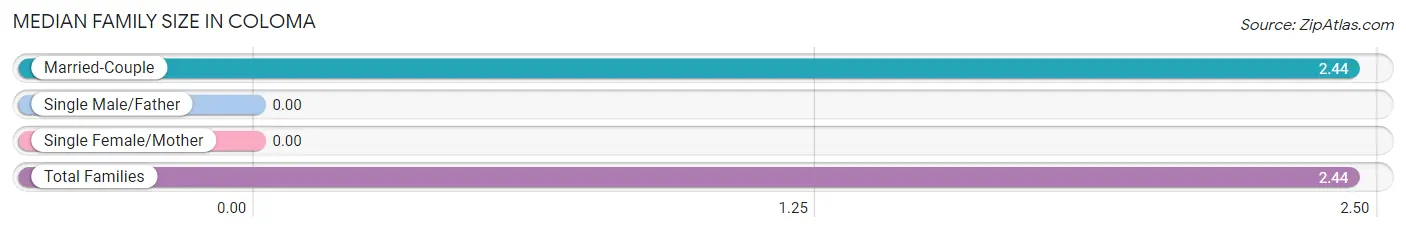
Median Family Size in Coloma
| Family Type | # Families | Family Size |
| Married-Couple | 18 (100.0%) | 2.44 |
| Single Male/Father | 0 (0.0%) | - |
| Single Female/Mother | 0 (0.0%) | - |
| Total Families | 18 (100.0%) | 2.44 |
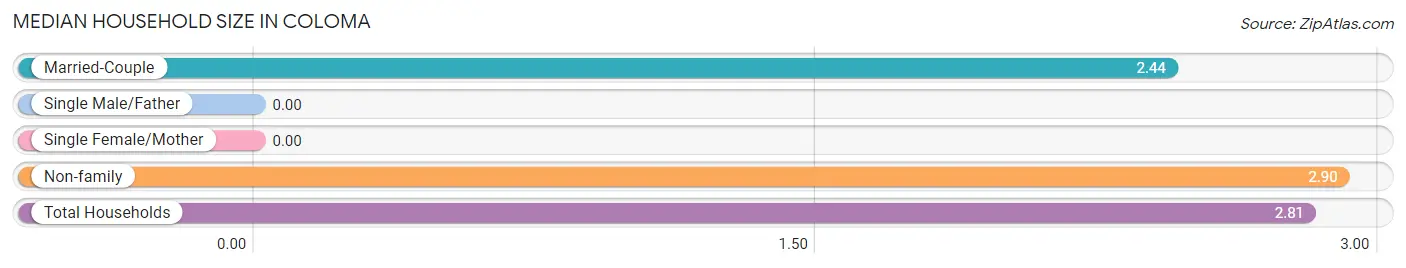
Median Household Size in Coloma
| Household Type | # Households | Household Size |
| Married-Couple | 18 (20.2%) | 2.44 |
| Single Male/Father | 0 (0.0%) | - |
| Single Female/Mother | 0 (0.0%) | - |
| Non-family | 71 (79.8%) | 2.90 |
| Total Households | 89 (100.0%) | 2.81 |
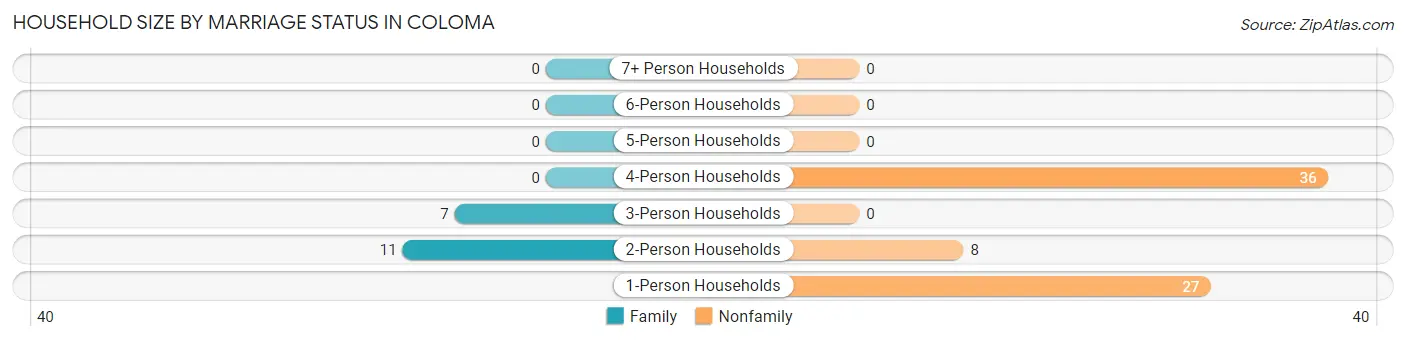
Household Size by Marriage Status in Coloma
Out of a total of 89 households in Coloma, 18 (20.2%) are family households, while 71 (79.8%) are nonfamily households. The most numerous type of family households are 2-person households, comprising 11, and the most common type of nonfamily households are 4-person households, comprising 36.
| Household Size | Family Households | Nonfamily Households |
| 1-Person Households | - | 27 (30.3%) |
| 2-Person Households | 11 (12.4%) | 8 (9.0%) |
| 3-Person Households | 7 (7.9%) | 0 (0.0%) |
| 4-Person Households | 0 (0.0%) | 36 (40.5%) |
| 5-Person Households | 0 (0.0%) | 0 (0.0%) |
| 6-Person Households | 0 (0.0%) | 0 (0.0%) |
| 7+ Person Households | 0 (0.0%) | 0 (0.0%) |
| Total | 18 (20.2%) | 71 (79.8%) |
Female Fertility in Coloma
Fertility by Age in Coloma
| Age Bracket | Women with Births | Births / 1,000 Women |
| 15 to 19 years | 0 (0.0%) | 0.0 |
| 20 to 34 years | 0 (0.0%) | 0.0 |
| 35 to 50 years | 0 (0.0%) | 0.0 |
| Total | 0 (0.0%) | 0.0 |
Fertility by Age by Marriage Status in Coloma
| Age Bracket | Married | Unmarried |
| 15 to 19 years | 0 (0.0%) | 0 (0.0%) |
| 20 to 34 years | 0 (0.0%) | 0 (0.0%) |
| 35 to 50 years | 0 (0.0%) | 0 (0.0%) |
| Total | 0 (0.0%) | 0 (0.0%) |
Fertility by Education in Coloma
| Educational Attainment | Women with Births | Births / 1,000 Women |
| Less than High School | 0 (0.0%) | 0.0 |
| High School Diploma | 0 (0.0%) | 0.0 |
| College or Associate's Degree | 0 (0.0%) | 0.0 |
| Bachelor's Degree | 0 (0.0%) | 0.0 |
| Graduate Degree | 0 (0.0%) | 0.0 |
| Total | 0 (0.0%) | 0.0 |
Fertility by Education by Marriage Status in Coloma
| Educational Attainment | Married | Unmarried |
| Less than High School | 0 (0.0%) | 0 (0.0%) |
| High School Diploma | 0 (0.0%) | 0 (0.0%) |
| College or Associate's Degree | 0 (0.0%) | 0 (0.0%) |
| Bachelor's Degree | 0 (0.0%) | 0 (0.0%) |
| Graduate Degree | 0 (0.0%) | 0 (0.0%) |
| Total | 0 (0.0%) | 0 (0.0%) |
Income in Coloma
Income Overview in Coloma
Per Capita Income in Coloma is $59,489, while median incomes of families and households are $250,001 and $114,201 respectively.
| Characteristic | Number | Measure |
| Per Capita Income | 279 | $59,489 |
| Median Family Income | 18 | $250,001 |
| Mean Family Income | 18 | $259,878 |
| Median Household Income | 89 | $114,201 |
| Mean Household Income | 89 | $179,542 |
| Income Deficit | 18 | $0 |
| Wage / Income Gap (%) | 279 | 34.47% |
| Wage / Income Gap ($) | 279 | 65.53¢ per $1 |
| Gini / Inequality Index | 279 | 0.48 |
Earnings by Sex in Coloma
Average Earnings in Coloma are $40,278, $45,625 for men and $29,896 for women, a difference of 34.5%.
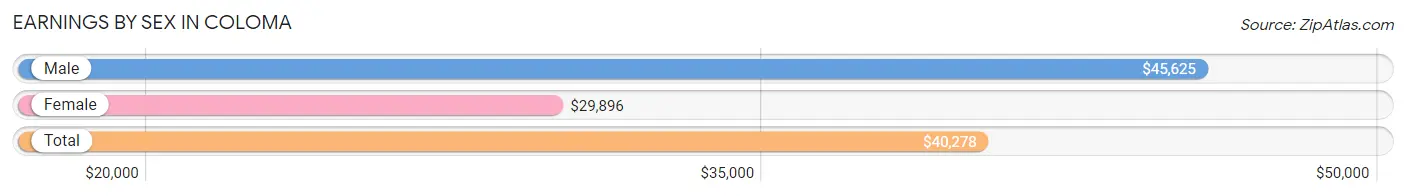
| Sex | Number | Average Earnings |
| Male | 74 (39.8%) | $45,625 |
| Female | 112 (60.2%) | $29,896 |
| Total | 186 (100.0%) | $40,278 |
Earnings by Sex by Income Bracket in Coloma
The most common earnings brackets in Coloma are $45,000 to $49,999 for men (24 | 32.4%) and $25,000 to $29,999 for women (48 | 42.9%).
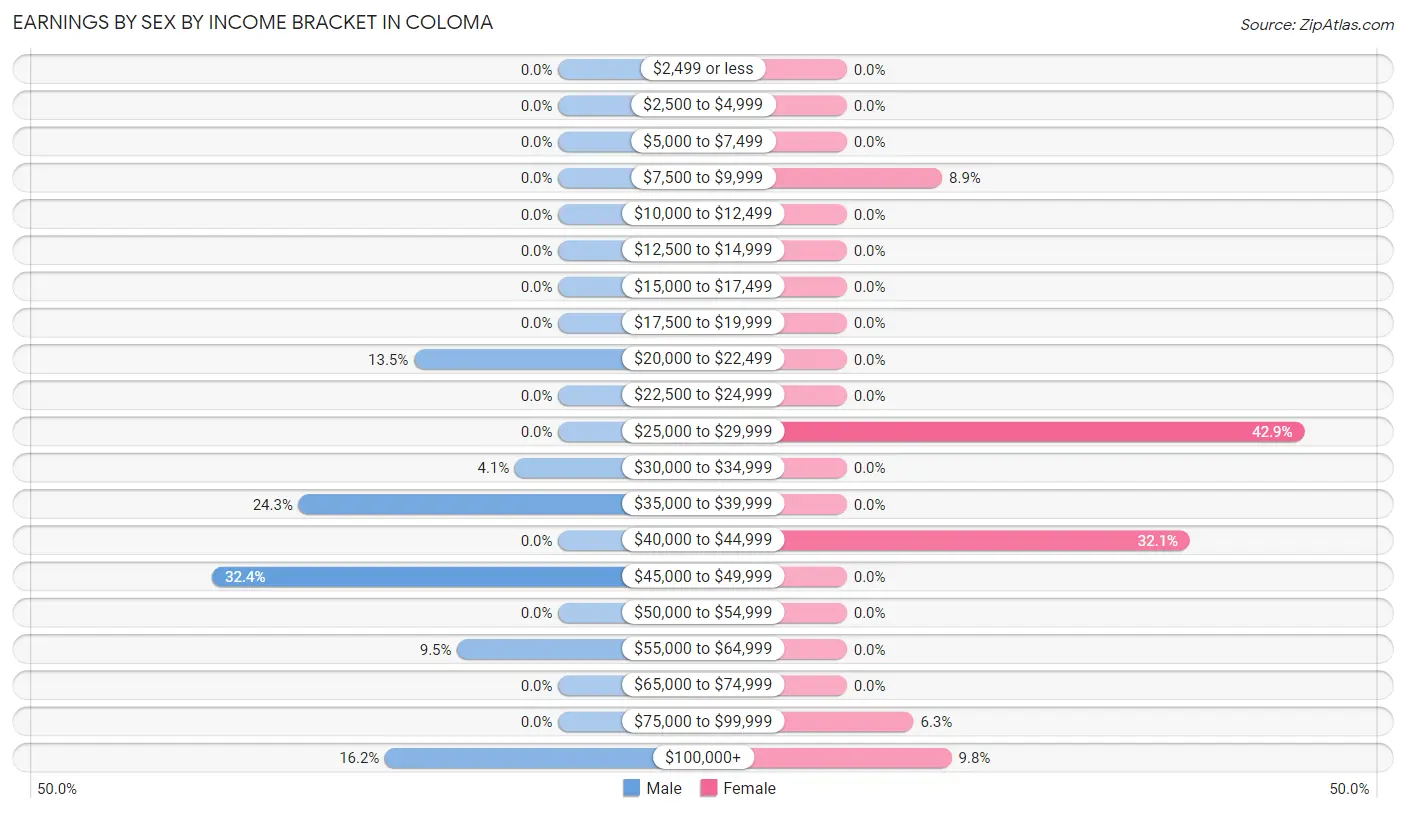
| Income | Male | Female |
| $2,499 or less | 0 (0.0%) | 0 (0.0%) |
| $2,500 to $4,999 | 0 (0.0%) | 0 (0.0%) |
| $5,000 to $7,499 | 0 (0.0%) | 0 (0.0%) |
| $7,500 to $9,999 | 0 (0.0%) | 10 (8.9%) |
| $10,000 to $12,499 | 0 (0.0%) | 0 (0.0%) |
| $12,500 to $14,999 | 0 (0.0%) | 0 (0.0%) |
| $15,000 to $17,499 | 0 (0.0%) | 0 (0.0%) |
| $17,500 to $19,999 | 0 (0.0%) | 0 (0.0%) |
| $20,000 to $22,499 | 10 (13.5%) | 0 (0.0%) |
| $22,500 to $24,999 | 0 (0.0%) | 0 (0.0%) |
| $25,000 to $29,999 | 0 (0.0%) | 48 (42.9%) |
| $30,000 to $34,999 | 3 (4.1%) | 0 (0.0%) |
| $35,000 to $39,999 | 18 (24.3%) | 0 (0.0%) |
| $40,000 to $44,999 | 0 (0.0%) | 36 (32.1%) |
| $45,000 to $49,999 | 24 (32.4%) | 0 (0.0%) |
| $50,000 to $54,999 | 0 (0.0%) | 0 (0.0%) |
| $55,000 to $64,999 | 7 (9.5%) | 0 (0.0%) |
| $65,000 to $74,999 | 0 (0.0%) | 0 (0.0%) |
| $75,000 to $99,999 | 0 (0.0%) | 7 (6.2%) |
| $100,000+ | 12 (16.2%) | 11 (9.8%) |
| Total | 74 (100.0%) | 112 (100.0%) |
Earnings by Sex by Educational Attainment in Coloma
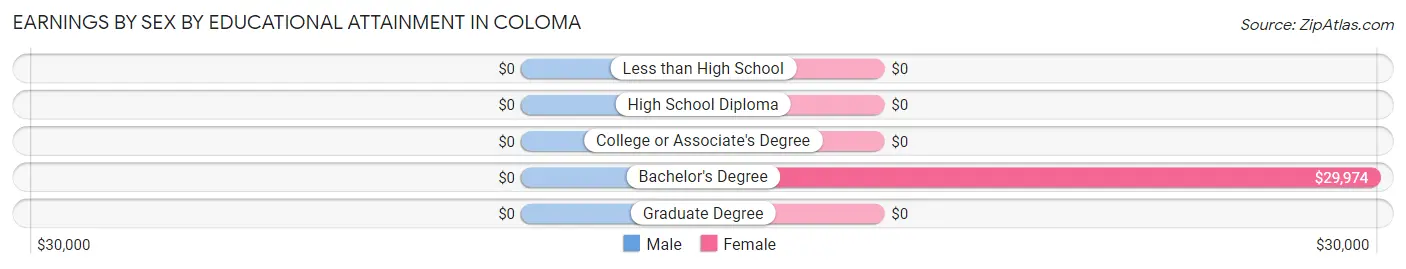
| Educational Attainment | Male Income | Female Income |
| Less than High School | - | - |
| High School Diploma | - | - |
| College or Associate's Degree | - | - |
| Bachelor's Degree | - | - |
| Graduate Degree | - | - |
| Total | - | - |
Family Income in Coloma
Family Income Brackets in Coloma
According to the Coloma family income data, there are 11 families falling into the $200,000+ income range, which is the most common income bracket and makes up 61.1% of all families.
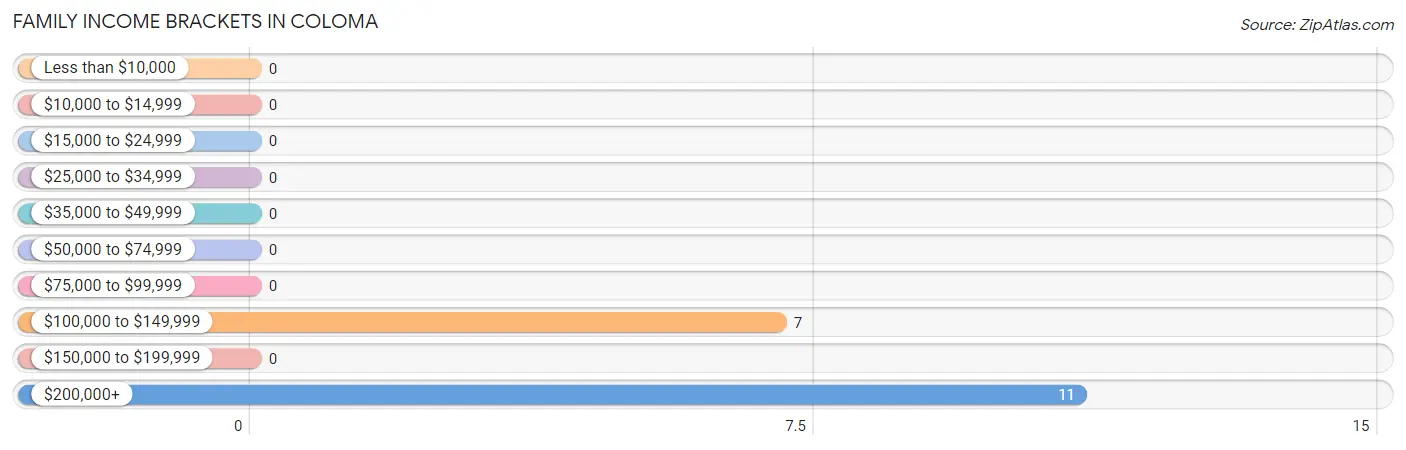
| Income Bracket | # Families | % Families |
| Less than $10,000 | 0 | 0.0% |
| $10,000 to $14,999 | 0 | 0.0% |
| $15,000 to $24,999 | 0 | 0.0% |
| $25,000 to $34,999 | 0 | 0.0% |
| $35,000 to $49,999 | 0 | 0.0% |
| $50,000 to $74,999 | 0 | 0.0% |
| $75,000 to $99,999 | 0 | 0.0% |
| $100,000 to $149,999 | 7 | 38.9% |
| $150,000 to $199,999 | 0 | 0.0% |
| $200,000+ | 11 | 61.1% |
Family Income by Famaliy Size in Coloma
| Income Bracket | # Families | Median Income |
| 2-Person Families | 11 (61.1%) | $0 |
| 3-Person Families | 7 (38.9%) | $0 |
| 4-Person Families | 0 (0.0%) | $0 |
| 5-Person Families | 0 (0.0%) | $0 |
| 6-Person Families | 0 (0.0%) | $0 |
| 7+ Person Families | 0 (0.0%) | $0 |
| Total | 18 (100.0%) | $250,001 |
Family Income by Number of Earners in Coloma
| Number of Earners | # Families | Median Income |
| No Earners | 7 (38.9%) | $0 |
| 1 Earner | 7 (38.9%) | $0 |
| 2 Earners | 4 (22.2%) | $0 |
| 3+ Earners | 0 (0.0%) | $0 |
| Total | 18 (100.0%) | $250,001 |
Household Income in Coloma
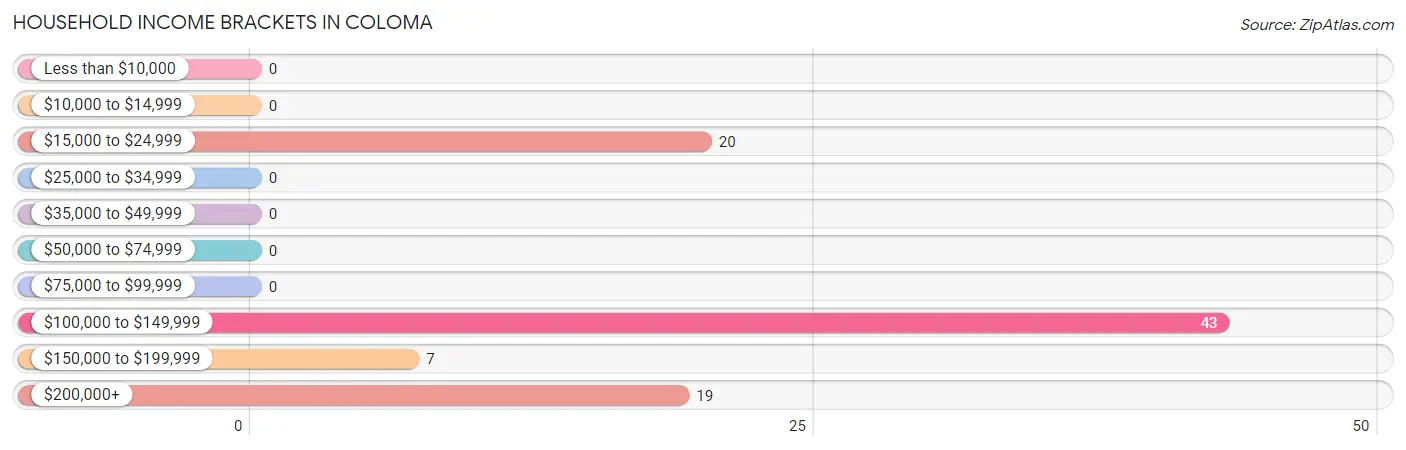
Household Income Brackets in Coloma
With 43 households falling in the category, the $100,000 to $149,999 income range is the most frequent in Coloma, accounting for 48.3% of all households.
| Income Bracket | # Households | % Households |
| Less than $10,000 | 0 | 0.0% |
| $10,000 to $14,999 | 0 | 0.0% |
| $15,000 to $24,999 | 20 | 22.5% |
| $25,000 to $34,999 | 0 | 0.0% |
| $35,000 to $49,999 | 0 | 0.0% |
| $50,000 to $74,999 | 0 | 0.0% |
| $75,000 to $99,999 | 0 | 0.0% |
| $100,000 to $149,999 | 43 | 48.3% |
| $150,000 to $199,999 | 7 | 7.9% |
| $200,000+ | 19 | 21.3% |
Household Income by Householder Age in Coloma
| Income Bracket | # Households | Median Income |
| 15 to 24 Years | 0 (0.0%) | $0 |
| 25 to 44 Years | 40 (44.9%) | $0 |
| 45 to 64 Years | 35 (39.3%) | $0 |
| 65+ Years | 14 (15.7%) | $0 |
| Total | 89 (100.0%) | $114,201 |
Poverty in Coloma
Income Below Poverty by Sex and Age in Coloma
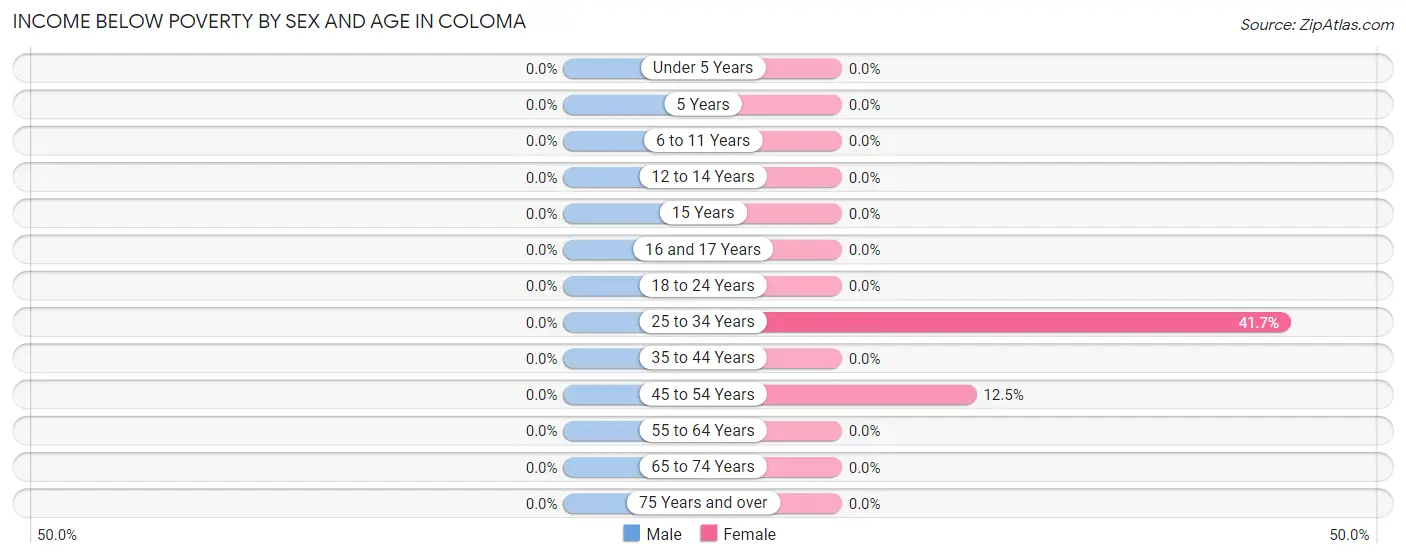
| Age Bracket | Male | Female |
| Under 5 Years | 0 (0.0%) | 0 (0.0%) |
| 5 Years | 0 (0.0%) | 0 (0.0%) |
| 6 to 11 Years | 0 (0.0%) | 0 (0.0%) |
| 12 to 14 Years | 0 (0.0%) | 0 (0.0%) |
| 15 Years | 0 (0.0%) | 0 (0.0%) |
| 16 and 17 Years | 0 (0.0%) | 0 (0.0%) |
| 18 to 24 Years | 0 (0.0%) | 0 (0.0%) |
| 25 to 34 Years | 0 (0.0%) | 60 (41.7%) |
| 35 to 44 Years | 0 (0.0%) | 0 (0.0%) |
| 45 to 54 Years | 0 (0.0%) | 2 (12.5%) |
| 55 to 64 Years | 0 (0.0%) | 0 (0.0%) |
| 65 to 74 Years | 0 (0.0%) | 0 (0.0%) |
| 75 Years and over | 0 (0.0%) | 0 (0.0%) |
| Total | 0 (0.0%) | 62 (31.8%) |
Income Above Poverty by Sex and Age in Coloma
According to the poverty statistics in Coloma, males aged 18 to 24 years and females aged 35 to 44 years are the age groups that are most secure financially, with 100.0% of males and 100.0% of females in these age groups living above the poverty line.
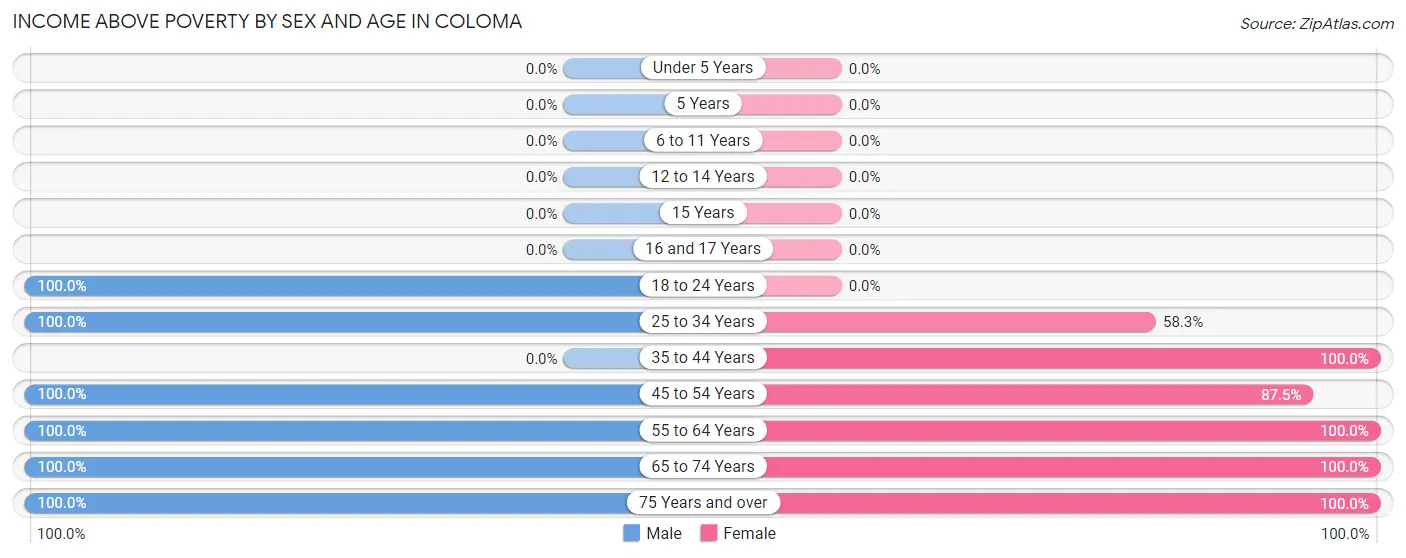
| Age Bracket | Male | Female |
| Under 5 Years | 0 (0.0%) | 0 (0.0%) |
| 5 Years | 0 (0.0%) | 0 (0.0%) |
| 6 to 11 Years | 0 (0.0%) | 0 (0.0%) |
| 12 to 14 Years | 0 (0.0%) | 0 (0.0%) |
| 15 Years | 0 (0.0%) | 0 (0.0%) |
| 16 and 17 Years | 0 (0.0%) | 0 (0.0%) |
| 18 to 24 Years | 21 (100.0%) | 0 (0.0%) |
| 25 to 34 Years | 24 (100.0%) | 84 (58.3%) |
| 35 to 44 Years | 0 (0.0%) | 4 (100.0%) |
| 45 to 54 Years | 8 (100.0%) | 14 (87.5%) |
| 55 to 64 Years | 14 (100.0%) | 10 (100.0%) |
| 65 to 74 Years | 7 (100.0%) | 7 (100.0%) |
| 75 Years and over | 8 (100.0%) | 14 (100.0%) |
| Total | 82 (100.0%) | 133 (68.2%) |
Income Below Poverty Among Married-Couple Families in Coloma
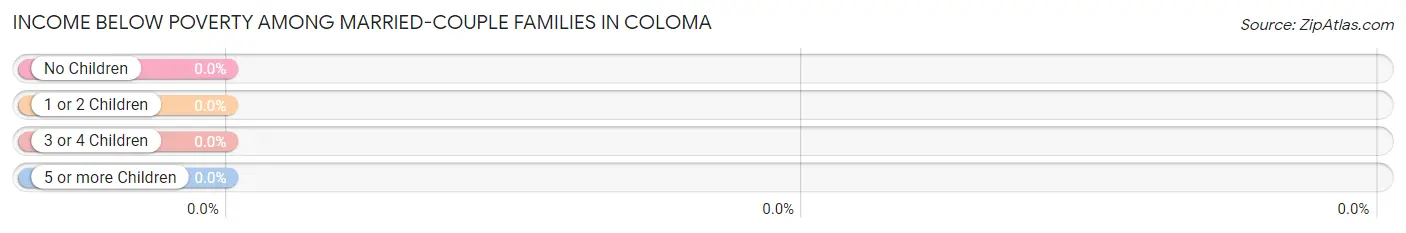
| Children | Above Poverty | Below Poverty |
| No Children | 18 (100.0%) | 0 (0.0%) |
| 1 or 2 Children | 0 (0.0%) | 0 (0.0%) |
| 3 or 4 Children | 0 (0.0%) | 0 (0.0%) |
| 5 or more Children | 0 (0.0%) | 0 (0.0%) |
| Total | 18 (100.0%) | 0 (0.0%) |
Income Below Poverty Among Single-Parent Households in Coloma
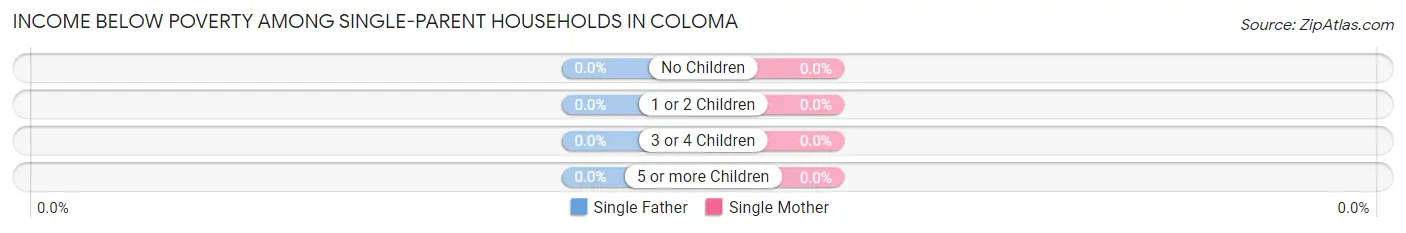
| Children | Single Father | Single Mother |
| No Children | 0 (0.0%) | 0 (0.0%) |
| 1 or 2 Children | 0 (0.0%) | 0 (0.0%) |
| 3 or 4 Children | 0 (0.0%) | 0 (0.0%) |
| 5 or more Children | 0 (0.0%) | 0 (0.0%) |
| Total | 0 (0.0%) | 0 (0.0%) |
Income Below Poverty Among Married-Couple vs Single-Parent Households in Coloma
| Children | Married-Couple Families | Single-Parent Households |
| No Children | 0 (0.0%) | 0 (0.0%) |
| 1 or 2 Children | 0 (0.0%) | 0 (0.0%) |
| 3 or 4 Children | 0 (0.0%) | 0 (0.0%) |
| 5 or more Children | 0 (0.0%) | 0 (0.0%) |
| Total | 0 (0.0%) | 0 (0.0%) |
Employment Characteristics in Coloma
Employment by Class of Employer in Coloma
Among the 176 employed individuals in Coloma, private company employees (104 | 59.1%), not-for-profit organizations (36 | 20.4%), and self-employed (not incorporated) (11 | 6.2%) make up the most common classes of employment.
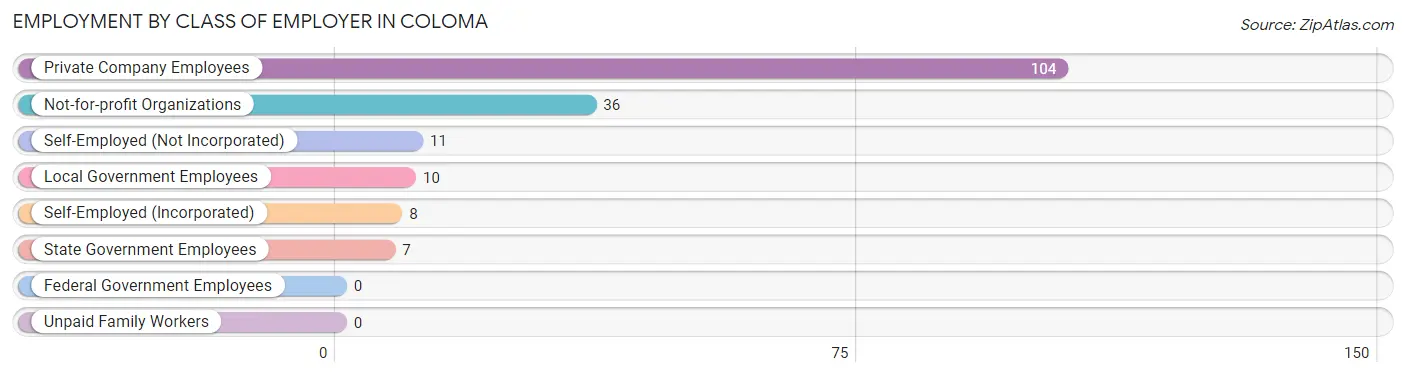
| Employer Class | # Employees | % Employees |
| Private Company Employees | 104 | 59.1% |
| Self-Employed (Incorporated) | 8 | 4.5% |
| Self-Employed (Not Incorporated) | 11 | 6.2% |
| Not-for-profit Organizations | 36 | 20.4% |
| Local Government Employees | 10 | 5.7% |
| State Government Employees | 7 | 4.0% |
| Federal Government Employees | 0 | 0.0% |
| Unpaid Family Workers | 0 | 0.0% |
| Total | 176 | 100.0% |
Employment Status by Age in Coloma
According to the labor force statistics for Coloma, out of the total population over 16 years of age (277), 88.8% or 246 individuals are in the labor force, with 28.5% or 70 of them unemployed. The age group with the highest labor force participation rate is 20 to 24 years, with 100.0% or 21 individuals in the labor force. Within the labor force, the 55 to 59 years age range has the highest percentage of unemployed individuals, with 41.7% or 10 of them being unemployed.
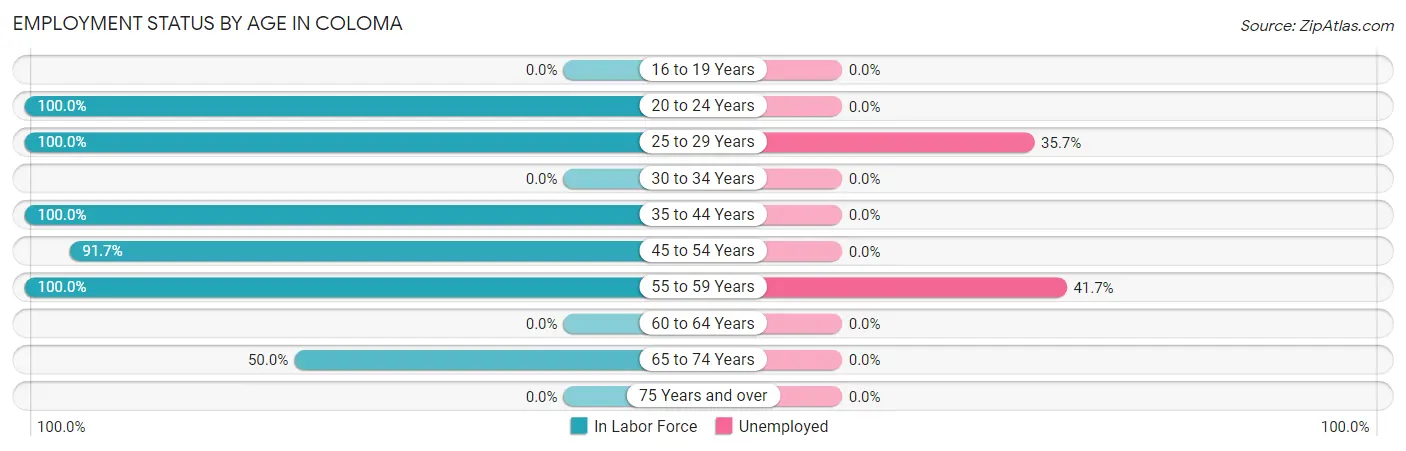
| Age Bracket | In Labor Force | Unemployed |
| 16 to 19 Years | 0 (0.0%) | 0 (0.0%) |
| 20 to 24 Years | 21 (100.0%) | 0 (0.0%) |
| 25 to 29 Years | 168 (100.0%) | 60 (35.7%) |
| 30 to 34 Years | 0 (0.0%) | 0 (0.0%) |
| 35 to 44 Years | 4 (100.0%) | 0 (0.0%) |
| 45 to 54 Years | 22 (91.7%) | 0 (0.0%) |
| 55 to 59 Years | 24 (100.0%) | 10 (41.7%) |
| 60 to 64 Years | 0 (0.0%) | 0 (0.0%) |
| 65 to 74 Years | 7 (50.0%) | 0 (0.0%) |
| 75 Years and over | 0 (0.0%) | 0 (0.0%) |
| Total | 246 (88.8%) | 70 (28.5%) |
Employment Status by Educational Attainment in Coloma
According to labor force statistics for Coloma, 99.1% of individuals (218) out of the total population between 25 and 64 years of age (220) are in the labor force, with 32.1% or 70 of them being unemployed. The group with the highest labor force participation rate are those with the educational attainment of high school diploma, with 100.0% or 70 individuals in the labor force. Within the labor force, individuals with high school diploma education have the highest percentage of unemployment, with 85.7% or 60 of them being unemployed.
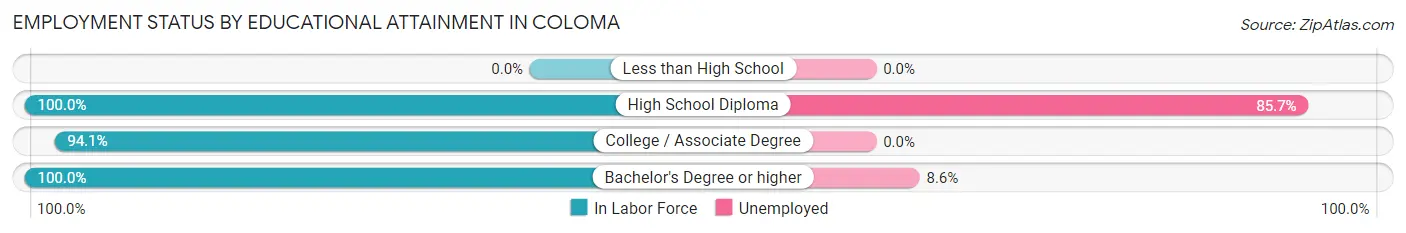
| Educational Attainment | In Labor Force | Unemployed |
| Less than High School | 0 (0.0%) | 0 (0.0%) |
| High School Diploma | 70 (100.0%) | 60 (85.7%) |
| College / Associate Degree | 32 (94.1%) | 0 (0.0%) |
| Bachelor's Degree or higher | 116 (100.0%) | 10 (8.6%) |
| Total | 218 (99.1%) | 71 (32.1%) |
Employment Occupations by Sex in Coloma
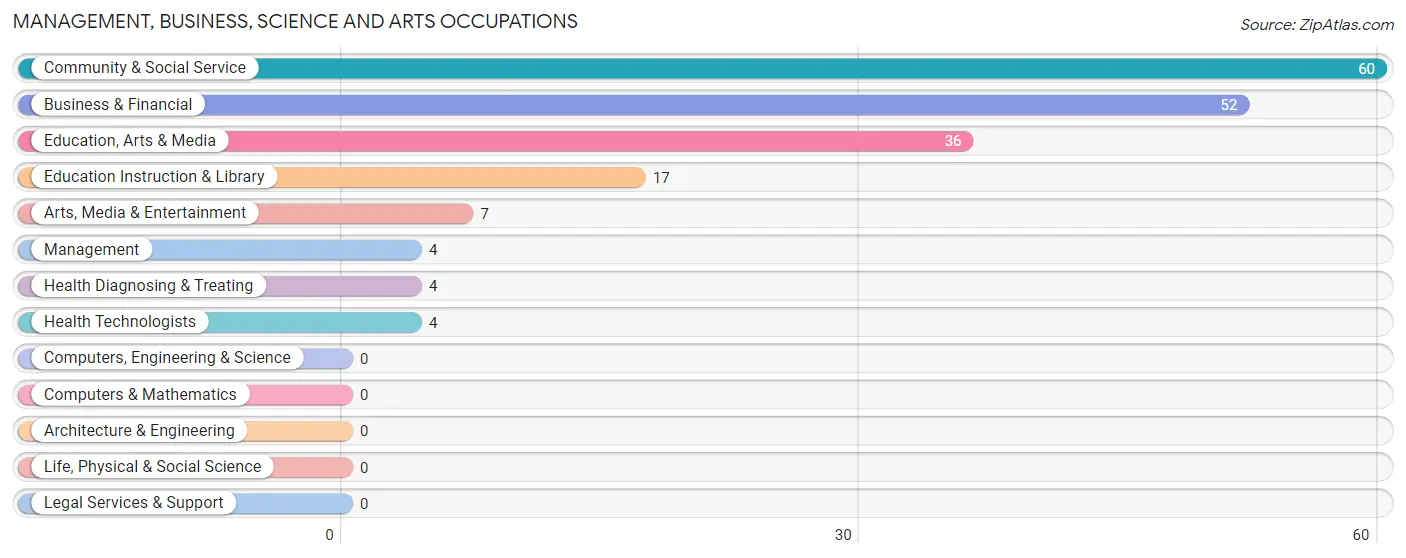
Management, Business, Science and Arts Occupations
The most common Management, Business, Science and Arts occupations in Coloma are Community & Social Service (60 | 34.1%), Business & Financial (52 | 29.5%), Education, Arts & Media (36 | 20.4%), Education Instruction & Library (17 | 9.7%), and Arts, Media & Entertainment (7 | 4.0%).
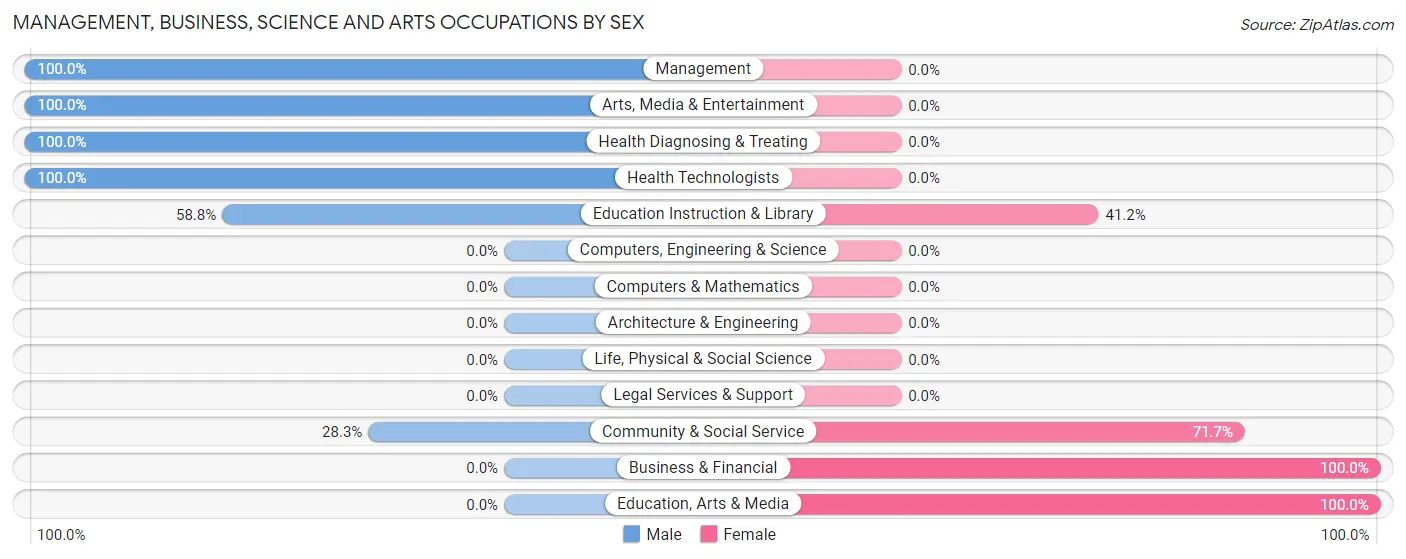
Management, Business, Science and Arts Occupations by Sex
Within the Management, Business, Science and Arts occupations in Coloma, the most male-oriented occupations are Management (100.0%), Arts, Media & Entertainment (100.0%), and Health Diagnosing & Treating (100.0%), while the most female-oriented occupations are Business & Financial (100.0%), Education, Arts & Media (100.0%), and Community & Social Service (71.7%).
| Occupation | Male | Female |
| Management | 4 (100.0%) | 0 (0.0%) |
| Business & Financial | 0 (0.0%) | 52 (100.0%) |
| Computers, Engineering & Science | 0 (0.0%) | 0 (0.0%) |
| Computers & Mathematics | 0 (0.0%) | 0 (0.0%) |
| Architecture & Engineering | 0 (0.0%) | 0 (0.0%) |
| Life, Physical & Social Science | 0 (0.0%) | 0 (0.0%) |
| Community & Social Service | 17 (28.3%) | 43 (71.7%) |
| Education, Arts & Media | 0 (0.0%) | 36 (100.0%) |
| Legal Services & Support | 0 (0.0%) | 0 (0.0%) |
| Education Instruction & Library | 10 (58.8%) | 7 (41.2%) |
| Arts, Media & Entertainment | 7 (100.0%) | 0 (0.0%) |
| Health Diagnosing & Treating | 4 (100.0%) | 0 (0.0%) |
| Health Technologists | 4 (100.0%) | 0 (0.0%) |
| Total (Category) | 25 (20.8%) | 95 (79.2%) |
| Total (Overall) | 74 (42.0%) | 102 (58.0%) |
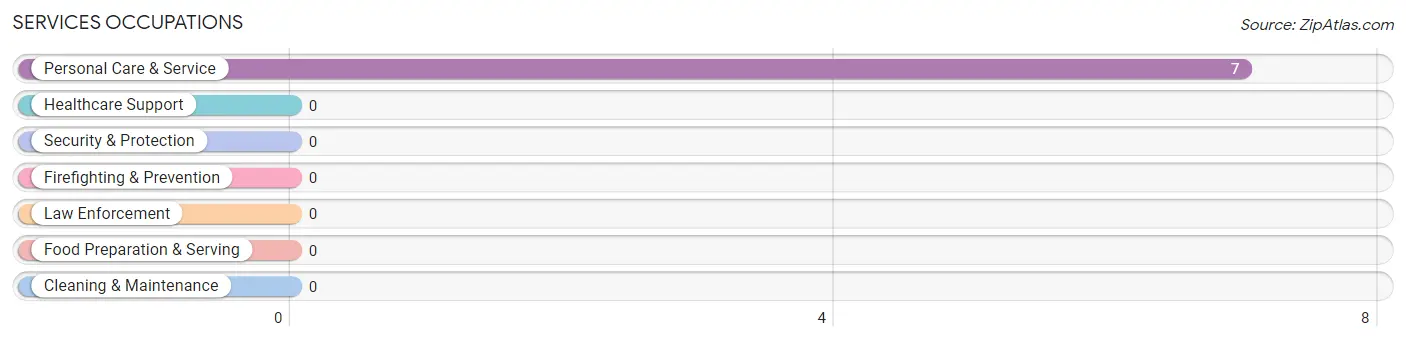
Services Occupations
The most common Services occupations in Coloma are , and Personal Care & Service (7 | 4.0%).
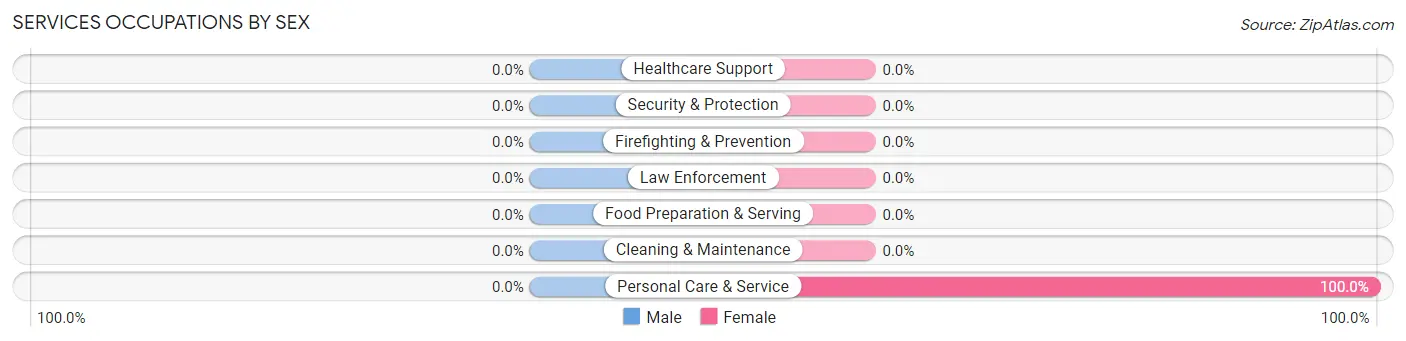
Services Occupations by Sex
| Occupation | Male | Female |
| Healthcare Support | 0 (0.0%) | 0 (0.0%) |
| Security & Protection | 0 (0.0%) | 0 (0.0%) |
| Firefighting & Prevention | 0 (0.0%) | 0 (0.0%) |
| Law Enforcement | 0 (0.0%) | 0 (0.0%) |
| Food Preparation & Serving | 0 (0.0%) | 0 (0.0%) |
| Cleaning & Maintenance | 0 (0.0%) | 0 (0.0%) |
| Personal Care & Service | 0 (0.0%) | 7 (100.0%) |
| Total (Category) | 0 (0.0%) | 7 (100.0%) |
| Total (Overall) | 74 (42.0%) | 102 (58.0%) |
Sales and Office Occupations
Sales and Office Occupations by Sex
| Occupation | Male | Female |
| Sales & Related | 0 (0.0%) | 0 (0.0%) |
| Office & Administration | 0 (0.0%) | 0 (0.0%) |
| Total (Category) | 0 (0.0%) | 0 (0.0%) |
| Total (Overall) | 74 (42.0%) | 102 (58.0%) |
Natural Resources, Construction and Maintenance Occupations
The most common Natural Resources, Construction and Maintenance occupations in Coloma are Construction & Extraction (28 | 15.9%), and Farming, Fishing & Forestry (21 | 11.9%).
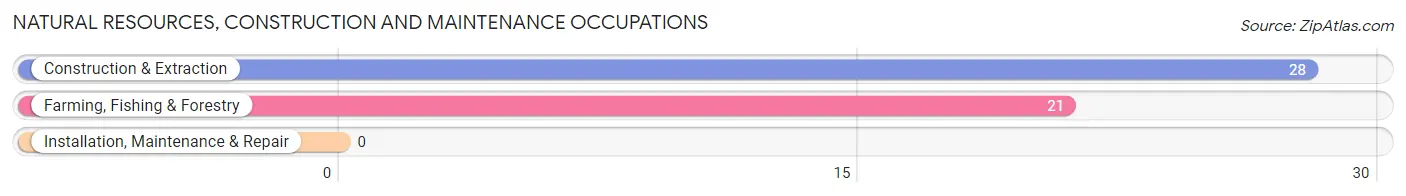
Natural Resources, Construction and Maintenance Occupations by Sex
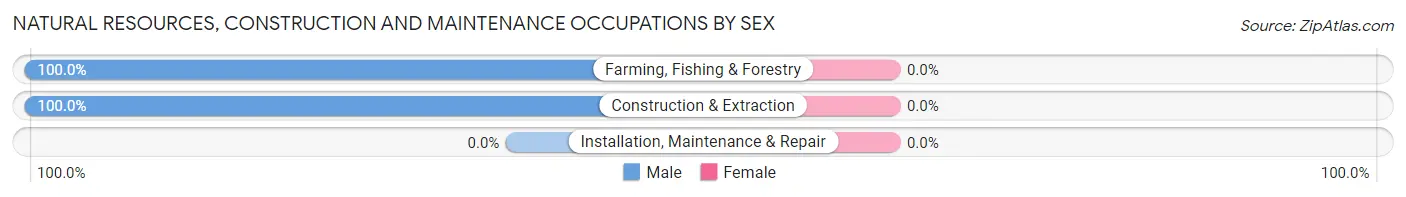
| Occupation | Male | Female |
| Farming, Fishing & Forestry | 21 (100.0%) | 0 (0.0%) |
| Construction & Extraction | 28 (100.0%) | 0 (0.0%) |
| Installation, Maintenance & Repair | 0 (0.0%) | 0 (0.0%) |
| Total (Category) | 49 (100.0%) | 0 (0.0%) |
| Total (Overall) | 74 (42.0%) | 102 (58.0%) |
Production, Transportation and Moving Occupations
Production, Transportation and Moving Occupations by Sex
| Occupation | Male | Female |
| Production | 0 (0.0%) | 0 (0.0%) |
| Transportation | 0 (0.0%) | 0 (0.0%) |
| Material Moving | 0 (0.0%) | 0 (0.0%) |
| Total (Category) | 0 (0.0%) | 0 (0.0%) |
| Total (Overall) | 74 (42.0%) | 102 (58.0%) |
Employment Industries by Sex in Coloma
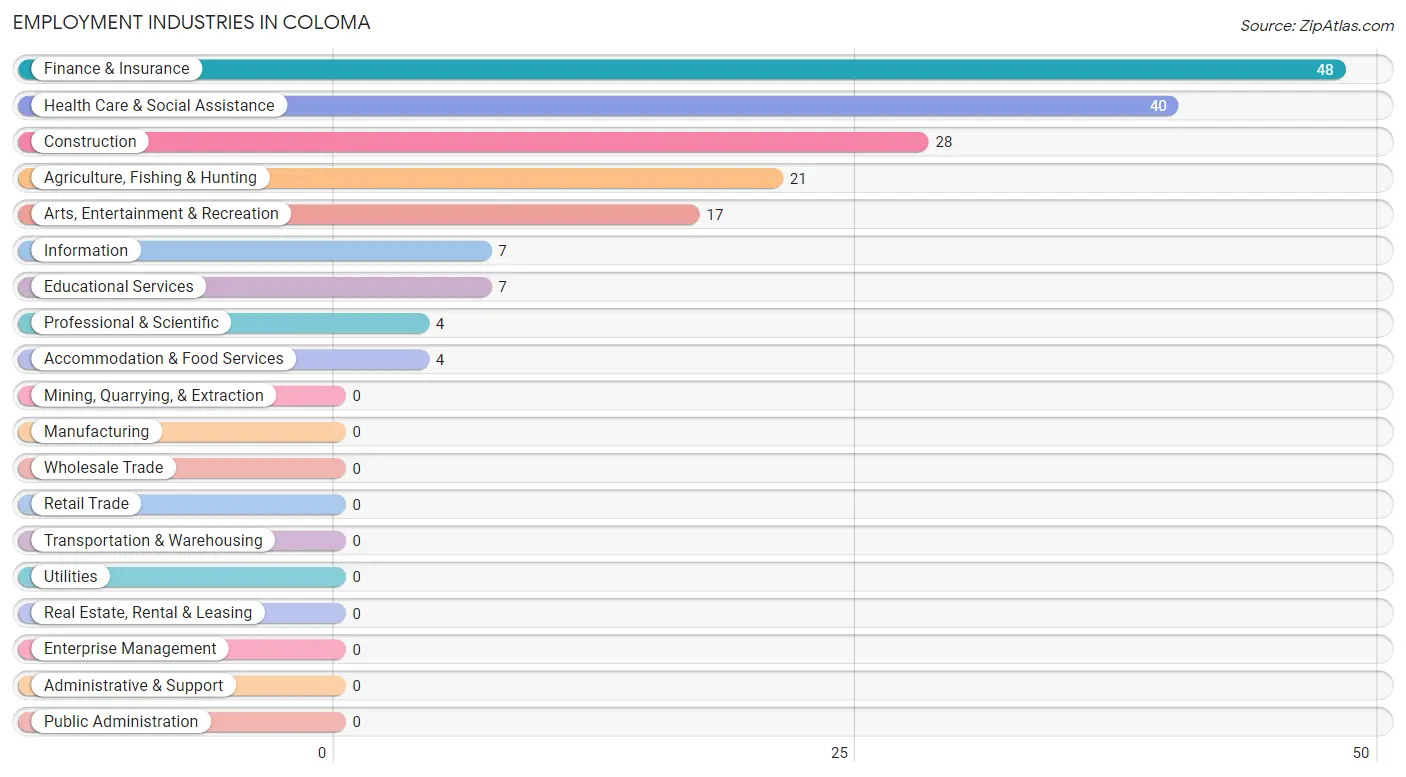
Employment Industries in Coloma
The major employment industries in Coloma include Finance & Insurance (48 | 27.3%), Health Care & Social Assistance (40 | 22.7%), Construction (28 | 15.9%), Agriculture, Fishing & Hunting (21 | 11.9%), and Arts, Entertainment & Recreation (17 | 9.7%).
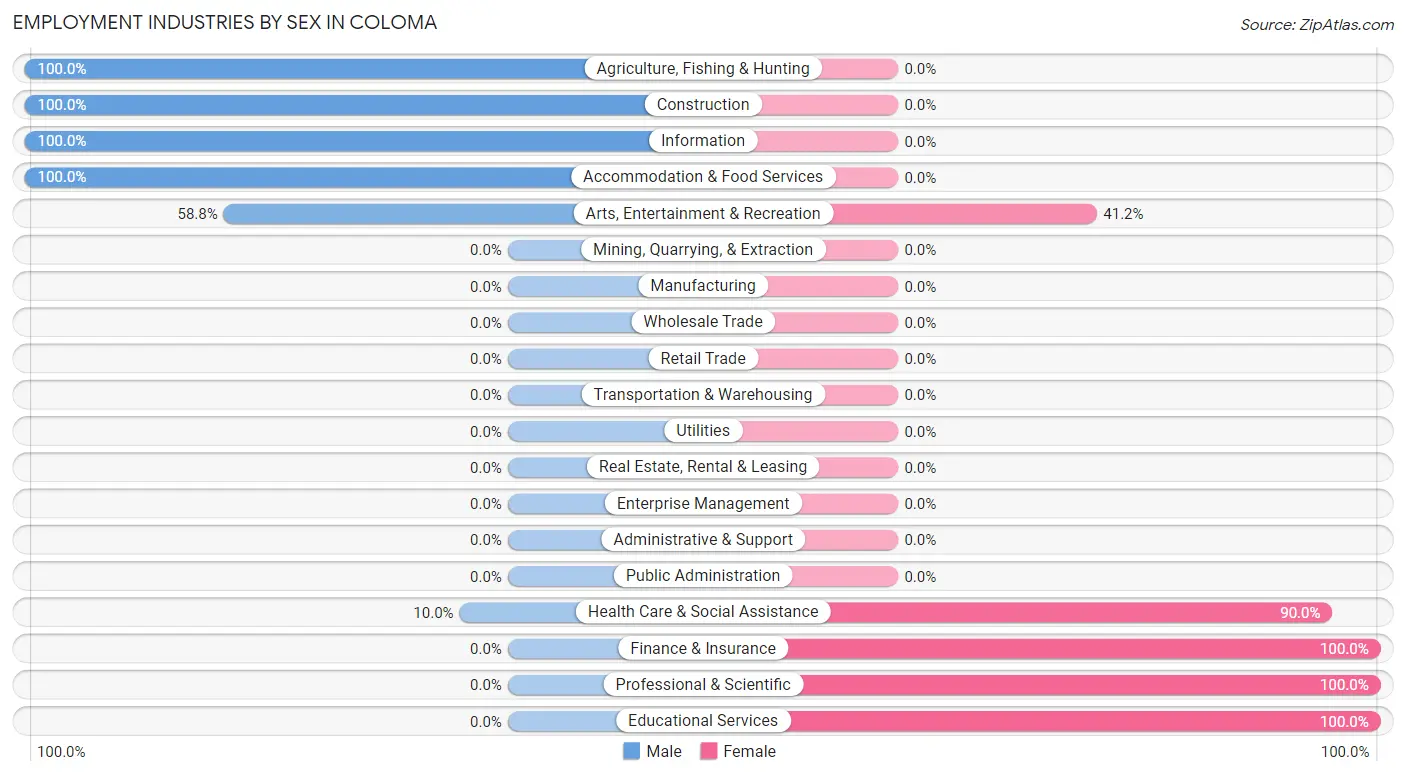
Employment Industries by Sex in Coloma
The Coloma industries that see more men than women are Agriculture, Fishing & Hunting (100.0%), Construction (100.0%), and Information (100.0%), whereas the industries that tend to have a higher number of women are Finance & Insurance (100.0%), Professional & Scientific (100.0%), and Educational Services (100.0%).
| Industry | Male | Female |
| Agriculture, Fishing & Hunting | 21 (100.0%) | 0 (0.0%) |
| Mining, Quarrying, & Extraction | 0 (0.0%) | 0 (0.0%) |
| Construction | 28 (100.0%) | 0 (0.0%) |
| Manufacturing | 0 (0.0%) | 0 (0.0%) |
| Wholesale Trade | 0 (0.0%) | 0 (0.0%) |
| Retail Trade | 0 (0.0%) | 0 (0.0%) |
| Transportation & Warehousing | 0 (0.0%) | 0 (0.0%) |
| Utilities | 0 (0.0%) | 0 (0.0%) |
| Information | 7 (100.0%) | 0 (0.0%) |
| Finance & Insurance | 0 (0.0%) | 48 (100.0%) |
| Real Estate, Rental & Leasing | 0 (0.0%) | 0 (0.0%) |
| Professional & Scientific | 0 (0.0%) | 4 (100.0%) |
| Enterprise Management | 0 (0.0%) | 0 (0.0%) |
| Administrative & Support | 0 (0.0%) | 0 (0.0%) |
| Educational Services | 0 (0.0%) | 7 (100.0%) |
| Health Care & Social Assistance | 4 (10.0%) | 36 (90.0%) |
| Arts, Entertainment & Recreation | 10 (58.8%) | 7 (41.2%) |
| Accommodation & Food Services | 4 (100.0%) | 0 (0.0%) |
| Public Administration | 0 (0.0%) | 0 (0.0%) |
| Total | 74 (42.0%) | 102 (58.0%) |
Education in Coloma
School Enrollment in Coloma
The most common levels of schooling among the 50 students in Coloma are graduate / professional (48 | 96.0%), and elementary school (2 | 4.0%).
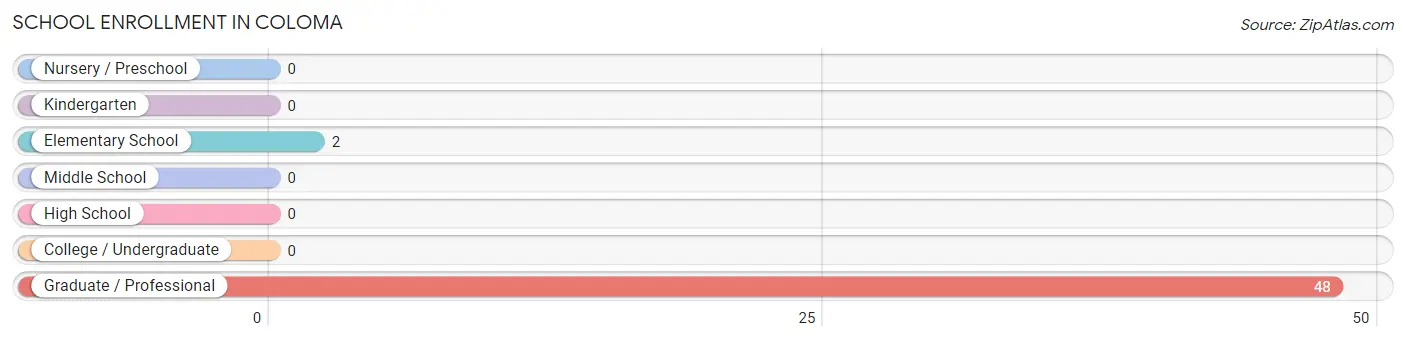
| School Level | # Students | % Students |
| Nursery / Preschool | 0 | 0.0% |
| Kindergarten | 0 | 0.0% |
| Elementary School | 2 | 4.0% |
| Middle School | 0 | 0.0% |
| High School | 0 | 0.0% |
| College / Undergraduate | 0 | 0.0% |
| Graduate / Professional | 48 | 96.0% |
| Total | 50 | 100.0% |
School Enrollment by Age by Funding Source in Coloma
Out of a total of 50 students who are enrolled in schools in Coloma, 2 (4.0%) attend a private institution, while the remaining 48 (96.0%) are enrolled in public schools. The age group of 5 to 9 year old has the highest likelihood of being enrolled in private schools, with 2 (100.0% in the age bracket) enrolled. Conversely, the age group of 25 to 34 year olds has the lowest likelihood of being enrolled in a private school, with 48 (100.0% in the age bracket) attending a public institution.
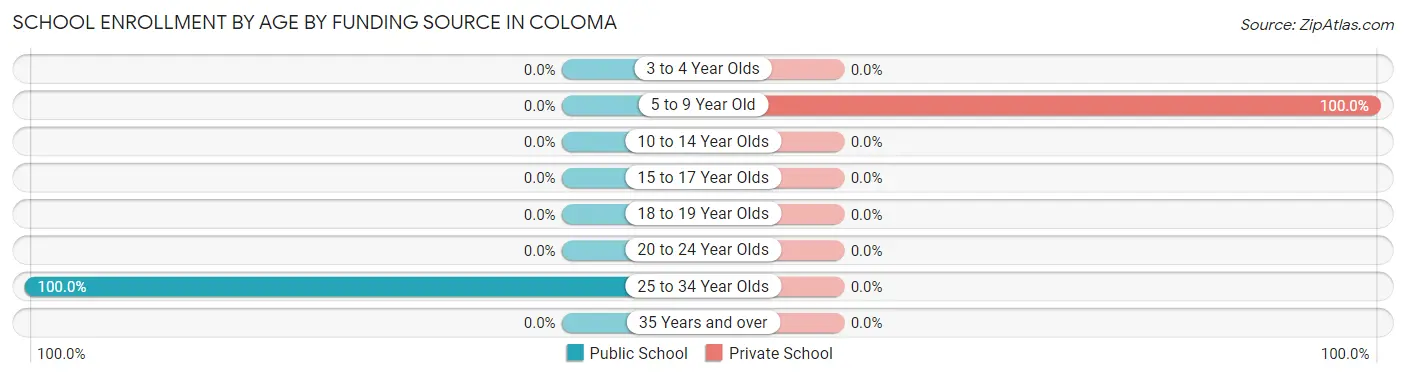
| Age Bracket | Public School | Private School |
| 3 to 4 Year Olds | 0 (0.0%) | 0 (0.0%) |
| 5 to 9 Year Old | 0 (0.0%) | 2 (100.0%) |
| 10 to 14 Year Olds | 0 (0.0%) | 0 (0.0%) |
| 15 to 17 Year Olds | 0 (0.0%) | 0 (0.0%) |
| 18 to 19 Year Olds | 0 (0.0%) | 0 (0.0%) |
| 20 to 24 Year Olds | 0 (0.0%) | 0 (0.0%) |
| 25 to 34 Year Olds | 48 (100.0%) | 0 (0.0%) |
| 35 Years and over | 0 (0.0%) | 0 (0.0%) |
| Total | 48 (96.0%) | 2 (4.0%) |
Educational Attainment by Field of Study in Coloma
Physical & health sciences (52 | 34.2%), communications (36 | 23.7%), business (17 | 11.2%), science & technology (11 | 7.2%), and liberal arts & history (8 | 5.3%) are the most common fields of study among 152 individuals in Coloma who have obtained a bachelor's degree or higher.
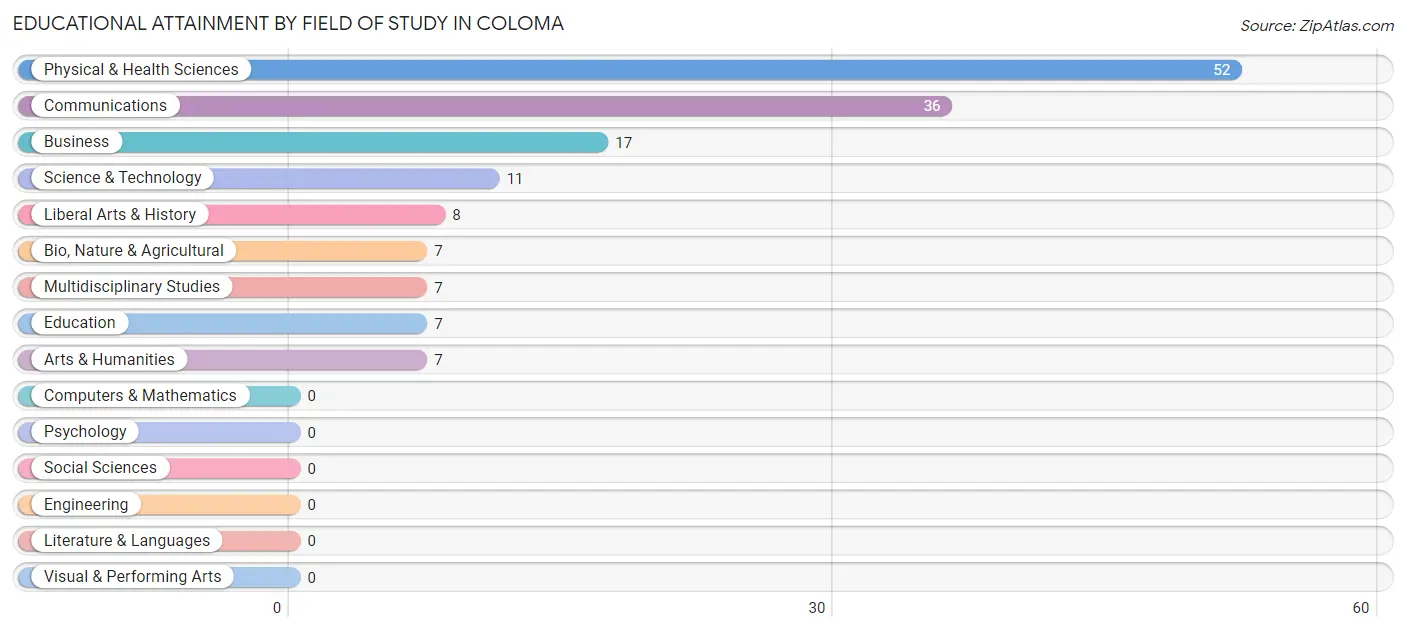
| Field of Study | # Graduates | % Graduates |
| Computers & Mathematics | 0 | 0.0% |
| Bio, Nature & Agricultural | 7 | 4.6% |
| Physical & Health Sciences | 52 | 34.2% |
| Psychology | 0 | 0.0% |
| Social Sciences | 0 | 0.0% |
| Engineering | 0 | 0.0% |
| Multidisciplinary Studies | 7 | 4.6% |
| Science & Technology | 11 | 7.2% |
| Business | 17 | 11.2% |
| Education | 7 | 4.6% |
| Literature & Languages | 0 | 0.0% |
| Liberal Arts & History | 8 | 5.3% |
| Visual & Performing Arts | 0 | 0.0% |
| Communications | 36 | 23.7% |
| Arts & Humanities | 7 | 4.6% |
| Total | 152 | 100.0% |
Transportation & Commute in Coloma
Vehicle Availability by Sex in Coloma
The most prevalent vehicle ownership categories in Coloma are males with 4 vehicles (20, accounting for 40.8%) and females with 4 vehicles (84, making up 19.6%).
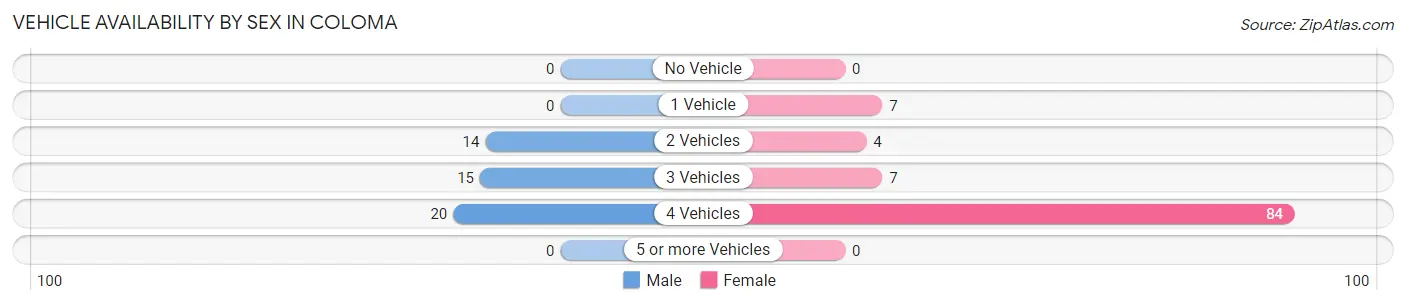
| Vehicles Available | Male | Female |
| No Vehicle | 0 (0.0%) | 0 (0.0%) |
| 1 Vehicle | 0 (0.0%) | 7 (6.9%) |
| 2 Vehicles | 14 (28.6%) | 4 (3.9%) |
| 3 Vehicles | 15 (30.6%) | 7 (6.9%) |
| 4 Vehicles | 20 (40.8%) | 84 (82.4%) |
| 5 or more Vehicles | 0 (0.0%) | 0 (0.0%) |
| Total | 49 (100.0%) | 102 (100.0%) |
Commute Time in Coloma
The most frequently occuring commute durations in Coloma are 15 to 19 minutes (84 commuters, 57.9%), 30 to 34 minutes (37 commuters, 25.5%), and 5 to 9 minutes (17 commuters, 11.7%).
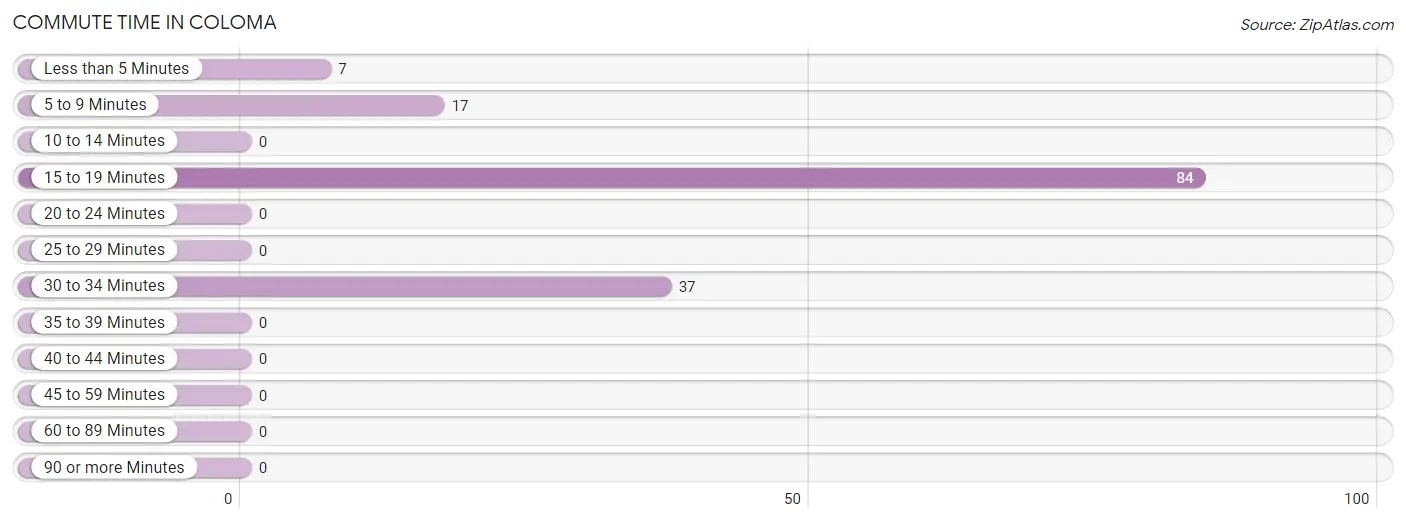
| Commute Time | # Commuters | % Commuters |
| Less than 5 Minutes | 7 | 4.8% |
| 5 to 9 Minutes | 17 | 11.7% |
| 10 to 14 Minutes | 0 | 0.0% |
| 15 to 19 Minutes | 84 | 57.9% |
| 20 to 24 Minutes | 0 | 0.0% |
| 25 to 29 Minutes | 0 | 0.0% |
| 30 to 34 Minutes | 37 | 25.5% |
| 35 to 39 Minutes | 0 | 0.0% |
| 40 to 44 Minutes | 0 | 0.0% |
| 45 to 59 Minutes | 0 | 0.0% |
| 60 to 89 Minutes | 0 | 0.0% |
| 90 or more Minutes | 0 | 0.0% |
Commute Time by Sex in Coloma
The most common commute times in Coloma are 30 to 34 minutes (33 commuters, 66.0%) for males and 15 to 19 minutes (84 commuters, 88.4%) for females.
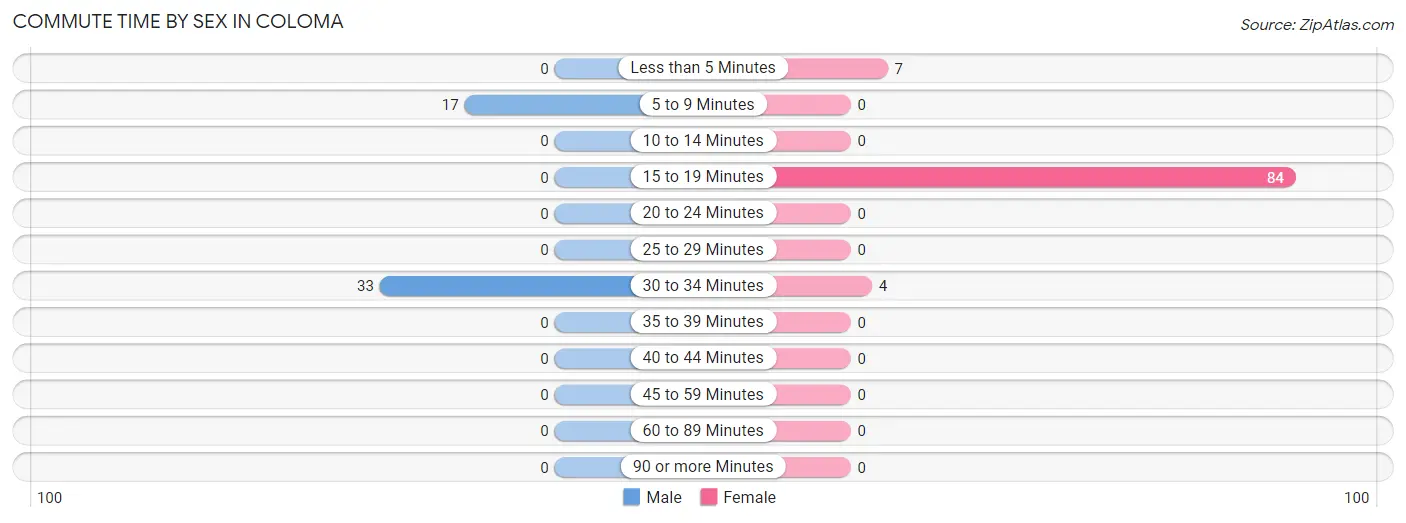
| Commute Time | Male | Female |
| Less than 5 Minutes | 0 (0.0%) | 7 (7.4%) |
| 5 to 9 Minutes | 17 (34.0%) | 0 (0.0%) |
| 10 to 14 Minutes | 0 (0.0%) | 0 (0.0%) |
| 15 to 19 Minutes | 0 (0.0%) | 84 (88.4%) |
| 20 to 24 Minutes | 0 (0.0%) | 0 (0.0%) |
| 25 to 29 Minutes | 0 (0.0%) | 0 (0.0%) |
| 30 to 34 Minutes | 33 (66.0%) | 4 (4.2%) |
| 35 to 39 Minutes | 0 (0.0%) | 0 (0.0%) |
| 40 to 44 Minutes | 0 (0.0%) | 0 (0.0%) |
| 45 to 59 Minutes | 0 (0.0%) | 0 (0.0%) |
| 60 to 89 Minutes | 0 (0.0%) | 0 (0.0%) |
| 90 or more Minutes | 0 (0.0%) | 0 (0.0%) |
Time of Departure to Work by Sex in Coloma
The most frequent times of departure to work in Coloma are 9:00 AM to 9:59 AM (20, 40.0%) for males and 8:30 AM to 8:59 AM (91, 95.8%) for females.
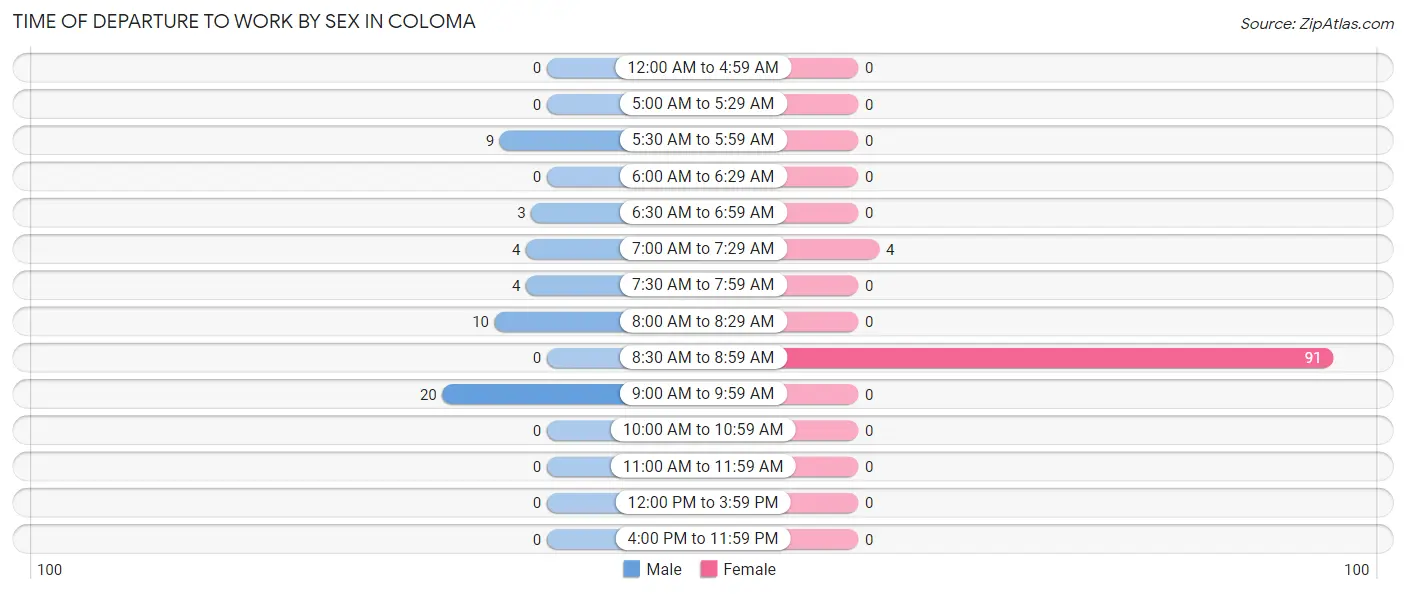
| Time of Departure | Male | Female |
| 12:00 AM to 4:59 AM | 0 (0.0%) | 0 (0.0%) |
| 5:00 AM to 5:29 AM | 0 (0.0%) | 0 (0.0%) |
| 5:30 AM to 5:59 AM | 9 (18.0%) | 0 (0.0%) |
| 6:00 AM to 6:29 AM | 0 (0.0%) | 0 (0.0%) |
| 6:30 AM to 6:59 AM | 3 (6.0%) | 0 (0.0%) |
| 7:00 AM to 7:29 AM | 4 (8.0%) | 4 (4.2%) |
| 7:30 AM to 7:59 AM | 4 (8.0%) | 0 (0.0%) |
| 8:00 AM to 8:29 AM | 10 (20.0%) | 0 (0.0%) |
| 8:30 AM to 8:59 AM | 0 (0.0%) | 91 (95.8%) |
| 9:00 AM to 9:59 AM | 20 (40.0%) | 0 (0.0%) |
| 10:00 AM to 10:59 AM | 0 (0.0%) | 0 (0.0%) |
| 11:00 AM to 11:59 AM | 0 (0.0%) | 0 (0.0%) |
| 12:00 PM to 3:59 PM | 0 (0.0%) | 0 (0.0%) |
| 4:00 PM to 11:59 PM | 0 (0.0%) | 0 (0.0%) |
| Total | 50 (100.0%) | 95 (100.0%) |
Housing Occupancy in Coloma
Occupancy by Ownership in Coloma
Of the total 89 dwellings in Coloma, owner-occupied units account for 36 (40.5%), while renter-occupied units make up 53 (59.6%).
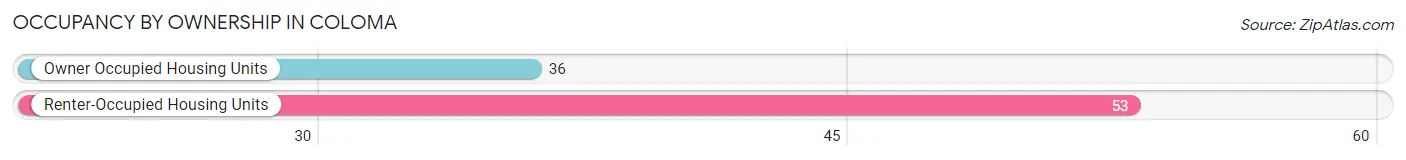
| Occupancy | # Housing Units | % Housing Units |
| Owner Occupied Housing Units | 36 | 40.5% |
| Renter-Occupied Housing Units | 53 | 59.6% |
| Total Occupied Housing Units | 89 | 100.0% |
Occupancy by Household Size in Coloma
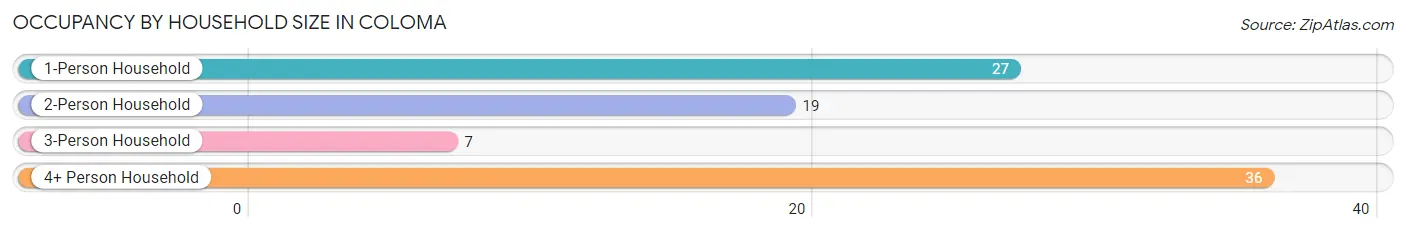
| Household Size | # Housing Units | % Housing Units |
| 1-Person Household | 27 | 30.3% |
| 2-Person Household | 19 | 21.3% |
| 3-Person Household | 7 | 7.9% |
| 4+ Person Household | 36 | 40.5% |
| Total Housing Units | 89 | 100.0% |
Occupancy by Ownership by Household Size in Coloma
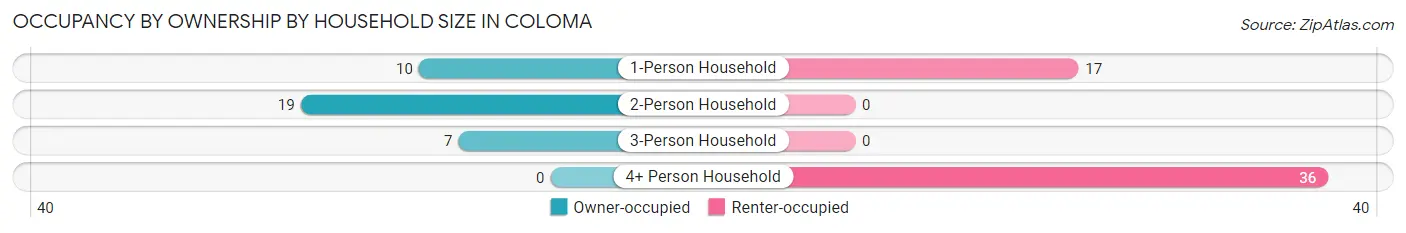
| Household Size | Owner-occupied | Renter-occupied |
| 1-Person Household | 10 (37.0%) | 17 (63.0%) |
| 2-Person Household | 19 (100.0%) | 0 (0.0%) |
| 3-Person Household | 7 (100.0%) | 0 (0.0%) |
| 4+ Person Household | 0 (0.0%) | 36 (100.0%) |
| Total Housing Units | 36 (40.5%) | 53 (59.6%) |
Occupancy by Educational Attainment in Coloma
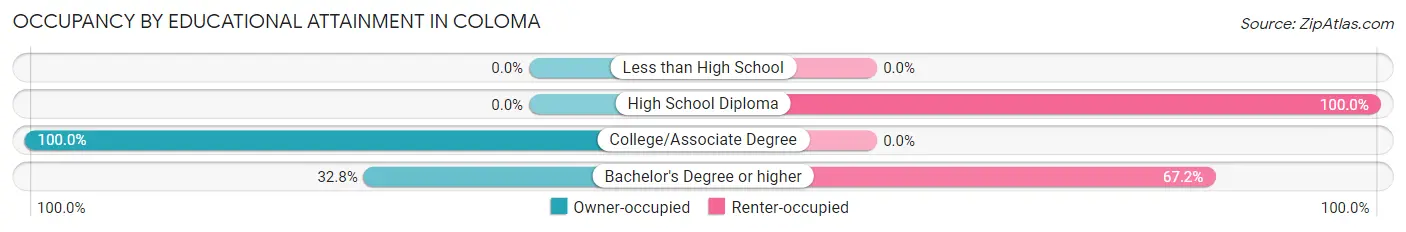
| Household Size | Owner-occupied | Renter-occupied |
| Less than High School | 0 (0.0%) | 0 (0.0%) |
| High School Diploma | 0 (0.0%) | 10 (100.0%) |
| College/Associate Degree | 15 (100.0%) | 0 (0.0%) |
| Bachelor's Degree or higher | 21 (32.8%) | 43 (67.2%) |
Occupancy by Age of Householder in Coloma
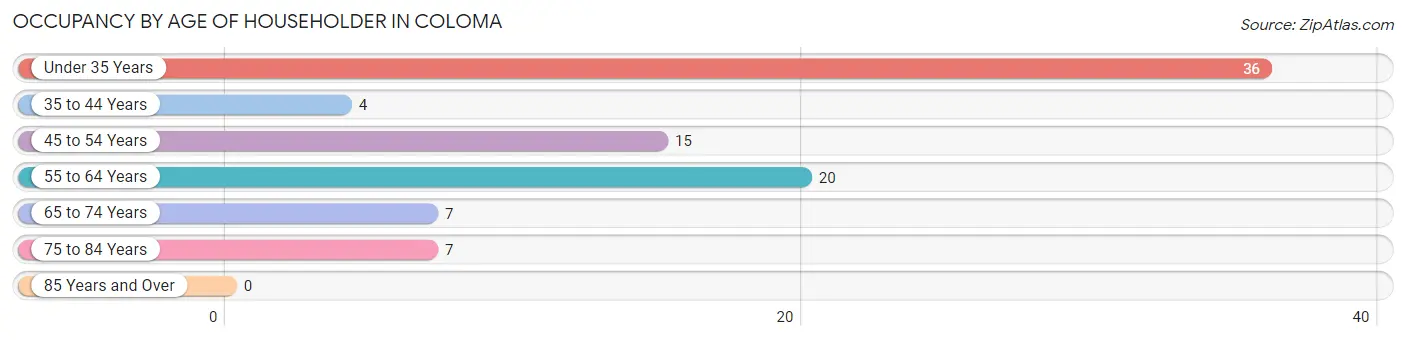
| Age Bracket | # Households | % Households |
| Under 35 Years | 36 | 40.5% |
| 35 to 44 Years | 4 | 4.5% |
| 45 to 54 Years | 15 | 16.9% |
| 55 to 64 Years | 20 | 22.5% |
| 65 to 74 Years | 7 | 7.9% |
| 75 to 84 Years | 7 | 7.9% |
| 85 Years and Over | 0 | 0.0% |
| Total | 89 | 100.0% |
Housing Finances in Coloma
Median Income by Occupancy in Coloma
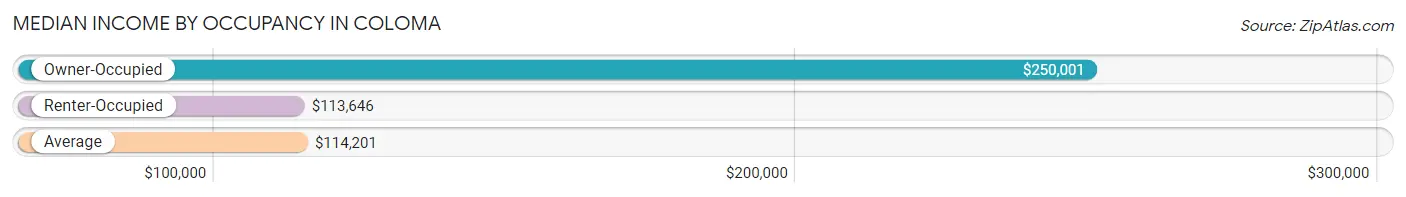
| Occupancy Type | # Households | Median Income |
| Owner-Occupied | 36 (40.5%) | $250,001 |
| Renter-Occupied | 53 (59.6%) | $113,646 |
| Average | 89 (100.0%) | $114,201 |
Occupancy by Householder Income Bracket in Coloma
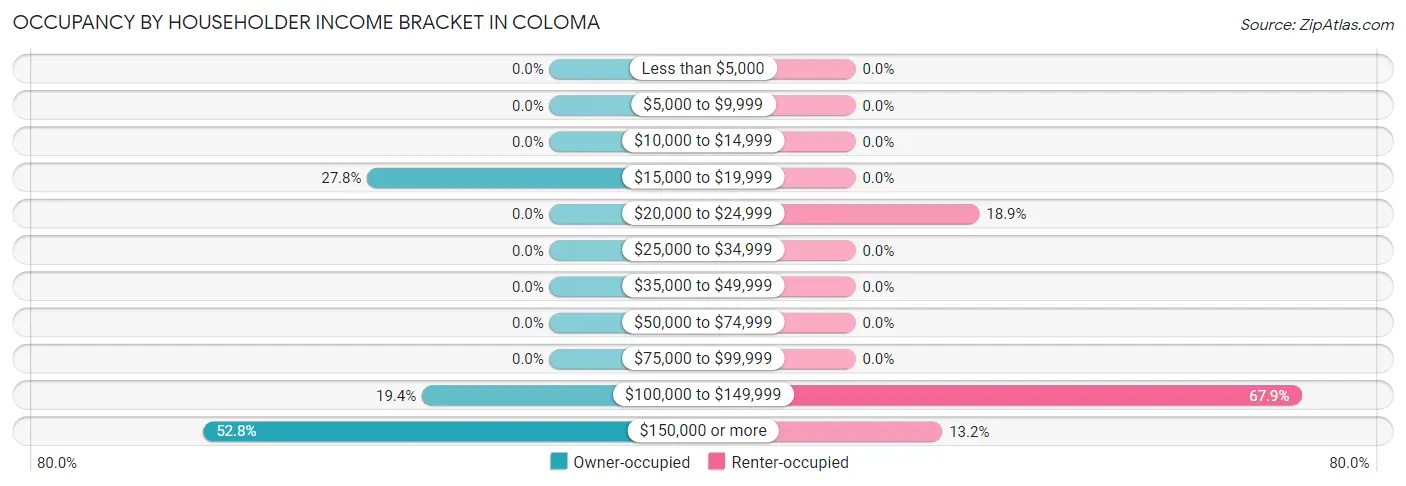
| Income Bracket | Owner-occupied | Renter-occupied |
| Less than $5,000 | 0 (0.0%) | 0 (0.0%) |
| $5,000 to $9,999 | 0 (0.0%) | 0 (0.0%) |
| $10,000 to $14,999 | 0 (0.0%) | 0 (0.0%) |
| $15,000 to $19,999 | 10 (27.8%) | 0 (0.0%) |
| $20,000 to $24,999 | 0 (0.0%) | 10 (18.9%) |
| $25,000 to $34,999 | 0 (0.0%) | 0 (0.0%) |
| $35,000 to $49,999 | 0 (0.0%) | 0 (0.0%) |
| $50,000 to $74,999 | 0 (0.0%) | 0 (0.0%) |
| $75,000 to $99,999 | 0 (0.0%) | 0 (0.0%) |
| $100,000 to $149,999 | 7 (19.4%) | 36 (67.9%) |
| $150,000 or more | 19 (52.8%) | 7 (13.2%) |
| Total | 36 (100.0%) | 53 (100.0%) |
Monthly Housing Cost Tiers in Coloma
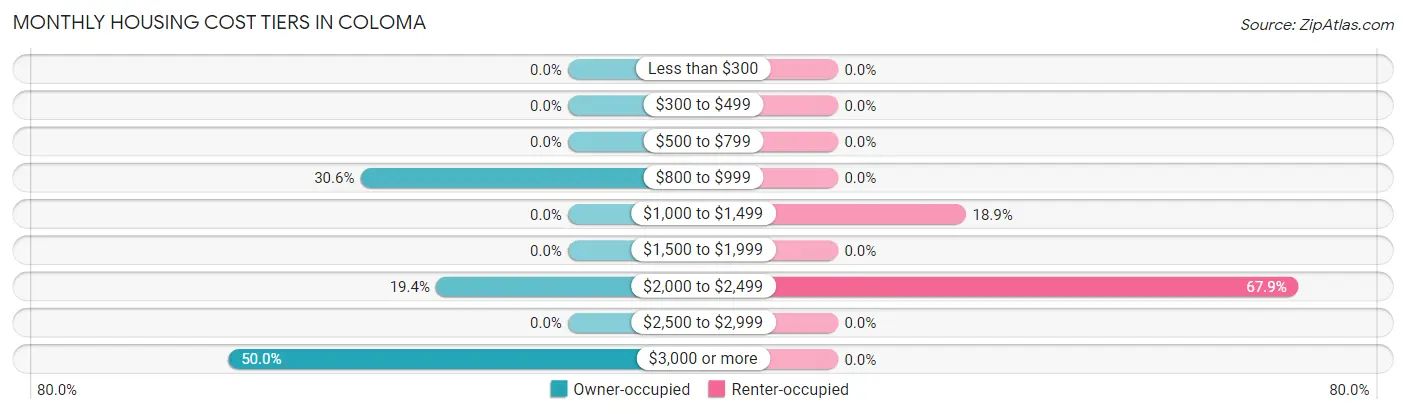
| Monthly Cost | Owner-occupied | Renter-occupied |
| Less than $300 | 0 (0.0%) | 0 (0.0%) |
| $300 to $499 | 0 (0.0%) | 0 (0.0%) |
| $500 to $799 | 0 (0.0%) | 0 (0.0%) |
| $800 to $999 | 11 (30.6%) | 0 (0.0%) |
| $1,000 to $1,499 | 0 (0.0%) | 10 (18.9%) |
| $1,500 to $1,999 | 0 (0.0%) | 0 (0.0%) |
| $2,000 to $2,499 | 7 (19.4%) | 36 (67.9%) |
| $2,500 to $2,999 | 0 (0.0%) | 0 (0.0%) |
| $3,000 or more | 18 (50.0%) | 0 (0.0%) |
| Total | 36 (100.0%) | 53 (100.0%) |
Physical Housing Characteristics in Coloma
Housing Structures in Coloma
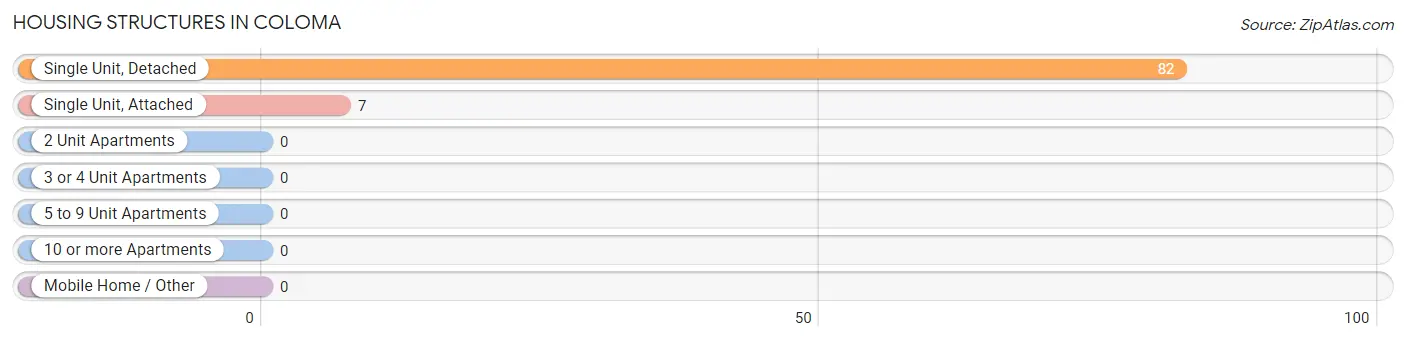
| Structure Type | # Housing Units | % Housing Units |
| Single Unit, Detached | 82 | 92.1% |
| Single Unit, Attached | 7 | 7.9% |
| 2 Unit Apartments | 0 | 0.0% |
| 3 or 4 Unit Apartments | 0 | 0.0% |
| 5 to 9 Unit Apartments | 0 | 0.0% |
| 10 or more Apartments | 0 | 0.0% |
| Mobile Home / Other | 0 | 0.0% |
| Total | 89 | 100.0% |
Housing Structures by Occupancy in Coloma
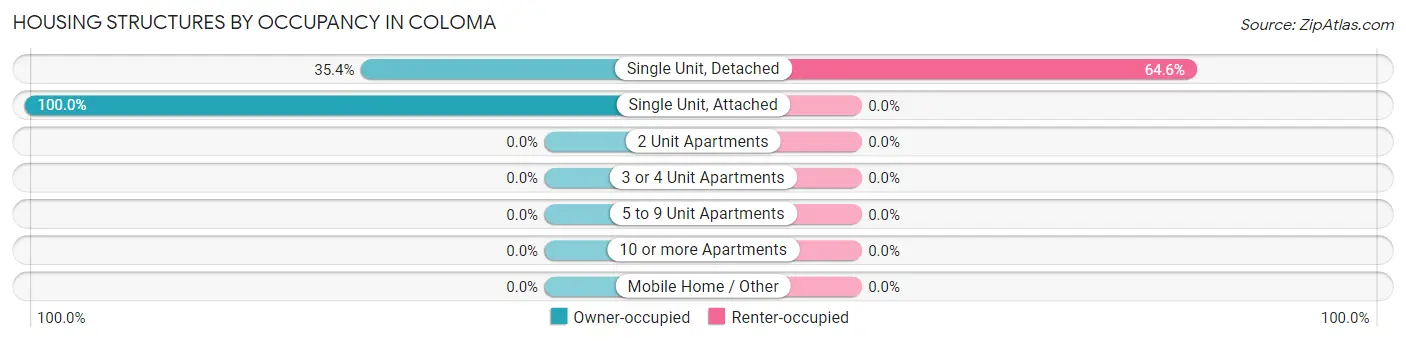
| Structure Type | Owner-occupied | Renter-occupied |
| Single Unit, Detached | 29 (35.4%) | 53 (64.6%) |
| Single Unit, Attached | 7 (100.0%) | 0 (0.0%) |
| 2 Unit Apartments | 0 (0.0%) | 0 (0.0%) |
| 3 or 4 Unit Apartments | 0 (0.0%) | 0 (0.0%) |
| 5 to 9 Unit Apartments | 0 (0.0%) | 0 (0.0%) |
| 10 or more Apartments | 0 (0.0%) | 0 (0.0%) |
| Mobile Home / Other | 0 (0.0%) | 0 (0.0%) |
| Total | 36 (40.5%) | 53 (59.6%) |
Housing Structures by Number of Rooms in Coloma
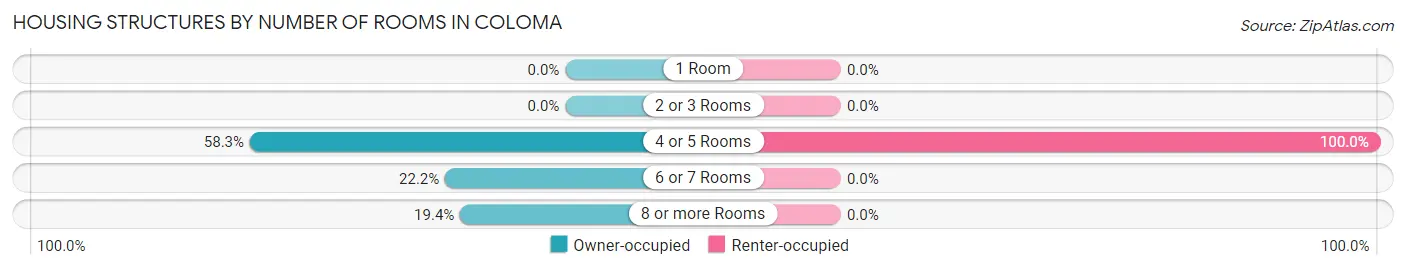
| Number of Rooms | Owner-occupied | Renter-occupied |
| 1 Room | 0 (0.0%) | 0 (0.0%) |
| 2 or 3 Rooms | 0 (0.0%) | 0 (0.0%) |
| 4 or 5 Rooms | 21 (58.3%) | 53 (100.0%) |
| 6 or 7 Rooms | 8 (22.2%) | 0 (0.0%) |
| 8 or more Rooms | 7 (19.4%) | 0 (0.0%) |
| Total | 36 (100.0%) | 53 (100.0%) |
Housing Structure by Heating Type in Coloma
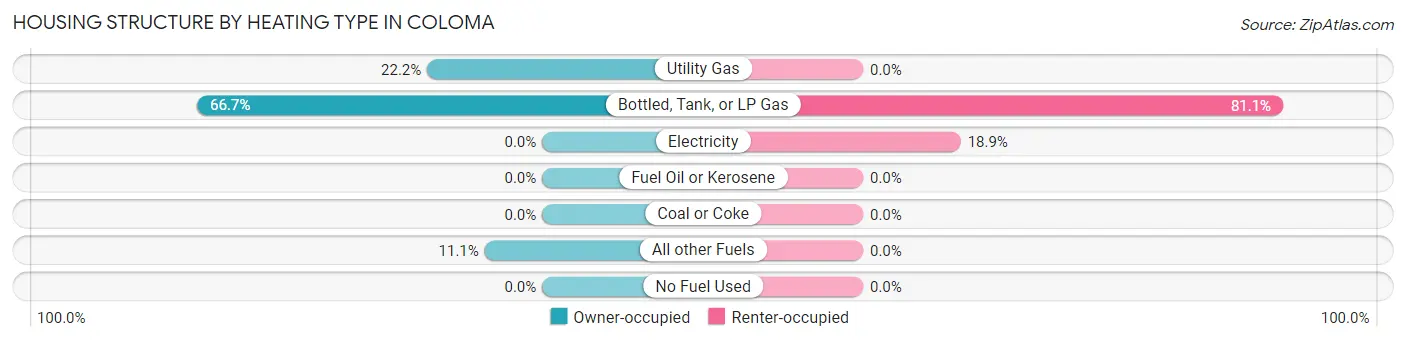
| Heating Type | Owner-occupied | Renter-occupied |
| Utility Gas | 8 (22.2%) | 0 (0.0%) |
| Bottled, Tank, or LP Gas | 24 (66.7%) | 43 (81.1%) |
| Electricity | 0 (0.0%) | 10 (18.9%) |
| Fuel Oil or Kerosene | 0 (0.0%) | 0 (0.0%) |
| Coal or Coke | 0 (0.0%) | 0 (0.0%) |
| All other Fuels | 4 (11.1%) | 0 (0.0%) |
| No Fuel Used | 0 (0.0%) | 0 (0.0%) |
| Total | 36 (100.0%) | 53 (100.0%) |
Household Vehicle Usage in Coloma
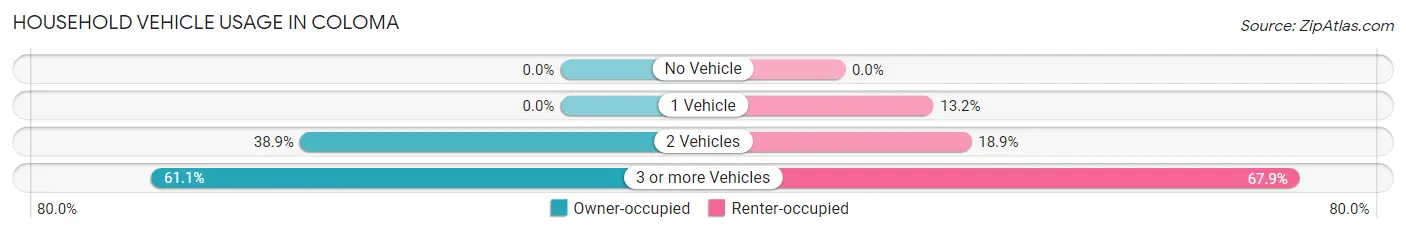
| Vehicles per Household | Owner-occupied | Renter-occupied |
| No Vehicle | 0 (0.0%) | 0 (0.0%) |
| 1 Vehicle | 0 (0.0%) | 7 (13.2%) |
| 2 Vehicles | 14 (38.9%) | 10 (18.9%) |
| 3 or more Vehicles | 22 (61.1%) | 36 (67.9%) |
| Total | 36 (100.0%) | 53 (100.0%) |
Real Estate & Mortgages in Coloma
Real Estate and Mortgage Overview in Coloma
| Characteristic | Without Mortgage | With Mortgage |
| Housing Units | 7 | 29 |
| Median Property Value | - | - |
| Median Household Income | - | - |
| Monthly Housing Costs | - | - |
| Real Estate Taxes | - | - |
Property Value by Mortgage Status in Coloma
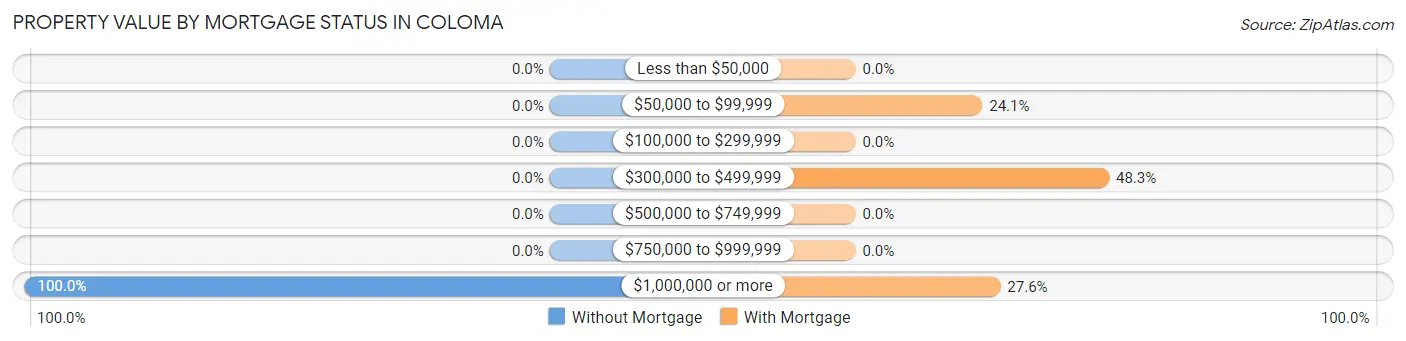
| Property Value | Without Mortgage | With Mortgage |
| Less than $50,000 | 0 (0.0%) | 0 (0.0%) |
| $50,000 to $99,999 | 0 (0.0%) | 7 (24.1%) |
| $100,000 to $299,999 | 0 (0.0%) | 0 (0.0%) |
| $300,000 to $499,999 | 0 (0.0%) | 14 (48.3%) |
| $500,000 to $749,999 | 0 (0.0%) | 0 (0.0%) |
| $750,000 to $999,999 | 0 (0.0%) | 0 (0.0%) |
| $1,000,000 or more | 7 (100.0%) | 8 (27.6%) |
| Total | 7 (100.0%) | 29 (100.0%) |
Household Income by Mortgage Status in Coloma
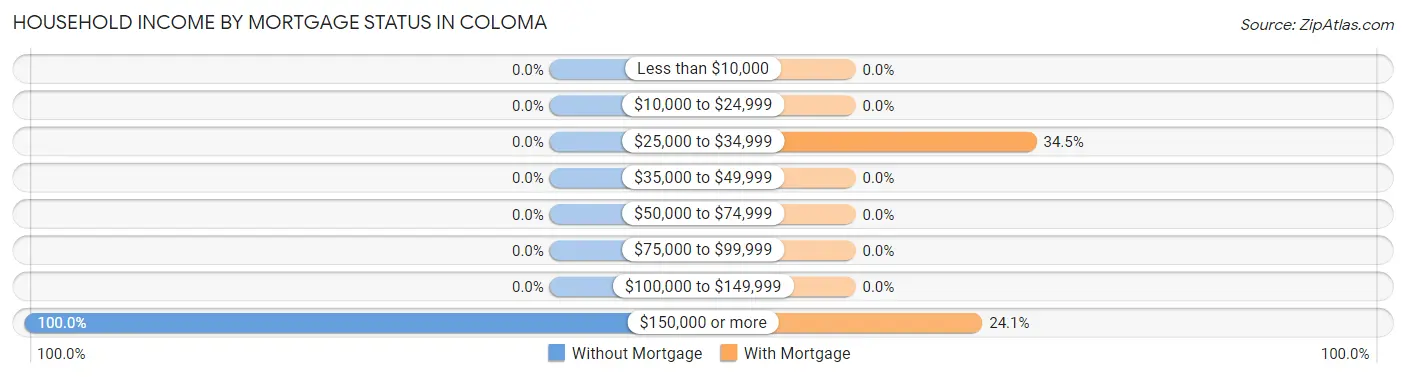
| Household Income | Without Mortgage | With Mortgage |
| Less than $10,000 | 0 (0.0%) | 0 (0.0%) |
| $10,000 to $24,999 | 0 (0.0%) | 0 (0.0%) |
| $25,000 to $34,999 | 0 (0.0%) | 10 (34.5%) |
| $35,000 to $49,999 | 0 (0.0%) | 0 (0.0%) |
| $50,000 to $74,999 | 0 (0.0%) | 0 (0.0%) |
| $75,000 to $99,999 | 0 (0.0%) | 0 (0.0%) |
| $100,000 to $149,999 | 0 (0.0%) | 0 (0.0%) |
| $150,000 or more | 7 (100.0%) | 7 (24.1%) |
| Total | 7 (100.0%) | 29 (100.0%) |
Property Value to Household Income Ratio in Coloma
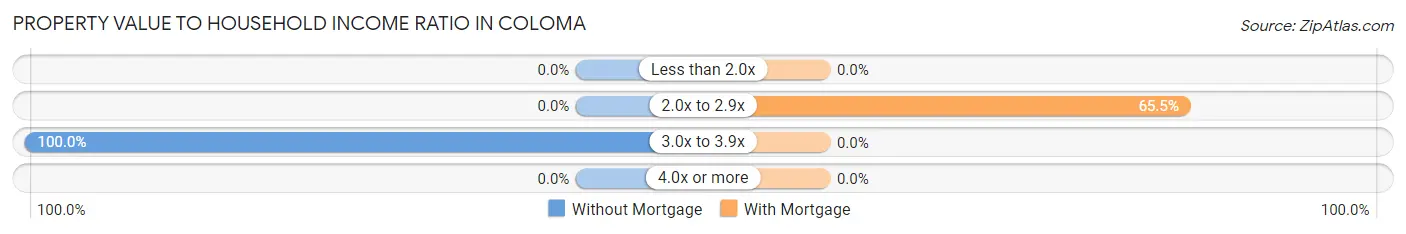
| Value-to-Income Ratio | Without Mortgage | With Mortgage |
| Less than 2.0x | 0 (0.0%) | 0 (0.0%) |
| 2.0x to 2.9x | 0 (0.0%) | 19 (65.5%) |
| 3.0x to 3.9x | 7 (100.0%) | 0 (0.0%) |
| 4.0x or more | 0 (0.0%) | 0 (0.0%) |
| Total | 7 (100.0%) | 29 (100.0%) |
Real Estate Taxes by Mortgage Status in Coloma
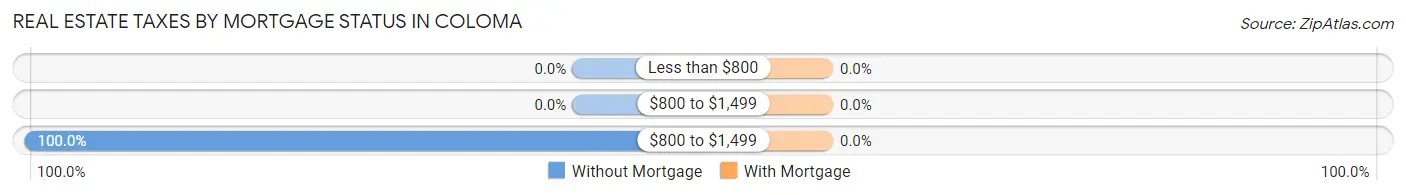
| Property Taxes | Without Mortgage | With Mortgage |
| Less than $800 | 0 (0.0%) | 0 (0.0%) |
| $800 to $1,499 | 0 (0.0%) | 0 (0.0%) |
| $800 to $1,499 | 7 (100.0%) | 0 (0.0%) |
| Total | 7 (100.0%) | 29 (100.0%) |
Health & Disability in Coloma
Health Insurance Coverage by Age in Coloma
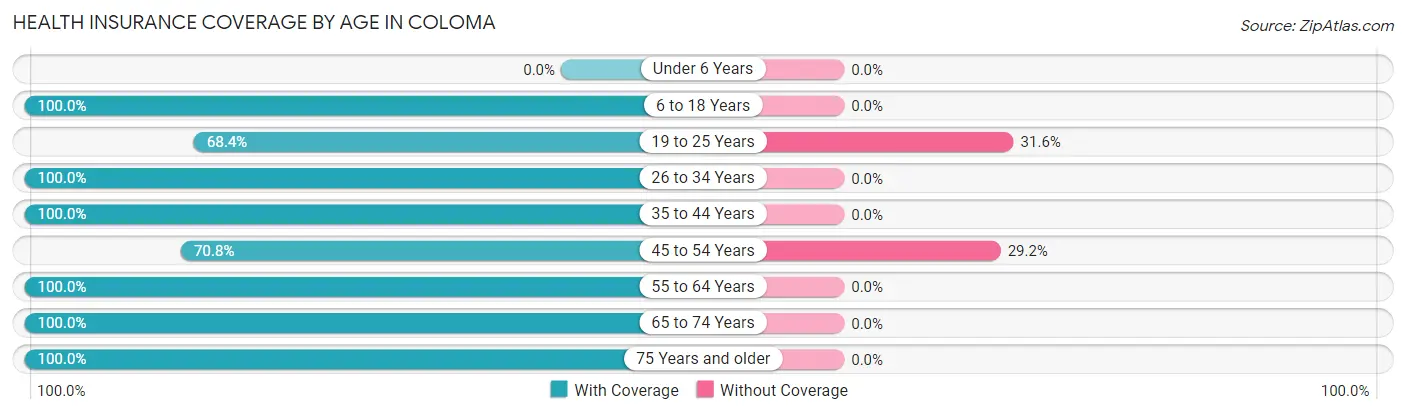
| Age Bracket | With Coverage | Without Coverage |
| Under 6 Years | 0 (0.0%) | 0 (0.0%) |
| 6 to 18 Years | 2 (100.0%) | 0 (0.0%) |
| 19 to 25 Years | 39 (68.4%) | 18 (31.6%) |
| 26 to 34 Years | 132 (100.0%) | 0 (0.0%) |
| 35 to 44 Years | 4 (100.0%) | 0 (0.0%) |
| 45 to 54 Years | 17 (70.8%) | 7 (29.2%) |
| 55 to 64 Years | 24 (100.0%) | 0 (0.0%) |
| 65 to 74 Years | 14 (100.0%) | 0 (0.0%) |
| 75 Years and older | 22 (100.0%) | 0 (0.0%) |
| Total | 254 (91.0%) | 25 (9.0%) |
Health Insurance Coverage by Citizenship Status in Coloma
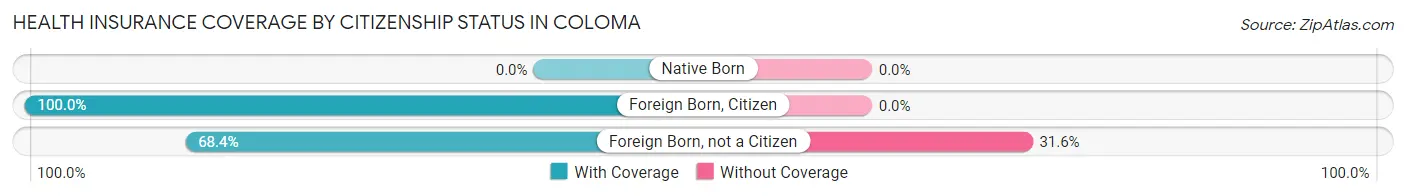
| Citizenship Status | With Coverage | Without Coverage |
| Native Born | 0 (0.0%) | 0 (0.0%) |
| Foreign Born, Citizen | 2 (100.0%) | 0 (0.0%) |
| Foreign Born, not a Citizen | 39 (68.4%) | 18 (31.6%) |
Health Insurance Coverage by Household Income in Coloma
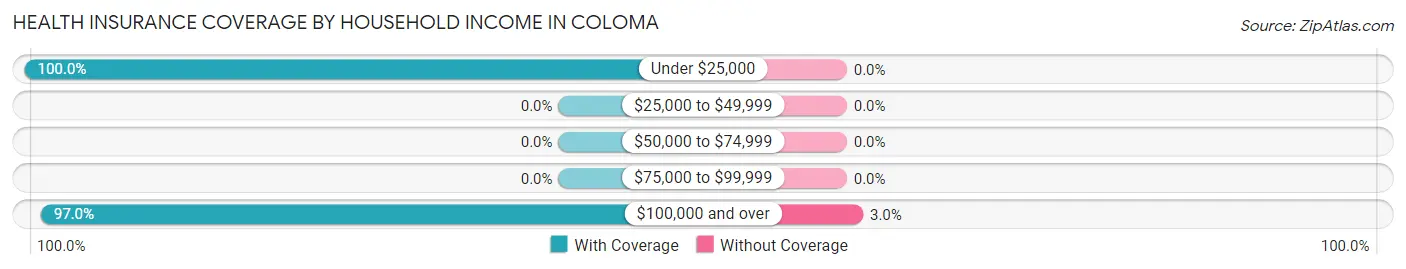
| Household Income | With Coverage | Without Coverage |
| Under $25,000 | 20 (100.0%) | 0 (0.0%) |
| $25,000 to $49,999 | 0 (0.0%) | 0 (0.0%) |
| $50,000 to $74,999 | 0 (0.0%) | 0 (0.0%) |
| $75,000 to $99,999 | 0 (0.0%) | 0 (0.0%) |
| $100,000 and over | 223 (97.0%) | 7 (3.0%) |
Public vs Private Health Insurance Coverage by Age in Coloma
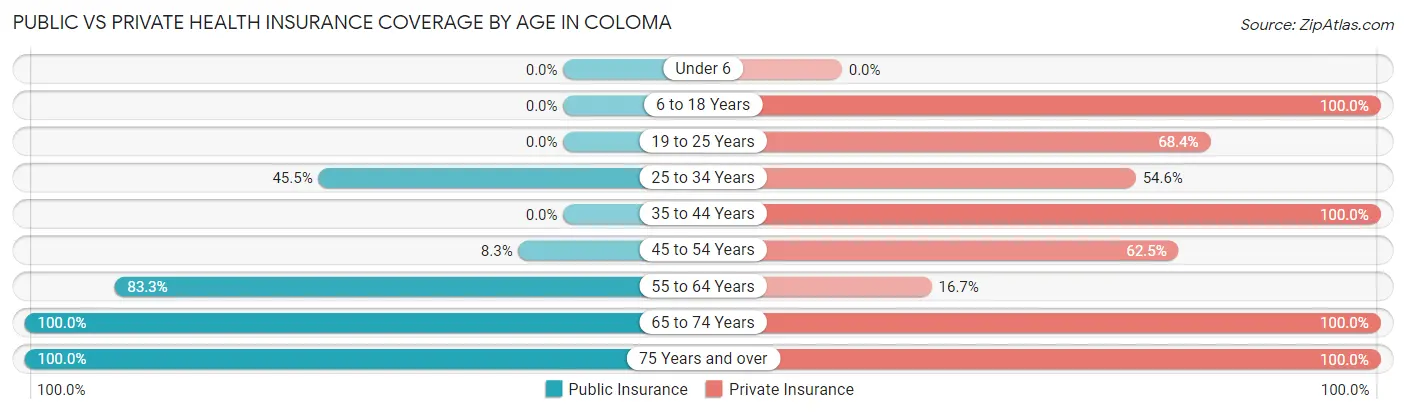
| Age Bracket | Public Insurance | Private Insurance |
| Under 6 | 0 (0.0%) | 0 (0.0%) |
| 6 to 18 Years | 0 (0.0%) | 2 (100.0%) |
| 19 to 25 Years | 0 (0.0%) | 39 (68.4%) |
| 25 to 34 Years | 60 (45.5%) | 72 (54.5%) |
| 35 to 44 Years | 0 (0.0%) | 4 (100.0%) |
| 45 to 54 Years | 2 (8.3%) | 15 (62.5%) |
| 55 to 64 Years | 20 (83.3%) | 4 (16.7%) |
| 65 to 74 Years | 14 (100.0%) | 14 (100.0%) |
| 75 Years and over | 22 (100.0%) | 22 (100.0%) |
| Total | 118 (42.3%) | 172 (61.7%) |
Disability Status by Sex by Age in Coloma
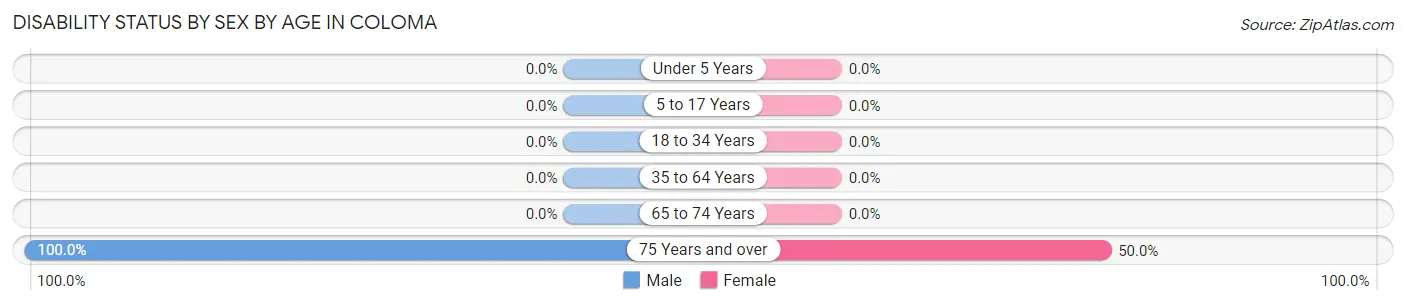
| Age Bracket | Male | Female |
| Under 5 Years | 0 (0.0%) | 0 (0.0%) |
| 5 to 17 Years | 0 (0.0%) | 0 (0.0%) |
| 18 to 34 Years | 0 (0.0%) | 0 (0.0%) |
| 35 to 64 Years | 0 (0.0%) | 0 (0.0%) |
| 65 to 74 Years | 0 (0.0%) | 0 (0.0%) |
| 75 Years and over | 8 (100.0%) | 7 (50.0%) |
Disability Class by Sex by Age in Coloma
Disability Class: Hearing Difficulty

| Age Bracket | Male | Female |
| Under 5 Years | 0 (0.0%) | 0 (0.0%) |
| 5 to 17 Years | 0 (0.0%) | 0 (0.0%) |
| 18 to 34 Years | 0 (0.0%) | 0 (0.0%) |
| 35 to 64 Years | 0 (0.0%) | 0 (0.0%) |
| 65 to 74 Years | 0 (0.0%) | 0 (0.0%) |
| 75 Years and over | 0 (0.0%) | 7 (50.0%) |
Disability Class: Vision Difficulty
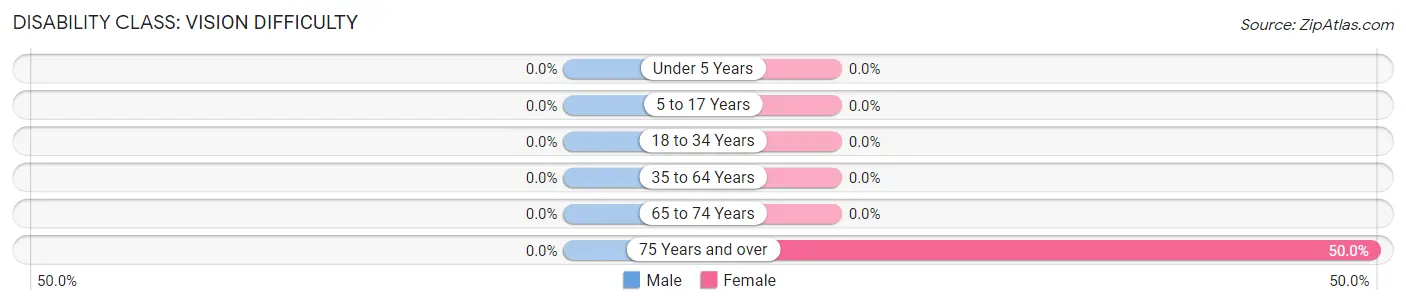
| Age Bracket | Male | Female |
| Under 5 Years | 0 (0.0%) | 0 (0.0%) |
| 5 to 17 Years | 0 (0.0%) | 0 (0.0%) |
| 18 to 34 Years | 0 (0.0%) | 0 (0.0%) |
| 35 to 64 Years | 0 (0.0%) | 0 (0.0%) |
| 65 to 74 Years | 0 (0.0%) | 0 (0.0%) |
| 75 Years and over | 0 (0.0%) | 7 (50.0%) |
Disability Class: Cognitive Difficulty
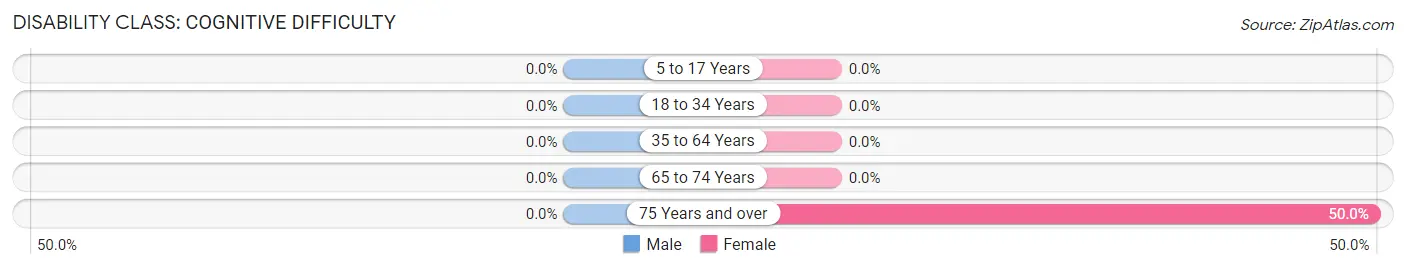
| Age Bracket | Male | Female |
| 5 to 17 Years | 0 (0.0%) | 0 (0.0%) |
| 18 to 34 Years | 0 (0.0%) | 0 (0.0%) |
| 35 to 64 Years | 0 (0.0%) | 0 (0.0%) |
| 65 to 74 Years | 0 (0.0%) | 0 (0.0%) |
| 75 Years and over | 0 (0.0%) | 7 (50.0%) |
Disability Class: Ambulatory Difficulty
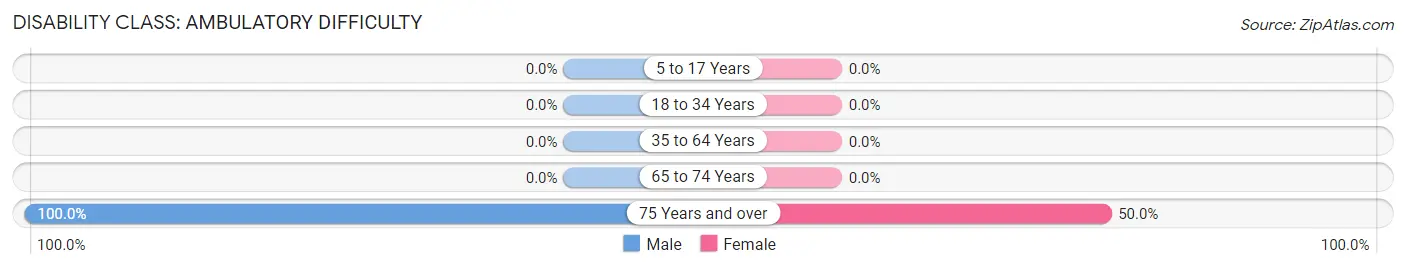
| Age Bracket | Male | Female |
| 5 to 17 Years | 0 (0.0%) | 0 (0.0%) |
| 18 to 34 Years | 0 (0.0%) | 0 (0.0%) |
| 35 to 64 Years | 0 (0.0%) | 0 (0.0%) |
| 65 to 74 Years | 0 (0.0%) | 0 (0.0%) |
| 75 Years and over | 8 (100.0%) | 7 (50.0%) |
Disability Class: Self-Care Difficulty
| Age Bracket | Male | Female |
| 5 to 17 Years | 0 (0.0%) | 0 (0.0%) |
| 18 to 34 Years | 0 (0.0%) | 0 (0.0%) |
| 35 to 64 Years | 0 (0.0%) | 0 (0.0%) |
| 65 to 74 Years | 0 (0.0%) | 0 (0.0%) |
| 75 Years and over | 0 (0.0%) | 7 (50.0%) |
Technology Access in Coloma
Computing Device Access in Coloma
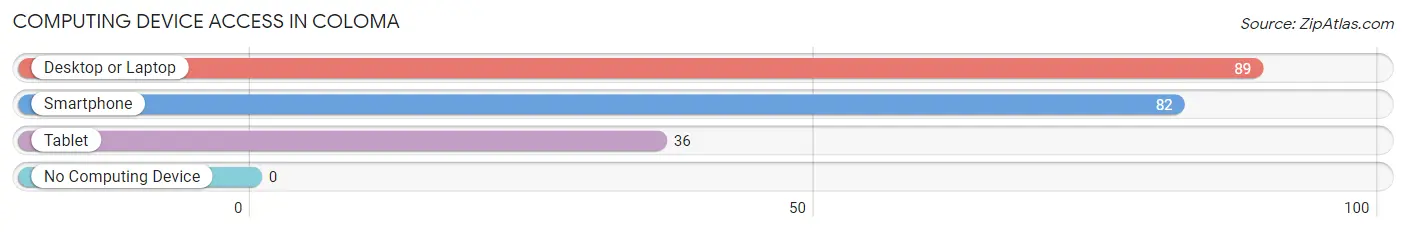
| Device Type | # Households | % Households |
| Desktop or Laptop | 89 | 100.0% |
| Smartphone | 82 | 92.1% |
| Tablet | 36 | 40.5% |
| No Computing Device | 0 | 0.0% |
| Total | 89 | 100.0% |
Internet Access in Coloma
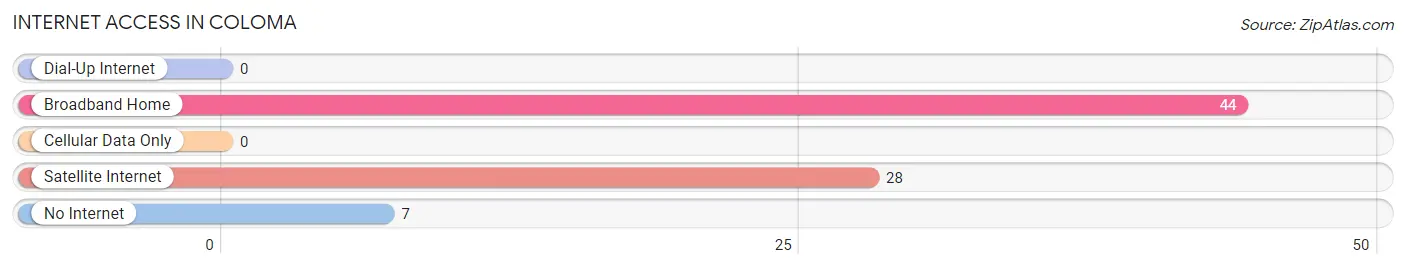
| Internet Type | # Households | % Households |
| Dial-Up Internet | 0 | 0.0% |
| Broadband Home | 44 | 49.4% |
| Cellular Data Only | 0 | 0.0% |
| Satellite Internet | 28 | 31.5% |
| No Internet | 7 | 7.9% |
| Total | 89 | 100.0% |
Coloma Summary
Coloma is a small unincorporated community located in El Dorado County, California. It is situated on the south fork of the American River, about 40 miles northeast of Sacramento. The town is best known as the site of James Marshall's discovery of gold in 1848, which sparked the California Gold Rush.
History
Coloma was originally inhabited by the Nisenan Native Americans, who lived in the area for thousands of years before the arrival of Europeans. The first Europeans to settle in the area were the Spanish, who established a mission in nearby Sutter's Fort in 1839. In 1848, James Marshall discovered gold in the American River near Coloma, sparking the California Gold Rush. The town of Coloma was founded shortly after, and quickly became a bustling center of commerce and industry.
The Gold Rush brought thousands of people to the area, and Coloma soon became a major hub for gold mining and related activities. The town was home to several large gold mining companies, as well as a number of saloons, stores, and other businesses. The population of Coloma peaked in the 1850s, with an estimated 10,000 people living in the area.
Geography
Coloma is located in El Dorado County, California, about 40 miles northeast of Sacramento. It is situated on the south fork of the American River, at an elevation of about 500 feet. The town is surrounded by rolling hills and is bordered by the Sierra Nevada mountain range to the east.
The climate in Coloma is Mediterranean, with hot, dry summers and mild, wet winters. The average annual temperature is around 60°F, and the average annual precipitation is around 20 inches.
Economy
The economy of Coloma is largely based on tourism. The town is a popular destination for visitors interested in the history of the California Gold Rush, and it is home to several museums and other attractions related to the Gold Rush. The town is also home to several wineries, and it is a popular destination for wine tasting.
In addition to tourism, Coloma is home to several small businesses, including restaurants, shops, and other services. The town is also home to a number of small farms and ranches, which produce a variety of fruits, vegetables, and livestock.
Demographics
As of the 2010 census, the population of Coloma was 1,976. The racial makeup of the town was 87.3% White, 0.7% African American, 0.7% Native American, 0.7% Asian, 0.2% Pacific Islander, 8.2% from other races, and 2.2% from two or more races. Hispanic or Latino of any race were 16.2% of the population.
The median household income in Coloma was $50,938, and the median family income was $58,906. The per capita income was $25,945. About 8.3% of families and 11.2% of the population were below the poverty line, including 15.2% of those under age 18 and 6.2% of those age 65 or over.
Common Questions
What is the Total Population of Coloma?
Total Population of Coloma is 279.
What is the Total Male Population of Coloma?
Total Male Population of Coloma is 84.
What is the Total Female Population of Coloma?
Total Female Population of Coloma is 195.
What is the Ratio of Males per 100 Females in Coloma?
There are 43.08 Males per 100 Females in Coloma.
What is the Ratio of Females per 100 Males in Coloma?
There are 232.14 Females per 100 Males in Coloma.
What is the Median Population Age in Coloma?
Median Population Age in Coloma is 27.5 Years.
What is the Average Family Size in Coloma
Average Family Size in Coloma is 2.4 People.
What is the Average Household Size in Coloma
Average Household Size in Coloma is 2.8 People.
What is Per Capita Income in Coloma?
Per Capita income in Coloma is $59,489.
What is the Median Family Income in Coloma?
Median Family Income in Coloma is $250,001.
What is the Median Household income in Coloma?
Median Household Income in Coloma is $114,201.
What is Income or Wage Gap in Coloma?
Income or Wage Gap in Coloma is 34.5%.
Women in Coloma earn 65.5 cents for every dollar earned by a man.
What is Inequality or Gini Index in Coloma?
Inequality or Gini Index in Coloma is 0.48.
How Large is the Labor Force in Coloma?
There are 246 People in the Labor Forcein in Coloma.
What is the Percentage of People in the Labor Force in Coloma?
88.8% of People are in the Labor Force in Coloma.
What is the Unemployment Rate in Coloma?
Unemployment Rate in Coloma is 28.5%.