Berkeley, CA
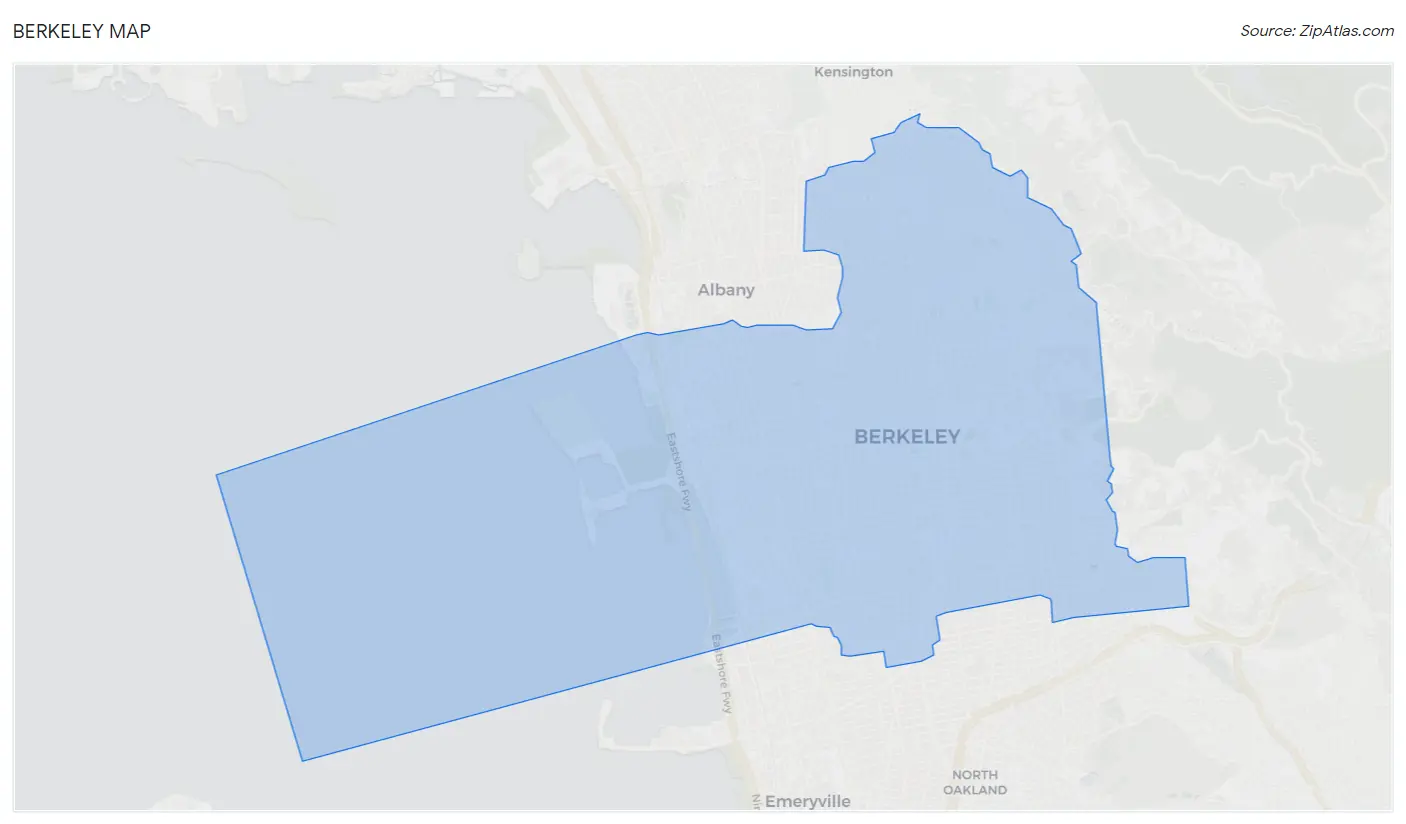
Berkeley Map
Berkeley Overview
121,385
TOTAL POPULATION
59,388
MALE POPULATION
61,997
FEMALE POPULATION
95.79
MALES / 100 FEMALES
104.39
FEMALES / 100 MALES
32.5
MEDIAN AGE
2.9
AVG FAMILY SIZE
2.4
AVG HOUSEHOLD SIZE
$63,310
PER CAPITA INCOME
$177,068
AVG FAMILY INCOME
$104,716
AVG HOUSEHOLD INCOME
29.7%
WAGE / INCOME GAP [ % ]
70.3¢/ $1
WAGE / INCOME GAP [ $ ]
$9,472
FAMILY INCOME DEFICIT
0.53
INEQUALITY / GINI INDEX
65,848
LABOR FORCE [ PEOPLE ]
60.5%
PERCENT IN LABOR FORCE
5.5%
UNEMPLOYMENT RATE
Berkeley Area Codes
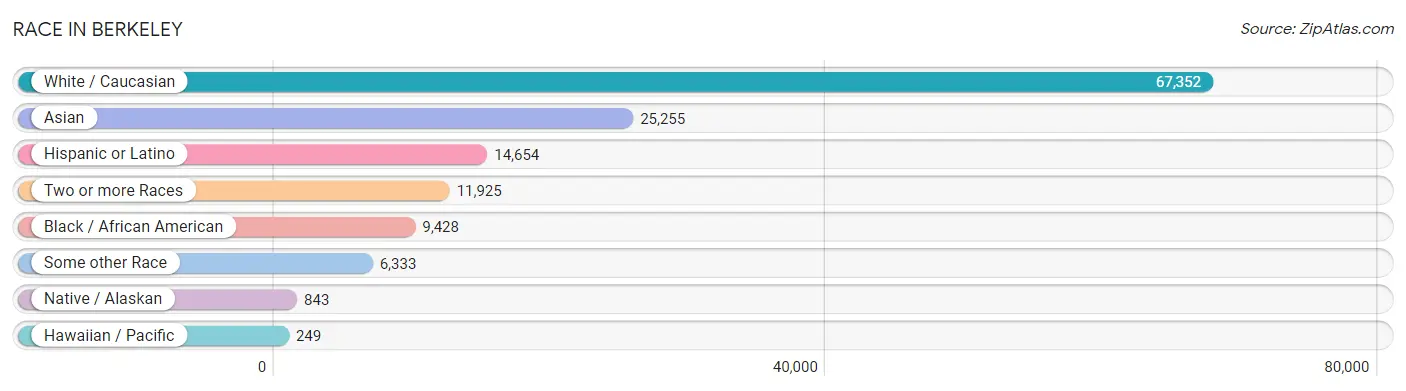
Race in Berkeley
The most populous races in Berkeley are White / Caucasian (67,352 | 55.5%), Asian (25,255 | 20.8%), and Hispanic or Latino (14,654 | 12.1%).
| Race | # Population | % Population |
| Asian | 25,255 | 20.8% |
| Black / African American | 9,428 | 7.8% |
| Hawaiian / Pacific | 249 | 0.2% |
| Hispanic or Latino | 14,654 | 12.1% |
| Native / Alaskan | 843 | 0.7% |
| White / Caucasian | 67,352 | 55.5% |
| Two or more Races | 11,925 | 9.8% |
| Some other Race | 6,333 | 5.2% |
| Total | 121,385 | 100.0% |
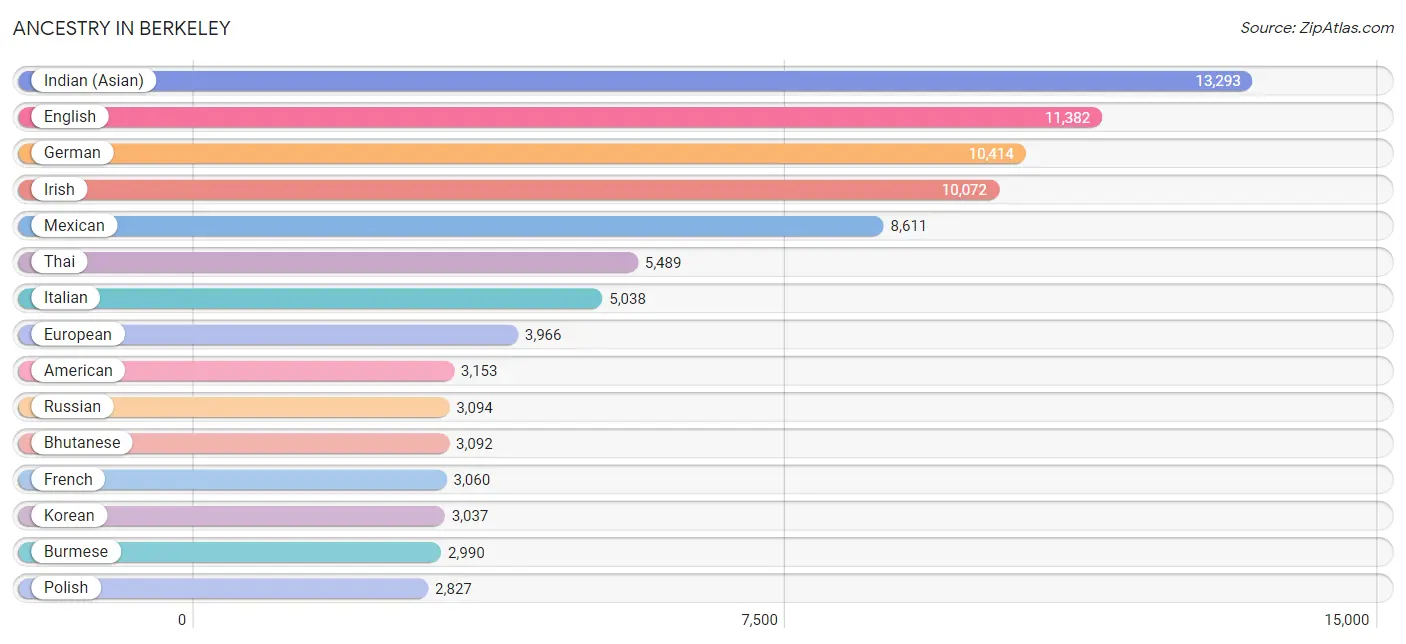
Ancestry in Berkeley
The most populous ancestries reported in Berkeley are Indian (Asian) (13,293 | 11.0%), English (11,382 | 9.4%), German (10,414 | 8.6%), Irish (10,072 | 8.3%), and Mexican (8,611 | 7.1%), together accounting for 44.3% of all Berkeley residents.
| Ancestry | # Population | % Population |
| Afghan | 129 | 0.1% |
| African | 704 | 0.6% |
| Albanian | 15 | 0.0% |
| Alsatian | 6 | 0.0% |
| American | 3,153 | 2.6% |
| Apache | 13 | 0.0% |
| Arab | 1,460 | 1.2% |
| Argentinean | 452 | 0.4% |
| Armenian | 514 | 0.4% |
| Assyrian / Chaldean / Syriac | 16 | 0.0% |
| Australian | 168 | 0.1% |
| Austrian | 545 | 0.4% |
| Bangladeshi | 46 | 0.0% |
| Barbadian | 17 | 0.0% |
| Basque | 39 | 0.0% |
| Belgian | 302 | 0.3% |
| Belizean | 96 | 0.1% |
| Bhutanese | 3,092 | 2.5% |
| Blackfeet | 12 | 0.0% |
| Bolivian | 47 | 0.0% |
| Brazilian | 531 | 0.4% |
| British | 1,598 | 1.3% |
| British West Indian | 21 | 0.0% |
| Bulgarian | 44 | 0.0% |
| Burmese | 2,990 | 2.5% |
| Cajun | 9 | 0.0% |
| Cambodian | 14 | 0.0% |
| Canadian | 231 | 0.2% |
| Cape Verdean | 4 | 0.0% |
| Celtic | 22 | 0.0% |
| Central American | 1,715 | 1.4% |
| Central American Indian | 381 | 0.3% |
| Cherokee | 273 | 0.2% |
| Cheyenne | 10 | 0.0% |
| Chilean | 632 | 0.5% |
| Chippewa | 10 | 0.0% |
| Choctaw | 181 | 0.2% |
| Colombian | 280 | 0.2% |
| Costa Rican | 56 | 0.1% |
| Creek | 33 | 0.0% |
| Croatian | 322 | 0.3% |
| Cuban | 208 | 0.2% |
| Czech | 310 | 0.3% |
| Czechoslovakian | 47 | 0.0% |
| Danish | 536 | 0.4% |
| Delaware | 5 | 0.0% |
| Dominican | 57 | 0.1% |
| Dutch | 1,162 | 1.0% |
| Dutch West Indian | 32 | 0.0% |
| Eastern European | 1,948 | 1.6% |
| Ecuadorian | 86 | 0.1% |
| Egyptian | 117 | 0.1% |
| English | 11,382 | 9.4% |
| Estonian | 38 | 0.0% |
| Ethiopian | 177 | 0.2% |
| European | 3,966 | 3.3% |
| Filipino | 981 | 0.8% |
| Finnish | 286 | 0.2% |
| French | 3,060 | 2.5% |
| French Canadian | 454 | 0.4% |
| German | 10,414 | 8.6% |
| Ghanaian | 25 | 0.0% |
| Greek | 777 | 0.6% |
| Guamanian / Chamorro | 66 | 0.1% |
| Guatemalan | 347 | 0.3% |
| Guyanese | 19 | 0.0% |
| Haitian | 129 | 0.1% |
| Honduran | 5 | 0.0% |
| Hopi | 22 | 0.0% |
| Hungarian | 766 | 0.6% |
| Icelander | 38 | 0.0% |
| Indian (Asian) | 13,293 | 11.0% |
| Indonesian | 59 | 0.1% |
| Iranian | 1,394 | 1.1% |
| Iraqi | 38 | 0.0% |
| Irish | 10,072 | 8.3% |
| Iroquois | 10 | 0.0% |
| Israeli | 160 | 0.1% |
| Italian | 5,038 | 4.2% |
| Jamaican | 91 | 0.1% |
| Japanese | 43 | 0.0% |
| Jordanian | 15 | 0.0% |
| Kenyan | 17 | 0.0% |
| Korean | 3,037 | 2.5% |
| Laotian | 328 | 0.3% |
| Latvian | 56 | 0.1% |
| Lebanese | 371 | 0.3% |
| Liberian | 9 | 0.0% |
| Lithuanian | 490 | 0.4% |
| Luxembourger | 14 | 0.0% |
| Macedonian | 17 | 0.0% |
| Malaysian | 192 | 0.2% |
| Maltese | 22 | 0.0% |
| Mexican | 8,611 | 7.1% |
| Mexican American Indian | 346 | 0.3% |
| Mongolian | 61 | 0.1% |
| Moroccan | 277 | 0.2% |
| Native Hawaiian | 201 | 0.2% |
| Navajo | 73 | 0.1% |
| Nepalese | 7 | 0.0% |
| New Zealander | 101 | 0.1% |
| Nicaraguan | 295 | 0.2% |
| Nigerian | 163 | 0.1% |
| Northern European | 557 | 0.5% |
| Norwegian | 1,615 | 1.3% |
| Okinawan | 31 | 0.0% |
| Ottawa | 4 | 0.0% |
| Pakistani | 335 | 0.3% |
| Palestinian | 136 | 0.1% |
| Panamanian | 22 | 0.0% |
| Pennsylvania German | 11 | 0.0% |
| Peruvian | 326 | 0.3% |
| Polish | 2,827 | 2.3% |
| Portuguese | 633 | 0.5% |
| Pueblo | 23 | 0.0% |
| Puerto Rican | 653 | 0.5% |
| Romanian | 351 | 0.3% |
| Russian | 3,094 | 2.5% |
| Salvadoran | 990 | 0.8% |
| Samoan | 132 | 0.1% |
| Scandinavian | 282 | 0.2% |
| Scotch-Irish | 1,055 | 0.9% |
| Scottish | 2,168 | 1.8% |
| Seminole | 11 | 0.0% |
| Senegalese | 30 | 0.0% |
| Serbian | 146 | 0.1% |
| Sierra Leonean | 8 | 0.0% |
| Sioux | 17 | 0.0% |
| Slavic | 9 | 0.0% |
| Slovak | 124 | 0.1% |
| Slovene | 53 | 0.0% |
| South African | 137 | 0.1% |
| South American | 2,015 | 1.7% |
| South American Indian | 21 | 0.0% |
| Spaniard | 673 | 0.5% |
| Spanish | 392 | 0.3% |
| Sri Lankan | 1,308 | 1.1% |
| Subsaharan African | 1,621 | 1.3% |
| Swedish | 1,778 | 1.5% |
| Swiss | 709 | 0.6% |
| Syrian | 17 | 0.0% |
| Taiwanese | 13 | 0.0% |
| Thai | 5,489 | 4.5% |
| Tlingit-Haida | 6 | 0.0% |
| Tongan | 12 | 0.0% |
| Trinidadian and Tobagonian | 10 | 0.0% |
| Turkish | 299 | 0.3% |
| Ugandan | 36 | 0.0% |
| Ukrainian | 1,237 | 1.0% |
| Uruguayan | 66 | 0.1% |
| Venezuelan | 125 | 0.1% |
| Vietnamese | 42 | 0.0% |
| Welsh | 700 | 0.6% |
| West Indian | 32 | 0.0% |
| Yaqui | 184 | 0.2% |
| Yugoslavian | 51 | 0.0% | View All 156 Rows |
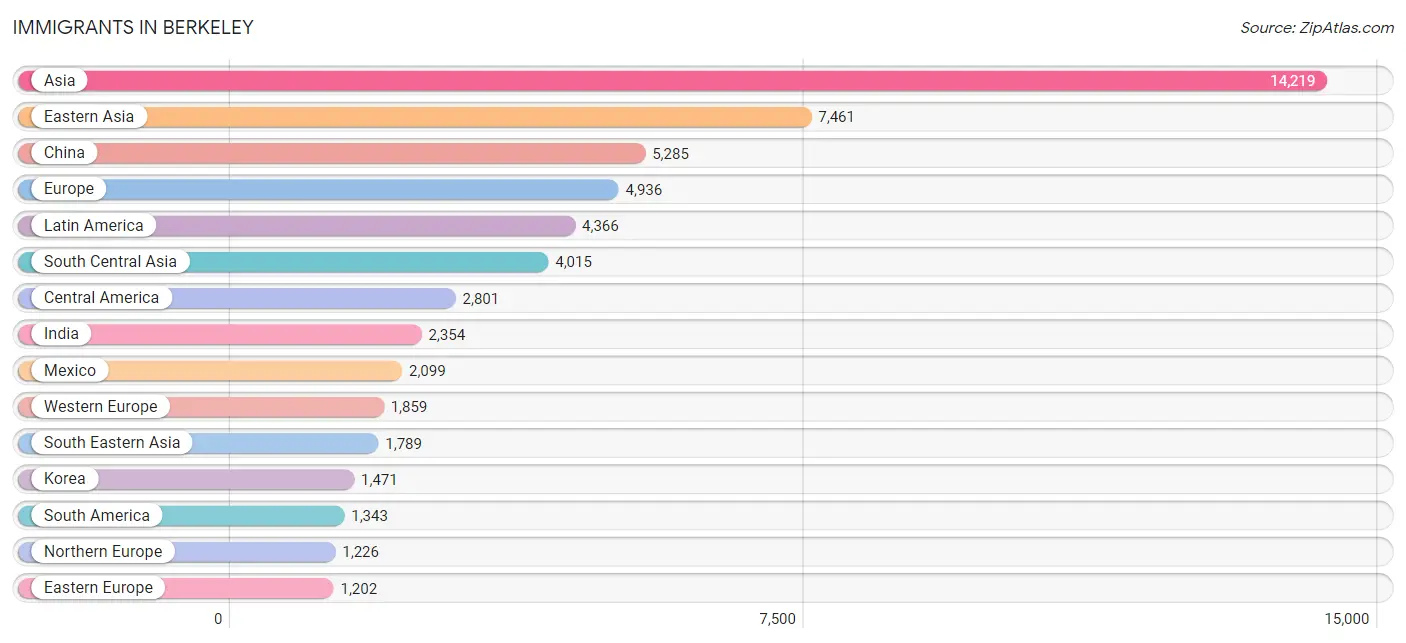
Immigrants in Berkeley
The most numerous immigrant groups reported in Berkeley came from Asia (14,219 | 11.7%), Eastern Asia (7,461 | 6.1%), China (5,285 | 4.3%), Europe (4,936 | 4.1%), and Latin America (4,366 | 3.6%), together accounting for 29.9% of all Berkeley residents.
| Immigration Origin | # Population | % Population |
| Afghanistan | 29 | 0.0% |
| Africa | 1,196 | 1.0% |
| Argentina | 320 | 0.3% |
| Armenia | 19 | 0.0% |
| Asia | 14,219 | 11.7% |
| Australia | 169 | 0.1% |
| Austria | 65 | 0.1% |
| Bangladesh | 69 | 0.1% |
| Barbados | 1 | 0.0% |
| Belarus | 155 | 0.1% |
| Belgium | 86 | 0.1% |
| Belize | 52 | 0.0% |
| Bolivia | 20 | 0.0% |
| Brazil | 444 | 0.4% |
| Bulgaria | 18 | 0.0% |
| Cambodia | 18 | 0.0% |
| Canada | 1,022 | 0.8% |
| Caribbean | 222 | 0.2% |
| Central America | 2,801 | 2.3% |
| Chile | 159 | 0.1% |
| China | 5,285 | 4.3% |
| Colombia | 99 | 0.1% |
| Costa Rica | 46 | 0.0% |
| Croatia | 57 | 0.1% |
| Cuba | 122 | 0.1% |
| Czechoslovakia | 10 | 0.0% |
| Denmark | 43 | 0.0% |
| Dominican Republic | 39 | 0.0% |
| Eastern Africa | 394 | 0.3% |
| Eastern Asia | 7,461 | 6.1% |
| Eastern Europe | 1,202 | 1.0% |
| Ecuador | 26 | 0.0% |
| Egypt | 53 | 0.0% |
| El Salvador | 459 | 0.4% |
| England | 389 | 0.3% |
| Eritrea | 109 | 0.1% |
| Ethiopia | 156 | 0.1% |
| Europe | 4,936 | 4.1% |
| Fiji | 57 | 0.1% |
| France | 840 | 0.7% |
| Germany | 617 | 0.5% |
| Ghana | 25 | 0.0% |
| Greece | 110 | 0.1% |
| Grenada | 9 | 0.0% |
| Guatemala | 79 | 0.1% |
| Hong Kong | 448 | 0.4% |
| Hungary | 30 | 0.0% |
| India | 2,354 | 1.9% |
| Indonesia | 200 | 0.2% |
| Iran | 857 | 0.7% |
| Iraq | 29 | 0.0% |
| Ireland | 148 | 0.1% |
| Israel | 368 | 0.3% |
| Italy | 209 | 0.2% |
| Japan | 705 | 0.6% |
| Kazakhstan | 16 | 0.0% |
| Kenya | 53 | 0.0% |
| Korea | 1,471 | 1.2% |
| Laos | 25 | 0.0% |
| Latin America | 4,366 | 3.6% |
| Latvia | 18 | 0.0% |
| Lebanon | 85 | 0.1% |
| Lithuania | 22 | 0.0% |
| Malaysia | 180 | 0.2% |
| Mexico | 2,099 | 1.7% |
| Middle Africa | 55 | 0.1% |
| Moldova | 8 | 0.0% |
| Morocco | 46 | 0.0% |
| Nepal | 245 | 0.2% |
| Netherlands | 114 | 0.1% |
| Nicaragua | 52 | 0.0% |
| Nigeria | 114 | 0.1% |
| North Macedonia | 5 | 0.0% |
| Northern Africa | 312 | 0.3% |
| Northern Europe | 1,226 | 1.0% |
| Norway | 33 | 0.0% |
| Oceania | 347 | 0.3% |
| Pakistan | 408 | 0.3% |
| Panama | 14 | 0.0% |
| Peru | 161 | 0.1% |
| Philippines | 518 | 0.4% |
| Poland | 196 | 0.2% |
| Portugal | 33 | 0.0% |
| Romania | 75 | 0.1% |
| Russia | 463 | 0.4% |
| Saudi Arabia | 46 | 0.0% |
| Scotland | 42 | 0.0% |
| Senegal | 28 | 0.0% |
| Sierra Leone | 8 | 0.0% |
| Singapore | 251 | 0.2% |
| South Africa | 238 | 0.2% |
| South America | 1,343 | 1.1% |
| South Central Asia | 4,015 | 3.3% |
| South Eastern Asia | 1,789 | 1.5% |
| Southern Europe | 649 | 0.5% |
| Spain | 297 | 0.2% |
| Sweden | 127 | 0.1% |
| Switzerland | 137 | 0.1% |
| Taiwan | 670 | 0.5% |
| Thailand | 216 | 0.2% |
| Trinidad and Tobago | 10 | 0.0% |
| Turkey | 269 | 0.2% |
| Uganda | 36 | 0.0% |
| Ukraine | 108 | 0.1% |
| Uruguay | 6 | 0.0% |
| Uzbekistan | 37 | 0.0% |
| Venezuela | 86 | 0.1% |
| Vietnam | 355 | 0.3% |
| Western Africa | 197 | 0.2% |
| Western Asia | 889 | 0.7% |
| Western Europe | 1,859 | 1.5% |
| Zaire | 39 | 0.0% | View All 112 Rows |
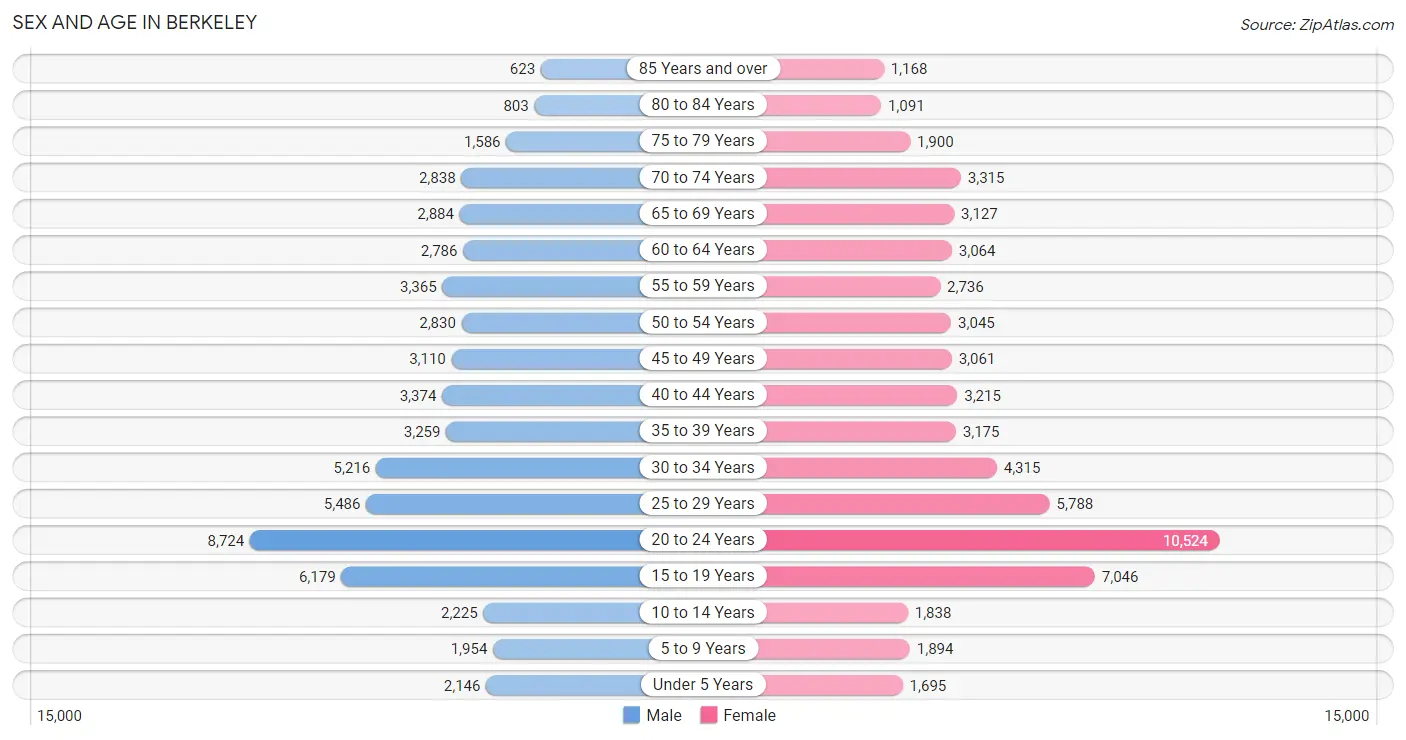
Sex and Age in Berkeley
Sex and Age in Berkeley
The most populous age groups in Berkeley are 20 to 24 Years (8,724 | 14.7%) for men and 20 to 24 Years (10,524 | 17.0%) for women.
| Age Bracket | Male | Female |
| Under 5 Years | 2,146 (3.6%) | 1,695 (2.7%) |
| 5 to 9 Years | 1,954 (3.3%) | 1,894 (3.0%) |
| 10 to 14 Years | 2,225 (3.7%) | 1,838 (3.0%) |
| 15 to 19 Years | 6,179 (10.4%) | 7,046 (11.4%) |
| 20 to 24 Years | 8,724 (14.7%) | 10,524 (17.0%) |
| 25 to 29 Years | 5,486 (9.2%) | 5,788 (9.3%) |
| 30 to 34 Years | 5,216 (8.8%) | 4,315 (7.0%) |
| 35 to 39 Years | 3,259 (5.5%) | 3,175 (5.1%) |
| 40 to 44 Years | 3,374 (5.7%) | 3,215 (5.2%) |
| 45 to 49 Years | 3,110 (5.2%) | 3,061 (4.9%) |
| 50 to 54 Years | 2,830 (4.8%) | 3,045 (4.9%) |
| 55 to 59 Years | 3,365 (5.7%) | 2,736 (4.4%) |
| 60 to 64 Years | 2,786 (4.7%) | 3,064 (4.9%) |
| 65 to 69 Years | 2,884 (4.9%) | 3,127 (5.0%) |
| 70 to 74 Years | 2,838 (4.8%) | 3,315 (5.3%) |
| 75 to 79 Years | 1,586 (2.7%) | 1,900 (3.1%) |
| 80 to 84 Years | 803 (1.3%) | 1,091 (1.8%) |
| 85 Years and over | 623 (1.1%) | 1,168 (1.9%) |
| Total | 59,388 (100.0%) | 61,997 (100.0%) |
Families and Households in Berkeley
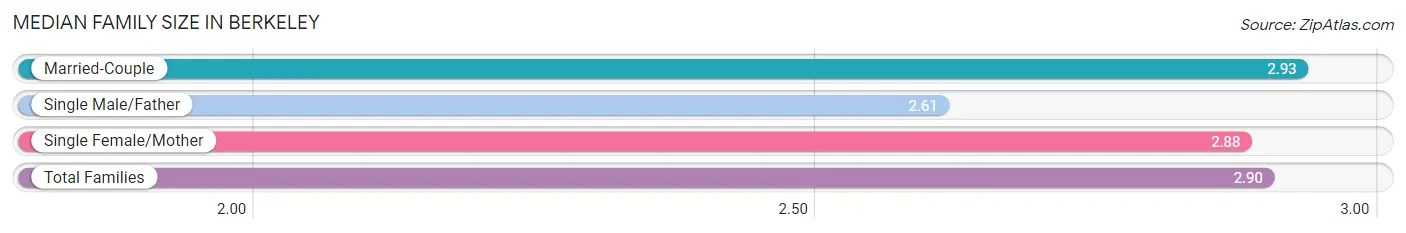
Median Family Size in Berkeley
The median family size in Berkeley is 2.90 persons per family, with married-couple families (16,732 | 78.7%) accounting for the largest median family size of 2.93 persons per family. On the other hand, single male/father families (1,422 | 6.7%) represent the smallest median family size with 2.61 persons per family.
| Family Type | # Families | Family Size |
| Married-Couple | 16,732 (78.7%) | 2.93 |
| Single Male/Father | 1,422 (6.7%) | 2.61 |
| Single Female/Mother | 3,114 (14.6%) | 2.88 |
| Total Families | 21,268 (100.0%) | 2.90 |
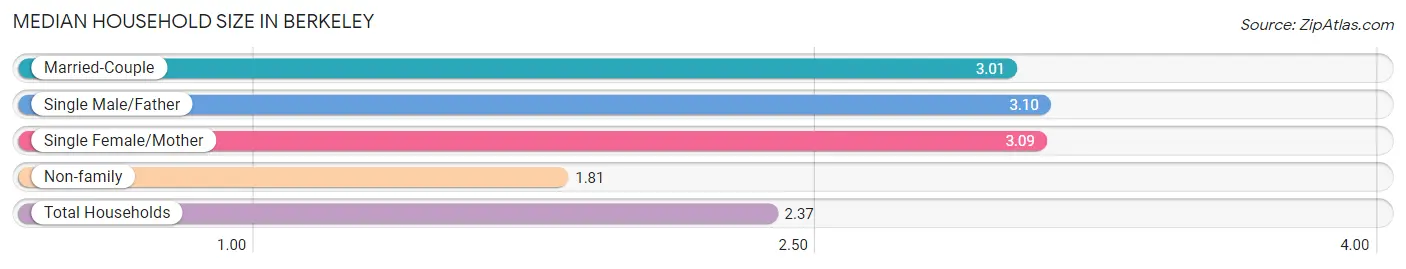
Median Household Size in Berkeley
The median household size in Berkeley is 2.37 persons per household, with single male/father households (1,422 | 3.1%) accounting for the largest median household size of 3.1 persons per household. non-family households (24,520 | 53.5%) represent the smallest median household size with 1.81 persons per household.
| Household Type | # Households | Household Size |
| Married-Couple | 16,732 (36.5%) | 3.01 |
| Single Male/Father | 1,422 (3.1%) | 3.10 |
| Single Female/Mother | 3,114 (6.8%) | 3.09 |
| Non-family | 24,520 (53.5%) | 1.81 |
| Total Households | 45,788 (100.0%) | 2.37 |
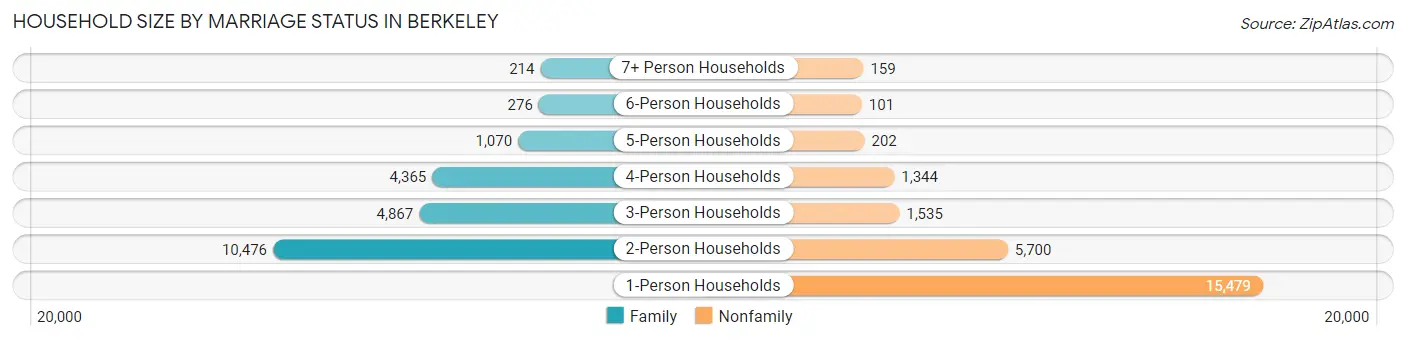
Household Size by Marriage Status in Berkeley
Out of a total of 45,788 households in Berkeley, 21,268 (46.5%) are family households, while 24,520 (53.5%) are nonfamily households. The most numerous type of family households are 2-person households, comprising 10,476, and the most common type of nonfamily households are 1-person households, comprising 15,479.
| Household Size | Family Households | Nonfamily Households |
| 1-Person Households | - | 15,479 (33.8%) |
| 2-Person Households | 10,476 (22.9%) | 5,700 (12.4%) |
| 3-Person Households | 4,867 (10.6%) | 1,535 (3.4%) |
| 4-Person Households | 4,365 (9.5%) | 1,344 (2.9%) |
| 5-Person Households | 1,070 (2.3%) | 202 (0.4%) |
| 6-Person Households | 276 (0.6%) | 101 (0.2%) |
| 7+ Person Households | 214 (0.5%) | 159 (0.4%) |
| Total | 21,268 (46.5%) | 24,520 (53.5%) |
Female Fertility in Berkeley
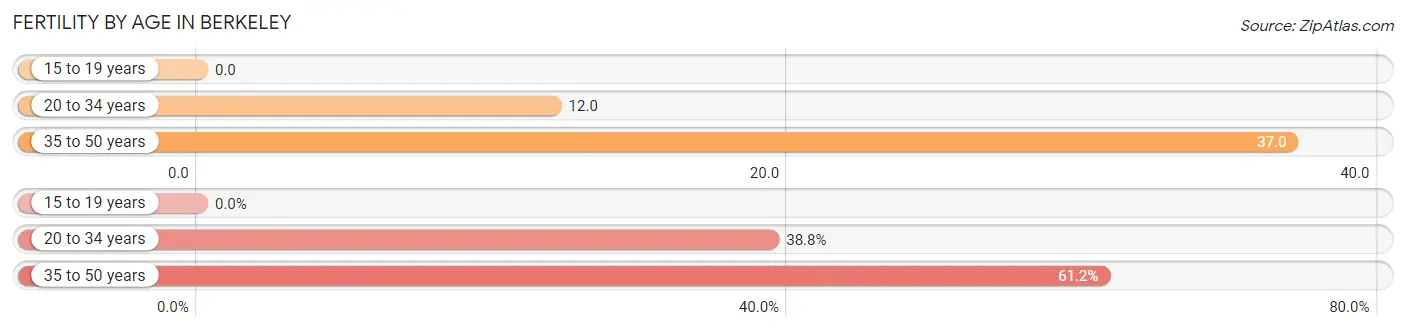
Fertility by Age in Berkeley
Average fertility rate in Berkeley is 16.0 births per 1,000 women. Women in the age bracket of 35 to 50 years have the highest fertility rate with 37.0 births per 1,000 women. Women in the age bracket of 35 to 50 years acount for 61.2% of all women with births.
| Age Bracket | Women with Births | Births / 1,000 Women |
| 15 to 19 years | 0 (0.0%) | 0.0 |
| 20 to 34 years | 240 (38.8%) | 12.0 |
| 35 to 50 years | 379 (61.2%) | 37.0 |
| Total | 619 (100.0%) | 16.0 |
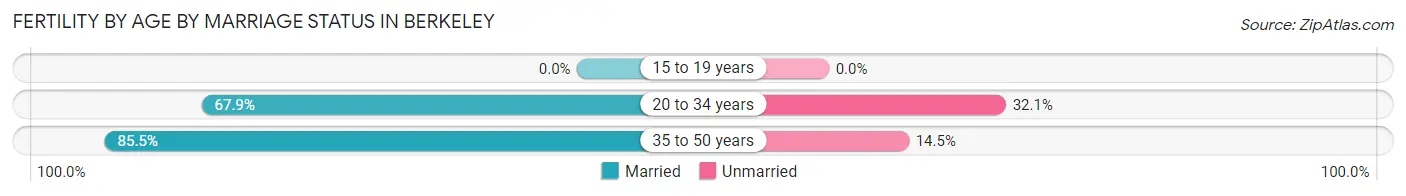
Fertility by Age by Marriage Status in Berkeley
78.7% of women with births (619) in Berkeley are married. The highest percentage of unmarried women with births falls into 20 to 34 years age bracket with 32.1% of them unmarried at the time of birth, while the lowest percentage of unmarried women with births belong to 35 to 50 years age bracket with 14.5% of them unmarried.
| Age Bracket | Married | Unmarried |
| 15 to 19 years | 0 (0.0%) | 0 (0.0%) |
| 20 to 34 years | 163 (67.9%) | 77 (32.1%) |
| 35 to 50 years | 324 (85.5%) | 55 (14.5%) |
| Total | 487 (78.7%) | 132 (21.3%) |
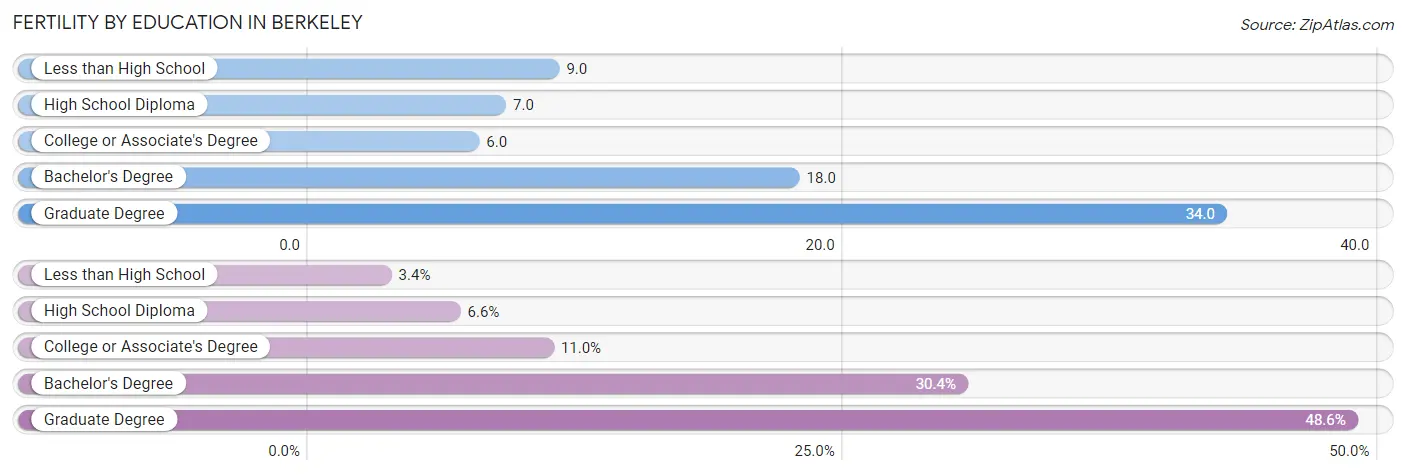
Fertility by Education in Berkeley
Average fertility rate in Berkeley is 16.0 births per 1,000 women. Women with the education attainment of graduate degree have the highest fertility rate of 34.0 births per 1,000 women, while women with the education attainment of college or associate's degree have the lowest fertility at 6.0 births per 1,000 women. Women with the education attainment of graduate degree represent 48.6% of all women with births.
| Educational Attainment | Women with Births | Births / 1,000 Women |
| Less than High School | 21 (3.4%) | 9.0 |
| High School Diploma | 41 (6.6%) | 7.0 |
| College or Associate's Degree | 68 (11.0%) | 6.0 |
| Bachelor's Degree | 188 (30.4%) | 18.0 |
| Graduate Degree | 301 (48.6%) | 34.0 |
| Total | 619 (100.0%) | 16.0 |
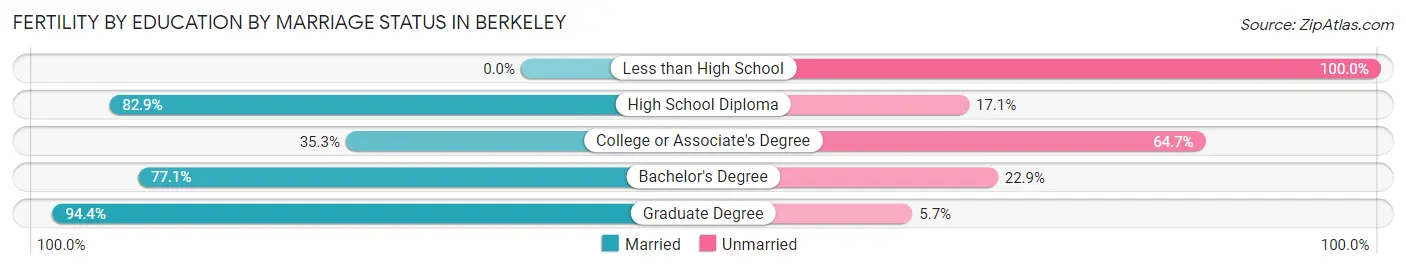
Fertility by Education by Marriage Status in Berkeley
21.3% of women with births in Berkeley are unmarried. Women with the educational attainment of graduate degree are most likely to be married with 94.4% of them married at childbirth, while women with the educational attainment of less than high school are least likely to be married with 100.0% of them unmarried at childbirth.
| Educational Attainment | Married | Unmarried |
| Less than High School | 0 (0.0%) | 21 (100.0%) |
| High School Diploma | 34 (82.9%) | 7 (17.1%) |
| College or Associate's Degree | 24 (35.3%) | 44 (64.7%) |
| Bachelor's Degree | 145 (77.1%) | 43 (22.9%) |
| Graduate Degree | 284 (94.4%) | 17 (5.7%) |
| Total | 487 (78.7%) | 132 (21.3%) |
Income in Berkeley
Income Overview in Berkeley
Per Capita Income in Berkeley is $63,310, while median incomes of families and households are $177,068 and $104,716 respectively.
| Characteristic | Number | Measure |
| Per Capita Income | 121,385 | $63,310 |
| Median Family Income | 21,268 | $177,068 |
| Mean Family Income | 21,268 | $229,132 |
| Median Household Income | 45,788 | $104,716 |
| Mean Household Income | 45,788 | $160,156 |
| Income Deficit | 21,268 | $9,472 |
| Wage / Income Gap (%) | 121,385 | 29.72% |
| Wage / Income Gap ($) | 121,385 | 70.28¢ per $1 |
| Gini / Inequality Index | 121,385 | 0.53 |
Earnings by Sex in Berkeley
Average Earnings in Berkeley are $47,464, $56,937 for men and $40,014 for women, a difference of 29.7%.
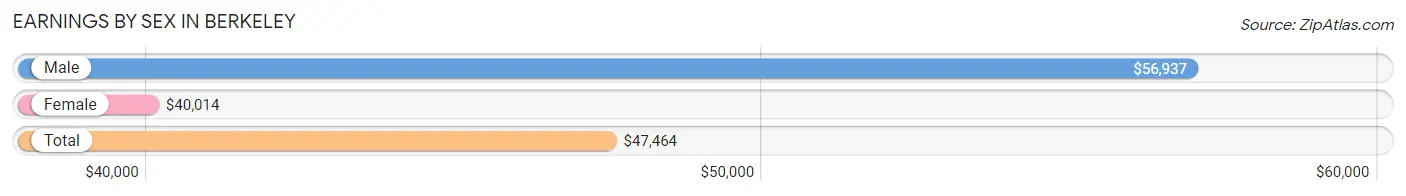
| Sex | Number | Average Earnings |
| Male | 37,204 (50.1%) | $56,937 |
| Female | 37,121 (49.9%) | $40,014 |
| Total | 74,325 (100.0%) | $47,464 |
Earnings by Sex by Income Bracket in Berkeley
The most common earnings brackets in Berkeley are $100,000+ for men (12,226 | 32.9%) and $100,000+ for women (8,060 | 21.7%).
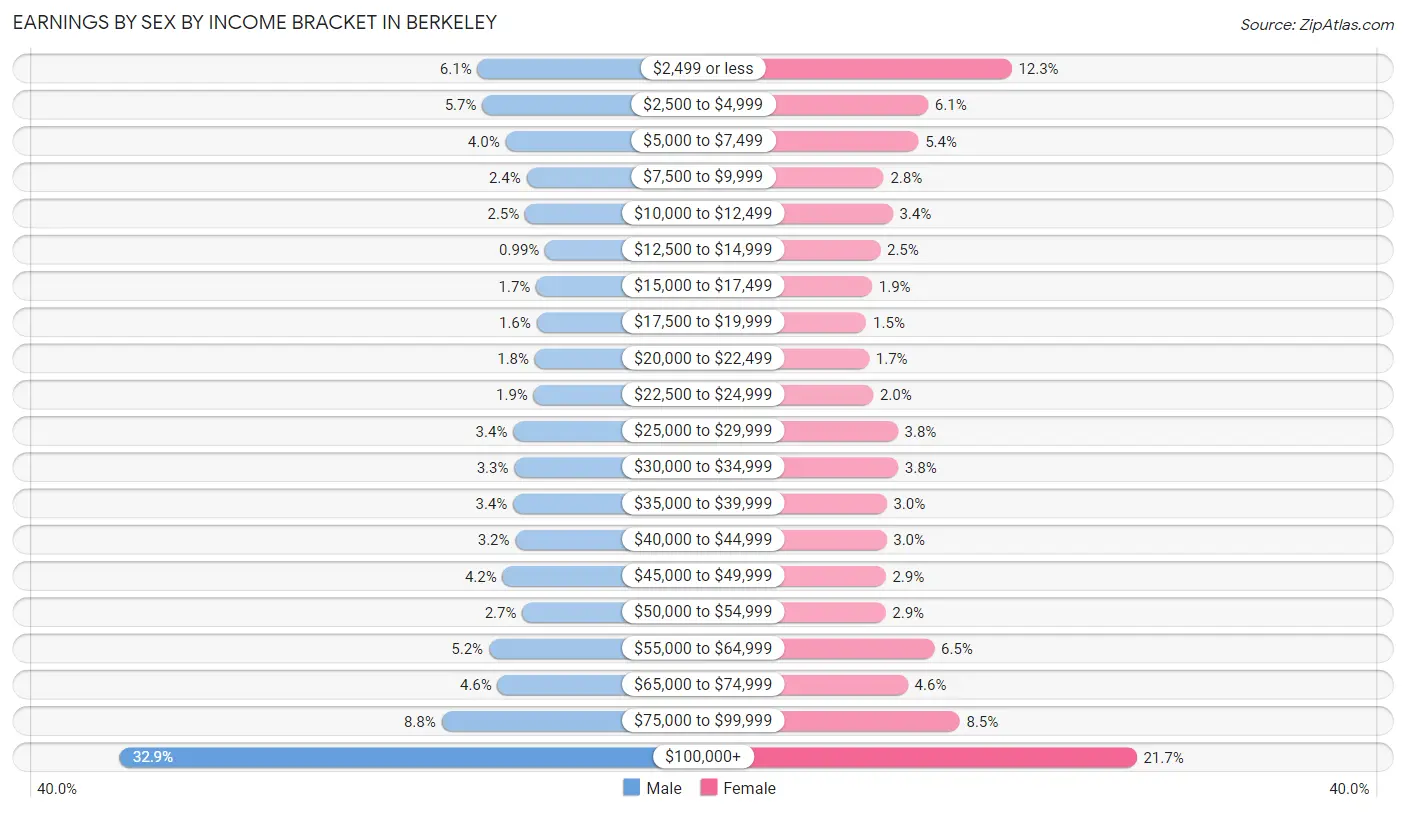
| Income | Male | Female |
| $2,499 or less | 2,256 (6.1%) | 4,581 (12.3%) |
| $2,500 to $4,999 | 2,120 (5.7%) | 2,257 (6.1%) |
| $5,000 to $7,499 | 1,473 (4.0%) | 1,986 (5.3%) |
| $7,500 to $9,999 | 884 (2.4%) | 1,022 (2.8%) |
| $10,000 to $12,499 | 925 (2.5%) | 1,270 (3.4%) |
| $12,500 to $14,999 | 368 (1.0%) | 924 (2.5%) |
| $15,000 to $17,499 | 616 (1.7%) | 697 (1.9%) |
| $17,500 to $19,999 | 606 (1.6%) | 537 (1.5%) |
| $20,000 to $22,499 | 656 (1.8%) | 612 (1.7%) |
| $22,500 to $24,999 | 687 (1.8%) | 729 (2.0%) |
| $25,000 to $29,999 | 1,258 (3.4%) | 1,415 (3.8%) |
| $30,000 to $34,999 | 1,226 (3.3%) | 1,423 (3.8%) |
| $35,000 to $39,999 | 1,263 (3.4%) | 1,104 (3.0%) |
| $40,000 to $44,999 | 1,199 (3.2%) | 1,097 (3.0%) |
| $45,000 to $49,999 | 1,555 (4.2%) | 1,077 (2.9%) |
| $50,000 to $54,999 | 1,004 (2.7%) | 1,072 (2.9%) |
| $55,000 to $64,999 | 1,934 (5.2%) | 2,429 (6.5%) |
| $65,000 to $74,999 | 1,691 (4.5%) | 1,694 (4.6%) |
| $75,000 to $99,999 | 3,257 (8.7%) | 3,135 (8.5%) |
| $100,000+ | 12,226 (32.9%) | 8,060 (21.7%) |
| Total | 37,204 (100.0%) | 37,121 (100.0%) |
Earnings by Sex by Educational Attainment in Berkeley
Average earnings in Berkeley are $80,482 for men and $62,765 for women, a difference of 22.0%. Men with an educational attainment of graduate degree enjoy the highest average annual earnings of $112,969, while those with less than high school education earn the least with $36,391. Women with an educational attainment of graduate degree earn the most with the average annual earnings of $87,949, while those with high school diploma education have the smallest earnings of $21,513.
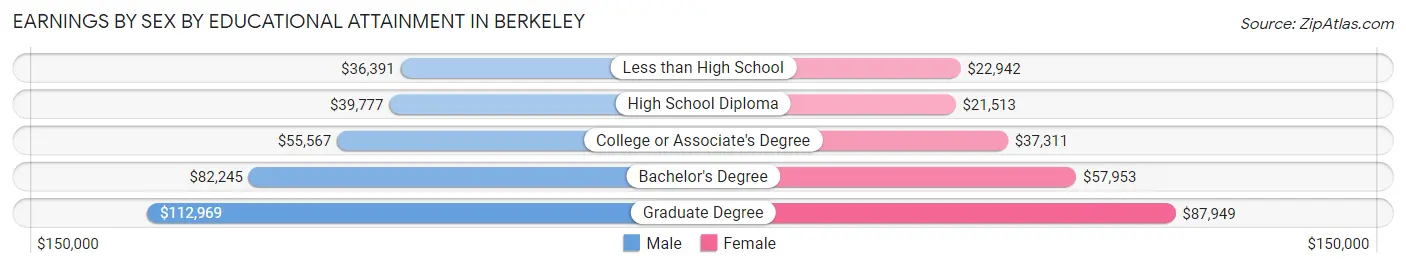
| Educational Attainment | Male Income | Female Income |
| Less than High School | $36,391 | $22,942 |
| High School Diploma | $39,777 | $21,513 |
| College or Associate's Degree | $55,567 | $37,311 |
| Bachelor's Degree | $82,245 | $57,953 |
| Graduate Degree | $112,969 | $87,949 |
| Total | $80,482 | $62,765 |
Family Income in Berkeley
Family Income Brackets in Berkeley
According to the Berkeley family income data, there are 9,400 families falling into the $200,000+ income range, which is the most common income bracket and makes up 44.2% of all families. Conversely, the $10,000 to $14,999 income bracket is the least frequent group with only 149 families (0.7%) belonging to this category.
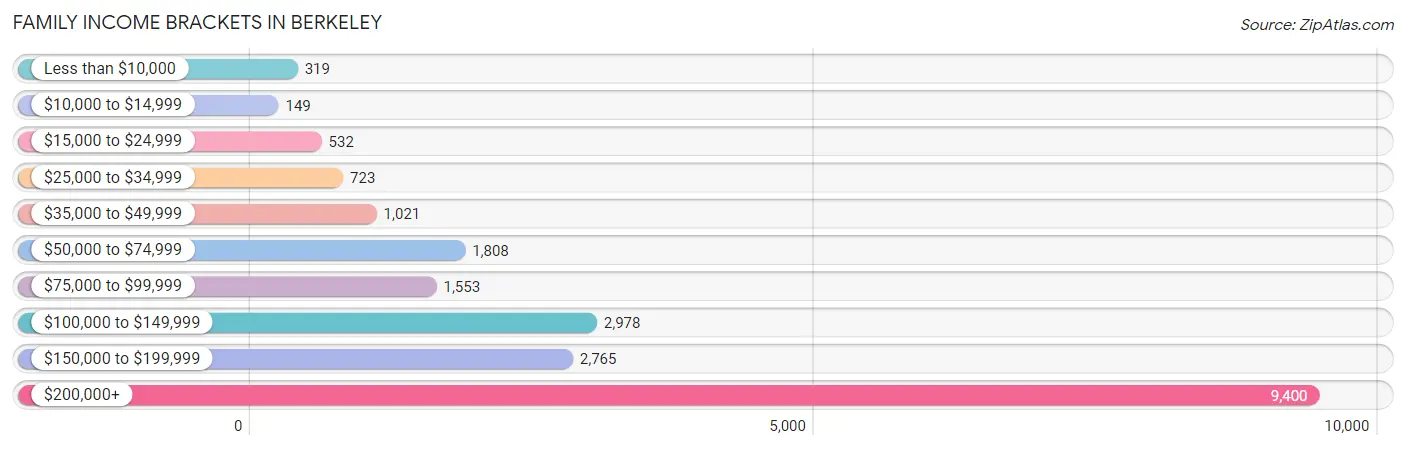
| Income Bracket | # Families | % Families |
| Less than $10,000 | 319 | 1.5% |
| $10,000 to $14,999 | 149 | 0.7% |
| $15,000 to $24,999 | 532 | 2.5% |
| $25,000 to $34,999 | 723 | 3.4% |
| $35,000 to $49,999 | 1,021 | 4.8% |
| $50,000 to $74,999 | 1,808 | 8.5% |
| $75,000 to $99,999 | 1,553 | 7.3% |
| $100,000 to $149,999 | 2,978 | 14.0% |
| $150,000 to $199,999 | 2,765 | 13.0% |
| $200,000+ | 9,400 | 44.2% |
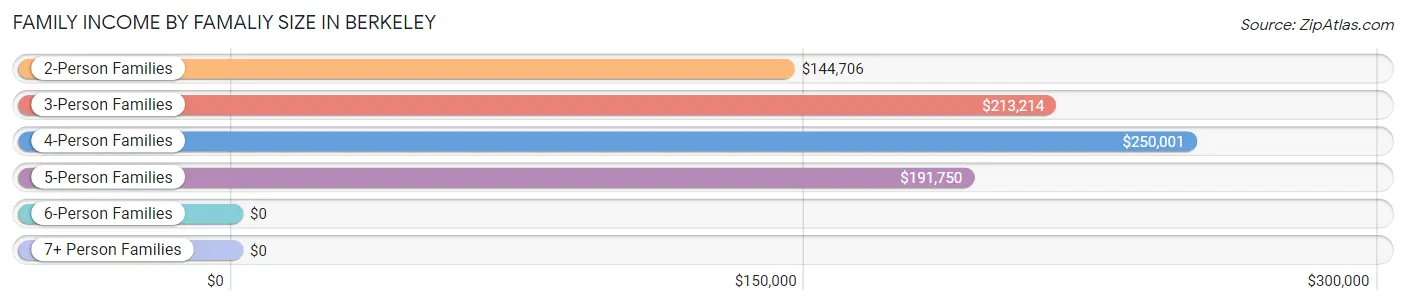
Family Income by Famaliy Size in Berkeley
4-person families (3,991 | 18.8%) account for the highest median family income in Berkeley with $250,001 per family, while 2-person families (11,314 | 53.2%) have the highest median income of $72,353 per family member.
| Income Bracket | # Families | Median Income |
| 2-Person Families | 11,314 (53.2%) | $144,706 |
| 3-Person Families | 4,702 (22.1%) | $213,214 |
| 4-Person Families | 3,991 (18.8%) | $250,001 |
| 5-Person Families | 992 (4.7%) | $191,750 |
| 6-Person Families | 145 (0.7%) | $0 |
| 7+ Person Families | 124 (0.6%) | $0 |
| Total | 21,268 (100.0%) | $177,068 |
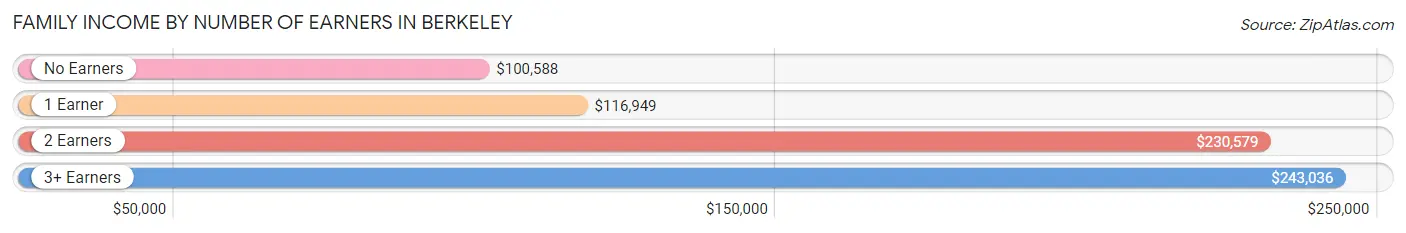
Family Income by Number of Earners in Berkeley
The median family income in Berkeley is $177,068, with families comprising 3+ earners (1,755) having the highest median family income of $243,036, while families with no earners (3,148) have the lowest median family income of $100,588, accounting for 8.3% and 14.8% of families, respectively.
| Number of Earners | # Families | Median Income |
| No Earners | 3,148 (14.8%) | $100,588 |
| 1 Earner | 6,452 (30.3%) | $116,949 |
| 2 Earners | 9,913 (46.6%) | $230,579 |
| 3+ Earners | 1,755 (8.3%) | $243,036 |
| Total | 21,268 (100.0%) | $177,068 |
Household Income in Berkeley
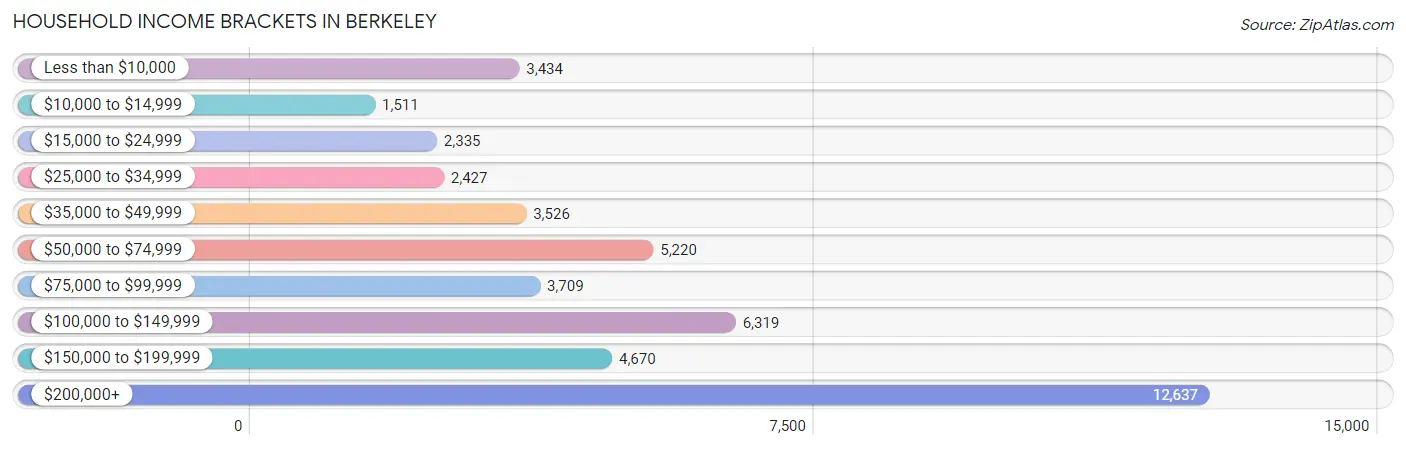
Household Income Brackets in Berkeley
With 12,637 households falling in the category, the $200,000+ income range is the most frequent in Berkeley, accounting for 27.6% of all households. In contrast, only 1,511 households (3.3%) fall into the $10,000 to $14,999 income bracket, making it the least populous group.
| Income Bracket | # Households | % Households |
| Less than $10,000 | 3,434 | 7.5% |
| $10,000 to $14,999 | 1,511 | 3.3% |
| $15,000 to $24,999 | 2,335 | 5.1% |
| $25,000 to $34,999 | 2,427 | 5.3% |
| $35,000 to $49,999 | 3,526 | 7.7% |
| $50,000 to $74,999 | 5,220 | 11.4% |
| $75,000 to $99,999 | 3,709 | 8.1% |
| $100,000 to $149,999 | 6,319 | 13.8% |
| $150,000 to $199,999 | 4,670 | 10.2% |
| $200,000+ | 12,637 | 27.6% |
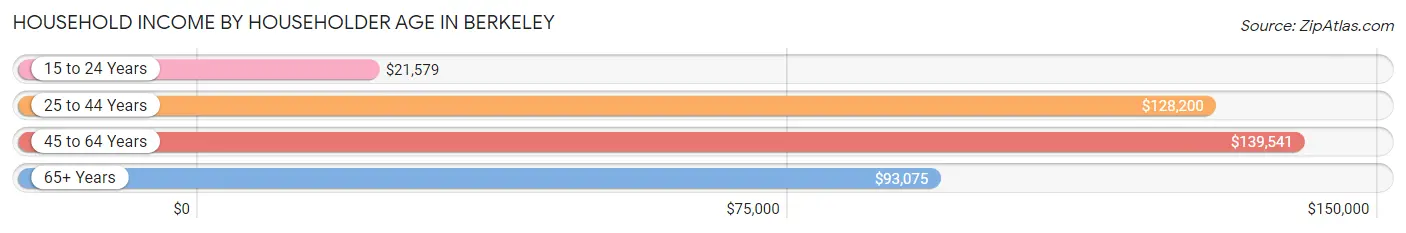
Household Income by Householder Age in Berkeley
The median household income in Berkeley is $104,716, with the highest median household income of $139,541 found in the 45 to 64 years age bracket for the primary householder. A total of 13,489 households (29.5%) fall into this category. Meanwhile, the 15 to 24 years age bracket for the primary householder has the lowest median household income of $21,579, with 4,887 households (10.7%) in this group.
| Income Bracket | # Households | Median Income |
| 15 to 24 Years | 4,887 (10.7%) | $21,579 |
| 25 to 44 Years | 14,856 (32.5%) | $128,200 |
| 45 to 64 Years | 13,489 (29.5%) | $139,541 |
| 65+ Years | 12,556 (27.4%) | $93,075 |
| Total | 45,788 (100.0%) | $104,716 |
Poverty in Berkeley
Income Below Poverty by Sex and Age in Berkeley
With 15.2% poverty level for males and 20.1% for females among the residents of Berkeley, 18 to 24 year old males and 18 to 24 year old females are the most vulnerable to poverty, with 4,700 males (53.3%) and 6,994 females (68.7%) in their respective age groups living below the poverty level.
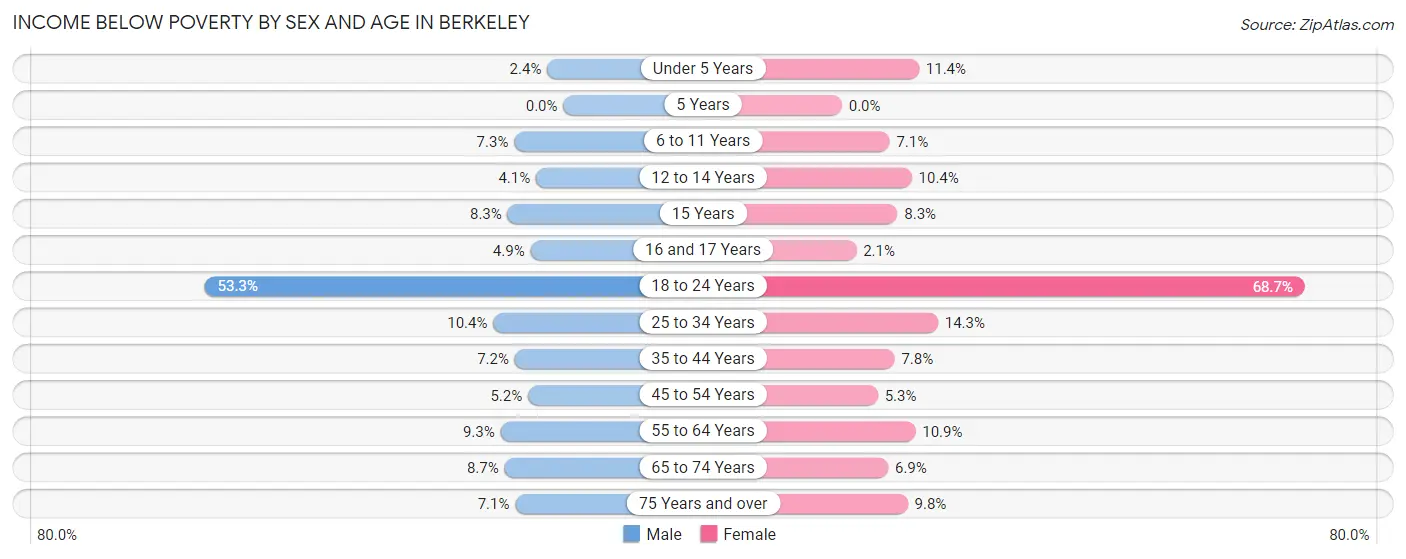
| Age Bracket | Male | Female |
| Under 5 Years | 50 (2.4%) | 189 (11.4%) |
| 5 Years | 0 (0.0%) | 0 (0.0%) |
| 6 to 11 Years | 174 (7.3%) | 153 (7.1%) |
| 12 to 14 Years | 48 (4.1%) | 115 (10.4%) |
| 15 Years | 25 (8.3%) | 40 (8.3%) |
| 16 and 17 Years | 44 (4.9%) | 22 (2.1%) |
| 18 to 24 Years | 4,700 (53.3%) | 6,994 (68.7%) |
| 25 to 34 Years | 1,075 (10.4%) | 1,425 (14.3%) |
| 35 to 44 Years | 478 (7.2%) | 499 (7.8%) |
| 45 to 54 Years | 311 (5.2%) | 325 (5.3%) |
| 55 to 64 Years | 569 (9.3%) | 632 (10.9%) |
| 65 to 74 Years | 497 (8.7%) | 441 (6.9%) |
| 75 Years and over | 212 (7.1%) | 397 (9.8%) |
| Total | 8,183 (15.2%) | 11,232 (20.1%) |
Income Above Poverty by Sex and Age in Berkeley
According to the poverty statistics in Berkeley, males aged 5 years and females aged 5 years are the age groups that are most secure financially, with 100.0% of males and 100.0% of females in these age groups living above the poverty line.
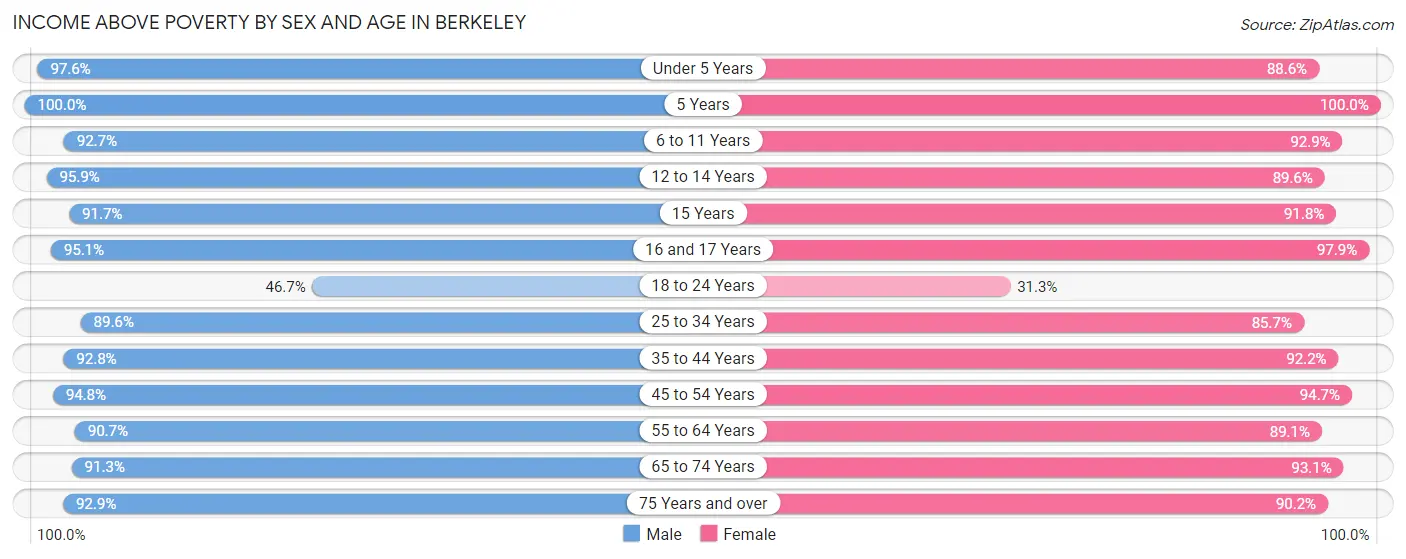
| Age Bracket | Male | Female |
| Under 5 Years | 2,043 (97.6%) | 1,463 (88.6%) |
| 5 Years | 493 (100.0%) | 421 (100.0%) |
| 6 to 11 Years | 2,214 (92.7%) | 2,009 (92.9%) |
| 12 to 14 Years | 1,135 (95.9%) | 994 (89.6%) |
| 15 Years | 277 (91.7%) | 445 (91.7%) |
| 16 and 17 Years | 857 (95.1%) | 1,007 (97.9%) |
| 18 to 24 Years | 4,124 (46.7%) | 3,180 (31.3%) |
| 25 to 34 Years | 9,264 (89.6%) | 8,569 (85.7%) |
| 35 to 44 Years | 6,149 (92.8%) | 5,882 (92.2%) |
| 45 to 54 Years | 5,619 (94.8%) | 5,770 (94.7%) |
| 55 to 64 Years | 5,538 (90.7%) | 5,161 (89.1%) |
| 65 to 74 Years | 5,194 (91.3%) | 5,974 (93.1%) |
| 75 Years and over | 2,762 (92.9%) | 3,667 (90.2%) |
| Total | 45,669 (84.8%) | 44,542 (79.9%) |
Income Below Poverty Among Married-Couple Families in Berkeley
The poverty statistics for married-couple families in Berkeley show that 2.7% or 450 of the total 16,732 families live below the poverty line. Families with 3 or 4 children have the highest poverty rate of 9.9%, comprising of 54 families. On the other hand, families with 5 or more children have the lowest poverty rate of 0.0%, which includes 0 families.
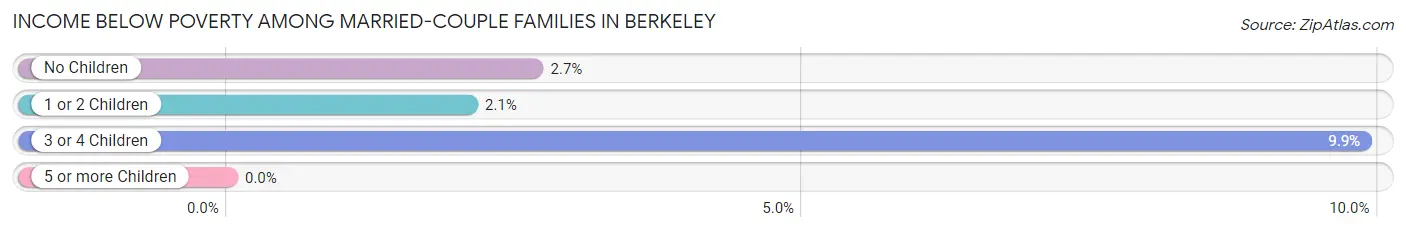
| Children | Above Poverty | Below Poverty |
| No Children | 9,935 (97.3%) | 271 (2.7%) |
| 1 or 2 Children | 5,848 (97.9%) | 125 (2.1%) |
| 3 or 4 Children | 493 (90.1%) | 54 (9.9%) |
| 5 or more Children | 6 (100.0%) | 0 (0.0%) |
| Total | 16,282 (97.3%) | 450 (2.7%) |
Income Below Poverty Among Single-Parent Households in Berkeley
According to the poverty data in Berkeley, 10.5% or 150 single-father households and 9.9% or 307 single-mother households are living below the poverty line. Among single-father households, those with no children have the highest poverty rate, with 113 households (12.8%) experiencing poverty. Likewise, among single-mother households, those with 3 or 4 children have the highest poverty rate, with 13 households (15.9%) falling below the poverty line.
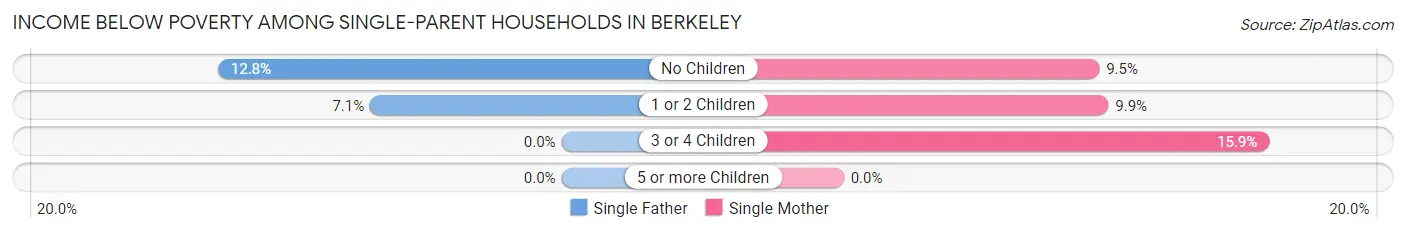
| Children | Single Father | Single Mother |
| No Children | 113 (12.8%) | 141 (9.5%) |
| 1 or 2 Children | 37 (7.1%) | 153 (9.9%) |
| 3 or 4 Children | 0 (0.0%) | 13 (15.9%) |
| 5 or more Children | 0 (0.0%) | 0 (0.0%) |
| Total | 150 (10.5%) | 307 (9.9%) |
Income Below Poverty Among Married-Couple vs Single-Parent Households in Berkeley
The poverty data for Berkeley shows that 450 of the married-couple family households (2.7%) and 457 of the single-parent households (10.1%) are living below the poverty level. Within the married-couple family households, those with 3 or 4 children have the highest poverty rate, with 54 households (9.9%) falling below the poverty line. Among the single-parent households, those with 3 or 4 children have the highest poverty rate, with 13 household (12.8%) living below poverty.
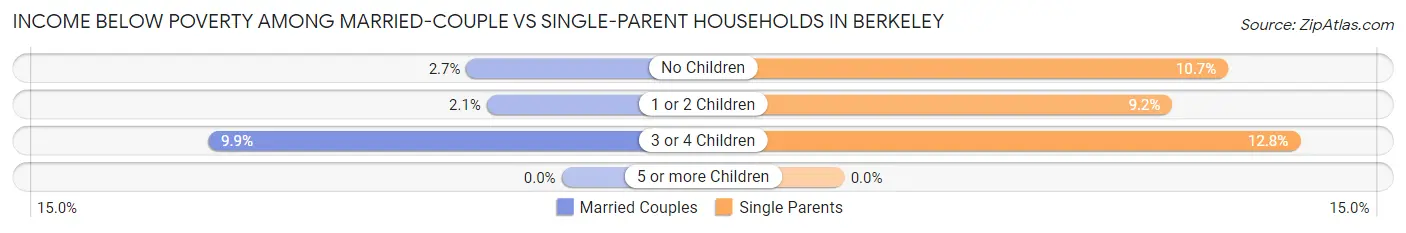
| Children | Married-Couple Families | Single-Parent Households |
| No Children | 271 (2.7%) | 254 (10.7%) |
| 1 or 2 Children | 125 (2.1%) | 190 (9.2%) |
| 3 or 4 Children | 54 (9.9%) | 13 (12.8%) |
| 5 or more Children | 0 (0.0%) | 0 (0.0%) |
| Total | 450 (2.7%) | 457 (10.1%) |
Employment Characteristics in Berkeley
Employment by Class of Employer in Berkeley
Among the 60,403 employed individuals in Berkeley, private company employees (31,029 | 51.4%), not-for-profit organizations (9,802 | 16.2%), and state government employees (7,560 | 12.5%) make up the most common classes of employment.
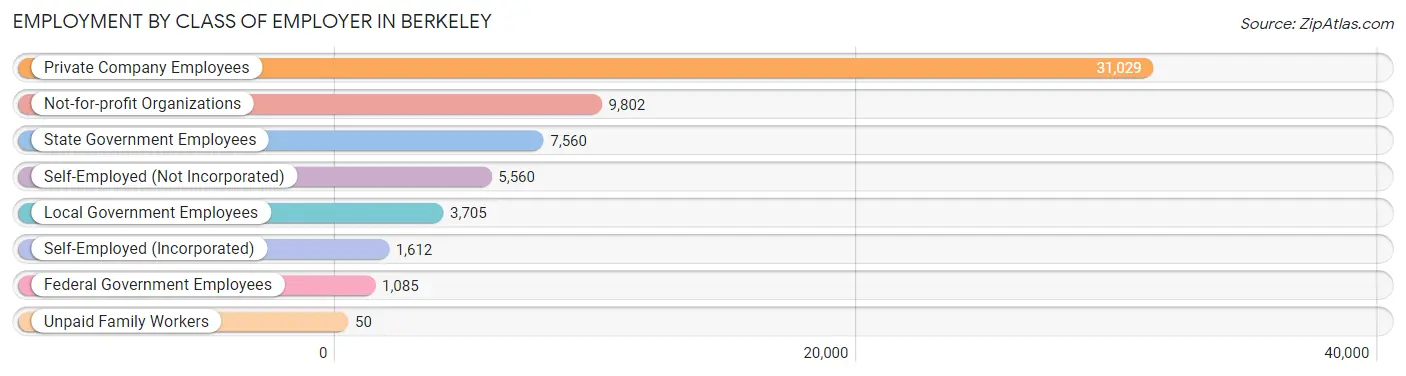
| Employer Class | # Employees | % Employees |
| Private Company Employees | 31,029 | 51.4% |
| Self-Employed (Incorporated) | 1,612 | 2.7% |
| Self-Employed (Not Incorporated) | 5,560 | 9.2% |
| Not-for-profit Organizations | 9,802 | 16.2% |
| Local Government Employees | 3,705 | 6.1% |
| State Government Employees | 7,560 | 12.5% |
| Federal Government Employees | 1,085 | 1.8% |
| Unpaid Family Workers | 50 | 0.1% |
| Total | 60,403 | 100.0% |
Employment Status by Age in Berkeley
According to the labor force statistics for Berkeley, out of the total population over 16 years of age (108,840), 60.5% or 65,848 individuals are in the labor force, with 5.5% or 3,622 of them unemployed. The age group with the highest labor force participation rate is 30 to 34 years, with 88.8% or 8,464 individuals in the labor force. Within the labor force, the 16 to 19 years age range has the highest percentage of unemployed individuals, with 16.1% or 512 of them being unemployed.
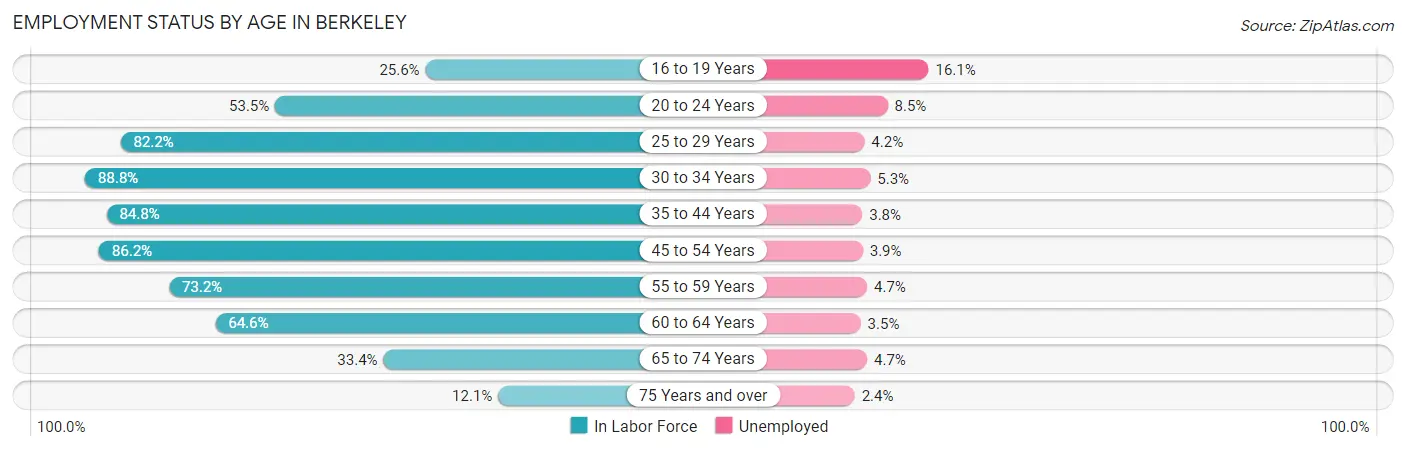
| Age Bracket | In Labor Force | Unemployed |
| 16 to 19 Years | 3,183 (25.6%) | 512 (16.1%) |
| 20 to 24 Years | 10,298 (53.5%) | 875 (8.5%) |
| 25 to 29 Years | 9,267 (82.2%) | 389 (4.2%) |
| 30 to 34 Years | 8,464 (88.8%) | 449 (5.3%) |
| 35 to 44 Years | 11,044 (84.8%) | 420 (3.8%) |
| 45 to 54 Years | 10,384 (86.2%) | 405 (3.9%) |
| 55 to 59 Years | 4,466 (73.2%) | 210 (4.7%) |
| 60 to 64 Years | 3,779 (64.6%) | 132 (3.5%) |
| 65 to 74 Years | 4,063 (33.4%) | 191 (4.7%) |
| 75 Years and over | 868 (12.1%) | 21 (2.4%) |
| Total | 65,848 (60.5%) | 3,622 (5.5%) |
Employment Status by Educational Attainment in Berkeley
According to labor force statistics for Berkeley, 82.0% of individuals (47,416) out of the total population between 25 and 64 years of age (57,825) are in the labor force, with 4.2% or 1,991 of them being unemployed. The group with the highest labor force participation rate are those with the educational attainment of bachelor's degree or higher, with 86.1% or 37,476 individuals in the labor force. Within the labor force, individuals with less than high school education have the highest percentage of unemployment, with 6.1% or 81 of them being unemployed.
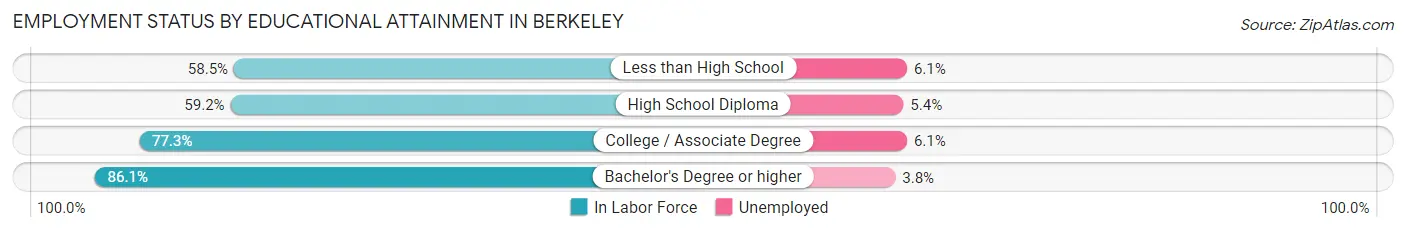
| Educational Attainment | In Labor Force | Unemployed |
| Less than High School | 1,320 (58.5%) | 138 (6.1%) |
| High School Diploma | 2,353 (59.2%) | 215 (5.4%) |
| College / Associate Degree | 6,237 (77.3%) | 492 (6.1%) |
| Bachelor's Degree or higher | 37,476 (86.1%) | 1,654 (3.8%) |
| Total | 47,416 (82.0%) | 2,429 (4.2%) |
Employment Occupations by Sex in Berkeley
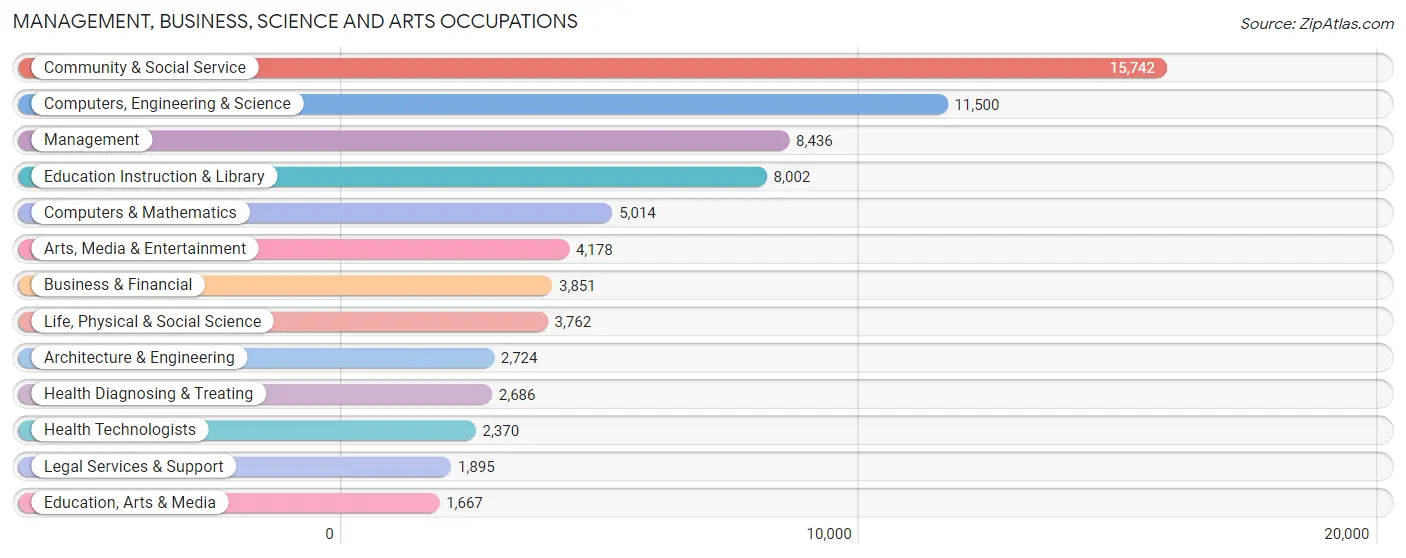
Management, Business, Science and Arts Occupations
The most common Management, Business, Science and Arts occupations in Berkeley are Community & Social Service (15,742 | 25.3%), Computers, Engineering & Science (11,500 | 18.5%), Management (8,436 | 13.6%), Education Instruction & Library (8,002 | 12.9%), and Computers & Mathematics (5,014 | 8.1%).
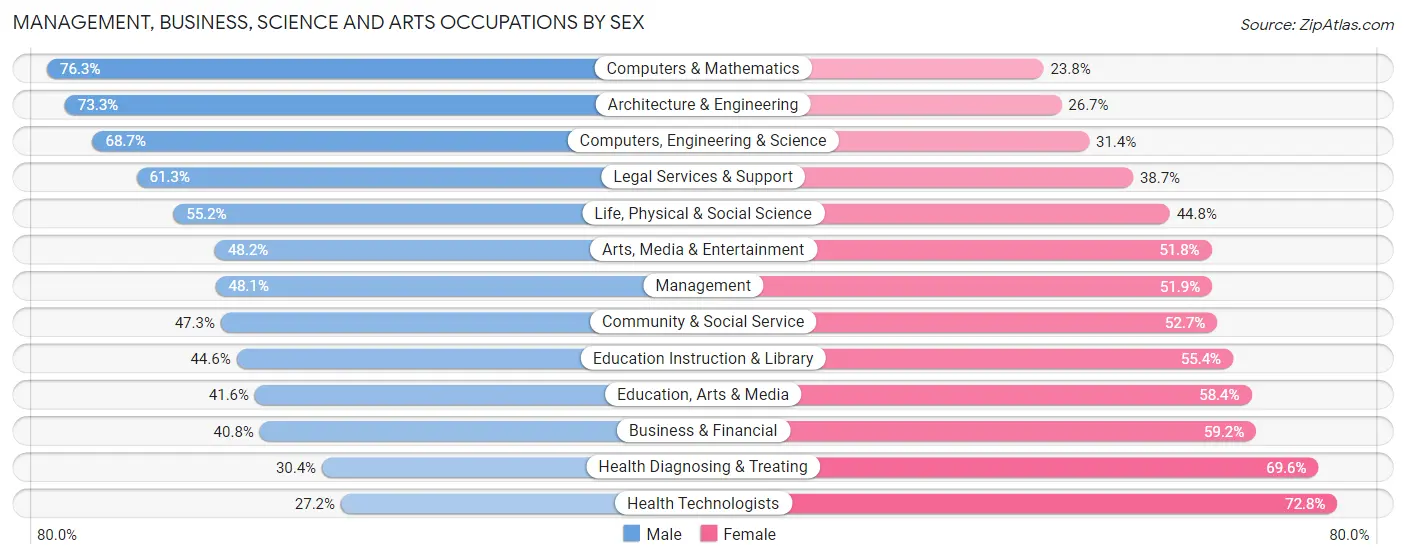
Management, Business, Science and Arts Occupations by Sex
Within the Management, Business, Science and Arts occupations in Berkeley, the most male-oriented occupations are Computers & Mathematics (76.2%), Architecture & Engineering (73.3%), and Computers, Engineering & Science (68.6%), while the most female-oriented occupations are Health Technologists (72.8%), Health Diagnosing & Treating (69.6%), and Business & Financial (59.2%).
| Occupation | Male | Female |
| Management | 4,060 (48.1%) | 4,376 (51.9%) |
| Business & Financial | 1,570 (40.8%) | 2,281 (59.2%) |
| Computers, Engineering & Science | 7,895 (68.6%) | 3,605 (31.4%) |
| Computers & Mathematics | 3,823 (76.2%) | 1,191 (23.7%) |
| Architecture & Engineering | 1,996 (73.3%) | 728 (26.7%) |
| Life, Physical & Social Science | 2,076 (55.2%) | 1,686 (44.8%) |
| Community & Social Service | 7,442 (47.3%) | 8,300 (52.7%) |
| Education, Arts & Media | 693 (41.6%) | 974 (58.4%) |
| Legal Services & Support | 1,162 (61.3%) | 733 (38.7%) |
| Education Instruction & Library | 3,572 (44.6%) | 4,430 (55.4%) |
| Arts, Media & Entertainment | 2,015 (48.2%) | 2,163 (51.8%) |
| Health Diagnosing & Treating | 816 (30.4%) | 1,870 (69.6%) |
| Health Technologists | 645 (27.2%) | 1,725 (72.8%) |
| Total (Category) | 21,783 (51.6%) | 20,432 (48.4%) |
| Total (Overall) | 31,384 (50.5%) | 30,806 (49.5%) |
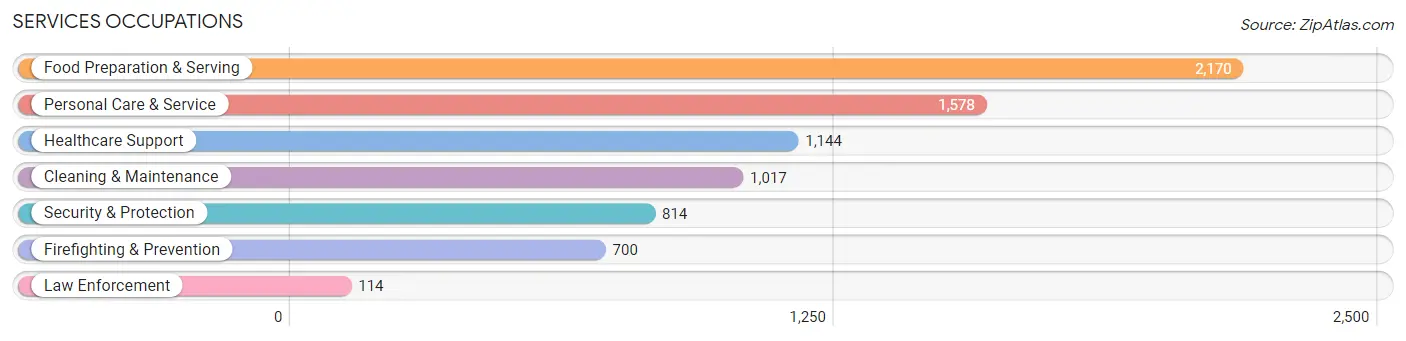
Services Occupations
The most common Services occupations in Berkeley are Food Preparation & Serving (2,170 | 3.5%), Personal Care & Service (1,578 | 2.5%), Healthcare Support (1,144 | 1.8%), Cleaning & Maintenance (1,017 | 1.6%), and Security & Protection (814 | 1.3%).
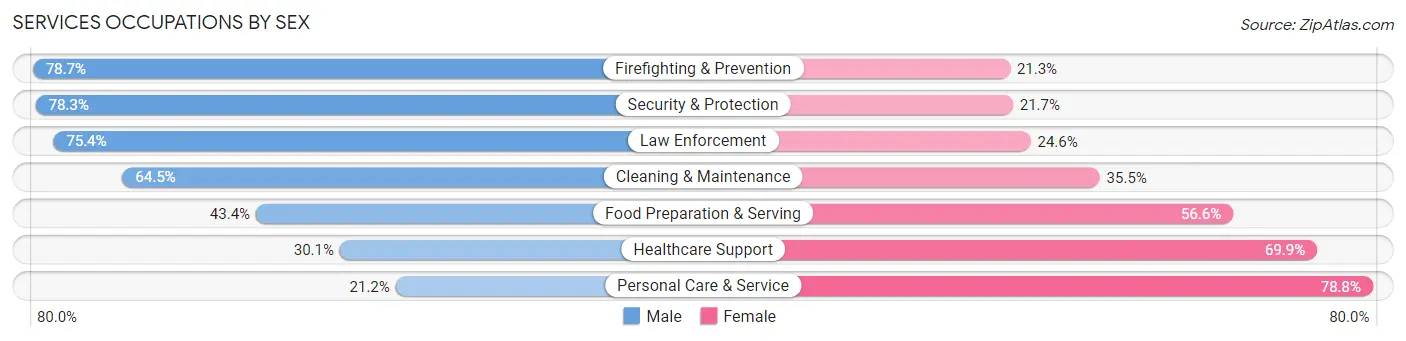
Services Occupations by Sex
Within the Services occupations in Berkeley, the most male-oriented occupations are Firefighting & Prevention (78.7%), Security & Protection (78.3%), and Law Enforcement (75.4%), while the most female-oriented occupations are Personal Care & Service (78.8%), Healthcare Support (69.9%), and Food Preparation & Serving (56.6%).
| Occupation | Male | Female |
| Healthcare Support | 344 (30.1%) | 800 (69.9%) |
| Security & Protection | 637 (78.3%) | 177 (21.7%) |
| Firefighting & Prevention | 551 (78.7%) | 149 (21.3%) |
| Law Enforcement | 86 (75.4%) | 28 (24.6%) |
| Food Preparation & Serving | 941 (43.4%) | 1,229 (56.6%) |
| Cleaning & Maintenance | 656 (64.5%) | 361 (35.5%) |
| Personal Care & Service | 335 (21.2%) | 1,243 (78.8%) |
| Total (Category) | 2,913 (43.3%) | 3,810 (56.7%) |
| Total (Overall) | 31,384 (50.5%) | 30,806 (49.5%) |
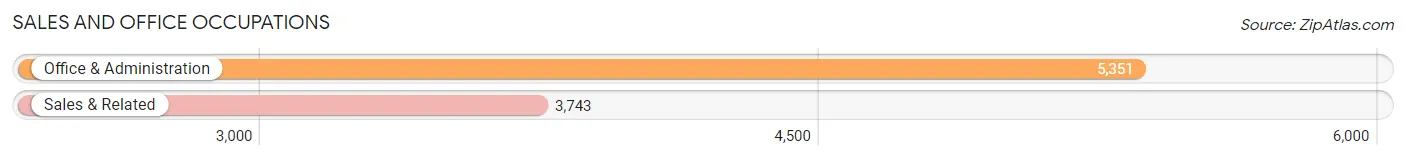
Sales and Office Occupations
The most common Sales and Office occupations in Berkeley are Office & Administration (5,351 | 8.6%), and Sales & Related (3,743 | 6.0%).
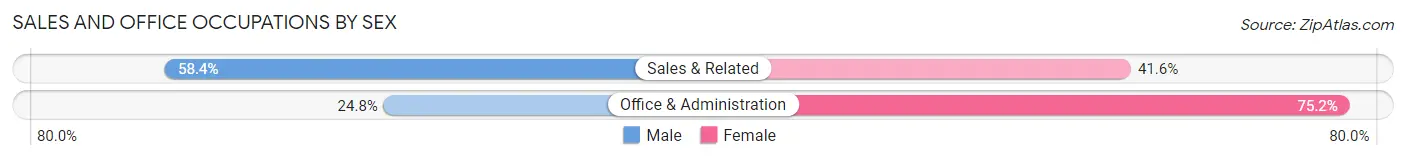
Sales and Office Occupations by Sex
| Occupation | Male | Female |
| Sales & Related | 2,185 (58.4%) | 1,558 (41.6%) |
| Office & Administration | 1,325 (24.8%) | 4,026 (75.2%) |
| Total (Category) | 3,510 (38.6%) | 5,584 (61.4%) |
| Total (Overall) | 31,384 (50.5%) | 30,806 (49.5%) |
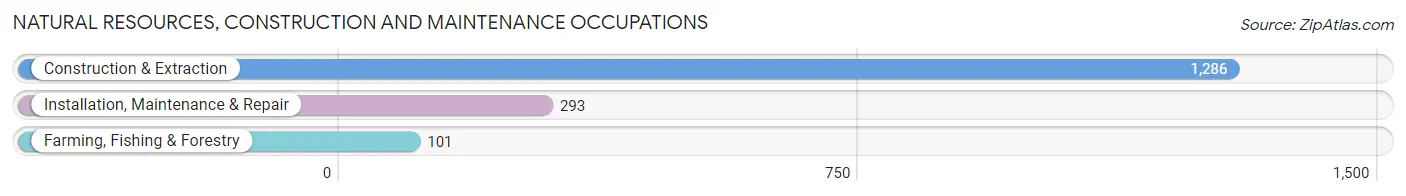
Natural Resources, Construction and Maintenance Occupations
The most common Natural Resources, Construction and Maintenance occupations in Berkeley are Construction & Extraction (1,286 | 2.1%), Installation, Maintenance & Repair (293 | 0.5%), and Farming, Fishing & Forestry (101 | 0.2%).
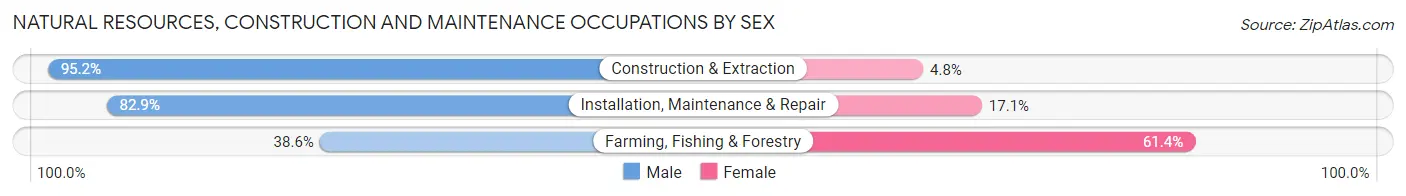
Natural Resources, Construction and Maintenance Occupations by Sex
| Occupation | Male | Female |
| Farming, Fishing & Forestry | 39 (38.6%) | 62 (61.4%) |
| Construction & Extraction | 1,224 (95.2%) | 62 (4.8%) |
| Installation, Maintenance & Repair | 243 (82.9%) | 50 (17.1%) |
| Total (Category) | 1,506 (89.6%) | 174 (10.4%) |
| Total (Overall) | 31,384 (50.5%) | 30,806 (49.5%) |
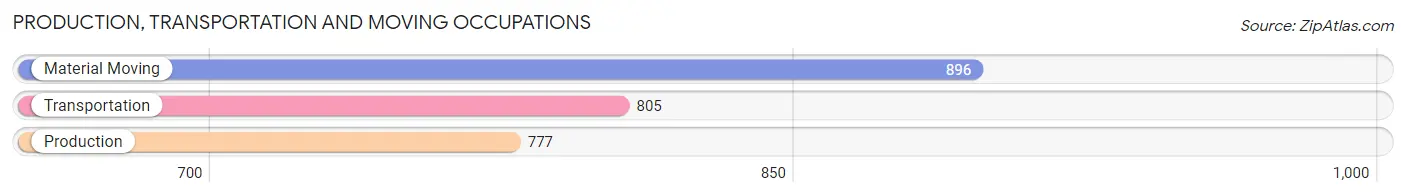
Production, Transportation and Moving Occupations
The most common Production, Transportation and Moving occupations in Berkeley are Material Moving (896 | 1.4%), Transportation (805 | 1.3%), and Production (777 | 1.3%).
Production, Transportation and Moving Occupations by Sex
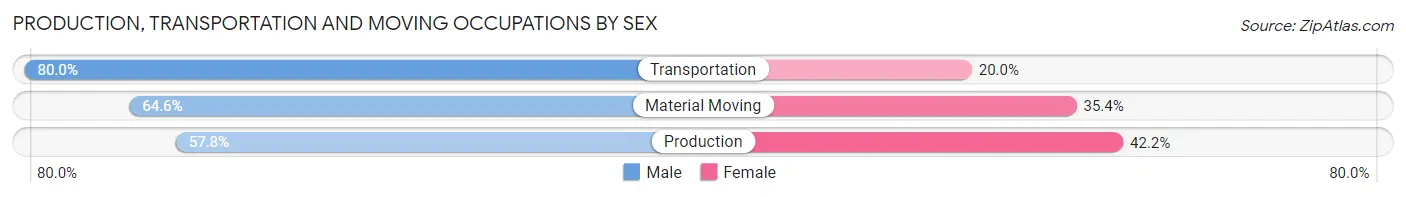
| Occupation | Male | Female |
| Production | 449 (57.8%) | 328 (42.2%) |
| Transportation | 644 (80.0%) | 161 (20.0%) |
| Material Moving | 579 (64.6%) | 317 (35.4%) |
| Total (Category) | 1,672 (67.5%) | 806 (32.5%) |
| Total (Overall) | 31,384 (50.5%) | 30,806 (49.5%) |
Employment Industries by Sex in Berkeley
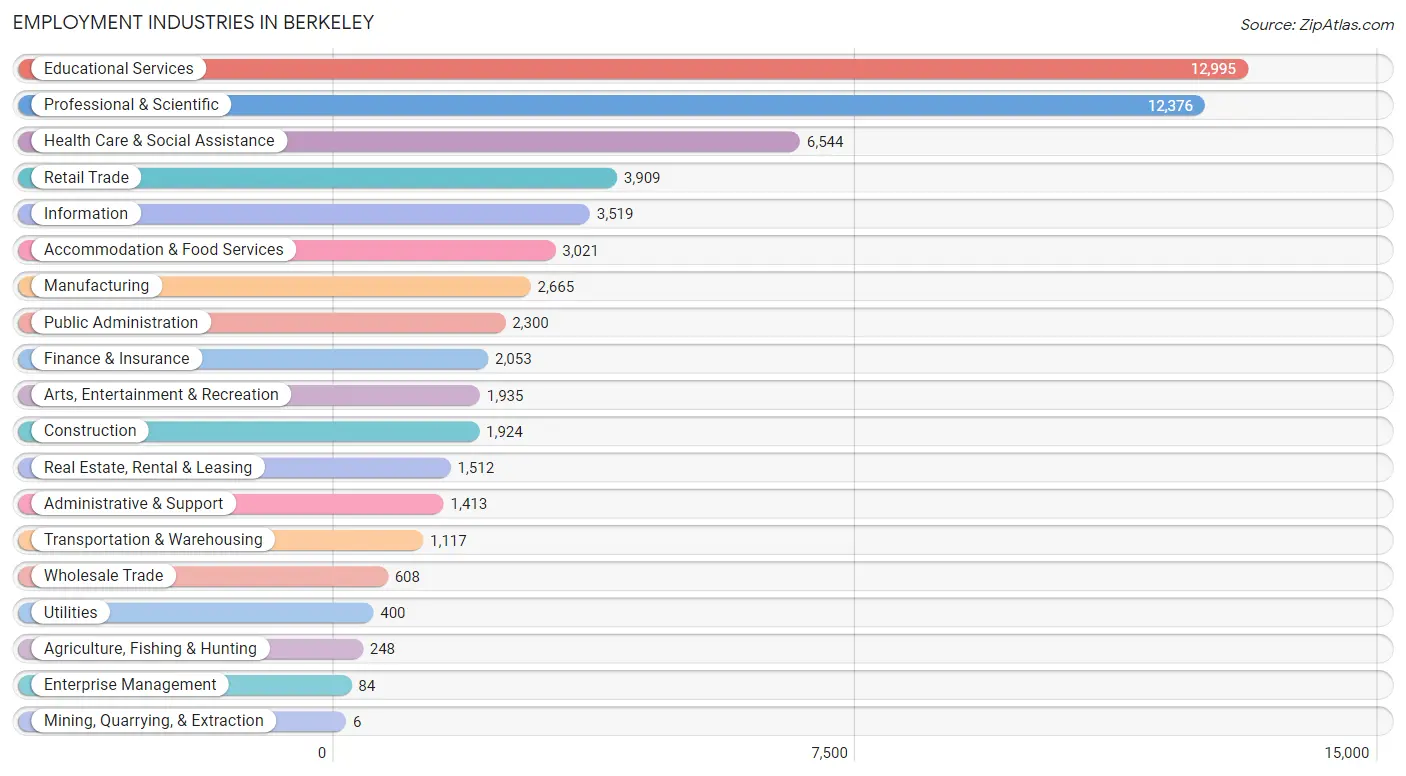
Employment Industries in Berkeley
The major employment industries in Berkeley include Educational Services (12,995 | 20.9%), Professional & Scientific (12,376 | 19.9%), Health Care & Social Assistance (6,544 | 10.5%), Retail Trade (3,909 | 6.3%), and Information (3,519 | 5.7%).
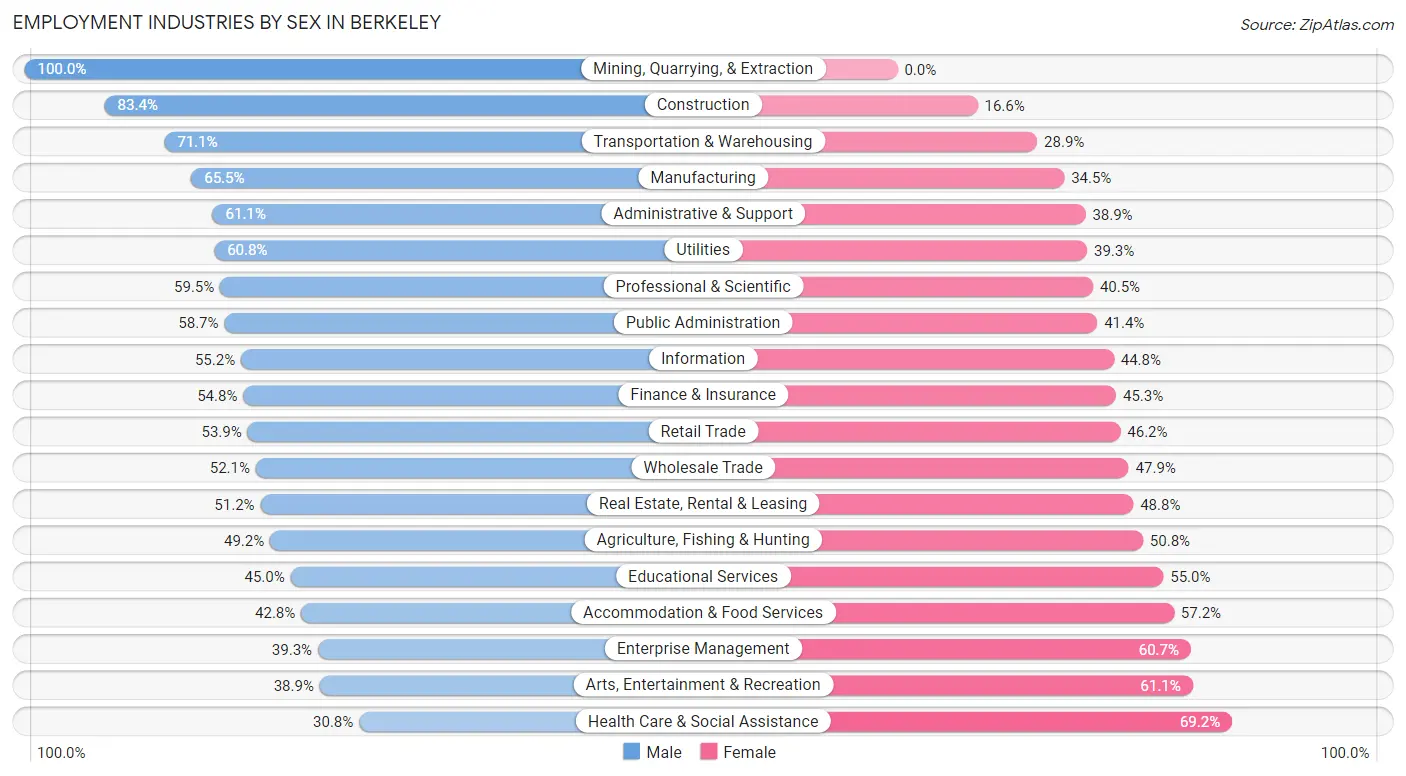
Employment Industries by Sex in Berkeley
The Berkeley industries that see more men than women are Mining, Quarrying, & Extraction (100.0%), Construction (83.4%), and Transportation & Warehousing (71.1%), whereas the industries that tend to have a higher number of women are Health Care & Social Assistance (69.2%), Arts, Entertainment & Recreation (61.1%), and Enterprise Management (60.7%).
| Industry | Male | Female |
| Agriculture, Fishing & Hunting | 122 (49.2%) | 126 (50.8%) |
| Mining, Quarrying, & Extraction | 6 (100.0%) | 0 (0.0%) |
| Construction | 1,605 (83.4%) | 319 (16.6%) |
| Manufacturing | 1,745 (65.5%) | 920 (34.5%) |
| Wholesale Trade | 317 (52.1%) | 291 (47.9%) |
| Retail Trade | 2,105 (53.8%) | 1,804 (46.2%) |
| Transportation & Warehousing | 794 (71.1%) | 323 (28.9%) |
| Utilities | 243 (60.8%) | 157 (39.3%) |
| Information | 1,943 (55.2%) | 1,576 (44.8%) |
| Finance & Insurance | 1,124 (54.7%) | 929 (45.3%) |
| Real Estate, Rental & Leasing | 774 (51.2%) | 738 (48.8%) |
| Professional & Scientific | 7,367 (59.5%) | 5,009 (40.5%) |
| Enterprise Management | 33 (39.3%) | 51 (60.7%) |
| Administrative & Support | 863 (61.1%) | 550 (38.9%) |
| Educational Services | 5,843 (45.0%) | 7,152 (55.0%) |
| Health Care & Social Assistance | 2,013 (30.8%) | 4,531 (69.2%) |
| Arts, Entertainment & Recreation | 753 (38.9%) | 1,182 (61.1%) |
| Accommodation & Food Services | 1,292 (42.8%) | 1,729 (57.2%) |
| Public Administration | 1,349 (58.7%) | 951 (41.3%) |
| Total | 31,384 (50.5%) | 30,806 (49.5%) |
Education in Berkeley
School Enrollment in Berkeley
The most common levels of schooling among the 45,047 students in Berkeley are college / undergraduate (25,880 | 57.5%), graduate / professional (7,225 | 16.0%), and high school (3,615 | 8.0%).
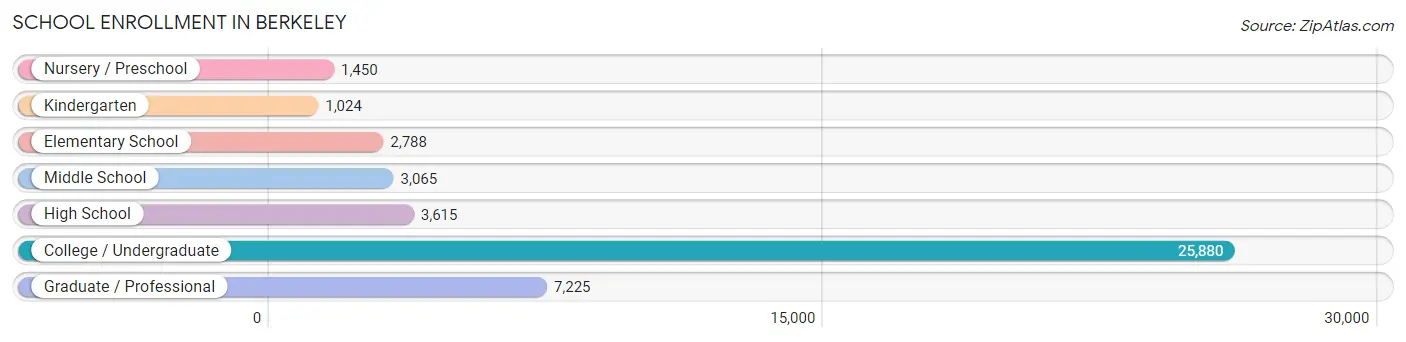
| School Level | # Students | % Students |
| Nursery / Preschool | 1,450 | 3.2% |
| Kindergarten | 1,024 | 2.3% |
| Elementary School | 2,788 | 6.2% |
| Middle School | 3,065 | 6.8% |
| High School | 3,615 | 8.0% |
| College / Undergraduate | 25,880 | 57.5% |
| Graduate / Professional | 7,225 | 16.0% |
| Total | 45,047 | 100.0% |
School Enrollment by Age by Funding Source in Berkeley
Out of a total of 45,047 students who are enrolled in schools in Berkeley, 5,406 (12.0%) attend a private institution, while the remaining 39,641 (88.0%) are enrolled in public schools. The age group of 3 to 4 year olds has the highest likelihood of being enrolled in private schools, with 844 (72.5% in the age bracket) enrolled. Conversely, the age group of 18 to 19 year olds has the lowest likelihood of being enrolled in a private school, with 9,483 (97.1% in the age bracket) attending a public institution.
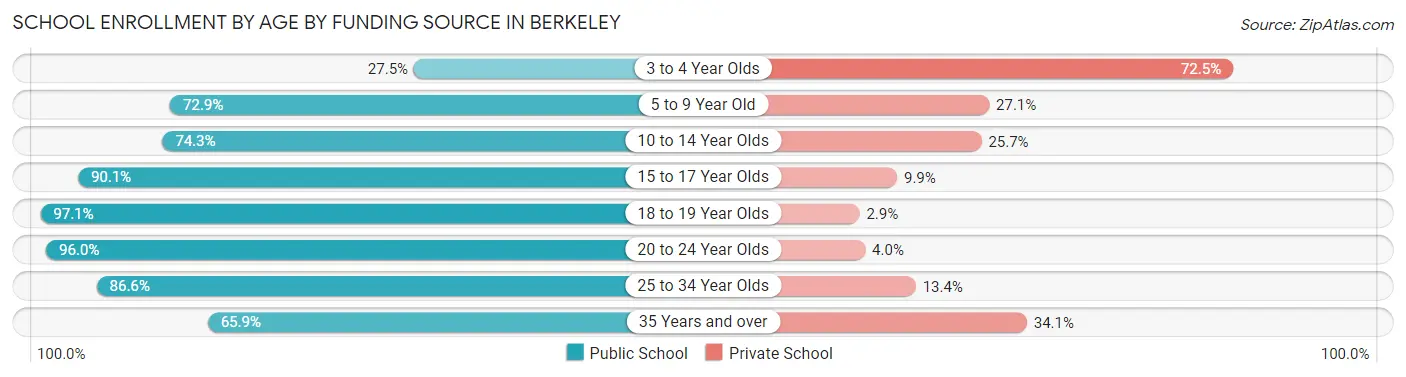
| Age Bracket | Public School | Private School |
| 3 to 4 Year Olds | 320 (27.5%) | 844 (72.5%) |
| 5 to 9 Year Old | 2,686 (72.9%) | 998 (27.1%) |
| 10 to 14 Year Olds | 2,978 (74.3%) | 1,028 (25.7%) |
| 15 to 17 Year Olds | 2,708 (90.1%) | 299 (9.9%) |
| 18 to 19 Year Olds | 9,483 (97.1%) | 287 (2.9%) |
| 20 to 24 Year Olds | 15,562 (96.0%) | 648 (4.0%) |
| 25 to 34 Year Olds | 4,795 (86.6%) | 743 (13.4%) |
| 35 Years and over | 1,099 (65.9%) | 569 (34.1%) |
| Total | 39,641 (88.0%) | 5,406 (12.0%) |
Educational Attainment by Field of Study in Berkeley
Social sciences (10,838 | 17.2%), bio, nature & agricultural (6,190 | 9.8%), literature & languages (6,026 | 9.6%), engineering (5,367 | 8.5%), and liberal arts & history (4,999 | 8.0%) are the most common fields of study among 62,920 individuals in Berkeley who have obtained a bachelor's degree or higher.
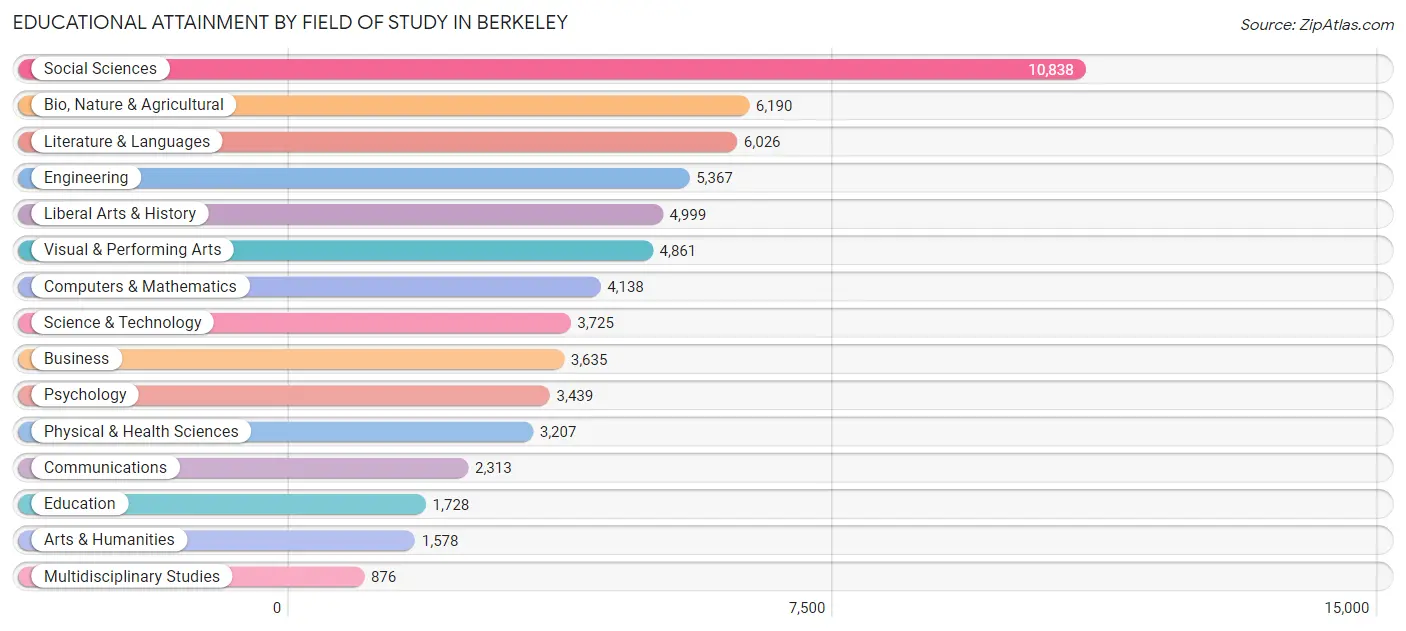
| Field of Study | # Graduates | % Graduates |
| Computers & Mathematics | 4,138 | 6.6% |
| Bio, Nature & Agricultural | 6,190 | 9.8% |
| Physical & Health Sciences | 3,207 | 5.1% |
| Psychology | 3,439 | 5.5% |
| Social Sciences | 10,838 | 17.2% |
| Engineering | 5,367 | 8.5% |
| Multidisciplinary Studies | 876 | 1.4% |
| Science & Technology | 3,725 | 5.9% |
| Business | 3,635 | 5.8% |
| Education | 1,728 | 2.8% |
| Literature & Languages | 6,026 | 9.6% |
| Liberal Arts & History | 4,999 | 8.0% |
| Visual & Performing Arts | 4,861 | 7.7% |
| Communications | 2,313 | 3.7% |
| Arts & Humanities | 1,578 | 2.5% |
| Total | 62,920 | 100.0% |
Transportation & Commute in Berkeley
Vehicle Availability by Sex in Berkeley
The most prevalent vehicle ownership categories in Berkeley are males with 2 vehicles (10,292, accounting for 34.9%) and females with 2 vehicles (8,900, making up 37.5%).
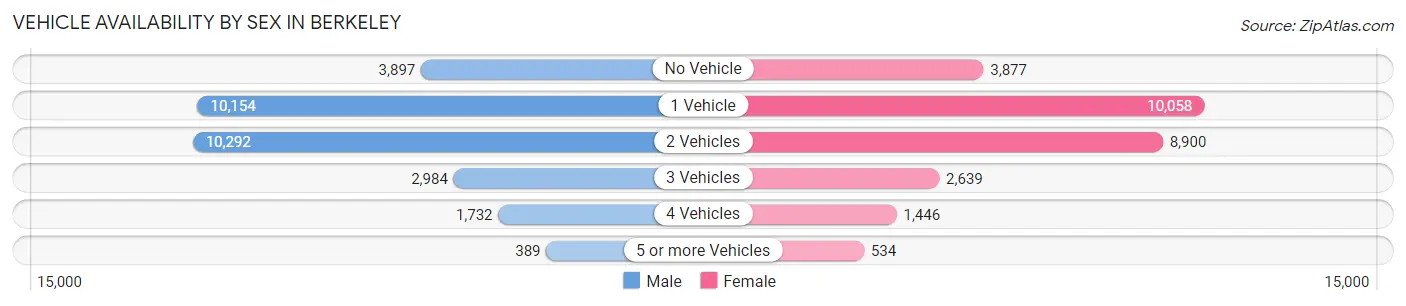
| Vehicles Available | Male | Female |
| No Vehicle | 3,897 (13.2%) | 3,877 (14.1%) |
| 1 Vehicle | 10,154 (34.5%) | 10,058 (36.6%) |
| 2 Vehicles | 10,292 (34.9%) | 8,900 (32.4%) |
| 3 Vehicles | 2,984 (10.1%) | 2,639 (9.6%) |
| 4 Vehicles | 1,732 (5.9%) | 1,446 (5.3%) |
| 5 or more Vehicles | 389 (1.3%) | 534 (1.9%) |
| Total | 29,448 (100.0%) | 27,454 (100.0%) |
Commute Time in Berkeley
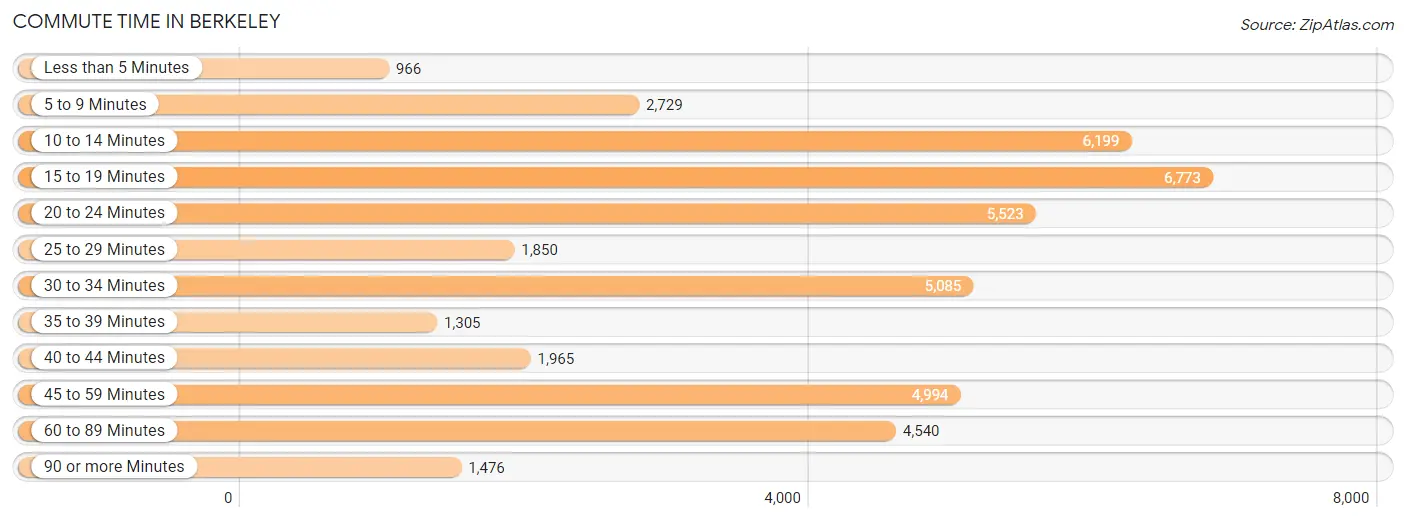
The most frequently occuring commute durations in Berkeley are 15 to 19 minutes (6,773 commuters, 15.6%), 10 to 14 minutes (6,199 commuters, 14.3%), and 20 to 24 minutes (5,523 commuters, 12.7%).
| Commute Time | # Commuters | % Commuters |
| Less than 5 Minutes | 966 | 2.2% |
| 5 to 9 Minutes | 2,729 | 6.3% |
| 10 to 14 Minutes | 6,199 | 14.3% |
| 15 to 19 Minutes | 6,773 | 15.6% |
| 20 to 24 Minutes | 5,523 | 12.7% |
| 25 to 29 Minutes | 1,850 | 4.3% |
| 30 to 34 Minutes | 5,085 | 11.7% |
| 35 to 39 Minutes | 1,305 | 3.0% |
| 40 to 44 Minutes | 1,965 | 4.5% |
| 45 to 59 Minutes | 4,994 | 11.5% |
| 60 to 89 Minutes | 4,540 | 10.5% |
| 90 or more Minutes | 1,476 | 3.4% |
Commute Time by Sex in Berkeley
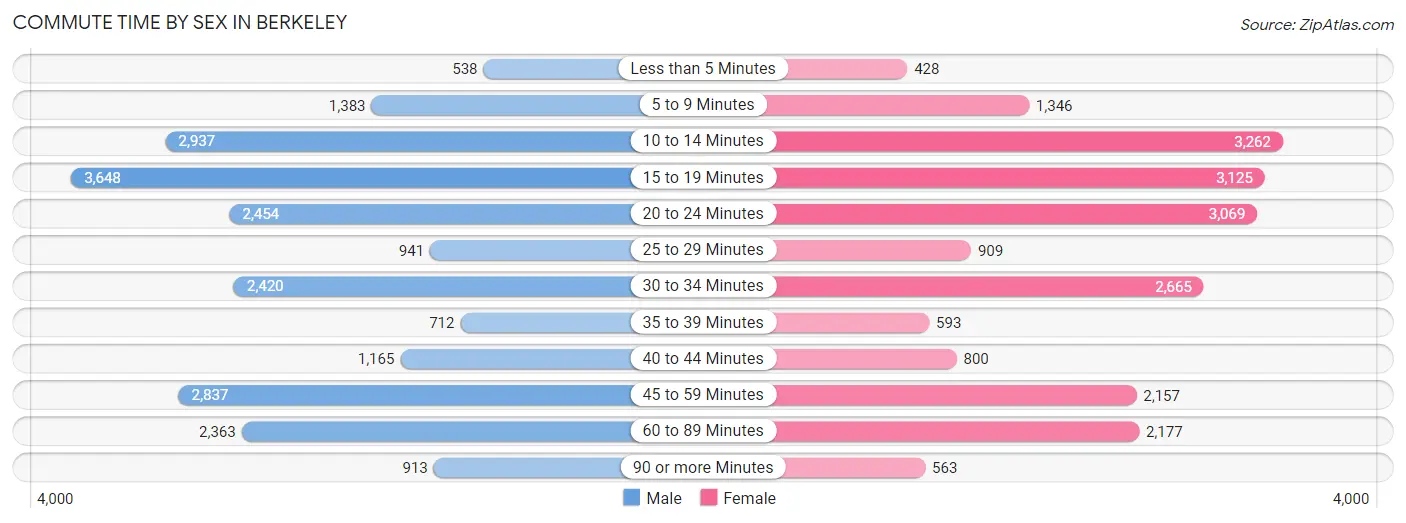
The most common commute times in Berkeley are 15 to 19 minutes (3,648 commuters, 16.4%) for males and 10 to 14 minutes (3,262 commuters, 15.5%) for females.
| Commute Time | Male | Female |
| Less than 5 Minutes | 538 (2.4%) | 428 (2.0%) |
| 5 to 9 Minutes | 1,383 (6.2%) | 1,346 (6.4%) |
| 10 to 14 Minutes | 2,937 (13.2%) | 3,262 (15.5%) |
| 15 to 19 Minutes | 3,648 (16.4%) | 3,125 (14.8%) |
| 20 to 24 Minutes | 2,454 (11.0%) | 3,069 (14.5%) |
| 25 to 29 Minutes | 941 (4.2%) | 909 (4.3%) |
| 30 to 34 Minutes | 2,420 (10.8%) | 2,665 (12.6%) |
| 35 to 39 Minutes | 712 (3.2%) | 593 (2.8%) |
| 40 to 44 Minutes | 1,165 (5.2%) | 800 (3.8%) |
| 45 to 59 Minutes | 2,837 (12.7%) | 2,157 (10.2%) |
| 60 to 89 Minutes | 2,363 (10.6%) | 2,177 (10.3%) |
| 90 or more Minutes | 913 (4.1%) | 563 (2.7%) |
Time of Departure to Work by Sex in Berkeley
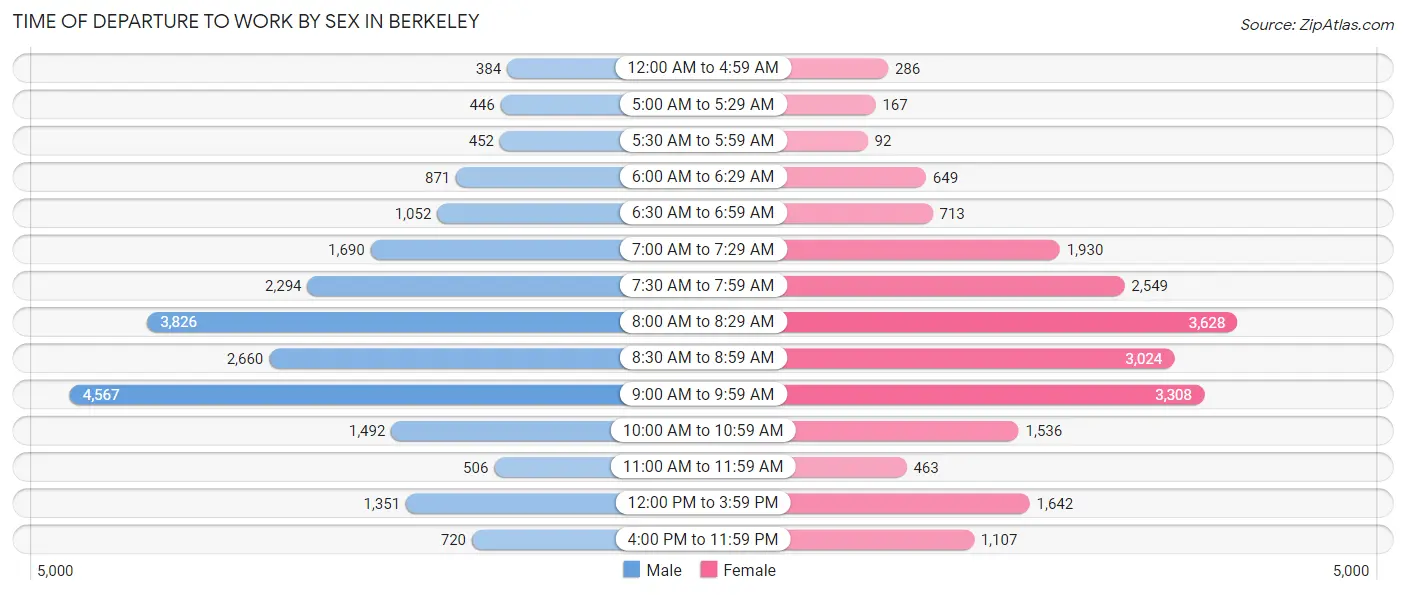
The most frequent times of departure to work in Berkeley are 9:00 AM to 9:59 AM (4,567, 20.5%) for males and 8:00 AM to 8:29 AM (3,628, 17.2%) for females.
| Time of Departure | Male | Female |
| 12:00 AM to 4:59 AM | 384 (1.7%) | 286 (1.4%) |
| 5:00 AM to 5:29 AM | 446 (2.0%) | 167 (0.8%) |
| 5:30 AM to 5:59 AM | 452 (2.0%) | 92 (0.4%) |
| 6:00 AM to 6:29 AM | 871 (3.9%) | 649 (3.1%) |
| 6:30 AM to 6:59 AM | 1,052 (4.7%) | 713 (3.4%) |
| 7:00 AM to 7:29 AM | 1,690 (7.6%) | 1,930 (9.1%) |
| 7:30 AM to 7:59 AM | 2,294 (10.3%) | 2,549 (12.1%) |
| 8:00 AM to 8:29 AM | 3,826 (17.2%) | 3,628 (17.2%) |
| 8:30 AM to 8:59 AM | 2,660 (11.9%) | 3,024 (14.3%) |
| 9:00 AM to 9:59 AM | 4,567 (20.5%) | 3,308 (15.7%) |
| 10:00 AM to 10:59 AM | 1,492 (6.7%) | 1,536 (7.3%) |
| 11:00 AM to 11:59 AM | 506 (2.3%) | 463 (2.2%) |
| 12:00 PM to 3:59 PM | 1,351 (6.1%) | 1,642 (7.8%) |
| 4:00 PM to 11:59 PM | 720 (3.2%) | 1,107 (5.2%) |
| Total | 22,311 (100.0%) | 21,094 (100.0%) |
Housing Occupancy in Berkeley
Occupancy by Ownership in Berkeley
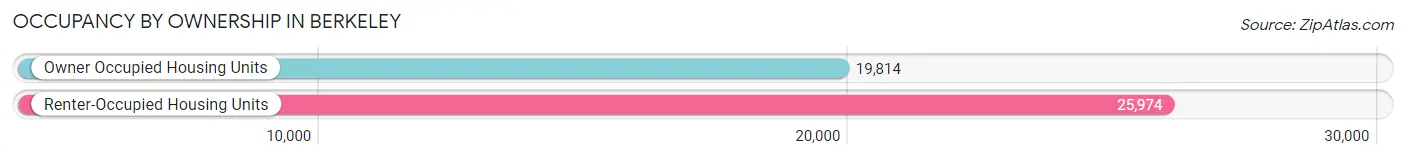
Of the total 45,788 dwellings in Berkeley, owner-occupied units account for 19,814 (43.3%), while renter-occupied units make up 25,974 (56.7%).
| Occupancy | # Housing Units | % Housing Units |
| Owner Occupied Housing Units | 19,814 | 43.3% |
| Renter-Occupied Housing Units | 25,974 | 56.7% |
| Total Occupied Housing Units | 45,788 | 100.0% |
Occupancy by Household Size in Berkeley
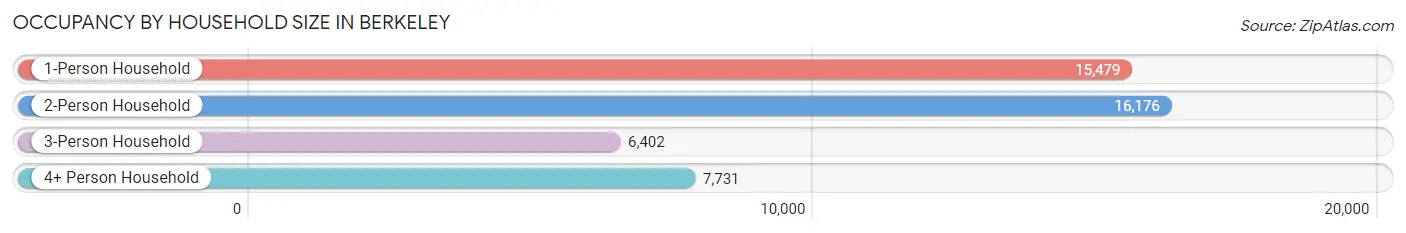
| Household Size | # Housing Units | % Housing Units |
| 1-Person Household | 15,479 | 33.8% |
| 2-Person Household | 16,176 | 35.3% |
| 3-Person Household | 6,402 | 14.0% |
| 4+ Person Household | 7,731 | 16.9% |
| Total Housing Units | 45,788 | 100.0% |
Occupancy by Ownership by Household Size in Berkeley
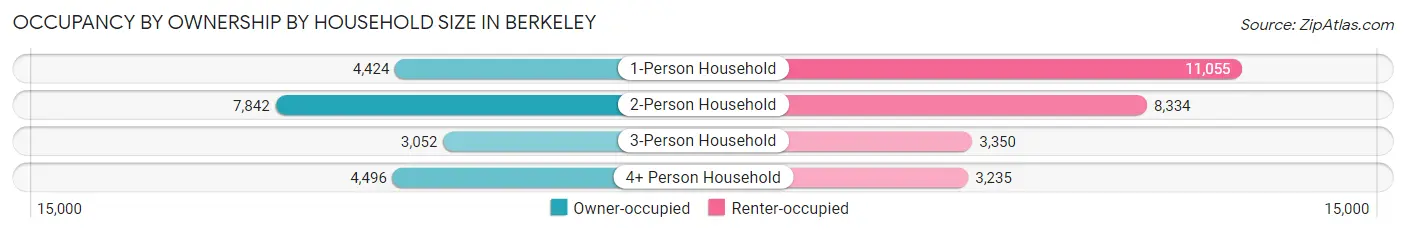
| Household Size | Owner-occupied | Renter-occupied |
| 1-Person Household | 4,424 (28.6%) | 11,055 (71.4%) |
| 2-Person Household | 7,842 (48.5%) | 8,334 (51.5%) |
| 3-Person Household | 3,052 (47.7%) | 3,350 (52.3%) |
| 4+ Person Household | 4,496 (58.2%) | 3,235 (41.8%) |
| Total Housing Units | 19,814 (43.3%) | 25,974 (56.7%) |
Occupancy by Educational Attainment in Berkeley
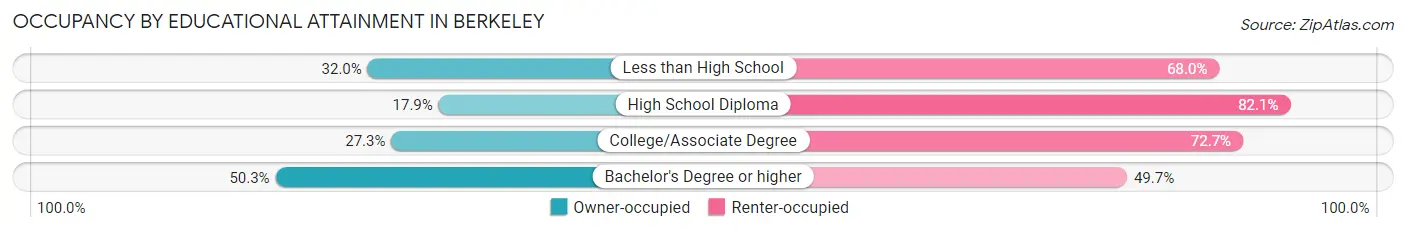
| Household Size | Owner-occupied | Renter-occupied |
| Less than High School | 412 (32.0%) | 876 (68.0%) |
| High School Diploma | 548 (17.9%) | 2,511 (82.1%) |
| College/Associate Degree | 2,353 (27.3%) | 6,266 (72.7%) |
| Bachelor's Degree or higher | 16,501 (50.3%) | 16,321 (49.7%) |
Occupancy by Age of Householder in Berkeley
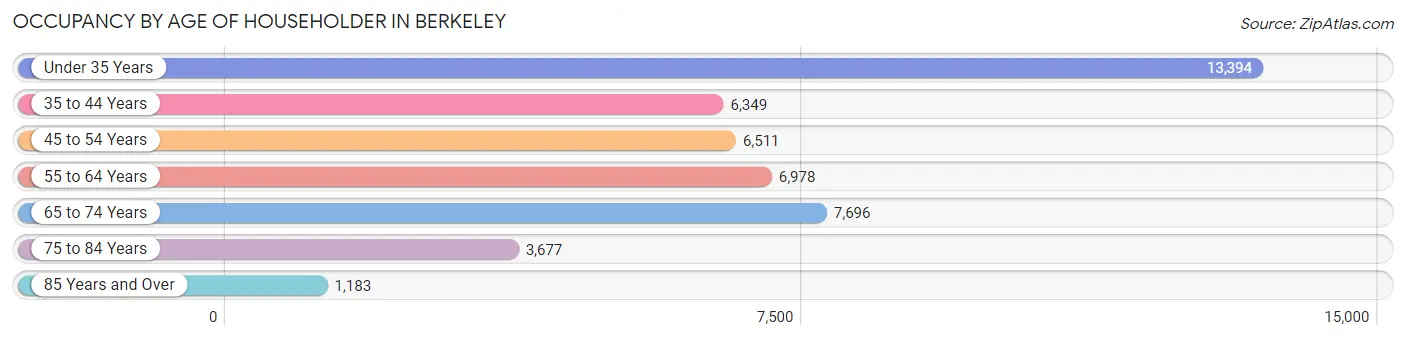
| Age Bracket | # Households | % Households |
| Under 35 Years | 13,394 | 29.2% |
| 35 to 44 Years | 6,349 | 13.9% |
| 45 to 54 Years | 6,511 | 14.2% |
| 55 to 64 Years | 6,978 | 15.2% |
| 65 to 74 Years | 7,696 | 16.8% |
| 75 to 84 Years | 3,677 | 8.0% |
| 85 Years and Over | 1,183 | 2.6% |
| Total | 45,788 | 100.0% |
Housing Finances in Berkeley
Median Income by Occupancy in Berkeley
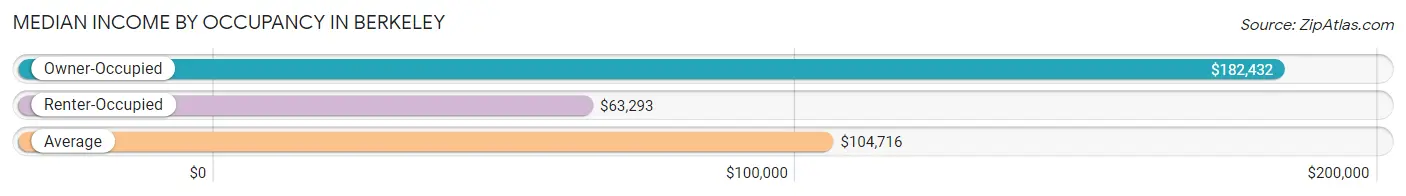
| Occupancy Type | # Households | Median Income |
| Owner-Occupied | 19,814 (43.3%) | $182,432 |
| Renter-Occupied | 25,974 (56.7%) | $63,293 |
| Average | 45,788 (100.0%) | $104,716 |
Occupancy by Householder Income Bracket in Berkeley
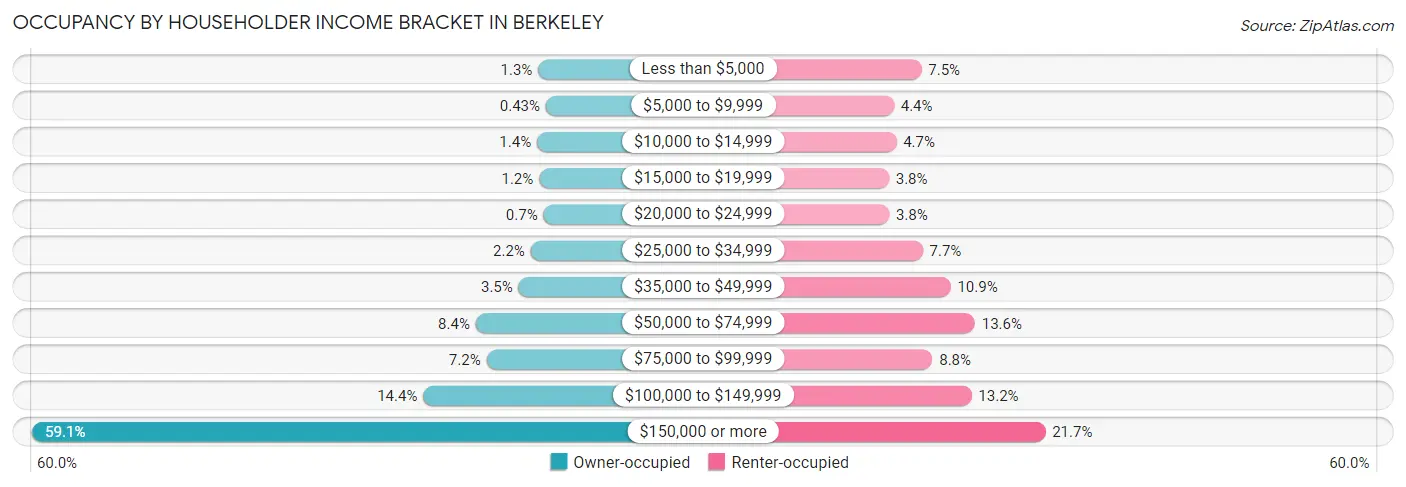
| Income Bracket | Owner-occupied | Renter-occupied |
| Less than $5,000 | 260 (1.3%) | 1,954 (7.5%) |
| $5,000 to $9,999 | 86 (0.4%) | 1,136 (4.4%) |
| $10,000 to $14,999 | 286 (1.4%) | 1,209 (4.6%) |
| $15,000 to $19,999 | 237 (1.2%) | 987 (3.8%) |
| $20,000 to $24,999 | 138 (0.7%) | 993 (3.8%) |
| $25,000 to $34,999 | 428 (2.2%) | 1,990 (7.7%) |
| $35,000 to $49,999 | 701 (3.5%) | 2,817 (10.8%) |
| $50,000 to $74,999 | 1,672 (8.4%) | 3,540 (13.6%) |
| $75,000 to $99,999 | 1,429 (7.2%) | 2,277 (8.8%) |
| $100,000 to $149,999 | 2,861 (14.4%) | 3,439 (13.2%) |
| $150,000 or more | 11,716 (59.1%) | 5,632 (21.7%) |
| Total | 19,814 (100.0%) | 25,974 (100.0%) |
Monthly Housing Cost Tiers in Berkeley
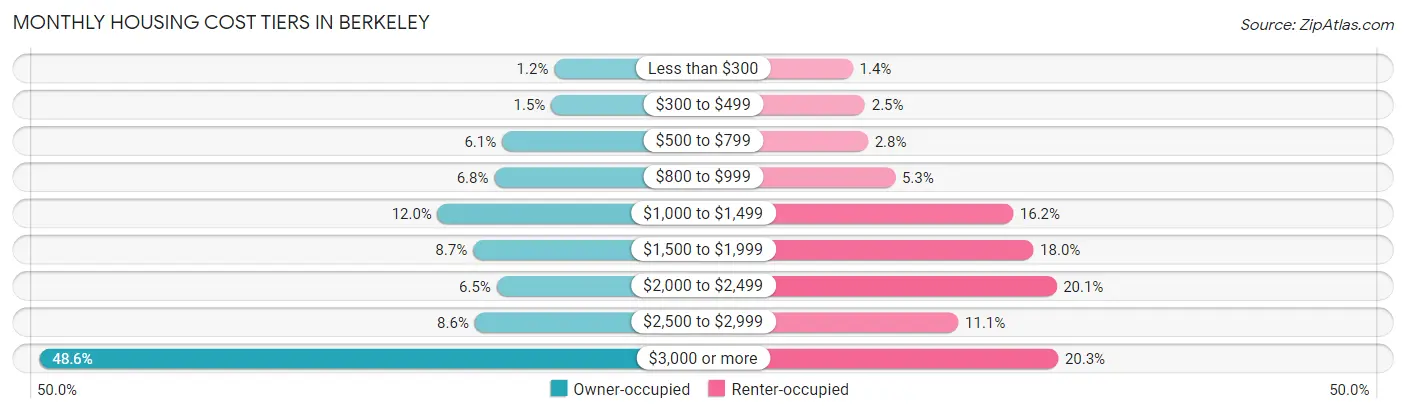
| Monthly Cost | Owner-occupied | Renter-occupied |
| Less than $300 | 245 (1.2%) | 363 (1.4%) |
| $300 to $499 | 302 (1.5%) | 654 (2.5%) |
| $500 to $799 | 1,198 (6.0%) | 725 (2.8%) |
| $800 to $999 | 1,340 (6.8%) | 1,376 (5.3%) |
| $1,000 to $1,499 | 2,372 (12.0%) | 4,196 (16.2%) |
| $1,500 to $1,999 | 1,728 (8.7%) | 4,681 (18.0%) |
| $2,000 to $2,499 | 1,295 (6.5%) | 5,230 (20.1%) |
| $2,500 to $2,999 | 1,697 (8.6%) | 2,886 (11.1%) |
| $3,000 or more | 9,637 (48.6%) | 5,272 (20.3%) |
| Total | 19,814 (100.0%) | 25,974 (100.0%) |
Physical Housing Characteristics in Berkeley
Housing Structures in Berkeley
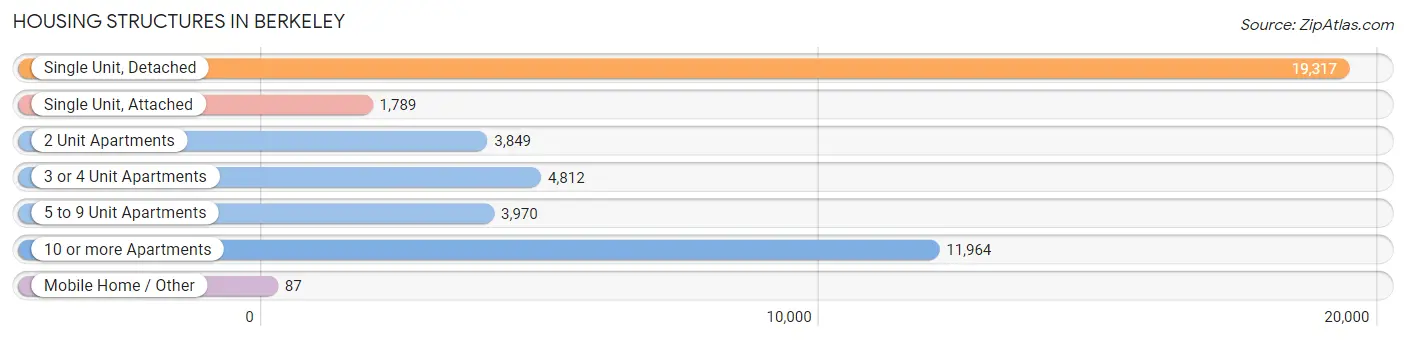
| Structure Type | # Housing Units | % Housing Units |
| Single Unit, Detached | 19,317 | 42.2% |
| Single Unit, Attached | 1,789 | 3.9% |
| 2 Unit Apartments | 3,849 | 8.4% |
| 3 or 4 Unit Apartments | 4,812 | 10.5% |
| 5 to 9 Unit Apartments | 3,970 | 8.7% |
| 10 or more Apartments | 11,964 | 26.1% |
| Mobile Home / Other | 87 | 0.2% |
| Total | 45,788 | 100.0% |
Housing Structures by Occupancy in Berkeley
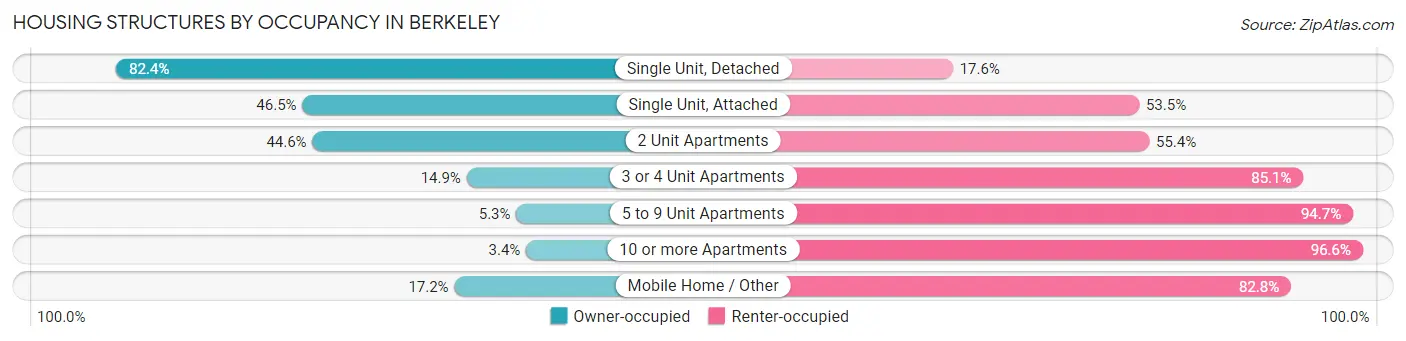
| Structure Type | Owner-occupied | Renter-occupied |
| Single Unit, Detached | 15,914 (82.4%) | 3,403 (17.6%) |
| Single Unit, Attached | 832 (46.5%) | 957 (53.5%) |
| 2 Unit Apartments | 1,716 (44.6%) | 2,133 (55.4%) |
| 3 or 4 Unit Apartments | 716 (14.9%) | 4,096 (85.1%) |
| 5 to 9 Unit Apartments | 211 (5.3%) | 3,759 (94.7%) |
| 10 or more Apartments | 410 (3.4%) | 11,554 (96.6%) |
| Mobile Home / Other | 15 (17.2%) | 72 (82.8%) |
| Total | 19,814 (43.3%) | 25,974 (56.7%) |
Housing Structures by Number of Rooms in Berkeley
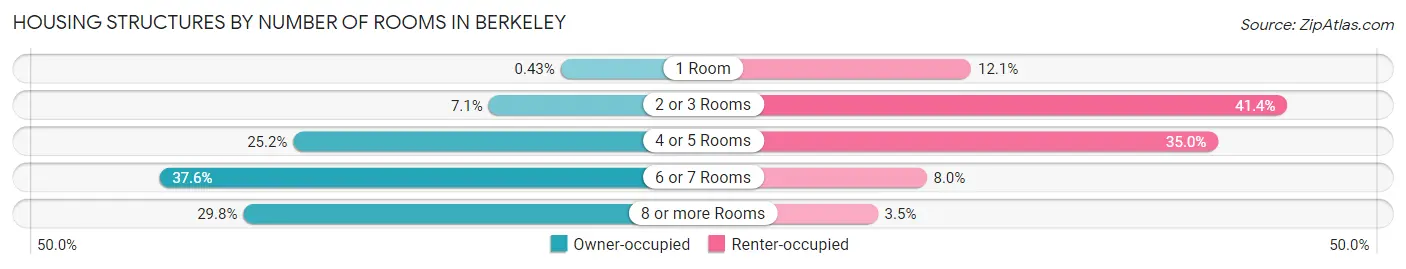
| Number of Rooms | Owner-occupied | Renter-occupied |
| 1 Room | 85 (0.4%) | 3,151 (12.1%) |
| 2 or 3 Rooms | 1,404 (7.1%) | 10,749 (41.4%) |
| 4 or 5 Rooms | 4,985 (25.2%) | 9,087 (35.0%) |
| 6 or 7 Rooms | 7,440 (37.6%) | 2,081 (8.0%) |
| 8 or more Rooms | 5,900 (29.8%) | 906 (3.5%) |
| Total | 19,814 (100.0%) | 25,974 (100.0%) |
Housing Structure by Heating Type in Berkeley
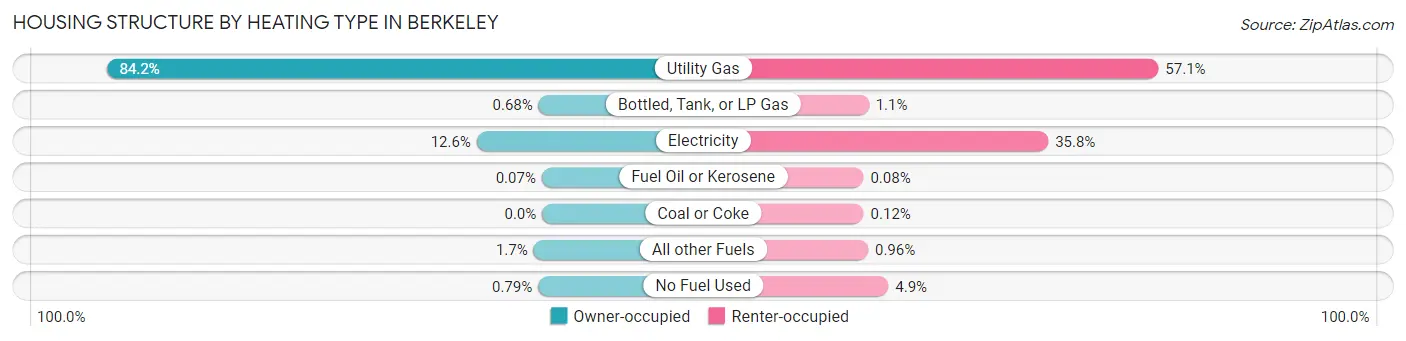
| Heating Type | Owner-occupied | Renter-occupied |
| Utility Gas | 16,679 (84.2%) | 14,823 (57.1%) |
| Bottled, Tank, or LP Gas | 134 (0.7%) | 286 (1.1%) |
| Electricity | 2,504 (12.6%) | 9,294 (35.8%) |
| Fuel Oil or Kerosene | 13 (0.1%) | 21 (0.1%) |
| Coal or Coke | 0 (0.0%) | 31 (0.1%) |
| All other Fuels | 327 (1.7%) | 249 (1.0%) |
| No Fuel Used | 157 (0.8%) | 1,270 (4.9%) |
| Total | 19,814 (100.0%) | 25,974 (100.0%) |
Household Vehicle Usage in Berkeley
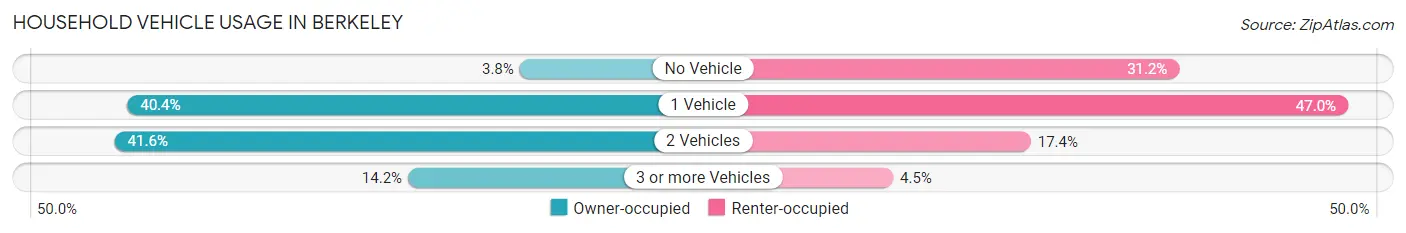
| Vehicles per Household | Owner-occupied | Renter-occupied |
| No Vehicle | 750 (3.8%) | 8,104 (31.2%) |
| 1 Vehicle | 8,006 (40.4%) | 12,196 (46.9%) |
| 2 Vehicles | 8,241 (41.6%) | 4,506 (17.3%) |
| 3 or more Vehicles | 2,817 (14.2%) | 1,168 (4.5%) |
| Total | 19,814 (100.0%) | 25,974 (100.0%) |
Real Estate & Mortgages in Berkeley
Real Estate and Mortgage Overview in Berkeley
| Characteristic | Without Mortgage | With Mortgage |
| Housing Units | 6,746 | 13,068 |
| Median Property Value | $1,191,500 | $1,335,700 |
| Median Household Income | $124,563 | $8,755 |
| Monthly Housing Costs | $1,100 | $9,350 |
| Real Estate Taxes | $6,980 | $125 |
Property Value by Mortgage Status in Berkeley
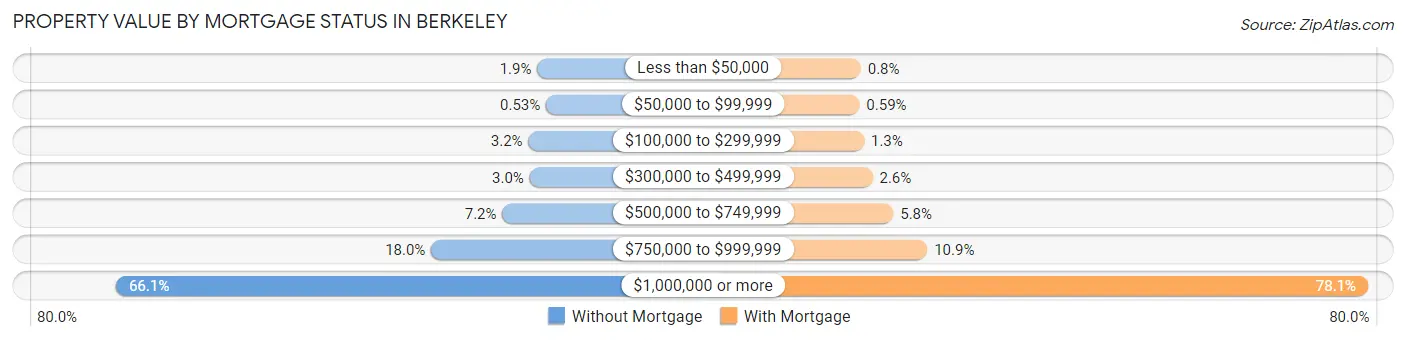
| Property Value | Without Mortgage | With Mortgage |
| Less than $50,000 | 127 (1.9%) | 104 (0.8%) |
| $50,000 to $99,999 | 36 (0.5%) | 77 (0.6%) |
| $100,000 to $299,999 | 218 (3.2%) | 168 (1.3%) |
| $300,000 to $499,999 | 205 (3.0%) | 339 (2.6%) |
| $500,000 to $749,999 | 486 (7.2%) | 751 (5.8%) |
| $750,000 to $999,999 | 1,217 (18.0%) | 1,427 (10.9%) |
| $1,000,000 or more | 4,457 (66.1%) | 10,202 (78.1%) |
| Total | 6,746 (100.0%) | 13,068 (100.0%) |
Household Income by Mortgage Status in Berkeley
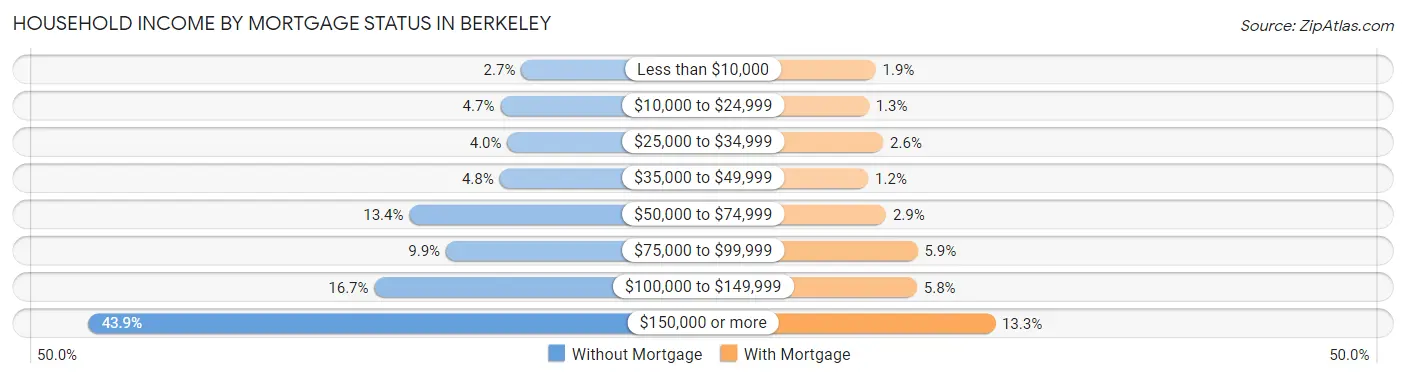
| Household Income | Without Mortgage | With Mortgage |
| Less than $10,000 | 182 (2.7%) | 249 (1.9%) |
| $10,000 to $24,999 | 317 (4.7%) | 164 (1.3%) |
| $25,000 to $34,999 | 271 (4.0%) | 344 (2.6%) |
| $35,000 to $49,999 | 322 (4.8%) | 157 (1.2%) |
| $50,000 to $74,999 | 901 (13.4%) | 379 (2.9%) |
| $75,000 to $99,999 | 666 (9.9%) | 771 (5.9%) |
| $100,000 to $149,999 | 1,126 (16.7%) | 763 (5.8%) |
| $150,000 or more | 2,961 (43.9%) | 1,735 (13.3%) |
| Total | 6,746 (100.0%) | 13,068 (100.0%) |
Property Value to Household Income Ratio in Berkeley
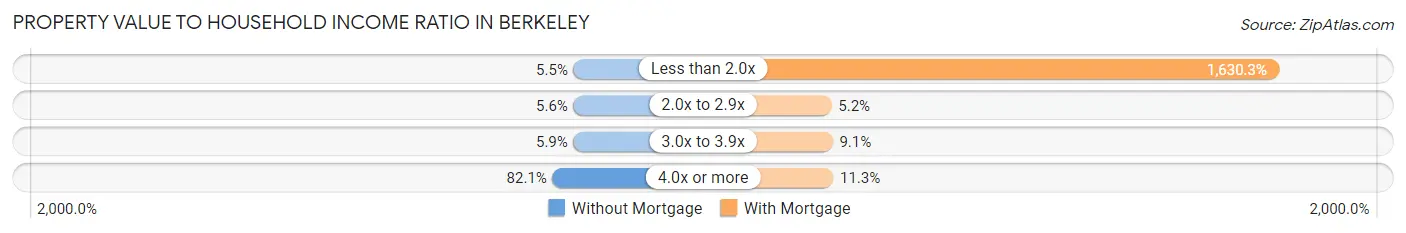
| Value-to-Income Ratio | Without Mortgage | With Mortgage |
| Less than 2.0x | 368 (5.5%) | 213,052 (1,630.3%) |
| 2.0x to 2.9x | 376 (5.6%) | 680 (5.2%) |
| 3.0x to 3.9x | 395 (5.9%) | 1,191 (9.1%) |
| 4.0x or more | 5,535 (82.1%) | 1,472 (11.3%) |
| Total | 6,746 (100.0%) | 13,068 (100.0%) |
Real Estate Taxes by Mortgage Status in Berkeley
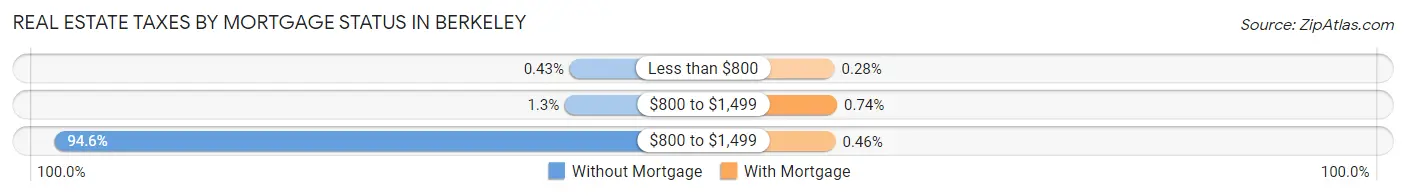
| Property Taxes | Without Mortgage | With Mortgage |
| Less than $800 | 29 (0.4%) | 36 (0.3%) |
| $800 to $1,499 | 87 (1.3%) | 97 (0.7%) |
| $800 to $1,499 | 6,379 (94.6%) | 60 (0.5%) |
| Total | 6,746 (100.0%) | 13,068 (100.0%) |
Health & Disability in Berkeley
Health Insurance Coverage by Age in Berkeley
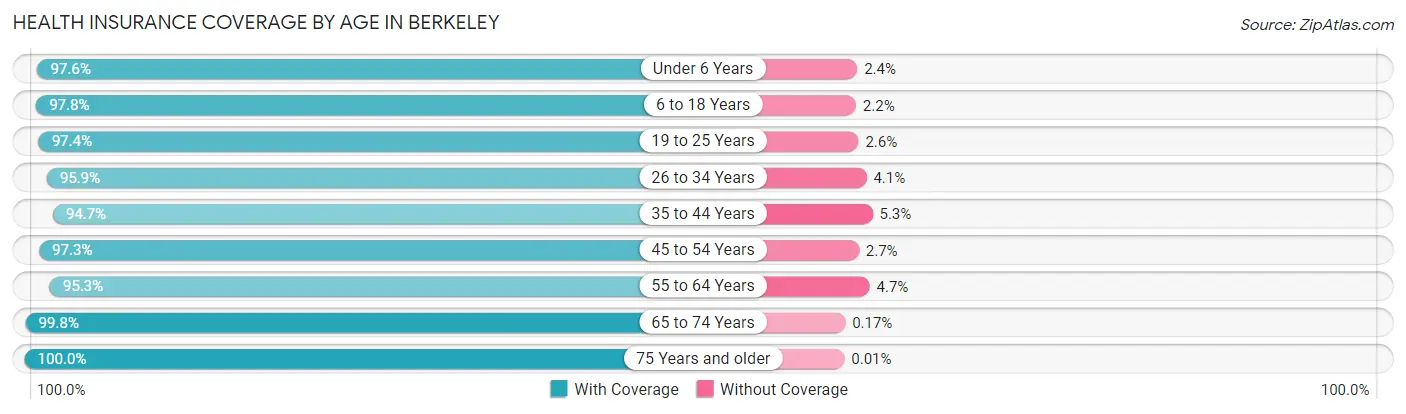
| Age Bracket | With Coverage | Without Coverage |
| Under 6 Years | 4,655 (97.6%) | 115 (2.4%) |
| 6 to 18 Years | 14,550 (97.8%) | 322 (2.2%) |
| 19 to 25 Years | 26,289 (97.4%) | 712 (2.6%) |
| 26 to 34 Years | 17,590 (95.9%) | 760 (4.1%) |
| 35 to 44 Years | 12,319 (94.7%) | 686 (5.3%) |
| 45 to 54 Years | 11,699 (97.3%) | 326 (2.7%) |
| 55 to 64 Years | 11,345 (95.3%) | 562 (4.7%) |
| 65 to 74 Years | 12,085 (99.8%) | 21 (0.2%) |
| 75 Years and older | 7,037 (100.0%) | 1 (0.0%) |
| Total | 117,569 (97.1%) | 3,505 (2.9%) |
Health Insurance Coverage by Citizenship Status in Berkeley
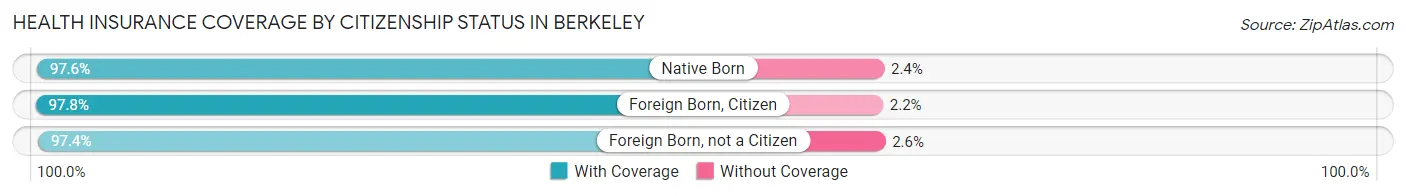
| Citizenship Status | With Coverage | Without Coverage |
| Native Born | 4,655 (97.6%) | 115 (2.4%) |
| Foreign Born, Citizen | 14,550 (97.8%) | 322 (2.2%) |
| Foreign Born, not a Citizen | 26,289 (97.4%) | 712 (2.6%) |
Health Insurance Coverage by Household Income in Berkeley
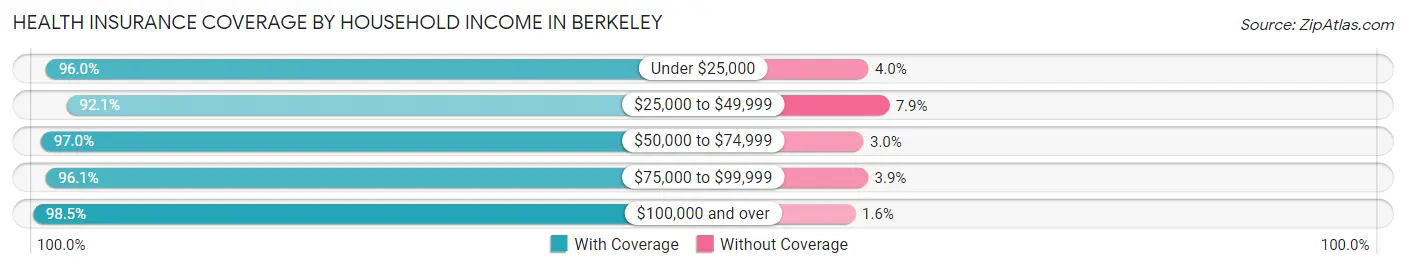
| Household Income | With Coverage | Without Coverage |
| Under $25,000 | 13,365 (96.0%) | 552 (4.0%) |
| $25,000 to $49,999 | 10,053 (92.1%) | 857 (7.9%) |
| $50,000 to $74,999 | 9,910 (97.0%) | 311 (3.0%) |
| $75,000 to $99,999 | 7,828 (96.1%) | 317 (3.9%) |
| $100,000 and over | 64,485 (98.5%) | 1,012 (1.5%) |
Public vs Private Health Insurance Coverage by Age in Berkeley
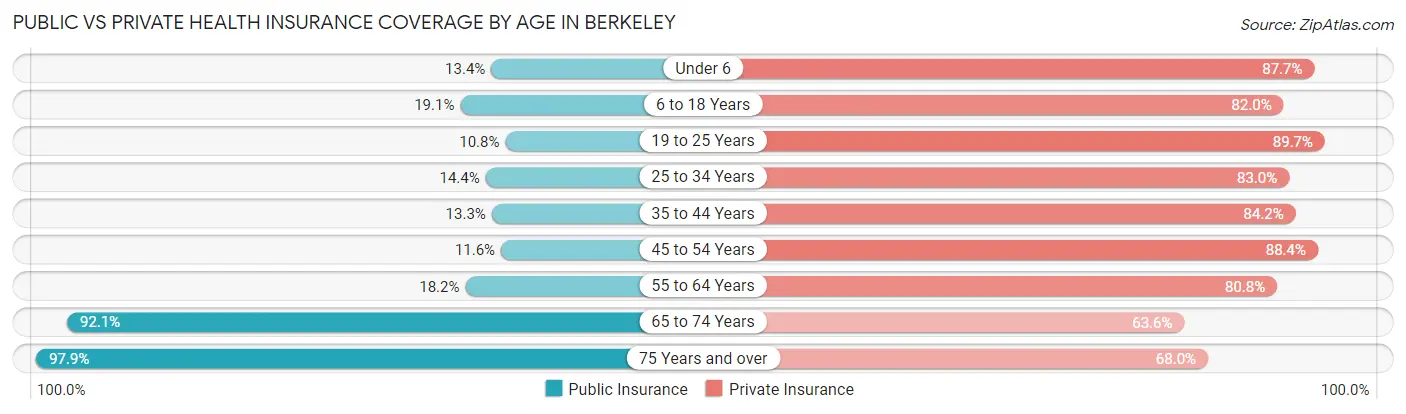
| Age Bracket | Public Insurance | Private Insurance |
| Under 6 | 639 (13.4%) | 4,183 (87.7%) |
| 6 to 18 Years | 2,847 (19.1%) | 12,195 (82.0%) |
| 19 to 25 Years | 2,910 (10.8%) | 24,209 (89.7%) |
| 25 to 34 Years | 2,650 (14.4%) | 15,232 (83.0%) |
| 35 to 44 Years | 1,731 (13.3%) | 10,954 (84.2%) |
| 45 to 54 Years | 1,393 (11.6%) | 10,624 (88.3%) |
| 55 to 64 Years | 2,167 (18.2%) | 9,619 (80.8%) |
| 65 to 74 Years | 11,154 (92.1%) | 7,695 (63.6%) |
| 75 Years and over | 6,889 (97.9%) | 4,782 (67.9%) |
| Total | 32,380 (26.7%) | 99,493 (82.2%) |
Disability Status by Sex by Age in Berkeley
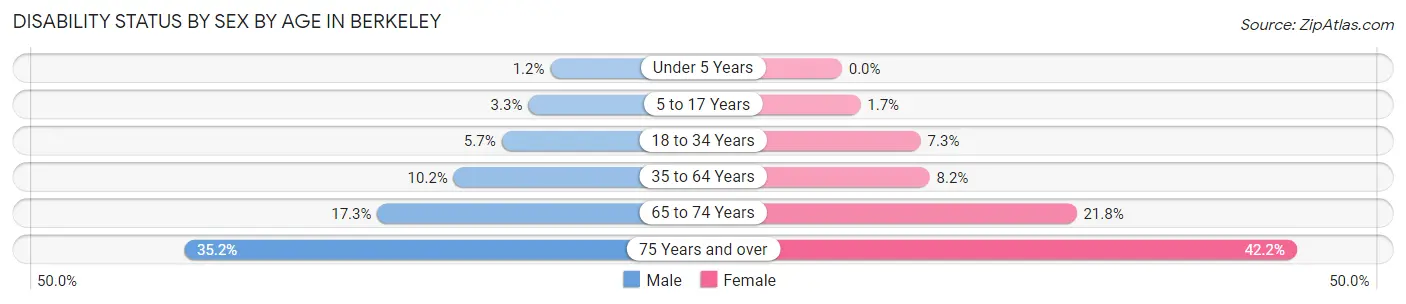
| Age Bracket | Male | Female |
| Under 5 Years | 26 (1.2%) | 0 (0.0%) |
| 5 to 17 Years | 181 (3.3%) | 92 (1.7%) |
| 18 to 34 Years | 1,389 (5.7%) | 1,907 (7.3%) |
| 35 to 64 Years | 1,899 (10.2%) | 1,490 (8.2%) |
| 65 to 74 Years | 983 (17.3%) | 1,397 (21.8%) |
| 75 Years and over | 1,047 (35.2%) | 1,716 (42.2%) |
Disability Class by Sex by Age in Berkeley
Disability Class: Hearing Difficulty
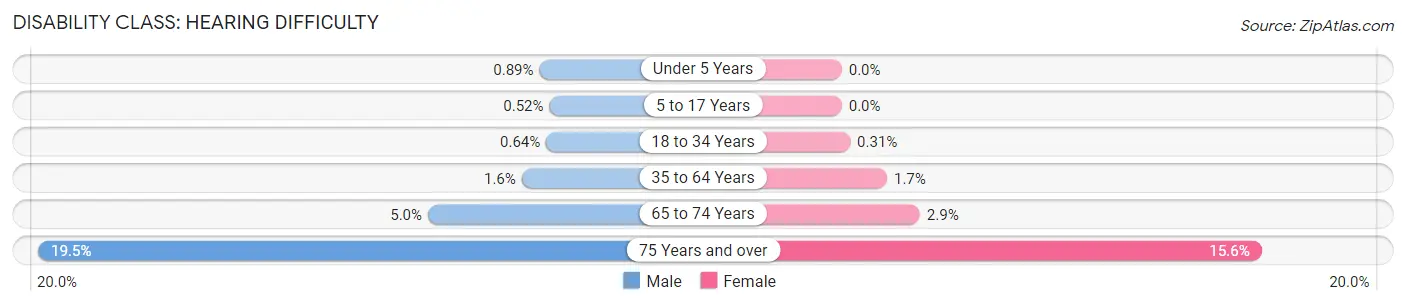
| Age Bracket | Male | Female |
| Under 5 Years | 19 (0.9%) | 0 (0.0%) |
| 5 to 17 Years | 29 (0.5%) | 0 (0.0%) |
| 18 to 34 Years | 154 (0.6%) | 80 (0.3%) |
| 35 to 64 Years | 289 (1.5%) | 307 (1.7%) |
| 65 to 74 Years | 286 (5.0%) | 186 (2.9%) |
| 75 Years and over | 580 (19.5%) | 633 (15.6%) |
Disability Class: Vision Difficulty
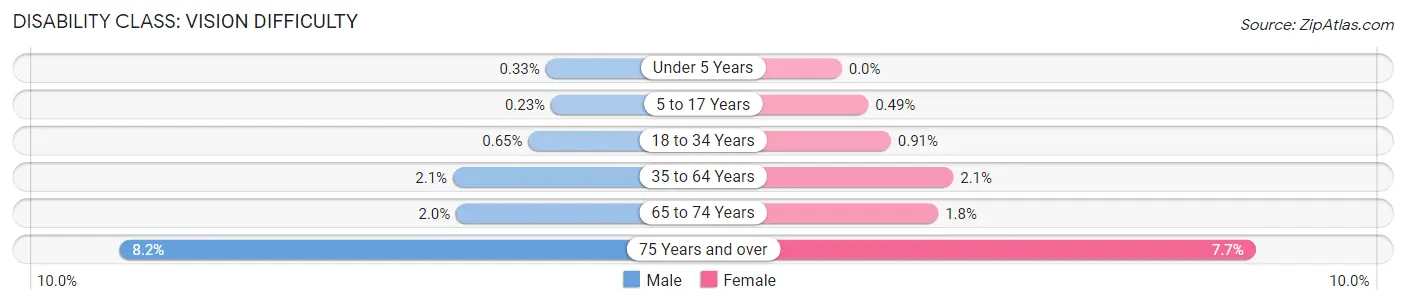
| Age Bracket | Male | Female |
| Under 5 Years | 7 (0.3%) | 0 (0.0%) |
| 5 to 17 Years | 13 (0.2%) | 26 (0.5%) |
| 18 to 34 Years | 158 (0.6%) | 237 (0.9%) |
| 35 to 64 Years | 383 (2.1%) | 379 (2.1%) |
| 65 to 74 Years | 113 (2.0%) | 115 (1.8%) |
| 75 Years and over | 245 (8.2%) | 312 (7.7%) |
Disability Class: Cognitive Difficulty
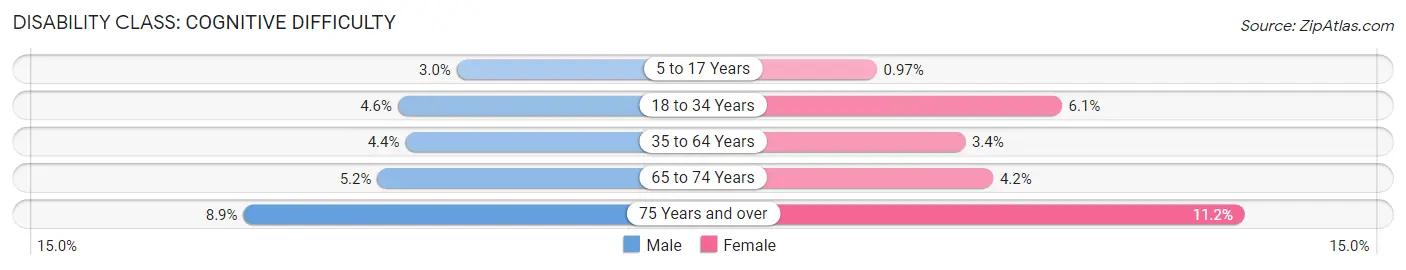
| Age Bracket | Male | Female |
| 5 to 17 Years | 165 (3.0%) | 52 (1.0%) |
| 18 to 34 Years | 1,115 (4.6%) | 1,594 (6.1%) |
| 35 to 64 Years | 822 (4.4%) | 627 (3.4%) |
| 65 to 74 Years | 295 (5.2%) | 270 (4.2%) |
| 75 Years and over | 265 (8.9%) | 456 (11.2%) |
Disability Class: Ambulatory Difficulty
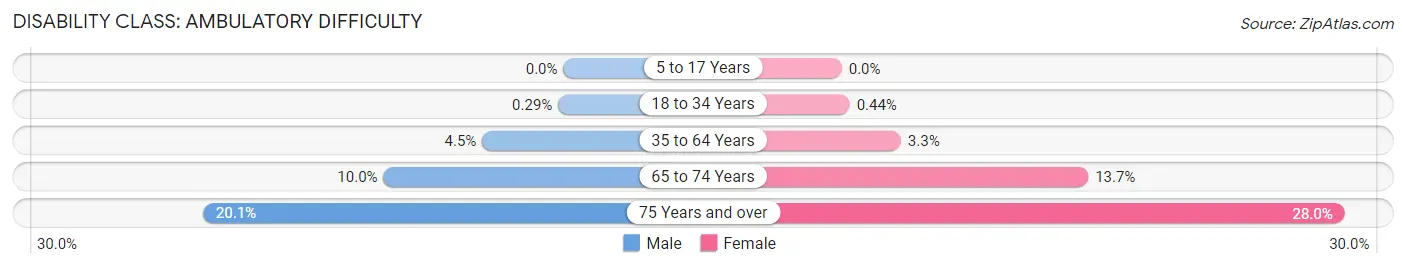
| Age Bracket | Male | Female |
| 5 to 17 Years | 0 (0.0%) | 0 (0.0%) |
| 18 to 34 Years | 69 (0.3%) | 114 (0.4%) |
| 35 to 64 Years | 844 (4.5%) | 602 (3.3%) |
| 65 to 74 Years | 570 (10.0%) | 880 (13.7%) |
| 75 Years and over | 597 (20.1%) | 1,138 (28.0%) |
Disability Class: Self-Care Difficulty
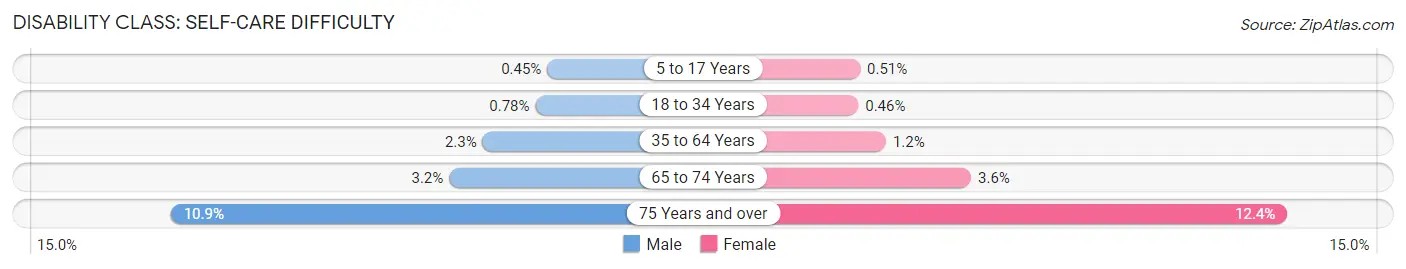
| Age Bracket | Male | Female |
| 5 to 17 Years | 25 (0.4%) | 27 (0.5%) |
| 18 to 34 Years | 188 (0.8%) | 120 (0.5%) |
| 35 to 64 Years | 420 (2.2%) | 225 (1.2%) |
| 65 to 74 Years | 181 (3.2%) | 231 (3.6%) |
| 75 Years and over | 325 (10.9%) | 504 (12.4%) |
Technology Access in Berkeley
Computing Device Access in Berkeley
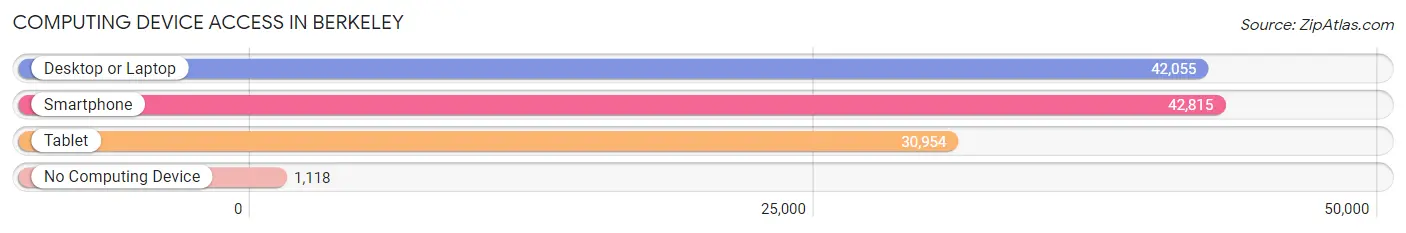
| Device Type | # Households | % Households |
| Desktop or Laptop | 42,055 | 91.8% |
| Smartphone | 42,815 | 93.5% |
| Tablet | 30,954 | 67.6% |
| No Computing Device | 1,118 | 2.4% |
| Total | 45,788 | 100.0% |
Internet Access in Berkeley
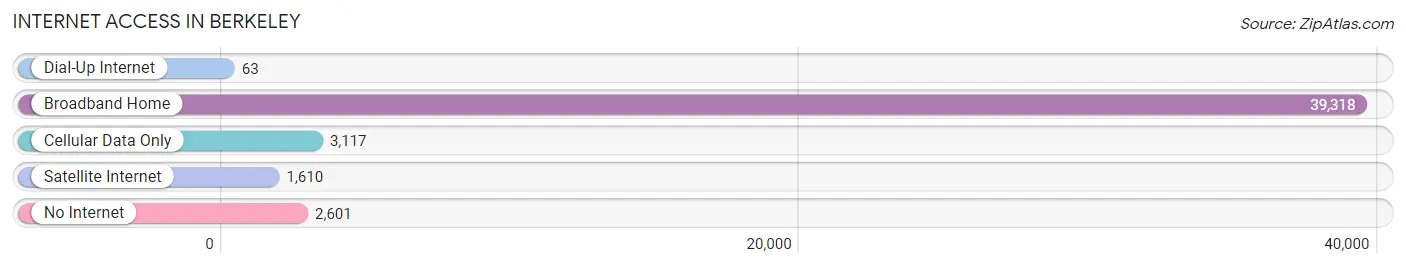
| Internet Type | # Households | % Households |
| Dial-Up Internet | 63 | 0.1% |
| Broadband Home | 39,318 | 85.9% |
| Cellular Data Only | 3,117 | 6.8% |
| Satellite Internet | 1,610 | 3.5% |
| No Internet | 2,601 | 5.7% |
| Total | 45,788 | 100.0% |
Berkeley Summary
Berkeley, California is a city located in the San Francisco Bay Area in Alameda County. It is bordered by Oakland to the east, Albany to the north, and Emeryville to the south. Berkeley is home to the University of California, Berkeley, one of the most prestigious universities in the world.
Geography
Berkeley is located on the eastern shore of San Francisco Bay, about 10 miles northeast of San Francisco. The city covers an area of about 10.5 square miles, with a population of about 112,580 people as of the 2010 census. The city is divided into several distinct neighborhoods, including Downtown Berkeley, North Berkeley, South Berkeley, West Berkeley, and the Berkeley Hills.
The city is situated on the Hayward Fault, a major fault line that runs through the Bay Area. The fault line is responsible for several earthquakes in the area, including the 1989 Loma Prieta earthquake.
Climate
Berkeley has a Mediterranean climate, with warm, dry summers and mild, wet winters. The average high temperature in the summer is around 75°F, while the average low temperature in the winter is around 45°F. The city receives an average of about 20 inches of rain per year.
Economy
Berkeley is home to a diverse economy, with a variety of industries represented. The city is home to several large employers, including the University of California, Berkeley, Lawrence Berkeley National Laboratory, and Bayer Healthcare. The city also has a thriving retail sector, with several large shopping centers and a vibrant downtown area.
Demographics
As of the 2010 census, Berkeley had a population of 112,580 people. The racial makeup of the city was 57.2% White, 25.3% Asian, 8.3% African American, 0.7% Native American, 0.2% Pacific Islander, and 6.3% from other races. The median household income was $63,829, and the median family income was $76,945.
Berkeley is a highly educated city, with over half of the population having a bachelor's degree or higher. The city is also home to a large number of students, with over 20,000 students enrolled at the University of California, Berkeley.
Conclusion
Berkeley, California is a vibrant city located in the San Francisco Bay Area. It is home to the prestigious University of California, Berkeley, and has a diverse economy and population. The city has a Mediterranean climate, with warm, dry summers and mild, wet winters. Berkeley is a highly educated city, with over half of the population having a bachelor's degree or higher.
Common Questions
What is the Total Population of Berkeley?
Total Population of Berkeley is 121,385.
What is the Total Male Population of Berkeley?
Total Male Population of Berkeley is 59,388.
What is the Total Female Population of Berkeley?
Total Female Population of Berkeley is 61,997.
What is the Ratio of Males per 100 Females in Berkeley?
There are 95.79 Males per 100 Females in Berkeley.
What is the Ratio of Females per 100 Males in Berkeley?
There are 104.39 Females per 100 Males in Berkeley.
What is the Median Population Age in Berkeley?
Median Population Age in Berkeley is 32.5 Years.
What is the Average Family Size in Berkeley
Average Family Size in Berkeley is 2.9 People.
What is the Average Household Size in Berkeley
Average Household Size in Berkeley is 2.4 People.
What is Per Capita Income in Berkeley?
Per Capita income in Berkeley is $63,310.
What is the Median Family Income in Berkeley?
Median Family Income in Berkeley is $177,068.
What is the Median Household income in Berkeley?
Median Household Income in Berkeley is $104,716.
What is Income or Wage Gap in Berkeley?
Income or Wage Gap in Berkeley is 29.7%.
Women in Berkeley earn 70.3 cents for every dollar earned by a man.
What is Family Income Deficit in Berkeley?
Family Income Deficit in Berkeley is $9,472.
Families that are below poverty line in Berkeley earn $9,472 less on average than the poverty threshold level.
What is Inequality or Gini Index in Berkeley?
Inequality or Gini Index in Berkeley is 0.53.
How Large is the Labor Force in Berkeley?
There are 65,848 People in the Labor Forcein in Berkeley.
What is the Percentage of People in the Labor Force in Berkeley?
60.5% of People are in the Labor Force in Berkeley.
What is the Unemployment Rate in Berkeley?
Unemployment Rate in Berkeley is 5.5%.