Miami, AZ
Miami Map
Miami Overview
1,353
TOTAL POPULATION
705
MALE POPULATION
648
FEMALE POPULATION
108.80
MALES / 100 FEMALES
91.91
FEMALES / 100 MALES
51.1
MEDIAN AGE
2.9
AVG FAMILY SIZE
2.1
AVG HOUSEHOLD SIZE
$21,059
PER CAPITA INCOME
$40,556
AVG FAMILY INCOME
$30,417
AVG HOUSEHOLD INCOME
15.1%
WAGE / INCOME GAP [ % ]
84.9¢/ $1
WAGE / INCOME GAP [ $ ]
0.44
INEQUALITY / GINI INDEX
566
LABOR FORCE [ PEOPLE ]
50.0%
PERCENT IN LABOR FORCE
15.9%
UNEMPLOYMENT RATE
Miami Zip Codes
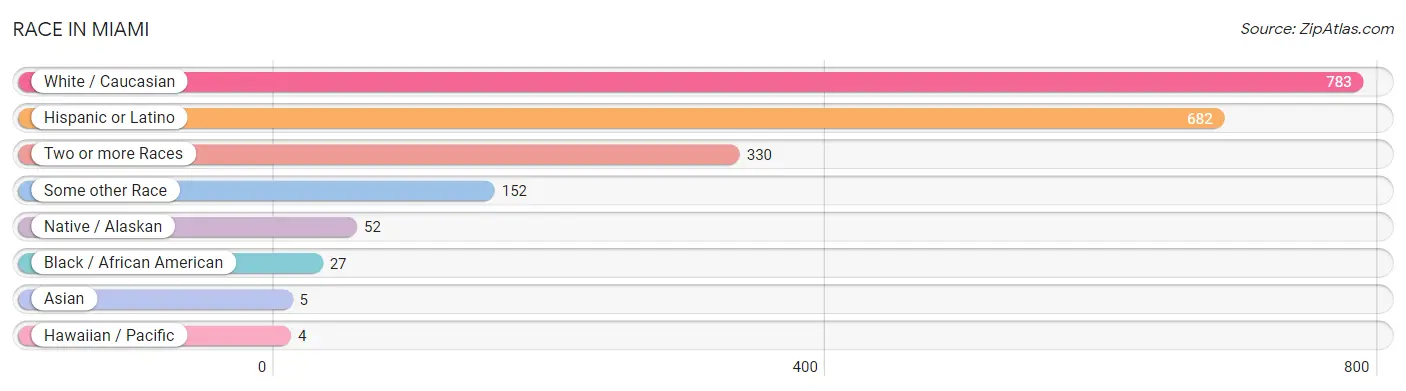
Race in Miami
The most populous races in Miami are White / Caucasian (783 | 57.9%), Hispanic or Latino (682 | 50.4%), and Two or more Races (330 | 24.4%).
| Race | # Population | % Population |
| Asian | 5 | 0.4% |
| Black / African American | 27 | 2.0% |
| Hawaiian / Pacific | 4 | 0.3% |
| Hispanic or Latino | 682 | 50.4% |
| Native / Alaskan | 52 | 3.8% |
| White / Caucasian | 783 | 57.9% |
| Two or more Races | 330 | 24.4% |
| Some other Race | 152 | 11.2% |
| Total | 1,353 | 100.0% |
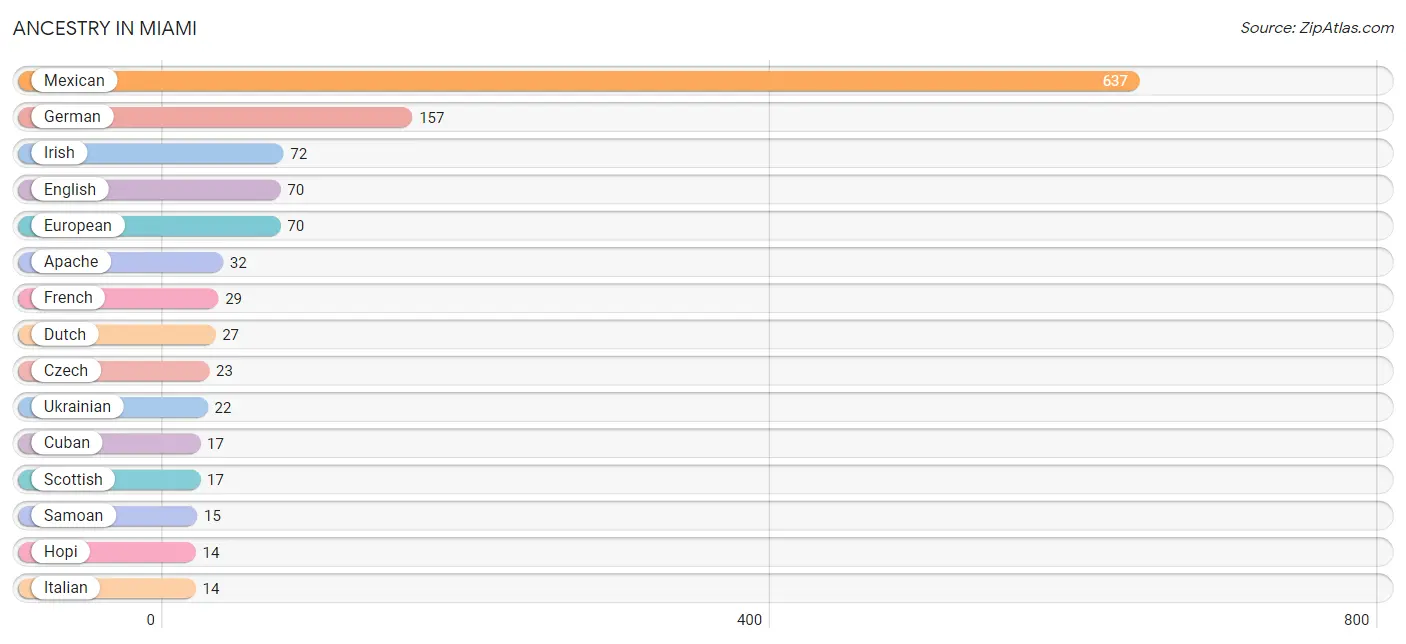
Ancestry in Miami
The most populous ancestries reported in Miami are Mexican (637 | 47.1%), German (157 | 11.6%), Irish (72 | 5.3%), English (70 | 5.2%), and European (70 | 5.2%), together accounting for 74.3% of all Miami residents.
| Ancestry | # Population | % Population |
| American | 11 | 0.8% |
| Apache | 32 | 2.4% |
| British | 10 | 0.7% |
| Cherokee | 4 | 0.3% |
| Cuban | 17 | 1.3% |
| Czech | 23 | 1.7% |
| Dutch | 27 | 2.0% |
| English | 70 | 5.2% |
| European | 70 | 5.2% |
| French | 29 | 2.1% |
| German | 157 | 11.6% |
| Greek | 6 | 0.4% |
| Hopi | 14 | 1.0% |
| Hungarian | 4 | 0.3% |
| Irish | 72 | 5.3% |
| Italian | 14 | 1.0% |
| Korean | 4 | 0.3% |
| Mexican | 637 | 47.1% |
| Navajo | 6 | 0.4% |
| Samoan | 15 | 1.1% |
| Scotch-Irish | 8 | 0.6% |
| Scottish | 17 | 1.3% |
| Spaniard | 2 | 0.2% |
| Sri Lankan | 1 | 0.1% |
| Ukrainian | 22 | 1.6% |
| Welsh | 8 | 0.6% | View All 26 Rows |
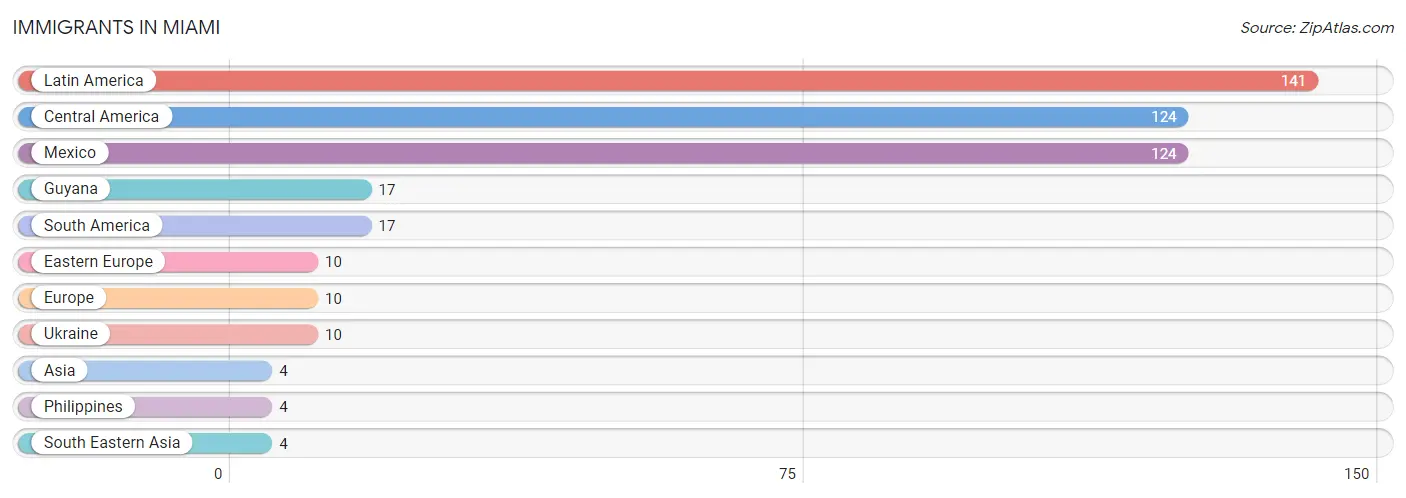
Immigrants in Miami
The most numerous immigrant groups reported in Miami came from Latin America (141 | 10.4%), Central America (124 | 9.2%), Mexico (124 | 9.2%), Guyana (17 | 1.3%), and South America (17 | 1.3%), together accounting for 31.3% of all Miami residents.
| Immigration Origin | # Population | % Population |
| Asia | 4 | 0.3% |
| Central America | 124 | 9.2% |
| Eastern Europe | 10 | 0.7% |
| Europe | 10 | 0.7% |
| Guyana | 17 | 1.3% |
| Latin America | 141 | 10.4% |
| Mexico | 124 | 9.2% |
| Philippines | 4 | 0.3% |
| South America | 17 | 1.3% |
| South Eastern Asia | 4 | 0.3% |
| Ukraine | 10 | 0.7% | View All 11 Rows |
Sex and Age in Miami
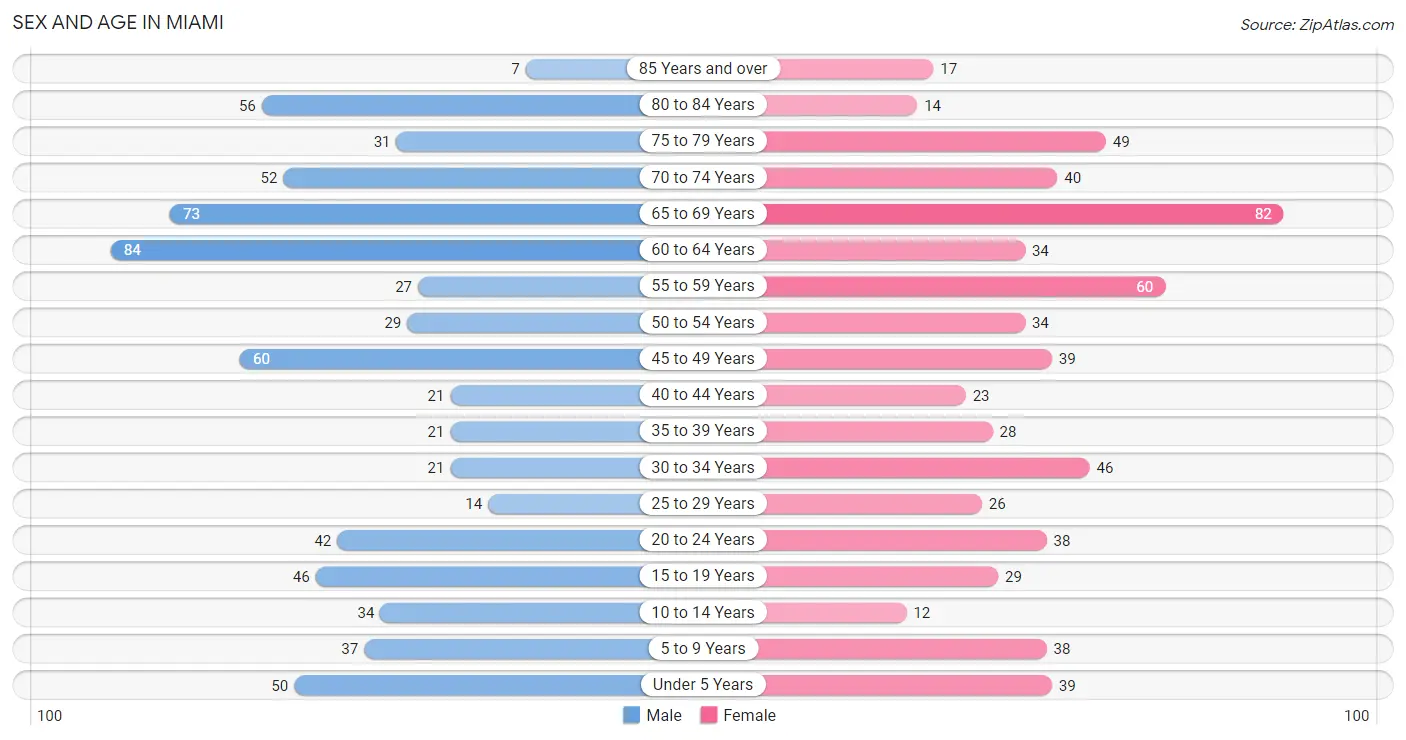
Sex and Age in Miami
The most populous age groups in Miami are 60 to 64 Years (84 | 11.9%) for men and 65 to 69 Years (82 | 12.7%) for women.
| Age Bracket | Male | Female |
| Under 5 Years | 50 (7.1%) | 39 (6.0%) |
| 5 to 9 Years | 37 (5.2%) | 38 (5.9%) |
| 10 to 14 Years | 34 (4.8%) | 12 (1.8%) |
| 15 to 19 Years | 46 (6.5%) | 29 (4.5%) |
| 20 to 24 Years | 42 (6.0%) | 38 (5.9%) |
| 25 to 29 Years | 14 (2.0%) | 26 (4.0%) |
| 30 to 34 Years | 21 (3.0%) | 46 (7.1%) |
| 35 to 39 Years | 21 (3.0%) | 28 (4.3%) |
| 40 to 44 Years | 21 (3.0%) | 23 (3.5%) |
| 45 to 49 Years | 60 (8.5%) | 39 (6.0%) |
| 50 to 54 Years | 29 (4.1%) | 34 (5.2%) |
| 55 to 59 Years | 27 (3.8%) | 60 (9.3%) |
| 60 to 64 Years | 84 (11.9%) | 34 (5.2%) |
| 65 to 69 Years | 73 (10.3%) | 82 (12.7%) |
| 70 to 74 Years | 52 (7.4%) | 40 (6.2%) |
| 75 to 79 Years | 31 (4.4%) | 49 (7.6%) |
| 80 to 84 Years | 56 (7.9%) | 14 (2.2%) |
| 85 Years and over | 7 (1.0%) | 17 (2.6%) |
| Total | 705 (100.0%) | 648 (100.0%) |
Families and Households in Miami
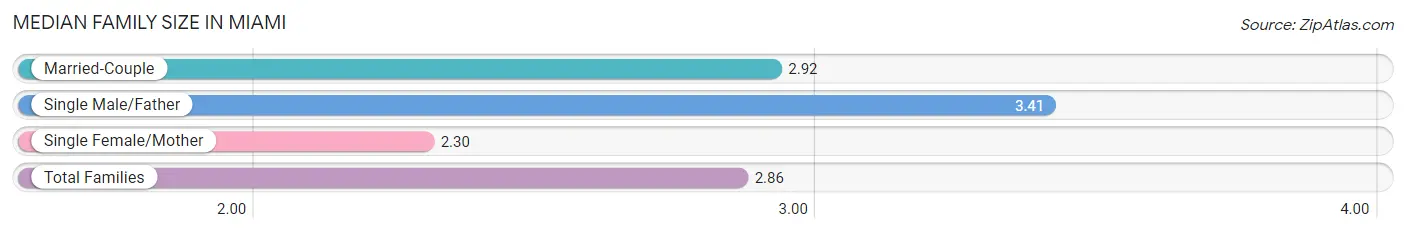
Median Family Size in Miami
The median family size in Miami is 2.86 persons per family, with single male/father families (51 | 16.2%) accounting for the largest median family size of 3.41 persons per family. On the other hand, single female/mother families (70 | 22.3%) represent the smallest median family size with 2.30 persons per family.
| Family Type | # Families | Family Size |
| Married-Couple | 193 (61.5%) | 2.92 |
| Single Male/Father | 51 (16.2%) | 3.41 |
| Single Female/Mother | 70 (22.3%) | 2.30 |
| Total Families | 314 (100.0%) | 2.86 |
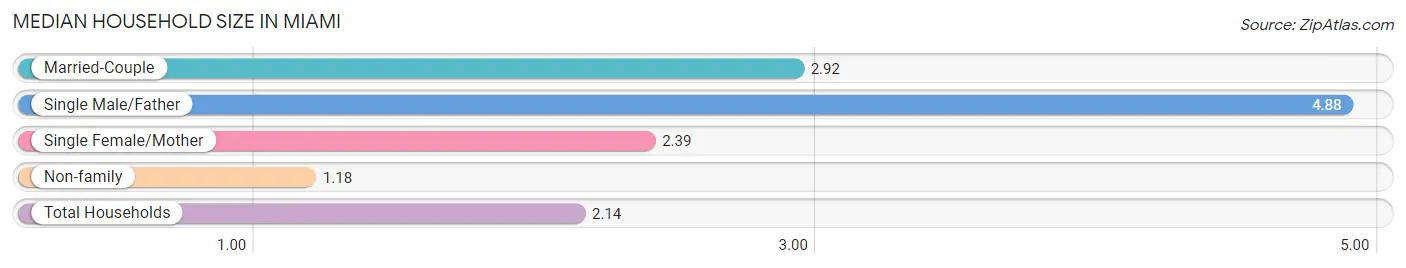
Median Household Size in Miami
The median household size in Miami is 2.14 persons per household, with single male/father households (51 | 8.1%) accounting for the largest median household size of 4.88 persons per household. non-family households (318 | 50.3%) represent the smallest median household size with 1.18 persons per household.
| Household Type | # Households | Household Size |
| Married-Couple | 193 (30.5%) | 2.92 |
| Single Male/Father | 51 (8.1%) | 4.88 |
| Single Female/Mother | 70 (11.1%) | 2.39 |
| Non-family | 318 (50.3%) | 1.18 |
| Total Households | 632 (100.0%) | 2.14 |
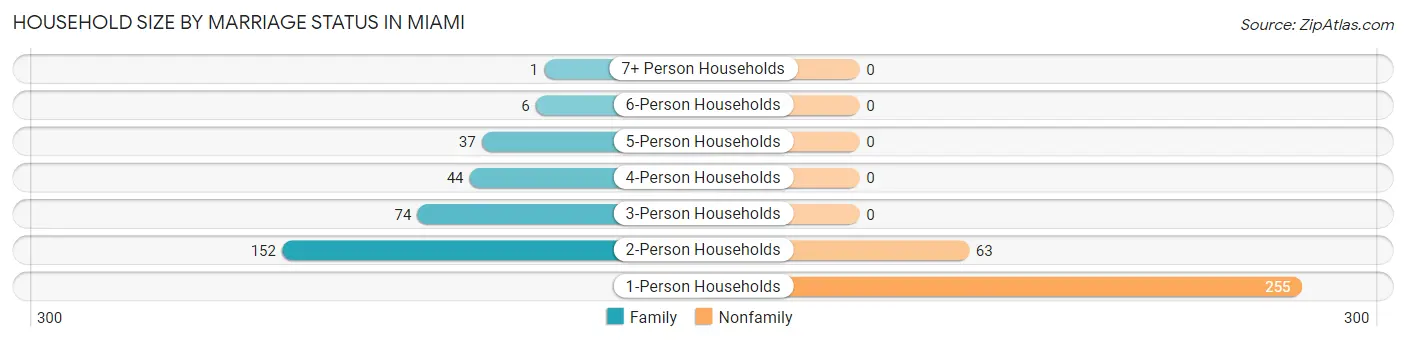
Household Size by Marriage Status in Miami
Out of a total of 632 households in Miami, 314 (49.7%) are family households, while 318 (50.3%) are nonfamily households. The most numerous type of family households are 2-person households, comprising 152, and the most common type of nonfamily households are 1-person households, comprising 255.
| Household Size | Family Households | Nonfamily Households |
| 1-Person Households | - | 255 (40.4%) |
| 2-Person Households | 152 (24.0%) | 63 (10.0%) |
| 3-Person Households | 74 (11.7%) | 0 (0.0%) |
| 4-Person Households | 44 (7.0%) | 0 (0.0%) |
| 5-Person Households | 37 (5.9%) | 0 (0.0%) |
| 6-Person Households | 6 (0.9%) | 0 (0.0%) |
| 7+ Person Households | 1 (0.2%) | 0 (0.0%) |
| Total | 314 (49.7%) | 318 (50.3%) |
Female Fertility in Miami
Fertility by Age in Miami
Average fertility rate in Miami is 79.0 births per 1,000 women. Women in the age bracket of 20 to 34 years have the highest fertility rate with 164.0 births per 1,000 women. Women in the age bracket of 20 to 34 years acount for 100.0% of all women with births.
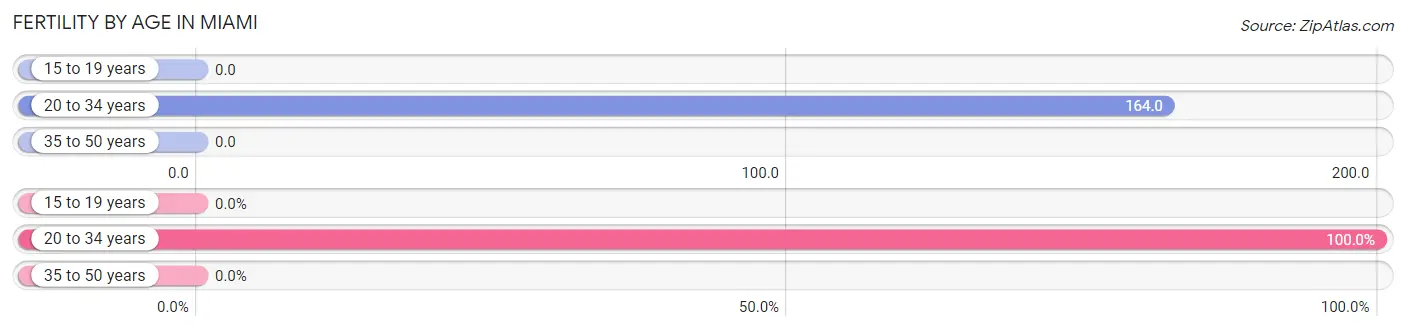
| Age Bracket | Women with Births | Births / 1,000 Women |
| 15 to 19 years | 0 (0.0%) | 0.0 |
| 20 to 34 years | 18 (100.0%) | 164.0 |
| 35 to 50 years | 0 (0.0%) | 0.0 |
| Total | 18 (100.0%) | 79.0 |
Fertility by Age by Marriage Status in Miami
88.9% of women with births (18) in Miami are married. The highest percentage of unmarried women with births falls into 20 to 34 years age bracket with 11.1% of them unmarried at the time of birth, while the lowest percentage of unmarried women with births belong to 20 to 34 years age bracket with 11.1% of them unmarried.
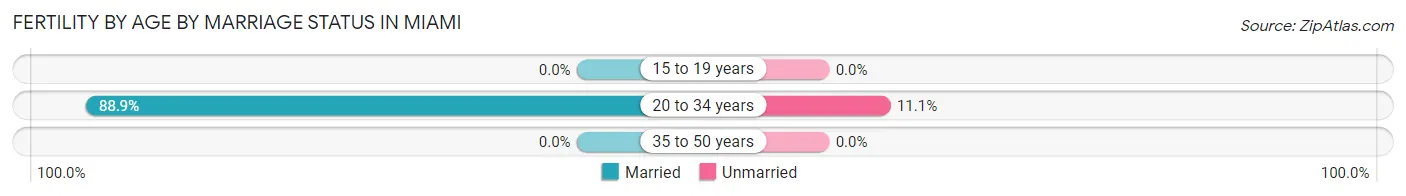
| Age Bracket | Married | Unmarried |
| 15 to 19 years | 0 (0.0%) | 0 (0.0%) |
| 20 to 34 years | 16 (88.9%) | 2 (11.1%) |
| 35 to 50 years | 0 (0.0%) | 0 (0.0%) |
| Total | 16 (88.9%) | 2 (11.1%) |
Fertility by Education in Miami
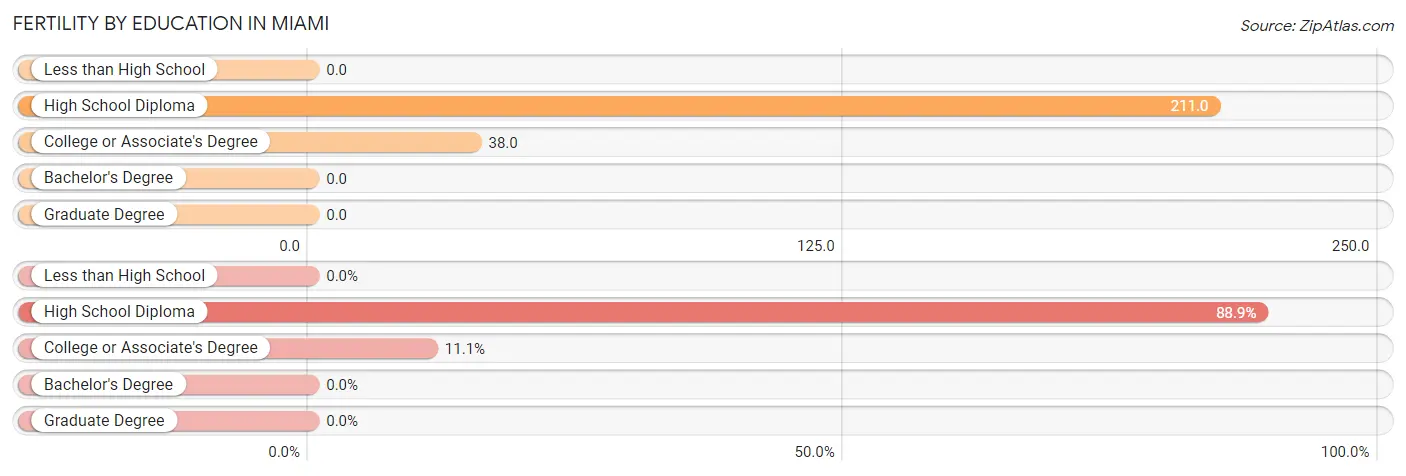
| Educational Attainment | Women with Births | Births / 1,000 Women |
| Less than High School | 0 (0.0%) | 0.0 |
| High School Diploma | 16 (88.9%) | 211.0 |
| College or Associate's Degree | 2 (11.1%) | 38.0 |
| Bachelor's Degree | 0 (0.0%) | 0.0 |
| Graduate Degree | 0 (0.0%) | 0.0 |
| Total | 18 (100.0%) | 79.0 |
Fertility by Education by Marriage Status in Miami
11.1% of women with births in Miami are unmarried. Women with the educational attainment of high school diploma are most likely to be married with 100.0% of them married at childbirth, while women with the educational attainment of college or associate's degree are least likely to be married with 100.0% of them unmarried at childbirth.
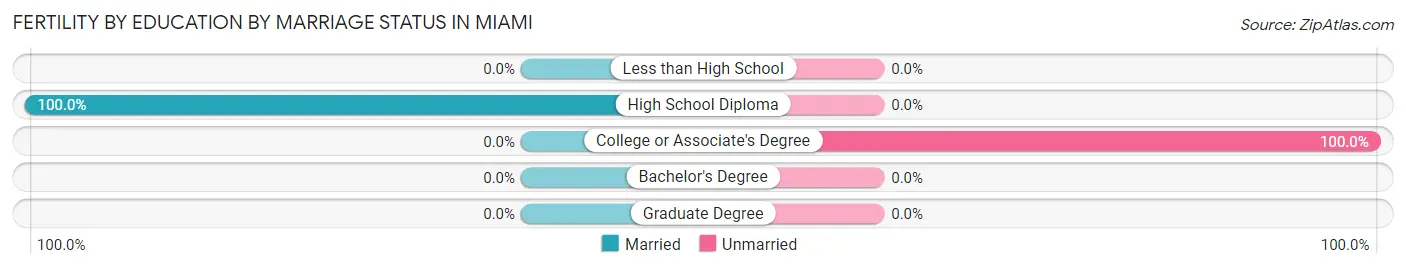
| Educational Attainment | Married | Unmarried |
| Less than High School | 0 (0.0%) | 0 (0.0%) |
| High School Diploma | 16 (100.0%) | 0 (0.0%) |
| College or Associate's Degree | 0 (0.0%) | 2 (100.0%) |
| Bachelor's Degree | 0 (0.0%) | 0 (0.0%) |
| Graduate Degree | 0 (0.0%) | 0 (0.0%) |
| Total | 16 (88.9%) | 2 (11.1%) |
Income in Miami
Income Overview in Miami
Per Capita Income in Miami is $21,059, while median incomes of families and households are $40,556 and $30,417 respectively.
| Characteristic | Number | Measure |
| Per Capita Income | 1,353 | $21,059 |
| Median Family Income | 314 | $40,556 |
| Mean Family Income | 314 | $53,853 |
| Median Household Income | 632 | $30,417 |
| Mean Household Income | 632 | $43,527 |
| Income Deficit | 314 | $0 |
| Wage / Income Gap (%) | 1,353 | 15.07% |
| Wage / Income Gap ($) | 1,353 | 84.93¢ per $1 |
| Gini / Inequality Index | 1,353 | 0.44 |
Earnings by Sex in Miami
Average Earnings in Miami are $28,684, $27,500 for men and $32,381 for women, a difference of 15.1%.
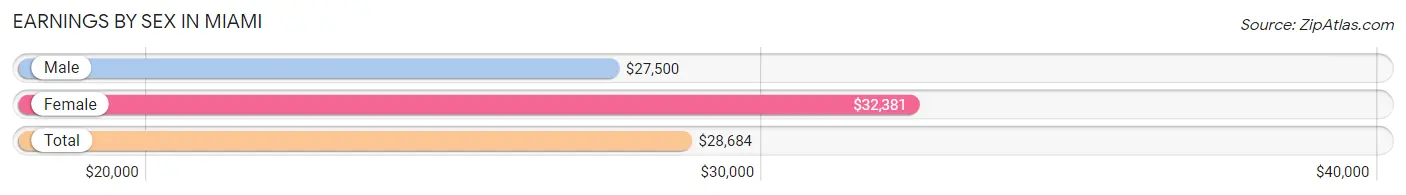
| Sex | Number | Average Earnings |
| Male | 280 (49.1%) | $27,500 |
| Female | 290 (50.9%) | $32,381 |
| Total | 570 (100.0%) | $28,684 |
Earnings by Sex by Income Bracket in Miami
The most common earnings brackets in Miami are $25,000 to $29,999 for men (64 | 22.9%) and $30,000 to $34,999 for women (44 | 15.2%).
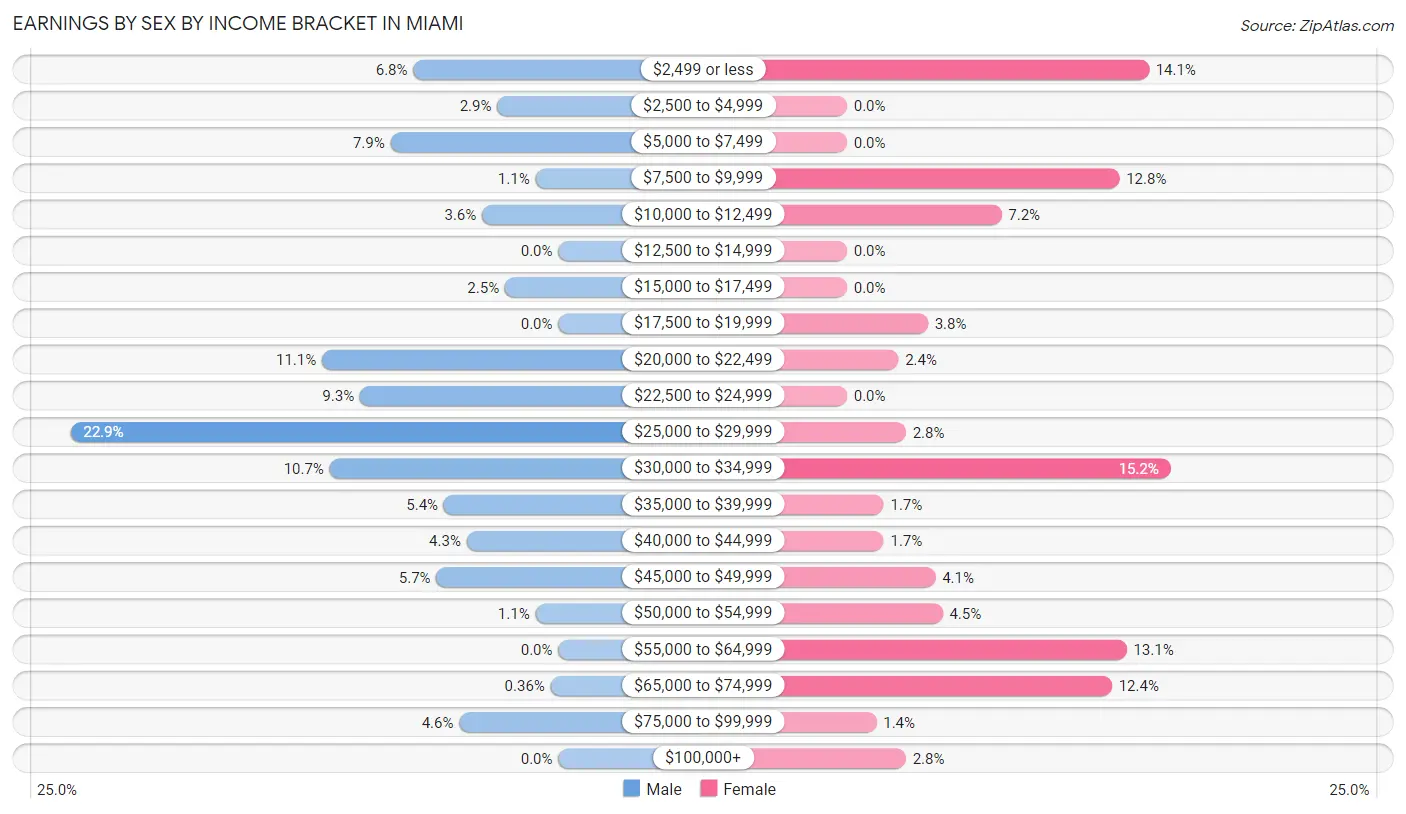
| Income | Male | Female |
| $2,499 or less | 19 (6.8%) | 41 (14.1%) |
| $2,500 to $4,999 | 8 (2.9%) | 0 (0.0%) |
| $5,000 to $7,499 | 22 (7.9%) | 0 (0.0%) |
| $7,500 to $9,999 | 3 (1.1%) | 37 (12.8%) |
| $10,000 to $12,499 | 10 (3.6%) | 21 (7.2%) |
| $12,500 to $14,999 | 0 (0.0%) | 0 (0.0%) |
| $15,000 to $17,499 | 7 (2.5%) | 0 (0.0%) |
| $17,500 to $19,999 | 0 (0.0%) | 11 (3.8%) |
| $20,000 to $22,499 | 31 (11.1%) | 7 (2.4%) |
| $22,500 to $24,999 | 26 (9.3%) | 0 (0.0%) |
| $25,000 to $29,999 | 64 (22.9%) | 8 (2.8%) |
| $30,000 to $34,999 | 30 (10.7%) | 44 (15.2%) |
| $35,000 to $39,999 | 15 (5.4%) | 5 (1.7%) |
| $40,000 to $44,999 | 12 (4.3%) | 5 (1.7%) |
| $45,000 to $49,999 | 16 (5.7%) | 12 (4.1%) |
| $50,000 to $54,999 | 3 (1.1%) | 13 (4.5%) |
| $55,000 to $64,999 | 0 (0.0%) | 38 (13.1%) |
| $65,000 to $74,999 | 1 (0.4%) | 36 (12.4%) |
| $75,000 to $99,999 | 13 (4.6%) | 4 (1.4%) |
| $100,000+ | 0 (0.0%) | 8 (2.8%) |
| Total | 280 (100.0%) | 290 (100.0%) |
Earnings by Sex by Educational Attainment in Miami
Average earnings in Miami are $28,775 for men and $39,000 for women, a difference of 26.2%. Men with an educational attainment of bachelor's degree enjoy the highest average annual earnings of $35,139, while those with less than high school education earn the least with $28,235. Women with an educational attainment of college or associate's degree earn the most with the average annual earnings of $63,125, while those with high school diploma education have the smallest earnings of $30,972.
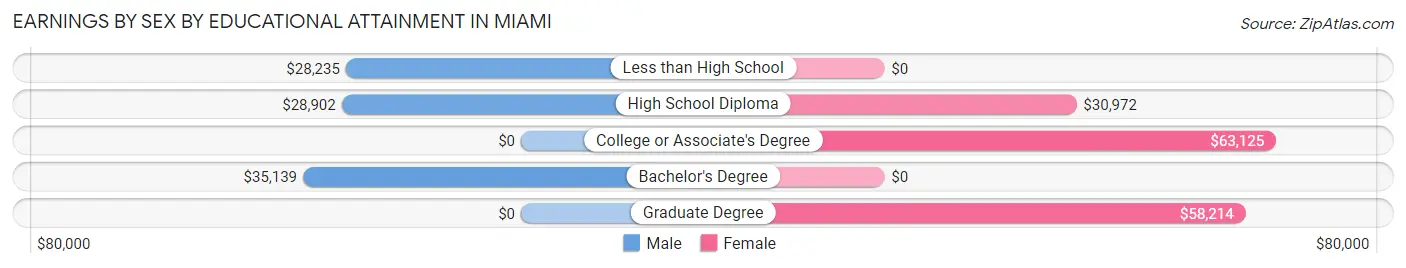
| Educational Attainment | Male Income | Female Income |
| Less than High School | $28,235 | $0 |
| High School Diploma | $28,902 | $30,972 |
| College or Associate's Degree | - | - |
| Bachelor's Degree | $35,139 | $0 |
| Graduate Degree | - | - |
| Total | $28,775 | $39,000 |
Family Income in Miami
Family Income Brackets in Miami
According to the Miami family income data, there are 76 families falling into the $75,000 to $99,999 income range, which is the most common income bracket and makes up 24.2% of all families.
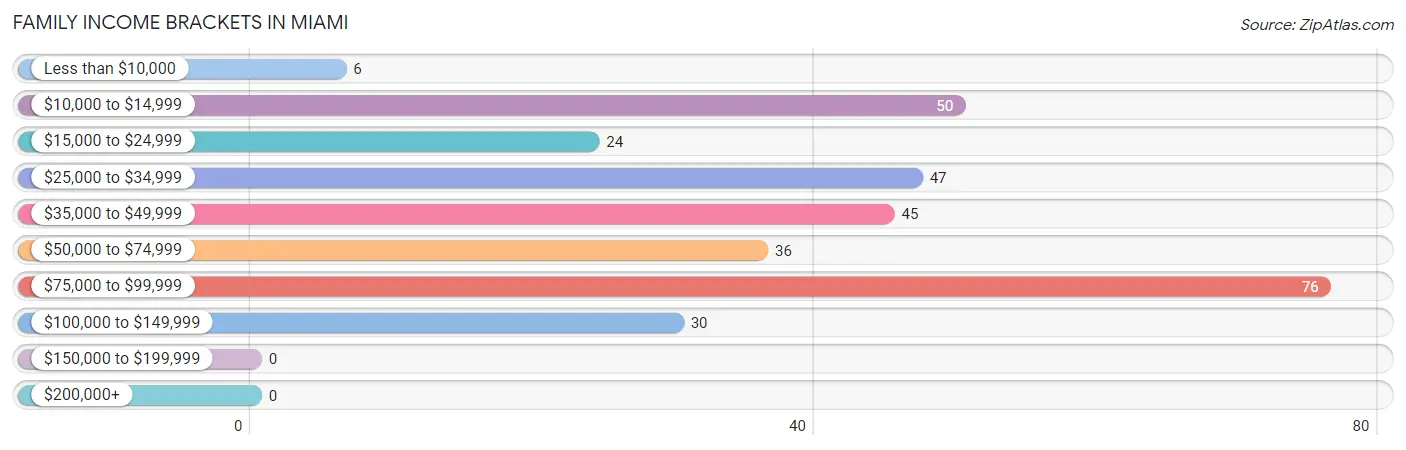
| Income Bracket | # Families | % Families |
| Less than $10,000 | 6 | 1.9% |
| $10,000 to $14,999 | 50 | 15.9% |
| $15,000 to $24,999 | 24 | 7.6% |
| $25,000 to $34,999 | 47 | 15.0% |
| $35,000 to $49,999 | 45 | 14.3% |
| $50,000 to $74,999 | 36 | 11.5% |
| $75,000 to $99,999 | 76 | 24.2% |
| $100,000 to $149,999 | 30 | 9.6% |
| $150,000 to $199,999 | 0 | 0.0% |
| $200,000+ | 0 | 0.0% |
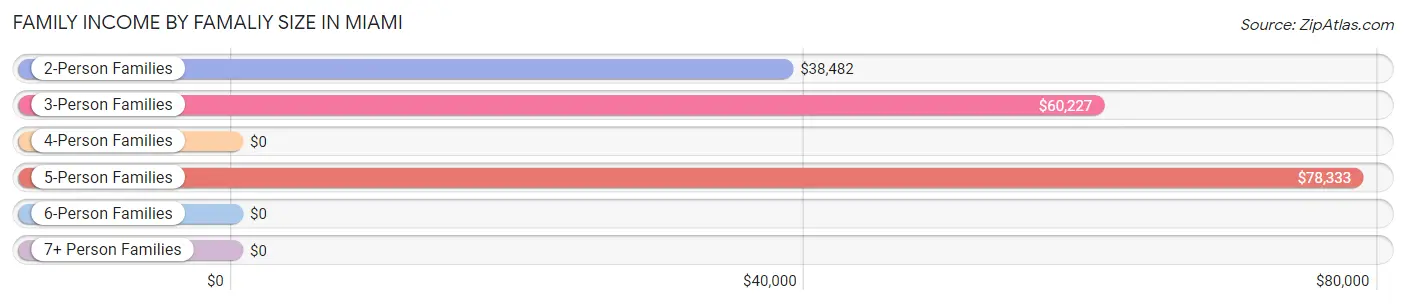
Family Income by Famaliy Size in Miami
5-person families (30 | 9.6%) account for the highest median family income in Miami with $78,333 per family, while 3-person families (54 | 17.2%) have the highest median income of $20,076 per family member.
| Income Bracket | # Families | Median Income |
| 2-Person Families | 177 (56.4%) | $38,482 |
| 3-Person Families | 54 (17.2%) | $60,227 |
| 4-Person Families | 53 (16.9%) | $0 |
| 5-Person Families | 30 (9.6%) | $78,333 |
| 6-Person Families | 0 (0.0%) | $0 |
| 7+ Person Families | 0 (0.0%) | $0 |
| Total | 314 (100.0%) | $40,556 |
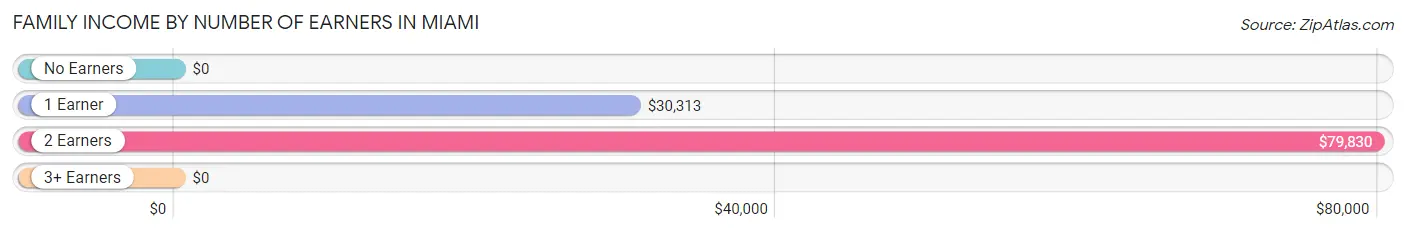
Family Income by Number of Earners in Miami
| Number of Earners | # Families | Median Income |
| No Earners | 104 (33.1%) | $0 |
| 1 Earner | 108 (34.4%) | $30,313 |
| 2 Earners | 77 (24.5%) | $79,830 |
| 3+ Earners | 25 (8.0%) | $0 |
| Total | 314 (100.0%) | $40,556 |
Household Income in Miami
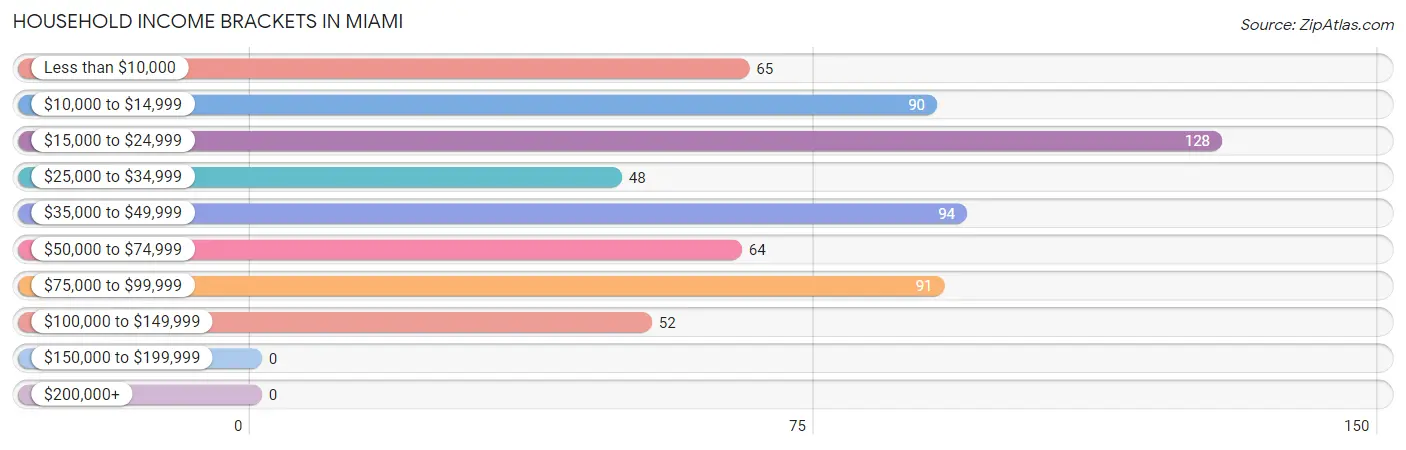
Household Income Brackets in Miami
With 128 households falling in the category, the $15,000 to $24,999 income range is the most frequent in Miami, accounting for 20.3% of all households.
| Income Bracket | # Households | % Households |
| Less than $10,000 | 65 | 10.3% |
| $10,000 to $14,999 | 90 | 14.2% |
| $15,000 to $24,999 | 128 | 20.3% |
| $25,000 to $34,999 | 48 | 7.6% |
| $35,000 to $49,999 | 94 | 14.9% |
| $50,000 to $74,999 | 64 | 10.1% |
| $75,000 to $99,999 | 91 | 14.4% |
| $100,000 to $149,999 | 52 | 8.2% |
| $150,000 to $199,999 | 0 | 0.0% |
| $200,000+ | 0 | 0.0% |
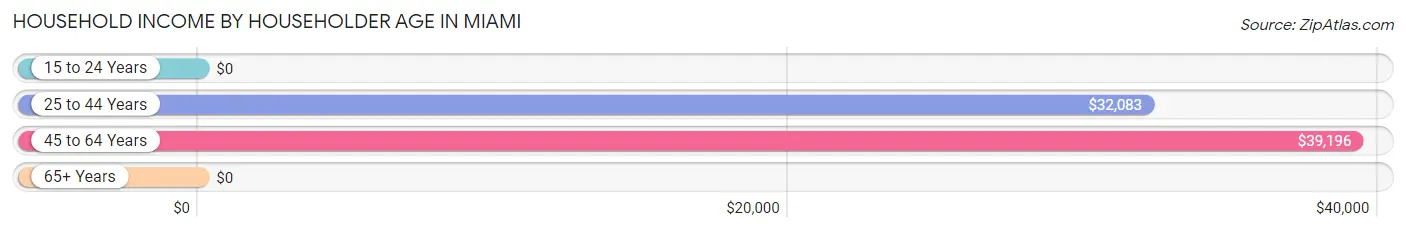
Household Income by Householder Age in Miami
The median household income in Miami is $30,417, with the highest median household income of $39,196 found in the 45 to 64 years age bracket for the primary householder. A total of 227 households (35.9%) fall into this category. Meanwhile, the 15 to 24 years age bracket for the primary householder has the lowest median household income of $0, with 41 households (6.5%) in this group.
| Income Bracket | # Households | Median Income |
| 15 to 24 Years | 41 (6.5%) | $0 |
| 25 to 44 Years | 56 (8.9%) | $32,083 |
| 45 to 64 Years | 227 (35.9%) | $39,196 |
| 65+ Years | 308 (48.7%) | $0 |
| Total | 632 (100.0%) | $30,417 |
Poverty in Miami
Income Below Poverty by Sex and Age in Miami
With 21.4% poverty level for males and 28.5% for females among the residents of Miami, 55 to 64 year old males and 6 to 11 year old females are the most vulnerable to poverty, with 53 males (47.7%) and 29 females (87.9%) in their respective age groups living below the poverty level.
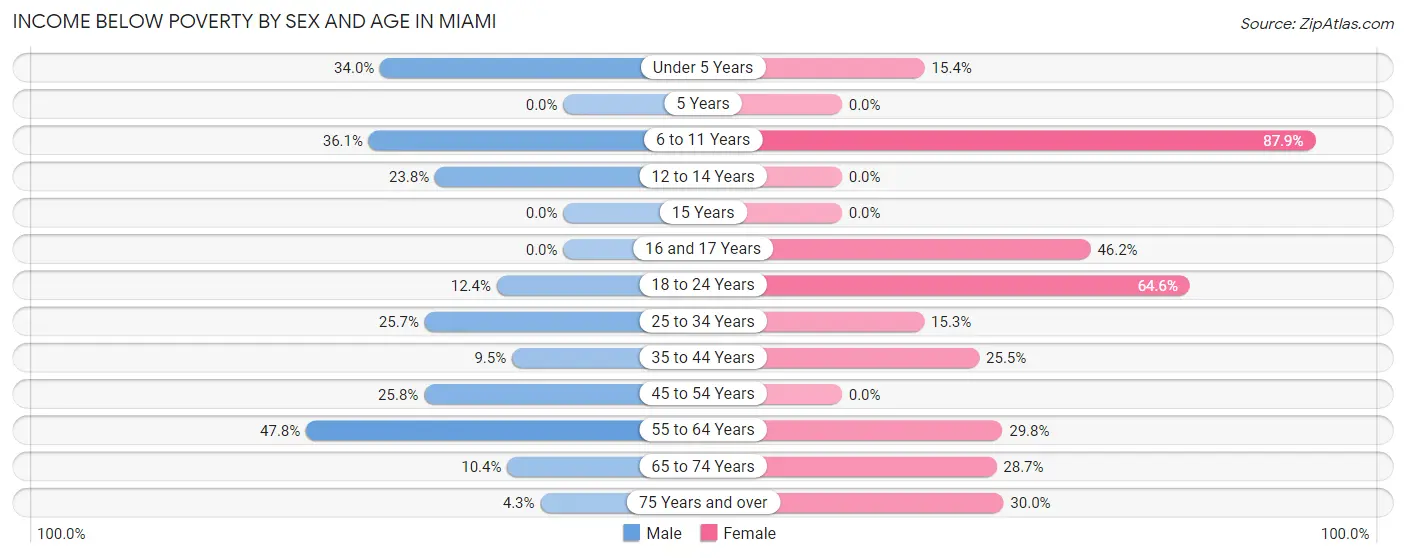
| Age Bracket | Male | Female |
| Under 5 Years | 17 (34.0%) | 6 (15.4%) |
| 5 Years | 0 (0.0%) | 0 (0.0%) |
| 6 to 11 Years | 13 (36.1%) | 29 (87.9%) |
| 12 to 14 Years | 5 (23.8%) | 0 (0.0%) |
| 15 Years | 0 (0.0%) | 0 (0.0%) |
| 16 and 17 Years | 0 (0.0%) | 6 (46.2%) |
| 18 to 24 Years | 10 (12.3%) | 31 (64.6%) |
| 25 to 34 Years | 9 (25.7%) | 11 (15.3%) |
| 35 to 44 Years | 4 (9.5%) | 13 (25.5%) |
| 45 to 54 Years | 23 (25.8%) | 0 (0.0%) |
| 55 to 64 Years | 53 (47.7%) | 28 (29.8%) |
| 65 to 74 Years | 13 (10.4%) | 35 (28.7%) |
| 75 Years and over | 4 (4.3%) | 24 (30.0%) |
| Total | 151 (21.4%) | 183 (28.5%) |
Income Above Poverty by Sex and Age in Miami
According to the poverty statistics in Miami, males aged 5 years and females aged 5 years are the age groups that are most secure financially, with 100.0% of males and 100.0% of females in these age groups living above the poverty line.
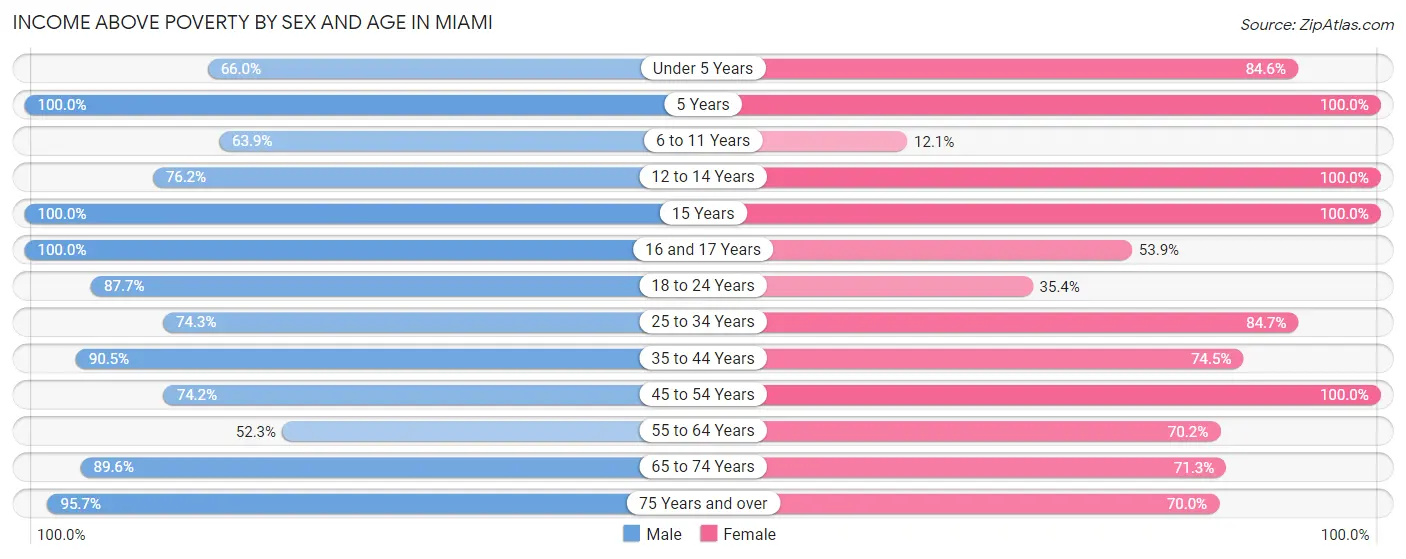
| Age Bracket | Male | Female |
| Under 5 Years | 33 (66.0%) | 33 (84.6%) |
| 5 Years | 13 (100.0%) | 6 (100.0%) |
| 6 to 11 Years | 23 (63.9%) | 4 (12.1%) |
| 12 to 14 Years | 16 (76.2%) | 5 (100.0%) |
| 15 Years | 6 (100.0%) | 6 (100.0%) |
| 16 and 17 Years | 1 (100.0%) | 7 (53.8%) |
| 18 to 24 Years | 71 (87.6%) | 17 (35.4%) |
| 25 to 34 Years | 26 (74.3%) | 61 (84.7%) |
| 35 to 44 Years | 38 (90.5%) | 38 (74.5%) |
| 45 to 54 Years | 66 (74.2%) | 73 (100.0%) |
| 55 to 64 Years | 58 (52.2%) | 66 (70.2%) |
| 65 to 74 Years | 112 (89.6%) | 87 (71.3%) |
| 75 Years and over | 90 (95.7%) | 56 (70.0%) |
| Total | 553 (78.5%) | 459 (71.5%) |
Income Below Poverty Among Married-Couple Families in Miami
The poverty statistics for married-couple families in Miami show that 23.8% or 46 of the total 193 families live below the poverty line. Families with no children have the highest poverty rate of 25.4%, comprising of 36 families. On the other hand, families with 3 or 4 children have the lowest poverty rate of 0.0%, which includes 0 families.
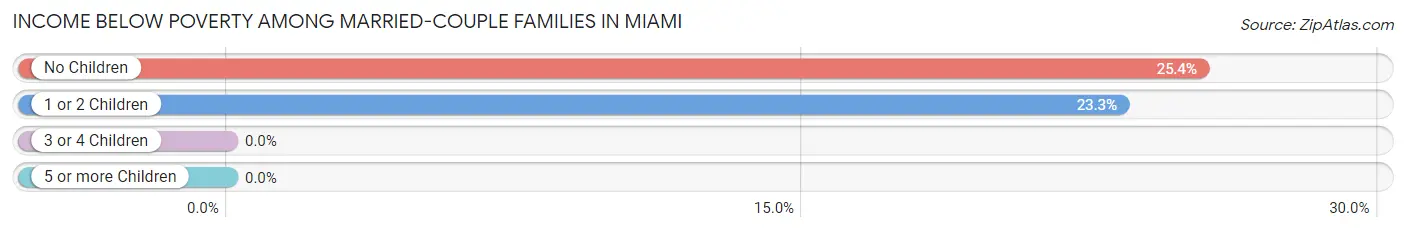
| Children | Above Poverty | Below Poverty |
| No Children | 106 (74.7%) | 36 (25.4%) |
| 1 or 2 Children | 33 (76.7%) | 10 (23.3%) |
| 3 or 4 Children | 8 (100.0%) | 0 (0.0%) |
| 5 or more Children | 0 (0.0%) | 0 (0.0%) |
| Total | 147 (76.2%) | 46 (23.8%) |
Income Below Poverty Among Single-Parent Households in Miami
According to the poverty data in Miami, 52.9% or 27 single-father households and 14.3% or 10 single-mother households are living below the poverty line. Among single-father households, those with 3 or 4 children have the highest poverty rate, with 13 households (68.4%) experiencing poverty. Likewise, among single-mother households, those with no children have the highest poverty rate, with 10 households (20.8%) falling below the poverty line.
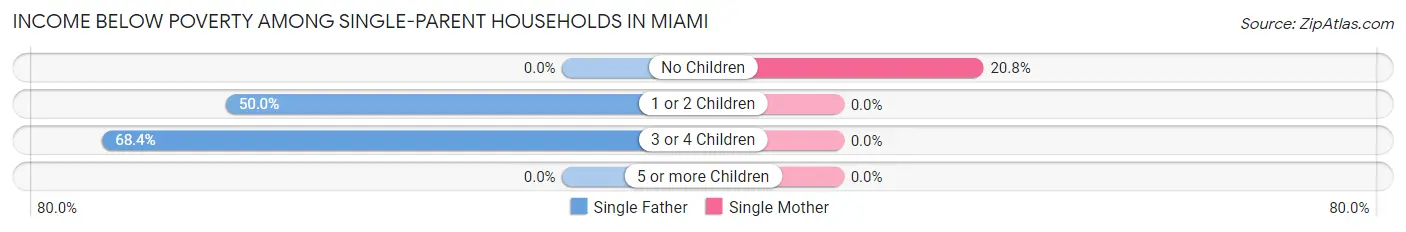
| Children | Single Father | Single Mother |
| No Children | 0 (0.0%) | 10 (20.8%) |
| 1 or 2 Children | 14 (50.0%) | 0 (0.0%) |
| 3 or 4 Children | 13 (68.4%) | 0 (0.0%) |
| 5 or more Children | 0 (0.0%) | 0 (0.0%) |
| Total | 27 (52.9%) | 10 (14.3%) |
Income Below Poverty Among Married-Couple vs Single-Parent Households in Miami
The poverty data for Miami shows that 46 of the married-couple family households (23.8%) and 37 of the single-parent households (30.6%) are living below the poverty level. Within the married-couple family households, those with no children have the highest poverty rate, with 36 households (25.4%) falling below the poverty line. Among the single-parent households, those with 3 or 4 children have the highest poverty rate, with 13 household (68.4%) living below poverty.
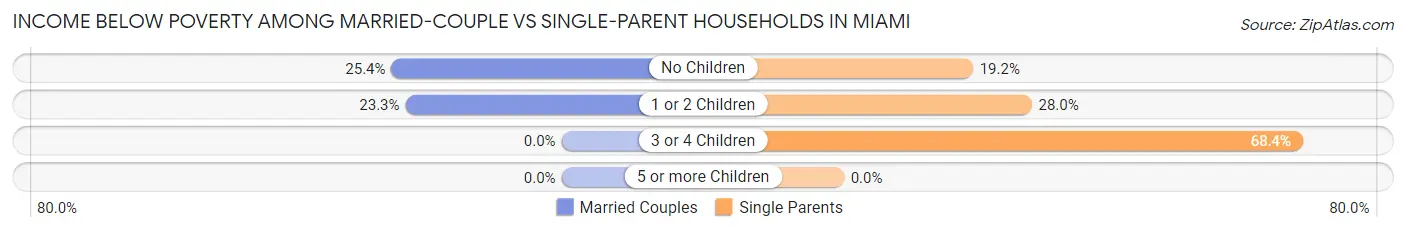
| Children | Married-Couple Families | Single-Parent Households |
| No Children | 36 (25.4%) | 10 (19.2%) |
| 1 or 2 Children | 10 (23.3%) | 14 (28.0%) |
| 3 or 4 Children | 0 (0.0%) | 13 (68.4%) |
| 5 or more Children | 0 (0.0%) | 0 (0.0%) |
| Total | 46 (23.8%) | 37 (30.6%) |
Employment Characteristics in Miami
Employment by Class of Employer in Miami
Among the 460 employed individuals in Miami, private company employees (296 | 64.3%), state government employees (74 | 16.1%), and not-for-profit organizations (38 | 8.3%) make up the most common classes of employment.
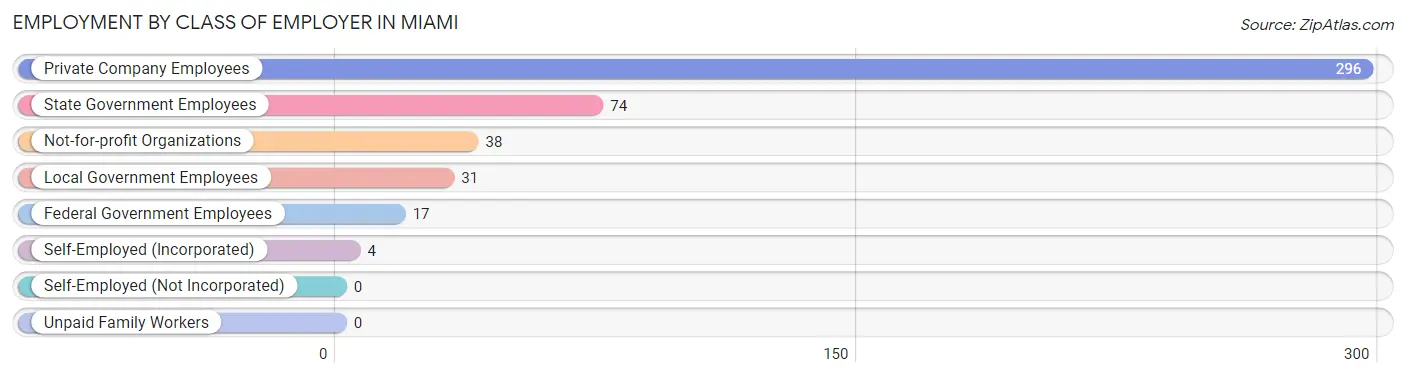
| Employer Class | # Employees | % Employees |
| Private Company Employees | 296 | 64.3% |
| Self-Employed (Incorporated) | 4 | 0.9% |
| Self-Employed (Not Incorporated) | 0 | 0.0% |
| Not-for-profit Organizations | 38 | 8.3% |
| Local Government Employees | 31 | 6.7% |
| State Government Employees | 74 | 16.1% |
| Federal Government Employees | 17 | 3.7% |
| Unpaid Family Workers | 0 | 0.0% |
| Total | 460 | 100.0% |
Employment Status by Age in Miami
According to the labor force statistics for Miami, out of the total population over 16 years of age (1,131), 50.0% or 566 individuals are in the labor force, with 15.9% or 90 of them unemployed. The age group with the highest labor force participation rate is 20 to 24 years, with 100.0% or 80 individuals in the labor force. Within the labor force, the 25 to 29 years age range has the highest percentage of unemployed individuals, with 42.1% or 16 of them being unemployed.
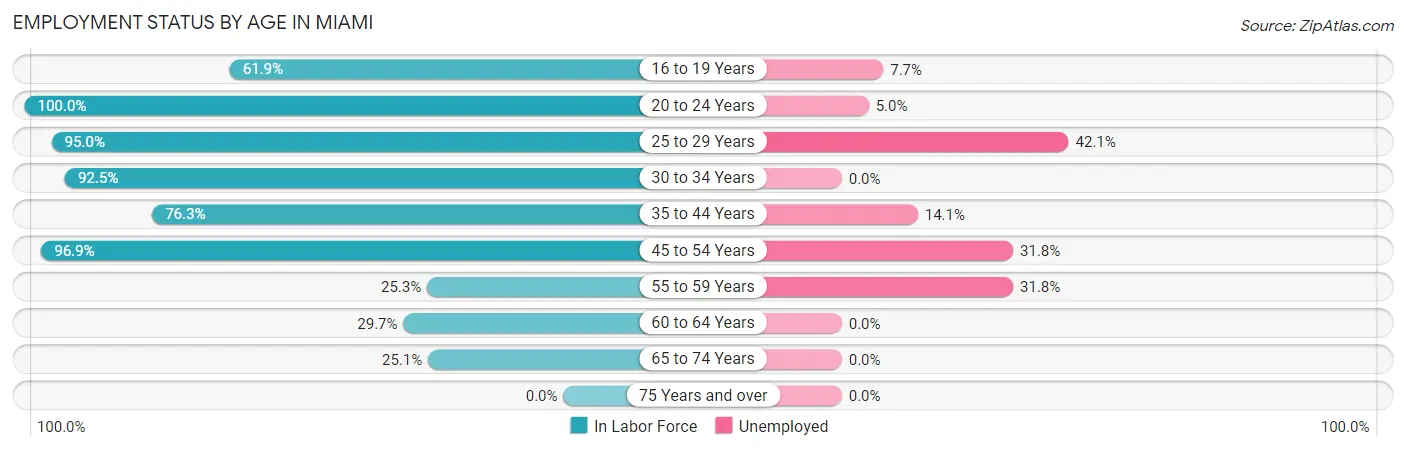
| Age Bracket | In Labor Force | Unemployed |
| 16 to 19 Years | 39 (61.9%) | 3 (7.7%) |
| 20 to 24 Years | 80 (100.0%) | 4 (5.0%) |
| 25 to 29 Years | 38 (95.0%) | 16 (42.1%) |
| 30 to 34 Years | 62 (92.5%) | 0 (0.0%) |
| 35 to 44 Years | 71 (76.3%) | 10 (14.1%) |
| 45 to 54 Years | 157 (96.9%) | 50 (31.8%) |
| 55 to 59 Years | 22 (25.3%) | 7 (31.8%) |
| 60 to 64 Years | 35 (29.7%) | 0 (0.0%) |
| 65 to 74 Years | 62 (25.1%) | 0 (0.0%) |
| 75 Years and over | 0 (0.0%) | 0 (0.0%) |
| Total | 566 (50.0%) | 90 (15.9%) |
Employment Status by Educational Attainment in Miami
According to labor force statistics for Miami, 67.9% of individuals (385) out of the total population between 25 and 64 years of age (567) are in the labor force, with 21.6% or 83 of them being unemployed. The group with the highest labor force participation rate are those with the educational attainment of bachelor's degree or higher, with 88.8% or 111 individuals in the labor force. Within the labor force, individuals with college / associate degree education have the highest percentage of unemployment, with 35.5% or 33 of them being unemployed.
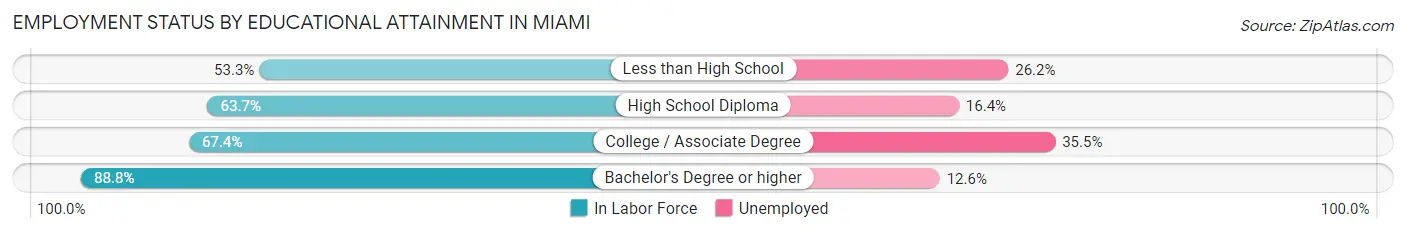
| Educational Attainment | In Labor Force | Unemployed |
| Less than High School | 65 (53.3%) | 32 (26.2%) |
| High School Diploma | 116 (63.7%) | 30 (16.4%) |
| College / Associate Degree | 93 (67.4%) | 49 (35.5%) |
| Bachelor's Degree or higher | 111 (88.8%) | 16 (12.6%) |
| Total | 385 (67.9%) | 122 (21.6%) |
Employment Occupations by Sex in Miami
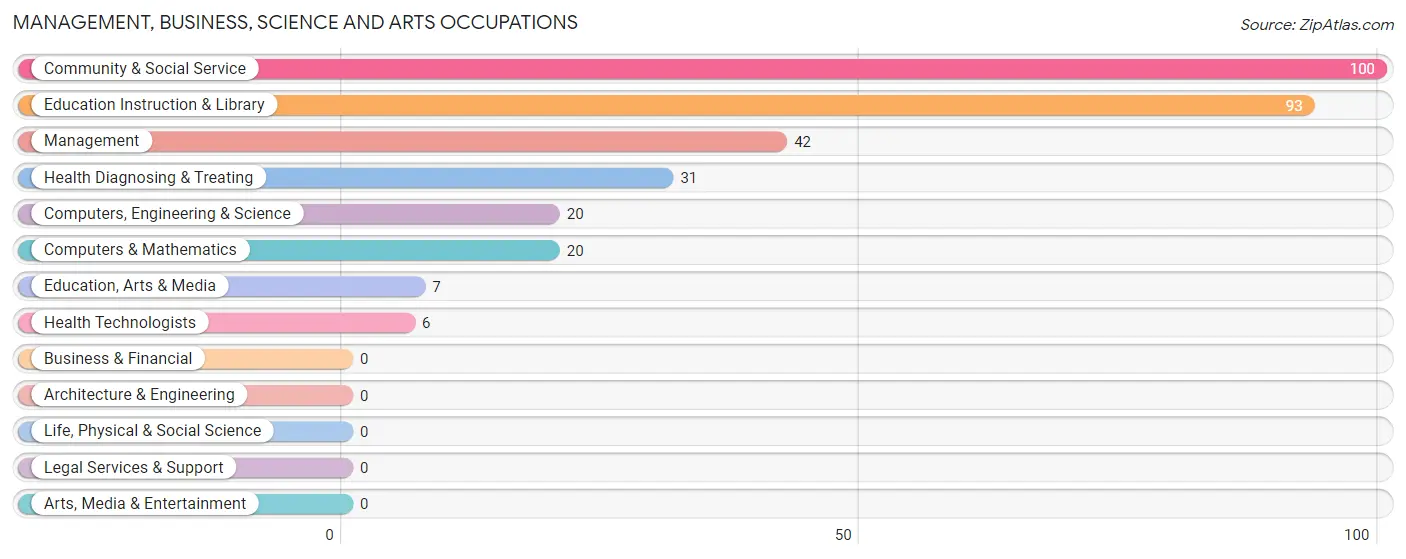
Management, Business, Science and Arts Occupations
The most common Management, Business, Science and Arts occupations in Miami are Community & Social Service (100 | 21.0%), Education Instruction & Library (93 | 19.5%), Management (42 | 8.8%), Health Diagnosing & Treating (31 | 6.5%), and Computers, Engineering & Science (20 | 4.2%).
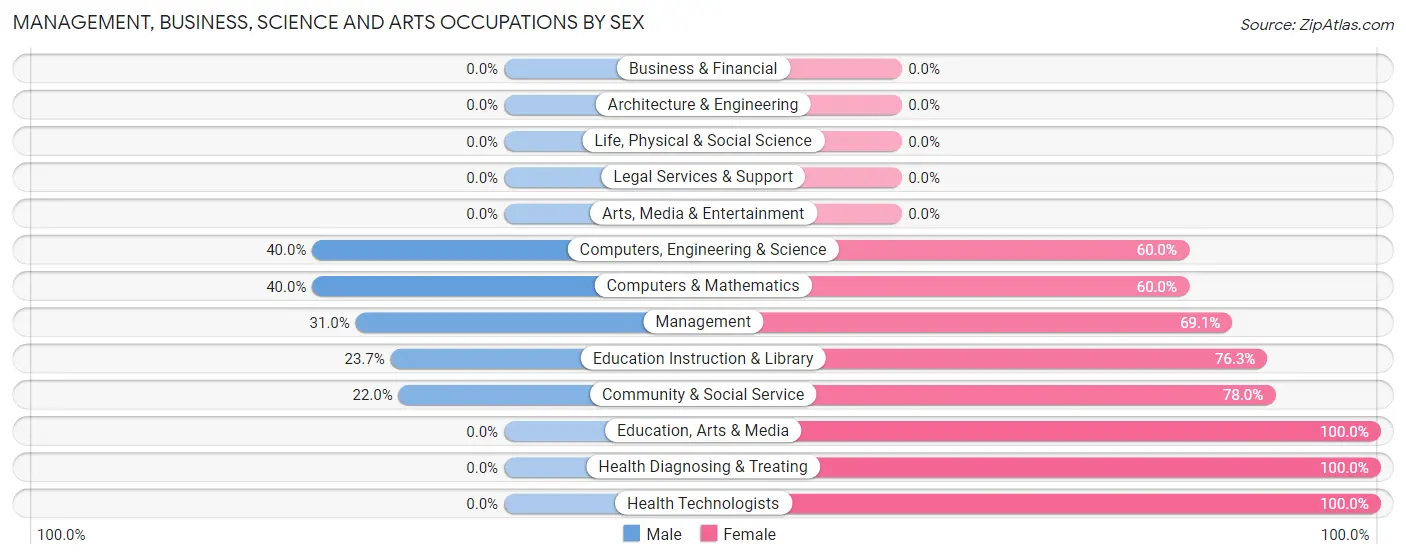
Management, Business, Science and Arts Occupations by Sex
Within the Management, Business, Science and Arts occupations in Miami, the most male-oriented occupations are Computers, Engineering & Science (40.0%), Computers & Mathematics (40.0%), and Management (30.9%), while the most female-oriented occupations are Education, Arts & Media (100.0%), Health Diagnosing & Treating (100.0%), and Health Technologists (100.0%).
| Occupation | Male | Female |
| Management | 13 (30.9%) | 29 (69.1%) |
| Business & Financial | 0 (0.0%) | 0 (0.0%) |
| Computers, Engineering & Science | 8 (40.0%) | 12 (60.0%) |
| Computers & Mathematics | 8 (40.0%) | 12 (60.0%) |
| Architecture & Engineering | 0 (0.0%) | 0 (0.0%) |
| Life, Physical & Social Science | 0 (0.0%) | 0 (0.0%) |
| Community & Social Service | 22 (22.0%) | 78 (78.0%) |
| Education, Arts & Media | 0 (0.0%) | 7 (100.0%) |
| Legal Services & Support | 0 (0.0%) | 0 (0.0%) |
| Education Instruction & Library | 22 (23.7%) | 71 (76.3%) |
| Arts, Media & Entertainment | 0 (0.0%) | 0 (0.0%) |
| Health Diagnosing & Treating | 0 (0.0%) | 31 (100.0%) |
| Health Technologists | 0 (0.0%) | 6 (100.0%) |
| Total (Category) | 43 (22.3%) | 150 (77.7%) |
| Total (Overall) | 253 (53.1%) | 223 (46.9%) |
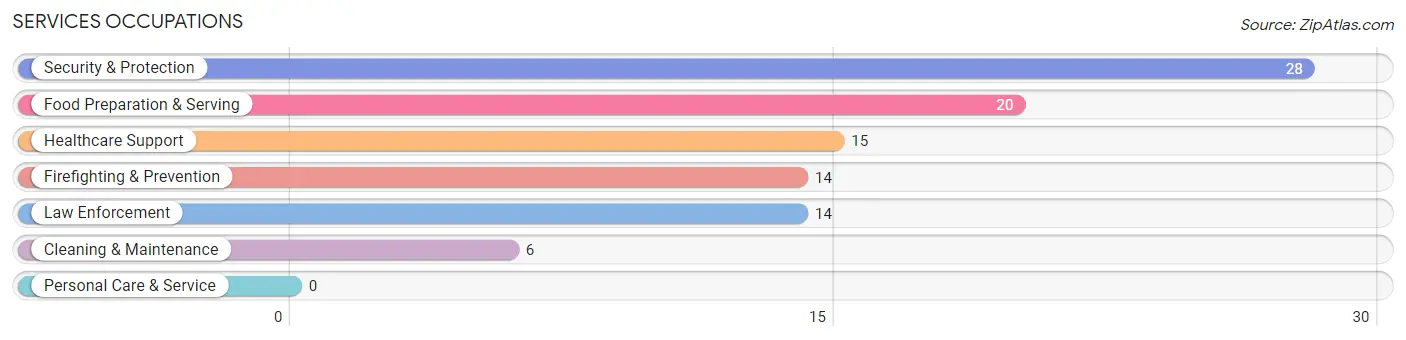
Services Occupations
The most common Services occupations in Miami are Security & Protection (28 | 5.9%), Food Preparation & Serving (20 | 4.2%), Healthcare Support (15 | 3.2%), Firefighting & Prevention (14 | 2.9%), and Law Enforcement (14 | 2.9%).
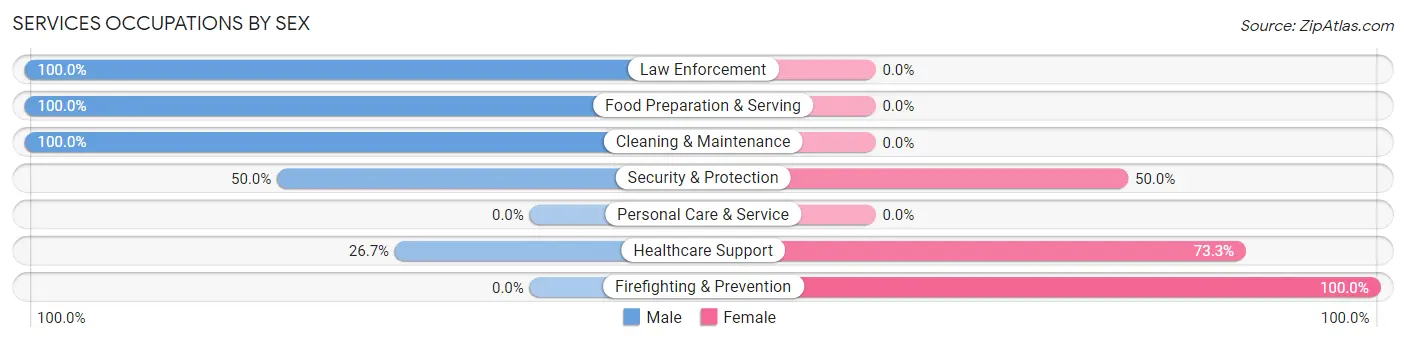
Services Occupations by Sex
Within the Services occupations in Miami, the most male-oriented occupations are Law Enforcement (100.0%), Food Preparation & Serving (100.0%), and Cleaning & Maintenance (100.0%), while the most female-oriented occupations are Firefighting & Prevention (100.0%), Healthcare Support (73.3%), and Security & Protection (50.0%).
| Occupation | Male | Female |
| Healthcare Support | 4 (26.7%) | 11 (73.3%) |
| Security & Protection | 14 (50.0%) | 14 (50.0%) |
| Firefighting & Prevention | 0 (0.0%) | 14 (100.0%) |
| Law Enforcement | 14 (100.0%) | 0 (0.0%) |
| Food Preparation & Serving | 20 (100.0%) | 0 (0.0%) |
| Cleaning & Maintenance | 6 (100.0%) | 0 (0.0%) |
| Personal Care & Service | 0 (0.0%) | 0 (0.0%) |
| Total (Category) | 44 (63.8%) | 25 (36.2%) |
| Total (Overall) | 253 (53.1%) | 223 (46.9%) |
Sales and Office Occupations
The most common Sales and Office occupations in Miami are Sales & Related (65 | 13.7%), and Office & Administration (16 | 3.4%).

Sales and Office Occupations by Sex

| Occupation | Male | Female |
| Sales & Related | 41 (63.1%) | 24 (36.9%) |
| Office & Administration | 0 (0.0%) | 16 (100.0%) |
| Total (Category) | 41 (50.6%) | 40 (49.4%) |
| Total (Overall) | 253 (53.1%) | 223 (46.9%) |
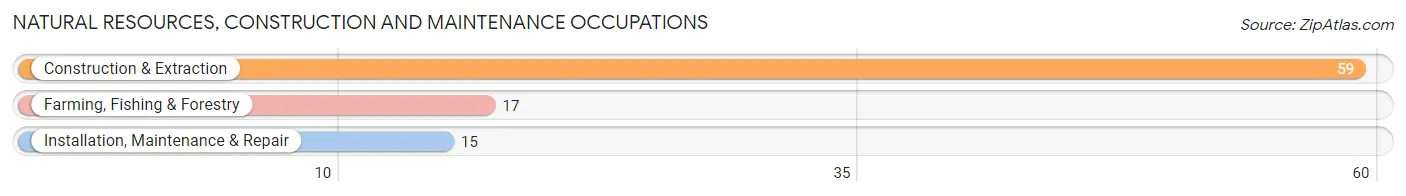
Natural Resources, Construction and Maintenance Occupations
The most common Natural Resources, Construction and Maintenance occupations in Miami are Construction & Extraction (59 | 12.4%), Farming, Fishing & Forestry (17 | 3.6%), and Installation, Maintenance & Repair (15 | 3.2%).
Natural Resources, Construction and Maintenance Occupations by Sex
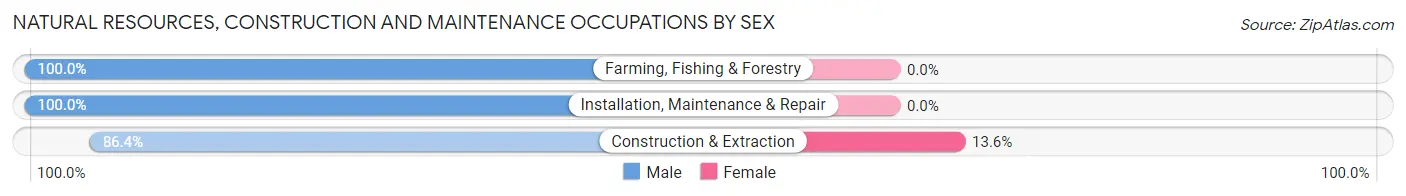
| Occupation | Male | Female |
| Farming, Fishing & Forestry | 17 (100.0%) | 0 (0.0%) |
| Construction & Extraction | 51 (86.4%) | 8 (13.6%) |
| Installation, Maintenance & Repair | 15 (100.0%) | 0 (0.0%) |
| Total (Category) | 83 (91.2%) | 8 (8.8%) |
| Total (Overall) | 253 (53.1%) | 223 (46.9%) |
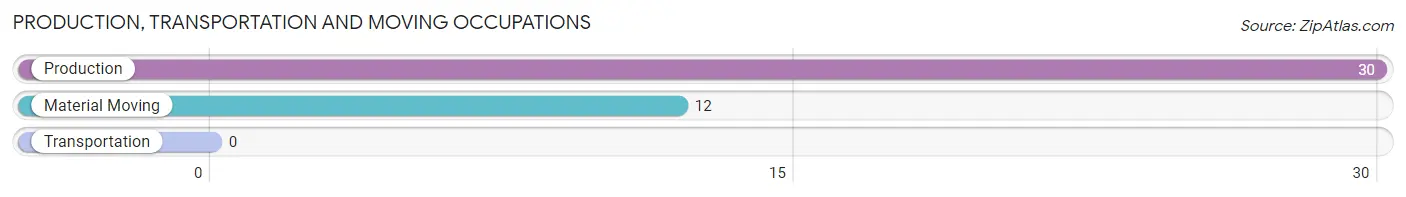
Production, Transportation and Moving Occupations
The most common Production, Transportation and Moving occupations in Miami are Production (30 | 6.3%), and Material Moving (12 | 2.5%).
Production, Transportation and Moving Occupations by Sex
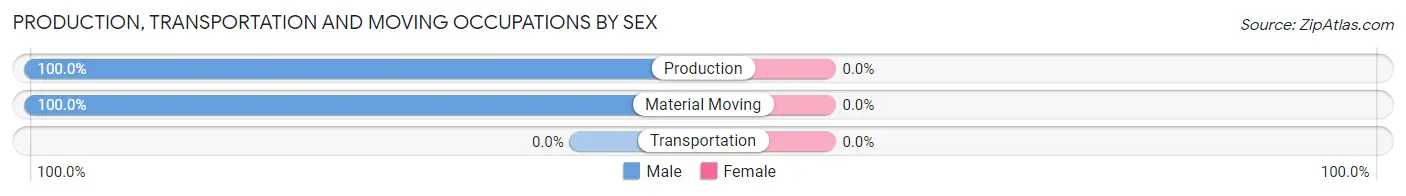
| Occupation | Male | Female |
| Production | 30 (100.0%) | 0 (0.0%) |
| Transportation | 0 (0.0%) | 0 (0.0%) |
| Material Moving | 12 (100.0%) | 0 (0.0%) |
| Total (Category) | 42 (100.0%) | 0 (0.0%) |
| Total (Overall) | 253 (53.1%) | 223 (46.9%) |
Employment Industries by Sex in Miami
Employment Industries in Miami
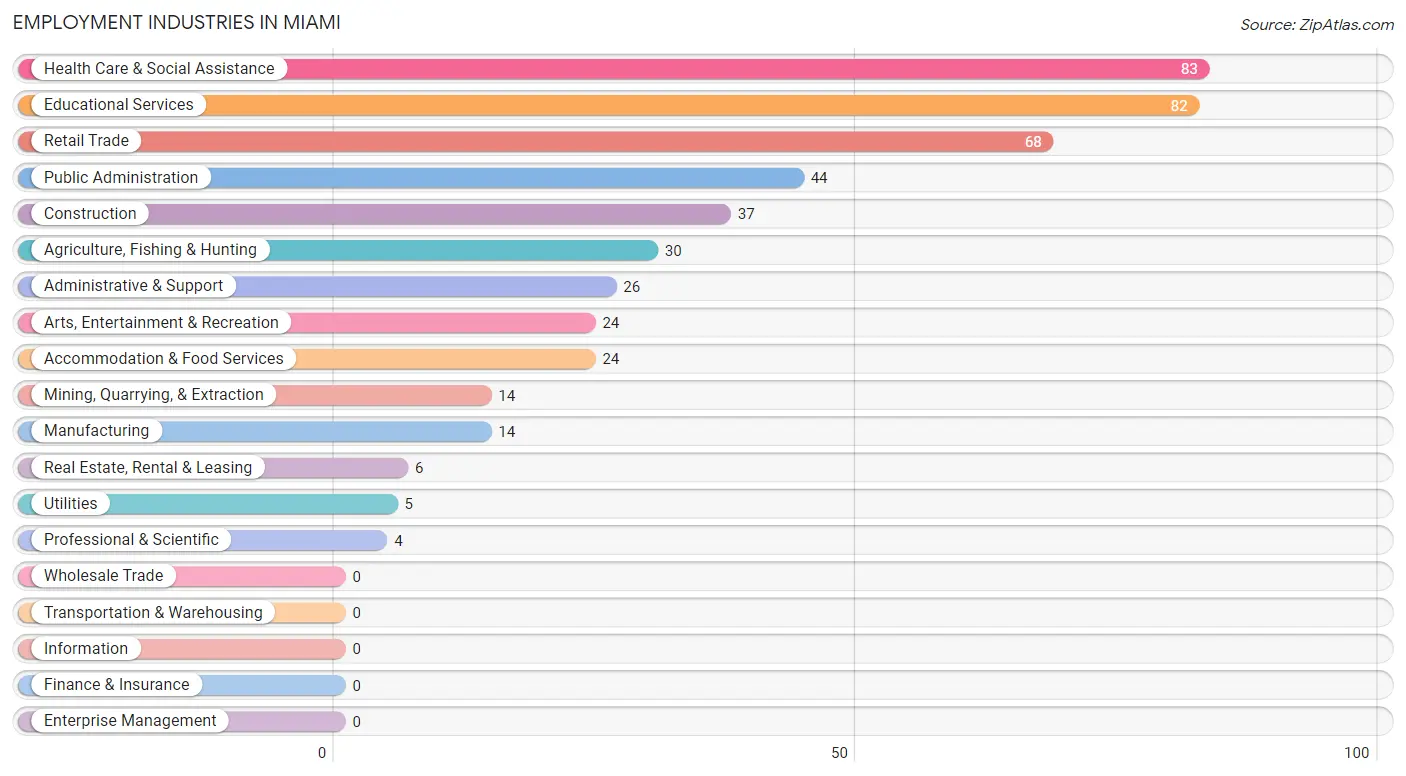
The major employment industries in Miami include Health Care & Social Assistance (83 | 17.4%), Educational Services (82 | 17.2%), Retail Trade (68 | 14.3%), Public Administration (44 | 9.2%), and Construction (37 | 7.8%).
Employment Industries by Sex in Miami
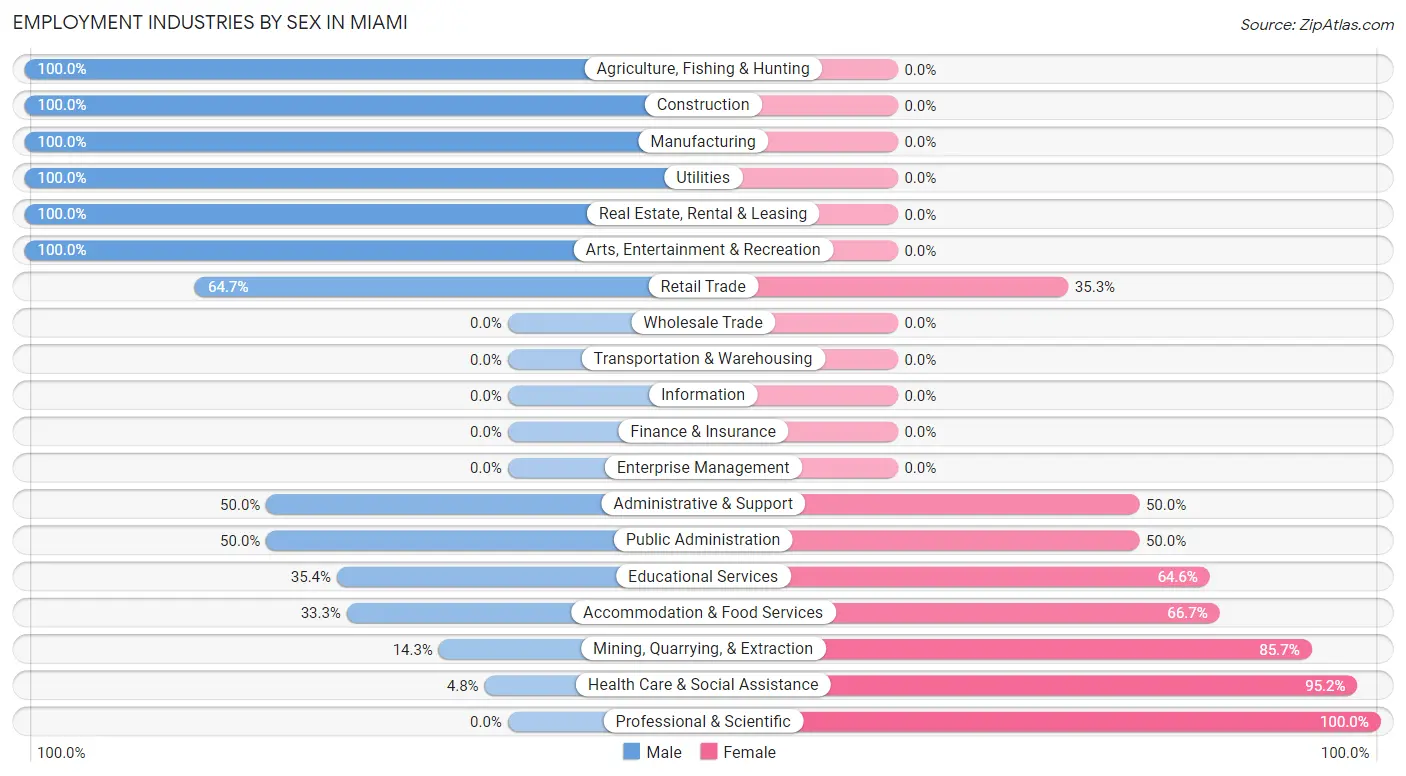
The Miami industries that see more men than women are Agriculture, Fishing & Hunting (100.0%), Construction (100.0%), and Manufacturing (100.0%), whereas the industries that tend to have a higher number of women are Professional & Scientific (100.0%), Health Care & Social Assistance (95.2%), and Mining, Quarrying, & Extraction (85.7%).
| Industry | Male | Female |
| Agriculture, Fishing & Hunting | 30 (100.0%) | 0 (0.0%) |
| Mining, Quarrying, & Extraction | 2 (14.3%) | 12 (85.7%) |
| Construction | 37 (100.0%) | 0 (0.0%) |
| Manufacturing | 14 (100.0%) | 0 (0.0%) |
| Wholesale Trade | 0 (0.0%) | 0 (0.0%) |
| Retail Trade | 44 (64.7%) | 24 (35.3%) |
| Transportation & Warehousing | 0 (0.0%) | 0 (0.0%) |
| Utilities | 5 (100.0%) | 0 (0.0%) |
| Information | 0 (0.0%) | 0 (0.0%) |
| Finance & Insurance | 0 (0.0%) | 0 (0.0%) |
| Real Estate, Rental & Leasing | 6 (100.0%) | 0 (0.0%) |
| Professional & Scientific | 0 (0.0%) | 4 (100.0%) |
| Enterprise Management | 0 (0.0%) | 0 (0.0%) |
| Administrative & Support | 13 (50.0%) | 13 (50.0%) |
| Educational Services | 29 (35.4%) | 53 (64.6%) |
| Health Care & Social Assistance | 4 (4.8%) | 79 (95.2%) |
| Arts, Entertainment & Recreation | 24 (100.0%) | 0 (0.0%) |
| Accommodation & Food Services | 8 (33.3%) | 16 (66.7%) |
| Public Administration | 22 (50.0%) | 22 (50.0%) |
| Total | 253 (53.1%) | 223 (46.9%) |
Education in Miami
School Enrollment in Miami
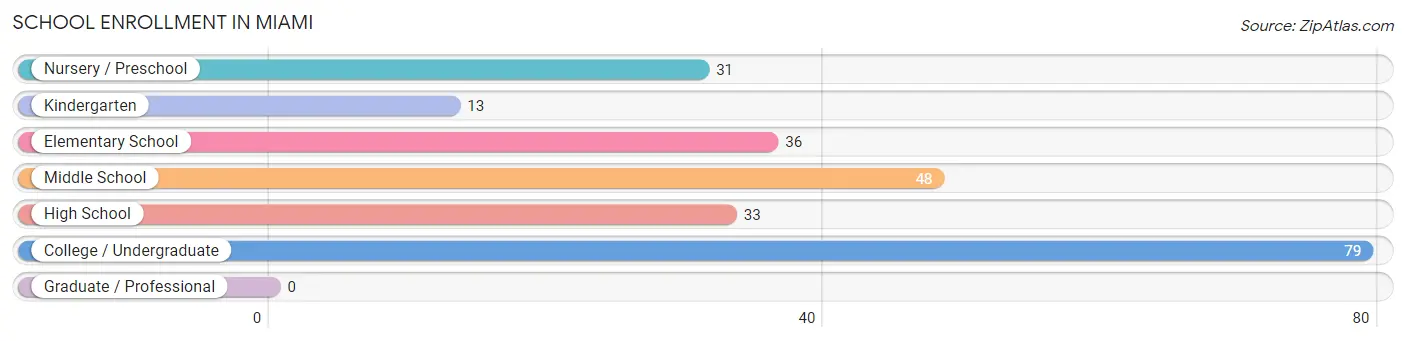
The most common levels of schooling among the 240 students in Miami are college / undergraduate (79 | 32.9%), middle school (48 | 20.0%), and elementary school (36 | 15.0%).
| School Level | # Students | % Students |
| Nursery / Preschool | 31 | 12.9% |
| Kindergarten | 13 | 5.4% |
| Elementary School | 36 | 15.0% |
| Middle School | 48 | 20.0% |
| High School | 33 | 13.8% |
| College / Undergraduate | 79 | 32.9% |
| Graduate / Professional | 0 | 0.0% |
| Total | 240 | 100.0% |
School Enrollment by Age by Funding Source in Miami
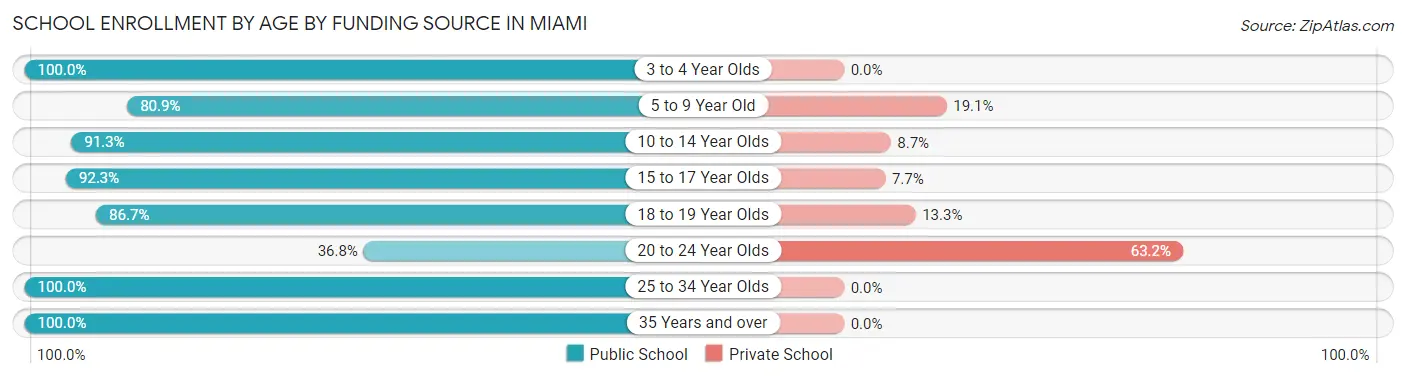
Out of a total of 240 students who are enrolled in schools in Miami, 33 (13.8%) attend a private institution, while the remaining 207 (86.2%) are enrolled in public schools. The age group of 20 to 24 year olds has the highest likelihood of being enrolled in private schools, with 12 (63.2% in the age bracket) enrolled. Conversely, the age group of 3 to 4 year olds has the lowest likelihood of being enrolled in a private school, with 12 (100.0% in the age bracket) attending a public institution.
| Age Bracket | Public School | Private School |
| 3 to 4 Year Olds | 12 (100.0%) | 0 (0.0%) |
| 5 to 9 Year Old | 55 (80.9%) | 13 (19.1%) |
| 10 to 14 Year Olds | 42 (91.3%) | 4 (8.7%) |
| 15 to 17 Year Olds | 24 (92.3%) | 2 (7.7%) |
| 18 to 19 Year Olds | 13 (86.7%) | 2 (13.3%) |
| 20 to 24 Year Olds | 7 (36.8%) | 12 (63.2%) |
| 25 to 34 Year Olds | 45 (100.0%) | 0 (0.0%) |
| 35 Years and over | 9 (100.0%) | 0 (0.0%) |
| Total | 207 (86.3%) | 33 (13.8%) |
Educational Attainment by Field of Study in Miami
Education (98 | 56.0%), business (35 | 20.0%), science & technology (28 | 16.0%), arts & humanities (9 | 5.1%), and visual & performing arts (5 | 2.9%) are the most common fields of study among 175 individuals in Miami who have obtained a bachelor's degree or higher.
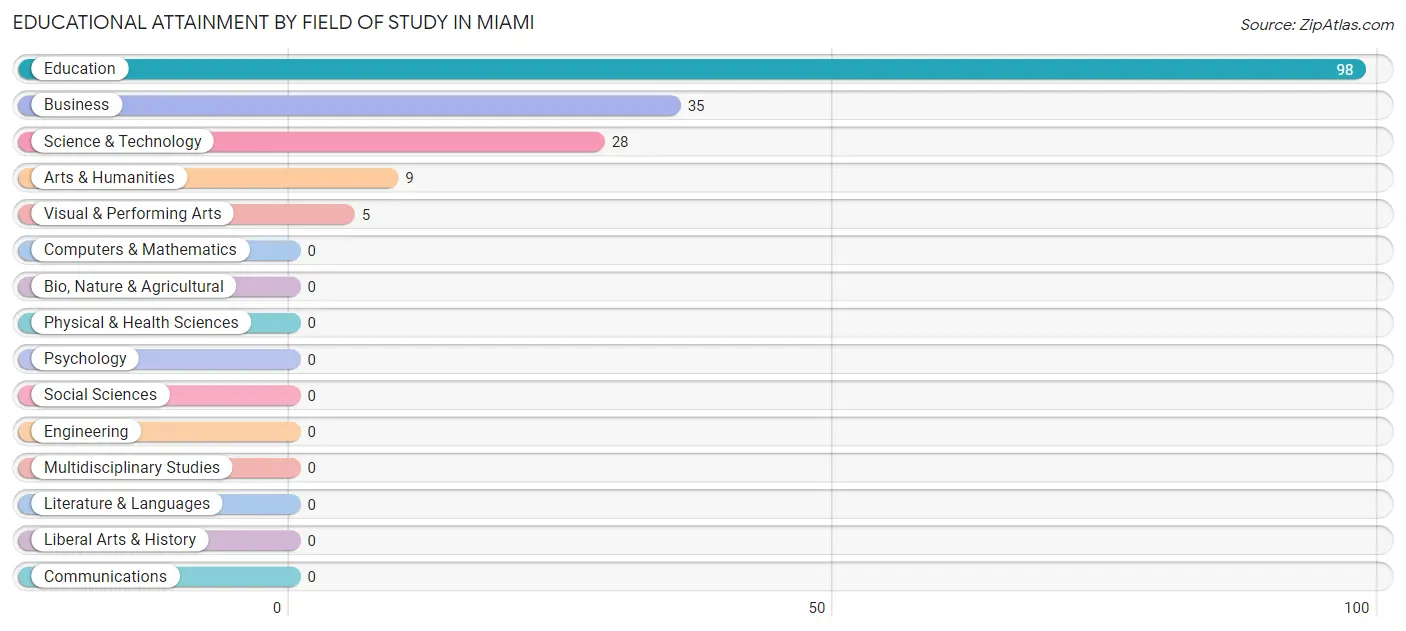
| Field of Study | # Graduates | % Graduates |
| Computers & Mathematics | 0 | 0.0% |
| Bio, Nature & Agricultural | 0 | 0.0% |
| Physical & Health Sciences | 0 | 0.0% |
| Psychology | 0 | 0.0% |
| Social Sciences | 0 | 0.0% |
| Engineering | 0 | 0.0% |
| Multidisciplinary Studies | 0 | 0.0% |
| Science & Technology | 28 | 16.0% |
| Business | 35 | 20.0% |
| Education | 98 | 56.0% |
| Literature & Languages | 0 | 0.0% |
| Liberal Arts & History | 0 | 0.0% |
| Visual & Performing Arts | 5 | 2.9% |
| Communications | 0 | 0.0% |
| Arts & Humanities | 9 | 5.1% |
| Total | 175 | 100.0% |
Transportation & Commute in Miami
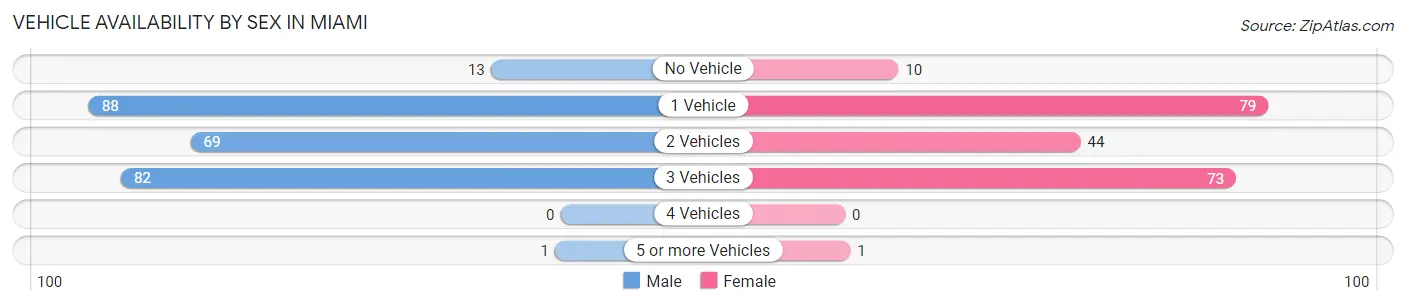
Vehicle Availability by Sex in Miami
The most prevalent vehicle ownership categories in Miami are males with 1 vehicle (88, accounting for 34.8%) and females with 1 vehicle (79, making up 42.5%).
| Vehicles Available | Male | Female |
| No Vehicle | 13 (5.1%) | 10 (4.8%) |
| 1 Vehicle | 88 (34.8%) | 79 (38.2%) |
| 2 Vehicles | 69 (27.3%) | 44 (21.3%) |
| 3 Vehicles | 82 (32.4%) | 73 (35.3%) |
| 4 Vehicles | 0 (0.0%) | 0 (0.0%) |
| 5 or more Vehicles | 1 (0.4%) | 1 (0.5%) |
| Total | 253 (100.0%) | 207 (100.0%) |
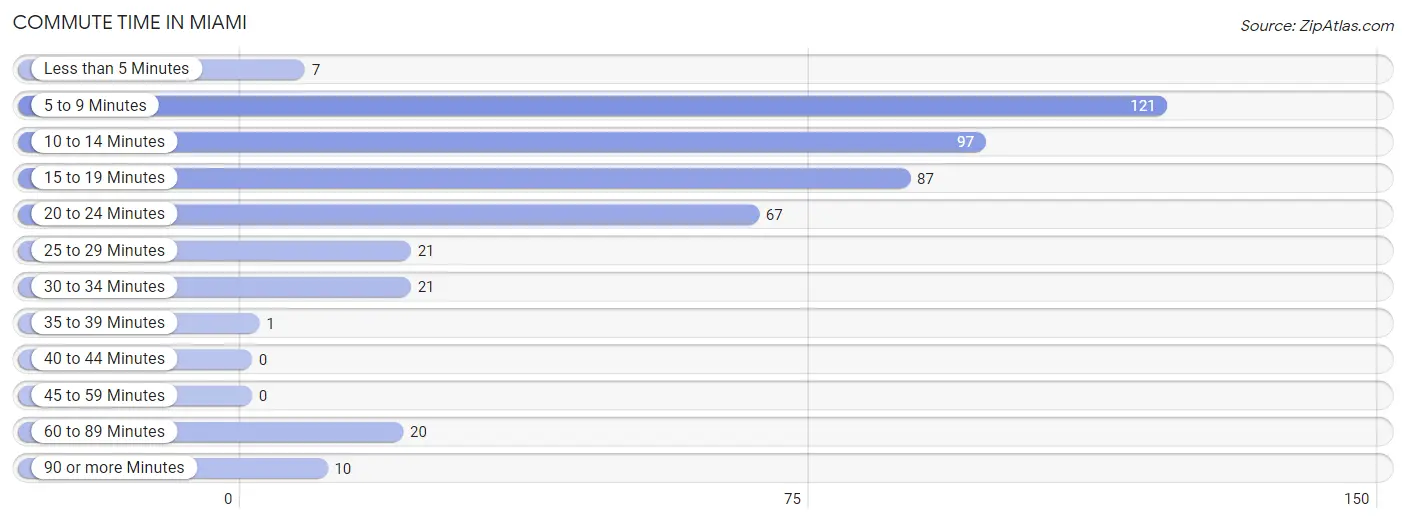
Commute Time in Miami
The most frequently occuring commute durations in Miami are 5 to 9 minutes (121 commuters, 26.8%), 10 to 14 minutes (97 commuters, 21.5%), and 15 to 19 minutes (87 commuters, 19.3%).
| Commute Time | # Commuters | % Commuters |
| Less than 5 Minutes | 7 | 1.5% |
| 5 to 9 Minutes | 121 | 26.8% |
| 10 to 14 Minutes | 97 | 21.5% |
| 15 to 19 Minutes | 87 | 19.3% |
| 20 to 24 Minutes | 67 | 14.8% |
| 25 to 29 Minutes | 21 | 4.6% |
| 30 to 34 Minutes | 21 | 4.6% |
| 35 to 39 Minutes | 1 | 0.2% |
| 40 to 44 Minutes | 0 | 0.0% |
| 45 to 59 Minutes | 0 | 0.0% |
| 60 to 89 Minutes | 20 | 4.4% |
| 90 or more Minutes | 10 | 2.2% |
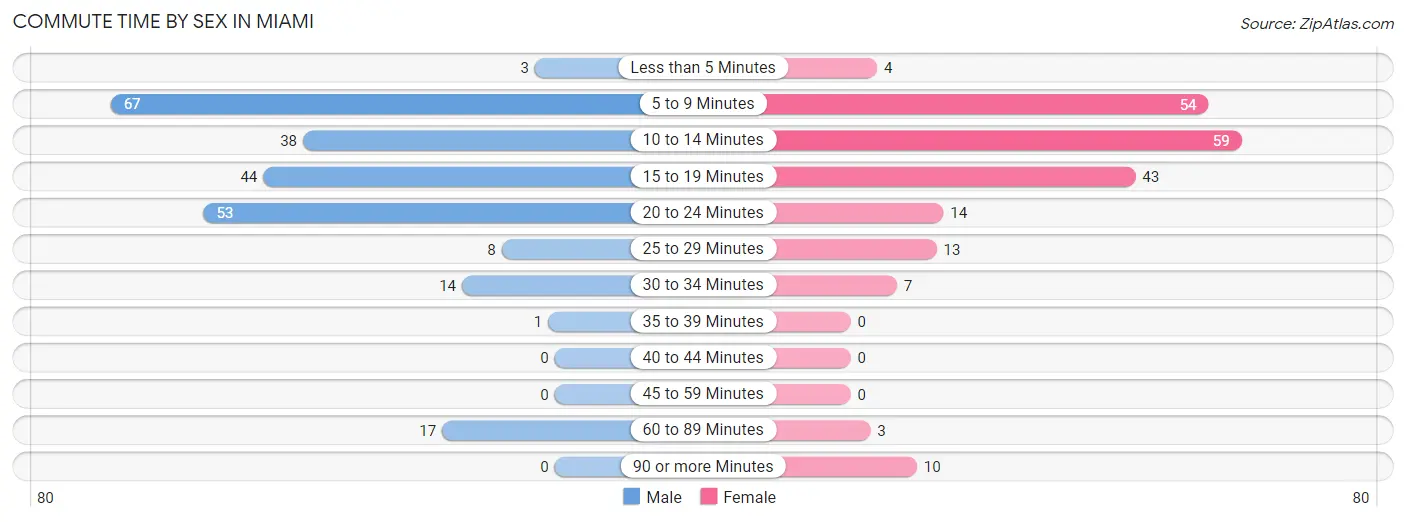
Commute Time by Sex in Miami
The most common commute times in Miami are 5 to 9 minutes (67 commuters, 27.4%) for males and 10 to 14 minutes (59 commuters, 28.5%) for females.
| Commute Time | Male | Female |
| Less than 5 Minutes | 3 (1.2%) | 4 (1.9%) |
| 5 to 9 Minutes | 67 (27.4%) | 54 (26.1%) |
| 10 to 14 Minutes | 38 (15.5%) | 59 (28.5%) |
| 15 to 19 Minutes | 44 (18.0%) | 43 (20.8%) |
| 20 to 24 Minutes | 53 (21.6%) | 14 (6.8%) |
| 25 to 29 Minutes | 8 (3.3%) | 13 (6.3%) |
| 30 to 34 Minutes | 14 (5.7%) | 7 (3.4%) |
| 35 to 39 Minutes | 1 (0.4%) | 0 (0.0%) |
| 40 to 44 Minutes | 0 (0.0%) | 0 (0.0%) |
| 45 to 59 Minutes | 0 (0.0%) | 0 (0.0%) |
| 60 to 89 Minutes | 17 (6.9%) | 3 (1.5%) |
| 90 or more Minutes | 0 (0.0%) | 10 (4.8%) |
Time of Departure to Work by Sex in Miami
The most frequent times of departure to work in Miami are 5:30 AM to 5:59 AM (54, 22.0%) for males and 7:30 AM to 7:59 AM (57, 27.5%) for females.
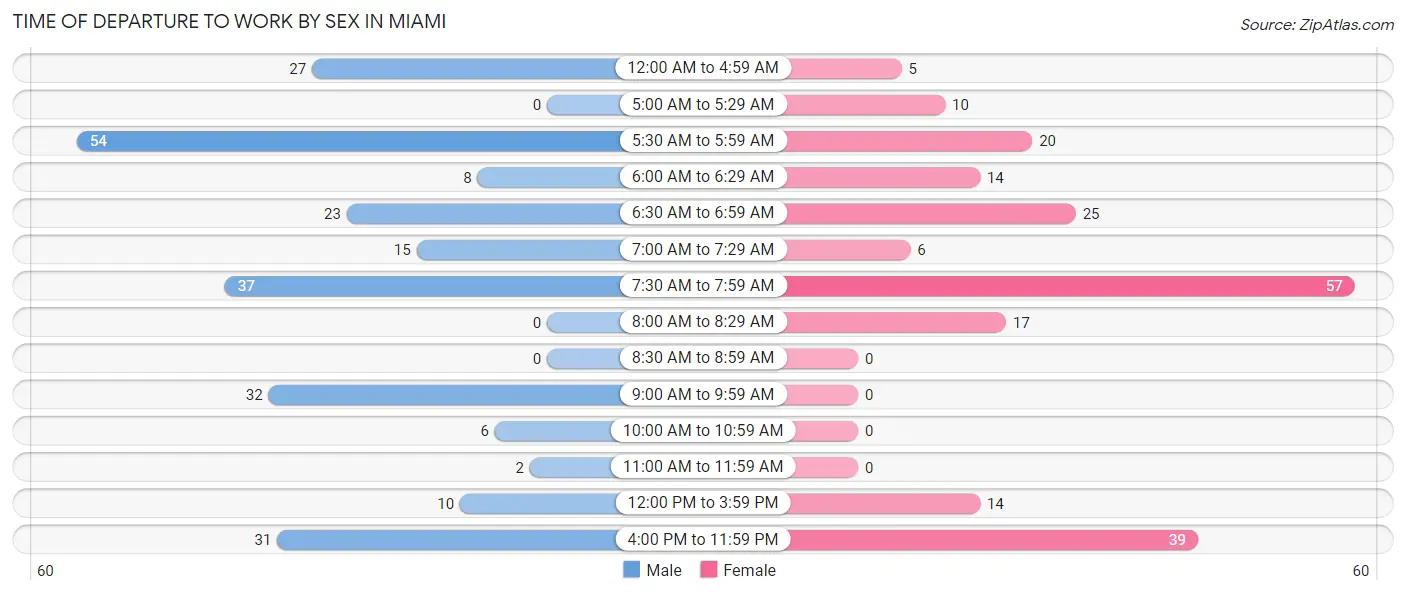
| Time of Departure | Male | Female |
| 12:00 AM to 4:59 AM | 27 (11.0%) | 5 (2.4%) |
| 5:00 AM to 5:29 AM | 0 (0.0%) | 10 (4.8%) |
| 5:30 AM to 5:59 AM | 54 (22.0%) | 20 (9.7%) |
| 6:00 AM to 6:29 AM | 8 (3.3%) | 14 (6.8%) |
| 6:30 AM to 6:59 AM | 23 (9.4%) | 25 (12.1%) |
| 7:00 AM to 7:29 AM | 15 (6.1%) | 6 (2.9%) |
| 7:30 AM to 7:59 AM | 37 (15.1%) | 57 (27.5%) |
| 8:00 AM to 8:29 AM | 0 (0.0%) | 17 (8.2%) |
| 8:30 AM to 8:59 AM | 0 (0.0%) | 0 (0.0%) |
| 9:00 AM to 9:59 AM | 32 (13.1%) | 0 (0.0%) |
| 10:00 AM to 10:59 AM | 6 (2.5%) | 0 (0.0%) |
| 11:00 AM to 11:59 AM | 2 (0.8%) | 0 (0.0%) |
| 12:00 PM to 3:59 PM | 10 (4.1%) | 14 (6.8%) |
| 4:00 PM to 11:59 PM | 31 (12.7%) | 39 (18.8%) |
| Total | 245 (100.0%) | 207 (100.0%) |
Housing Occupancy in Miami
Occupancy by Ownership in Miami
Of the total 632 dwellings in Miami, owner-occupied units account for 426 (67.4%), while renter-occupied units make up 206 (32.6%).
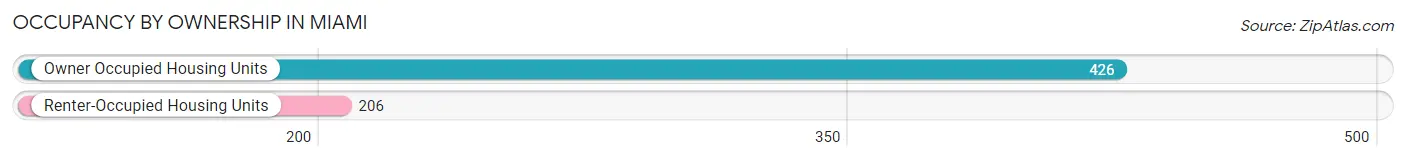
| Occupancy | # Housing Units | % Housing Units |
| Owner Occupied Housing Units | 426 | 67.4% |
| Renter-Occupied Housing Units | 206 | 32.6% |
| Total Occupied Housing Units | 632 | 100.0% |
Occupancy by Household Size in Miami
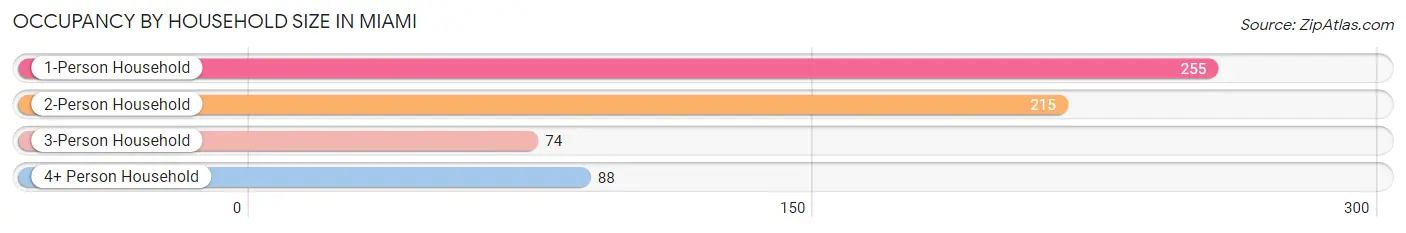
| Household Size | # Housing Units | % Housing Units |
| 1-Person Household | 255 | 40.4% |
| 2-Person Household | 215 | 34.0% |
| 3-Person Household | 74 | 11.7% |
| 4+ Person Household | 88 | 13.9% |
| Total Housing Units | 632 | 100.0% |
Occupancy by Ownership by Household Size in Miami
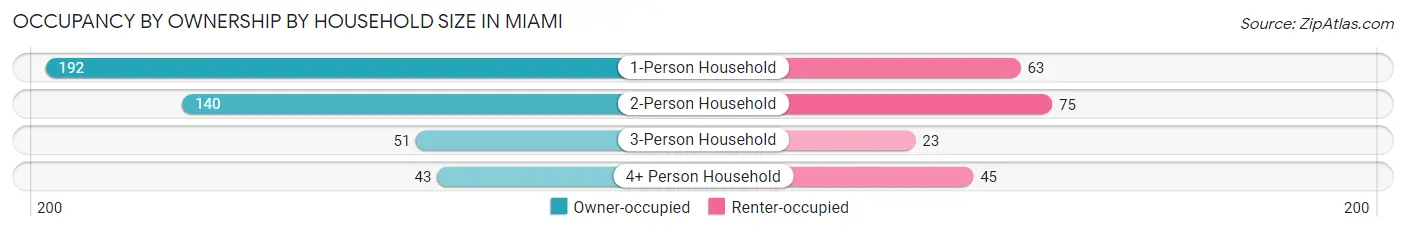
| Household Size | Owner-occupied | Renter-occupied |
| 1-Person Household | 192 (75.3%) | 63 (24.7%) |
| 2-Person Household | 140 (65.1%) | 75 (34.9%) |
| 3-Person Household | 51 (68.9%) | 23 (31.1%) |
| 4+ Person Household | 43 (48.9%) | 45 (51.1%) |
| Total Housing Units | 426 (67.4%) | 206 (32.6%) |
Occupancy by Educational Attainment in Miami
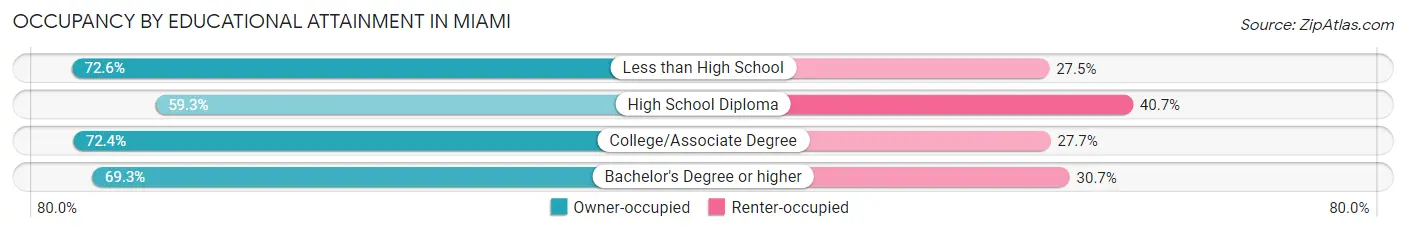
| Household Size | Owner-occupied | Renter-occupied |
| Less than High School | 111 (72.6%) | 42 (27.5%) |
| High School Diploma | 131 (59.3%) | 90 (40.7%) |
| College/Associate Degree | 123 (72.4%) | 47 (27.7%) |
| Bachelor's Degree or higher | 61 (69.3%) | 27 (30.7%) |
Occupancy by Age of Householder in Miami
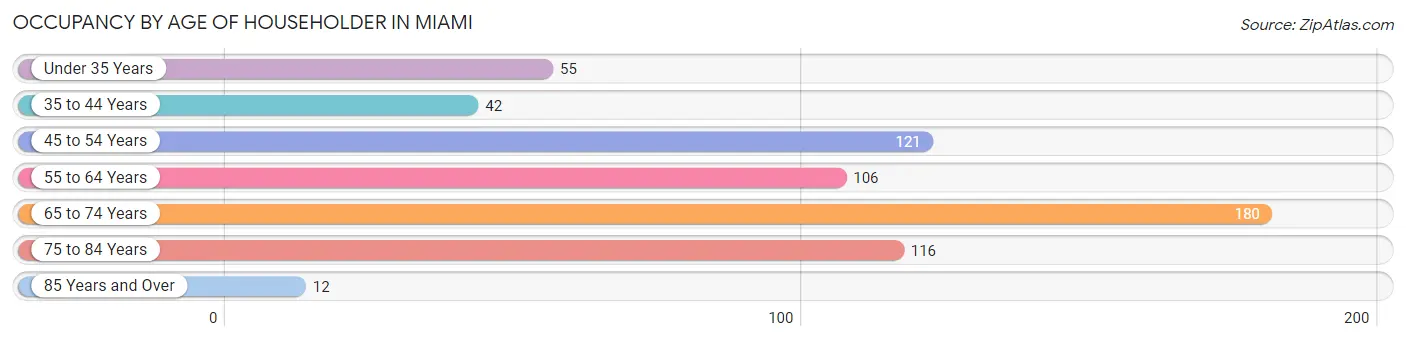
| Age Bracket | # Households | % Households |
| Under 35 Years | 55 | 8.7% |
| 35 to 44 Years | 42 | 6.7% |
| 45 to 54 Years | 121 | 19.2% |
| 55 to 64 Years | 106 | 16.8% |
| 65 to 74 Years | 180 | 28.5% |
| 75 to 84 Years | 116 | 18.3% |
| 85 Years and Over | 12 | 1.9% |
| Total | 632 | 100.0% |
Housing Finances in Miami
Median Income by Occupancy in Miami
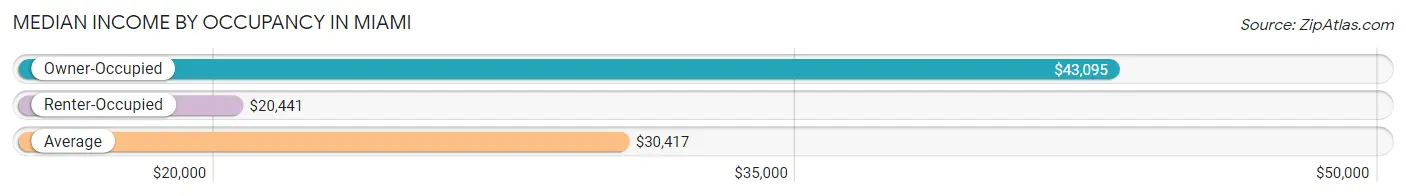
| Occupancy Type | # Households | Median Income |
| Owner-Occupied | 426 (67.4%) | $43,095 |
| Renter-Occupied | 206 (32.6%) | $20,441 |
| Average | 632 (100.0%) | $30,417 |
Occupancy by Householder Income Bracket in Miami
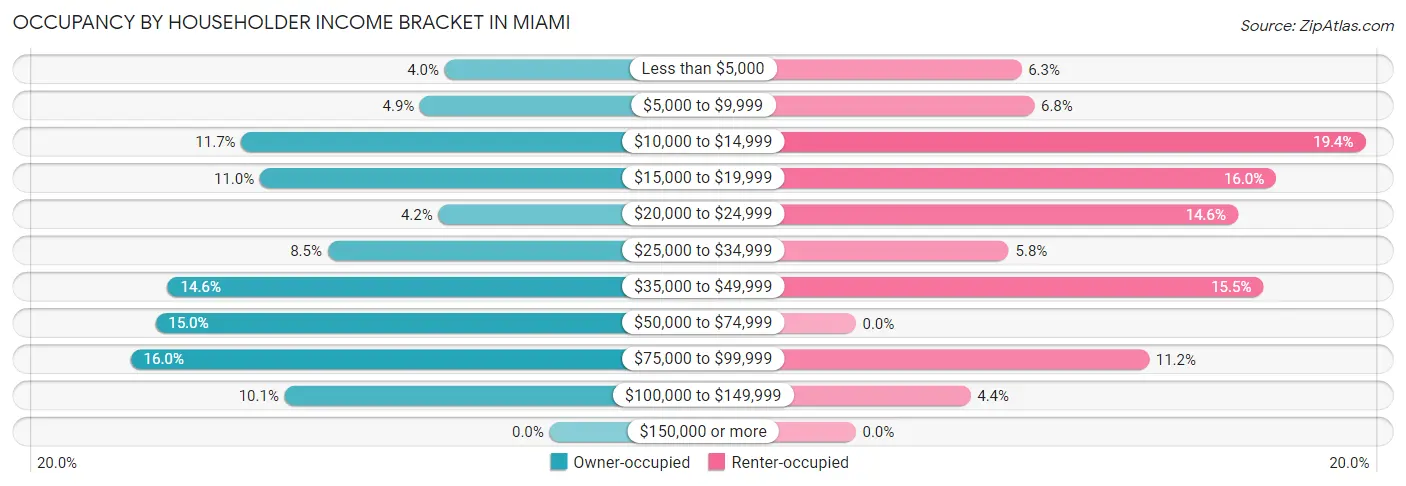
| Income Bracket | Owner-occupied | Renter-occupied |
| Less than $5,000 | 17 (4.0%) | 13 (6.3%) |
| $5,000 to $9,999 | 21 (4.9%) | 14 (6.8%) |
| $10,000 to $14,999 | 50 (11.7%) | 40 (19.4%) |
| $15,000 to $19,999 | 47 (11.0%) | 33 (16.0%) |
| $20,000 to $24,999 | 18 (4.2%) | 30 (14.6%) |
| $25,000 to $34,999 | 36 (8.5%) | 12 (5.8%) |
| $35,000 to $49,999 | 62 (14.5%) | 32 (15.5%) |
| $50,000 to $74,999 | 64 (15.0%) | 0 (0.0%) |
| $75,000 to $99,999 | 68 (16.0%) | 23 (11.2%) |
| $100,000 to $149,999 | 43 (10.1%) | 9 (4.4%) |
| $150,000 or more | 0 (0.0%) | 0 (0.0%) |
| Total | 426 (100.0%) | 206 (100.0%) |
Monthly Housing Cost Tiers in Miami
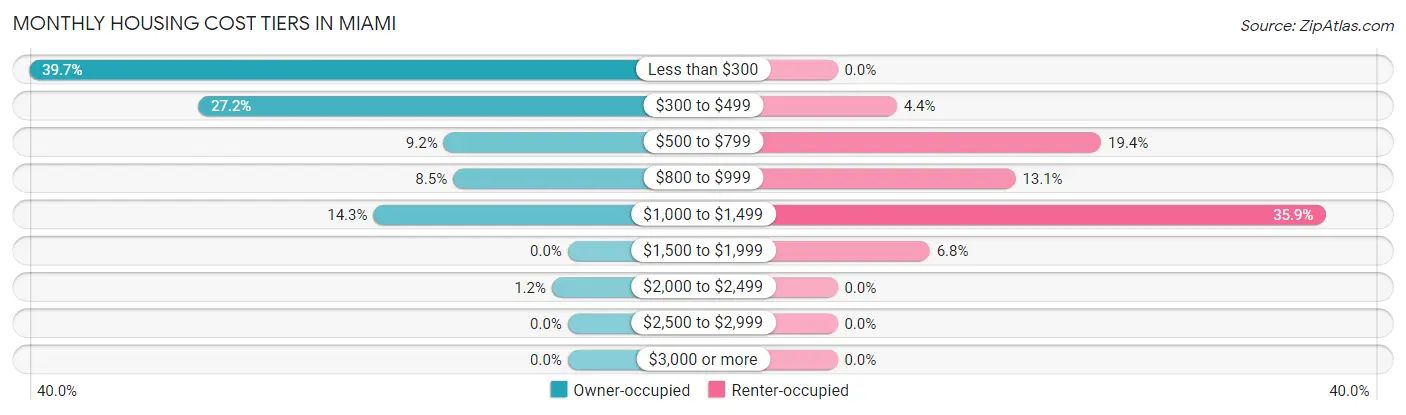
| Monthly Cost | Owner-occupied | Renter-occupied |
| Less than $300 | 169 (39.7%) | 0 (0.0%) |
| $300 to $499 | 116 (27.2%) | 9 (4.4%) |
| $500 to $799 | 39 (9.1%) | 40 (19.4%) |
| $800 to $999 | 36 (8.5%) | 27 (13.1%) |
| $1,000 to $1,499 | 61 (14.3%) | 74 (35.9%) |
| $1,500 to $1,999 | 0 (0.0%) | 14 (6.8%) |
| $2,000 to $2,499 | 5 (1.2%) | 0 (0.0%) |
| $2,500 to $2,999 | 0 (0.0%) | 0 (0.0%) |
| $3,000 or more | 0 (0.0%) | 0 (0.0%) |
| Total | 426 (100.0%) | 206 (100.0%) |
Physical Housing Characteristics in Miami
Housing Structures in Miami
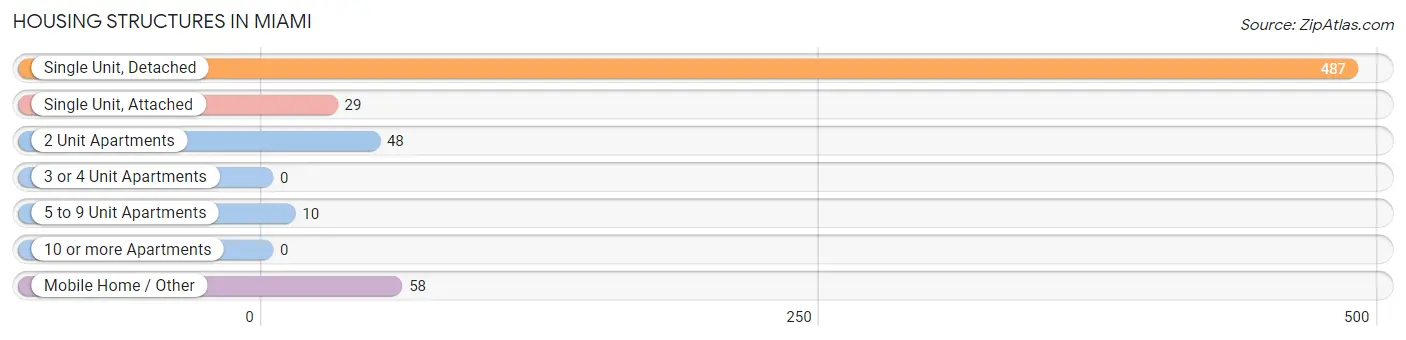
| Structure Type | # Housing Units | % Housing Units |
| Single Unit, Detached | 487 | 77.1% |
| Single Unit, Attached | 29 | 4.6% |
| 2 Unit Apartments | 48 | 7.6% |
| 3 or 4 Unit Apartments | 0 | 0.0% |
| 5 to 9 Unit Apartments | 10 | 1.6% |
| 10 or more Apartments | 0 | 0.0% |
| Mobile Home / Other | 58 | 9.2% |
| Total | 632 | 100.0% |
Housing Structures by Occupancy in Miami
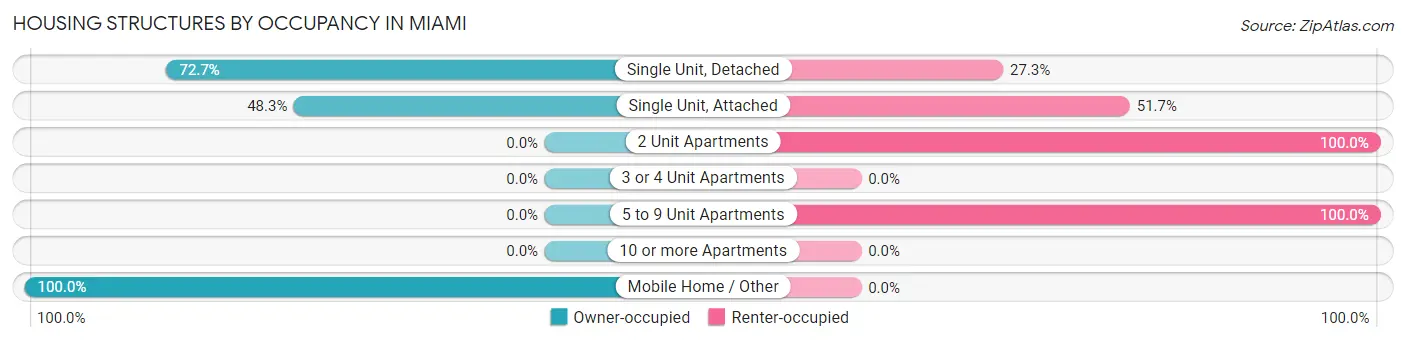
| Structure Type | Owner-occupied | Renter-occupied |
| Single Unit, Detached | 354 (72.7%) | 133 (27.3%) |
| Single Unit, Attached | 14 (48.3%) | 15 (51.7%) |
| 2 Unit Apartments | 0 (0.0%) | 48 (100.0%) |
| 3 or 4 Unit Apartments | 0 (0.0%) | 0 (0.0%) |
| 5 to 9 Unit Apartments | 0 (0.0%) | 10 (100.0%) |
| 10 or more Apartments | 0 (0.0%) | 0 (0.0%) |
| Mobile Home / Other | 58 (100.0%) | 0 (0.0%) |
| Total | 426 (67.4%) | 206 (32.6%) |
Housing Structures by Number of Rooms in Miami
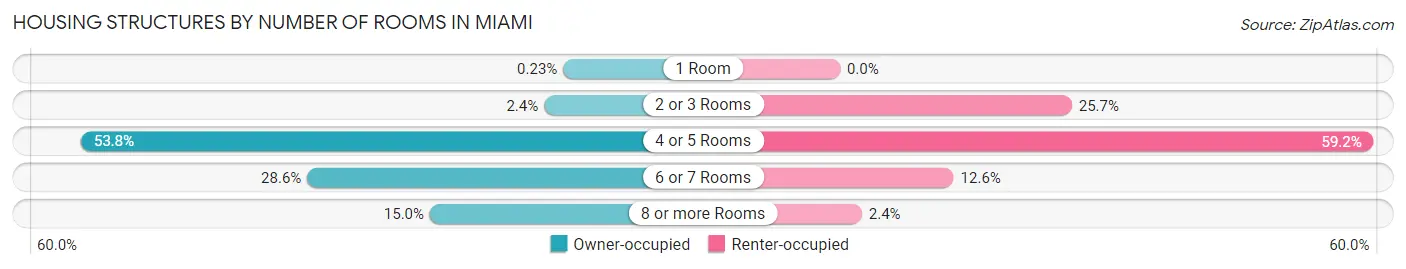
| Number of Rooms | Owner-occupied | Renter-occupied |
| 1 Room | 1 (0.2%) | 0 (0.0%) |
| 2 or 3 Rooms | 10 (2.4%) | 53 (25.7%) |
| 4 or 5 Rooms | 229 (53.8%) | 122 (59.2%) |
| 6 or 7 Rooms | 122 (28.6%) | 26 (12.6%) |
| 8 or more Rooms | 64 (15.0%) | 5 (2.4%) |
| Total | 426 (100.0%) | 206 (100.0%) |
Housing Structure by Heating Type in Miami
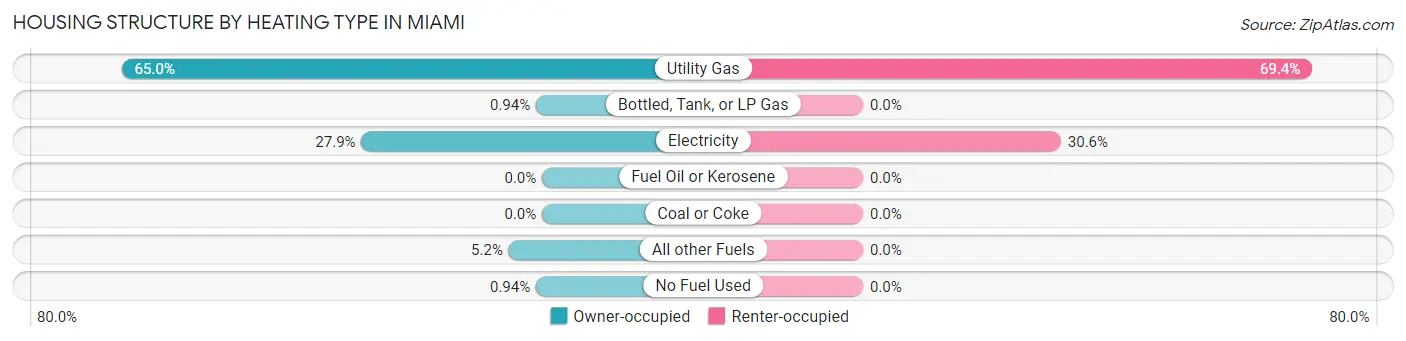
| Heating Type | Owner-occupied | Renter-occupied |
| Utility Gas | 277 (65.0%) | 143 (69.4%) |
| Bottled, Tank, or LP Gas | 4 (0.9%) | 0 (0.0%) |
| Electricity | 119 (27.9%) | 63 (30.6%) |
| Fuel Oil or Kerosene | 0 (0.0%) | 0 (0.0%) |
| Coal or Coke | 0 (0.0%) | 0 (0.0%) |
| All other Fuels | 22 (5.2%) | 0 (0.0%) |
| No Fuel Used | 4 (0.9%) | 0 (0.0%) |
| Total | 426 (100.0%) | 206 (100.0%) |
Household Vehicle Usage in Miami
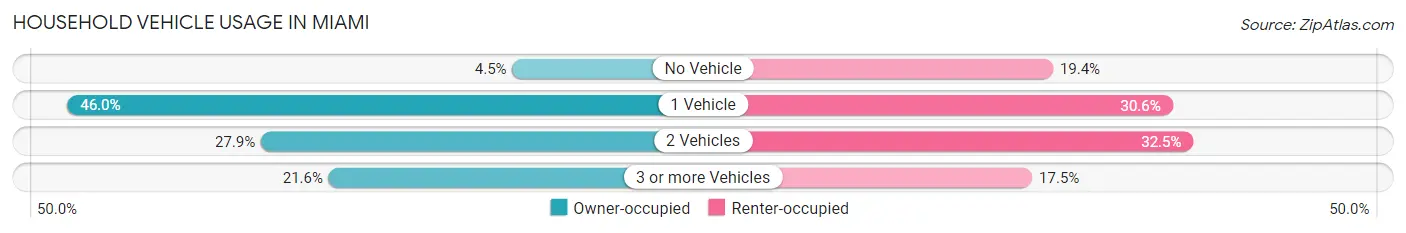
| Vehicles per Household | Owner-occupied | Renter-occupied |
| No Vehicle | 19 (4.5%) | 40 (19.4%) |
| 1 Vehicle | 196 (46.0%) | 63 (30.6%) |
| 2 Vehicles | 119 (27.9%) | 67 (32.5%) |
| 3 or more Vehicles | 92 (21.6%) | 36 (17.5%) |
| Total | 426 (100.0%) | 206 (100.0%) |
Real Estate & Mortgages in Miami
Real Estate and Mortgage Overview in Miami
| Characteristic | Without Mortgage | With Mortgage |
| Housing Units | 311 | 115 |
| Median Property Value | $62,600 | $120,800 |
| Median Household Income | $28,702 | $0 |
| Monthly Housing Costs | $285 | $0 |
| Real Estate Taxes | $365 | $0 |
Property Value by Mortgage Status in Miami
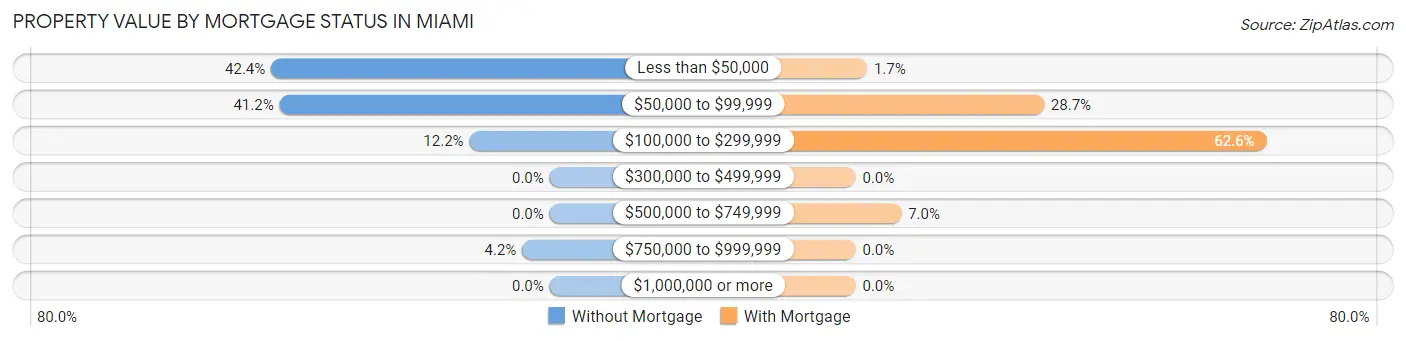
| Property Value | Without Mortgage | With Mortgage |
| Less than $50,000 | 132 (42.4%) | 2 (1.7%) |
| $50,000 to $99,999 | 128 (41.2%) | 33 (28.7%) |
| $100,000 to $299,999 | 38 (12.2%) | 72 (62.6%) |
| $300,000 to $499,999 | 0 (0.0%) | 0 (0.0%) |
| $500,000 to $749,999 | 0 (0.0%) | 8 (7.0%) |
| $750,000 to $999,999 | 13 (4.2%) | 0 (0.0%) |
| $1,000,000 or more | 0 (0.0%) | 0 (0.0%) |
| Total | 311 (100.0%) | 115 (100.0%) |
Household Income by Mortgage Status in Miami
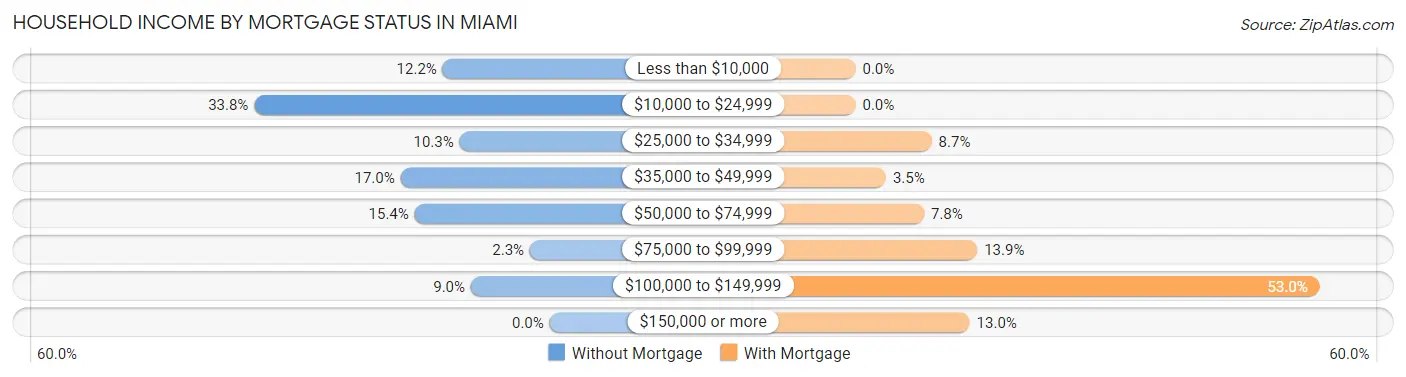
| Household Income | Without Mortgage | With Mortgage |
| Less than $10,000 | 38 (12.2%) | 0 (0.0%) |
| $10,000 to $24,999 | 105 (33.8%) | 0 (0.0%) |
| $25,000 to $34,999 | 32 (10.3%) | 10 (8.7%) |
| $35,000 to $49,999 | 53 (17.0%) | 4 (3.5%) |
| $50,000 to $74,999 | 48 (15.4%) | 9 (7.8%) |
| $75,000 to $99,999 | 7 (2.2%) | 16 (13.9%) |
| $100,000 to $149,999 | 28 (9.0%) | 61 (53.0%) |
| $150,000 or more | 0 (0.0%) | 15 (13.0%) |
| Total | 311 (100.0%) | 115 (100.0%) |
Property Value to Household Income Ratio in Miami
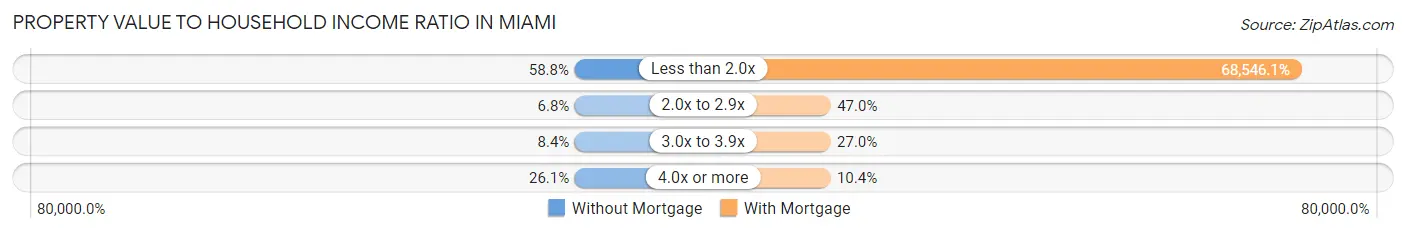
| Value-to-Income Ratio | Without Mortgage | With Mortgage |
| Less than 2.0x | 183 (58.8%) | 78,828 (68,546.1%) |
| 2.0x to 2.9x | 21 (6.8%) | 54 (47.0%) |
| 3.0x to 3.9x | 26 (8.4%) | 31 (27.0%) |
| 4.0x or more | 81 (26.1%) | 12 (10.4%) |
| Total | 311 (100.0%) | 115 (100.0%) |
Real Estate Taxes by Mortgage Status in Miami
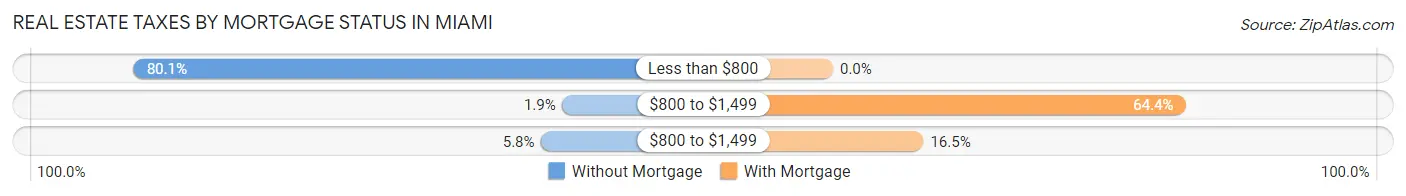
| Property Taxes | Without Mortgage | With Mortgage |
| Less than $800 | 249 (80.1%) | 0 (0.0%) |
| $800 to $1,499 | 6 (1.9%) | 74 (64.3%) |
| $800 to $1,499 | 18 (5.8%) | 19 (16.5%) |
| Total | 311 (100.0%) | 115 (100.0%) |
Health & Disability in Miami
Health Insurance Coverage by Age in Miami
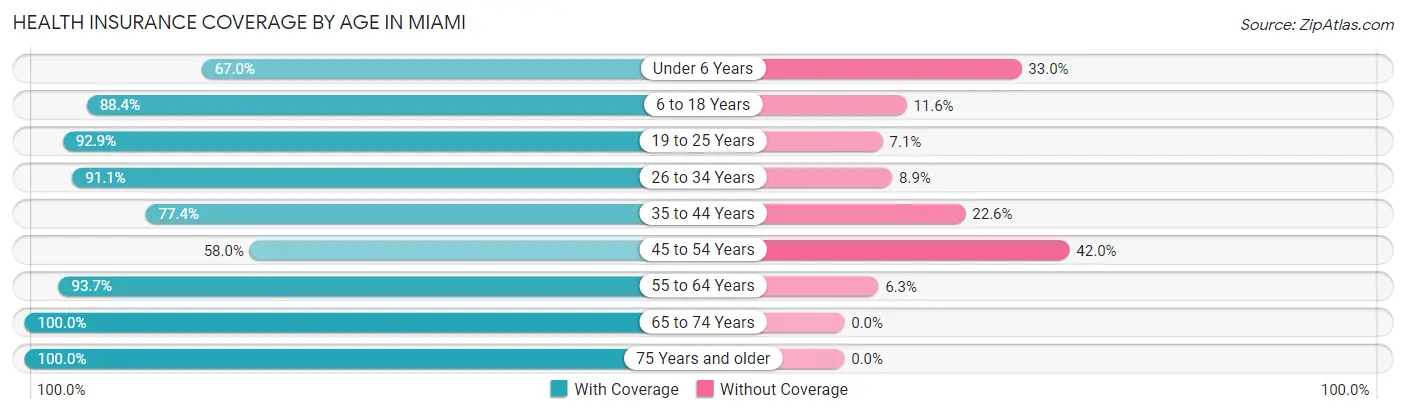
| Age Bracket | With Coverage | Without Coverage |
| Under 6 Years | 73 (67.0%) | 36 (33.0%) |
| 6 to 18 Years | 145 (88.4%) | 19 (11.6%) |
| 19 to 25 Years | 91 (92.9%) | 7 (7.1%) |
| 26 to 34 Years | 92 (91.1%) | 9 (8.9%) |
| 35 to 44 Years | 72 (77.4%) | 21 (22.6%) |
| 45 to 54 Years | 94 (58.0%) | 68 (42.0%) |
| 55 to 64 Years | 192 (93.7%) | 13 (6.3%) |
| 65 to 74 Years | 247 (100.0%) | 0 (0.0%) |
| 75 Years and older | 174 (100.0%) | 0 (0.0%) |
| Total | 1,180 (87.2%) | 173 (12.8%) |
Health Insurance Coverage by Citizenship Status in Miami
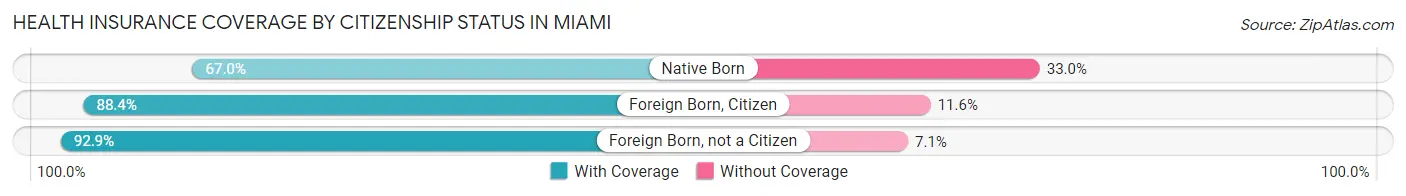
| Citizenship Status | With Coverage | Without Coverage |
| Native Born | 73 (67.0%) | 36 (33.0%) |
| Foreign Born, Citizen | 145 (88.4%) | 19 (11.6%) |
| Foreign Born, not a Citizen | 91 (92.9%) | 7 (7.1%) |
Health Insurance Coverage by Household Income in Miami
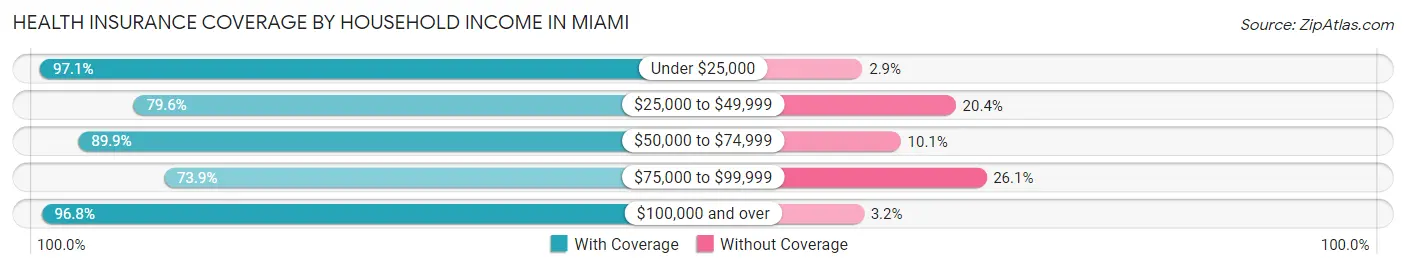
| Household Income | With Coverage | Without Coverage |
| Under $25,000 | 402 (97.1%) | 12 (2.9%) |
| $25,000 to $49,999 | 281 (79.6%) | 72 (20.4%) |
| $50,000 to $74,999 | 116 (89.9%) | 13 (10.1%) |
| $75,000 to $99,999 | 198 (73.9%) | 70 (26.1%) |
| $100,000 and over | 183 (96.8%) | 6 (3.2%) |
Public vs Private Health Insurance Coverage by Age in Miami
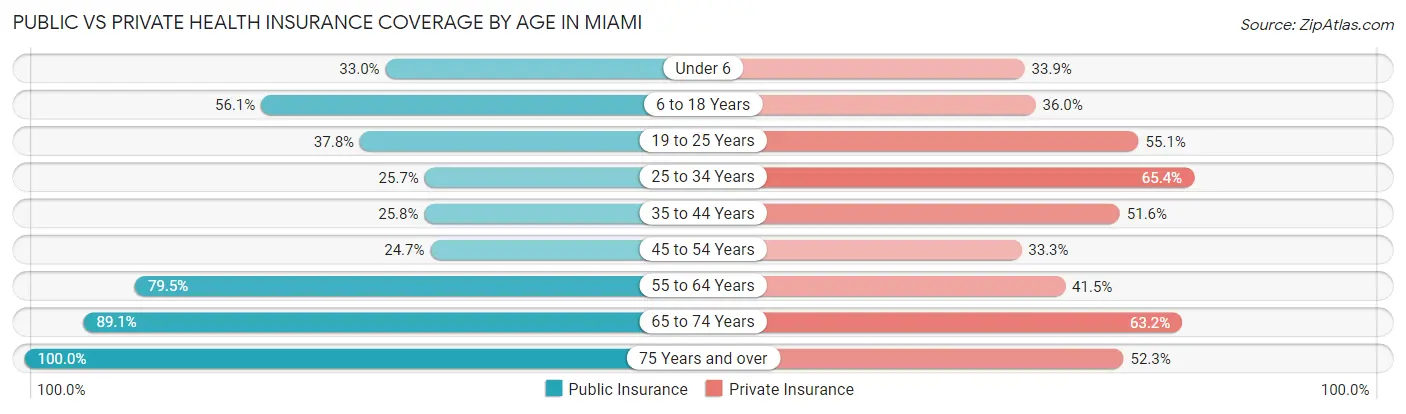
| Age Bracket | Public Insurance | Private Insurance |
| Under 6 | 36 (33.0%) | 37 (33.9%) |
| 6 to 18 Years | 92 (56.1%) | 59 (36.0%) |
| 19 to 25 Years | 37 (37.8%) | 54 (55.1%) |
| 25 to 34 Years | 26 (25.7%) | 66 (65.3%) |
| 35 to 44 Years | 24 (25.8%) | 48 (51.6%) |
| 45 to 54 Years | 40 (24.7%) | 54 (33.3%) |
| 55 to 64 Years | 163 (79.5%) | 85 (41.5%) |
| 65 to 74 Years | 220 (89.1%) | 156 (63.2%) |
| 75 Years and over | 174 (100.0%) | 91 (52.3%) |
| Total | 812 (60.0%) | 650 (48.0%) |
Disability Status by Sex by Age in Miami
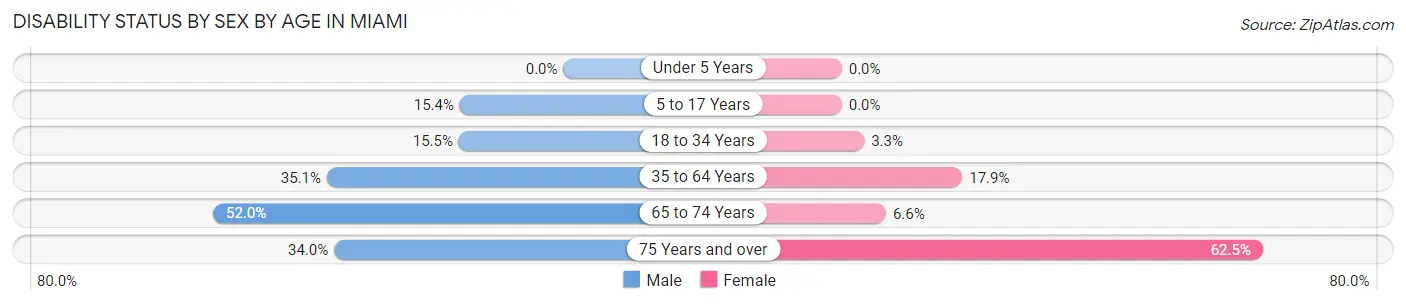
| Age Bracket | Male | Female |
| Under 5 Years | 0 (0.0%) | 0 (0.0%) |
| 5 to 17 Years | 12 (15.4%) | 0 (0.0%) |
| 18 to 34 Years | 18 (15.5%) | 4 (3.3%) |
| 35 to 64 Years | 85 (35.1%) | 39 (17.9%) |
| 65 to 74 Years | 65 (52.0%) | 8 (6.6%) |
| 75 Years and over | 32 (34.0%) | 50 (62.5%) |
Disability Class by Sex by Age in Miami
Disability Class: Hearing Difficulty
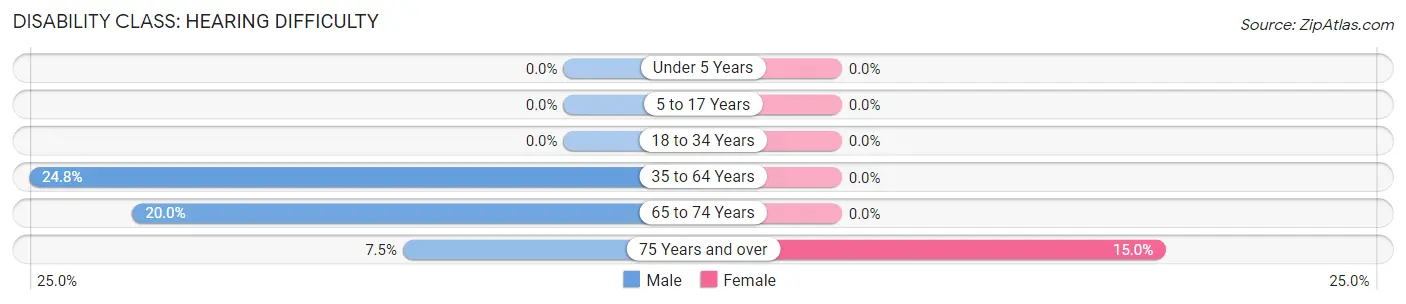
| Age Bracket | Male | Female |
| Under 5 Years | 0 (0.0%) | 0 (0.0%) |
| 5 to 17 Years | 0 (0.0%) | 0 (0.0%) |
| 18 to 34 Years | 0 (0.0%) | 0 (0.0%) |
| 35 to 64 Years | 60 (24.8%) | 0 (0.0%) |
| 65 to 74 Years | 25 (20.0%) | 0 (0.0%) |
| 75 Years and over | 7 (7.4%) | 12 (15.0%) |
Disability Class: Vision Difficulty
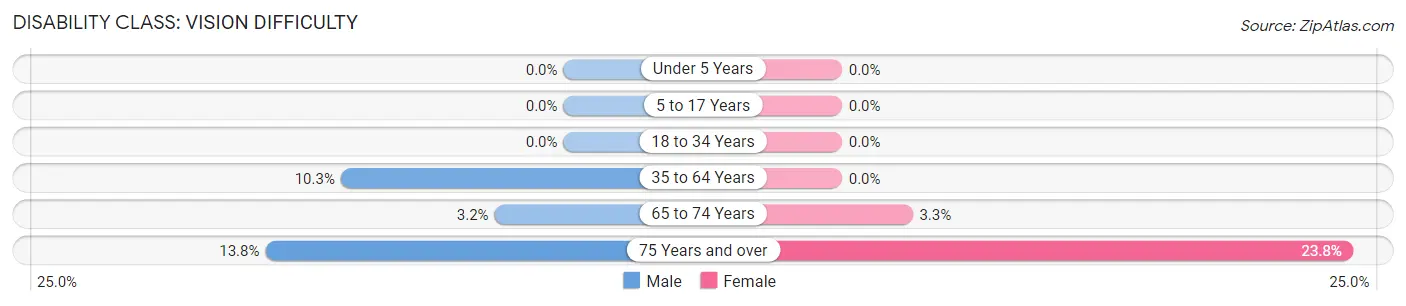
| Age Bracket | Male | Female |
| Under 5 Years | 0 (0.0%) | 0 (0.0%) |
| 5 to 17 Years | 0 (0.0%) | 0 (0.0%) |
| 18 to 34 Years | 0 (0.0%) | 0 (0.0%) |
| 35 to 64 Years | 25 (10.3%) | 0 (0.0%) |
| 65 to 74 Years | 4 (3.2%) | 4 (3.3%) |
| 75 Years and over | 13 (13.8%) | 19 (23.7%) |
Disability Class: Cognitive Difficulty
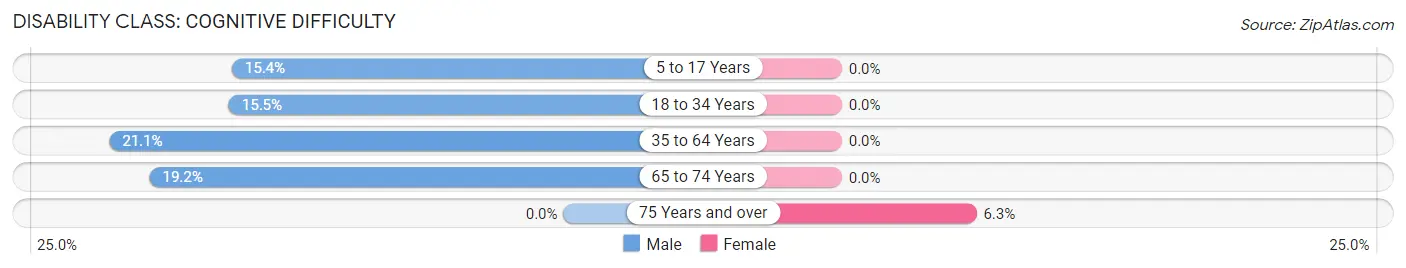
| Age Bracket | Male | Female |
| 5 to 17 Years | 12 (15.4%) | 0 (0.0%) |
| 18 to 34 Years | 18 (15.5%) | 0 (0.0%) |
| 35 to 64 Years | 51 (21.1%) | 0 (0.0%) |
| 65 to 74 Years | 24 (19.2%) | 0 (0.0%) |
| 75 Years and over | 0 (0.0%) | 5 (6.2%) |
Disability Class: Ambulatory Difficulty
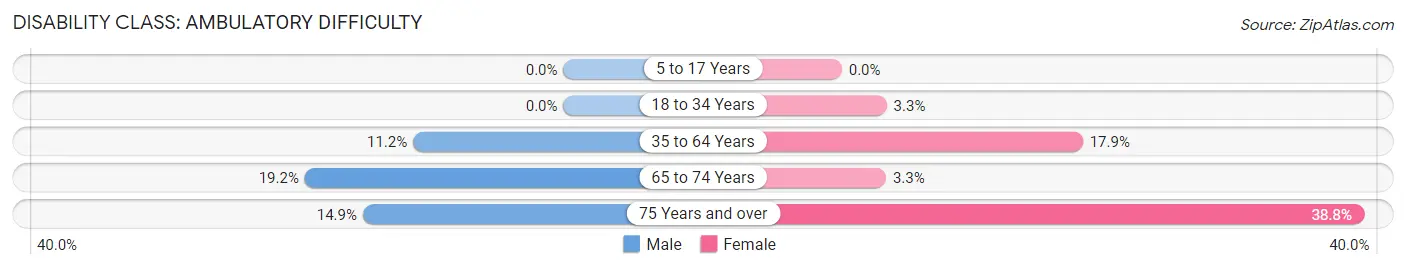
| Age Bracket | Male | Female |
| 5 to 17 Years | 0 (0.0%) | 0 (0.0%) |
| 18 to 34 Years | 0 (0.0%) | 4 (3.3%) |
| 35 to 64 Years | 27 (11.2%) | 39 (17.9%) |
| 65 to 74 Years | 24 (19.2%) | 4 (3.3%) |
| 75 Years and over | 14 (14.9%) | 31 (38.8%) |
Disability Class: Self-Care Difficulty
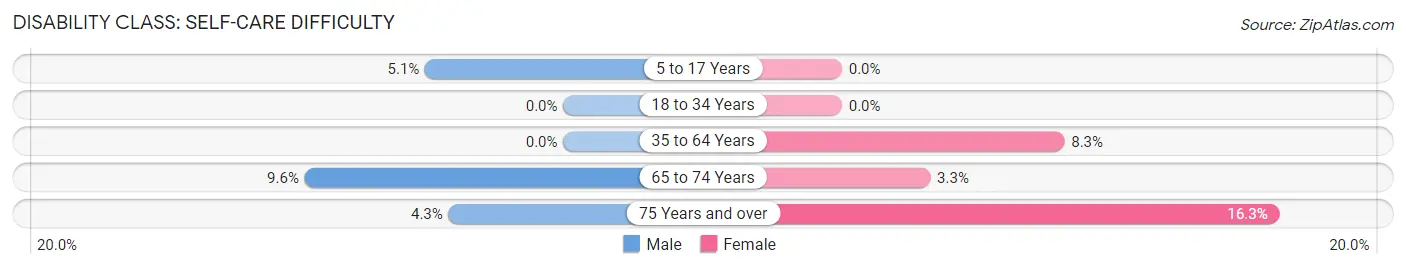
| Age Bracket | Male | Female |
| 5 to 17 Years | 4 (5.1%) | 0 (0.0%) |
| 18 to 34 Years | 0 (0.0%) | 0 (0.0%) |
| 35 to 64 Years | 0 (0.0%) | 18 (8.3%) |
| 65 to 74 Years | 12 (9.6%) | 4 (3.3%) |
| 75 Years and over | 4 (4.3%) | 13 (16.3%) |
Technology Access in Miami
Computing Device Access in Miami
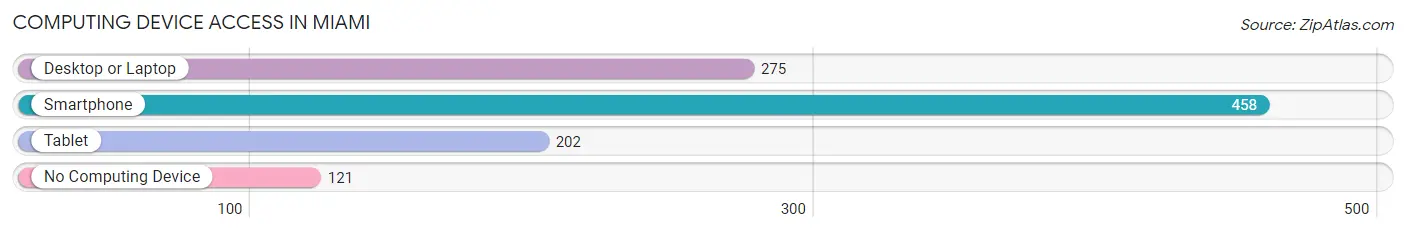
| Device Type | # Households | % Households |
| Desktop or Laptop | 275 | 43.5% |
| Smartphone | 458 | 72.5% |
| Tablet | 202 | 32.0% |
| No Computing Device | 121 | 19.2% |
| Total | 632 | 100.0% |
Internet Access in Miami
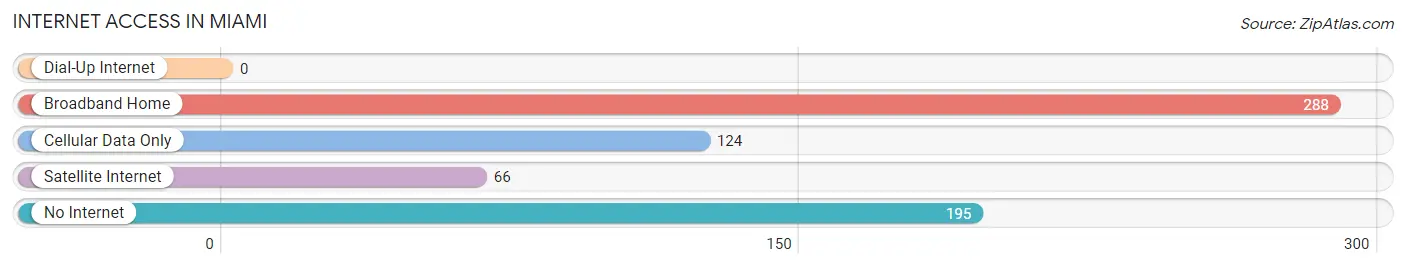
| Internet Type | # Households | % Households |
| Dial-Up Internet | 0 | 0.0% |
| Broadband Home | 288 | 45.6% |
| Cellular Data Only | 124 | 19.6% |
| Satellite Internet | 66 | 10.4% |
| No Internet | 195 | 30.8% |
| Total | 632 | 100.0% |
Miami Summary
Miami, Arizona is a small town located in Gila County in the northeastern part of the state. It is situated in the foothills of the Pinal Mountains, about 30 miles east of Globe and 60 miles east of Phoenix. The town was founded in 1878 and was originally called Mineral City. It was later renamed Miami in 1887 after the Miami Copper Company, which was the first copper mining company in the area.
Geography
Miami is located in the Sonoran Desert, which is characterized by hot, dry summers and mild winters. The town is situated at an elevation of 4,890 feet and is surrounded by the Pinal Mountains to the north and the Superstition Mountains to the south. The town is located in the Tonto National Forest, which is home to a variety of wildlife, including deer, javelina, coyotes, and mountain lions. The town is also located near the Salt River, which provides a source of water for the area.
Economy
The economy of Miami is largely based on copper mining and tourism. The town is home to the Miami Copper Company, which is the oldest copper mining company in the state. The company has been in operation since 1887 and is still in operation today. The town is also home to several tourist attractions, including the Miami Mine Museum, the Miami Historical Museum, and the Miami-Inspiration Mine.
Demographics
As of the 2010 census, the population of Miami was 1,846. The racial makeup of the town was 94.3% White, 0.3% African American, 0.7% Native American, 0.2% Asian, 0.1% Pacific Islander, 2.3% from other races, and 2.2% from two or more races. Hispanic or Latino of any race were 8.2% of the population.
The median income for a household in the town was $30,938, and the median income for a family was $35,625. The per capita income for the town was $15,945. About 16.2% of families and 19.2% of the population were below the poverty line, including 25.2% of those under age 18 and 8.3% of those age 65 or over.
Conclusion
Miami, Arizona is a small town located in Gila County in the northeastern part of the state. It is situated in the foothills of the Pinal Mountains and is home to the Miami Copper Company, which is the oldest copper mining company in the state. The town is also home to several tourist attractions and is surrounded by the Tonto National Forest. The economy of Miami is largely based on copper mining and tourism, and the population of the town was 1,846 as of the 2010 census.
Common Questions
What is the Total Population of Miami?
Total Population of Miami is 1,353.
What is the Total Male Population of Miami?
Total Male Population of Miami is 705.
What is the Total Female Population of Miami?
Total Female Population of Miami is 648.
What is the Ratio of Males per 100 Females in Miami?
There are 108.80 Males per 100 Females in Miami.
What is the Ratio of Females per 100 Males in Miami?
There are 91.91 Females per 100 Males in Miami.
What is the Median Population Age in Miami?
Median Population Age in Miami is 51.1 Years.
What is the Average Family Size in Miami
Average Family Size in Miami is 2.9 People.
What is the Average Household Size in Miami
Average Household Size in Miami is 2.1 People.
What is Per Capita Income in Miami?
Per Capita income in Miami is $21,059.
What is the Median Family Income in Miami?
Median Family Income in Miami is $40,556.
What is the Median Household income in Miami?
Median Household Income in Miami is $30,417.
What is Income or Wage Gap in Miami?
Income or Wage Gap in Miami is 15.1%.
Women in Miami earn 84.9 cents for every dollar earned by a man.
What is Inequality or Gini Index in Miami?
Inequality or Gini Index in Miami is 0.44.
How Large is the Labor Force in Miami?
There are 566 People in the Labor Forcein in Miami.
What is the Percentage of People in the Labor Force in Miami?
50.0% of People are in the Labor Force in Miami.
What is the Unemployment Rate in Miami?
Unemployment Rate in Miami is 15.9%.