Joseph City, AZ
Joseph City Map
Joseph City Overview
2,058
TOTAL POPULATION
1,061
MALE POPULATION
997
FEMALE POPULATION
106.42
MALES / 100 FEMALES
93.97
FEMALES / 100 MALES
21.5
MEDIAN AGE
4.2
AVG FAMILY SIZE
3.6
AVG HOUSEHOLD SIZE
$19,906
PER CAPITA INCOME
$69,087
AVG FAMILY INCOME
$69,643
AVG HOUSEHOLD INCOME
51.1%
WAGE / INCOME GAP [ % ]
48.9¢/ $1
WAGE / INCOME GAP [ $ ]
0.32
INEQUALITY / GINI INDEX
782
LABOR FORCE [ PEOPLE ]
64.5%
PERCENT IN LABOR FORCE
5.2%
UNEMPLOYMENT RATE
Joseph City Zip Codes
Joseph City Area Codes
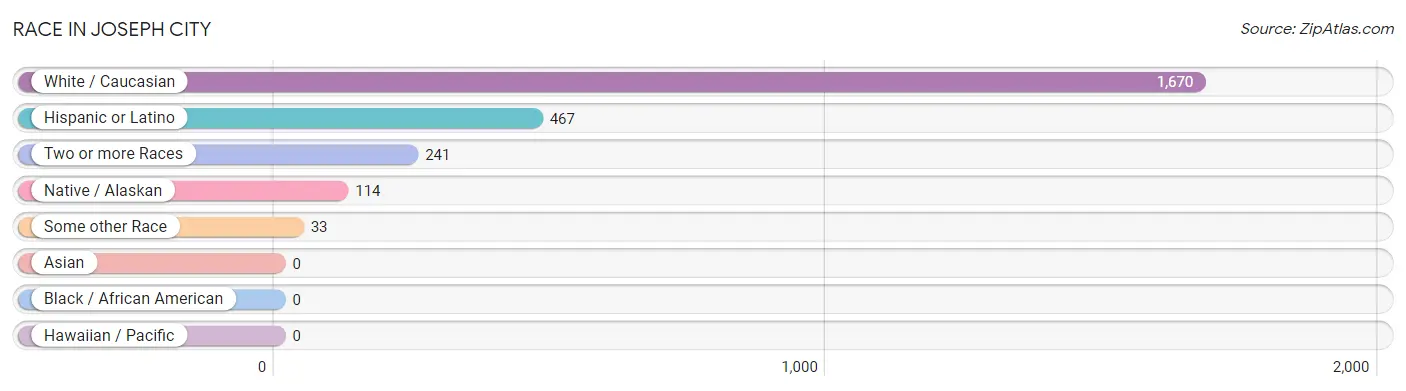
Race in Joseph City
The most populous races in Joseph City are White / Caucasian (1,670 | 81.1%), Hispanic or Latino (467 | 22.7%), and Two or more Races (241 | 11.7%).
| Race | # Population | % Population |
| Asian | 0 | 0.0% |
| Black / African American | 0 | 0.0% |
| Hawaiian / Pacific | 0 | 0.0% |
| Hispanic or Latino | 467 | 22.7% |
| Native / Alaskan | 114 | 5.5% |
| White / Caucasian | 1,670 | 81.1% |
| Two or more Races | 241 | 11.7% |
| Some other Race | 33 | 1.6% |
| Total | 2,058 | 100.0% |
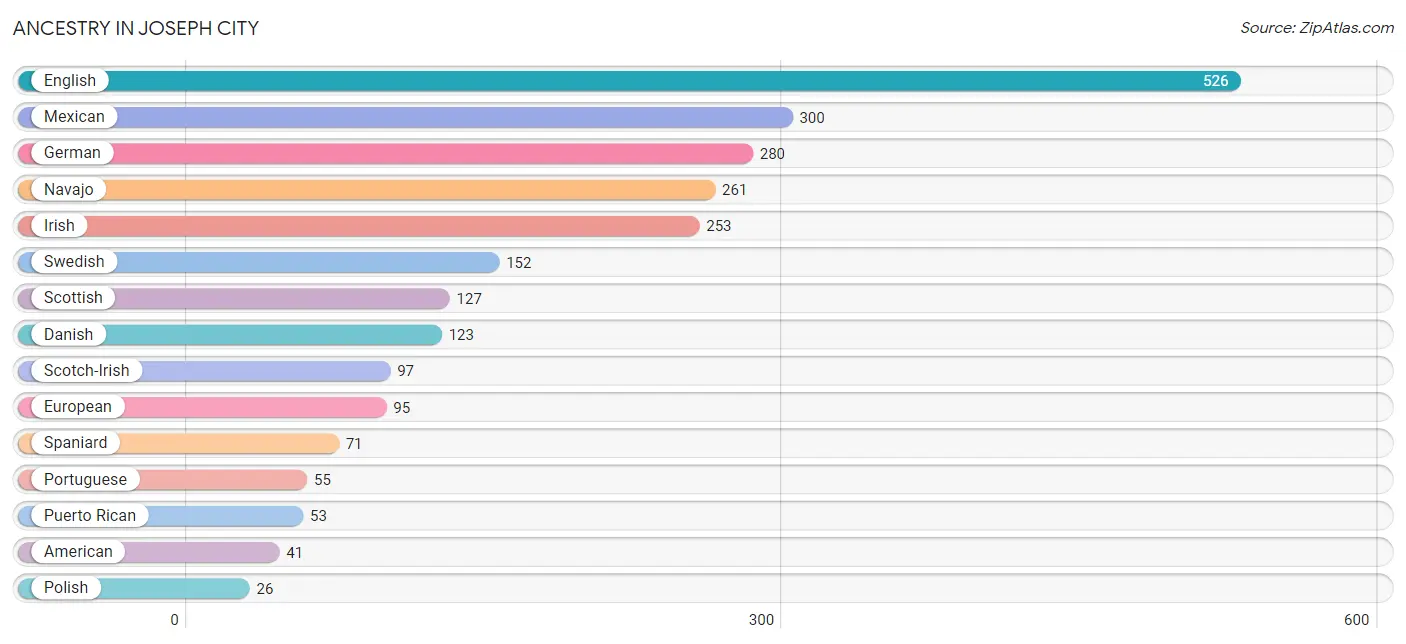
Ancestry in Joseph City
The most populous ancestries reported in Joseph City are English (526 | 25.6%), Mexican (300 | 14.6%), German (280 | 13.6%), Navajo (261 | 12.7%), and Irish (253 | 12.3%), together accounting for 78.7% of all Joseph City residents.
| Ancestry | # Population | % Population |
| American | 41 | 2.0% |
| British | 12 | 0.6% |
| Cherokee | 20 | 1.0% |
| Choctaw | 10 | 0.5% |
| Danish | 123 | 6.0% |
| Dutch | 12 | 0.6% |
| English | 526 | 25.6% |
| European | 95 | 4.6% |
| French | 22 | 1.1% |
| German | 280 | 13.6% |
| Greek | 25 | 1.2% |
| Irish | 253 | 12.3% |
| Mexican | 300 | 14.6% |
| Navajo | 261 | 12.7% |
| Norwegian | 25 | 1.2% |
| Polish | 26 | 1.3% |
| Portuguese | 55 | 2.7% |
| Puerto Rican | 53 | 2.6% |
| Scotch-Irish | 97 | 4.7% |
| Scottish | 127 | 6.2% |
| Spaniard | 71 | 3.5% |
| Spanish | 15 | 0.7% |
| Swedish | 152 | 7.4% | View All 23 Rows |
Immigrants in Joseph City
The most numerous immigrant groups reported in Joseph City came from , and Canada (12 | 0.6%), together accounting for 0.6% of all Joseph City residents.

| Immigration Origin | # Population | % Population |
| Canada | 12 | 0.6% | View All 1 Rows |
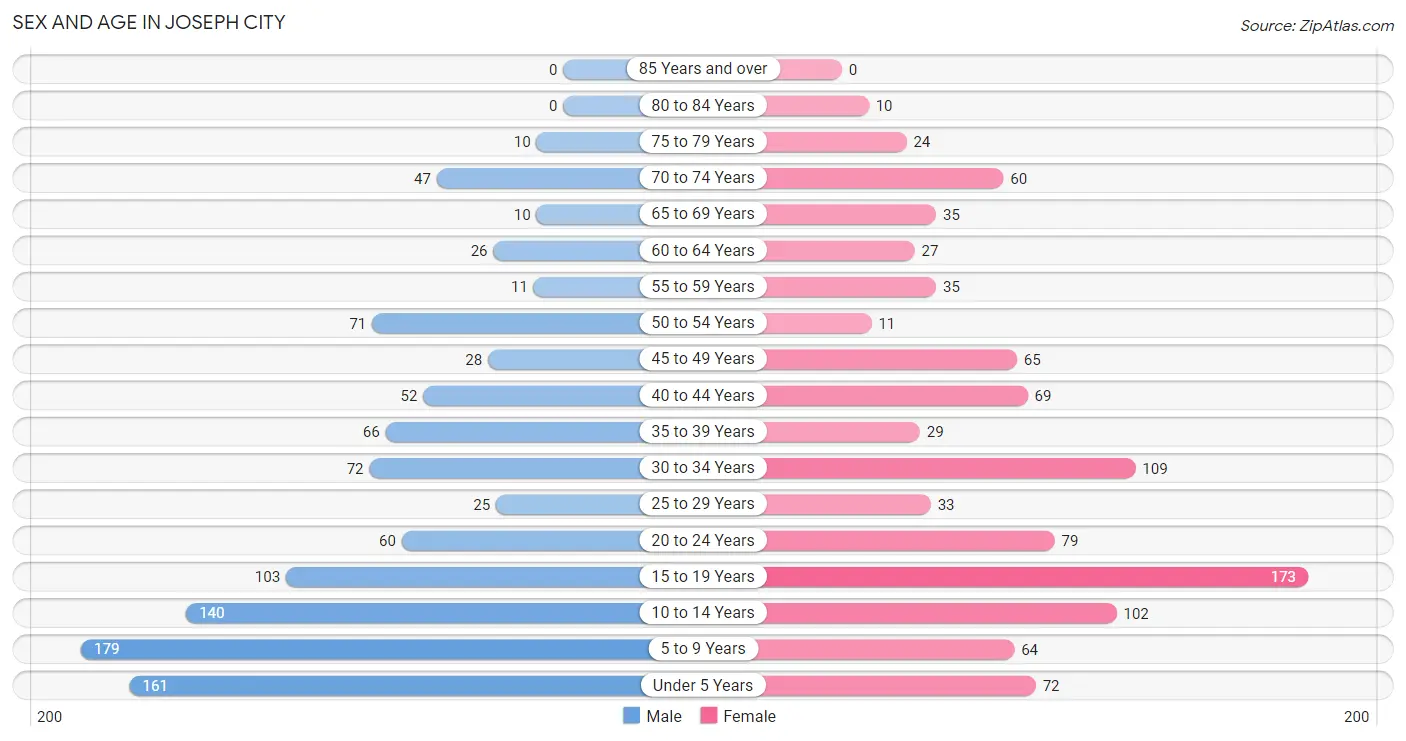
Sex and Age in Joseph City
Sex and Age in Joseph City
The most populous age groups in Joseph City are 5 to 9 Years (179 | 16.9%) for men and 15 to 19 Years (173 | 17.3%) for women.
| Age Bracket | Male | Female |
| Under 5 Years | 161 (15.2%) | 72 (7.2%) |
| 5 to 9 Years | 179 (16.9%) | 64 (6.4%) |
| 10 to 14 Years | 140 (13.2%) | 102 (10.2%) |
| 15 to 19 Years | 103 (9.7%) | 173 (17.3%) |
| 20 to 24 Years | 60 (5.7%) | 79 (7.9%) |
| 25 to 29 Years | 25 (2.4%) | 33 (3.3%) |
| 30 to 34 Years | 72 (6.8%) | 109 (10.9%) |
| 35 to 39 Years | 66 (6.2%) | 29 (2.9%) |
| 40 to 44 Years | 52 (4.9%) | 69 (6.9%) |
| 45 to 49 Years | 28 (2.6%) | 65 (6.5%) |
| 50 to 54 Years | 71 (6.7%) | 11 (1.1%) |
| 55 to 59 Years | 11 (1.0%) | 35 (3.5%) |
| 60 to 64 Years | 26 (2.5%) | 27 (2.7%) |
| 65 to 69 Years | 10 (0.9%) | 35 (3.5%) |
| 70 to 74 Years | 47 (4.4%) | 60 (6.0%) |
| 75 to 79 Years | 10 (0.9%) | 24 (2.4%) |
| 80 to 84 Years | 0 (0.0%) | 10 (1.0%) |
| 85 Years and over | 0 (0.0%) | 0 (0.0%) |
| Total | 1,061 (100.0%) | 997 (100.0%) |
Families and Households in Joseph City
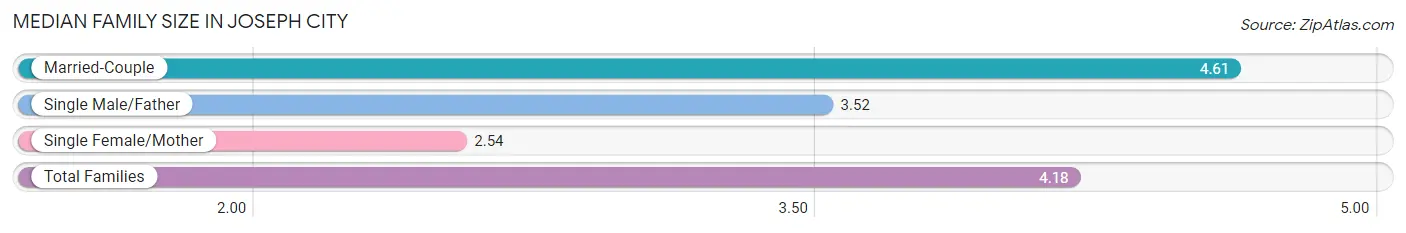
Median Family Size in Joseph City
The median family size in Joseph City is 4.18 persons per family, with married-couple families (332 | 73.9%) accounting for the largest median family size of 4.61 persons per family. On the other hand, single female/mother families (67 | 14.9%) represent the smallest median family size with 2.54 persons per family.
| Family Type | # Families | Family Size |
| Married-Couple | 332 (73.9%) | 4.61 |
| Single Male/Father | 50 (11.1%) | 3.52 |
| Single Female/Mother | 67 (14.9%) | 2.54 |
| Total Families | 449 (100.0%) | 4.18 |
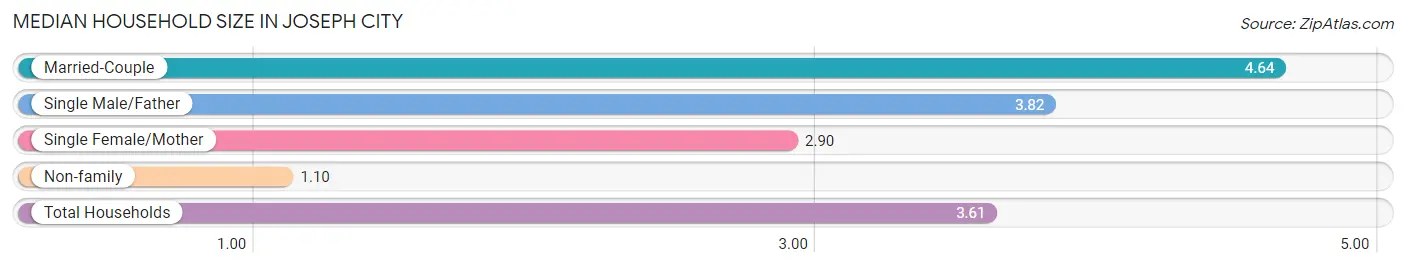
Median Household Size in Joseph City
The median household size in Joseph City is 3.61 persons per household, with married-couple households (332 | 58.3%) accounting for the largest median household size of 4.64 persons per household. non-family households (121 | 21.2%) represent the smallest median household size with 1.10 persons per household.
| Household Type | # Households | Household Size |
| Married-Couple | 332 (58.3%) | 4.64 |
| Single Male/Father | 50 (8.8%) | 3.82 |
| Single Female/Mother | 67 (11.7%) | 2.90 |
| Non-family | 121 (21.2%) | 1.10 |
| Total Households | 570 (100.0%) | 3.61 |
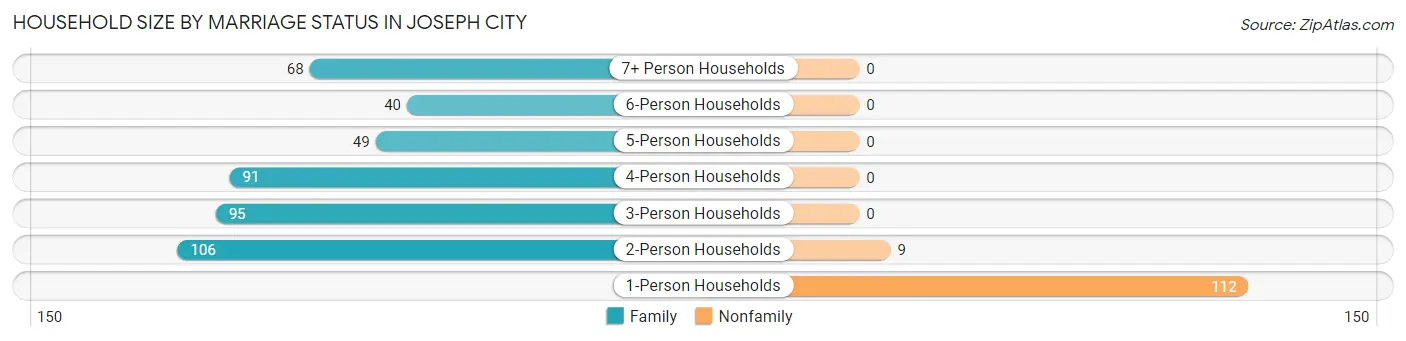
Household Size by Marriage Status in Joseph City
Out of a total of 570 households in Joseph City, 449 (78.8%) are family households, while 121 (21.2%) are nonfamily households. The most numerous type of family households are 2-person households, comprising 106, and the most common type of nonfamily households are 1-person households, comprising 112.
| Household Size | Family Households | Nonfamily Households |
| 1-Person Households | - | 112 (19.7%) |
| 2-Person Households | 106 (18.6%) | 9 (1.6%) |
| 3-Person Households | 95 (16.7%) | 0 (0.0%) |
| 4-Person Households | 91 (16.0%) | 0 (0.0%) |
| 5-Person Households | 49 (8.6%) | 0 (0.0%) |
| 6-Person Households | 40 (7.0%) | 0 (0.0%) |
| 7+ Person Households | 68 (11.9%) | 0 (0.0%) |
| Total | 449 (78.8%) | 121 (21.2%) |
Female Fertility in Joseph City
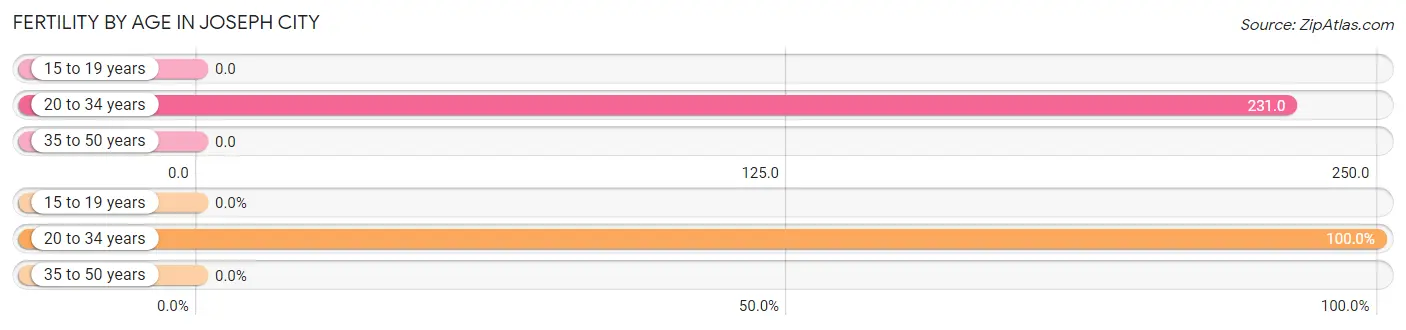
Fertility by Age in Joseph City
Average fertility rate in Joseph City is 92.0 births per 1,000 women. Women in the age bracket of 20 to 34 years have the highest fertility rate with 231.0 births per 1,000 women. Women in the age bracket of 20 to 34 years acount for 100.0% of all women with births.
| Age Bracket | Women with Births | Births / 1,000 Women |
| 15 to 19 years | 0 (0.0%) | 0.0 |
| 20 to 34 years | 51 (100.0%) | 231.0 |
| 35 to 50 years | 0 (0.0%) | 0.0 |
| Total | 51 (100.0%) | 92.0 |
Fertility by Age by Marriage Status in Joseph City
70.6% of women with births (51) in Joseph City are married. The highest percentage of unmarried women with births falls into 20 to 34 years age bracket with 29.4% of them unmarried at the time of birth, while the lowest percentage of unmarried women with births belong to 20 to 34 years age bracket with 29.4% of them unmarried.
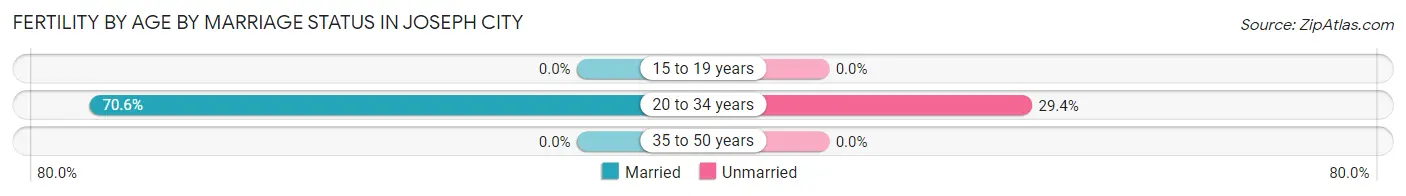
| Age Bracket | Married | Unmarried |
| 15 to 19 years | 0 (0.0%) | 0 (0.0%) |
| 20 to 34 years | 36 (70.6%) | 15 (29.4%) |
| 35 to 50 years | 0 (0.0%) | 0 (0.0%) |
| Total | 36 (70.6%) | 15 (29.4%) |
Fertility by Education in Joseph City
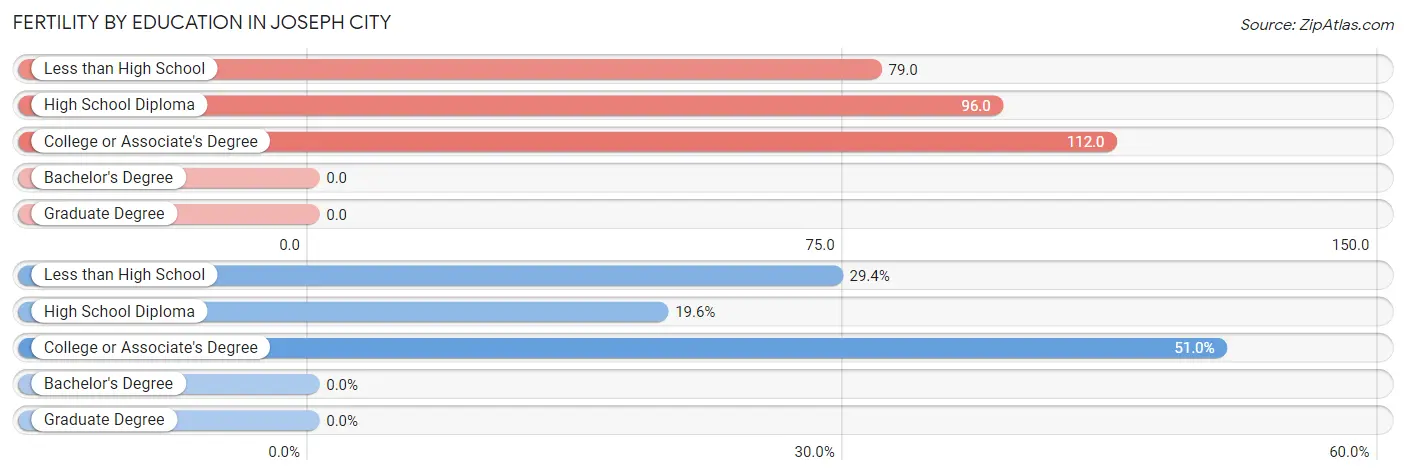
| Educational Attainment | Women with Births | Births / 1,000 Women |
| Less than High School | 15 (29.4%) | 79.0 |
| High School Diploma | 10 (19.6%) | 96.0 |
| College or Associate's Degree | 26 (51.0%) | 112.0 |
| Bachelor's Degree | 0 (0.0%) | 0.0 |
| Graduate Degree | 0 (0.0%) | 0.0 |
| Total | 51 (100.0%) | 92.0 |
Fertility by Education by Marriage Status in Joseph City
29.4% of women with births in Joseph City are unmarried. Women with the educational attainment of high school diploma are most likely to be married with 100.0% of them married at childbirth, while women with the educational attainment of less than high school are least likely to be married with 100.0% of them unmarried at childbirth.
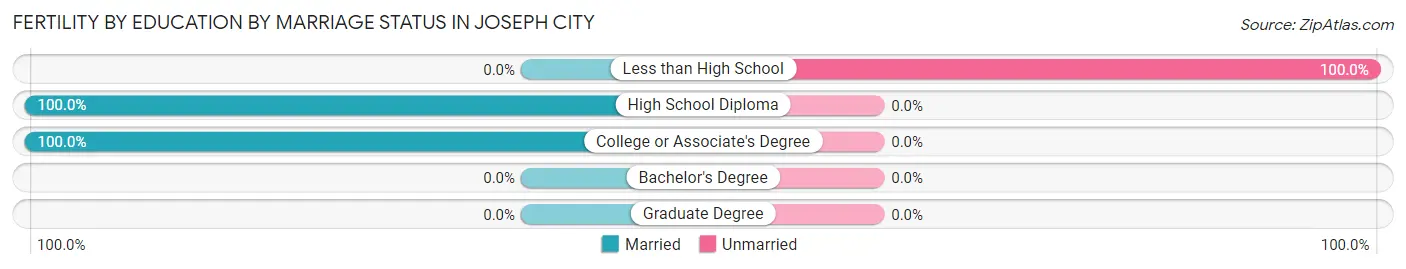
| Educational Attainment | Married | Unmarried |
| Less than High School | 0 (0.0%) | 15 (100.0%) |
| High School Diploma | 10 (100.0%) | 0 (0.0%) |
| College or Associate's Degree | 26 (100.0%) | 0 (0.0%) |
| Bachelor's Degree | 0 (0.0%) | 0 (0.0%) |
| Graduate Degree | 0 (0.0%) | 0 (0.0%) |
| Total | 36 (70.6%) | 15 (29.4%) |
Income in Joseph City
Income Overview in Joseph City
Per Capita Income in Joseph City is $19,906, while median incomes of families and households are $69,087 and $69,643 respectively.
| Characteristic | Number | Measure |
| Per Capita Income | 2,058 | $19,906 |
| Median Family Income | 449 | $69,087 |
| Mean Family Income | 449 | $71,160 |
| Median Household Income | 570 | $69,643 |
| Mean Household Income | 570 | $71,292 |
| Income Deficit | 449 | $0 |
| Wage / Income Gap (%) | 2,058 | 51.07% |
| Wage / Income Gap ($) | 2,058 | 48.93¢ per $1 |
| Gini / Inequality Index | 2,058 | 0.32 |
Earnings by Sex in Joseph City
Average Earnings in Joseph City are $32,692, $50,625 for men and $24,773 for women, a difference of 51.1%.
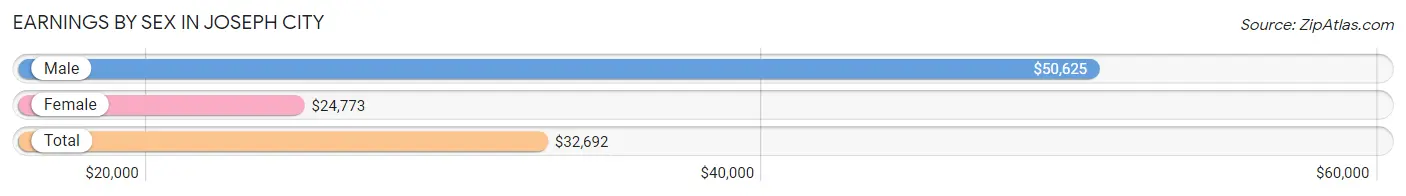
| Sex | Number | Average Earnings |
| Male | 384 (48.8%) | $50,625 |
| Female | 402 (51.1%) | $24,773 |
| Total | 786 (100.0%) | $32,692 |
Earnings by Sex by Income Bracket in Joseph City
The most common earnings brackets in Joseph City are $75,000 to $99,999 for men (63 | 16.4%) and $30,000 to $34,999 for women (56 | 13.9%).
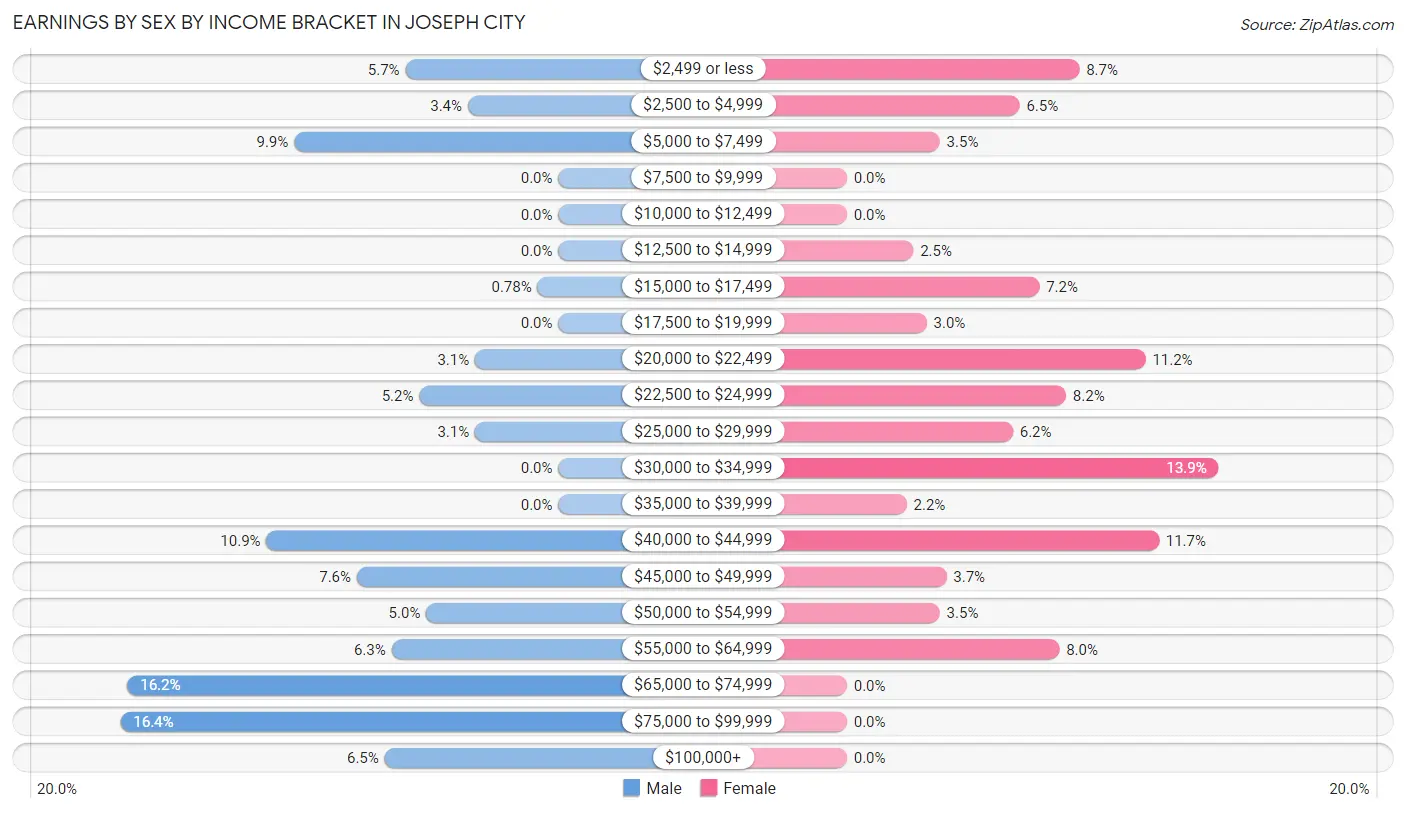
| Income | Male | Female |
| $2,499 or less | 22 (5.7%) | 35 (8.7%) |
| $2,500 to $4,999 | 13 (3.4%) | 26 (6.5%) |
| $5,000 to $7,499 | 38 (9.9%) | 14 (3.5%) |
| $7,500 to $9,999 | 0 (0.0%) | 0 (0.0%) |
| $10,000 to $12,499 | 0 (0.0%) | 0 (0.0%) |
| $12,500 to $14,999 | 0 (0.0%) | 10 (2.5%) |
| $15,000 to $17,499 | 3 (0.8%) | 29 (7.2%) |
| $17,500 to $19,999 | 0 (0.0%) | 12 (3.0%) |
| $20,000 to $22,499 | 12 (3.1%) | 45 (11.2%) |
| $22,500 to $24,999 | 20 (5.2%) | 33 (8.2%) |
| $25,000 to $29,999 | 12 (3.1%) | 25 (6.2%) |
| $30,000 to $34,999 | 0 (0.0%) | 56 (13.9%) |
| $35,000 to $39,999 | 0 (0.0%) | 9 (2.2%) |
| $40,000 to $44,999 | 42 (10.9%) | 47 (11.7%) |
| $45,000 to $49,999 | 29 (7.5%) | 15 (3.7%) |
| $50,000 to $54,999 | 19 (5.0%) | 14 (3.5%) |
| $55,000 to $64,999 | 24 (6.2%) | 32 (8.0%) |
| $65,000 to $74,999 | 62 (16.2%) | 0 (0.0%) |
| $75,000 to $99,999 | 63 (16.4%) | 0 (0.0%) |
| $100,000+ | 25 (6.5%) | 0 (0.0%) |
| Total | 384 (100.0%) | 402 (100.0%) |
Earnings by Sex by Educational Attainment in Joseph City
Average earnings in Joseph City are $58,385 for men and $25,714 for women, a difference of 56.0%. Men with an educational attainment of college or associate's degree enjoy the highest average annual earnings of $71,591, while those with college or associate's degree education earn the least with $71,591. Women with an educational attainment of graduate degree earn the most with the average annual earnings of $49,667, while those with college or associate's degree education have the smallest earnings of $25,446.
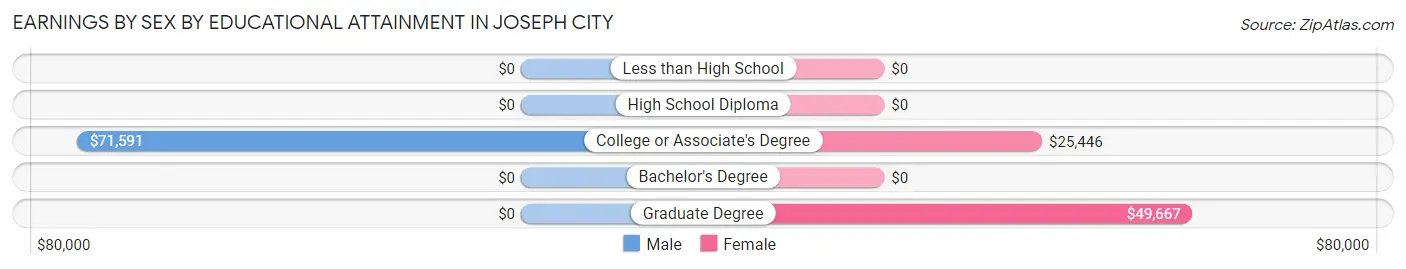
| Educational Attainment | Male Income | Female Income |
| Less than High School | - | - |
| High School Diploma | - | - |
| College or Associate's Degree | $71,591 | $25,446 |
| Bachelor's Degree | - | - |
| Graduate Degree | - | - |
| Total | $58,385 | $25,714 |
Family Income in Joseph City
Family Income Brackets in Joseph City
According to the Joseph City family income data, there are 112 families falling into the $35,000 to $49,999 income range, which is the most common income bracket and makes up 24.9% of all families.
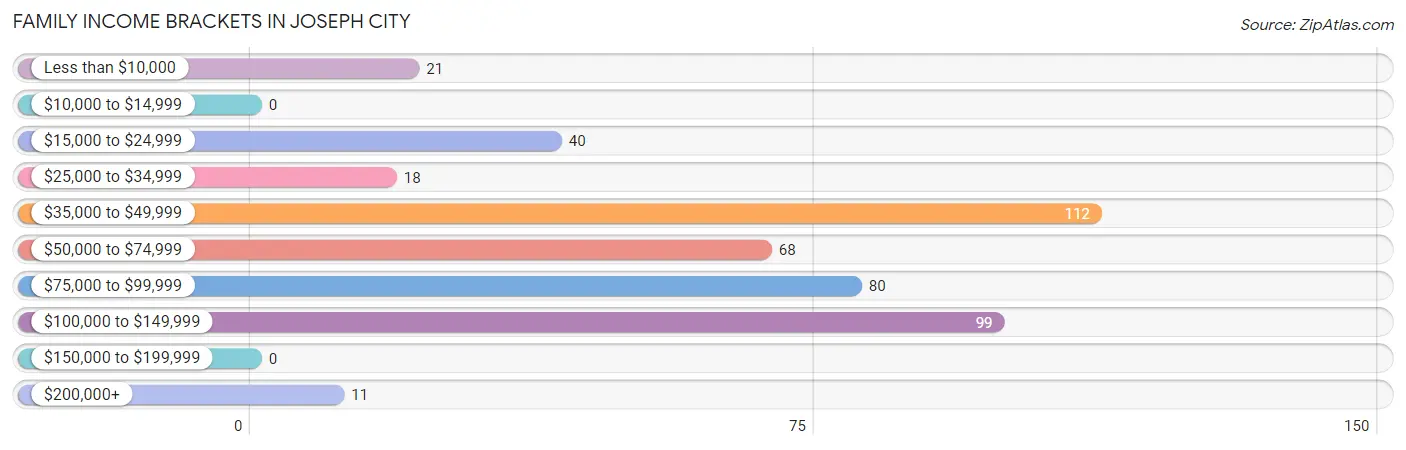
| Income Bracket | # Families | % Families |
| Less than $10,000 | 21 | 4.7% |
| $10,000 to $14,999 | 0 | 0.0% |
| $15,000 to $24,999 | 40 | 8.9% |
| $25,000 to $34,999 | 18 | 4.0% |
| $35,000 to $49,999 | 112 | 24.9% |
| $50,000 to $74,999 | 68 | 15.1% |
| $75,000 to $99,999 | 80 | 17.8% |
| $100,000 to $149,999 | 99 | 22.0% |
| $150,000 to $199,999 | 0 | 0.0% |
| $200,000+ | 11 | 2.4% |
Family Income by Famaliy Size in Joseph City
6-person families (52 | 11.6%) account for the highest median family income in Joseph City with $100,909 per family, while 2-person families (127 | 28.3%) have the highest median income of $22,562 per family member.
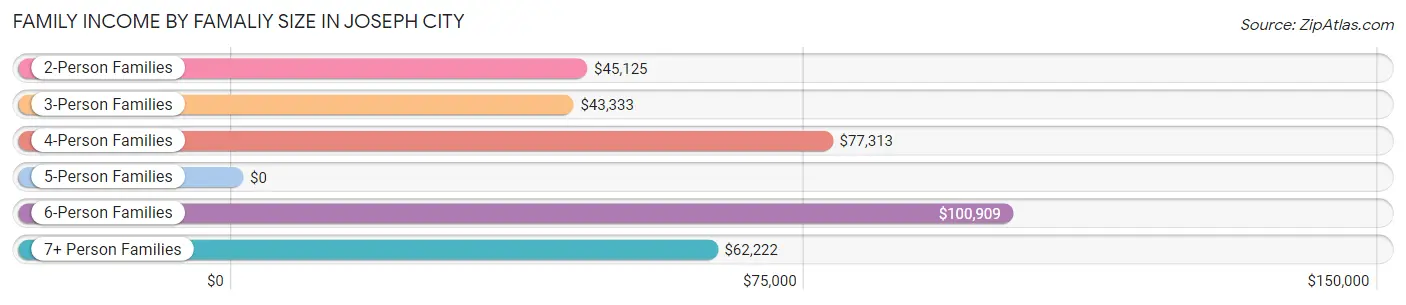
| Income Bracket | # Families | Median Income |
| 2-Person Families | 127 (28.3%) | $45,125 |
| 3-Person Families | 92 (20.5%) | $43,333 |
| 4-Person Families | 73 (16.3%) | $77,313 |
| 5-Person Families | 49 (10.9%) | $0 |
| 6-Person Families | 52 (11.6%) | $100,909 |
| 7+ Person Families | 56 (12.5%) | $62,222 |
| Total | 449 (100.0%) | $69,087 |
Family Income by Number of Earners in Joseph City
The median family income in Joseph City is $69,087, with families comprising 3+ earners (59) having the highest median family income of $119,063, while families with 1 earner (134) have the lowest median family income of $42,177, accounting for 13.1% and 29.8% of families, respectively.
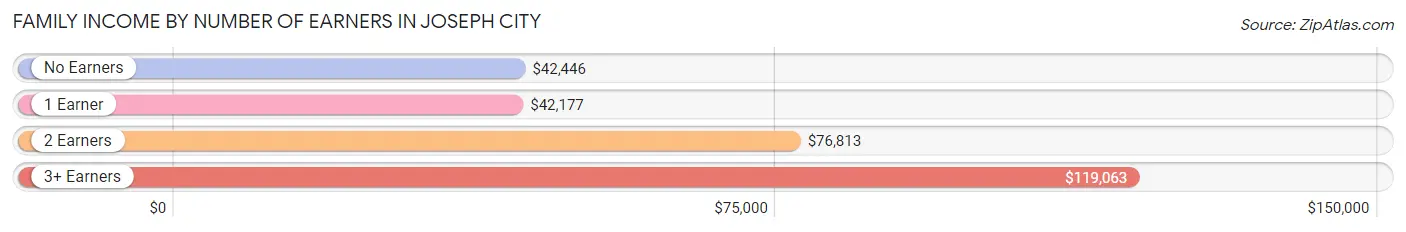
| Number of Earners | # Families | Median Income |
| No Earners | 101 (22.5%) | $42,446 |
| 1 Earner | 134 (29.8%) | $42,177 |
| 2 Earners | 155 (34.5%) | $76,813 |
| 3+ Earners | 59 (13.1%) | $119,063 |
| Total | 449 (100.0%) | $69,087 |
Household Income in Joseph City
Household Income Brackets in Joseph City
With 160 households falling in the category, the $35,000 to $49,999 income range is the most frequent in Joseph City, accounting for 28.1% of all households.
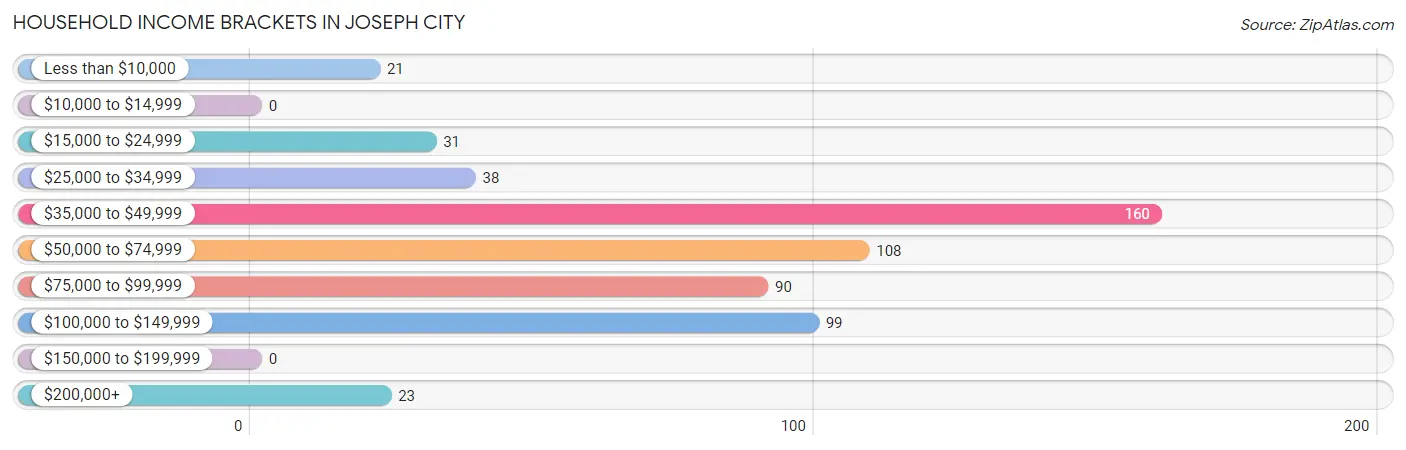
| Income Bracket | # Households | % Households |
| Less than $10,000 | 21 | 3.7% |
| $10,000 to $14,999 | 0 | 0.0% |
| $15,000 to $24,999 | 31 | 5.4% |
| $25,000 to $34,999 | 38 | 6.7% |
| $35,000 to $49,999 | 160 | 28.1% |
| $50,000 to $74,999 | 108 | 18.9% |
| $75,000 to $99,999 | 90 | 15.8% |
| $100,000 to $149,999 | 99 | 17.4% |
| $150,000 to $199,999 | 0 | 0.0% |
| $200,000+ | 23 | 4.0% |
Household Income by Householder Age in Joseph City
The median household income in Joseph City is $69,643, with the highest median household income of $78,250 found in the 45 to 64 years age bracket for the primary householder. A total of 162 households (28.4%) fall into this category. Meanwhile, the 15 to 24 years age bracket for the primary householder has the lowest median household income of $0, with 41 households (7.2%) in this group.
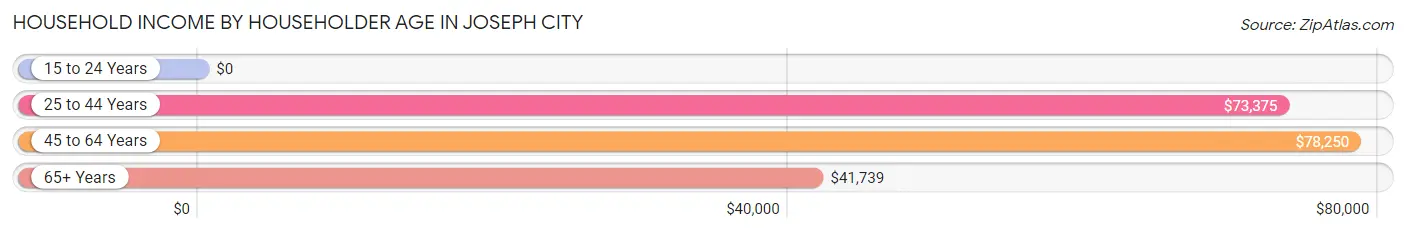
| Income Bracket | # Households | Median Income |
| 15 to 24 Years | 41 (7.2%) | $0 |
| 25 to 44 Years | 245 (43.0%) | $73,375 |
| 45 to 64 Years | 162 (28.4%) | $78,250 |
| 65+ Years | 122 (21.4%) | $41,739 |
| Total | 570 (100.0%) | $69,643 |
Poverty in Joseph City
Income Below Poverty by Sex and Age in Joseph City
With 12.0% poverty level for males and 17.0% for females among the residents of Joseph City, 6 to 11 year old males and 12 to 14 year old females are the most vulnerable to poverty, with 66 males (27.9%) and 24 females (49.0%) in their respective age groups living below the poverty level.
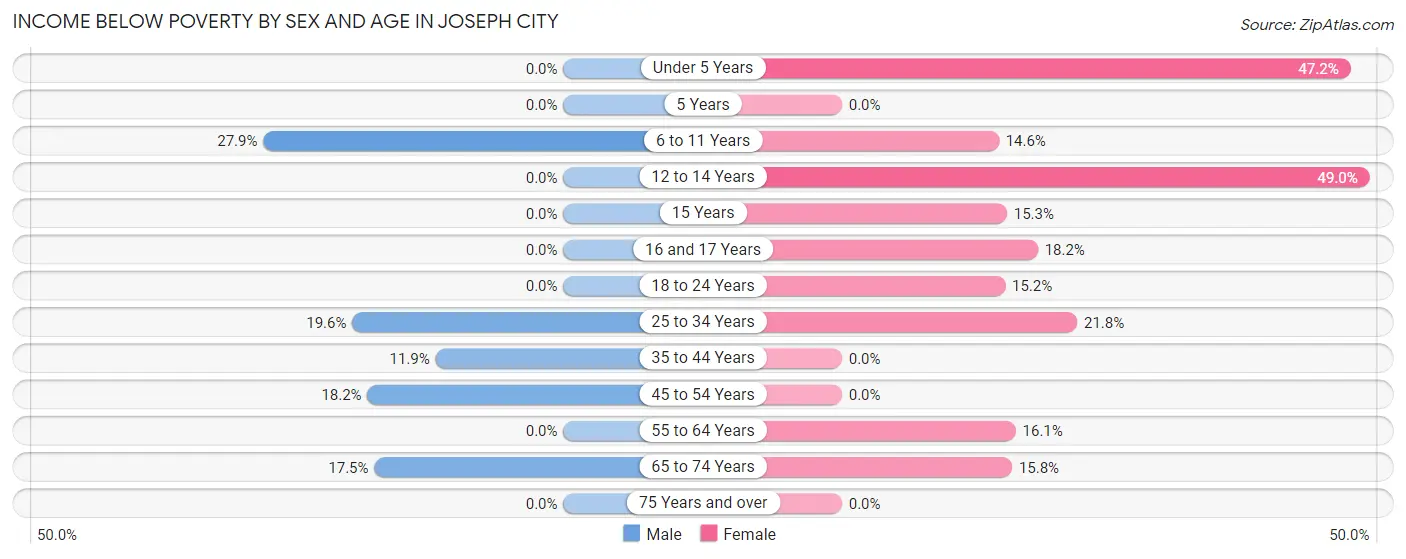
| Age Bracket | Male | Female |
| Under 5 Years | 0 (0.0%) | 34 (47.2%) |
| 5 Years | 0 (0.0%) | 0 (0.0%) |
| 6 to 11 Years | 66 (27.9%) | 15 (14.6%) |
| 12 to 14 Years | 0 (0.0%) | 24 (49.0%) |
| 15 Years | 0 (0.0%) | 15 (15.3%) |
| 16 and 17 Years | 0 (0.0%) | 10 (18.2%) |
| 18 to 24 Years | 0 (0.0%) | 15 (15.1%) |
| 25 to 34 Years | 19 (19.6%) | 31 (21.8%) |
| 35 to 44 Years | 14 (11.9%) | 0 (0.0%) |
| 45 to 54 Years | 18 (18.2%) | 0 (0.0%) |
| 55 to 64 Years | 0 (0.0%) | 10 (16.1%) |
| 65 to 74 Years | 10 (17.5%) | 15 (15.8%) |
| 75 Years and over | 0 (0.0%) | 0 (0.0%) |
| Total | 127 (12.0%) | 169 (17.0%) |
Income Above Poverty by Sex and Age in Joseph City
According to the poverty statistics in Joseph City, males aged under 5 years and females aged 5 years are the age groups that are most secure financially, with 100.0% of males and 100.0% of females in these age groups living above the poverty line.
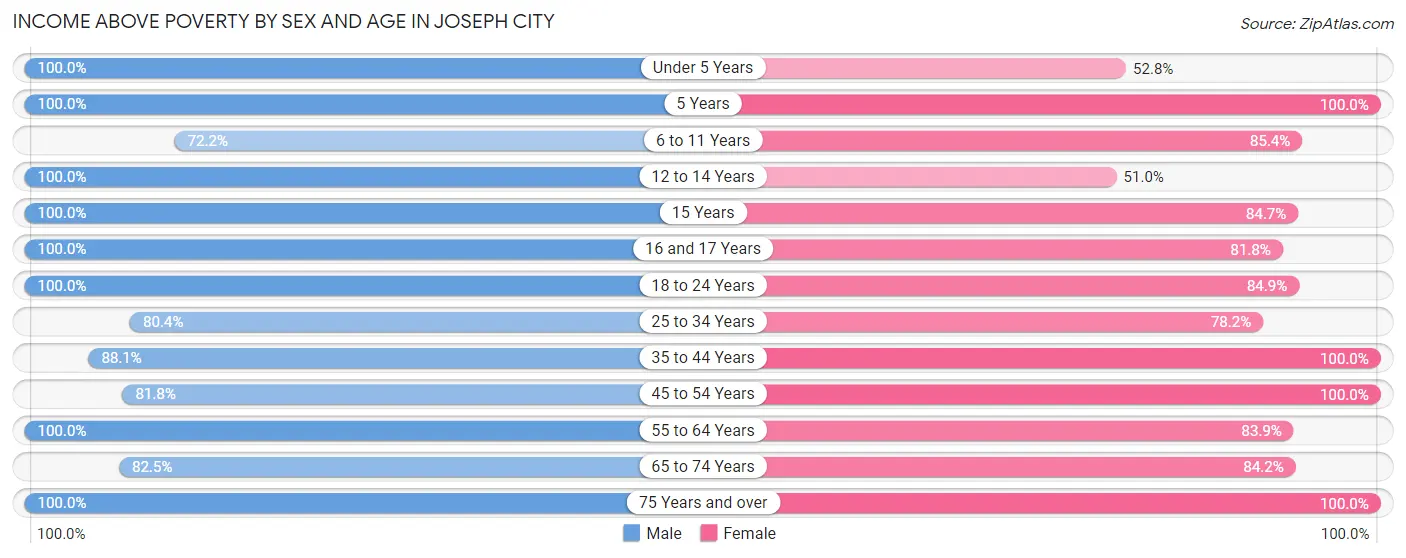
| Age Bracket | Male | Female |
| Under 5 Years | 161 (100.0%) | 38 (52.8%) |
| 5 Years | 30 (100.0%) | 14 (100.0%) |
| 6 to 11 Years | 171 (72.2%) | 88 (85.4%) |
| 12 to 14 Years | 52 (100.0%) | 25 (51.0%) |
| 15 Years | 30 (100.0%) | 83 (84.7%) |
| 16 and 17 Years | 36 (100.0%) | 45 (81.8%) |
| 18 to 24 Years | 97 (100.0%) | 84 (84.9%) |
| 25 to 34 Years | 78 (80.4%) | 111 (78.2%) |
| 35 to 44 Years | 104 (88.1%) | 98 (100.0%) |
| 45 to 54 Years | 81 (81.8%) | 76 (100.0%) |
| 55 to 64 Years | 37 (100.0%) | 52 (83.9%) |
| 65 to 74 Years | 47 (82.5%) | 80 (84.2%) |
| 75 Years and over | 10 (100.0%) | 34 (100.0%) |
| Total | 934 (88.0%) | 828 (83.1%) |
Income Below Poverty Among Married-Couple Families in Joseph City
The poverty statistics for married-couple families in Joseph City show that 12.3% or 41 of the total 332 families live below the poverty line. Families with 5 or more children have the highest poverty rate of 46.5%, comprising of 20 families. On the other hand, families with 3 or 4 children have the lowest poverty rate of 0.0%, which includes 0 families.
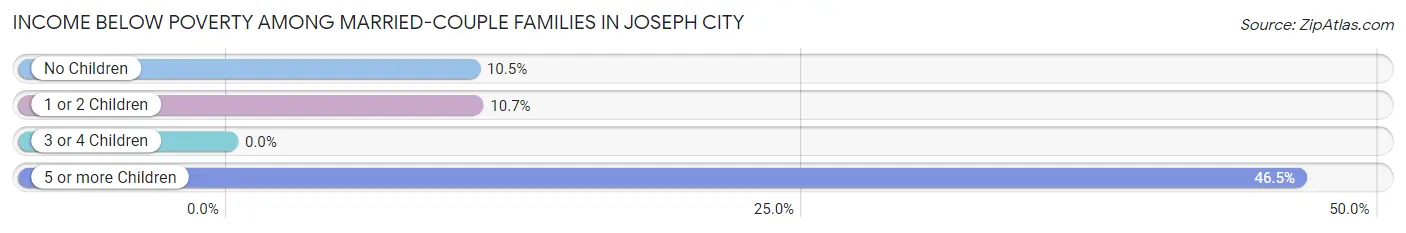
| Children | Above Poverty | Below Poverty |
| No Children | 85 (89.5%) | 10 (10.5%) |
| 1 or 2 Children | 92 (89.3%) | 11 (10.7%) |
| 3 or 4 Children | 91 (100.0%) | 0 (0.0%) |
| 5 or more Children | 23 (53.5%) | 20 (46.5%) |
| Total | 291 (87.6%) | 41 (12.3%) |
Income Below Poverty Among Single-Parent Households in Joseph City
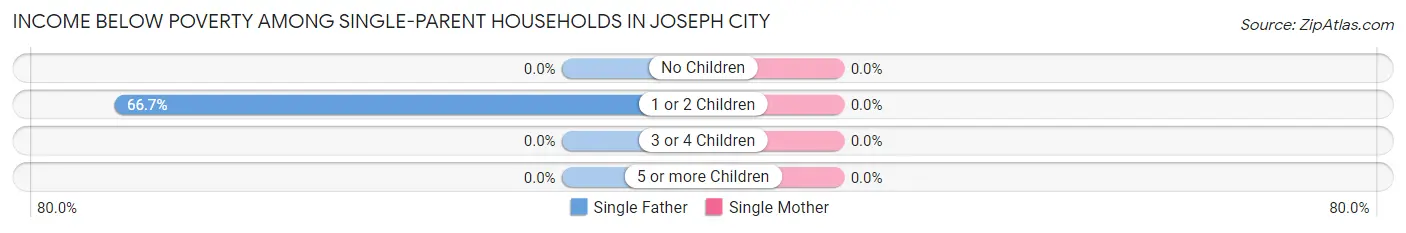
| Children | Single Father | Single Mother |
| No Children | 0 (0.0%) | 0 (0.0%) |
| 1 or 2 Children | 18 (66.7%) | 0 (0.0%) |
| 3 or 4 Children | 0 (0.0%) | 0 (0.0%) |
| 5 or more Children | 0 (0.0%) | 0 (0.0%) |
| Total | 18 (36.0%) | 0 (0.0%) |
Income Below Poverty Among Married-Couple vs Single-Parent Households in Joseph City
The poverty data for Joseph City shows that 41 of the married-couple family households (12.3%) and 18 of the single-parent households (15.4%) are living below the poverty level. Within the married-couple family households, those with 5 or more children have the highest poverty rate, with 20 households (46.5%) falling below the poverty line. Among the single-parent households, those with 1 or 2 children have the highest poverty rate, with 18 household (22.0%) living below poverty.
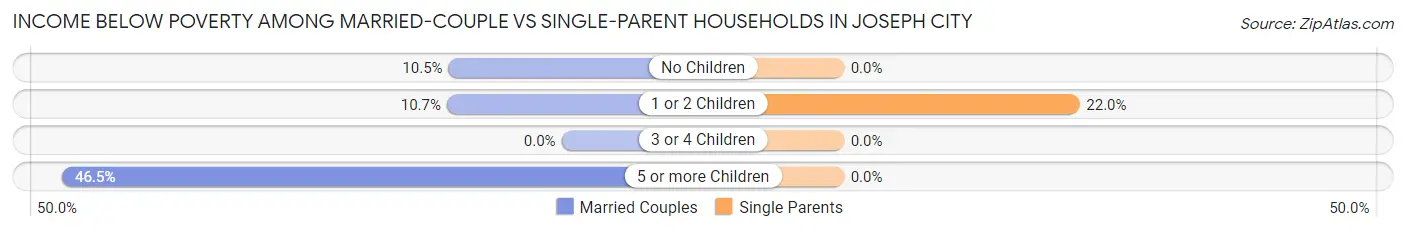
| Children | Married-Couple Families | Single-Parent Households |
| No Children | 10 (10.5%) | 0 (0.0%) |
| 1 or 2 Children | 11 (10.7%) | 18 (22.0%) |
| 3 or 4 Children | 0 (0.0%) | 0 (0.0%) |
| 5 or more Children | 20 (46.5%) | 0 (0.0%) |
| Total | 41 (12.3%) | 18 (15.4%) |
Employment Characteristics in Joseph City
Employment by Class of Employer in Joseph City
Among the 726 employed individuals in Joseph City, private company employees (379 | 52.2%), local government employees (120 | 16.5%), and state government employees (118 | 16.3%) make up the most common classes of employment.
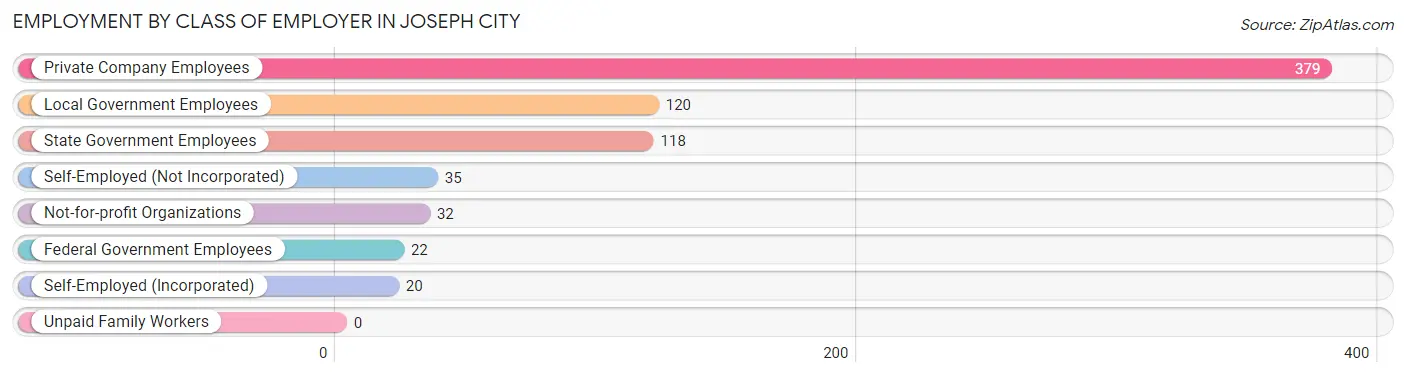
| Employer Class | # Employees | % Employees |
| Private Company Employees | 379 | 52.2% |
| Self-Employed (Incorporated) | 20 | 2.8% |
| Self-Employed (Not Incorporated) | 35 | 4.8% |
| Not-for-profit Organizations | 32 | 4.4% |
| Local Government Employees | 120 | 16.5% |
| State Government Employees | 118 | 16.3% |
| Federal Government Employees | 22 | 3.0% |
| Unpaid Family Workers | 0 | 0.0% |
| Total | 726 | 100.0% |
Employment Status by Age in Joseph City
According to the labor force statistics for Joseph City, out of the total population over 16 years of age (1,212), 64.5% or 782 individuals are in the labor force, with 5.2% or 41 of them unemployed. The age group with the highest labor force participation rate is 30 to 34 years, with 96.7% or 175 individuals in the labor force. Within the labor force, the 16 to 19 years age range has the highest percentage of unemployed individuals, with 32.8% or 22 of them being unemployed.
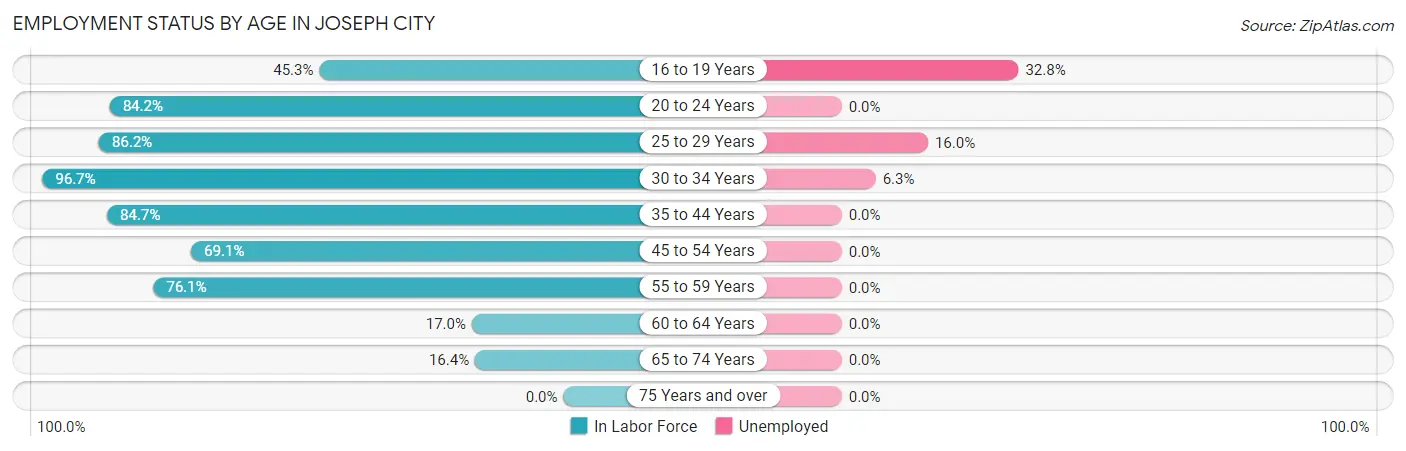
| Age Bracket | In Labor Force | Unemployed |
| 16 to 19 Years | 67 (45.3%) | 22 (32.8%) |
| 20 to 24 Years | 117 (84.2%) | 0 (0.0%) |
| 25 to 29 Years | 50 (86.2%) | 8 (16.0%) |
| 30 to 34 Years | 175 (96.7%) | 11 (6.3%) |
| 35 to 44 Years | 183 (84.7%) | 0 (0.0%) |
| 45 to 54 Years | 121 (69.1%) | 0 (0.0%) |
| 55 to 59 Years | 35 (76.1%) | 0 (0.0%) |
| 60 to 64 Years | 9 (17.0%) | 0 (0.0%) |
| 65 to 74 Years | 25 (16.4%) | 0 (0.0%) |
| 75 Years and over | 0 (0.0%) | 0 (0.0%) |
| Total | 782 (64.5%) | 41 (5.2%) |
Employment Status by Educational Attainment in Joseph City
According to labor force statistics for Joseph City, 78.6% of individuals (573) out of the total population between 25 and 64 years of age (729) are in the labor force, with 3.3% or 19 of them being unemployed. The group with the highest labor force participation rate are those with the educational attainment of less than high school, with 100.0% or 12 individuals in the labor force. Within the labor force, individuals with high school diploma education have the highest percentage of unemployment, with 19.4% or 19 of them being unemployed.
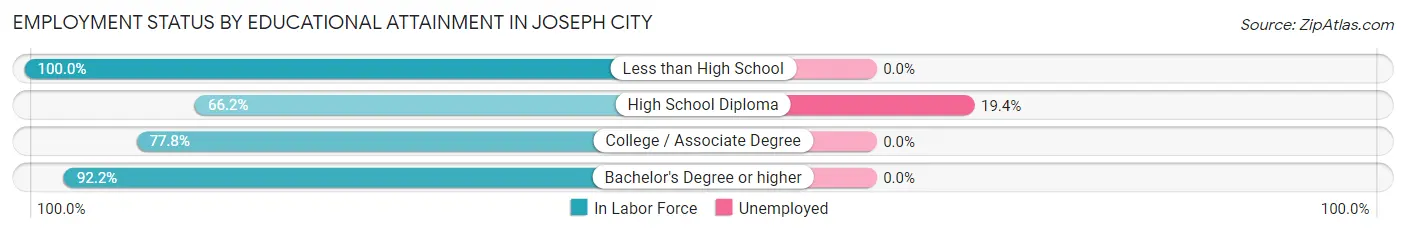
| Educational Attainment | In Labor Force | Unemployed |
| Less than High School | 12 (100.0%) | 0 (0.0%) |
| High School Diploma | 98 (66.2%) | 29 (19.4%) |
| College / Associate Degree | 333 (77.8%) | 0 (0.0%) |
| Bachelor's Degree or higher | 130 (92.2%) | 0 (0.0%) |
| Total | 573 (78.6%) | 24 (3.3%) |
Employment Occupations by Sex in Joseph City
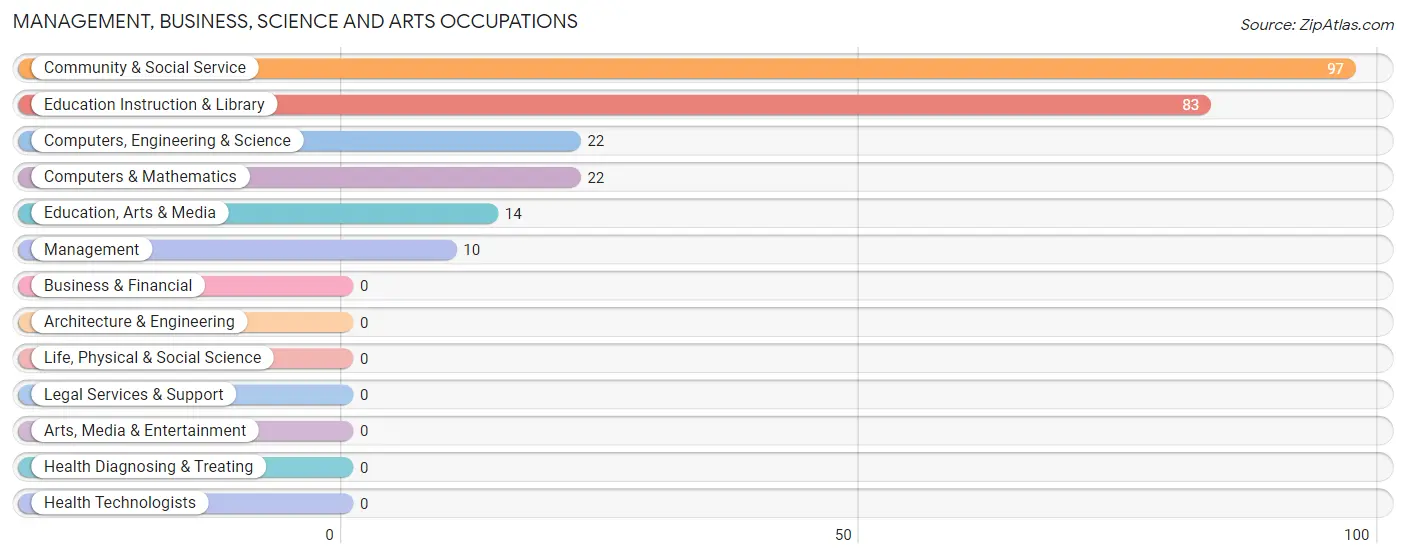
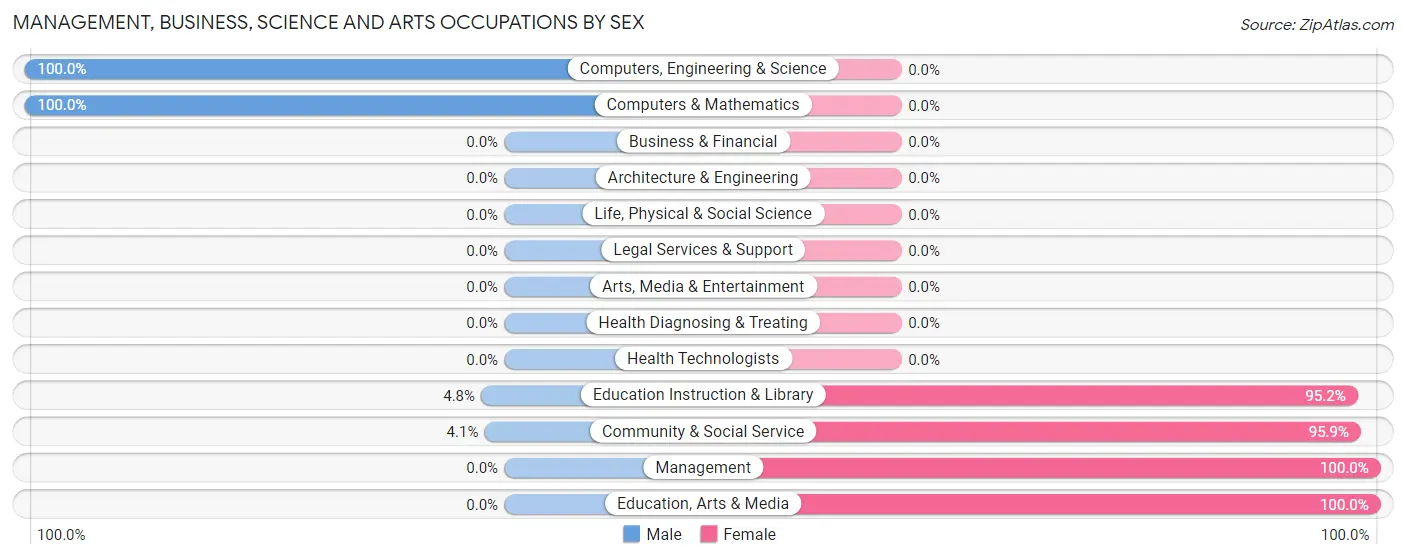
Management, Business, Science and Arts Occupations
The most common Management, Business, Science and Arts occupations in Joseph City are Community & Social Service (97 | 13.1%), Education Instruction & Library (83 | 11.2%), Computers, Engineering & Science (22 | 3.0%), Computers & Mathematics (22 | 3.0%), and Education, Arts & Media (14 | 1.9%).
Management, Business, Science and Arts Occupations by Sex
Within the Management, Business, Science and Arts occupations in Joseph City, the most male-oriented occupations are Computers, Engineering & Science (100.0%), Computers & Mathematics (100.0%), and Education Instruction & Library (4.8%), while the most female-oriented occupations are Management (100.0%), Education, Arts & Media (100.0%), and Community & Social Service (95.9%).
| Occupation | Male | Female |
| Management | 0 (0.0%) | 10 (100.0%) |
| Business & Financial | 0 (0.0%) | 0 (0.0%) |
| Computers, Engineering & Science | 22 (100.0%) | 0 (0.0%) |
| Computers & Mathematics | 22 (100.0%) | 0 (0.0%) |
| Architecture & Engineering | 0 (0.0%) | 0 (0.0%) |
| Life, Physical & Social Science | 0 (0.0%) | 0 (0.0%) |
| Community & Social Service | 4 (4.1%) | 93 (95.9%) |
| Education, Arts & Media | 0 (0.0%) | 14 (100.0%) |
| Legal Services & Support | 0 (0.0%) | 0 (0.0%) |
| Education Instruction & Library | 4 (4.8%) | 79 (95.2%) |
| Arts, Media & Entertainment | 0 (0.0%) | 0 (0.0%) |
| Health Diagnosing & Treating | 0 (0.0%) | 0 (0.0%) |
| Health Technologists | 0 (0.0%) | 0 (0.0%) |
| Total (Category) | 26 (20.2%) | 103 (79.8%) |
| Total (Overall) | 360 (48.6%) | 381 (51.4%) |
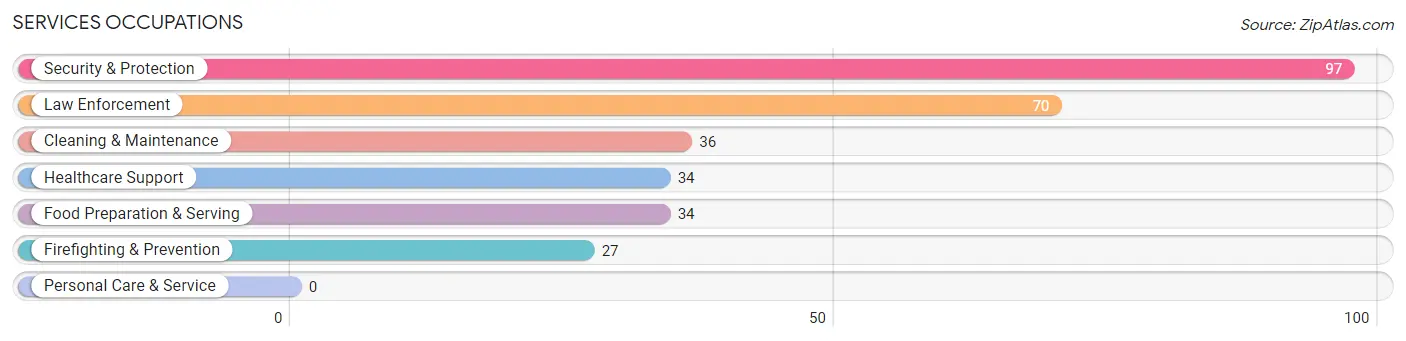
Services Occupations
The most common Services occupations in Joseph City are Security & Protection (97 | 13.1%), Law Enforcement (70 | 9.5%), Cleaning & Maintenance (36 | 4.9%), Healthcare Support (34 | 4.6%), and Food Preparation & Serving (34 | 4.6%).
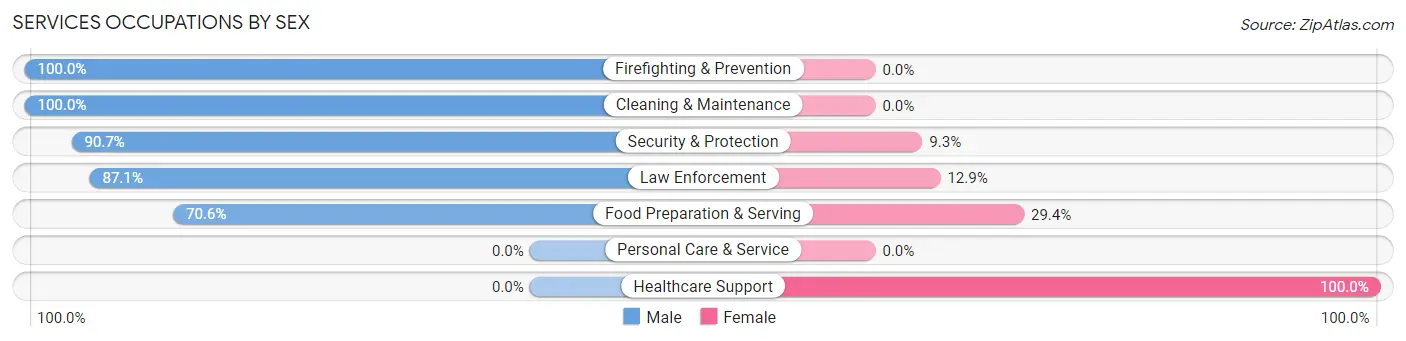
Services Occupations by Sex
Within the Services occupations in Joseph City, the most male-oriented occupations are Firefighting & Prevention (100.0%), Cleaning & Maintenance (100.0%), and Security & Protection (90.7%), while the most female-oriented occupations are Healthcare Support (100.0%), Food Preparation & Serving (29.4%), and Law Enforcement (12.9%).
| Occupation | Male | Female |
| Healthcare Support | 0 (0.0%) | 34 (100.0%) |
| Security & Protection | 88 (90.7%) | 9 (9.3%) |
| Firefighting & Prevention | 27 (100.0%) | 0 (0.0%) |
| Law Enforcement | 61 (87.1%) | 9 (12.9%) |
| Food Preparation & Serving | 24 (70.6%) | 10 (29.4%) |
| Cleaning & Maintenance | 36 (100.0%) | 0 (0.0%) |
| Personal Care & Service | 0 (0.0%) | 0 (0.0%) |
| Total (Category) | 148 (73.6%) | 53 (26.4%) |
| Total (Overall) | 360 (48.6%) | 381 (51.4%) |
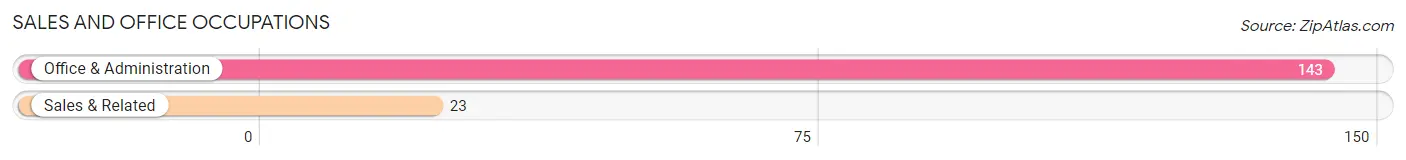
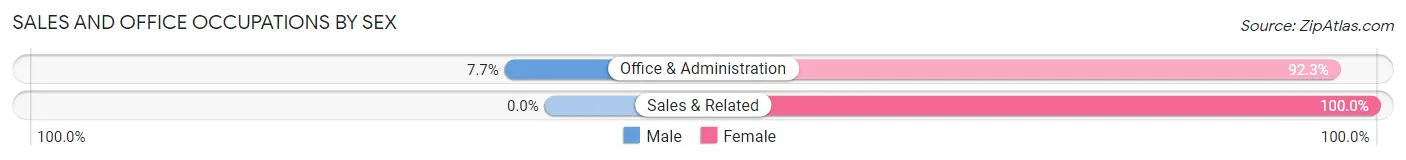
Sales and Office Occupations
The most common Sales and Office occupations in Joseph City are Office & Administration (143 | 19.3%), and Sales & Related (23 | 3.1%).
Sales and Office Occupations by Sex
| Occupation | Male | Female |
| Sales & Related | 0 (0.0%) | 23 (100.0%) |
| Office & Administration | 11 (7.7%) | 132 (92.3%) |
| Total (Category) | 11 (6.6%) | 155 (93.4%) |
| Total (Overall) | 360 (48.6%) | 381 (51.4%) |
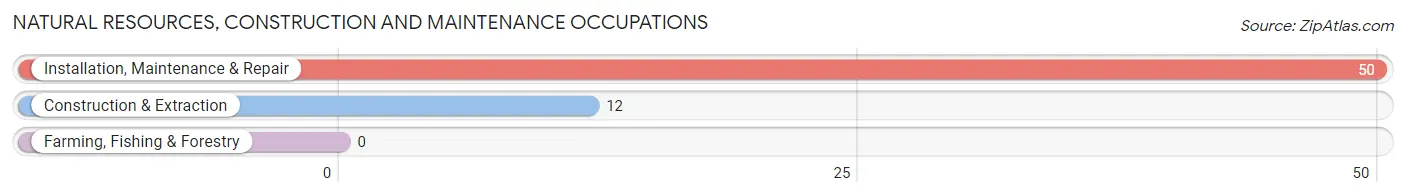
Natural Resources, Construction and Maintenance Occupations
The most common Natural Resources, Construction and Maintenance occupations in Joseph City are Installation, Maintenance & Repair (50 | 6.8%), and Construction & Extraction (12 | 1.6%).
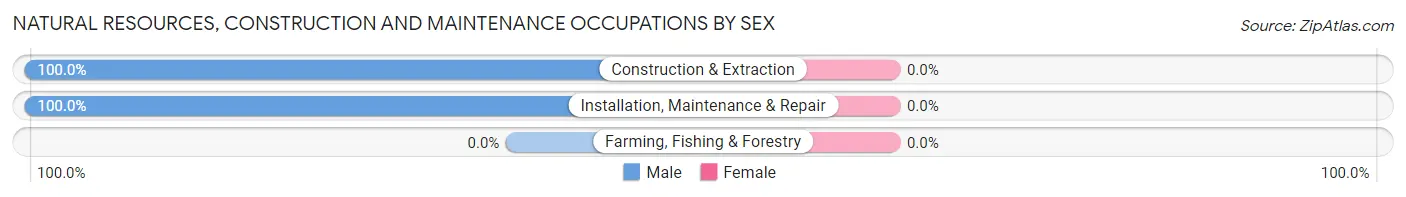
Natural Resources, Construction and Maintenance Occupations by Sex
| Occupation | Male | Female |
| Farming, Fishing & Forestry | 0 (0.0%) | 0 (0.0%) |
| Construction & Extraction | 12 (100.0%) | 0 (0.0%) |
| Installation, Maintenance & Repair | 50 (100.0%) | 0 (0.0%) |
| Total (Category) | 62 (100.0%) | 0 (0.0%) |
| Total (Overall) | 360 (48.6%) | 381 (51.4%) |
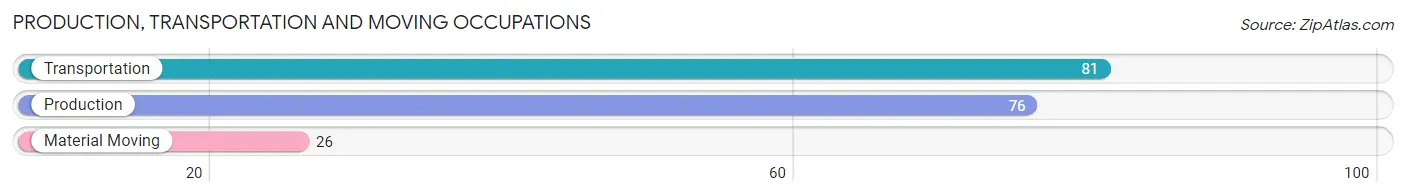
Production, Transportation and Moving Occupations
The most common Production, Transportation and Moving occupations in Joseph City are Transportation (81 | 10.9%), Production (76 | 10.3%), and Material Moving (26 | 3.5%).
Production, Transportation and Moving Occupations by Sex
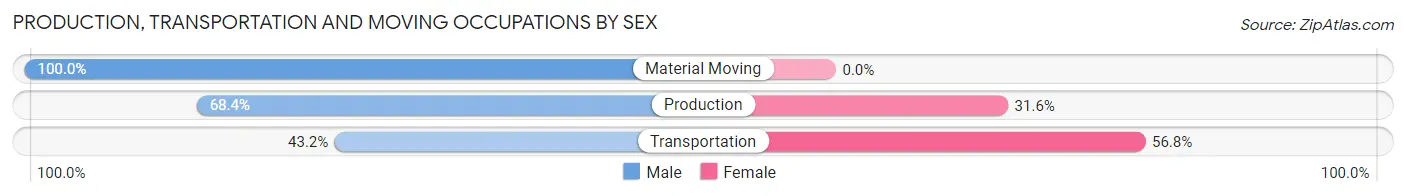
| Occupation | Male | Female |
| Production | 52 (68.4%) | 24 (31.6%) |
| Transportation | 35 (43.2%) | 46 (56.8%) |
| Material Moving | 26 (100.0%) | 0 (0.0%) |
| Total (Category) | 113 (61.8%) | 70 (38.3%) |
| Total (Overall) | 360 (48.6%) | 381 (51.4%) |
Employment Industries by Sex in Joseph City
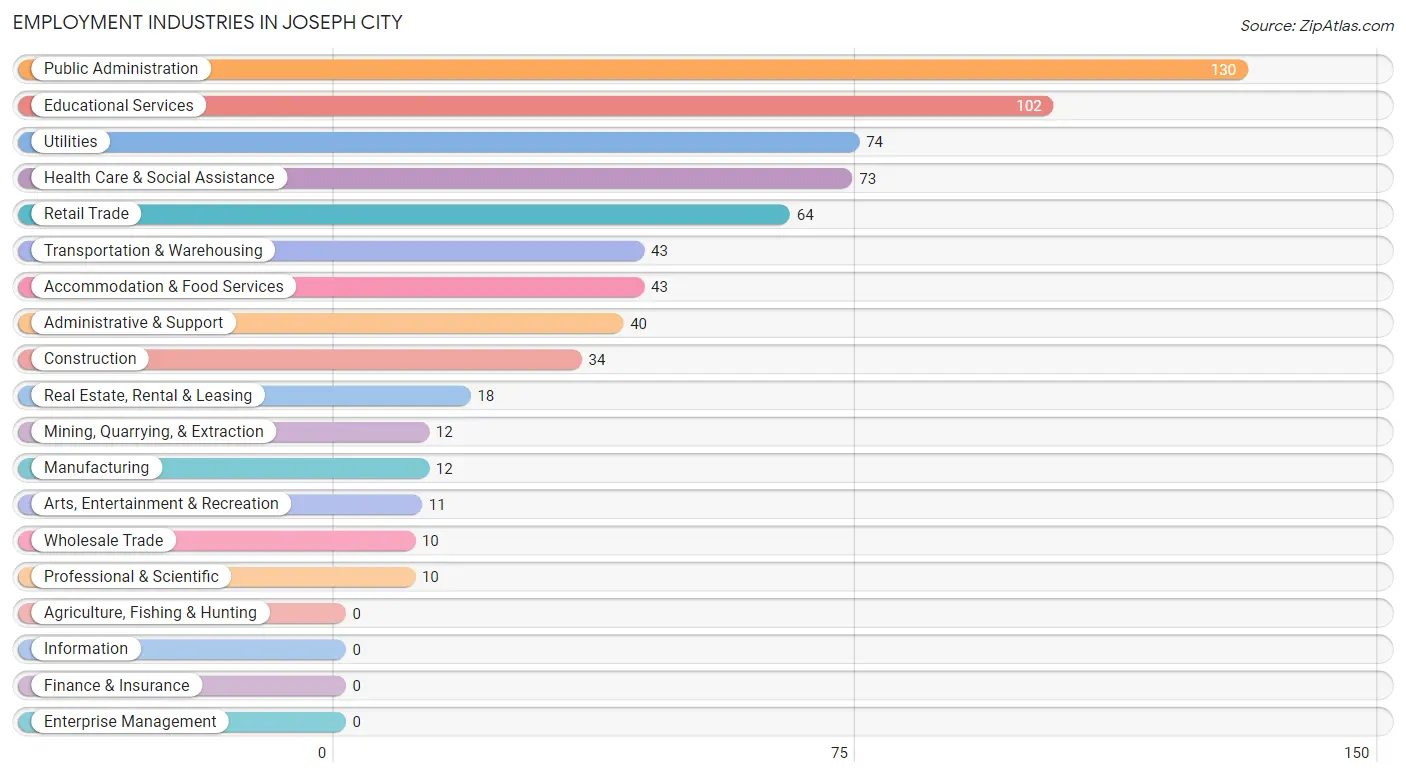
Employment Industries in Joseph City
The major employment industries in Joseph City include Public Administration (130 | 17.5%), Educational Services (102 | 13.8%), Utilities (74 | 10.0%), Health Care & Social Assistance (73 | 9.9%), and Retail Trade (64 | 8.6%).
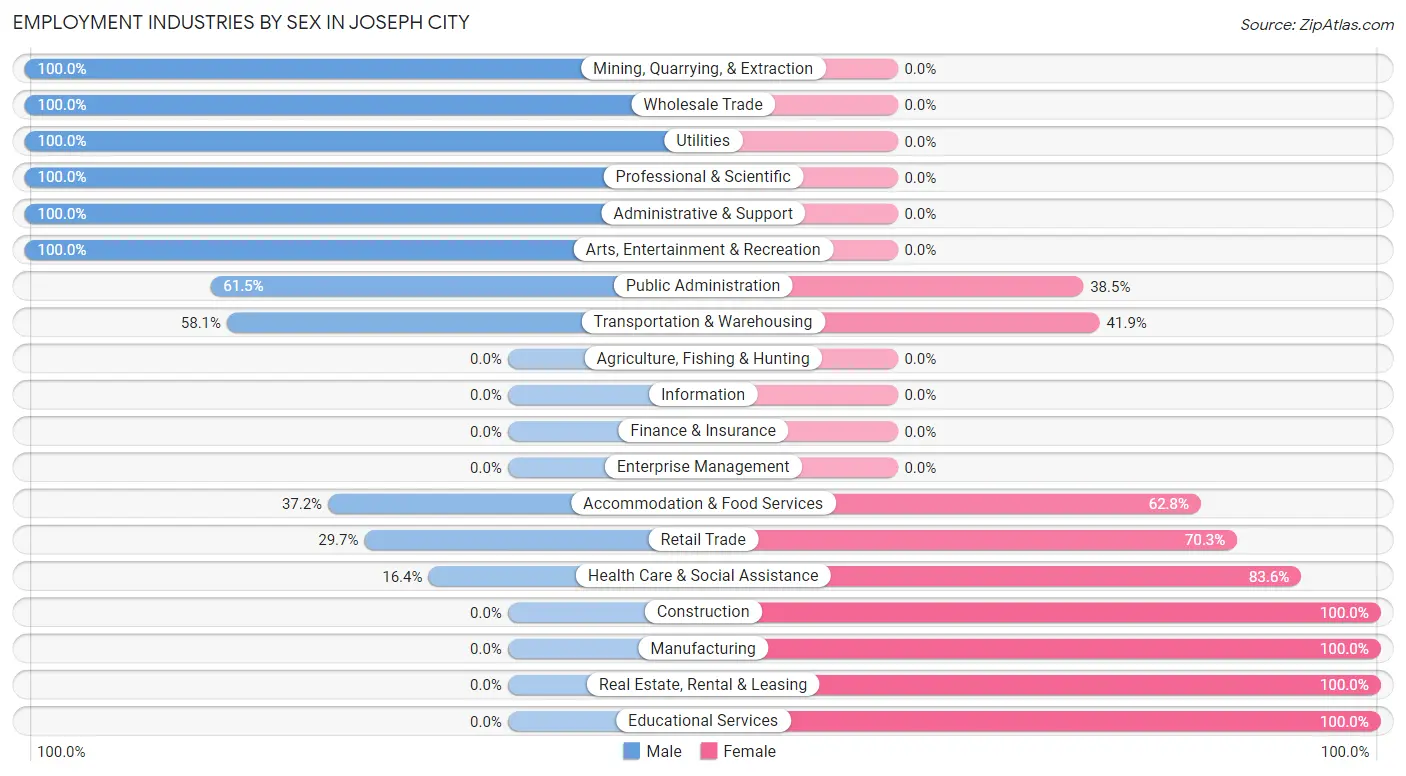
Employment Industries by Sex in Joseph City
The Joseph City industries that see more men than women are Mining, Quarrying, & Extraction (100.0%), Wholesale Trade (100.0%), and Utilities (100.0%), whereas the industries that tend to have a higher number of women are Construction (100.0%), Manufacturing (100.0%), and Real Estate, Rental & Leasing (100.0%).
| Industry | Male | Female |
| Agriculture, Fishing & Hunting | 0 (0.0%) | 0 (0.0%) |
| Mining, Quarrying, & Extraction | 12 (100.0%) | 0 (0.0%) |
| Construction | 0 (0.0%) | 34 (100.0%) |
| Manufacturing | 0 (0.0%) | 12 (100.0%) |
| Wholesale Trade | 10 (100.0%) | 0 (0.0%) |
| Retail Trade | 19 (29.7%) | 45 (70.3%) |
| Transportation & Warehousing | 25 (58.1%) | 18 (41.9%) |
| Utilities | 74 (100.0%) | 0 (0.0%) |
| Information | 0 (0.0%) | 0 (0.0%) |
| Finance & Insurance | 0 (0.0%) | 0 (0.0%) |
| Real Estate, Rental & Leasing | 0 (0.0%) | 18 (100.0%) |
| Professional & Scientific | 10 (100.0%) | 0 (0.0%) |
| Enterprise Management | 0 (0.0%) | 0 (0.0%) |
| Administrative & Support | 40 (100.0%) | 0 (0.0%) |
| Educational Services | 0 (0.0%) | 102 (100.0%) |
| Health Care & Social Assistance | 12 (16.4%) | 61 (83.6%) |
| Arts, Entertainment & Recreation | 11 (100.0%) | 0 (0.0%) |
| Accommodation & Food Services | 16 (37.2%) | 27 (62.8%) |
| Public Administration | 80 (61.5%) | 50 (38.5%) |
| Total | 360 (48.6%) | 381 (51.4%) |
Education in Joseph City
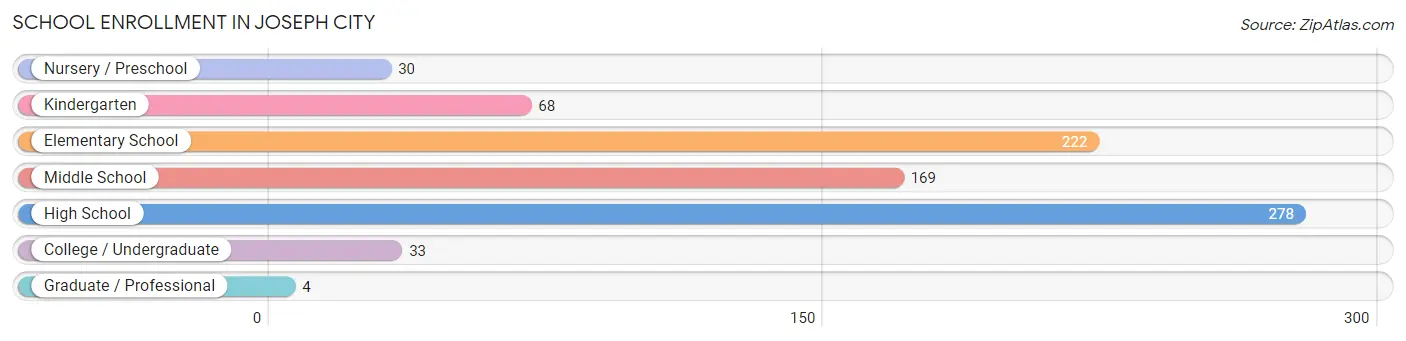
School Enrollment in Joseph City
The most common levels of schooling among the 804 students in Joseph City are high school (278 | 34.6%), elementary school (222 | 27.6%), and middle school (169 | 21.0%).
| School Level | # Students | % Students |
| Nursery / Preschool | 30 | 3.7% |
| Kindergarten | 68 | 8.5% |
| Elementary School | 222 | 27.6% |
| Middle School | 169 | 21.0% |
| High School | 278 | 34.6% |
| College / Undergraduate | 33 | 4.1% |
| Graduate / Professional | 4 | 0.5% |
| Total | 804 | 100.0% |
School Enrollment by Age by Funding Source in Joseph City
Out of a total of 804 students who are enrolled in schools in Joseph City, 94 (11.7%) attend a private institution, while the remaining 710 (88.3%) are enrolled in public schools. The age group of 15 to 17 year olds has the highest likelihood of being enrolled in private schools, with 55 (25.1% in the age bracket) enrolled. Conversely, the age group of 3 to 4 year olds has the lowest likelihood of being enrolled in a private school, with 21 (100.0% in the age bracket) attending a public institution.
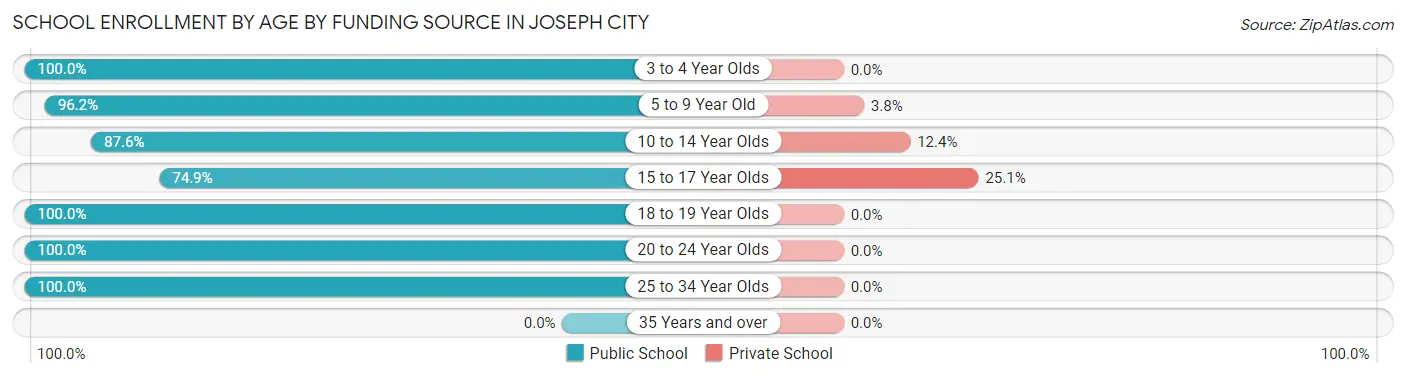
| Age Bracket | Public School | Private School |
| 3 to 4 Year Olds | 21 (100.0%) | 0 (0.0%) |
| 5 to 9 Year Old | 230 (96.2%) | 9 (3.8%) |
| 10 to 14 Year Olds | 212 (87.6%) | 30 (12.4%) |
| 15 to 17 Year Olds | 164 (74.9%) | 55 (25.1%) |
| 18 to 19 Year Olds | 45 (100.0%) | 0 (0.0%) |
| 20 to 24 Year Olds | 26 (100.0%) | 0 (0.0%) |
| 25 to 34 Year Olds | 12 (100.0%) | 0 (0.0%) |
| 35 Years and over | 0 (0.0%) | 0 (0.0%) |
| Total | 710 (88.3%) | 94 (11.7%) |
Educational Attainment by Field of Study in Joseph City
Education (83 | 54.2%), computers & mathematics (20 | 13.1%), business (16 | 10.5%), engineering (12 | 7.8%), and arts & humanities (12 | 7.8%) are the most common fields of study among 153 individuals in Joseph City who have obtained a bachelor's degree or higher.
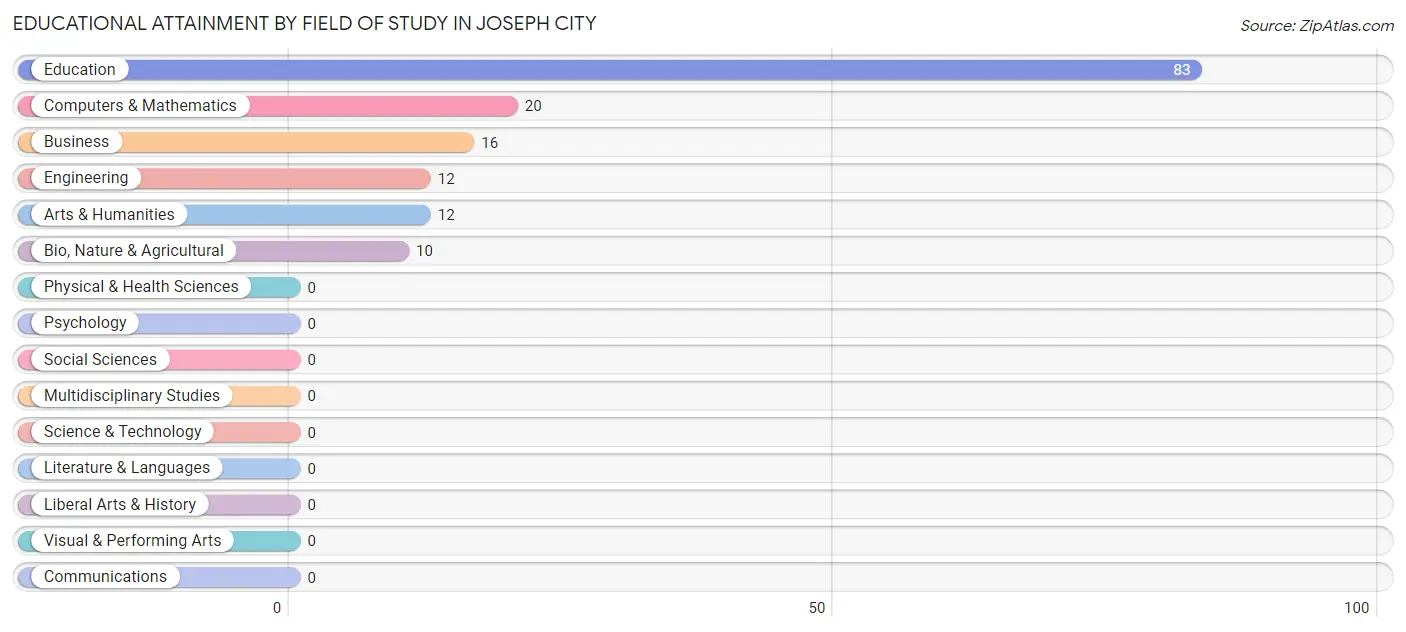
| Field of Study | # Graduates | % Graduates |
| Computers & Mathematics | 20 | 13.1% |
| Bio, Nature & Agricultural | 10 | 6.5% |
| Physical & Health Sciences | 0 | 0.0% |
| Psychology | 0 | 0.0% |
| Social Sciences | 0 | 0.0% |
| Engineering | 12 | 7.8% |
| Multidisciplinary Studies | 0 | 0.0% |
| Science & Technology | 0 | 0.0% |
| Business | 16 | 10.5% |
| Education | 83 | 54.2% |
| Literature & Languages | 0 | 0.0% |
| Liberal Arts & History | 0 | 0.0% |
| Visual & Performing Arts | 0 | 0.0% |
| Communications | 0 | 0.0% |
| Arts & Humanities | 12 | 7.8% |
| Total | 153 | 100.0% |
Transportation & Commute in Joseph City
Vehicle Availability by Sex in Joseph City
The most prevalent vehicle ownership categories in Joseph City are males with 2 vehicles (109, accounting for 30.3%) and females with 2 vehicles (141, making up 29.8%).
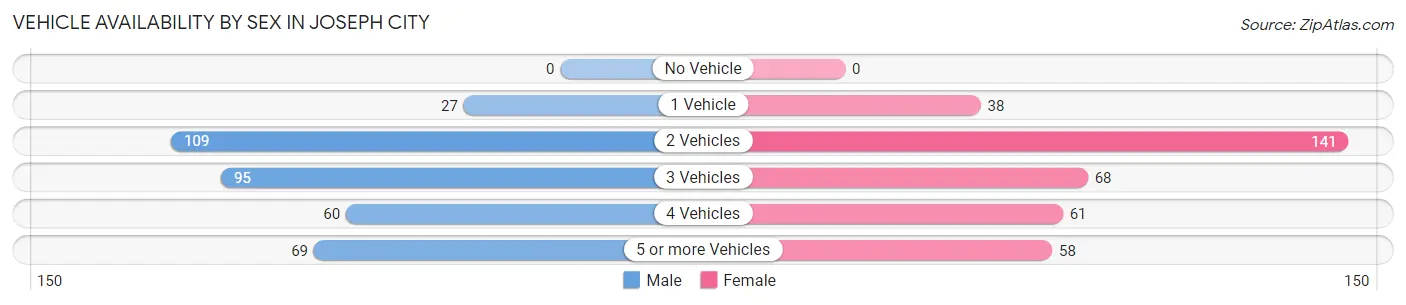
| Vehicles Available | Male | Female |
| No Vehicle | 0 (0.0%) | 0 (0.0%) |
| 1 Vehicle | 27 (7.5%) | 38 (10.4%) |
| 2 Vehicles | 109 (30.3%) | 141 (38.5%) |
| 3 Vehicles | 95 (26.4%) | 68 (18.6%) |
| 4 Vehicles | 60 (16.7%) | 61 (16.7%) |
| 5 or more Vehicles | 69 (19.2%) | 58 (15.9%) |
| Total | 360 (100.0%) | 366 (100.0%) |
Commute Time in Joseph City
The most frequently occuring commute durations in Joseph City are 5 to 9 minutes (196 commuters, 27.4%), 20 to 24 minutes (112 commuters, 15.7%), and 15 to 19 minutes (98 commuters, 13.7%).
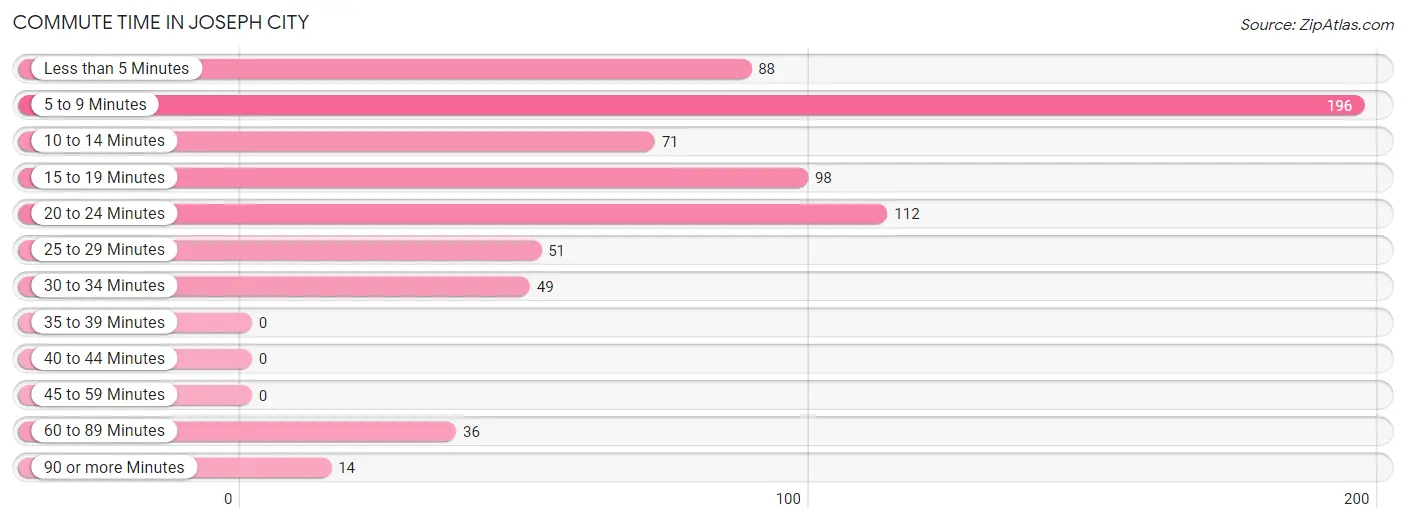
| Commute Time | # Commuters | % Commuters |
| Less than 5 Minutes | 88 | 12.3% |
| 5 to 9 Minutes | 196 | 27.4% |
| 10 to 14 Minutes | 71 | 9.9% |
| 15 to 19 Minutes | 98 | 13.7% |
| 20 to 24 Minutes | 112 | 15.7% |
| 25 to 29 Minutes | 51 | 7.1% |
| 30 to 34 Minutes | 49 | 6.9% |
| 35 to 39 Minutes | 0 | 0.0% |
| 40 to 44 Minutes | 0 | 0.0% |
| 45 to 59 Minutes | 0 | 0.0% |
| 60 to 89 Minutes | 36 | 5.0% |
| 90 or more Minutes | 14 | 2.0% |
Commute Time by Sex in Joseph City
The most common commute times in Joseph City are 5 to 9 minutes (91 commuters, 26.1%) for males and 5 to 9 minutes (105 commuters, 28.7%) for females.
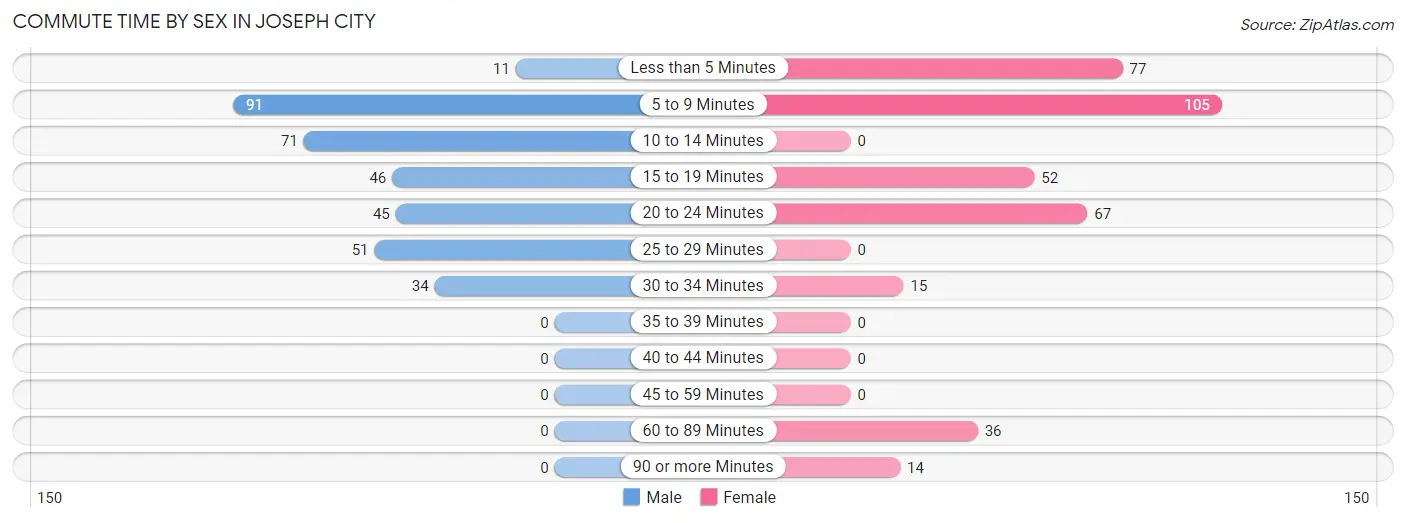
| Commute Time | Male | Female |
| Less than 5 Minutes | 11 (3.2%) | 77 (21.0%) |
| 5 to 9 Minutes | 91 (26.1%) | 105 (28.7%) |
| 10 to 14 Minutes | 71 (20.3%) | 0 (0.0%) |
| 15 to 19 Minutes | 46 (13.2%) | 52 (14.2%) |
| 20 to 24 Minutes | 45 (12.9%) | 67 (18.3%) |
| 25 to 29 Minutes | 51 (14.6%) | 0 (0.0%) |
| 30 to 34 Minutes | 34 (9.7%) | 15 (4.1%) |
| 35 to 39 Minutes | 0 (0.0%) | 0 (0.0%) |
| 40 to 44 Minutes | 0 (0.0%) | 0 (0.0%) |
| 45 to 59 Minutes | 0 (0.0%) | 0 (0.0%) |
| 60 to 89 Minutes | 0 (0.0%) | 36 (9.8%) |
| 90 or more Minutes | 0 (0.0%) | 14 (3.8%) |
Time of Departure to Work by Sex in Joseph City
The most frequent times of departure to work in Joseph City are 5:30 AM to 5:59 AM (98, 28.1%) for males and 7:30 AM to 7:59 AM (68, 18.6%) for females.
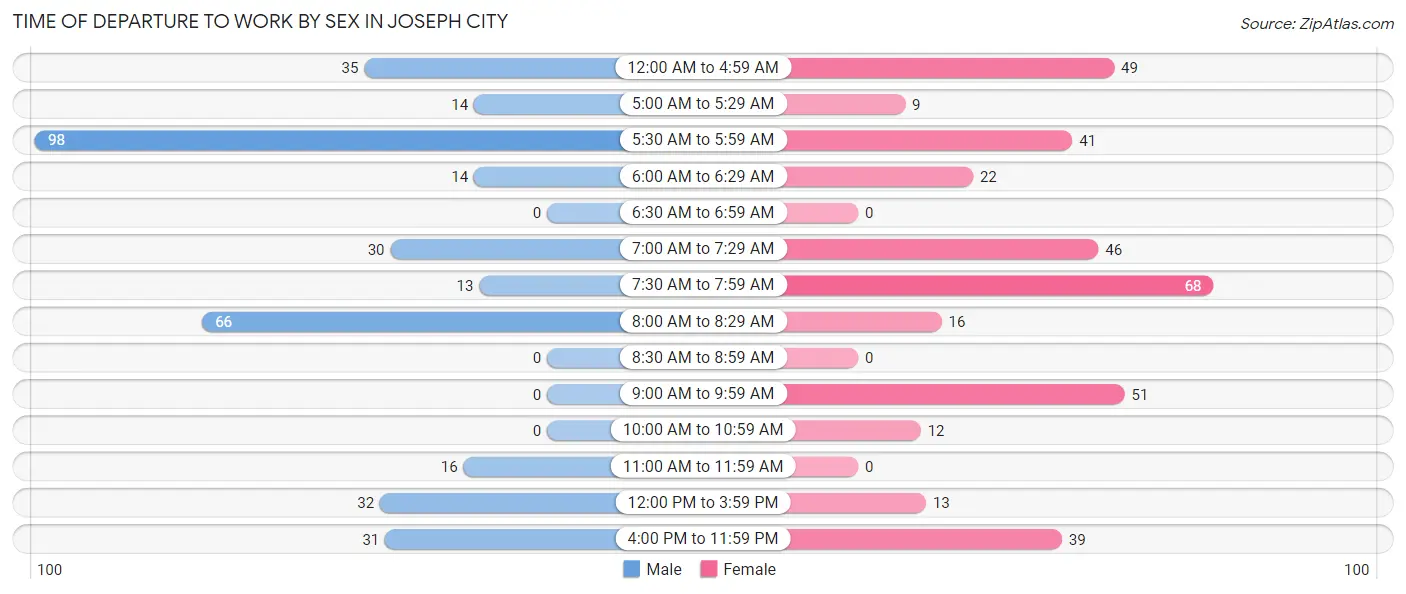
| Time of Departure | Male | Female |
| 12:00 AM to 4:59 AM | 35 (10.0%) | 49 (13.4%) |
| 5:00 AM to 5:29 AM | 14 (4.0%) | 9 (2.5%) |
| 5:30 AM to 5:59 AM | 98 (28.1%) | 41 (11.2%) |
| 6:00 AM to 6:29 AM | 14 (4.0%) | 22 (6.0%) |
| 6:30 AM to 6:59 AM | 0 (0.0%) | 0 (0.0%) |
| 7:00 AM to 7:29 AM | 30 (8.6%) | 46 (12.6%) |
| 7:30 AM to 7:59 AM | 13 (3.7%) | 68 (18.6%) |
| 8:00 AM to 8:29 AM | 66 (18.9%) | 16 (4.4%) |
| 8:30 AM to 8:59 AM | 0 (0.0%) | 0 (0.0%) |
| 9:00 AM to 9:59 AM | 0 (0.0%) | 51 (13.9%) |
| 10:00 AM to 10:59 AM | 0 (0.0%) | 12 (3.3%) |
| 11:00 AM to 11:59 AM | 16 (4.6%) | 0 (0.0%) |
| 12:00 PM to 3:59 PM | 32 (9.2%) | 13 (3.5%) |
| 4:00 PM to 11:59 PM | 31 (8.9%) | 39 (10.7%) |
| Total | 349 (100.0%) | 366 (100.0%) |
Housing Occupancy in Joseph City
Occupancy by Ownership in Joseph City
Of the total 570 dwellings in Joseph City, owner-occupied units account for 400 (70.2%), while renter-occupied units make up 170 (29.8%).
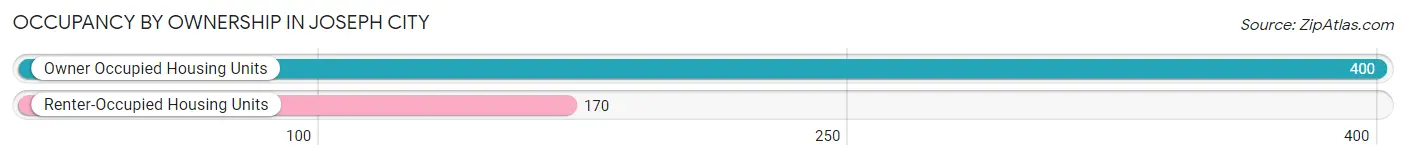
| Occupancy | # Housing Units | % Housing Units |
| Owner Occupied Housing Units | 400 | 70.2% |
| Renter-Occupied Housing Units | 170 | 29.8% |
| Total Occupied Housing Units | 570 | 100.0% |
Occupancy by Household Size in Joseph City
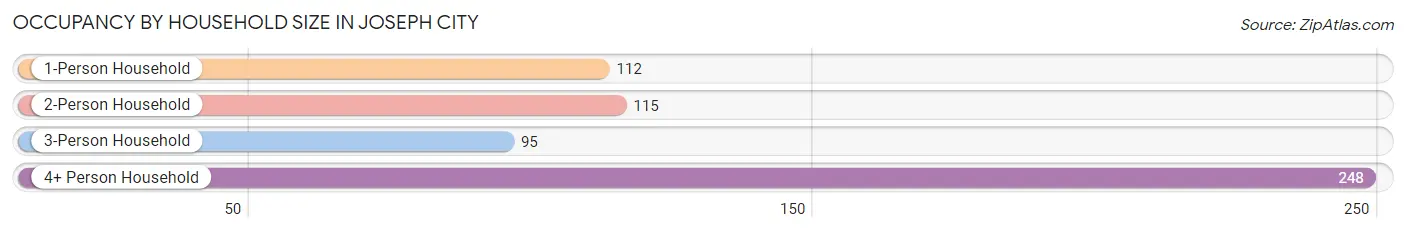
| Household Size | # Housing Units | % Housing Units |
| 1-Person Household | 112 | 19.7% |
| 2-Person Household | 115 | 20.2% |
| 3-Person Household | 95 | 16.7% |
| 4+ Person Household | 248 | 43.5% |
| Total Housing Units | 570 | 100.0% |
Occupancy by Ownership by Household Size in Joseph City
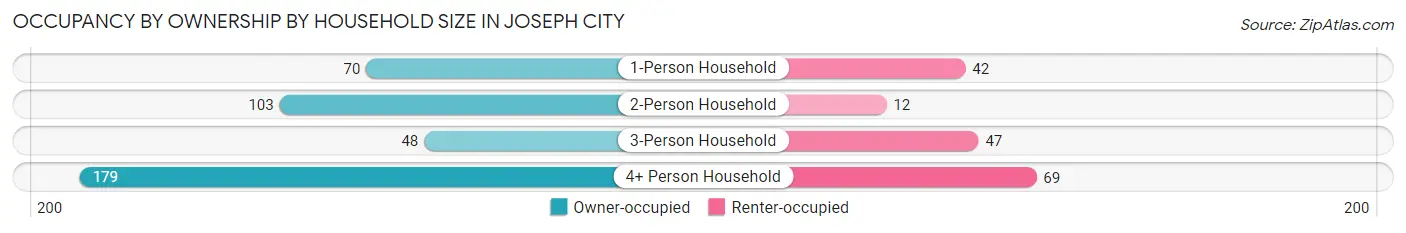
| Household Size | Owner-occupied | Renter-occupied |
| 1-Person Household | 70 (62.5%) | 42 (37.5%) |
| 2-Person Household | 103 (89.6%) | 12 (10.4%) |
| 3-Person Household | 48 (50.5%) | 47 (49.5%) |
| 4+ Person Household | 179 (72.2%) | 69 (27.8%) |
| Total Housing Units | 400 (70.2%) | 170 (29.8%) |
Occupancy by Educational Attainment in Joseph City
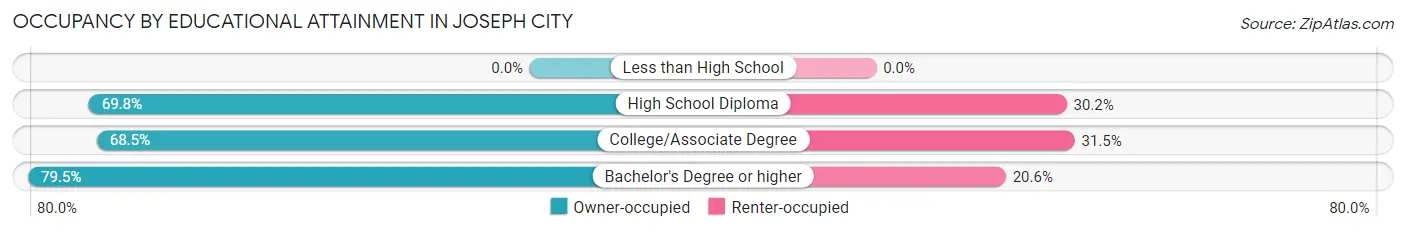
| Household Size | Owner-occupied | Renter-occupied |
| Less than High School | 0 (0.0%) | 0 (0.0%) |
| High School Diploma | 74 (69.8%) | 32 (30.2%) |
| College/Associate Degree | 268 (68.5%) | 123 (31.5%) |
| Bachelor's Degree or higher | 58 (79.4%) | 15 (20.5%) |
Occupancy by Age of Householder in Joseph City
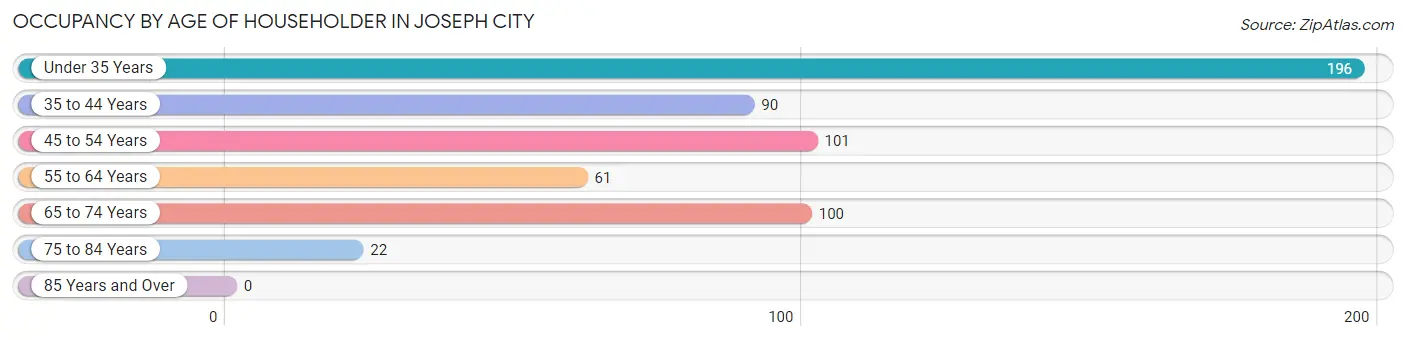
| Age Bracket | # Households | % Households |
| Under 35 Years | 196 | 34.4% |
| 35 to 44 Years | 90 | 15.8% |
| 45 to 54 Years | 101 | 17.7% |
| 55 to 64 Years | 61 | 10.7% |
| 65 to 74 Years | 100 | 17.5% |
| 75 to 84 Years | 22 | 3.9% |
| 85 Years and Over | 0 | 0.0% |
| Total | 570 | 100.0% |
Housing Finances in Joseph City
Median Income by Occupancy in Joseph City
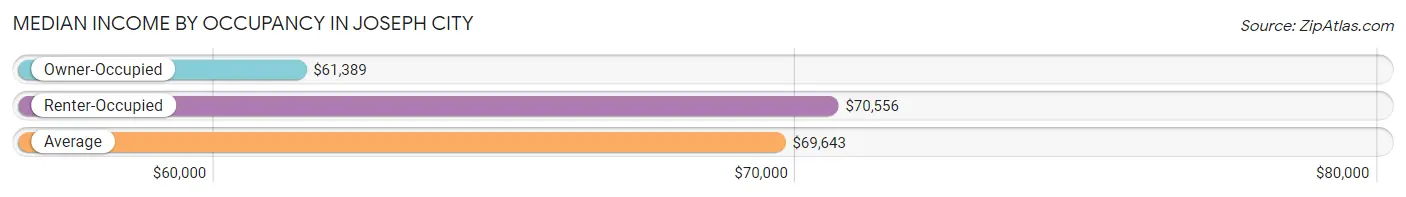
| Occupancy Type | # Households | Median Income |
| Owner-Occupied | 400 (70.2%) | $61,389 |
| Renter-Occupied | 170 (29.8%) | $70,556 |
| Average | 570 (100.0%) | $69,643 |
Occupancy by Householder Income Bracket in Joseph City
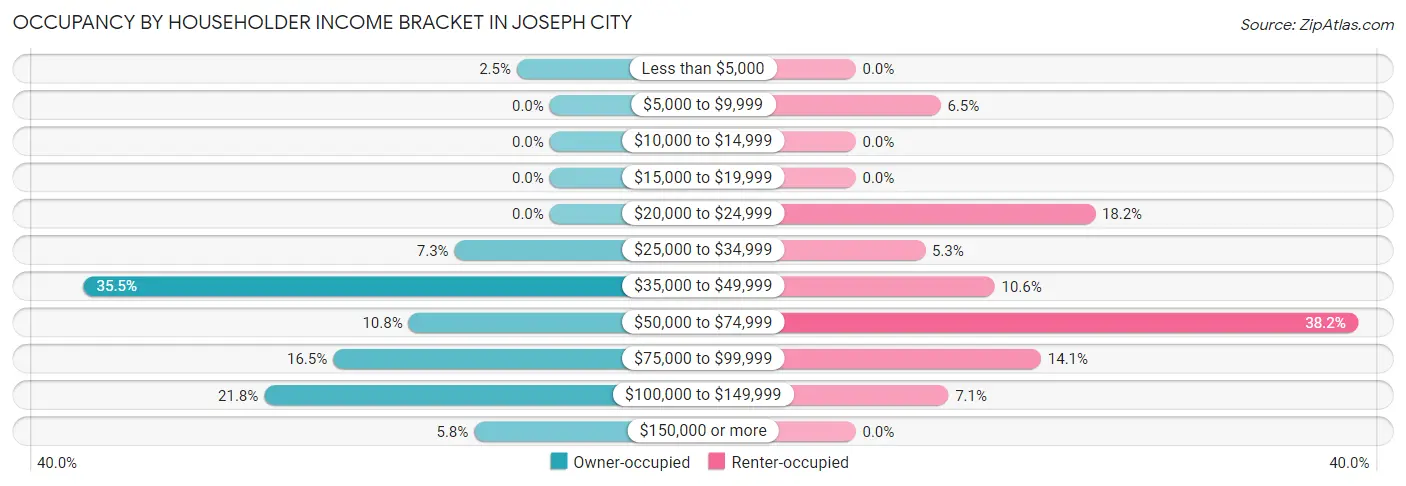
| Income Bracket | Owner-occupied | Renter-occupied |
| Less than $5,000 | 10 (2.5%) | 0 (0.0%) |
| $5,000 to $9,999 | 0 (0.0%) | 11 (6.5%) |
| $10,000 to $14,999 | 0 (0.0%) | 0 (0.0%) |
| $15,000 to $19,999 | 0 (0.0%) | 0 (0.0%) |
| $20,000 to $24,999 | 0 (0.0%) | 31 (18.2%) |
| $25,000 to $34,999 | 29 (7.2%) | 9 (5.3%) |
| $35,000 to $49,999 | 142 (35.5%) | 18 (10.6%) |
| $50,000 to $74,999 | 43 (10.7%) | 65 (38.2%) |
| $75,000 to $99,999 | 66 (16.5%) | 24 (14.1%) |
| $100,000 to $149,999 | 87 (21.7%) | 12 (7.1%) |
| $150,000 or more | 23 (5.8%) | 0 (0.0%) |
| Total | 400 (100.0%) | 170 (100.0%) |
Monthly Housing Cost Tiers in Joseph City
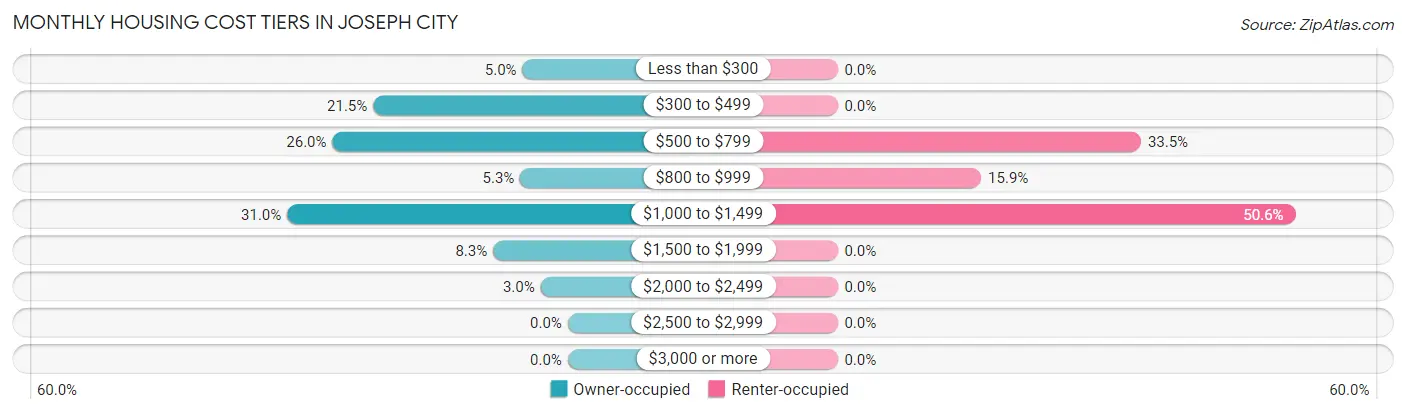
| Monthly Cost | Owner-occupied | Renter-occupied |
| Less than $300 | 20 (5.0%) | 0 (0.0%) |
| $300 to $499 | 86 (21.5%) | 0 (0.0%) |
| $500 to $799 | 104 (26.0%) | 57 (33.5%) |
| $800 to $999 | 21 (5.2%) | 27 (15.9%) |
| $1,000 to $1,499 | 124 (31.0%) | 86 (50.6%) |
| $1,500 to $1,999 | 33 (8.3%) | 0 (0.0%) |
| $2,000 to $2,499 | 12 (3.0%) | 0 (0.0%) |
| $2,500 to $2,999 | 0 (0.0%) | 0 (0.0%) |
| $3,000 or more | 0 (0.0%) | 0 (0.0%) |
| Total | 400 (100.0%) | 170 (100.0%) |
Physical Housing Characteristics in Joseph City
Housing Structures in Joseph City
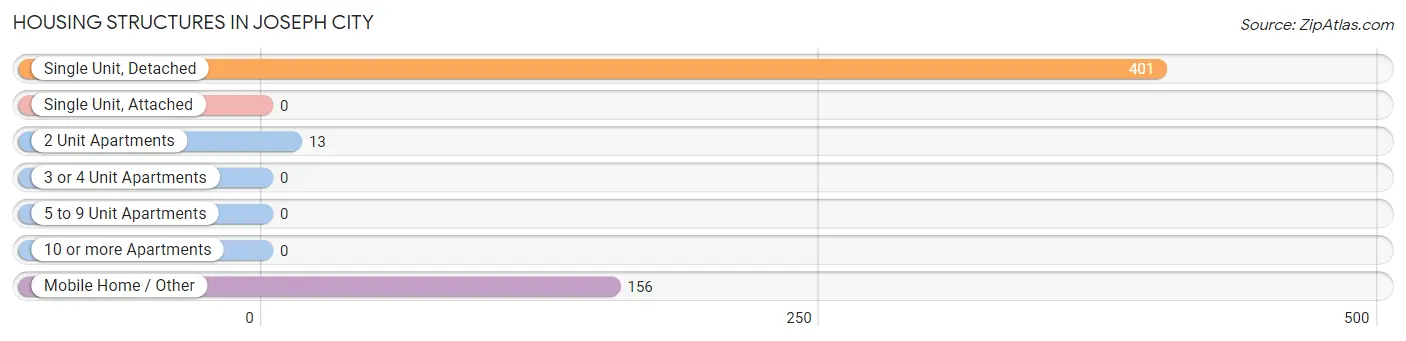
| Structure Type | # Housing Units | % Housing Units |
| Single Unit, Detached | 401 | 70.4% |
| Single Unit, Attached | 0 | 0.0% |
| 2 Unit Apartments | 13 | 2.3% |
| 3 or 4 Unit Apartments | 0 | 0.0% |
| 5 to 9 Unit Apartments | 0 | 0.0% |
| 10 or more Apartments | 0 | 0.0% |
| Mobile Home / Other | 156 | 27.4% |
| Total | 570 | 100.0% |
Housing Structures by Occupancy in Joseph City
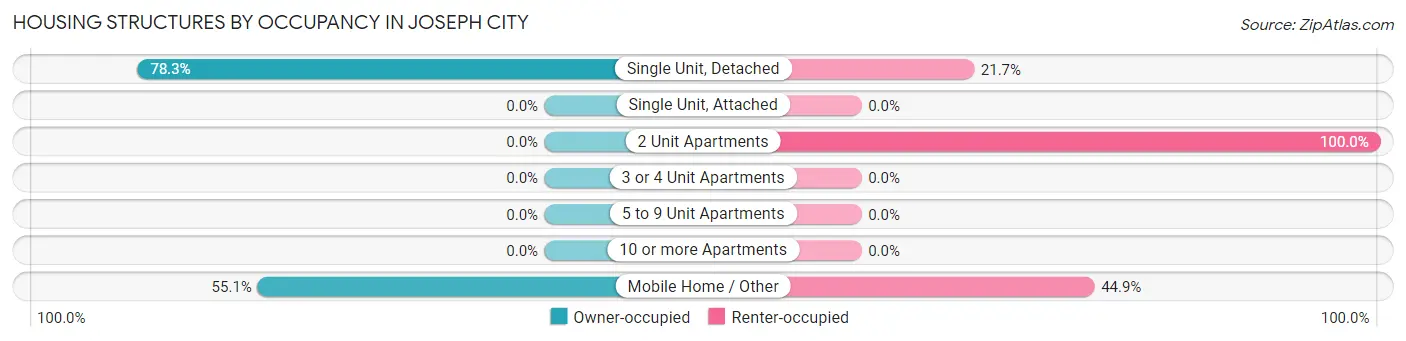
| Structure Type | Owner-occupied | Renter-occupied |
| Single Unit, Detached | 314 (78.3%) | 87 (21.7%) |
| Single Unit, Attached | 0 (0.0%) | 0 (0.0%) |
| 2 Unit Apartments | 0 (0.0%) | 13 (100.0%) |
| 3 or 4 Unit Apartments | 0 (0.0%) | 0 (0.0%) |
| 5 to 9 Unit Apartments | 0 (0.0%) | 0 (0.0%) |
| 10 or more Apartments | 0 (0.0%) | 0 (0.0%) |
| Mobile Home / Other | 86 (55.1%) | 70 (44.9%) |
| Total | 400 (70.2%) | 170 (29.8%) |
Housing Structures by Number of Rooms in Joseph City
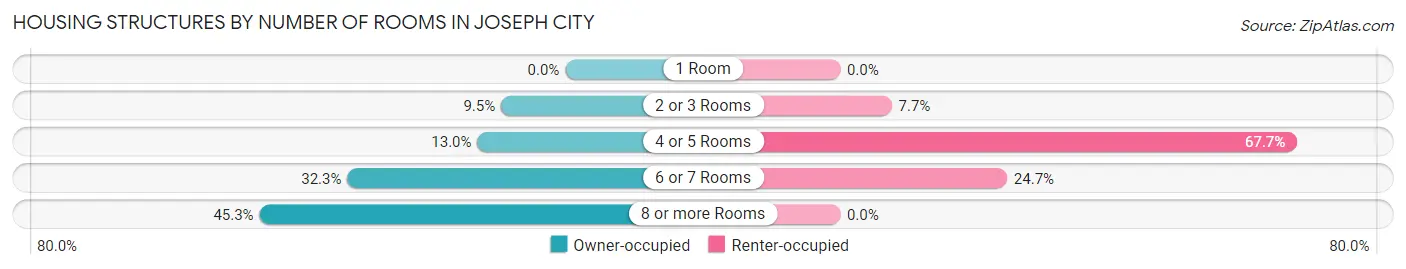
| Number of Rooms | Owner-occupied | Renter-occupied |
| 1 Room | 0 (0.0%) | 0 (0.0%) |
| 2 or 3 Rooms | 38 (9.5%) | 13 (7.6%) |
| 4 or 5 Rooms | 52 (13.0%) | 115 (67.6%) |
| 6 or 7 Rooms | 129 (32.3%) | 42 (24.7%) |
| 8 or more Rooms | 181 (45.3%) | 0 (0.0%) |
| Total | 400 (100.0%) | 170 (100.0%) |
Housing Structure by Heating Type in Joseph City
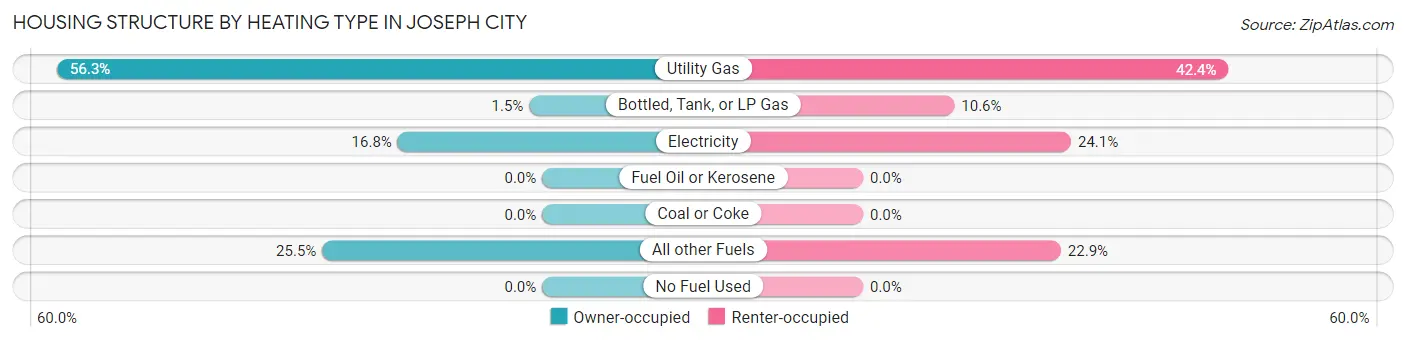
| Heating Type | Owner-occupied | Renter-occupied |
| Utility Gas | 225 (56.2%) | 72 (42.3%) |
| Bottled, Tank, or LP Gas | 6 (1.5%) | 18 (10.6%) |
| Electricity | 67 (16.8%) | 41 (24.1%) |
| Fuel Oil or Kerosene | 0 (0.0%) | 0 (0.0%) |
| Coal or Coke | 0 (0.0%) | 0 (0.0%) |
| All other Fuels | 102 (25.5%) | 39 (22.9%) |
| No Fuel Used | 0 (0.0%) | 0 (0.0%) |
| Total | 400 (100.0%) | 170 (100.0%) |
Household Vehicle Usage in Joseph City
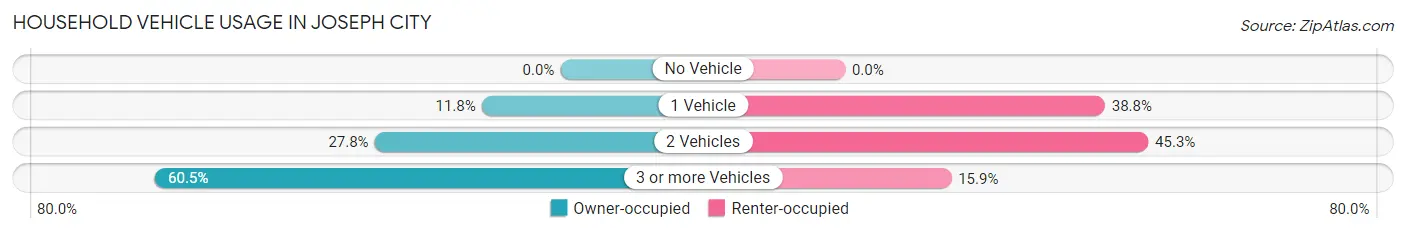
| Vehicles per Household | Owner-occupied | Renter-occupied |
| No Vehicle | 0 (0.0%) | 0 (0.0%) |
| 1 Vehicle | 47 (11.7%) | 66 (38.8%) |
| 2 Vehicles | 111 (27.8%) | 77 (45.3%) |
| 3 or more Vehicles | 242 (60.5%) | 27 (15.9%) |
| Total | 400 (100.0%) | 170 (100.0%) |
Real Estate & Mortgages in Joseph City
Real Estate and Mortgage Overview in Joseph City
| Characteristic | Without Mortgage | With Mortgage |
| Housing Units | 171 | 229 |
| Median Property Value | $124,000 | $157,100 |
| Median Household Income | $46,875 | $23 |
| Monthly Housing Costs | $438 | $0 |
| Real Estate Taxes | $889 | $20 |
Property Value by Mortgage Status in Joseph City
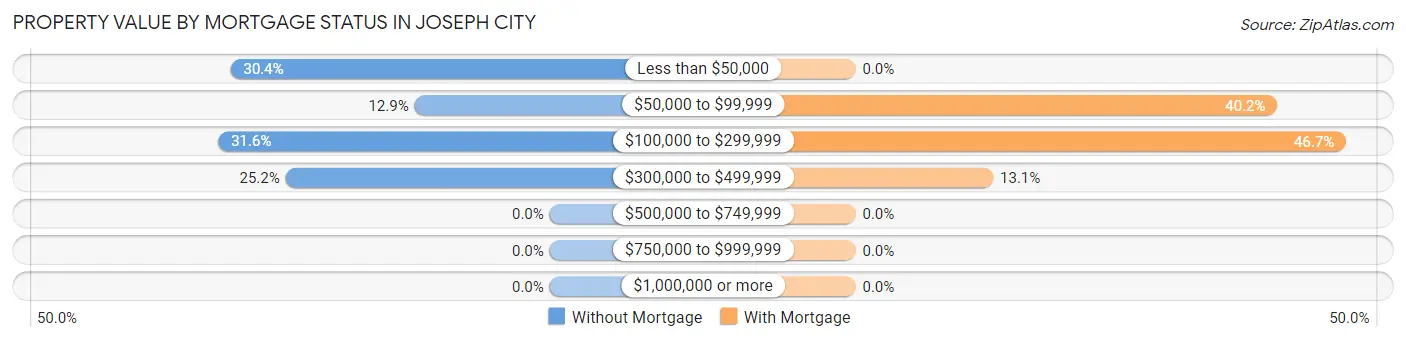
| Property Value | Without Mortgage | With Mortgage |
| Less than $50,000 | 52 (30.4%) | 0 (0.0%) |
| $50,000 to $99,999 | 22 (12.9%) | 92 (40.2%) |
| $100,000 to $299,999 | 54 (31.6%) | 107 (46.7%) |
| $300,000 to $499,999 | 43 (25.2%) | 30 (13.1%) |
| $500,000 to $749,999 | 0 (0.0%) | 0 (0.0%) |
| $750,000 to $999,999 | 0 (0.0%) | 0 (0.0%) |
| $1,000,000 or more | 0 (0.0%) | 0 (0.0%) |
| Total | 171 (100.0%) | 229 (100.0%) |
Household Income by Mortgage Status in Joseph City
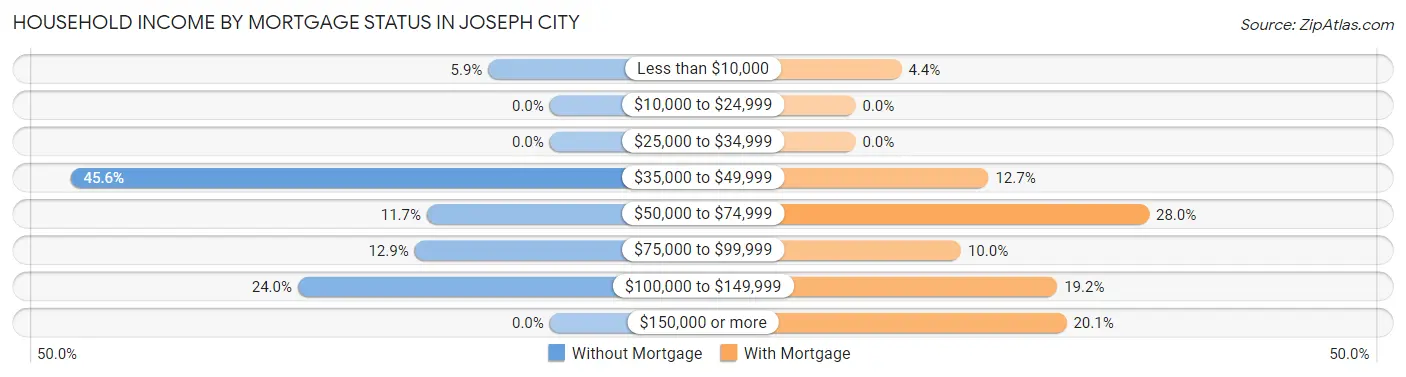
| Household Income | Without Mortgage | With Mortgage |
| Less than $10,000 | 10 (5.9%) | 10 (4.4%) |
| $10,000 to $24,999 | 0 (0.0%) | 0 (0.0%) |
| $25,000 to $34,999 | 0 (0.0%) | 0 (0.0%) |
| $35,000 to $49,999 | 78 (45.6%) | 29 (12.7%) |
| $50,000 to $74,999 | 20 (11.7%) | 64 (28.0%) |
| $75,000 to $99,999 | 22 (12.9%) | 23 (10.0%) |
| $100,000 to $149,999 | 41 (24.0%) | 44 (19.2%) |
| $150,000 or more | 0 (0.0%) | 46 (20.1%) |
| Total | 171 (100.0%) | 229 (100.0%) |
Property Value to Household Income Ratio in Joseph City
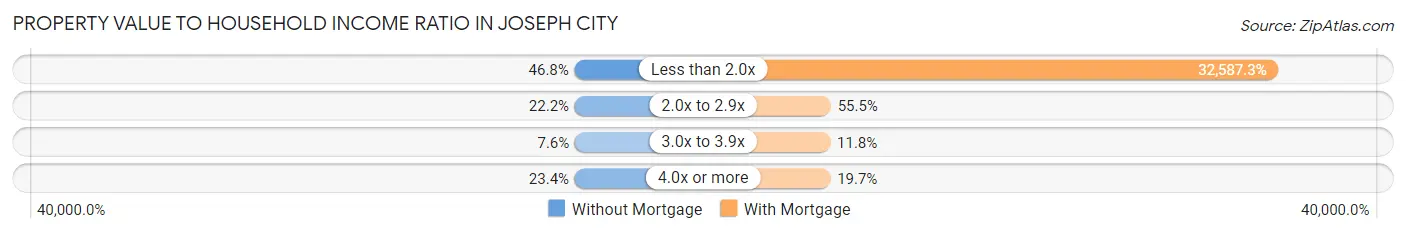
| Value-to-Income Ratio | Without Mortgage | With Mortgage |
| Less than 2.0x | 80 (46.8%) | 74,625 (32,587.3%) |
| 2.0x to 2.9x | 38 (22.2%) | 127 (55.5%) |
| 3.0x to 3.9x | 13 (7.6%) | 27 (11.8%) |
| 4.0x or more | 40 (23.4%) | 45 (19.7%) |
| Total | 171 (100.0%) | 229 (100.0%) |
Real Estate Taxes by Mortgage Status in Joseph City
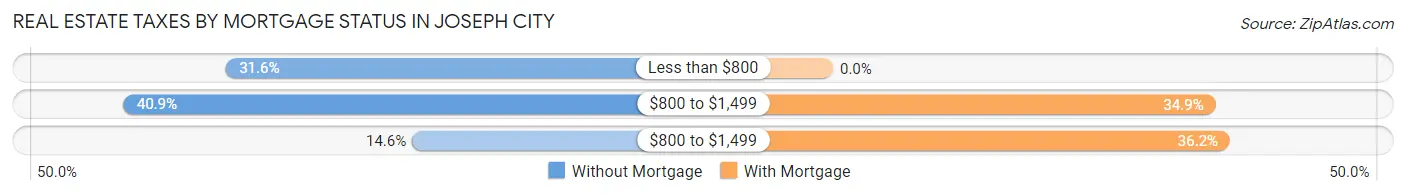
| Property Taxes | Without Mortgage | With Mortgage |
| Less than $800 | 54 (31.6%) | 0 (0.0%) |
| $800 to $1,499 | 70 (40.9%) | 80 (34.9%) |
| $800 to $1,499 | 25 (14.6%) | 83 (36.2%) |
| Total | 171 (100.0%) | 229 (100.0%) |
Health & Disability in Joseph City
Health Insurance Coverage by Age in Joseph City
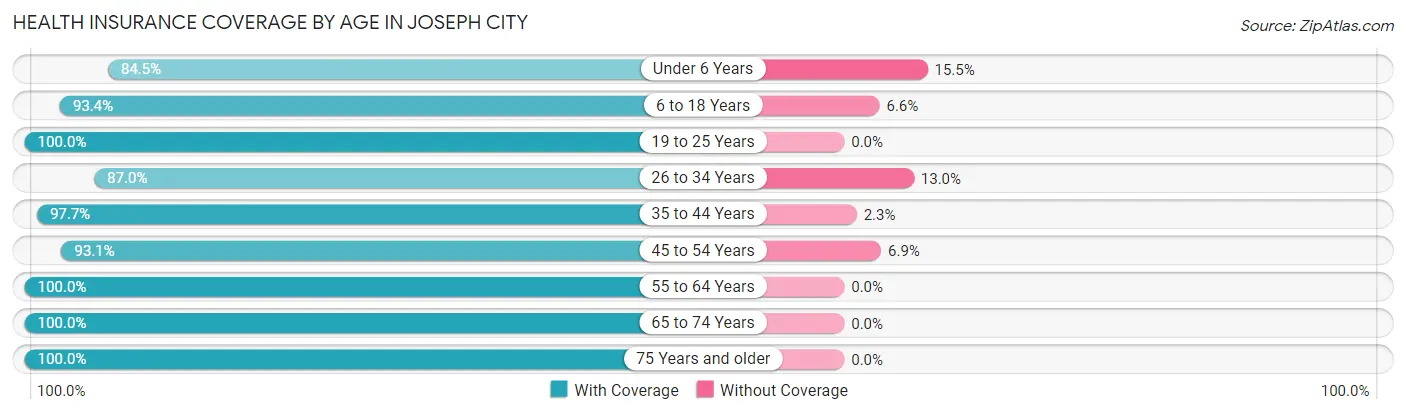
| Age Bracket | With Coverage | Without Coverage |
| Under 6 Years | 234 (84.5%) | 43 (15.5%) |
| 6 to 18 Years | 640 (93.4%) | 45 (6.6%) |
| 19 to 25 Years | 171 (100.0%) | 0 (0.0%) |
| 26 to 34 Years | 208 (87.0%) | 31 (13.0%) |
| 35 to 44 Years | 211 (97.7%) | 5 (2.3%) |
| 45 to 54 Years | 163 (93.1%) | 12 (6.9%) |
| 55 to 64 Years | 99 (100.0%) | 0 (0.0%) |
| 65 to 74 Years | 152 (100.0%) | 0 (0.0%) |
| 75 Years and older | 44 (100.0%) | 0 (0.0%) |
| Total | 1,922 (93.4%) | 136 (6.6%) |
Health Insurance Coverage by Citizenship Status in Joseph City
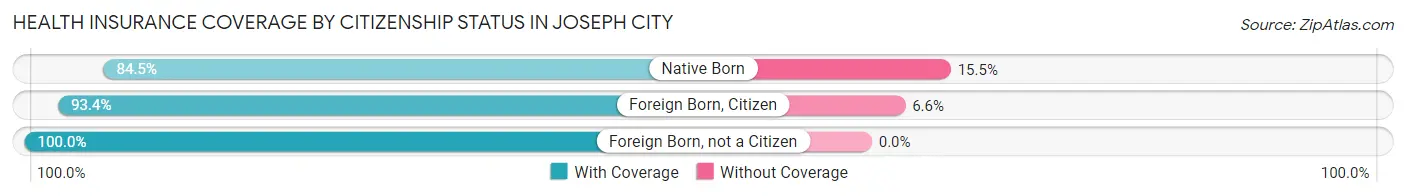
| Citizenship Status | With Coverage | Without Coverage |
| Native Born | 234 (84.5%) | 43 (15.5%) |
| Foreign Born, Citizen | 640 (93.4%) | 45 (6.6%) |
| Foreign Born, not a Citizen | 171 (100.0%) | 0 (0.0%) |
Health Insurance Coverage by Household Income in Joseph City
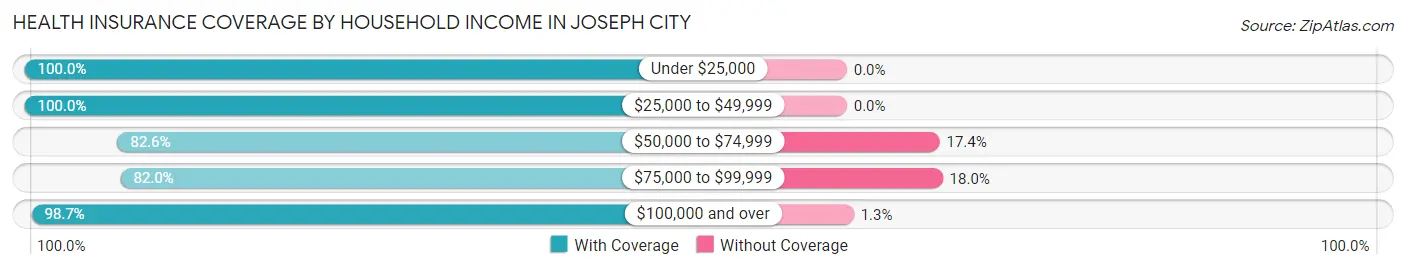
| Household Income | With Coverage | Without Coverage |
| Under $25,000 | 183 (100.0%) | 0 (0.0%) |
| $25,000 to $49,999 | 531 (100.0%) | 0 (0.0%) |
| $50,000 to $74,999 | 290 (82.6%) | 61 (17.4%) |
| $75,000 to $99,999 | 306 (82.0%) | 67 (18.0%) |
| $100,000 and over | 612 (98.7%) | 8 (1.3%) |
Public vs Private Health Insurance Coverage by Age in Joseph City
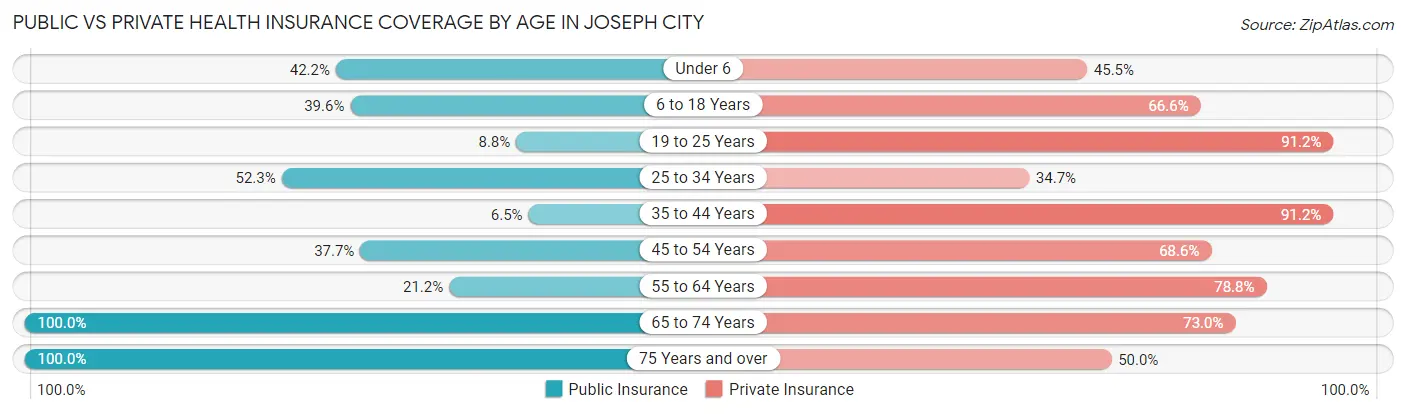
| Age Bracket | Public Insurance | Private Insurance |
| Under 6 | 117 (42.2%) | 126 (45.5%) |
| 6 to 18 Years | 271 (39.6%) | 456 (66.6%) |
| 19 to 25 Years | 15 (8.8%) | 156 (91.2%) |
| 25 to 34 Years | 125 (52.3%) | 83 (34.7%) |
| 35 to 44 Years | 14 (6.5%) | 197 (91.2%) |
| 45 to 54 Years | 66 (37.7%) | 120 (68.6%) |
| 55 to 64 Years | 21 (21.2%) | 78 (78.8%) |
| 65 to 74 Years | 152 (100.0%) | 111 (73.0%) |
| 75 Years and over | 44 (100.0%) | 22 (50.0%) |
| Total | 825 (40.1%) | 1,349 (65.5%) |
Disability Status by Sex by Age in Joseph City
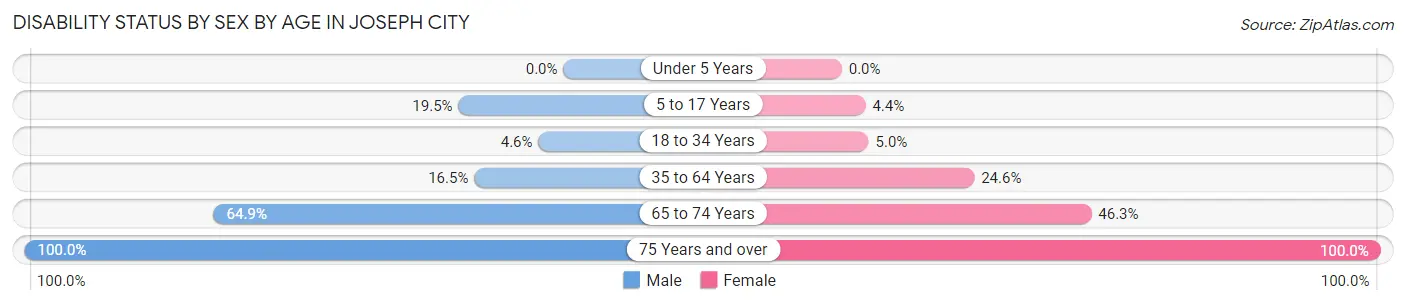
| Age Bracket | Male | Female |
| Under 5 Years | 0 (0.0%) | 0 (0.0%) |
| 5 to 17 Years | 75 (19.5%) | 14 (4.4%) |
| 18 to 34 Years | 9 (4.6%) | 12 (5.0%) |
| 35 to 64 Years | 42 (16.5%) | 58 (24.6%) |
| 65 to 74 Years | 37 (64.9%) | 44 (46.3%) |
| 75 Years and over | 10 (100.0%) | 34 (100.0%) |
Disability Class by Sex by Age in Joseph City
Disability Class: Hearing Difficulty
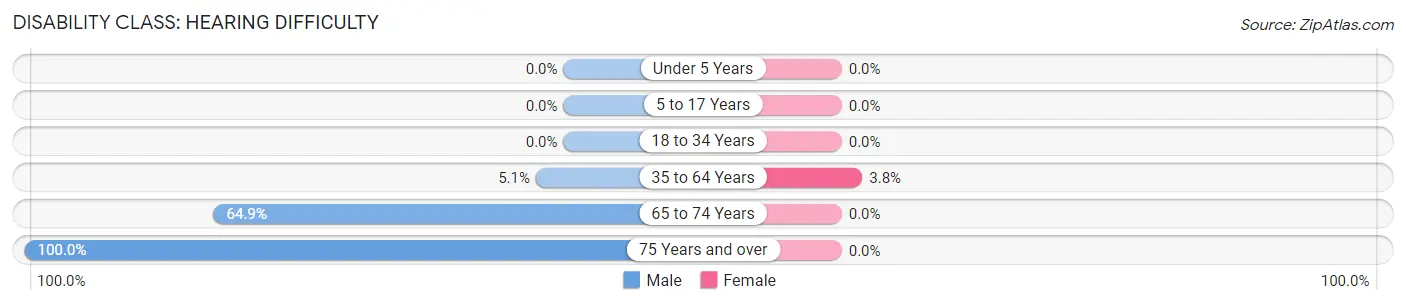
| Age Bracket | Male | Female |
| Under 5 Years | 0 (0.0%) | 0 (0.0%) |
| 5 to 17 Years | 0 (0.0%) | 0 (0.0%) |
| 18 to 34 Years | 0 (0.0%) | 0 (0.0%) |
| 35 to 64 Years | 13 (5.1%) | 9 (3.8%) |
| 65 to 74 Years | 37 (64.9%) | 0 (0.0%) |
| 75 Years and over | 10 (100.0%) | 0 (0.0%) |
Disability Class: Vision Difficulty
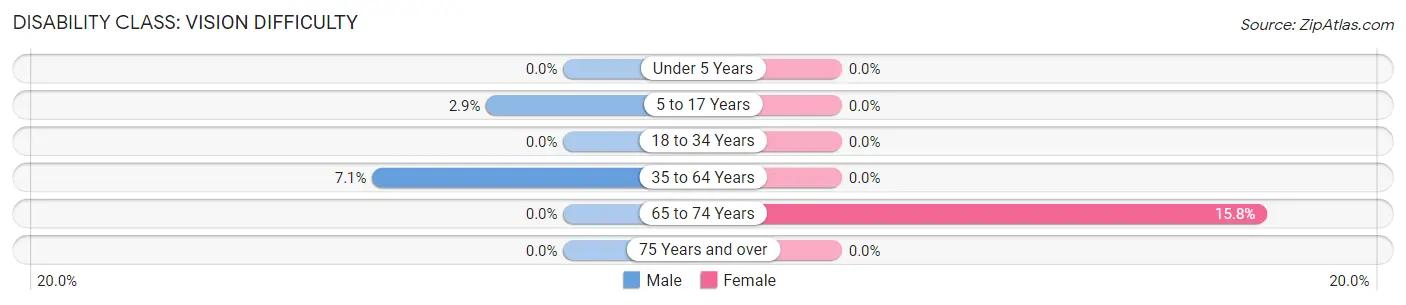
| Age Bracket | Male | Female |
| Under 5 Years | 0 (0.0%) | 0 (0.0%) |
| 5 to 17 Years | 11 (2.9%) | 0 (0.0%) |
| 18 to 34 Years | 0 (0.0%) | 0 (0.0%) |
| 35 to 64 Years | 18 (7.1%) | 0 (0.0%) |
| 65 to 74 Years | 0 (0.0%) | 15 (15.8%) |
| 75 Years and over | 0 (0.0%) | 0 (0.0%) |
Disability Class: Cognitive Difficulty
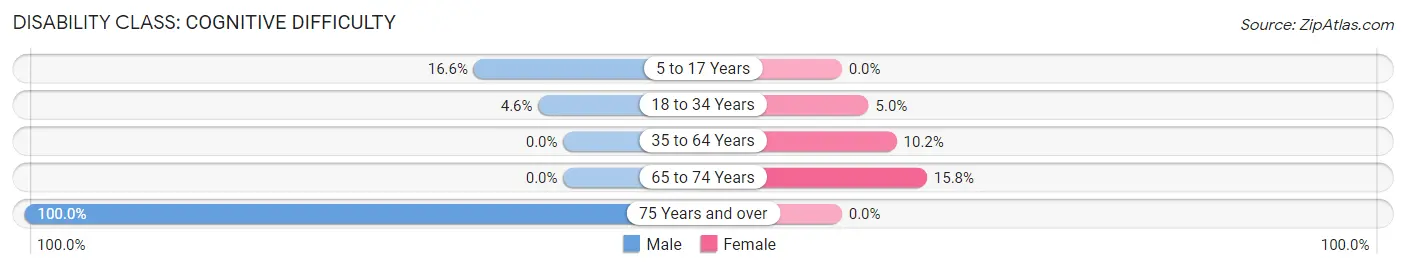
| Age Bracket | Male | Female |
| 5 to 17 Years | 64 (16.6%) | 0 (0.0%) |
| 18 to 34 Years | 9 (4.6%) | 12 (5.0%) |
| 35 to 64 Years | 0 (0.0%) | 24 (10.2%) |
| 65 to 74 Years | 0 (0.0%) | 15 (15.8%) |
| 75 Years and over | 10 (100.0%) | 0 (0.0%) |
Disability Class: Ambulatory Difficulty
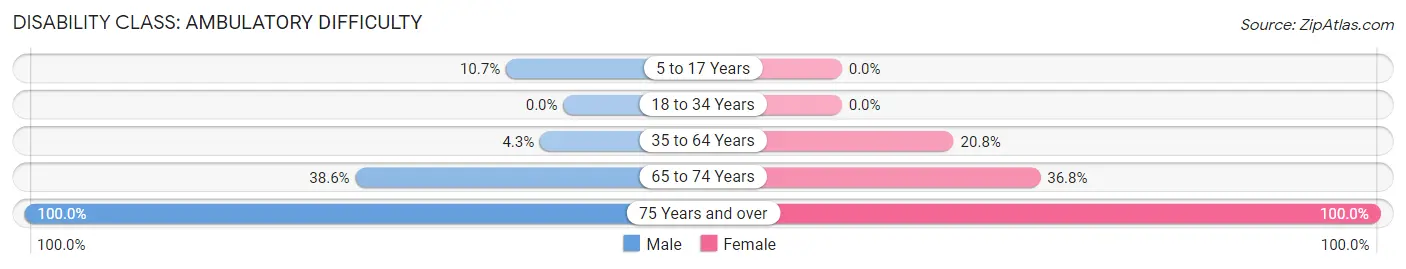
| Age Bracket | Male | Female |
| 5 to 17 Years | 41 (10.6%) | 0 (0.0%) |
| 18 to 34 Years | 0 (0.0%) | 0 (0.0%) |
| 35 to 64 Years | 11 (4.3%) | 49 (20.8%) |
| 65 to 74 Years | 22 (38.6%) | 35 (36.8%) |
| 75 Years and over | 10 (100.0%) | 34 (100.0%) |
Disability Class: Self-Care Difficulty
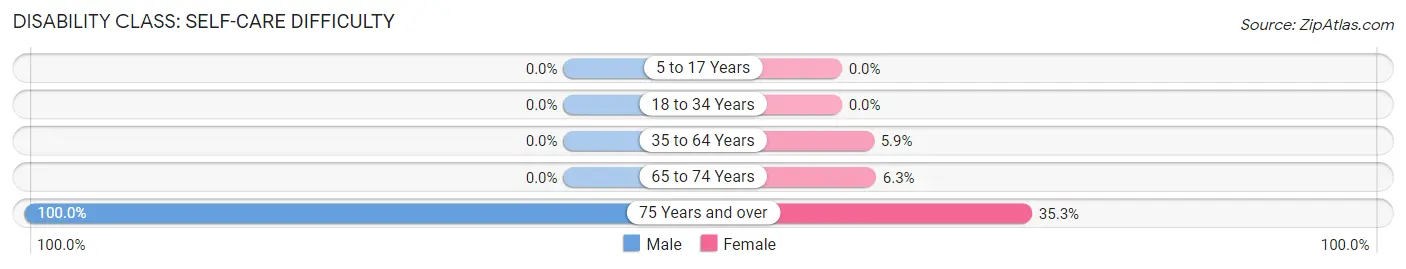
| Age Bracket | Male | Female |
| 5 to 17 Years | 0 (0.0%) | 0 (0.0%) |
| 18 to 34 Years | 0 (0.0%) | 0 (0.0%) |
| 35 to 64 Years | 0 (0.0%) | 14 (5.9%) |
| 65 to 74 Years | 0 (0.0%) | 6 (6.3%) |
| 75 Years and over | 10 (100.0%) | 12 (35.3%) |
Technology Access in Joseph City
Computing Device Access in Joseph City
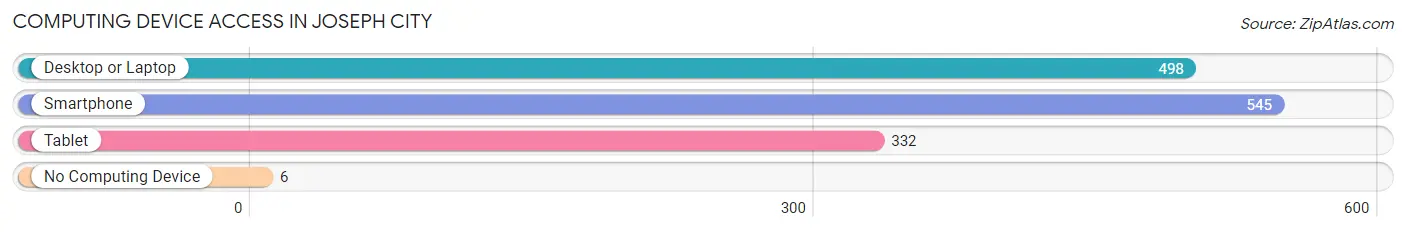
| Device Type | # Households | % Households |
| Desktop or Laptop | 498 | 87.4% |
| Smartphone | 545 | 95.6% |
| Tablet | 332 | 58.3% |
| No Computing Device | 6 | 1.1% |
| Total | 570 | 100.0% |
Internet Access in Joseph City
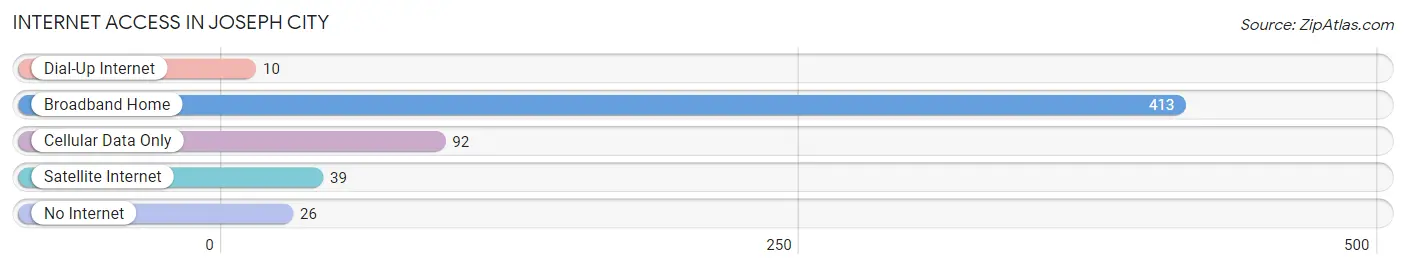
| Internet Type | # Households | % Households |
| Dial-Up Internet | 10 | 1.8% |
| Broadband Home | 413 | 72.5% |
| Cellular Data Only | 92 | 16.1% |
| Satellite Internet | 39 | 6.8% |
| No Internet | 26 | 4.6% |
| Total | 570 | 100.0% |
Joseph City Summary
St. Joseph City is a small city located in the state of Arizona. It is located in the northern part of the state, near the border with Utah. The city has a population of just over 1,000 people, making it one of the smallest cities in Arizona.
Geography
St. Joseph City is located in the northern part of Arizona, near the border with Utah. The city is situated in the high desert region of the state, with an elevation of 4,400 feet. The city is surrounded by the Kaibab National Forest, which provides a beautiful backdrop for the city. The city is located in Coconino County, and is about 30 miles from Flagstaff, the county seat.
The climate in St. Joseph City is semi-arid, with hot summers and cold winters. The average high temperature in the summer is around 90 degrees Fahrenheit, while the average low temperature in the winter is around 20 degrees Fahrenheit. The city receives an average of 8 inches of precipitation per year, with most of it falling in the winter months.
Economy
The economy of St. Joseph City is largely based on tourism. The city is home to several tourist attractions, including the Kaibab National Forest, the Grand Canyon, and the Petrified Forest National Park. The city also has several restaurants, hotels, and other businesses that cater to tourists.
In addition to tourism, the city also has a small manufacturing sector. The city is home to several small businesses that produce a variety of products, including furniture, clothing, and electronics.
Demographics
As of the 2010 census, the population of St. Joseph City was 1,037. The population is predominantly white, with about 85% of the population identifying as white. The remaining 15% of the population is made up of African Americans, Native Americans, Asians, and other races.
The median household income in St. Joseph City is $37,000, which is slightly lower than the national average. The median age of the population is 37, and the city has a higher than average rate of poverty.
Conclusion
St. Joseph City is a small city located in the northern part of Arizona. The city has a population of just over 1,000 people, and is largely dependent on tourism for its economy. The city is home to several tourist attractions, including the Kaibab National Forest, the Grand Canyon, and the Petrified Forest National Park. The population of St. Joseph City is predominantly white, with a median household income of $37,000 and a higher than average rate of poverty.
Common Questions
What is the Total Population of Joseph City?
Total Population of Joseph City is 2,058.
What is the Total Male Population of Joseph City?
Total Male Population of Joseph City is 1,061.
What is the Total Female Population of Joseph City?
Total Female Population of Joseph City is 997.
What is the Ratio of Males per 100 Females in Joseph City?
There are 106.42 Males per 100 Females in Joseph City.
What is the Ratio of Females per 100 Males in Joseph City?
There are 93.97 Females per 100 Males in Joseph City.
What is the Median Population Age in Joseph City?
Median Population Age in Joseph City is 21.5 Years.
What is the Average Family Size in Joseph City
Average Family Size in Joseph City is 4.2 People.
What is the Average Household Size in Joseph City
Average Household Size in Joseph City is 3.6 People.
What is Per Capita Income in Joseph City?
Per Capita income in Joseph City is $19,906.
What is the Median Family Income in Joseph City?
Median Family Income in Joseph City is $69,087.
What is the Median Household income in Joseph City?
Median Household Income in Joseph City is $69,643.
What is Income or Wage Gap in Joseph City?
Income or Wage Gap in Joseph City is 51.1%.
Women in Joseph City earn 48.9 cents for every dollar earned by a man.
What is Inequality or Gini Index in Joseph City?
Inequality or Gini Index in Joseph City is 0.32.
How Large is the Labor Force in Joseph City?
There are 782 People in the Labor Forcein in Joseph City.
What is the Percentage of People in the Labor Force in Joseph City?
64.5% of People are in the Labor Force in Joseph City.
What is the Unemployment Rate in Joseph City?
Unemployment Rate in Joseph City is 5.2%.