Dateland, AZ
Dateland Map
Dateland Overview
341
TOTAL POPULATION
173
MALE POPULATION
168
FEMALE POPULATION
102.98
MALES / 100 FEMALES
97.11
FEMALES / 100 MALES
25.8
MEDIAN AGE
3.9
AVG FAMILY SIZE
2.6
AVG HOUSEHOLD SIZE
$23,825
PER CAPITA INCOME
$74,130
AVG FAMILY INCOME
$65,313
AVG HOUSEHOLD INCOME
0.35
INEQUALITY / GINI INDEX
126
LABOR FORCE [ PEOPLE ]
57.5%
PERCENT IN LABOR FORCE
1.6%
UNEMPLOYMENT RATE
Dateland Zip Codes
Dateland Area Codes
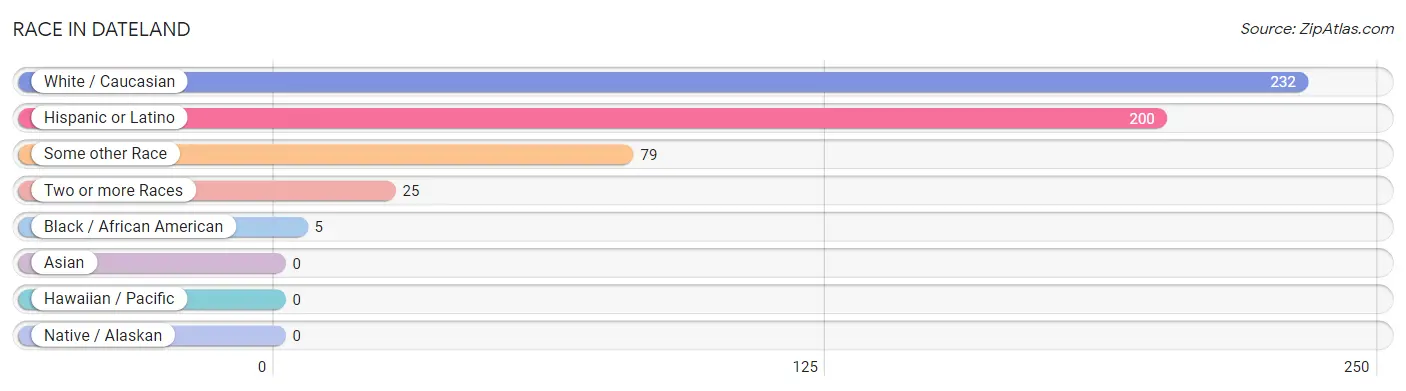
Race in Dateland
The most populous races in Dateland are White / Caucasian (232 | 68.0%), Hispanic or Latino (200 | 58.7%), and Some other Race (79 | 23.2%).
| Race | # Population | % Population |
| Asian | 0 | 0.0% |
| Black / African American | 5 | 1.5% |
| Hawaiian / Pacific | 0 | 0.0% |
| Hispanic or Latino | 200 | 58.7% |
| Native / Alaskan | 0 | 0.0% |
| White / Caucasian | 232 | 68.0% |
| Two or more Races | 25 | 7.3% |
| Some other Race | 79 | 23.2% |
| Total | 341 | 100.0% |
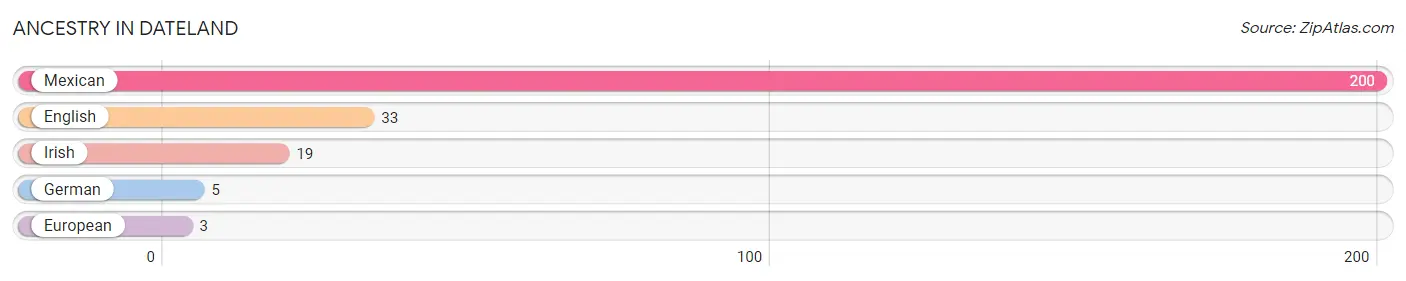
Ancestry in Dateland
The most populous ancestries reported in Dateland are Mexican (200 | 58.7%), English (33 | 9.7%), Irish (19 | 5.6%), German (5 | 1.5%), and European (3 | 0.9%), together accounting for 76.3% of all Dateland residents.
| Ancestry | # Population | % Population |
| English | 33 | 9.7% |
| European | 3 | 0.9% |
| German | 5 | 1.5% |
| Irish | 19 | 5.6% |
| Mexican | 200 | 58.7% | View All 5 Rows |
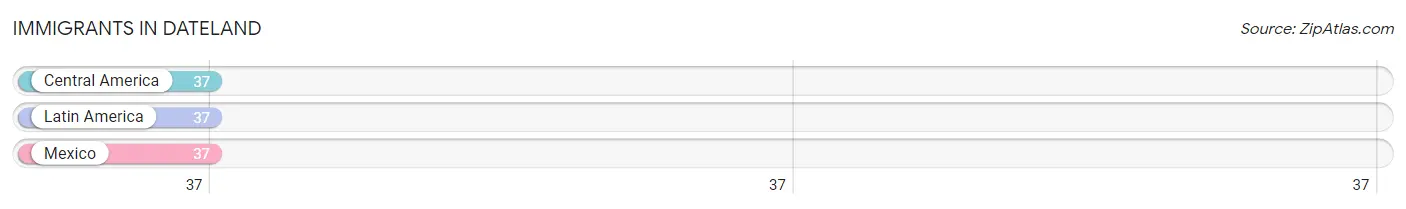
Immigrants in Dateland
The most numerous immigrant groups reported in Dateland came from Central America (37 | 10.8%), Latin America (37 | 10.8%), and Mexico (37 | 10.8%), together accounting for 32.6% of all Dateland residents.
| Immigration Origin | # Population | % Population |
| Central America | 37 | 10.8% |
| Latin America | 37 | 10.8% |
| Mexico | 37 | 10.8% | View All 3 Rows |
Sex and Age in Dateland
Sex and Age in Dateland
The most populous age groups in Dateland are 5 to 9 Years (32 | 18.5%) for men and 30 to 34 Years (26 | 15.5%) for women.
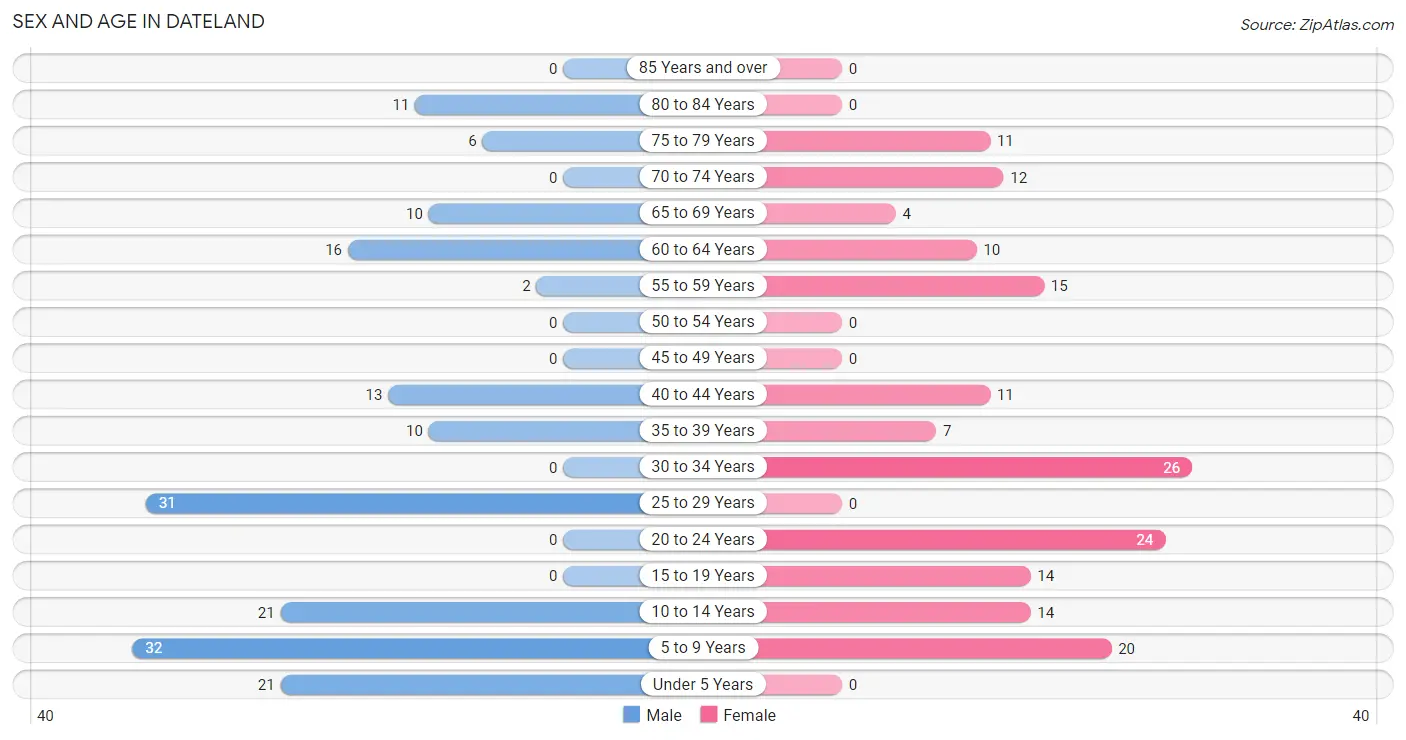
| Age Bracket | Male | Female |
| Under 5 Years | 21 (12.1%) | 0 (0.0%) |
| 5 to 9 Years | 32 (18.5%) | 20 (11.9%) |
| 10 to 14 Years | 21 (12.1%) | 14 (8.3%) |
| 15 to 19 Years | 0 (0.0%) | 14 (8.3%) |
| 20 to 24 Years | 0 (0.0%) | 24 (14.3%) |
| 25 to 29 Years | 31 (17.9%) | 0 (0.0%) |
| 30 to 34 Years | 0 (0.0%) | 26 (15.5%) |
| 35 to 39 Years | 10 (5.8%) | 7 (4.2%) |
| 40 to 44 Years | 13 (7.5%) | 11 (6.6%) |
| 45 to 49 Years | 0 (0.0%) | 0 (0.0%) |
| 50 to 54 Years | 0 (0.0%) | 0 (0.0%) |
| 55 to 59 Years | 2 (1.2%) | 15 (8.9%) |
| 60 to 64 Years | 16 (9.2%) | 10 (5.9%) |
| 65 to 69 Years | 10 (5.8%) | 4 (2.4%) |
| 70 to 74 Years | 0 (0.0%) | 12 (7.1%) |
| 75 to 79 Years | 6 (3.5%) | 11 (6.6%) |
| 80 to 84 Years | 11 (6.4%) | 0 (0.0%) |
| 85 Years and over | 0 (0.0%) | 0 (0.0%) |
| Total | 173 (100.0%) | 168 (100.0%) |
Families and Households in Dateland
Median Family Size in Dateland
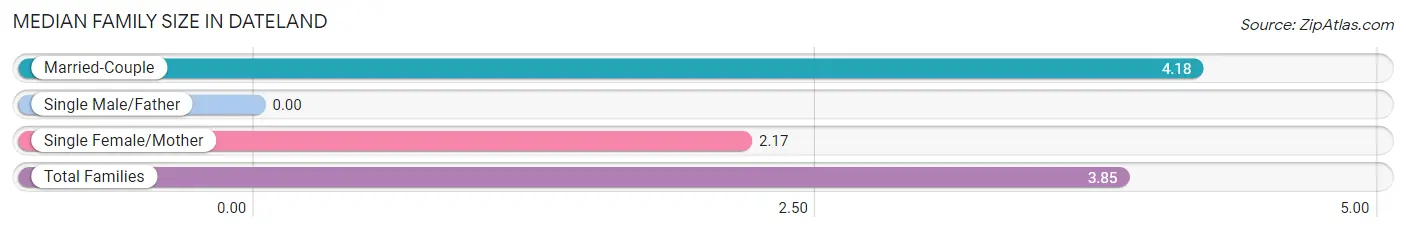
| Family Type | # Families | Family Size |
| Married-Couple | 60 (83.3%) | 4.18 |
| Single Male/Father | 0 (0.0%) | - |
| Single Female/Mother | 12 (16.7%) | 2.17 |
| Total Families | 72 (100.0%) | 3.85 |
Median Household Size in Dateland
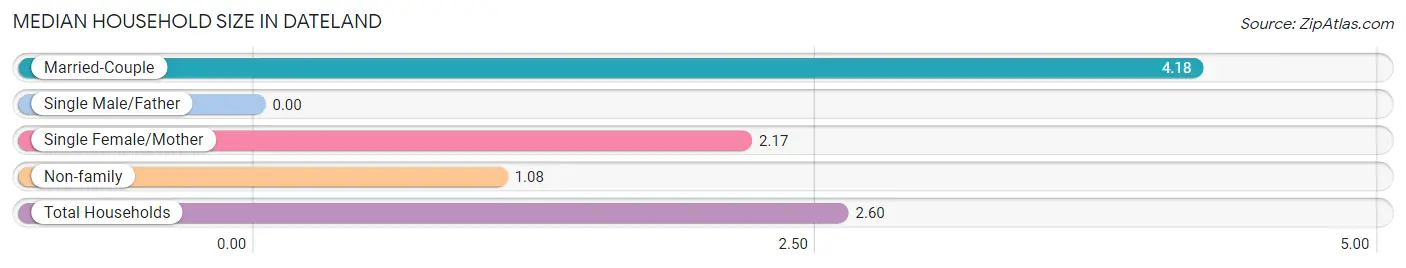
| Household Type | # Households | Household Size |
| Married-Couple | 60 (45.8%) | 4.18 |
| Single Male/Father | 0 (0.0%) | - |
| Single Female/Mother | 12 (9.2%) | 2.17 |
| Non-family | 59 (45.0%) | 1.08 |
| Total Households | 131 (100.0%) | 2.60 |
Household Size by Marriage Status in Dateland
Out of a total of 131 households in Dateland, 72 (55.0%) are family households, while 59 (45.0%) are nonfamily households. The most numerous type of family households are 4-person households, comprising 24, and the most common type of nonfamily households are 1-person households, comprising 54.
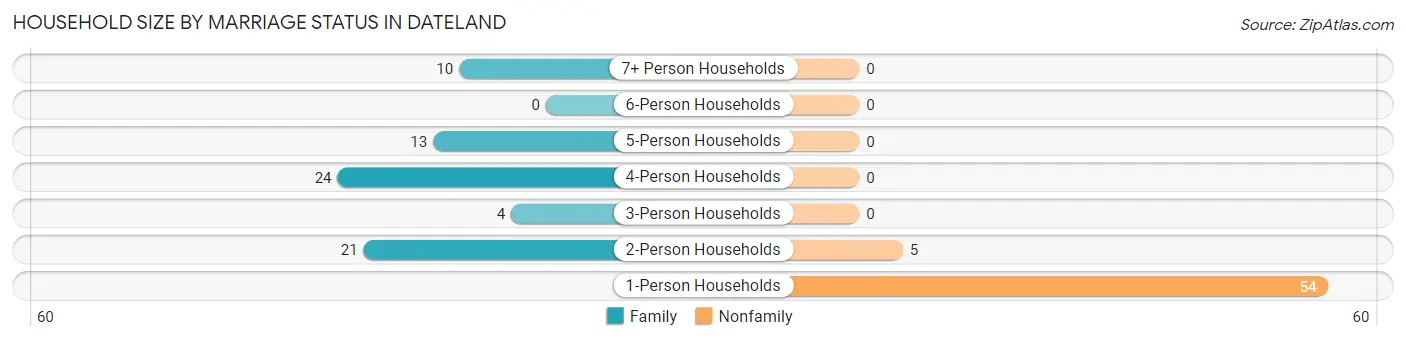
| Household Size | Family Households | Nonfamily Households |
| 1-Person Households | - | 54 (41.2%) |
| 2-Person Households | 21 (16.0%) | 5 (3.8%) |
| 3-Person Households | 4 (3.0%) | 0 (0.0%) |
| 4-Person Households | 24 (18.3%) | 0 (0.0%) |
| 5-Person Households | 13 (9.9%) | 0 (0.0%) |
| 6-Person Households | 0 (0.0%) | 0 (0.0%) |
| 7+ Person Households | 10 (7.6%) | 0 (0.0%) |
| Total | 72 (55.0%) | 59 (45.0%) |
Female Fertility in Dateland
Fertility by Age in Dateland
Average fertility rate in Dateland is 293.0 births per 1,000 women. Women in the age bracket of 20 to 34 years have the highest fertility rate with 480.0 births per 1,000 women. Women in the age bracket of 20 to 34 years acount for 100.0% of all women with births.
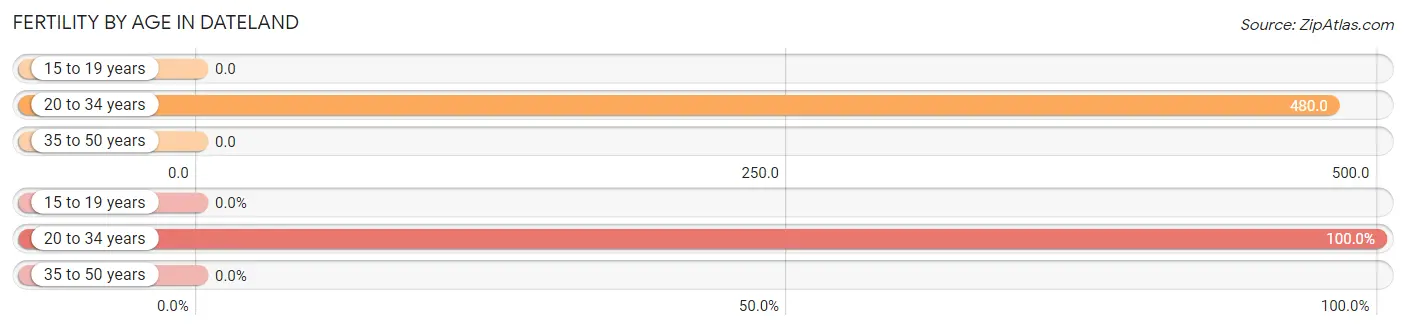
| Age Bracket | Women with Births | Births / 1,000 Women |
| 15 to 19 years | 0 (0.0%) | 0.0 |
| 20 to 34 years | 24 (100.0%) | 480.0 |
| 35 to 50 years | 0 (0.0%) | 0.0 |
| Total | 24 (100.0%) | 293.0 |
Fertility by Age by Marriage Status in Dateland
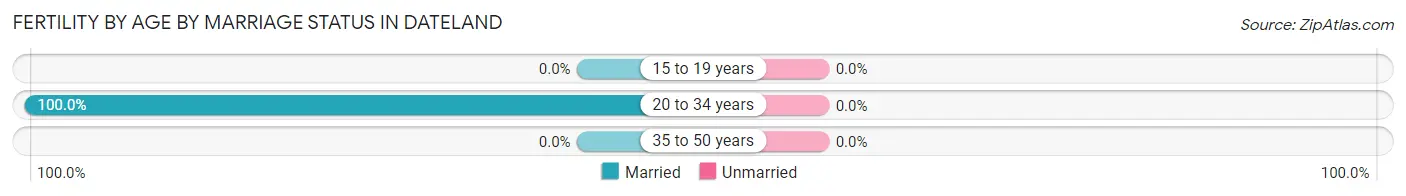
| Age Bracket | Married | Unmarried |
| 15 to 19 years | 0 (0.0%) | 0 (0.0%) |
| 20 to 34 years | 24 (100.0%) | 0 (0.0%) |
| 35 to 50 years | 0 (0.0%) | 0 (0.0%) |
| Total | 24 (100.0%) | 0 (0.0%) |
Fertility by Education in Dateland
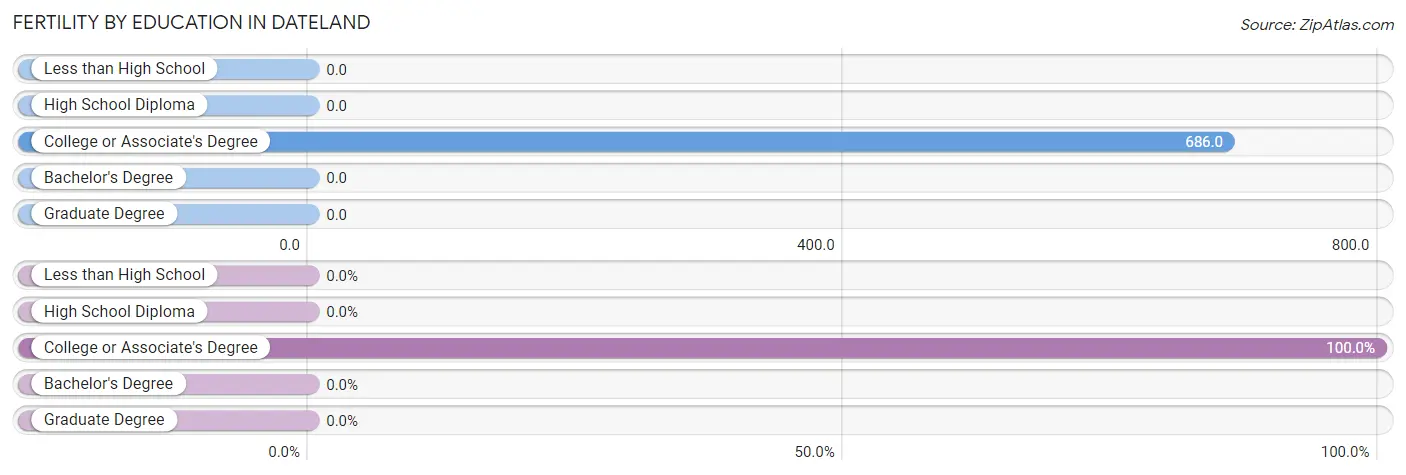
| Educational Attainment | Women with Births | Births / 1,000 Women |
| Less than High School | 0 (0.0%) | 0.0 |
| High School Diploma | 0 (0.0%) | 0.0 |
| College or Associate's Degree | 24 (100.0%) | 686.0 |
| Bachelor's Degree | 0 (0.0%) | 0.0 |
| Graduate Degree | 0 (0.0%) | 0.0 |
| Total | 24 (100.0%) | 293.0 |
Fertility by Education by Marriage Status in Dateland
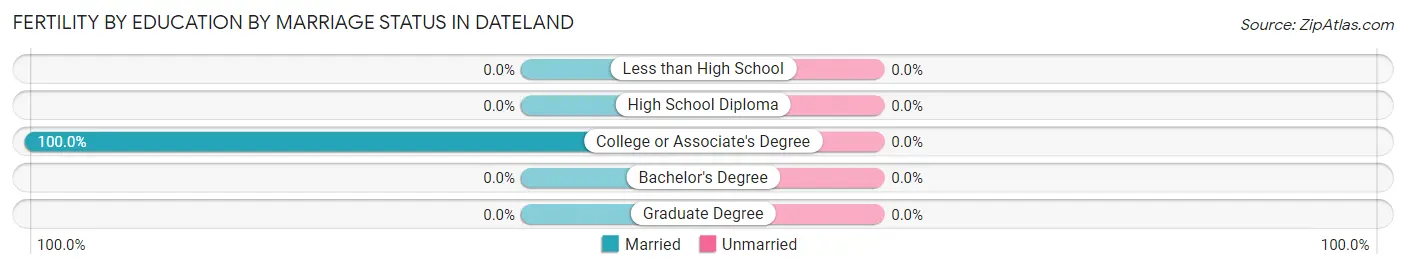
| Educational Attainment | Married | Unmarried |
| Less than High School | 0 (0.0%) | 0 (0.0%) |
| High School Diploma | 0 (0.0%) | 0 (0.0%) |
| College or Associate's Degree | 24 (100.0%) | 0 (0.0%) |
| Bachelor's Degree | 0 (0.0%) | 0 (0.0%) |
| Graduate Degree | 0 (0.0%) | 0 (0.0%) |
| Total | 24 (100.0%) | 0 (0.0%) |
Income in Dateland
Income Overview in Dateland
Per Capita Income in Dateland is $23,825, while median incomes of families and households are $74,130 and $65,313 respectively.
| Characteristic | Number | Measure |
| Per Capita Income | 341 | $23,825 |
| Median Family Income | 72 | $74,130 |
| Mean Family Income | 72 | $67,575 |
| Median Household Income | 131 | $65,313 |
| Mean Household Income | 131 | $57,792 |
| Income Deficit | 72 | $0 |
| Wage / Income Gap (%) | 341 | 0.00% |
| Wage / Income Gap ($) | 341 | 100.00¢ per $1 |
| Gini / Inequality Index | 341 | 0.35 |
Earnings by Sex in Dateland
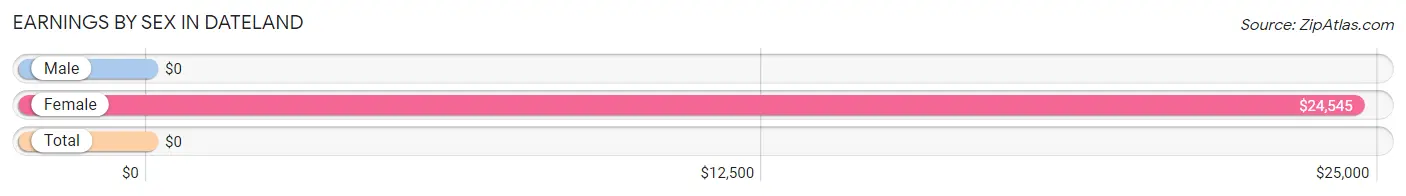
| Sex | Number | Average Earnings |
| Male | 70 (53.8%) | $0 |
| Female | 60 (46.2%) | $24,545 |
| Total | 130 (100.0%) | $0 |
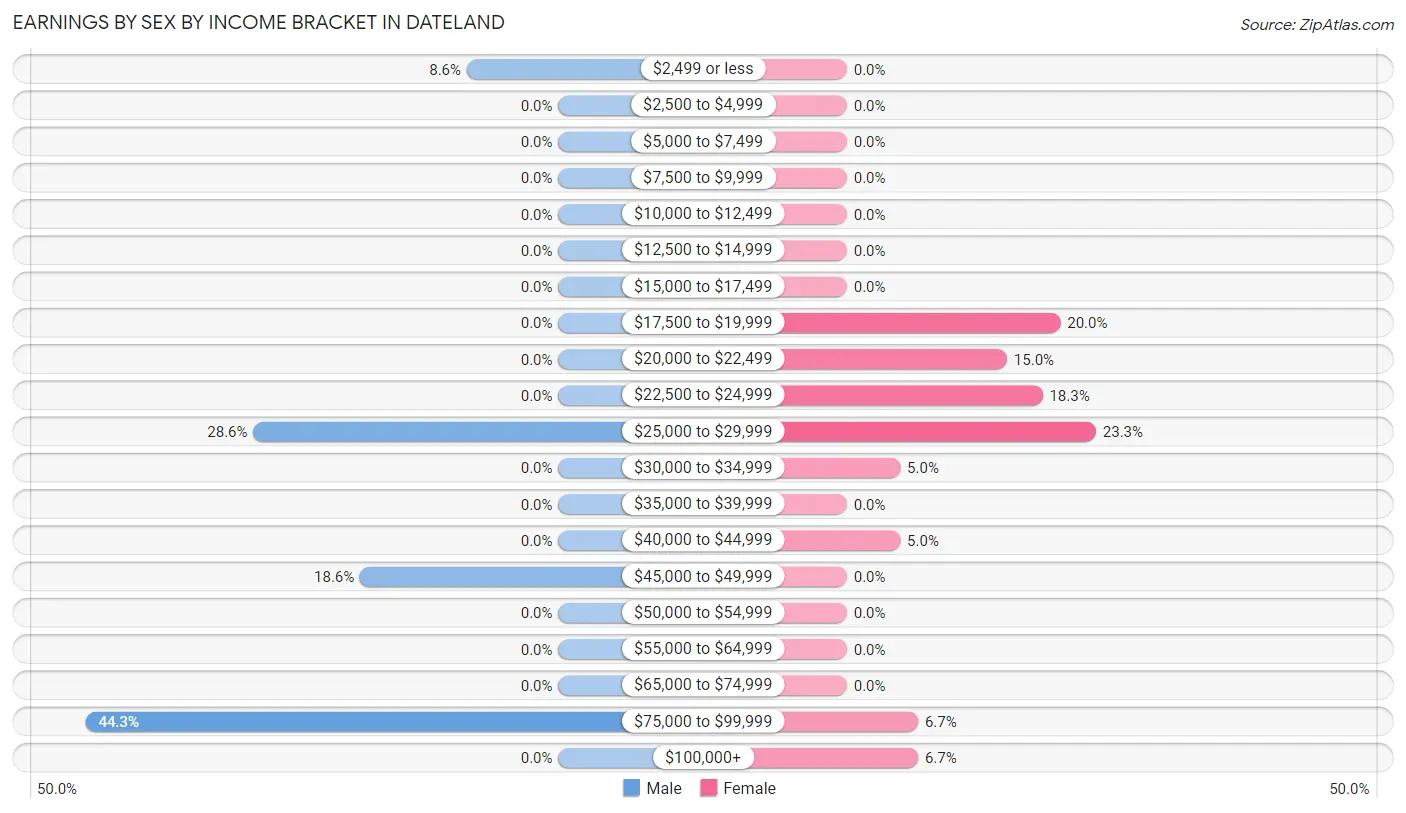
Earnings by Sex by Income Bracket in Dateland
The most common earnings brackets in Dateland are $75,000 to $99,999 for men (31 | 44.3%) and $25,000 to $29,999 for women (14 | 23.3%).
| Income | Male | Female |
| $2,499 or less | 6 (8.6%) | 0 (0.0%) |
| $2,500 to $4,999 | 0 (0.0%) | 0 (0.0%) |
| $5,000 to $7,499 | 0 (0.0%) | 0 (0.0%) |
| $7,500 to $9,999 | 0 (0.0%) | 0 (0.0%) |
| $10,000 to $12,499 | 0 (0.0%) | 0 (0.0%) |
| $12,500 to $14,999 | 0 (0.0%) | 0 (0.0%) |
| $15,000 to $17,499 | 0 (0.0%) | 0 (0.0%) |
| $17,500 to $19,999 | 0 (0.0%) | 12 (20.0%) |
| $20,000 to $22,499 | 0 (0.0%) | 9 (15.0%) |
| $22,500 to $24,999 | 0 (0.0%) | 11 (18.3%) |
| $25,000 to $29,999 | 20 (28.6%) | 14 (23.3%) |
| $30,000 to $34,999 | 0 (0.0%) | 3 (5.0%) |
| $35,000 to $39,999 | 0 (0.0%) | 0 (0.0%) |
| $40,000 to $44,999 | 0 (0.0%) | 3 (5.0%) |
| $45,000 to $49,999 | 13 (18.6%) | 0 (0.0%) |
| $50,000 to $54,999 | 0 (0.0%) | 0 (0.0%) |
| $55,000 to $64,999 | 0 (0.0%) | 0 (0.0%) |
| $65,000 to $74,999 | 0 (0.0%) | 0 (0.0%) |
| $75,000 to $99,999 | 31 (44.3%) | 4 (6.7%) |
| $100,000+ | 0 (0.0%) | 4 (6.7%) |
| Total | 70 (100.0%) | 60 (100.0%) |
Earnings by Sex by Educational Attainment in Dateland
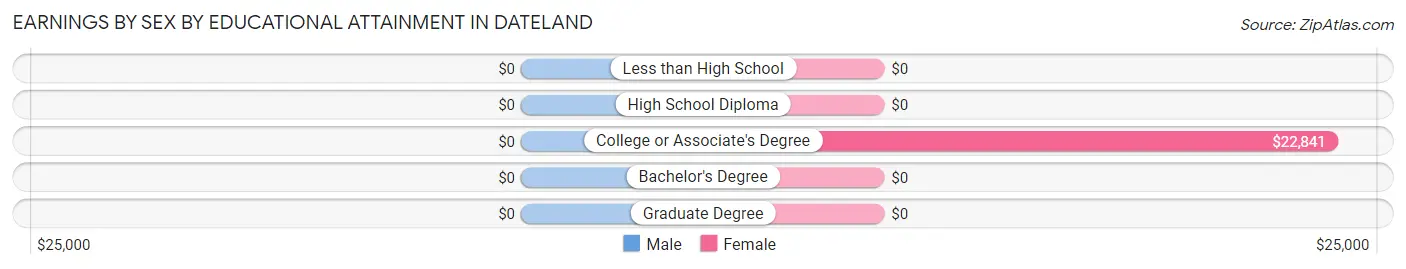
| Educational Attainment | Male Income | Female Income |
| Less than High School | - | - |
| High School Diploma | - | - |
| College or Associate's Degree | - | - |
| Bachelor's Degree | - | - |
| Graduate Degree | - | - |
| Total | - | - |
Family Income in Dateland
Family Income Brackets in Dateland
According to the Dateland family income data, there are 26 families falling into the $50,000 to $74,999 income range, which is the most common income bracket and makes up 36.1% of all families.
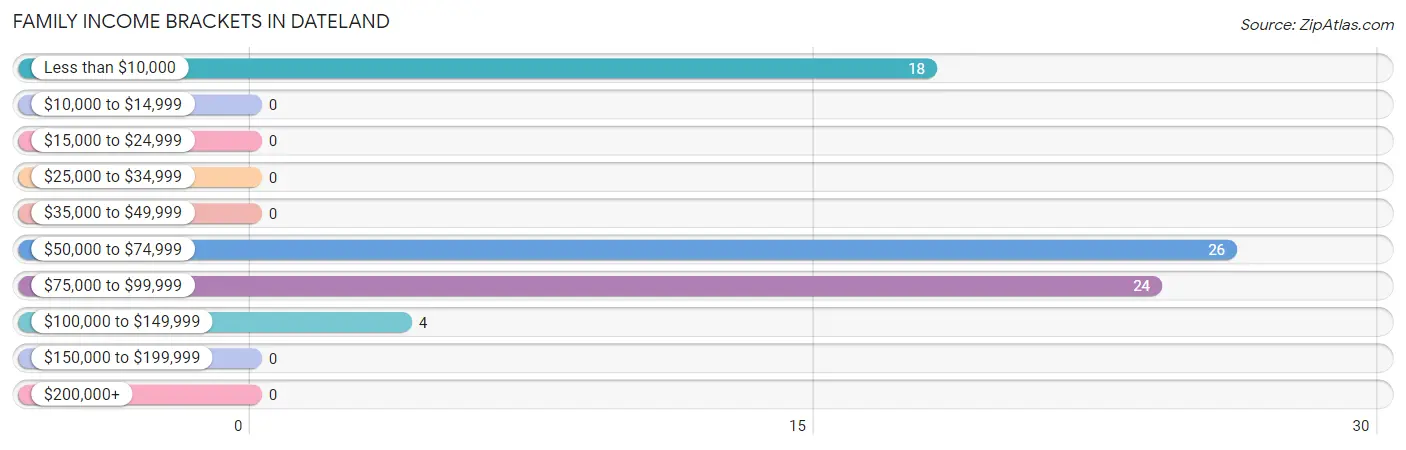
| Income Bracket | # Families | % Families |
| Less than $10,000 | 18 | 25.0% |
| $10,000 to $14,999 | 0 | 0.0% |
| $15,000 to $24,999 | 0 | 0.0% |
| $25,000 to $34,999 | 0 | 0.0% |
| $35,000 to $49,999 | 0 | 0.0% |
| $50,000 to $74,999 | 26 | 36.1% |
| $75,000 to $99,999 | 24 | 33.3% |
| $100,000 to $149,999 | 4 | 5.6% |
| $150,000 to $199,999 | 0 | 0.0% |
| $200,000+ | 0 | 0.0% |
Family Income by Famaliy Size in Dateland
2-person families (21 | 29.2%) account for the highest median family income in Dateland with $8,958 per family, while 2-person families (21 | 29.2%) have the highest median income of $4,479 per family member.
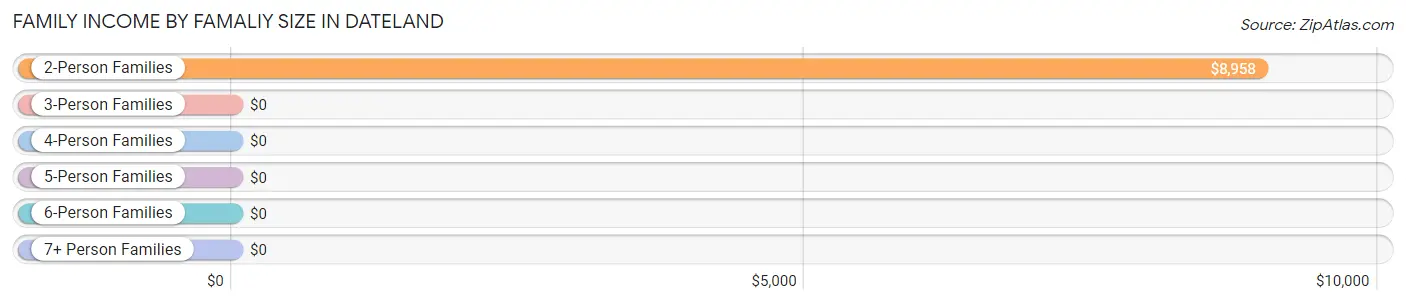
| Income Bracket | # Families | Median Income |
| 2-Person Families | 21 (29.2%) | $8,958 |
| 3-Person Families | 4 (5.6%) | $0 |
| 4-Person Families | 24 (33.3%) | $0 |
| 5-Person Families | 13 (18.1%) | $0 |
| 6-Person Families | 0 (0.0%) | $0 |
| 7+ Person Families | 10 (13.9%) | $0 |
| Total | 72 (100.0%) | $74,130 |
Family Income by Number of Earners in Dateland
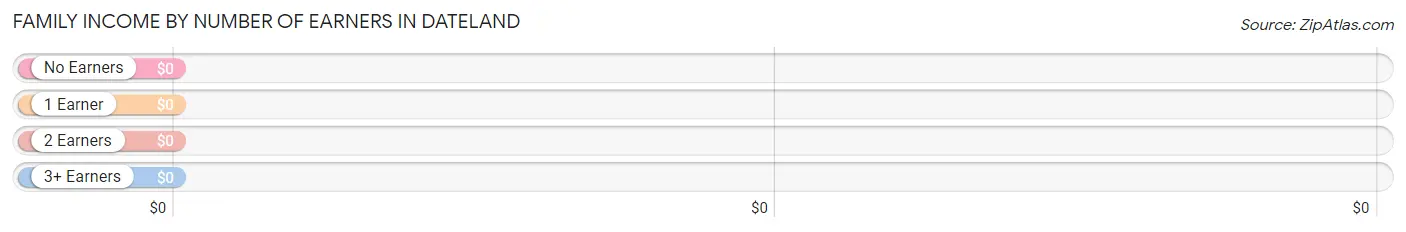
| Number of Earners | # Families | Median Income |
| No Earners | 18 (25.0%) | $0 |
| 1 Earner | 27 (37.5%) | $0 |
| 2 Earners | 13 (18.1%) | $0 |
| 3+ Earners | 14 (19.4%) | $0 |
| Total | 72 (100.0%) | $74,130 |
Household Income in Dateland
Household Income Brackets in Dateland
With 44 households falling in the category, the $50,000 to $74,999 income range is the most frequent in Dateland, accounting for 33.6% of all households.
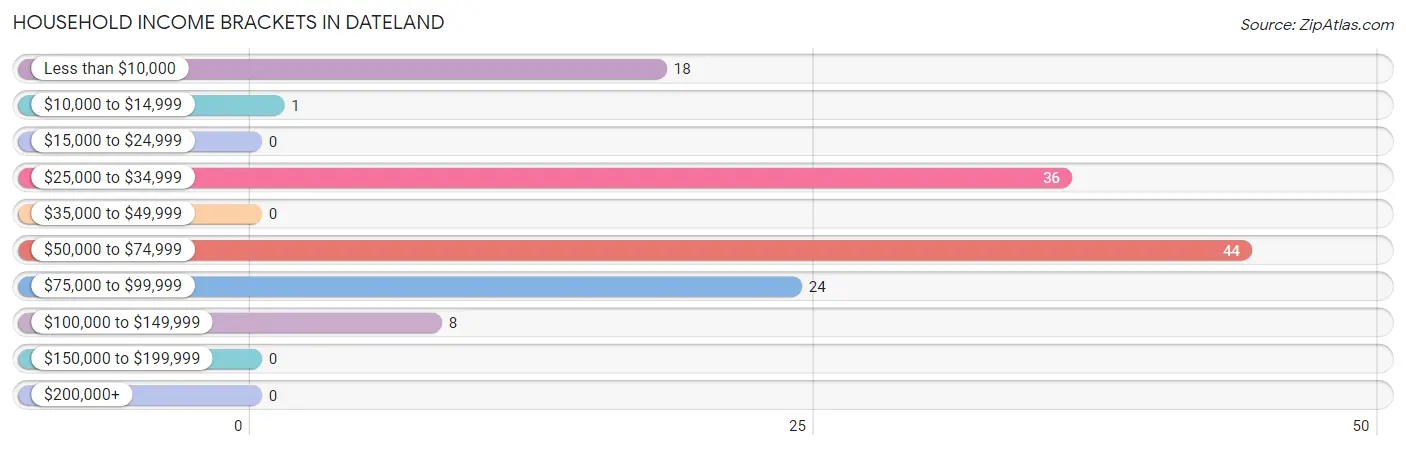
| Income Bracket | # Households | % Households |
| Less than $10,000 | 18 | 13.7% |
| $10,000 to $14,999 | 1 | 0.8% |
| $15,000 to $24,999 | 0 | 0.0% |
| $25,000 to $34,999 | 36 | 27.5% |
| $35,000 to $49,999 | 0 | 0.0% |
| $50,000 to $74,999 | 44 | 33.6% |
| $75,000 to $99,999 | 24 | 18.3% |
| $100,000 to $149,999 | 8 | 6.1% |
| $150,000 to $199,999 | 0 | 0.0% |
| $200,000+ | 0 | 0.0% |
Household Income by Householder Age in Dateland
The median household income in Dateland is $65,313, with the highest median household income of $73,250 found in the 45 to 64 years age bracket for the primary householder. A total of 14 households (10.7%) fall into this category. Meanwhile, the 15 to 24 years age bracket for the primary householder has the lowest median household income of $0, with 24 households (18.3%) in this group.
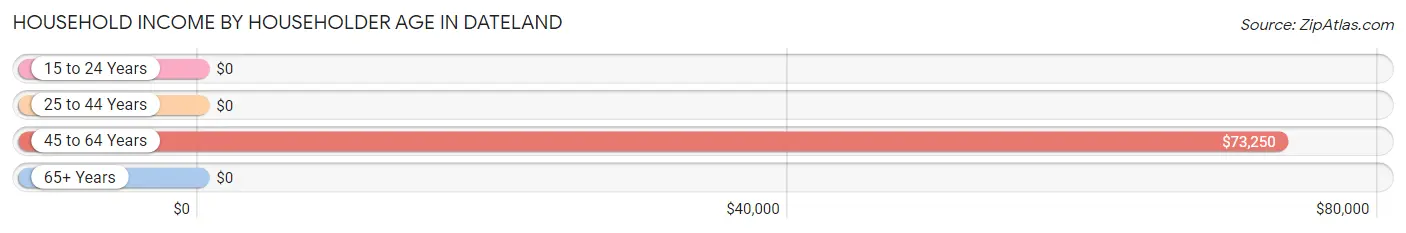
| Income Bracket | # Households | Median Income |
| 15 to 24 Years | 24 (18.3%) | $0 |
| 25 to 44 Years | 39 (29.8%) | $0 |
| 45 to 64 Years | 14 (10.7%) | $73,250 |
| 65+ Years | 54 (41.2%) | $0 |
| Total | 131 (100.0%) | $65,313 |
Poverty in Dateland
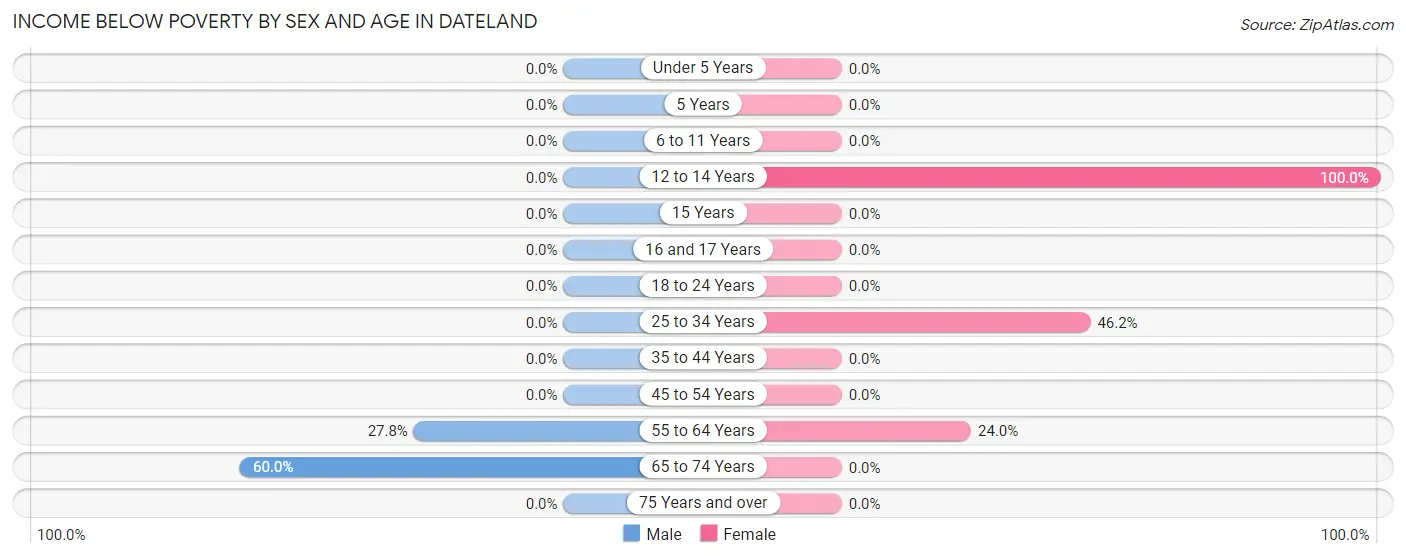
Income Below Poverty by Sex and Age in Dateland
With 6.4% poverty level for males and 19.1% for females among the residents of Dateland, 65 to 74 year old males and 12 to 14 year old females are the most vulnerable to poverty, with 6 males (60.0%) and 14 females (100.0%) in their respective age groups living below the poverty level.
| Age Bracket | Male | Female |
| Under 5 Years | 0 (0.0%) | 0 (0.0%) |
| 5 Years | 0 (0.0%) | 0 (0.0%) |
| 6 to 11 Years | 0 (0.0%) | 0 (0.0%) |
| 12 to 14 Years | 0 (0.0%) | 14 (100.0%) |
| 15 Years | 0 (0.0%) | 0 (0.0%) |
| 16 and 17 Years | 0 (0.0%) | 0 (0.0%) |
| 18 to 24 Years | 0 (0.0%) | 0 (0.0%) |
| 25 to 34 Years | 0 (0.0%) | 12 (46.2%) |
| 35 to 44 Years | 0 (0.0%) | 0 (0.0%) |
| 45 to 54 Years | 0 (0.0%) | 0 (0.0%) |
| 55 to 64 Years | 5 (27.8%) | 6 (24.0%) |
| 65 to 74 Years | 6 (60.0%) | 0 (0.0%) |
| 75 Years and over | 0 (0.0%) | 0 (0.0%) |
| Total | 11 (6.4%) | 32 (19.1%) |
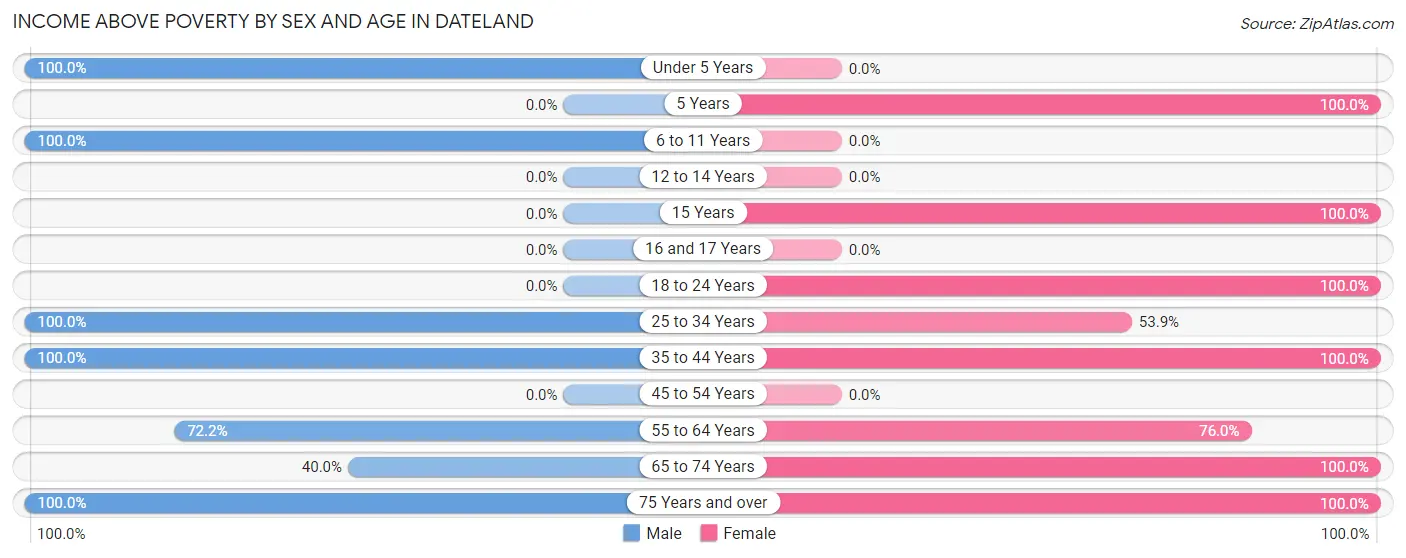
Income Above Poverty by Sex and Age in Dateland
According to the poverty statistics in Dateland, males aged under 5 years and females aged 5 years are the age groups that are most secure financially, with 100.0% of males and 100.0% of females in these age groups living above the poverty line.
| Age Bracket | Male | Female |
| Under 5 Years | 21 (100.0%) | 0 (0.0%) |
| 5 Years | 0 (0.0%) | 20 (100.0%) |
| 6 to 11 Years | 53 (100.0%) | 0 (0.0%) |
| 12 to 14 Years | 0 (0.0%) | 0 (0.0%) |
| 15 Years | 0 (0.0%) | 14 (100.0%) |
| 16 and 17 Years | 0 (0.0%) | 0 (0.0%) |
| 18 to 24 Years | 0 (0.0%) | 24 (100.0%) |
| 25 to 34 Years | 31 (100.0%) | 14 (53.8%) |
| 35 to 44 Years | 23 (100.0%) | 18 (100.0%) |
| 45 to 54 Years | 0 (0.0%) | 0 (0.0%) |
| 55 to 64 Years | 13 (72.2%) | 19 (76.0%) |
| 65 to 74 Years | 4 (40.0%) | 16 (100.0%) |
| 75 Years and over | 17 (100.0%) | 11 (100.0%) |
| Total | 162 (93.6%) | 136 (80.9%) |
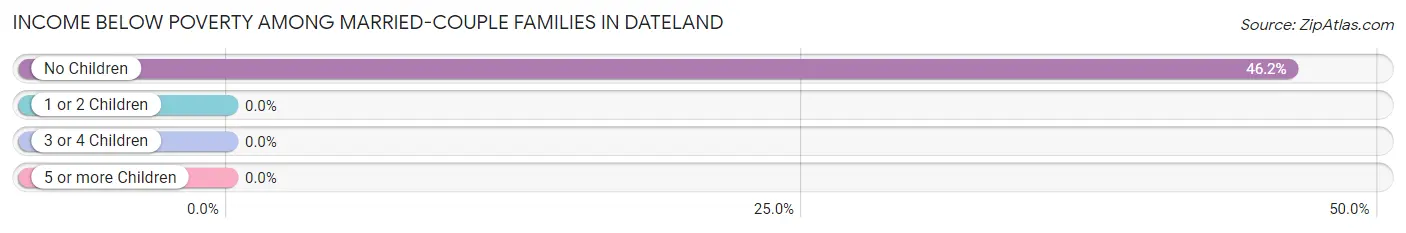
Income Below Poverty Among Married-Couple Families in Dateland
The poverty statistics for married-couple families in Dateland show that 10.0% or 6 of the total 60 families live below the poverty line. Families with no children have the highest poverty rate of 46.2%, comprising of 6 families. On the other hand, families with 1 or 2 children have the lowest poverty rate of 0.0%, which includes 0 families.
| Children | Above Poverty | Below Poverty |
| No Children | 7 (53.8%) | 6 (46.2%) |
| 1 or 2 Children | 24 (100.0%) | 0 (0.0%) |
| 3 or 4 Children | 23 (100.0%) | 0 (0.0%) |
| 5 or more Children | 0 (0.0%) | 0 (0.0%) |
| Total | 54 (90.0%) | 6 (10.0%) |
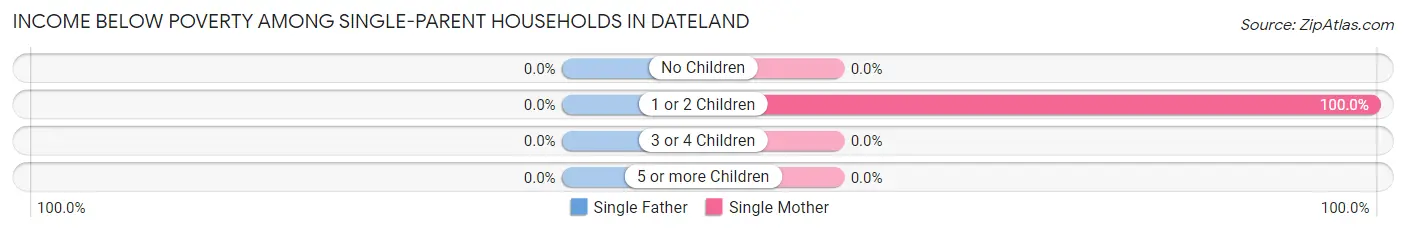
Income Below Poverty Among Single-Parent Households in Dateland
| Children | Single Father | Single Mother |
| No Children | 0 (0.0%) | 0 (0.0%) |
| 1 or 2 Children | 0 (0.0%) | 12 (100.0%) |
| 3 or 4 Children | 0 (0.0%) | 0 (0.0%) |
| 5 or more Children | 0 (0.0%) | 0 (0.0%) |
| Total | 0 (0.0%) | 12 (100.0%) |
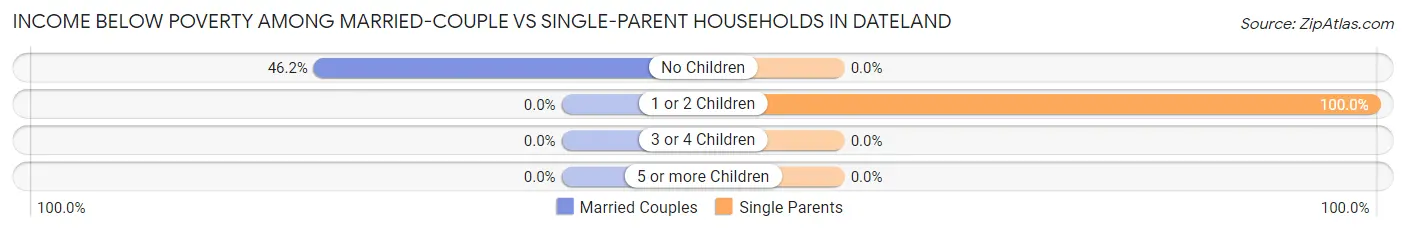
Income Below Poverty Among Married-Couple vs Single-Parent Households in Dateland
The poverty data for Dateland shows that 6 of the married-couple family households (10.0%) and 12 of the single-parent households (100.0%) are living below the poverty level. Within the married-couple family households, those with no children have the highest poverty rate, with 6 households (46.2%) falling below the poverty line. Among the single-parent households, those with 1 or 2 children have the highest poverty rate, with 12 household (100.0%) living below poverty.
| Children | Married-Couple Families | Single-Parent Households |
| No Children | 6 (46.2%) | 0 (0.0%) |
| 1 or 2 Children | 0 (0.0%) | 12 (100.0%) |
| 3 or 4 Children | 0 (0.0%) | 0 (0.0%) |
| 5 or more Children | 0 (0.0%) | 0 (0.0%) |
| Total | 6 (10.0%) | 12 (100.0%) |
Employment Characteristics in Dateland
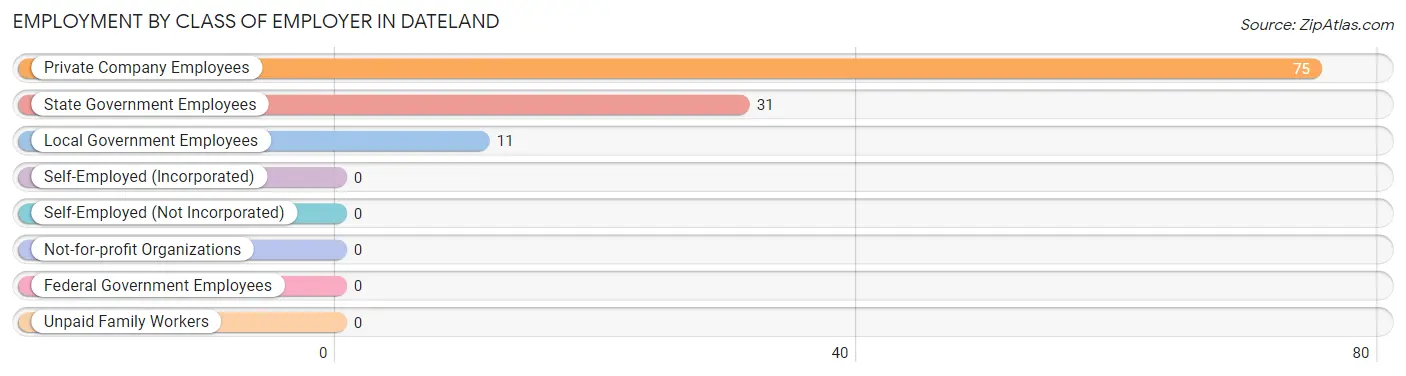
Employment by Class of Employer in Dateland
Among the 117 employed individuals in Dateland, private company employees (75 | 64.1%), state government employees (31 | 26.5%), and local government employees (11 | 9.4%) make up the most common classes of employment.
| Employer Class | # Employees | % Employees |
| Private Company Employees | 75 | 64.1% |
| Self-Employed (Incorporated) | 0 | 0.0% |
| Self-Employed (Not Incorporated) | 0 | 0.0% |
| Not-for-profit Organizations | 0 | 0.0% |
| Local Government Employees | 11 | 9.4% |
| State Government Employees | 31 | 26.5% |
| Federal Government Employees | 0 | 0.0% |
| Unpaid Family Workers | 0 | 0.0% |
| Total | 117 | 100.0% |
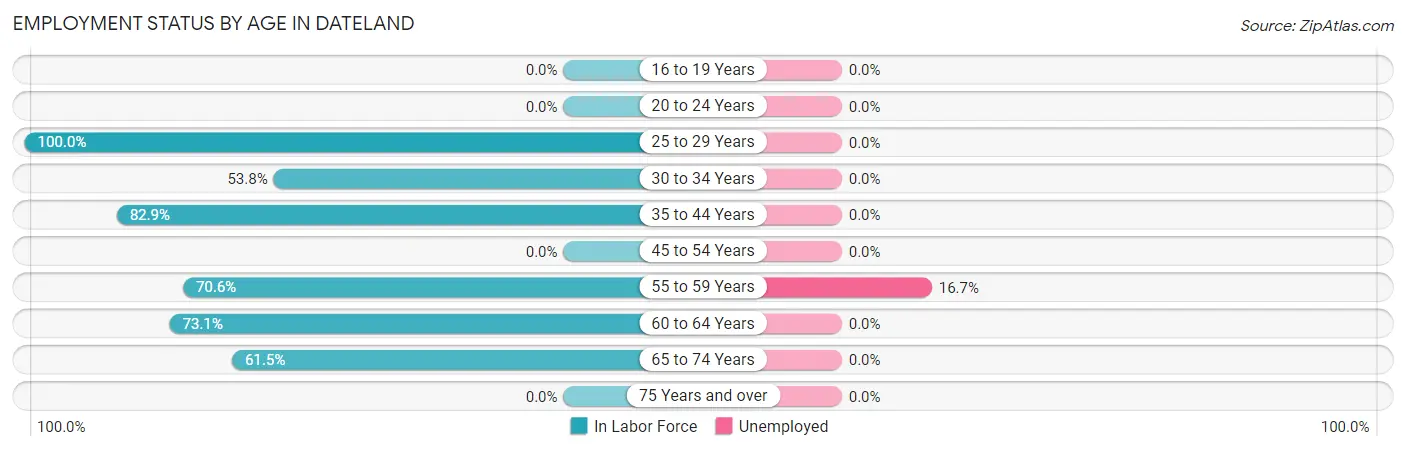
Employment Status by Age in Dateland
According to the labor force statistics for Dateland, out of the total population over 16 years of age (219), 57.5% or 126 individuals are in the labor force, with 1.6% or 2 of them unemployed. The age group with the highest labor force participation rate is 25 to 29 years, with 100.0% or 31 individuals in the labor force. Within the labor force, the 55 to 59 years age range has the highest percentage of unemployed individuals, with 16.7% or 2 of them being unemployed.
| Age Bracket | In Labor Force | Unemployed |
| 16 to 19 Years | 0 (0.0%) | 0 (0.0%) |
| 20 to 24 Years | 0 (0.0%) | 0 (0.0%) |
| 25 to 29 Years | 31 (100.0%) | 0 (0.0%) |
| 30 to 34 Years | 14 (53.8%) | 0 (0.0%) |
| 35 to 44 Years | 34 (82.9%) | 0 (0.0%) |
| 45 to 54 Years | 0 (0.0%) | 0 (0.0%) |
| 55 to 59 Years | 12 (70.6%) | 2 (16.7%) |
| 60 to 64 Years | 19 (73.1%) | 0 (0.0%) |
| 65 to 74 Years | 16 (61.5%) | 0 (0.0%) |
| 75 Years and over | 0 (0.0%) | 0 (0.0%) |
| Total | 126 (57.5%) | 2 (1.6%) |
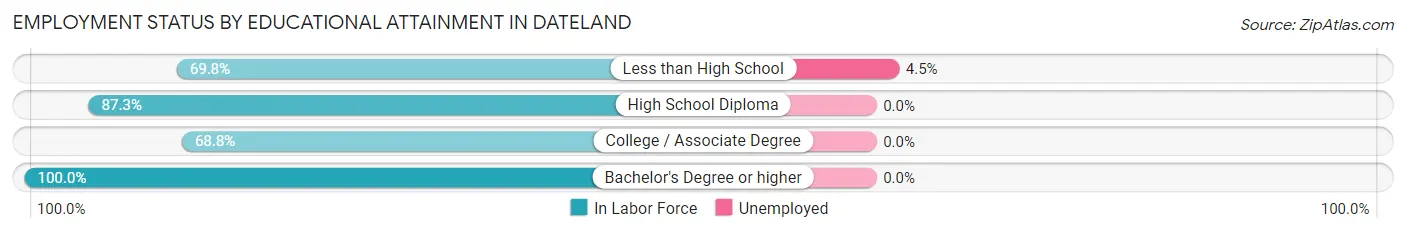
Employment Status by Educational Attainment in Dateland
According to labor force statistics for Dateland, 78.0% of individuals (110) out of the total population between 25 and 64 years of age (141) are in the labor force, with 1.8% or 2 of them being unemployed. The group with the highest labor force participation rate are those with the educational attainment of bachelor's degree or higher, with 100.0% or 7 individuals in the labor force. Within the labor force, individuals with less than high school education have the highest percentage of unemployment, with 4.5% or 2 of them being unemployed.
| Educational Attainment | In Labor Force | Unemployed |
| Less than High School | 44 (69.8%) | 3 (4.5%) |
| High School Diploma | 48 (87.3%) | 0 (0.0%) |
| College / Associate Degree | 11 (68.8%) | 0 (0.0%) |
| Bachelor's Degree or higher | 7 (100.0%) | 0 (0.0%) |
| Total | 110 (78.0%) | 3 (1.8%) |
Employment Occupations by Sex in Dateland
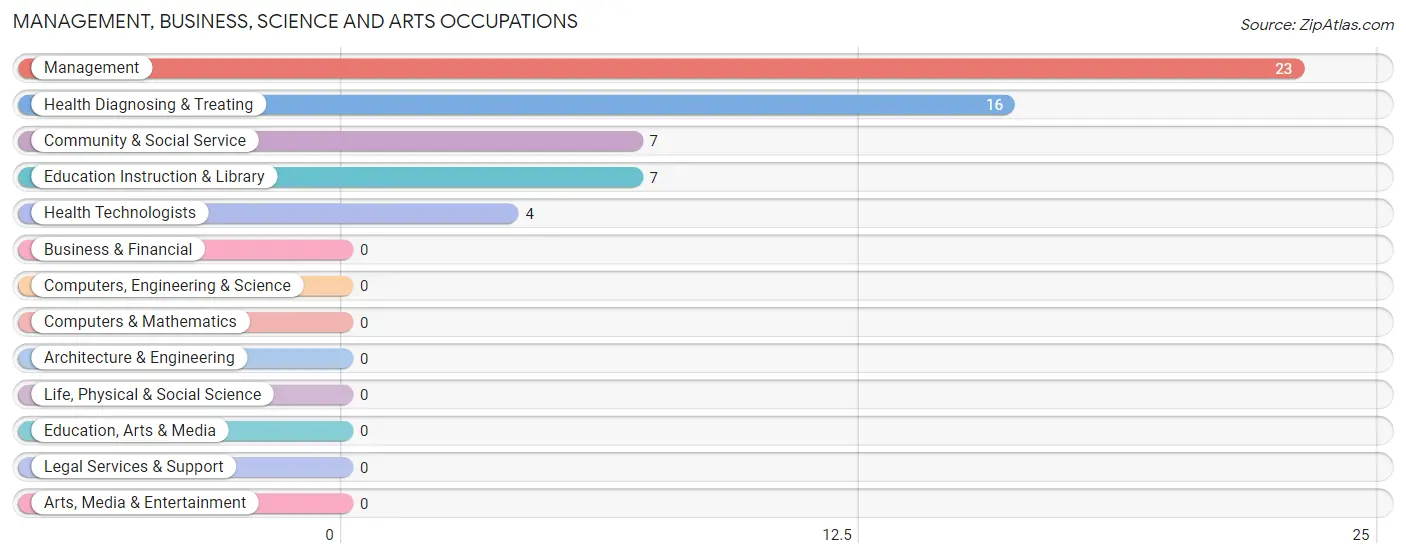
Management, Business, Science and Arts Occupations
The most common Management, Business, Science and Arts occupations in Dateland are Management (23 | 18.5%), Health Diagnosing & Treating (16 | 12.9%), Community & Social Service (7 | 5.7%), Education Instruction & Library (7 | 5.7%), and Health Technologists (4 | 3.2%).
Management, Business, Science and Arts Occupations by Sex
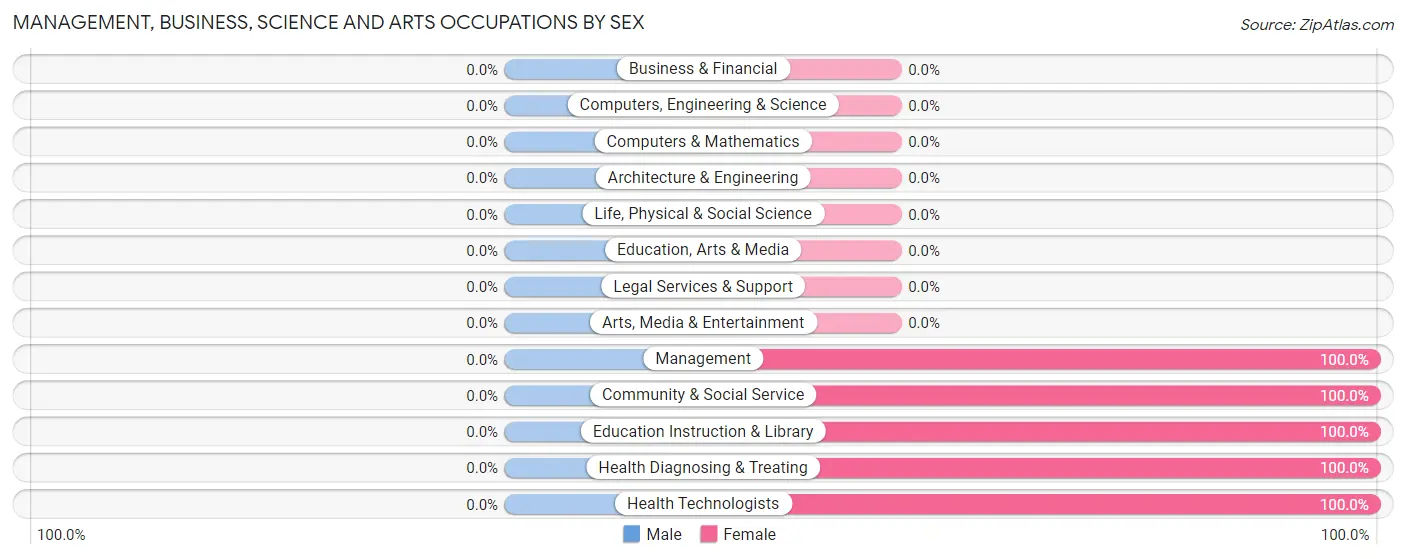
| Occupation | Male | Female |
| Management | 0 (0.0%) | 23 (100.0%) |
| Business & Financial | 0 (0.0%) | 0 (0.0%) |
| Computers, Engineering & Science | 0 (0.0%) | 0 (0.0%) |
| Computers & Mathematics | 0 (0.0%) | 0 (0.0%) |
| Architecture & Engineering | 0 (0.0%) | 0 (0.0%) |
| Life, Physical & Social Science | 0 (0.0%) | 0 (0.0%) |
| Community & Social Service | 0 (0.0%) | 7 (100.0%) |
| Education, Arts & Media | 0 (0.0%) | 0 (0.0%) |
| Legal Services & Support | 0 (0.0%) | 0 (0.0%) |
| Education Instruction & Library | 0 (0.0%) | 7 (100.0%) |
| Arts, Media & Entertainment | 0 (0.0%) | 0 (0.0%) |
| Health Diagnosing & Treating | 0 (0.0%) | 16 (100.0%) |
| Health Technologists | 0 (0.0%) | 4 (100.0%) |
| Total (Category) | 0 (0.0%) | 46 (100.0%) |
| Total (Overall) | 64 (51.6%) | 60 (48.4%) |
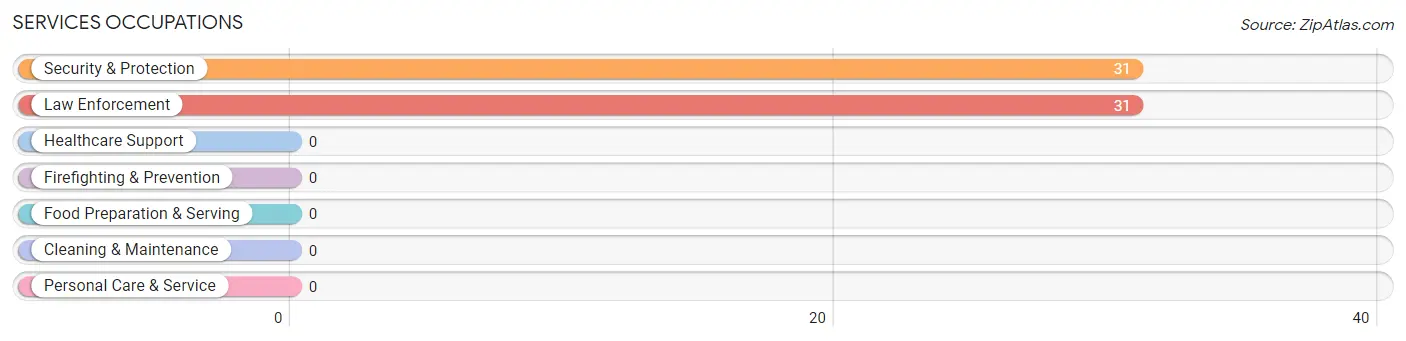
Services Occupations
The most common Services occupations in Dateland are Security & Protection (31 | 25.0%), and Law Enforcement (31 | 25.0%).
Services Occupations by Sex
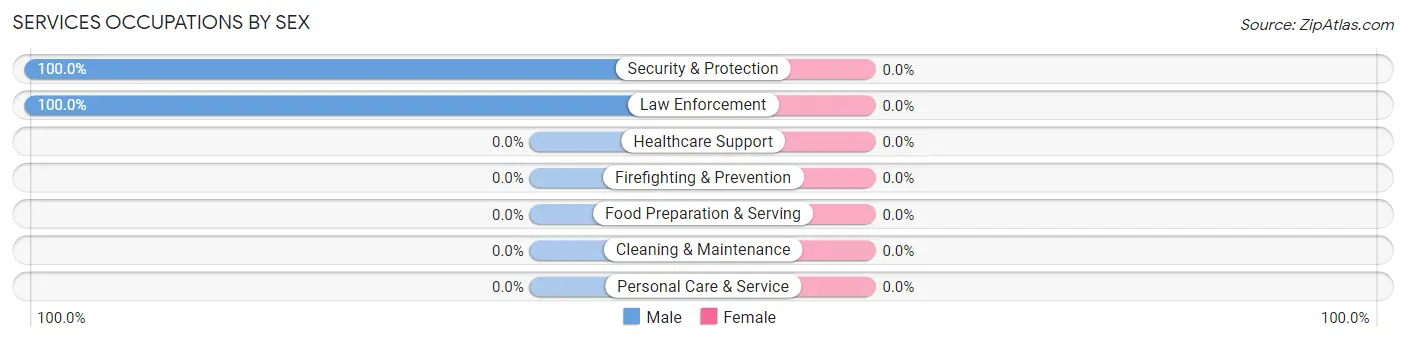
| Occupation | Male | Female |
| Healthcare Support | 0 (0.0%) | 0 (0.0%) |
| Security & Protection | 31 (100.0%) | 0 (0.0%) |
| Firefighting & Prevention | 0 (0.0%) | 0 (0.0%) |
| Law Enforcement | 31 (100.0%) | 0 (0.0%) |
| Food Preparation & Serving | 0 (0.0%) | 0 (0.0%) |
| Cleaning & Maintenance | 0 (0.0%) | 0 (0.0%) |
| Personal Care & Service | 0 (0.0%) | 0 (0.0%) |
| Total (Category) | 31 (100.0%) | 0 (0.0%) |
| Total (Overall) | 64 (51.6%) | 60 (48.4%) |
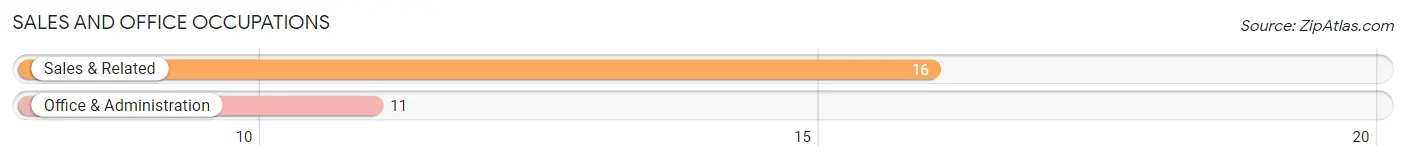
Sales and Office Occupations
The most common Sales and Office occupations in Dateland are Sales & Related (16 | 12.9%), and Office & Administration (11 | 8.9%).
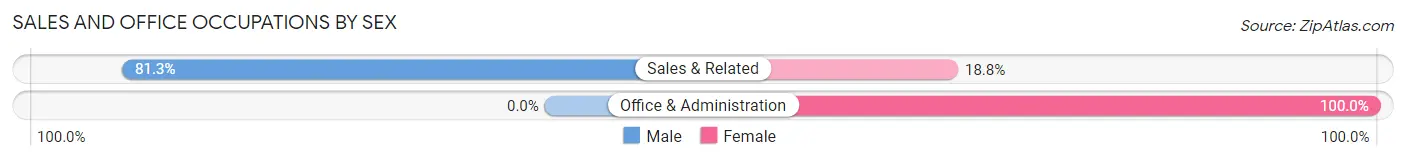
Sales and Office Occupations by Sex
| Occupation | Male | Female |
| Sales & Related | 13 (81.2%) | 3 (18.8%) |
| Office & Administration | 0 (0.0%) | 11 (100.0%) |
| Total (Category) | 13 (48.1%) | 14 (51.8%) |
| Total (Overall) | 64 (51.6%) | 60 (48.4%) |
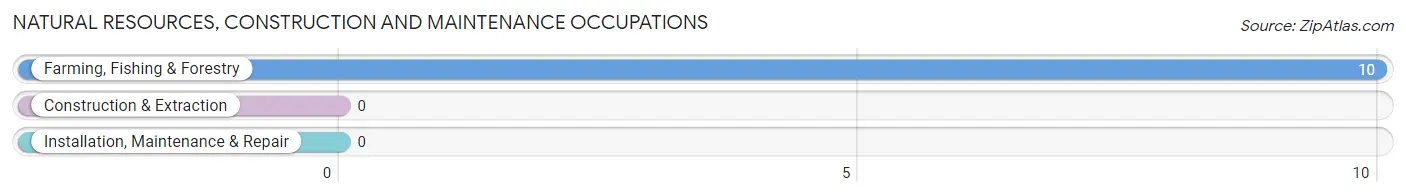
Natural Resources, Construction and Maintenance Occupations
The most common Natural Resources, Construction and Maintenance occupations in Dateland are , and Farming, Fishing & Forestry (10 | 8.1%).
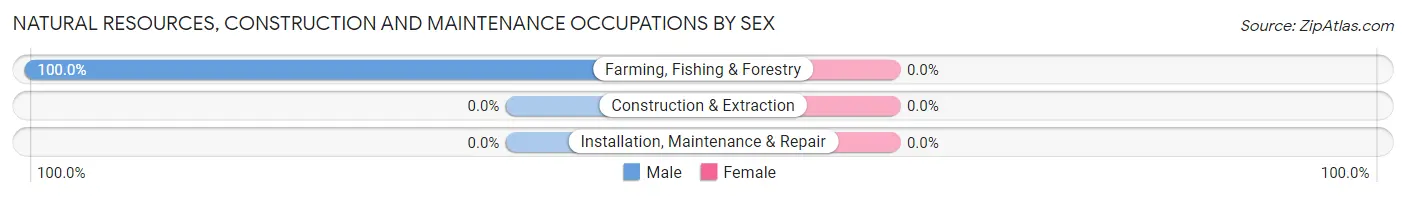
Natural Resources, Construction and Maintenance Occupations by Sex
| Occupation | Male | Female |
| Farming, Fishing & Forestry | 10 (100.0%) | 0 (0.0%) |
| Construction & Extraction | 0 (0.0%) | 0 (0.0%) |
| Installation, Maintenance & Repair | 0 (0.0%) | 0 (0.0%) |
| Total (Category) | 10 (100.0%) | 0 (0.0%) |
| Total (Overall) | 64 (51.6%) | 60 (48.4%) |
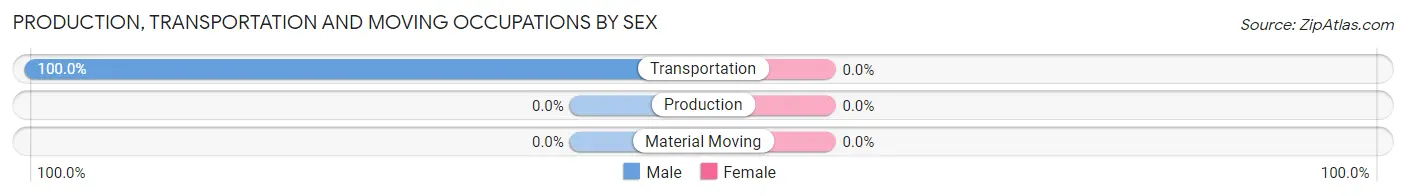
Production, Transportation and Moving Occupations
The most common Production, Transportation and Moving occupations in Dateland are , and Transportation (10 | 8.1%).
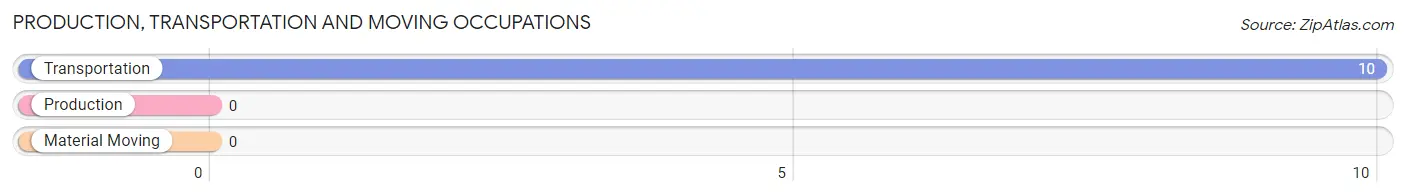
Production, Transportation and Moving Occupations by Sex
| Occupation | Male | Female |
| Production | 0 (0.0%) | 0 (0.0%) |
| Transportation | 10 (100.0%) | 0 (0.0%) |
| Material Moving | 0 (0.0%) | 0 (0.0%) |
| Total (Category) | 10 (100.0%) | 0 (0.0%) |
| Total (Overall) | 64 (51.6%) | 60 (48.4%) |
Employment Industries by Sex in Dateland
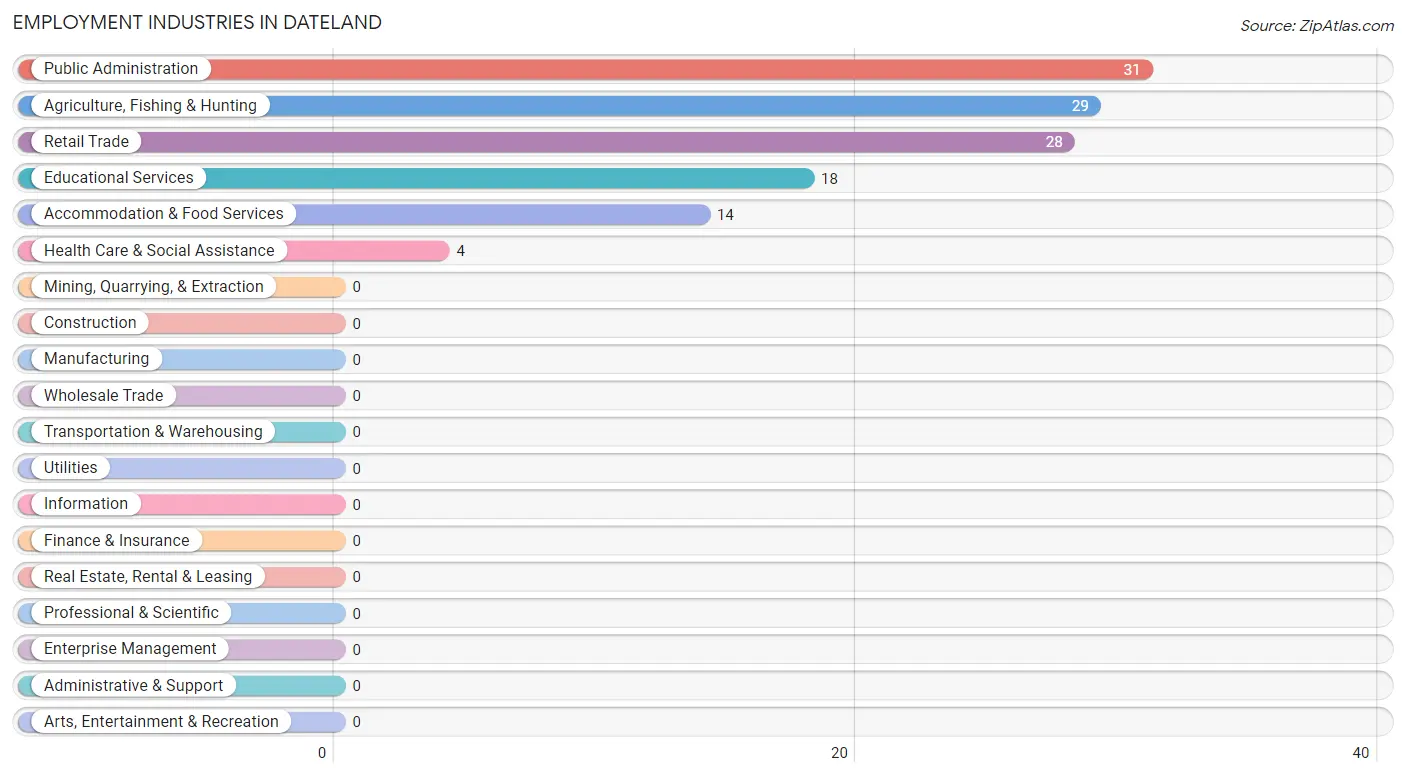
Employment Industries in Dateland
The major employment industries in Dateland include Public Administration (31 | 25.0%), Agriculture, Fishing & Hunting (29 | 23.4%), Retail Trade (28 | 22.6%), Educational Services (18 | 14.5%), and Accommodation & Food Services (14 | 11.3%).
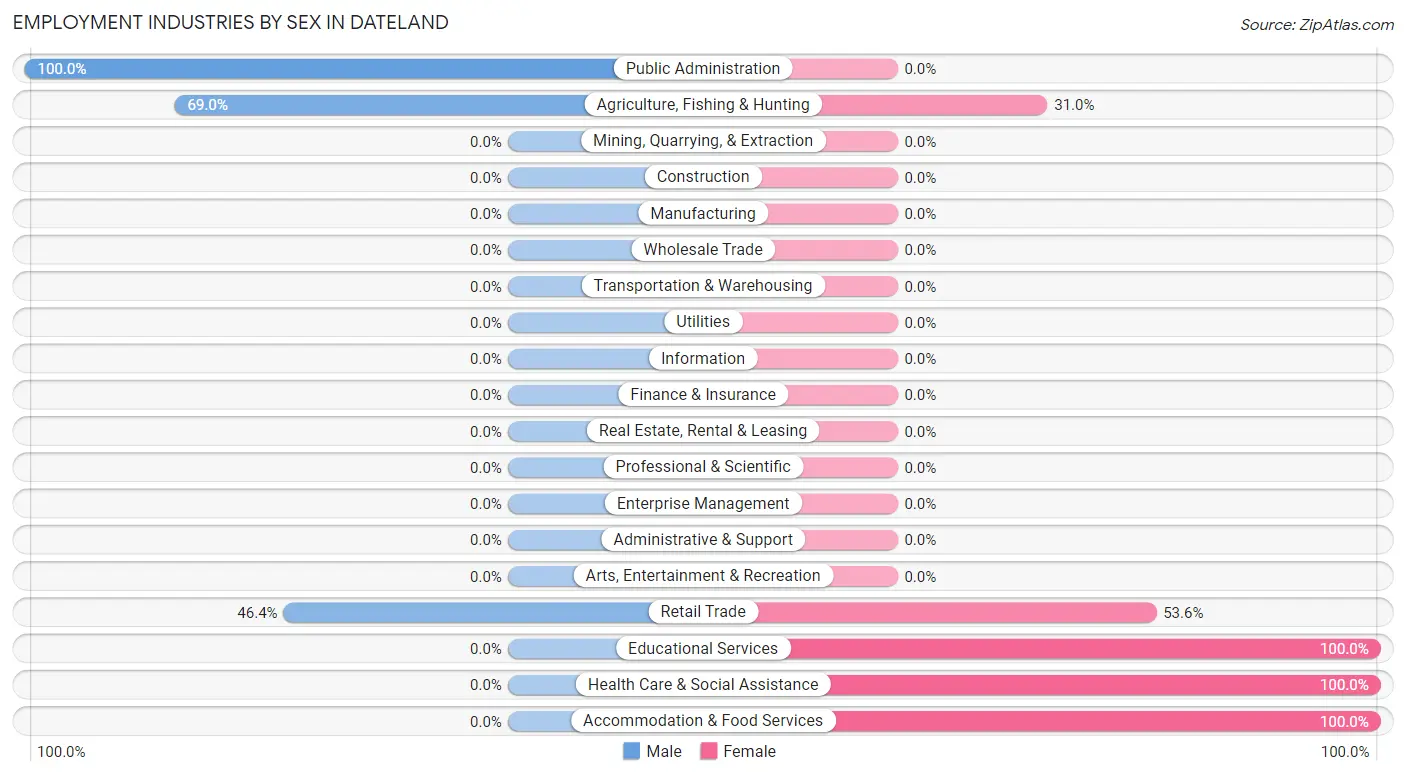
Employment Industries by Sex in Dateland
The Dateland industries that see more men than women are Public Administration (100.0%), Agriculture, Fishing & Hunting (69.0%), and Retail Trade (46.4%), whereas the industries that tend to have a higher number of women are Educational Services (100.0%), Health Care & Social Assistance (100.0%), and Accommodation & Food Services (100.0%).
| Industry | Male | Female |
| Agriculture, Fishing & Hunting | 20 (69.0%) | 9 (31.0%) |
| Mining, Quarrying, & Extraction | 0 (0.0%) | 0 (0.0%) |
| Construction | 0 (0.0%) | 0 (0.0%) |
| Manufacturing | 0 (0.0%) | 0 (0.0%) |
| Wholesale Trade | 0 (0.0%) | 0 (0.0%) |
| Retail Trade | 13 (46.4%) | 15 (53.6%) |
| Transportation & Warehousing | 0 (0.0%) | 0 (0.0%) |
| Utilities | 0 (0.0%) | 0 (0.0%) |
| Information | 0 (0.0%) | 0 (0.0%) |
| Finance & Insurance | 0 (0.0%) | 0 (0.0%) |
| Real Estate, Rental & Leasing | 0 (0.0%) | 0 (0.0%) |
| Professional & Scientific | 0 (0.0%) | 0 (0.0%) |
| Enterprise Management | 0 (0.0%) | 0 (0.0%) |
| Administrative & Support | 0 (0.0%) | 0 (0.0%) |
| Educational Services | 0 (0.0%) | 18 (100.0%) |
| Health Care & Social Assistance | 0 (0.0%) | 4 (100.0%) |
| Arts, Entertainment & Recreation | 0 (0.0%) | 0 (0.0%) |
| Accommodation & Food Services | 0 (0.0%) | 14 (100.0%) |
| Public Administration | 31 (100.0%) | 0 (0.0%) |
| Total | 64 (51.6%) | 60 (48.4%) |
Education in Dateland
School Enrollment in Dateland
The most common levels of schooling among the 114 students in Dateland are elementary school (31 | 27.2%), middle school (25 | 21.9%), and college / undergraduate (24 | 21.0%).
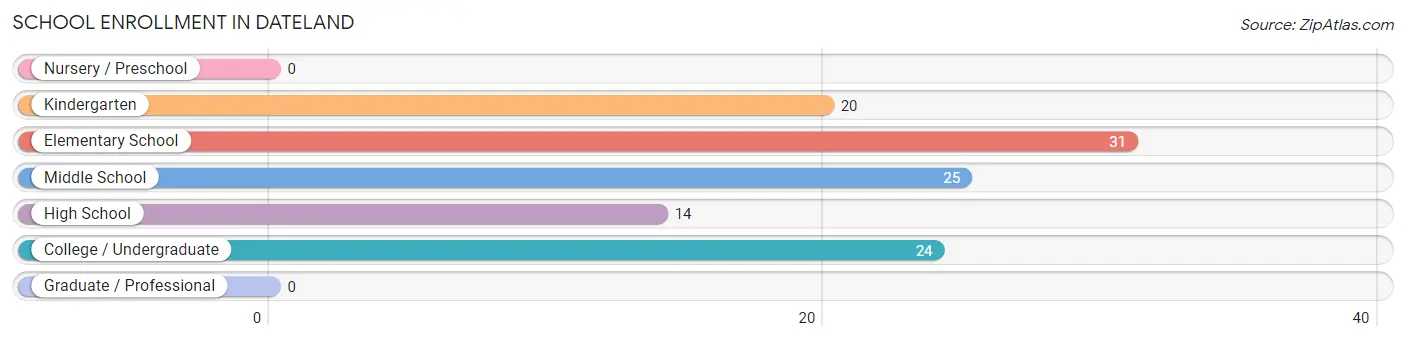
| School Level | # Students | % Students |
| Nursery / Preschool | 0 | 0.0% |
| Kindergarten | 20 | 17.5% |
| Elementary School | 31 | 27.2% |
| Middle School | 25 | 21.9% |
| High School | 14 | 12.3% |
| College / Undergraduate | 24 | 21.0% |
| Graduate / Professional | 0 | 0.0% |
| Total | 114 | 100.0% |
School Enrollment by Age by Funding Source in Dateland
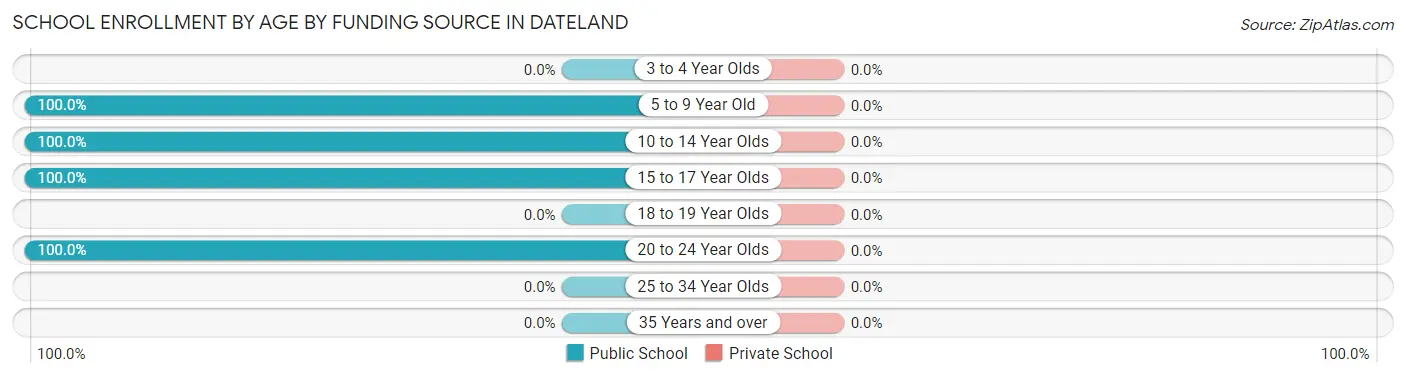
| Age Bracket | Public School | Private School |
| 3 to 4 Year Olds | 0 (0.0%) | 0 (0.0%) |
| 5 to 9 Year Old | 41 (100.0%) | 0 (0.0%) |
| 10 to 14 Year Olds | 35 (100.0%) | 0 (0.0%) |
| 15 to 17 Year Olds | 14 (100.0%) | 0 (0.0%) |
| 18 to 19 Year Olds | 0 (0.0%) | 0 (0.0%) |
| 20 to 24 Year Olds | 24 (100.0%) | 0 (0.0%) |
| 25 to 34 Year Olds | 0 (0.0%) | 0 (0.0%) |
| 35 Years and over | 0 (0.0%) | 0 (0.0%) |
| Total | 114 (100.0%) | 0 (0.0%) |
Educational Attainment by Field of Study in Dateland
Education (11 | 39.3%), business (7 | 25.0%), arts & humanities (6 | 21.4%), and liberal arts & history (4 | 14.3%) are the most common fields of study among 28 individuals in Dateland who have obtained a bachelor's degree or higher.
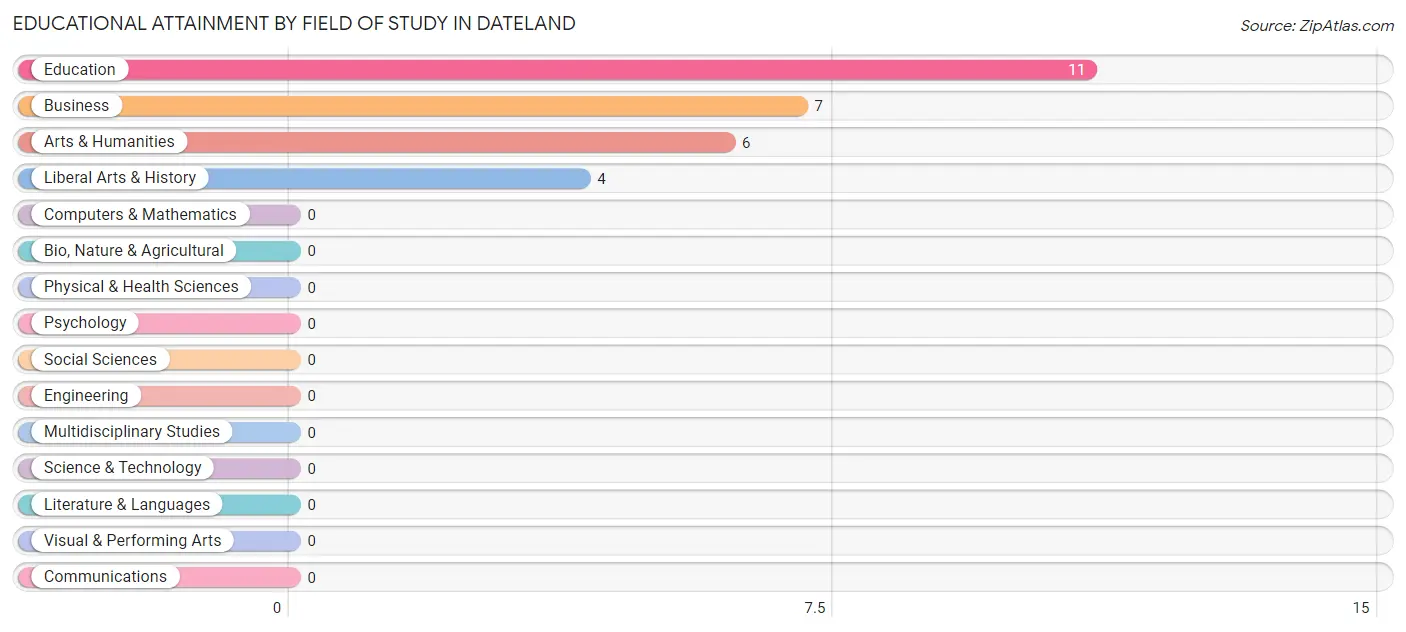
| Field of Study | # Graduates | % Graduates |
| Computers & Mathematics | 0 | 0.0% |
| Bio, Nature & Agricultural | 0 | 0.0% |
| Physical & Health Sciences | 0 | 0.0% |
| Psychology | 0 | 0.0% |
| Social Sciences | 0 | 0.0% |
| Engineering | 0 | 0.0% |
| Multidisciplinary Studies | 0 | 0.0% |
| Science & Technology | 0 | 0.0% |
| Business | 7 | 25.0% |
| Education | 11 | 39.3% |
| Literature & Languages | 0 | 0.0% |
| Liberal Arts & History | 4 | 14.3% |
| Visual & Performing Arts | 0 | 0.0% |
| Communications | 0 | 0.0% |
| Arts & Humanities | 6 | 21.4% |
| Total | 28 | 100.0% |
Transportation & Commute in Dateland
Vehicle Availability by Sex in Dateland
The most prevalent vehicle ownership categories in Dateland are males with 2 vehicles (44, accounting for 68.8%) and females with 2 vehicles (27, making up 83.0%).
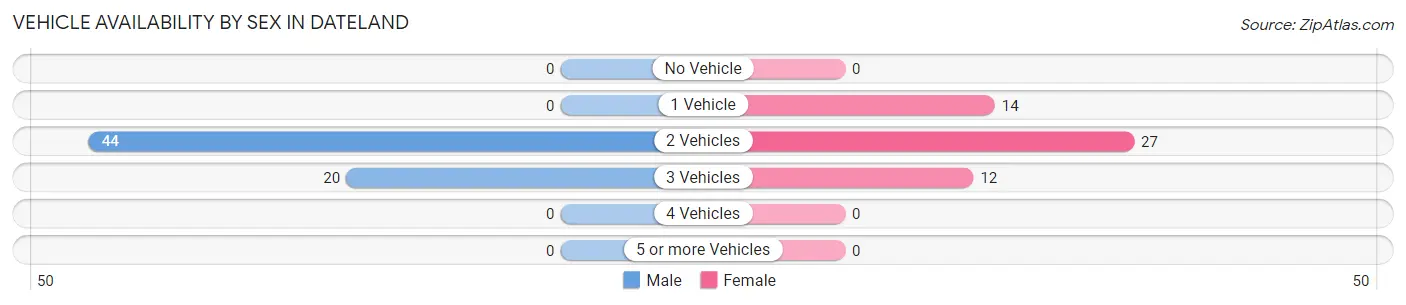
| Vehicles Available | Male | Female |
| No Vehicle | 0 (0.0%) | 0 (0.0%) |
| 1 Vehicle | 0 (0.0%) | 14 (26.4%) |
| 2 Vehicles | 44 (68.8%) | 27 (50.9%) |
| 3 Vehicles | 20 (31.2%) | 12 (22.6%) |
| 4 Vehicles | 0 (0.0%) | 0 (0.0%) |
| 5 or more Vehicles | 0 (0.0%) | 0 (0.0%) |
| Total | 64 (100.0%) | 53 (100.0%) |
Commute Time in Dateland
The most frequently occuring commute durations in Dateland are 60 to 89 minutes (47 commuters, 40.2%), 5 to 9 minutes (38 commuters, 32.5%), and 30 to 34 minutes (19 commuters, 16.2%).
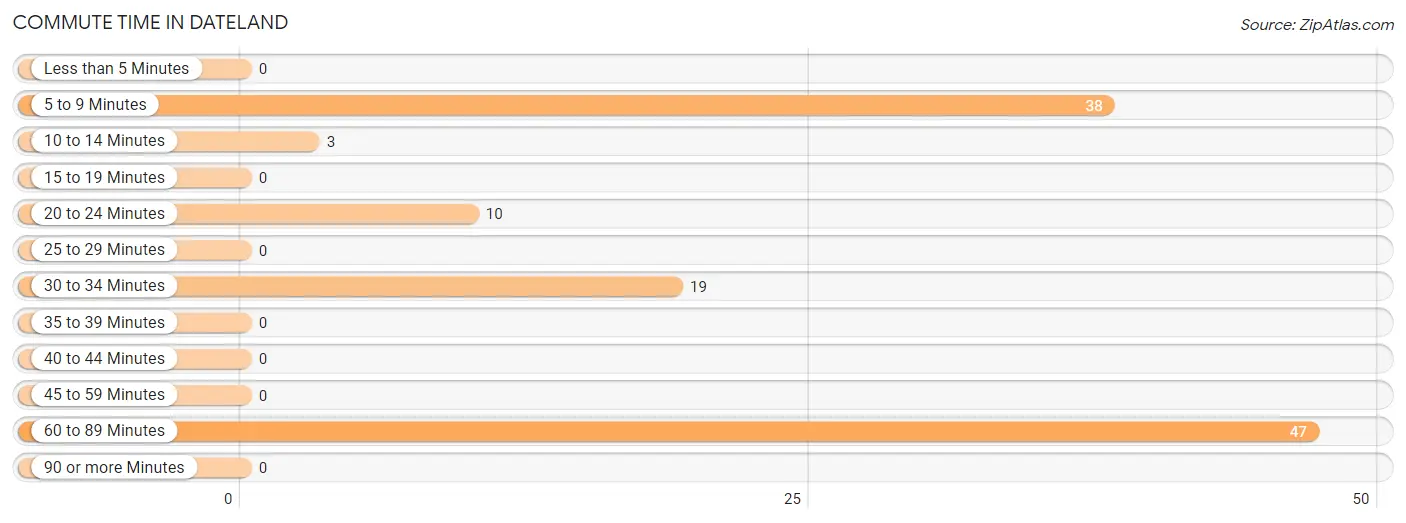
| Commute Time | # Commuters | % Commuters |
| Less than 5 Minutes | 0 | 0.0% |
| 5 to 9 Minutes | 38 | 32.5% |
| 10 to 14 Minutes | 3 | 2.6% |
| 15 to 19 Minutes | 0 | 0.0% |
| 20 to 24 Minutes | 10 | 8.6% |
| 25 to 29 Minutes | 0 | 0.0% |
| 30 to 34 Minutes | 19 | 16.2% |
| 35 to 39 Minutes | 0 | 0.0% |
| 40 to 44 Minutes | 0 | 0.0% |
| 45 to 59 Minutes | 0 | 0.0% |
| 60 to 89 Minutes | 47 | 40.2% |
| 90 or more Minutes | 0 | 0.0% |
Commute Time by Sex in Dateland
The most common commute times in Dateland are 60 to 89 minutes (31 commuters, 48.4%) for males and 5 to 9 minutes (25 commuters, 47.2%) for females.
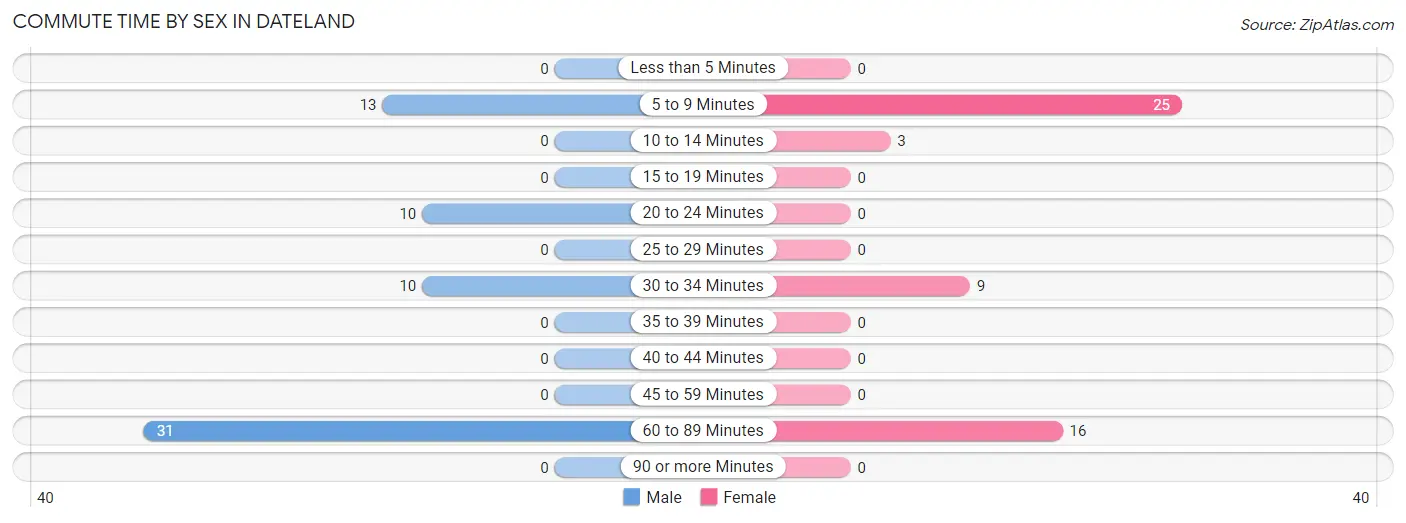
| Commute Time | Male | Female |
| Less than 5 Minutes | 0 (0.0%) | 0 (0.0%) |
| 5 to 9 Minutes | 13 (20.3%) | 25 (47.2%) |
| 10 to 14 Minutes | 0 (0.0%) | 3 (5.7%) |
| 15 to 19 Minutes | 0 (0.0%) | 0 (0.0%) |
| 20 to 24 Minutes | 10 (15.6%) | 0 (0.0%) |
| 25 to 29 Minutes | 0 (0.0%) | 0 (0.0%) |
| 30 to 34 Minutes | 10 (15.6%) | 9 (17.0%) |
| 35 to 39 Minutes | 0 (0.0%) | 0 (0.0%) |
| 40 to 44 Minutes | 0 (0.0%) | 0 (0.0%) |
| 45 to 59 Minutes | 0 (0.0%) | 0 (0.0%) |
| 60 to 89 Minutes | 31 (48.4%) | 16 (30.2%) |
| 90 or more Minutes | 0 (0.0%) | 0 (0.0%) |
Time of Departure to Work by Sex in Dateland
The most frequent times of departure to work in Dateland are 8:00 AM to 8:29 AM (31, 48.4%) for males and 5:30 AM to 5:59 AM (20, 37.7%) for females.
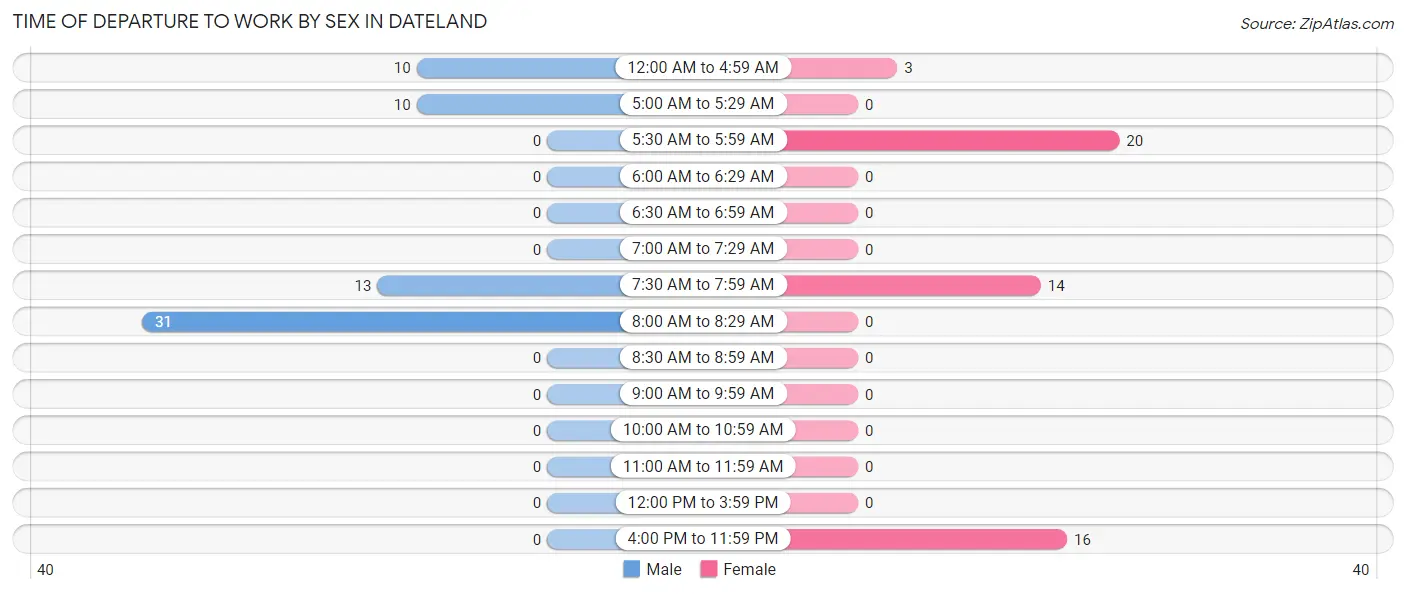
| Time of Departure | Male | Female |
| 12:00 AM to 4:59 AM | 10 (15.6%) | 3 (5.7%) |
| 5:00 AM to 5:29 AM | 10 (15.6%) | 0 (0.0%) |
| 5:30 AM to 5:59 AM | 0 (0.0%) | 20 (37.7%) |
| 6:00 AM to 6:29 AM | 0 (0.0%) | 0 (0.0%) |
| 6:30 AM to 6:59 AM | 0 (0.0%) | 0 (0.0%) |
| 7:00 AM to 7:29 AM | 0 (0.0%) | 0 (0.0%) |
| 7:30 AM to 7:59 AM | 13 (20.3%) | 14 (26.4%) |
| 8:00 AM to 8:29 AM | 31 (48.4%) | 0 (0.0%) |
| 8:30 AM to 8:59 AM | 0 (0.0%) | 0 (0.0%) |
| 9:00 AM to 9:59 AM | 0 (0.0%) | 0 (0.0%) |
| 10:00 AM to 10:59 AM | 0 (0.0%) | 0 (0.0%) |
| 11:00 AM to 11:59 AM | 0 (0.0%) | 0 (0.0%) |
| 12:00 PM to 3:59 PM | 0 (0.0%) | 0 (0.0%) |
| 4:00 PM to 11:59 PM | 0 (0.0%) | 16 (30.2%) |
| Total | 64 (100.0%) | 53 (100.0%) |
Housing Occupancy in Dateland
Occupancy by Ownership in Dateland
Of the total 131 dwellings in Dateland, owner-occupied units account for 91 (69.5%), while renter-occupied units make up 40 (30.5%).
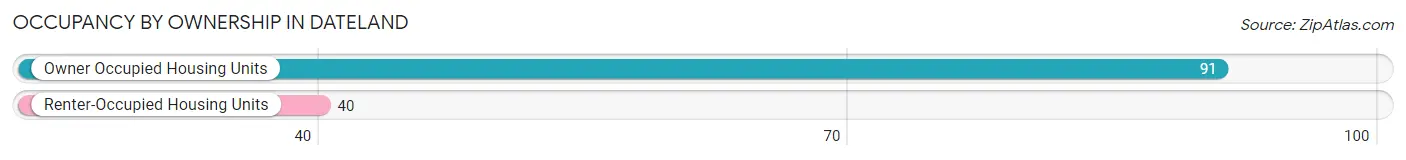
| Occupancy | # Housing Units | % Housing Units |
| Owner Occupied Housing Units | 91 | 69.5% |
| Renter-Occupied Housing Units | 40 | 30.5% |
| Total Occupied Housing Units | 131 | 100.0% |
Occupancy by Household Size in Dateland
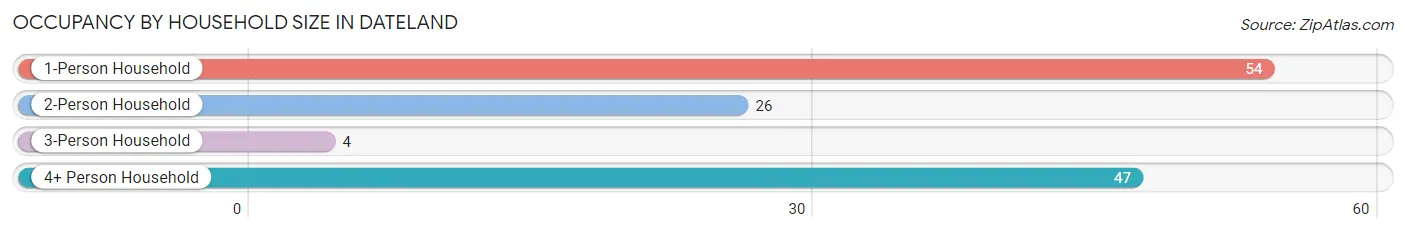
| Household Size | # Housing Units | % Housing Units |
| 1-Person Household | 54 | 41.2% |
| 2-Person Household | 26 | 19.9% |
| 3-Person Household | 4 | 3.0% |
| 4+ Person Household | 47 | 35.9% |
| Total Housing Units | 131 | 100.0% |
Occupancy by Ownership by Household Size in Dateland
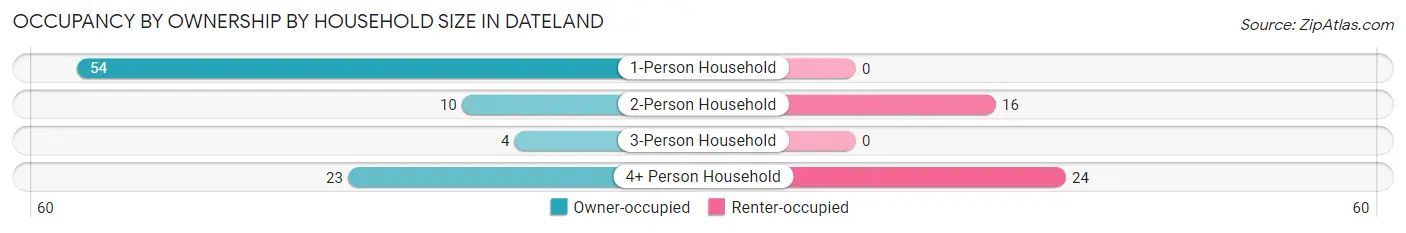
| Household Size | Owner-occupied | Renter-occupied |
| 1-Person Household | 54 (100.0%) | 0 (0.0%) |
| 2-Person Household | 10 (38.5%) | 16 (61.5%) |
| 3-Person Household | 4 (100.0%) | 0 (0.0%) |
| 4+ Person Household | 23 (48.9%) | 24 (51.1%) |
| Total Housing Units | 91 (69.5%) | 40 (30.5%) |
Occupancy by Educational Attainment in Dateland
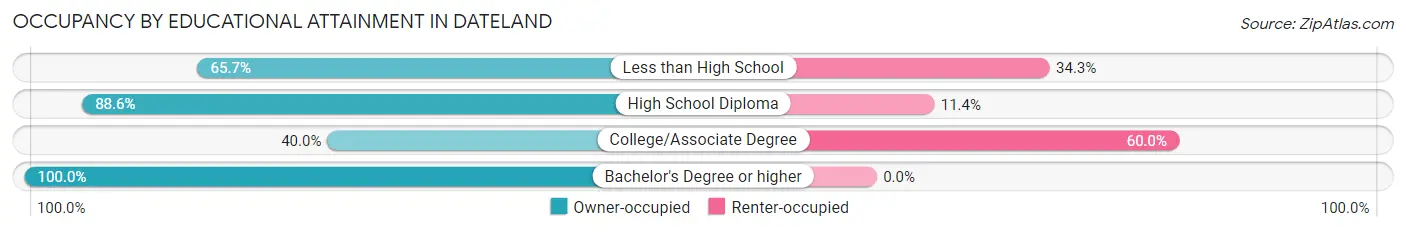
| Household Size | Owner-occupied | Renter-occupied |
| Less than High School | 23 (65.7%) | 12 (34.3%) |
| High School Diploma | 31 (88.6%) | 4 (11.4%) |
| College/Associate Degree | 16 (40.0%) | 24 (60.0%) |
| Bachelor's Degree or higher | 21 (100.0%) | 0 (0.0%) |
Occupancy by Age of Householder in Dateland
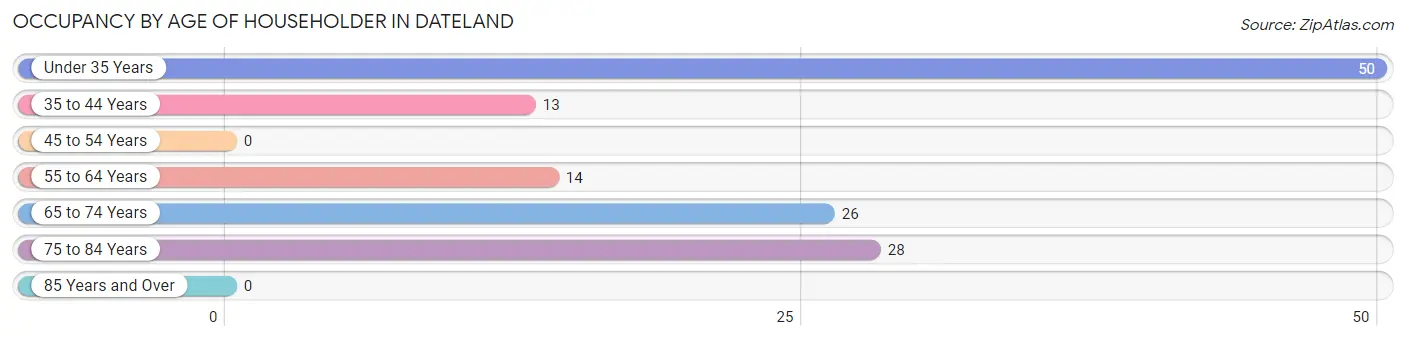
| Age Bracket | # Households | % Households |
| Under 35 Years | 50 | 38.2% |
| 35 to 44 Years | 13 | 9.9% |
| 45 to 54 Years | 0 | 0.0% |
| 55 to 64 Years | 14 | 10.7% |
| 65 to 74 Years | 26 | 19.9% |
| 75 to 84 Years | 28 | 21.4% |
| 85 Years and Over | 0 | 0.0% |
| Total | 131 | 100.0% |
Housing Finances in Dateland
Median Income by Occupancy in Dateland
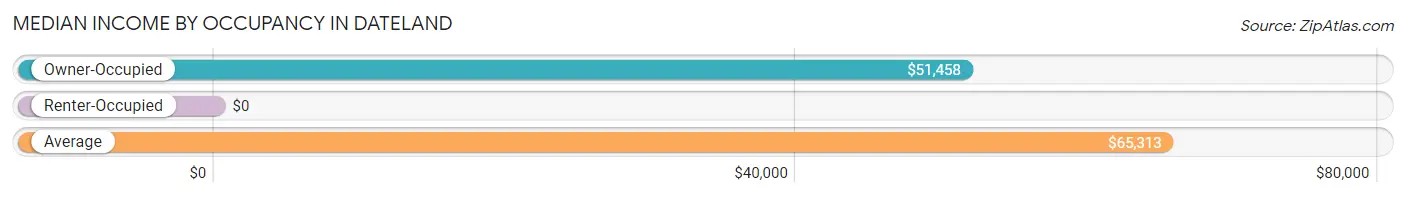
| Occupancy Type | # Households | Median Income |
| Owner-Occupied | 91 (69.5%) | $51,458 |
| Renter-Occupied | 40 (30.5%) | $0 |
| Average | 131 (100.0%) | $65,313 |
Occupancy by Householder Income Bracket in Dateland
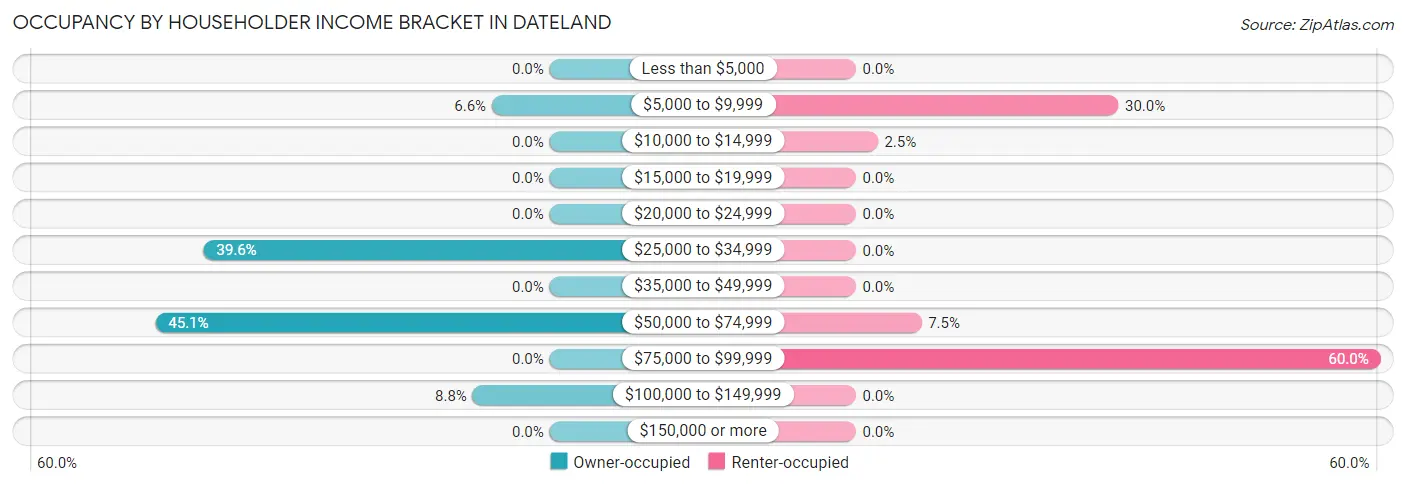
| Income Bracket | Owner-occupied | Renter-occupied |
| Less than $5,000 | 0 (0.0%) | 0 (0.0%) |
| $5,000 to $9,999 | 6 (6.6%) | 12 (30.0%) |
| $10,000 to $14,999 | 0 (0.0%) | 1 (2.5%) |
| $15,000 to $19,999 | 0 (0.0%) | 0 (0.0%) |
| $20,000 to $24,999 | 0 (0.0%) | 0 (0.0%) |
| $25,000 to $34,999 | 36 (39.6%) | 0 (0.0%) |
| $35,000 to $49,999 | 0 (0.0%) | 0 (0.0%) |
| $50,000 to $74,999 | 41 (45.1%) | 3 (7.5%) |
| $75,000 to $99,999 | 0 (0.0%) | 24 (60.0%) |
| $100,000 to $149,999 | 8 (8.8%) | 0 (0.0%) |
| $150,000 or more | 0 (0.0%) | 0 (0.0%) |
| Total | 91 (100.0%) | 40 (100.0%) |
Monthly Housing Cost Tiers in Dateland
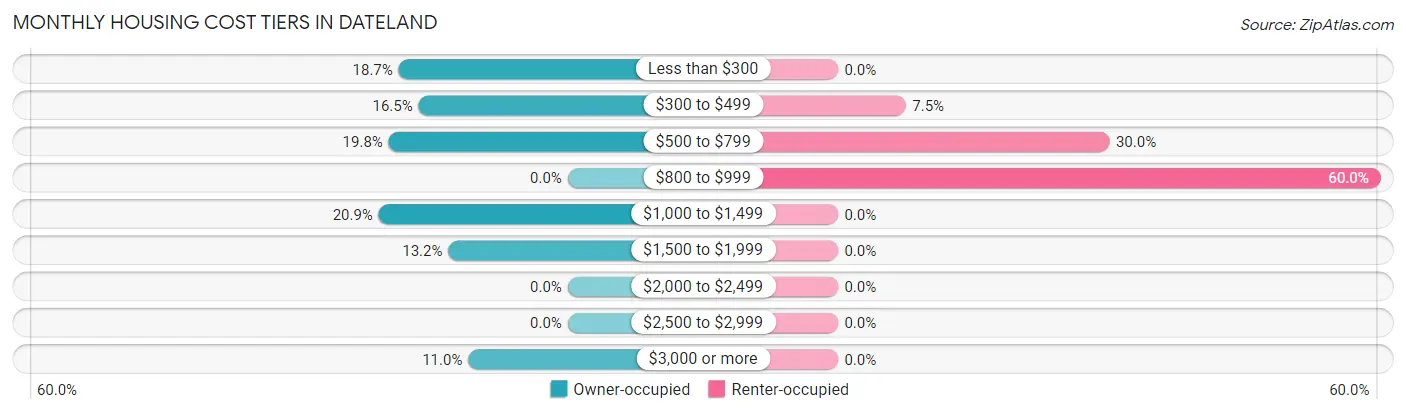
| Monthly Cost | Owner-occupied | Renter-occupied |
| Less than $300 | 17 (18.7%) | 0 (0.0%) |
| $300 to $499 | 15 (16.5%) | 3 (7.5%) |
| $500 to $799 | 18 (19.8%) | 12 (30.0%) |
| $800 to $999 | 0 (0.0%) | 24 (60.0%) |
| $1,000 to $1,499 | 19 (20.9%) | 0 (0.0%) |
| $1,500 to $1,999 | 12 (13.2%) | 0 (0.0%) |
| $2,000 to $2,499 | 0 (0.0%) | 0 (0.0%) |
| $2,500 to $2,999 | 0 (0.0%) | 0 (0.0%) |
| $3,000 or more | 10 (11.0%) | 0 (0.0%) |
| Total | 91 (100.0%) | 40 (100.0%) |
Physical Housing Characteristics in Dateland
Housing Structures in Dateland
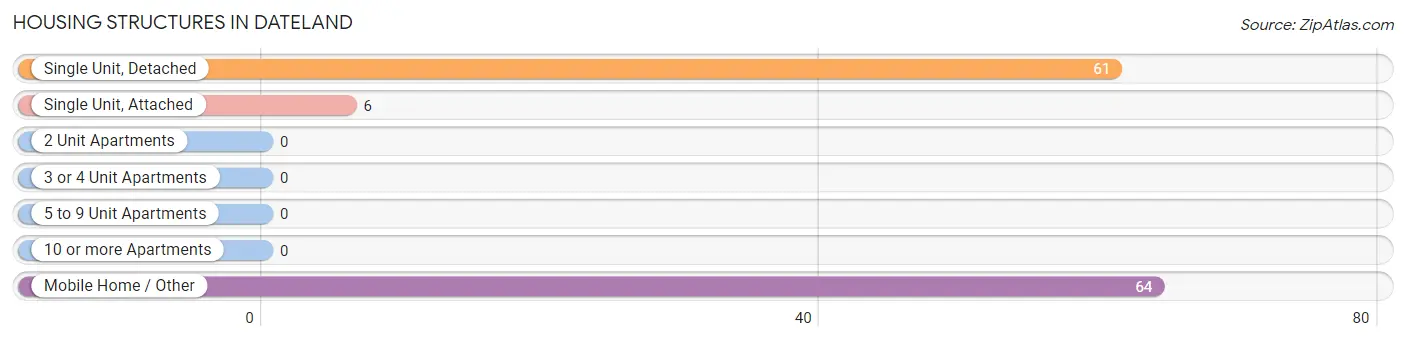
| Structure Type | # Housing Units | % Housing Units |
| Single Unit, Detached | 61 | 46.6% |
| Single Unit, Attached | 6 | 4.6% |
| 2 Unit Apartments | 0 | 0.0% |
| 3 or 4 Unit Apartments | 0 | 0.0% |
| 5 to 9 Unit Apartments | 0 | 0.0% |
| 10 or more Apartments | 0 | 0.0% |
| Mobile Home / Other | 64 | 48.8% |
| Total | 131 | 100.0% |
Housing Structures by Occupancy in Dateland
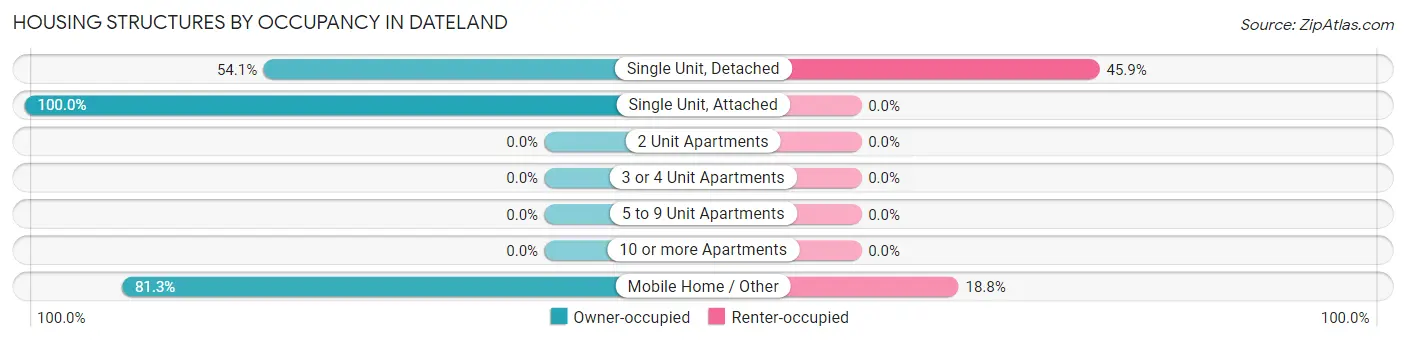
| Structure Type | Owner-occupied | Renter-occupied |
| Single Unit, Detached | 33 (54.1%) | 28 (45.9%) |
| Single Unit, Attached | 6 (100.0%) | 0 (0.0%) |
| 2 Unit Apartments | 0 (0.0%) | 0 (0.0%) |
| 3 or 4 Unit Apartments | 0 (0.0%) | 0 (0.0%) |
| 5 to 9 Unit Apartments | 0 (0.0%) | 0 (0.0%) |
| 10 or more Apartments | 0 (0.0%) | 0 (0.0%) |
| Mobile Home / Other | 52 (81.2%) | 12 (18.8%) |
| Total | 91 (69.5%) | 40 (30.5%) |
Housing Structures by Number of Rooms in Dateland
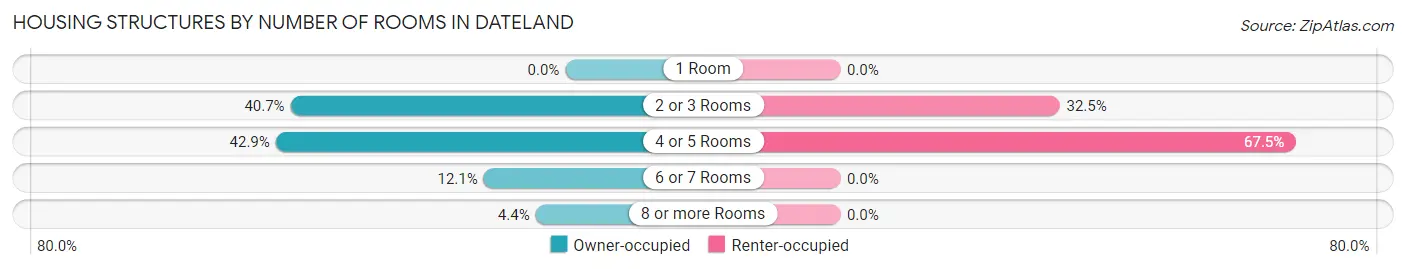
| Number of Rooms | Owner-occupied | Renter-occupied |
| 1 Room | 0 (0.0%) | 0 (0.0%) |
| 2 or 3 Rooms | 37 (40.7%) | 13 (32.5%) |
| 4 or 5 Rooms | 39 (42.9%) | 27 (67.5%) |
| 6 or 7 Rooms | 11 (12.1%) | 0 (0.0%) |
| 8 or more Rooms | 4 (4.4%) | 0 (0.0%) |
| Total | 91 (100.0%) | 40 (100.0%) |
Housing Structure by Heating Type in Dateland
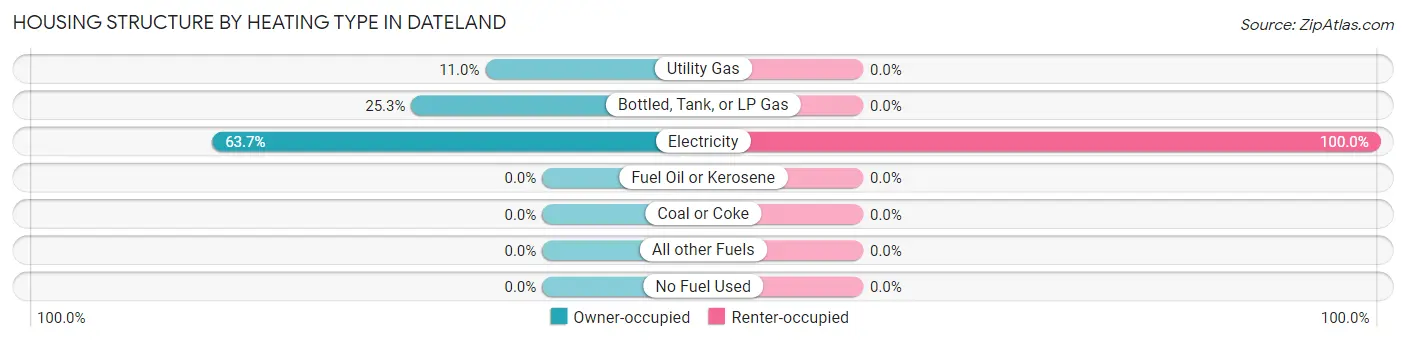
| Heating Type | Owner-occupied | Renter-occupied |
| Utility Gas | 10 (11.0%) | 0 (0.0%) |
| Bottled, Tank, or LP Gas | 23 (25.3%) | 0 (0.0%) |
| Electricity | 58 (63.7%) | 40 (100.0%) |
| Fuel Oil or Kerosene | 0 (0.0%) | 0 (0.0%) |
| Coal or Coke | 0 (0.0%) | 0 (0.0%) |
| All other Fuels | 0 (0.0%) | 0 (0.0%) |
| No Fuel Used | 0 (0.0%) | 0 (0.0%) |
| Total | 91 (100.0%) | 40 (100.0%) |
Household Vehicle Usage in Dateland
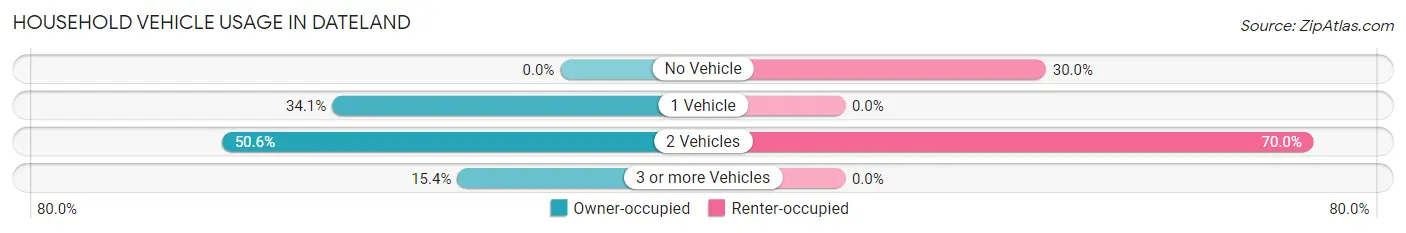
| Vehicles per Household | Owner-occupied | Renter-occupied |
| No Vehicle | 0 (0.0%) | 12 (30.0%) |
| 1 Vehicle | 31 (34.1%) | 0 (0.0%) |
| 2 Vehicles | 46 (50.5%) | 28 (70.0%) |
| 3 or more Vehicles | 14 (15.4%) | 0 (0.0%) |
| Total | 91 (100.0%) | 40 (100.0%) |
Real Estate & Mortgages in Dateland
Real Estate and Mortgage Overview in Dateland
| Characteristic | Without Mortgage | With Mortgage |
| Housing Units | 50 | 41 |
| Median Property Value | - | - |
| Median Household Income | $30,000 | $0 |
| Monthly Housing Costs | $453 | $10 |
| Real Estate Taxes | $350 | $0 |
Property Value by Mortgage Status in Dateland
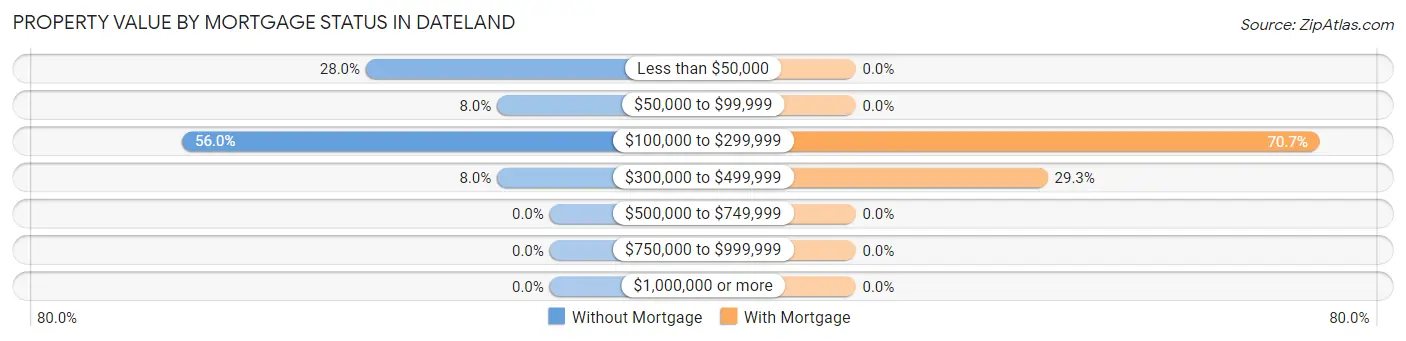
| Property Value | Without Mortgage | With Mortgage |
| Less than $50,000 | 14 (28.0%) | 0 (0.0%) |
| $50,000 to $99,999 | 4 (8.0%) | 0 (0.0%) |
| $100,000 to $299,999 | 28 (56.0%) | 29 (70.7%) |
| $300,000 to $499,999 | 4 (8.0%) | 12 (29.3%) |
| $500,000 to $749,999 | 0 (0.0%) | 0 (0.0%) |
| $750,000 to $999,999 | 0 (0.0%) | 0 (0.0%) |
| $1,000,000 or more | 0 (0.0%) | 0 (0.0%) |
| Total | 50 (100.0%) | 41 (100.0%) |
Household Income by Mortgage Status in Dateland
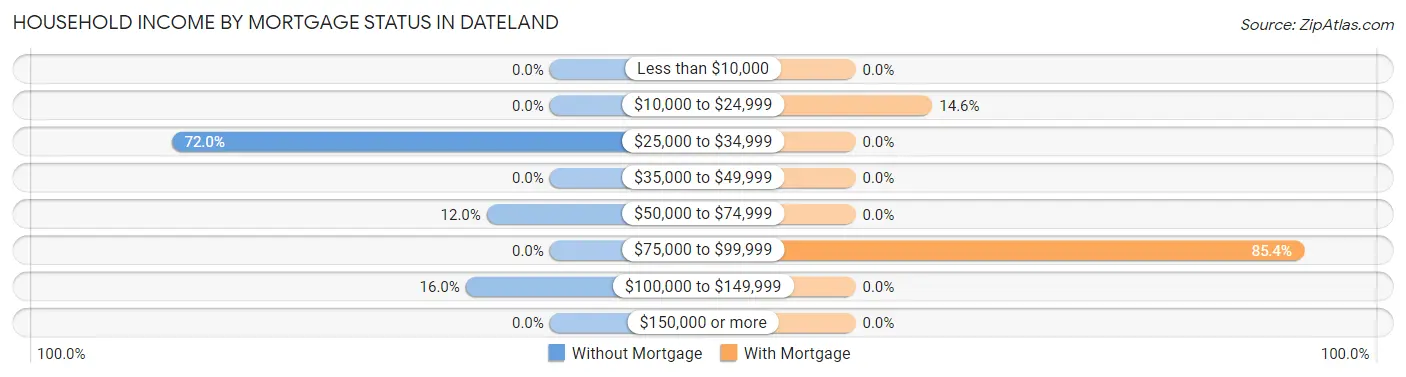
| Household Income | Without Mortgage | With Mortgage |
| Less than $10,000 | 0 (0.0%) | 0 (0.0%) |
| $10,000 to $24,999 | 0 (0.0%) | 6 (14.6%) |
| $25,000 to $34,999 | 36 (72.0%) | 0 (0.0%) |
| $35,000 to $49,999 | 0 (0.0%) | 0 (0.0%) |
| $50,000 to $74,999 | 6 (12.0%) | 0 (0.0%) |
| $75,000 to $99,999 | 0 (0.0%) | 35 (85.4%) |
| $100,000 to $149,999 | 8 (16.0%) | 0 (0.0%) |
| $150,000 or more | 0 (0.0%) | 0 (0.0%) |
| Total | 50 (100.0%) | 41 (100.0%) |
Property Value to Household Income Ratio in Dateland
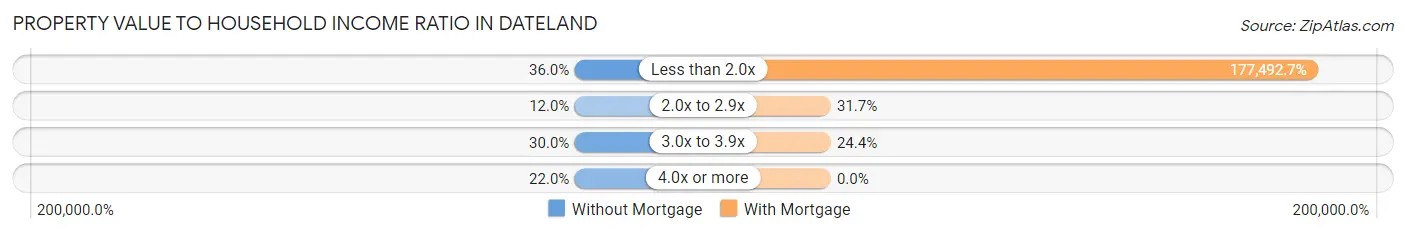
| Value-to-Income Ratio | Without Mortgage | With Mortgage |
| Less than 2.0x | 18 (36.0%) | 72,772 (177,492.7%) |
| 2.0x to 2.9x | 6 (12.0%) | 13 (31.7%) |
| 3.0x to 3.9x | 15 (30.0%) | 10 (24.4%) |
| 4.0x or more | 11 (22.0%) | 0 (0.0%) |
| Total | 50 (100.0%) | 41 (100.0%) |
Real Estate Taxes by Mortgage Status in Dateland
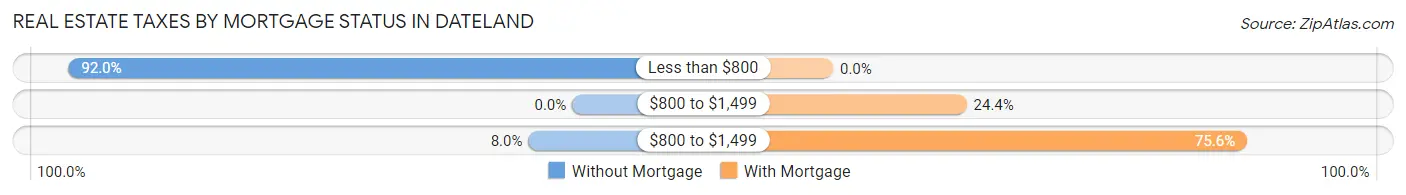
| Property Taxes | Without Mortgage | With Mortgage |
| Less than $800 | 46 (92.0%) | 0 (0.0%) |
| $800 to $1,499 | 0 (0.0%) | 10 (24.4%) |
| $800 to $1,499 | 4 (8.0%) | 31 (75.6%) |
| Total | 50 (100.0%) | 41 (100.0%) |
Health & Disability in Dateland
Health Insurance Coverage by Age in Dateland
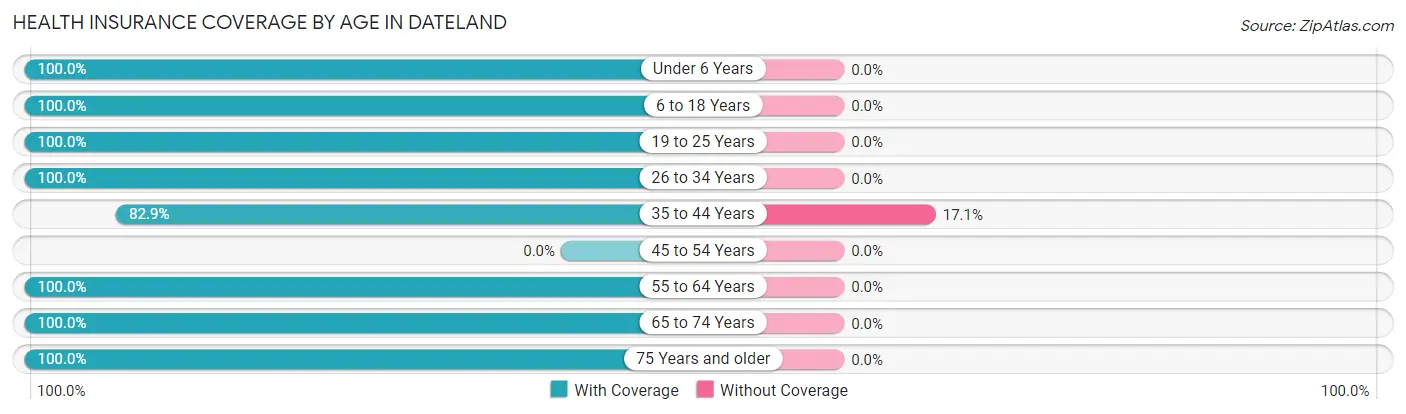
| Age Bracket | With Coverage | Without Coverage |
| Under 6 Years | 41 (100.0%) | 0 (0.0%) |
| 6 to 18 Years | 81 (100.0%) | 0 (0.0%) |
| 19 to 25 Years | 55 (100.0%) | 0 (0.0%) |
| 26 to 34 Years | 26 (100.0%) | 0 (0.0%) |
| 35 to 44 Years | 34 (82.9%) | 7 (17.1%) |
| 45 to 54 Years | 0 (0.0%) | 0 (0.0%) |
| 55 to 64 Years | 43 (100.0%) | 0 (0.0%) |
| 65 to 74 Years | 26 (100.0%) | 0 (0.0%) |
| 75 Years and older | 28 (100.0%) | 0 (0.0%) |
| Total | 334 (98.0%) | 7 (2.1%) |
Health Insurance Coverage by Citizenship Status in Dateland
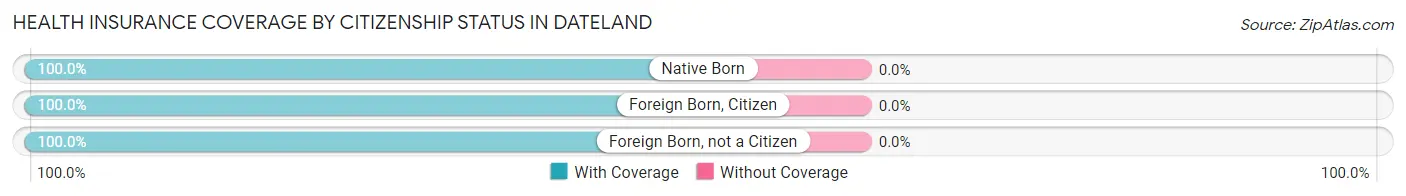
| Citizenship Status | With Coverage | Without Coverage |
| Native Born | 41 (100.0%) | 0 (0.0%) |
| Foreign Born, Citizen | 81 (100.0%) | 0 (0.0%) |
| Foreign Born, not a Citizen | 55 (100.0%) | 0 (0.0%) |
Health Insurance Coverage by Household Income in Dateland
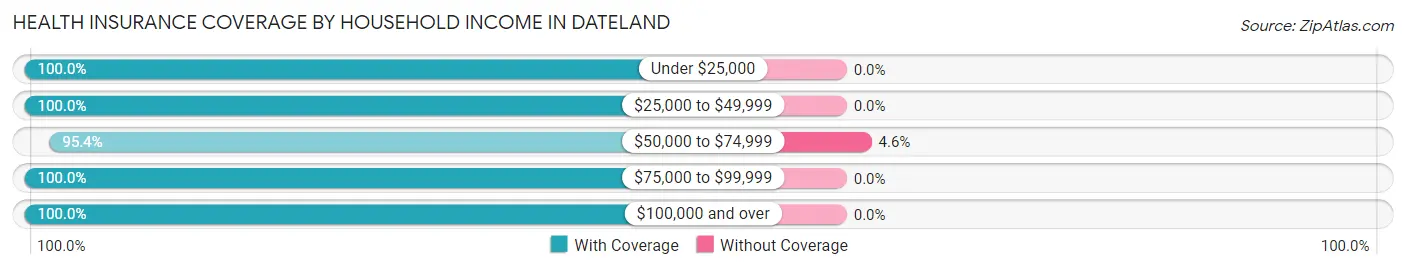
| Household Income | With Coverage | Without Coverage |
| Under $25,000 | 40 (100.0%) | 0 (0.0%) |
| $25,000 to $49,999 | 36 (100.0%) | 0 (0.0%) |
| $50,000 to $74,999 | 144 (95.4%) | 7 (4.6%) |
| $75,000 to $99,999 | 96 (100.0%) | 0 (0.0%) |
| $100,000 and over | 18 (100.0%) | 0 (0.0%) |
Public vs Private Health Insurance Coverage by Age in Dateland
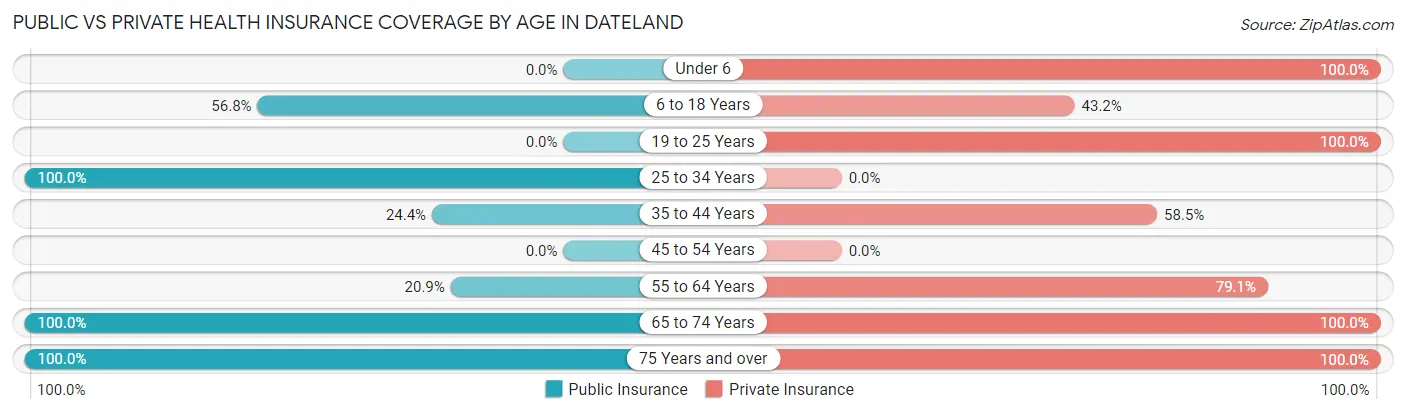
| Age Bracket | Public Insurance | Private Insurance |
| Under 6 | 0 (0.0%) | 41 (100.0%) |
| 6 to 18 Years | 46 (56.8%) | 35 (43.2%) |
| 19 to 25 Years | 0 (0.0%) | 55 (100.0%) |
| 25 to 34 Years | 26 (100.0%) | 0 (0.0%) |
| 35 to 44 Years | 10 (24.4%) | 24 (58.5%) |
| 45 to 54 Years | 0 (0.0%) | 0 (0.0%) |
| 55 to 64 Years | 9 (20.9%) | 34 (79.1%) |
| 65 to 74 Years | 26 (100.0%) | 26 (100.0%) |
| 75 Years and over | 28 (100.0%) | 28 (100.0%) |
| Total | 145 (42.5%) | 243 (71.3%) |
Disability Status by Sex by Age in Dateland
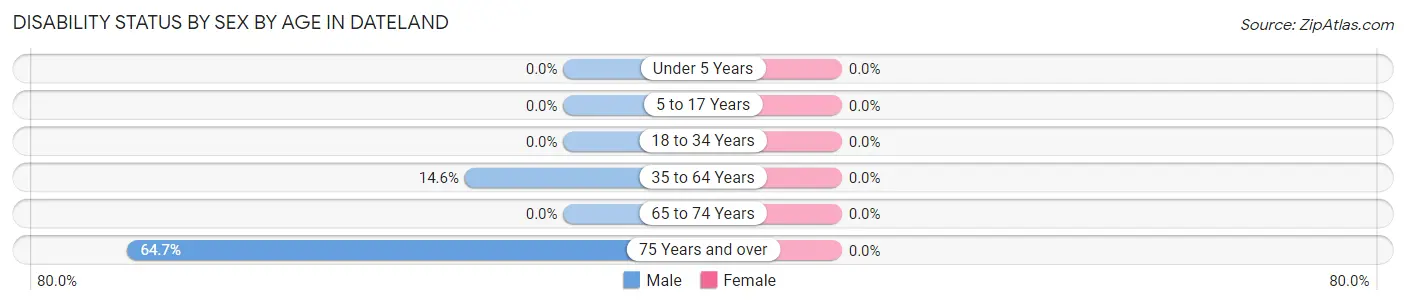
| Age Bracket | Male | Female |
| Under 5 Years | 0 (0.0%) | 0 (0.0%) |
| 5 to 17 Years | 0 (0.0%) | 0 (0.0%) |
| 18 to 34 Years | 0 (0.0%) | 0 (0.0%) |
| 35 to 64 Years | 6 (14.6%) | 0 (0.0%) |
| 65 to 74 Years | 0 (0.0%) | 0 (0.0%) |
| 75 Years and over | 11 (64.7%) | 0 (0.0%) |
Disability Class by Sex by Age in Dateland
Disability Class: Hearing Difficulty
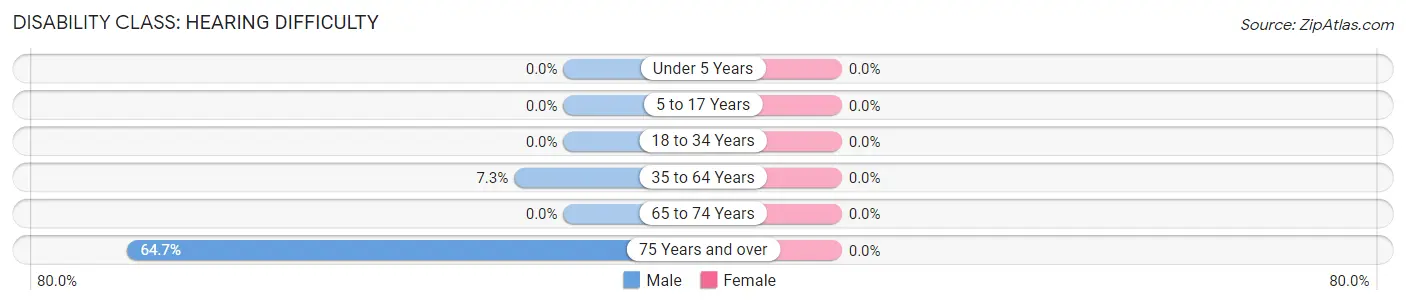
| Age Bracket | Male | Female |
| Under 5 Years | 0 (0.0%) | 0 (0.0%) |
| 5 to 17 Years | 0 (0.0%) | 0 (0.0%) |
| 18 to 34 Years | 0 (0.0%) | 0 (0.0%) |
| 35 to 64 Years | 3 (7.3%) | 0 (0.0%) |
| 65 to 74 Years | 0 (0.0%) | 0 (0.0%) |
| 75 Years and over | 11 (64.7%) | 0 (0.0%) |
Disability Class: Vision Difficulty
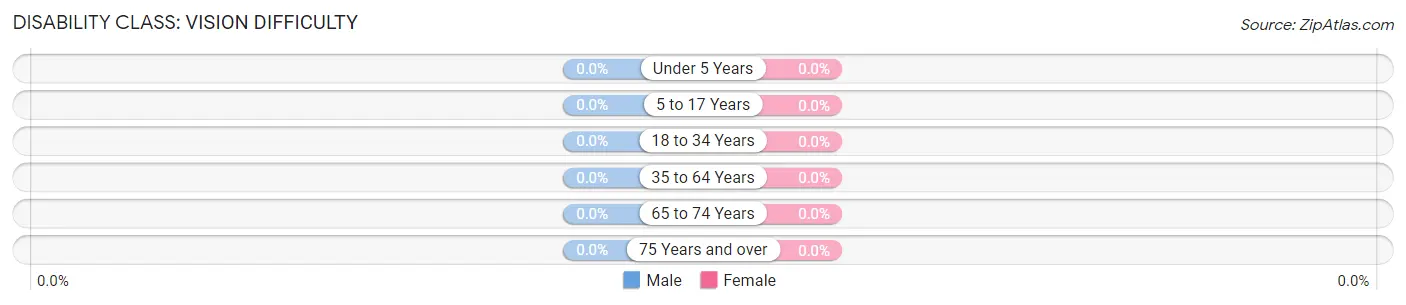
| Age Bracket | Male | Female |
| Under 5 Years | 0 (0.0%) | 0 (0.0%) |
| 5 to 17 Years | 0 (0.0%) | 0 (0.0%) |
| 18 to 34 Years | 0 (0.0%) | 0 (0.0%) |
| 35 to 64 Years | 0 (0.0%) | 0 (0.0%) |
| 65 to 74 Years | 0 (0.0%) | 0 (0.0%) |
| 75 Years and over | 0 (0.0%) | 0 (0.0%) |
Disability Class: Cognitive Difficulty
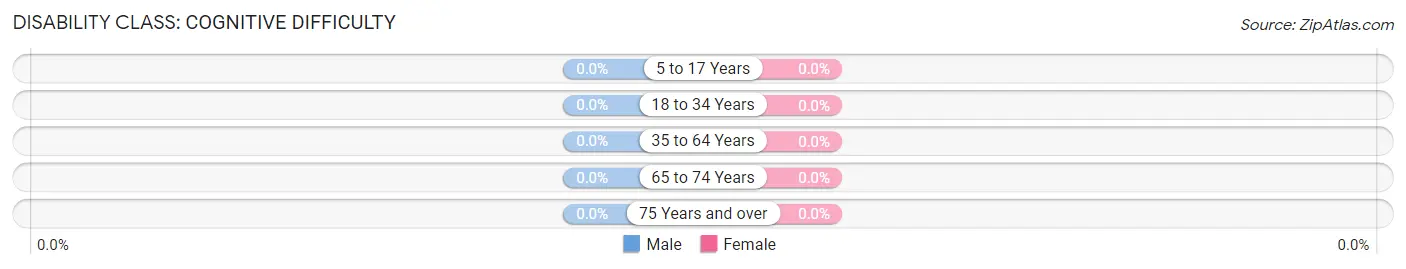
| Age Bracket | Male | Female |
| 5 to 17 Years | 0 (0.0%) | 0 (0.0%) |
| 18 to 34 Years | 0 (0.0%) | 0 (0.0%) |
| 35 to 64 Years | 0 (0.0%) | 0 (0.0%) |
| 65 to 74 Years | 0 (0.0%) | 0 (0.0%) |
| 75 Years and over | 0 (0.0%) | 0 (0.0%) |
Disability Class: Ambulatory Difficulty
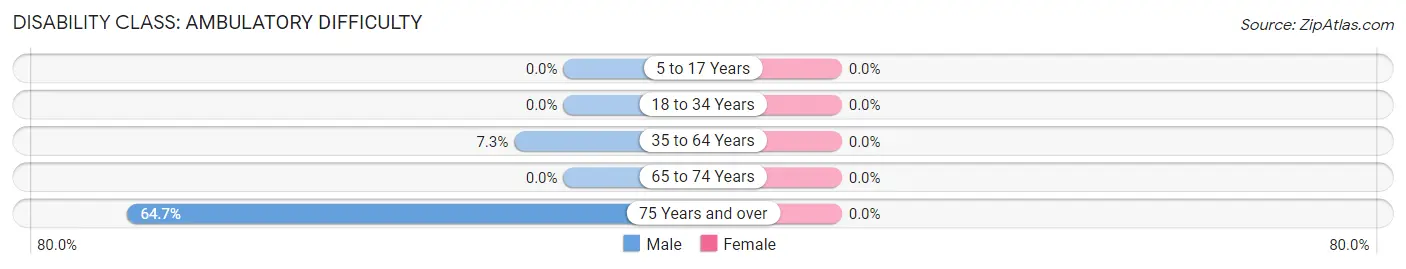
| Age Bracket | Male | Female |
| 5 to 17 Years | 0 (0.0%) | 0 (0.0%) |
| 18 to 34 Years | 0 (0.0%) | 0 (0.0%) |
| 35 to 64 Years | 3 (7.3%) | 0 (0.0%) |
| 65 to 74 Years | 0 (0.0%) | 0 (0.0%) |
| 75 Years and over | 11 (64.7%) | 0 (0.0%) |
Disability Class: Self-Care Difficulty
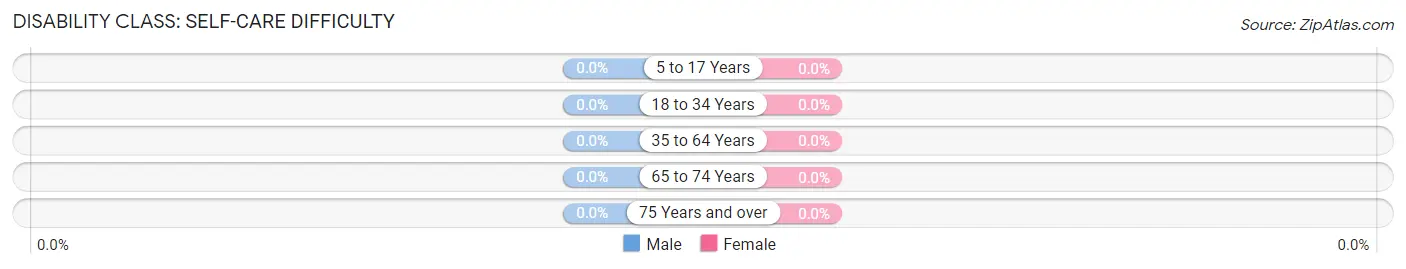
| Age Bracket | Male | Female |
| 5 to 17 Years | 0 (0.0%) | 0 (0.0%) |
| 18 to 34 Years | 0 (0.0%) | 0 (0.0%) |
| 35 to 64 Years | 0 (0.0%) | 0 (0.0%) |
| 65 to 74 Years | 0 (0.0%) | 0 (0.0%) |
| 75 Years and over | 0 (0.0%) | 0 (0.0%) |
Technology Access in Dateland
Computing Device Access in Dateland
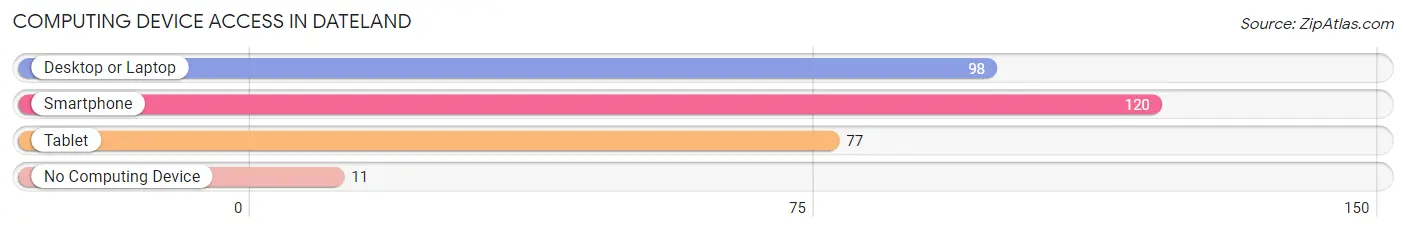
| Device Type | # Households | % Households |
| Desktop or Laptop | 98 | 74.8% |
| Smartphone | 120 | 91.6% |
| Tablet | 77 | 58.8% |
| No Computing Device | 11 | 8.4% |
| Total | 131 | 100.0% |
Internet Access in Dateland
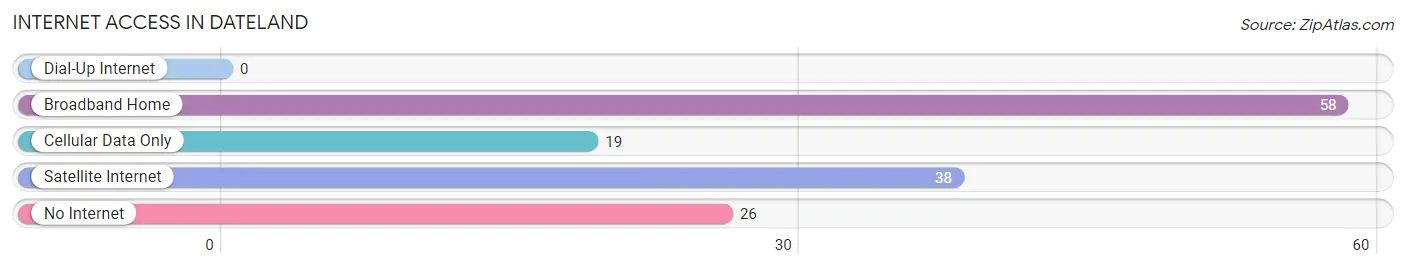
| Internet Type | # Households | % Households |
| Dial-Up Internet | 0 | 0.0% |
| Broadband Home | 58 | 44.3% |
| Cellular Data Only | 19 | 14.5% |
| Satellite Internet | 38 | 29.0% |
| No Internet | 26 | 19.9% |
| Total | 131 | 100.0% |
Dateland Summary
Dateland, Arizona is a small unincorporated community located in Yuma County, Arizona. It is situated along Interstate 8, approximately halfway between Yuma and Gila Bend. The town is known for its date farms, which produce a variety of dates, including Deglet Noor, Medjool, and Zahidi.
History
Dateland was founded in the early 1900s by a group of settlers from the Middle East. The settlers were attracted to the area by the warm climate and the abundance of water from the nearby Colorado River. The settlers began to cultivate date palms, which quickly became the main crop of the area. The town was officially incorporated in 1912 and was named after the date farms.
Geography
Dateland is located in the Sonoran Desert, which is characterized by hot, dry summers and mild winters. The town is situated along Interstate 8, approximately halfway between Yuma and Gila Bend. The town is surrounded by desert and is located near the Gila River. The town is also close to the Colorado River, which provides irrigation for the date farms.
Economy
Dateland’s economy is largely based on agriculture, with the main crop being dates. The town is home to several date farms, which produce a variety of dates, including Deglet Noor, Medjool, and Zahidi. The town also has a few small businesses, including a gas station, a convenience store, and a restaurant.
Demographics
As of the 2010 census, Dateland had a population of 1,072. The population is largely Hispanic, with the majority of the population being of Mexican descent. The median household income is $25,000, and the median age is 33. The town has a high poverty rate, with nearly 40% of the population living below the poverty line.
Conclusion
Dateland, Arizona is a small unincorporated community located in Yuma County, Arizona. It is known for its date farms, which produce a variety of dates, including Deglet Noor, Medjool, and Zahidi. The town’s economy is largely based on agriculture, with the main crop being dates. The population is largely Hispanic, with the majority of the population being of Mexican descent. The town has a high poverty rate, with nearly 40% of the population living below the poverty line.
Common Questions
What is the Total Population of Dateland?
Total Population of Dateland is 341.
What is the Total Male Population of Dateland?
Total Male Population of Dateland is 173.
What is the Total Female Population of Dateland?
Total Female Population of Dateland is 168.
What is the Ratio of Males per 100 Females in Dateland?
There are 102.98 Males per 100 Females in Dateland.
What is the Ratio of Females per 100 Males in Dateland?
There are 97.11 Females per 100 Males in Dateland.
What is the Median Population Age in Dateland?
Median Population Age in Dateland is 25.8 Years.
What is the Average Family Size in Dateland
Average Family Size in Dateland is 3.9 People.
What is the Average Household Size in Dateland
Average Household Size in Dateland is 2.6 People.
What is Per Capita Income in Dateland?
Per Capita income in Dateland is $23,825.
What is the Median Family Income in Dateland?
Median Family Income in Dateland is $74,130.
What is the Median Household income in Dateland?
Median Household Income in Dateland is $65,313.
What is Inequality or Gini Index in Dateland?
Inequality or Gini Index in Dateland is 0.35.
How Large is the Labor Force in Dateland?
There are 126 People in the Labor Forcein in Dateland.
What is the Percentage of People in the Labor Force in Dateland?
57.5% of People are in the Labor Force in Dateland.
What is the Unemployment Rate in Dateland?
Unemployment Rate in Dateland is 1.6%.