Cities with the Highest Percentage of Population Employed in Manufacturing in Arizona
RELATED REPORTS & OPTIONS
Manufacturing
Arizona
Compare Cities
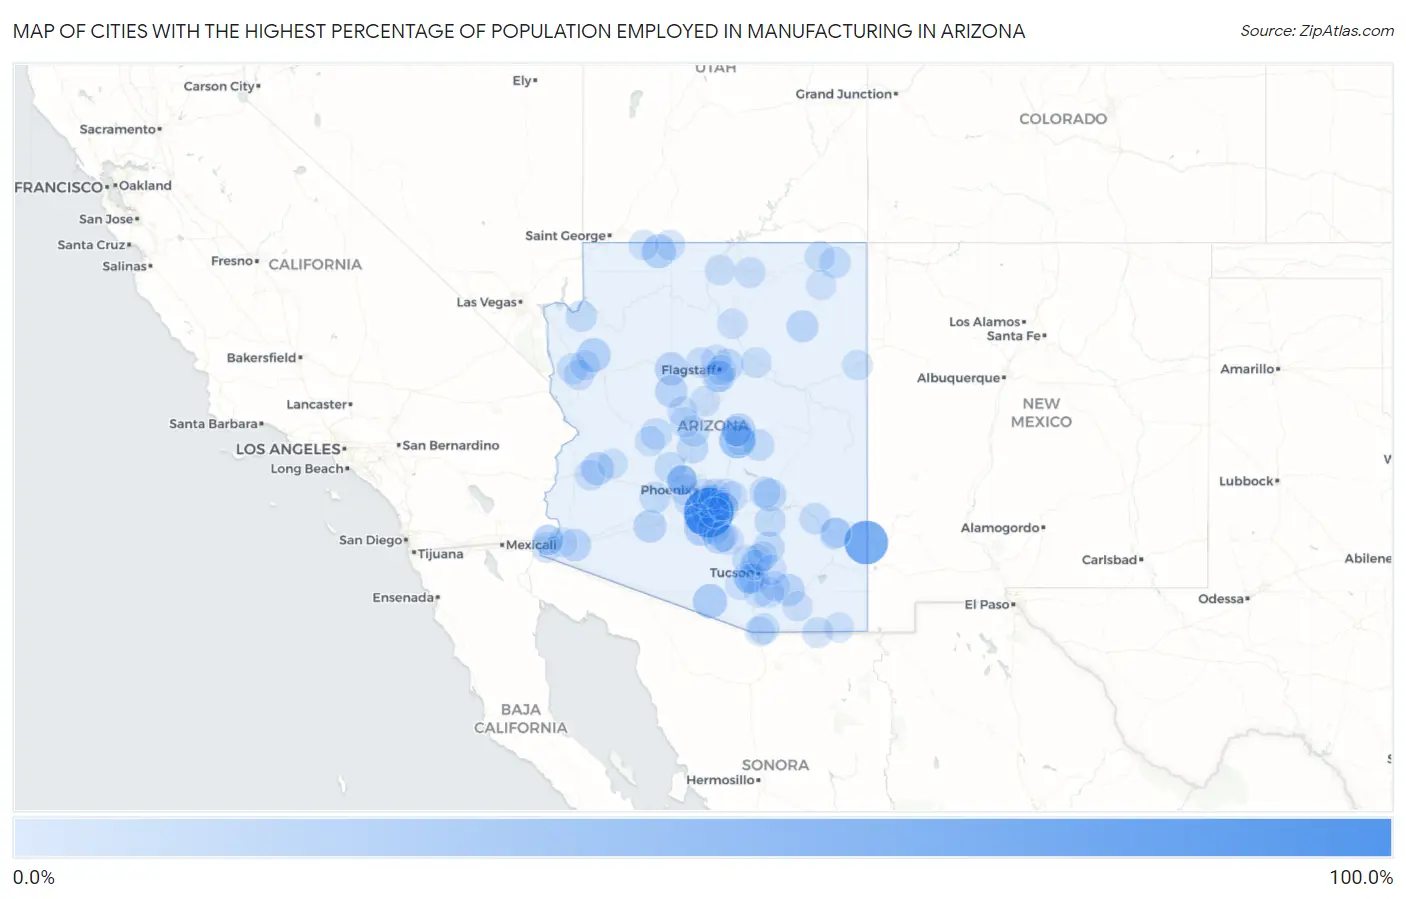
Map of Cities with the Highest Percentage of Population Employed in Manufacturing in Arizona
0.0%
100.0%
Cities with the Highest Percentage of Population Employed in Manufacturing in Arizona
| City | % Employed | vs State | vs National | |
| 1. | Sweet Water Village | 100.0% | 7.4%(+92.6)#1 | 10.0%(+90.0)#13 |
| 2. | Franklin | 71.0% | 7.4%(+63.6)#2 | 10.0%(+61.0)#128 |
| 3. | Stotonic Village | 44.9% | 7.4%(+37.6)#3 | 10.0%(+35.0)#554 |
| 4. | Oxbow Estates | 37.9% | 7.4%(+30.5)#4 | 10.0%(+27.9)#994 |
| 5. | Topawa | 26.9% | 7.4%(+19.5)#5 | 10.0%(+16.9)#2,894 |
| 6. | Stanfield | 25.4% | 7.4%(+18.0)#6 | 10.0%(+15.4)#3,319 |
| 7. | Valle Vista | 24.7% | 7.4%(+17.4)#7 | 10.0%(+14.7)#3,580 |
| 8. | Kaibab | 24.6% | 7.4%(+17.2)#8 | 10.0%(+14.6)#3,631 |
| 9. | Red Lake | 23.0% | 7.4%(+15.6)#9 | 10.0%(+13.0)#4,210 |
| 10. | Freedom Acres | 21.2% | 7.4%(+13.9)#10 | 10.0%(+11.2)#5,065 |
| 11. | Vicksburg | 21.0% | 7.4%(+13.6)#11 | 10.0%(+11.0)#5,170 |
| 12. | Ash Fork | 20.0% | 7.4%(+12.6)#12 | 10.0%(+10.0)#5,730 |
| 13. | Theba | 19.6% | 7.4%(+12.2)#13 | 10.0%(+9.57)#6,006 |
| 14. | Pinal | 18.5% | 7.4%(+11.1)#14 | 10.0%(+8.53)#6,748 |
| 15. | Paulden | 18.4% | 7.4%(+11.0)#15 | 10.0%(+8.37)#6,856 |
| 16. | Wellton | 18.2% | 7.4%(+10.9)#16 | 10.0%(+8.25)#6,921 |
| 17. | Doney Park | 17.7% | 7.4%(+10.3)#17 | 10.0%(+7.70)#7,318 |
| 18. | Arizona City | 17.4% | 7.4%(+10.0)#18 | 10.0%(+7.40)#7,510 |
| 19. | Mescal | 16.4% | 7.4%(+9.07)#19 | 10.0%(+6.46)#8,243 |
| 20. | Keams Canyon | 15.8% | 7.4%(+8.46)#20 | 10.0%(+5.84)#8,759 |
| 21. | Oracle | 15.2% | 7.4%(+7.80)#21 | 10.0%(+5.18)#9,390 |
| 22. | Kachina Village | 14.9% | 7.4%(+7.51)#22 | 10.0%(+4.90)#9,657 |
| 23. | Casa Grande | 14.9% | 7.4%(+7.50)#23 | 10.0%(+4.88)#9,673 |
| 24. | Black Canyon City | 14.4% | 7.4%(+7.07)#24 | 10.0%(+4.45)#10,096 |
| 25. | Meadview | 13.8% | 7.4%(+6.42)#25 | 10.0%(+3.80)#10,718 |
| 26. | Rock Point | 13.6% | 7.4%(+6.26)#26 | 10.0%(+3.65)#10,878 |
| 27. | Timberline-Fernwood | 13.6% | 7.4%(+6.22)#27 | 10.0%(+3.60)#10,949 |
| 28. | Arlington | 13.5% | 7.4%(+6.09)#28 | 10.0%(+3.47)#11,106 |
| 29. | Wittmann | 13.4% | 7.4%(+5.99)#29 | 10.0%(+3.38)#11,218 |
| 30. | Peeples Valley | 13.3% | 7.4%(+5.96)#30 | 10.0%(+3.34)#11,244 |
| 31. | Solomon | 13.1% | 7.4%(+5.73)#31 | 10.0%(+3.12)#11,506 |
| 32. | Winkelman | 13.0% | 7.4%(+5.67)#32 | 10.0%(+3.05)#11,572 |
| 33. | Claypool | 12.8% | 7.4%(+5.44)#33 | 10.0%(+2.82)#11,807 |
| 34. | Tucson Estates | 12.7% | 7.4%(+5.34)#34 | 10.0%(+2.72)#11,928 |
| 35. | Young | 12.7% | 7.4%(+5.34)#35 | 10.0%(+2.72)#11,929 |
| 36. | Fort Thomas | 12.7% | 7.4%(+5.34)#36 | 10.0%(+2.72)#11,930 |
| 37. | Chandler | 12.7% | 7.4%(+5.32)#37 | 10.0%(+2.70)#11,952 |
| 38. | Cordes Lakes | 12.5% | 7.4%(+5.10)#38 | 10.0%(+2.48)#12,193 |
| 39. | Mountainaire | 12.0% | 7.4%(+4.63)#39 | 10.0%(+2.02)#12,700 |
| 40. | Corona De Tucson | 11.7% | 7.4%(+4.37)#40 | 10.0%(+1.75)#13,034 |
| 41. | Golden Valley | 11.7% | 7.4%(+4.37)#41 | 10.0%(+1.75)#13,037 |
| 42. | Oro Valley | 11.7% | 7.4%(+4.29)#42 | 10.0%(+1.68)#13,125 |
| 43. | Beyerville | 11.5% | 7.4%(+4.16)#43 | 10.0%(+1.55)#13,286 |
| 44. | Kaibito | 11.0% | 7.4%(+3.65)#44 | 10.0%(+1.04)#13,921 |
| 45. | Eloy | 11.0% | 7.4%(+3.59)#45 | 10.0%(+0.978)#13,999 |
| 46. | Gilbert | 10.8% | 7.4%(+3.45)#46 | 10.0%(+0.836)#14,190 |
| 47. | Brenda | 10.8% | 7.4%(+3.38)#47 | 10.0%(+0.762)#14,289 |
| 48. | Naco | 10.6% | 7.4%(+3.26)#48 | 10.0%(+0.642)#14,433 |
| 49. | Walnut Creek | 10.2% | 7.4%(+2.82)#49 | 10.0%(+0.205)#14,956 |
| 50. | Round Valley | 10.2% | 7.4%(+2.80)#50 | 10.0%(+0.179)#14,986 |
| 51. | Dennehotso | 9.9% | 7.4%(+2.56)#51 | 10.0%(-0.062)#15,310 |
| 52. | Marana | 9.9% | 7.4%(+2.53)#52 | 10.0%(-0.090)#15,344 |
| 53. | Bitter Springs | 9.8% | 7.4%(+2.46)#53 | 10.0%(-0.155)#15,438 |
| 54. | Leupp | 9.8% | 7.4%(+2.39)#54 | 10.0%(-0.229)#15,539 |
| 55. | Parks | 9.7% | 7.4%(+2.32)#55 | 10.0%(-0.295)#15,634 |
| 56. | Drexel Heights | 9.6% | 7.4%(+2.28)#56 | 10.0%(-0.342)#15,703 |
| 57. | Tucson Mountains | 9.6% | 7.4%(+2.20)#57 | 10.0%(-0.418)#15,797 |
| 58. | Fort Valley | 9.5% | 7.4%(+2.15)#58 | 10.0%(-0.467)#15,847 |
| 59. | Cornville | 9.5% | 7.4%(+2.08)#59 | 10.0%(-0.540)#15,956 |
| 60. | Sahuarita | 9.4% | 7.4%(+1.98)#60 | 10.0%(-0.641)#16,085 |
| 61. | Valencia West | 9.3% | 7.4%(+1.88)#61 | 10.0%(-0.740)#16,215 |
| 62. | St Johns | 9.2% | 7.4%(+1.78)#62 | 10.0%(-0.841)#16,341 |
| 63. | Houck | 9.1% | 7.4%(+1.72)#63 | 10.0%(-0.900)#16,424 |
| 64. | Casas Adobes | 9.1% | 7.4%(+1.70)#64 | 10.0%(-0.922)#16,481 |
| 65. | Flagstaff | 9.0% | 7.4%(+1.64)#65 | 10.0%(-0.976)#16,538 |
| 66. | San Jose | 8.9% | 7.4%(+1.56)#66 | 10.0%(-1.05)#16,632 |
| 67. | Cameron | 8.9% | 7.4%(+1.52)#67 | 10.0%(-1.09)#16,687 |
| 68. | Picacho | 8.8% | 7.4%(+1.45)#68 | 10.0%(-1.17)#16,786 |
| 69. | Tanque Verde | 8.8% | 7.4%(+1.44)#69 | 10.0%(-1.18)#16,803 |
| 70. | Apache Junction | 8.8% | 7.4%(+1.40)#70 | 10.0%(-1.22)#16,869 |
| 71. | Tolleson | 8.7% | 7.4%(+1.36)#71 | 10.0%(-1.25)#16,916 |
| 72. | New Kingman Butler | 8.7% | 7.4%(+1.29)#72 | 10.0%(-1.33)#17,045 |
| 73. | Queen Creek | 8.6% | 7.4%(+1.26)#73 | 10.0%(-1.36)#17,089 |
| 74. | Congress | 8.6% | 7.4%(+1.19)#74 | 10.0%(-1.43)#17,177 |
| 75. | Maricopa | 8.5% | 7.4%(+1.16)#75 | 10.0%(-1.46)#17,222 |
| 76. | Whetstone | 8.5% | 7.4%(+1.13)#76 | 10.0%(-1.49)#17,261 |
| 77. | Fredonia | 8.5% | 7.4%(+1.12)#77 | 10.0%(-1.50)#17,278 |
| 78. | Vail | 8.4% | 7.4%(+1.06)#78 | 10.0%(-1.56)#17,366 |
| 79. | Colorado City | 8.4% | 7.4%(+1.05)#79 | 10.0%(-1.57)#17,372 |
| 80. | Wenden | 8.4% | 7.4%(+1.03)#80 | 10.0%(-1.59)#17,406 |
| 81. | East Verde Estates | 8.3% | 7.4%(+0.959)#81 | 10.0%(-1.66)#17,521 |
| 82. | Tempe | 8.3% | 7.4%(+0.890)#82 | 10.0%(-1.73)#17,611 |
| 83. | Mesa | 8.2% | 7.4%(+0.819)#83 | 10.0%(-1.80)#17,718 |
| 84. | Catalina | 8.2% | 7.4%(+0.792)#84 | 10.0%(-1.83)#17,755 |
| 85. | Gold Canyon | 8.2% | 7.4%(+0.787)#85 | 10.0%(-1.83)#17,773 |
| 86. | San Tan Valley | 8.1% | 7.4%(+0.769)#86 | 10.0%(-1.85)#17,788 |
| 87. | Somerton | 8.1% | 7.4%(+0.764)#87 | 10.0%(-1.85)#17,797 |
| 88. | Mayer | 8.1% | 7.4%(+0.759)#88 | 10.0%(-1.86)#17,801 |
| 89. | Prescott Valley | 8.1% | 7.4%(+0.688)#89 | 10.0%(-1.93)#17,905 |
| 90. | Donovan Estates | 8.0% | 7.4%(+0.653)#90 | 10.0%(-1.96)#17,968 |
| 91. | Fortuna Foothills | 7.9% | 7.4%(+0.523)#91 | 10.0%(-2.09)#18,132 |
| 92. | Avenue B And C | 7.8% | 7.4%(+0.404)#92 | 10.0%(-2.21)#18,320 |
| 93. | Upper Santan Village | 7.7% | 7.4%(+0.370)#93 | 10.0%(-2.25)#18,366 |
| 94. | Youngtown | 7.7% | 7.4%(+0.296)#94 | 10.0%(-2.32)#18,496 |
| 95. | Glendale | 7.4% | 7.4%(+0.073)#95 | 10.0%(-2.54)#18,792 |
| 96. | Nogales | 7.4% | 7.4%(+0.048)#96 | 10.0%(-2.57)#18,831 |
| 97. | Douglas | 7.4% | 7.4%(+0.041)#97 | 10.0%(-2.58)#18,844 |
| 98. | El Mirage | 7.4% | 7.4%(+0.032)#98 | 10.0%(-2.58)#18,871 |
| 99. | Three Points | 7.2% | 7.4%(-0.126)#99 | 10.0%(-2.74)#19,069 |
| 100. | Rough Rock | 7.2% | 7.4%(-0.127)#100 | 10.0%(-2.74)#19,075 |
Common Questions
What are the Top 10 Cities with the Highest Percentage of Population Employed in Manufacturing in Arizona?
Top 10 Cities with the Highest Percentage of Population Employed in Manufacturing in Arizona are:
#1
100.0%
#2
71.0%
#3
44.9%
#4
37.9%
#5
26.9%
#6
25.4%
#7
24.7%
#8
24.6%
#9
21.2%
#10
21.0%
What city has the Highest Percentage of Population Employed in Manufacturing in Arizona?
Sweet Water Village has the Highest Percentage of Population Employed in Manufacturing in Arizona with 100.0%.
What is the Percentage of Population Employed in Manufacturing in the State of Arizona?
Percentage of Population Employed in Manufacturing in Arizona is 7.4%.
What is the Percentage of Population Employed in Manufacturing in the United States?
Percentage of Population Employed in Manufacturing in the United States is 10.0%.