Arivaca, AZ
Arivaca Map
Arivaca Overview
524
TOTAL POPULATION
265
MALE POPULATION
259
FEMALE POPULATION
102.32
MALES / 100 FEMALES
97.74
FEMALES / 100 MALES
61.5
MEDIAN AGE
2.0
AVG FAMILY SIZE
1.5
AVG HOUSEHOLD SIZE
$29,864
PER CAPITA INCOME
$47,277
AVG FAMILY INCOME
$31,636
AVG HOUSEHOLD INCOME
0.40
INEQUALITY / GINI INDEX
246
LABOR FORCE [ PEOPLE ]
49.2%
PERCENT IN LABOR FORCE
8.5%
UNEMPLOYMENT RATE
Arivaca Zip Codes
Arivaca Area Codes
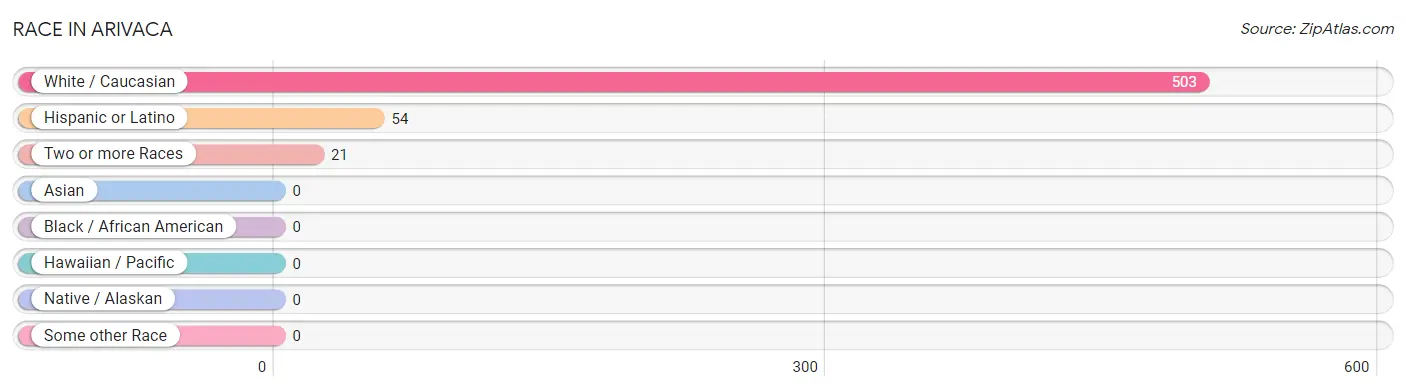
Race in Arivaca
The most populous races in Arivaca are White / Caucasian (503 | 96.0%), Hispanic or Latino (54 | 10.3%), and Two or more Races (21 | 4.0%).
| Race | # Population | % Population |
| Asian | 0 | 0.0% |
| Black / African American | 0 | 0.0% |
| Hawaiian / Pacific | 0 | 0.0% |
| Hispanic or Latino | 54 | 10.3% |
| Native / Alaskan | 0 | 0.0% |
| White / Caucasian | 503 | 96.0% |
| Two or more Races | 21 | 4.0% |
| Some other Race | 0 | 0.0% |
| Total | 524 | 100.0% |
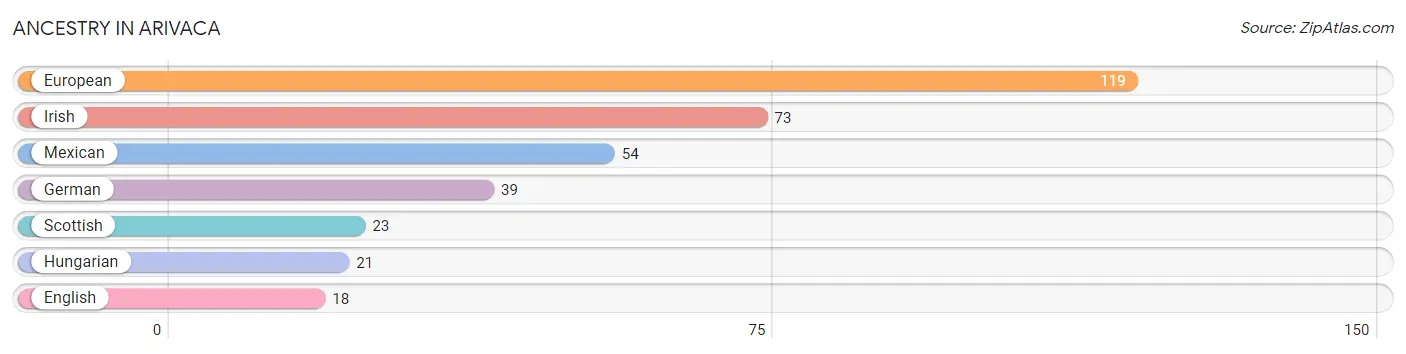
Ancestry in Arivaca
The most populous ancestries reported in Arivaca are European (119 | 22.7%), Irish (73 | 13.9%), Mexican (54 | 10.3%), German (39 | 7.4%), and Scottish (23 | 4.4%), together accounting for 58.8% of all Arivaca residents.
| Ancestry | # Population | % Population |
| English | 18 | 3.4% |
| European | 119 | 22.7% |
| German | 39 | 7.4% |
| Hungarian | 21 | 4.0% |
| Irish | 73 | 13.9% |
| Mexican | 54 | 10.3% |
| Scottish | 23 | 4.4% | View All 7 Rows |
Immigrants in Arivaca

| Immigration Origin | # Population | % Population | View All 0 Rows |
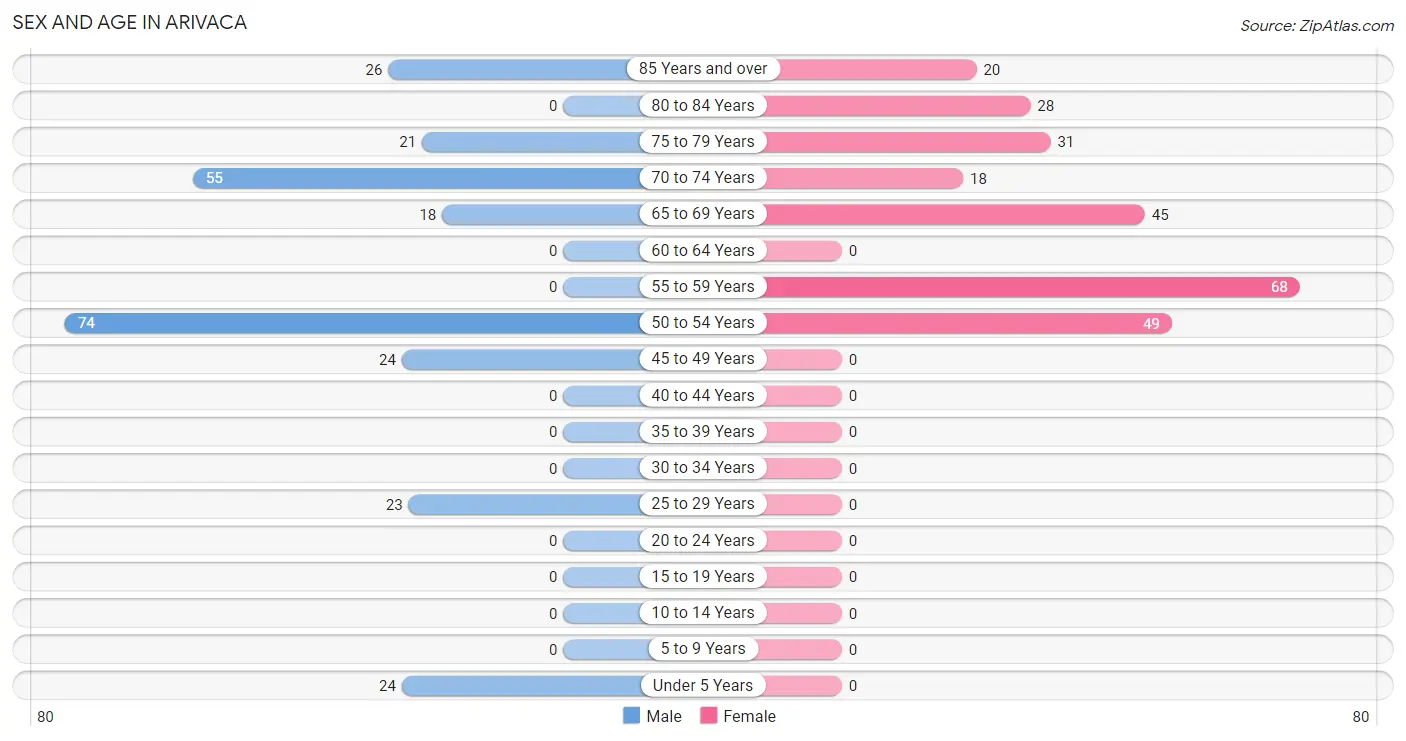
Sex and Age in Arivaca
Sex and Age in Arivaca
The most populous age groups in Arivaca are 50 to 54 Years (74 | 27.9%) for men and 55 to 59 Years (68 | 26.3%) for women.
| Age Bracket | Male | Female |
| Under 5 Years | 24 (9.1%) | 0 (0.0%) |
| 5 to 9 Years | 0 (0.0%) | 0 (0.0%) |
| 10 to 14 Years | 0 (0.0%) | 0 (0.0%) |
| 15 to 19 Years | 0 (0.0%) | 0 (0.0%) |
| 20 to 24 Years | 0 (0.0%) | 0 (0.0%) |
| 25 to 29 Years | 23 (8.7%) | 0 (0.0%) |
| 30 to 34 Years | 0 (0.0%) | 0 (0.0%) |
| 35 to 39 Years | 0 (0.0%) | 0 (0.0%) |
| 40 to 44 Years | 0 (0.0%) | 0 (0.0%) |
| 45 to 49 Years | 24 (9.1%) | 0 (0.0%) |
| 50 to 54 Years | 74 (27.9%) | 49 (18.9%) |
| 55 to 59 Years | 0 (0.0%) | 68 (26.3%) |
| 60 to 64 Years | 0 (0.0%) | 0 (0.0%) |
| 65 to 69 Years | 18 (6.8%) | 45 (17.4%) |
| 70 to 74 Years | 55 (20.7%) | 18 (7.0%) |
| 75 to 79 Years | 21 (7.9%) | 31 (12.0%) |
| 80 to 84 Years | 0 (0.0%) | 28 (10.8%) |
| 85 Years and over | 26 (9.8%) | 20 (7.7%) |
| Total | 265 (100.0%) | 259 (100.0%) |
Families and Households in Arivaca
Median Family Size in Arivaca
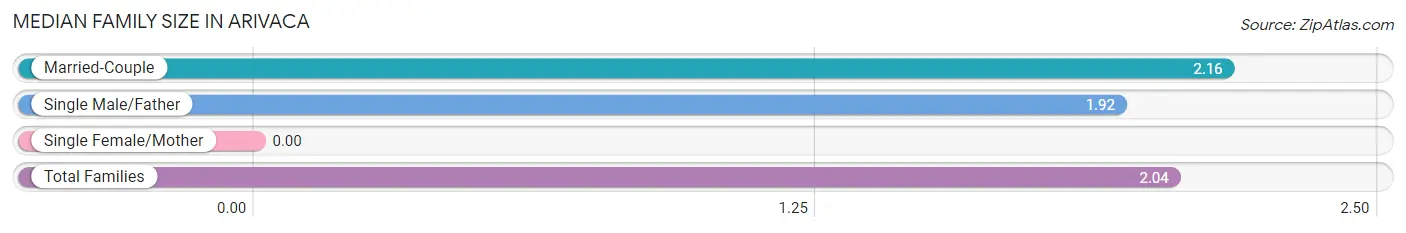
| Family Type | # Families | Family Size |
| Married-Couple | 49 (48.5%) | 2.16 |
| Single Male/Father | 52 (51.5%) | 1.92 |
| Single Female/Mother | 0 (0.0%) | - |
| Total Families | 101 (100.0%) | 2.04 |
Median Household Size in Arivaca
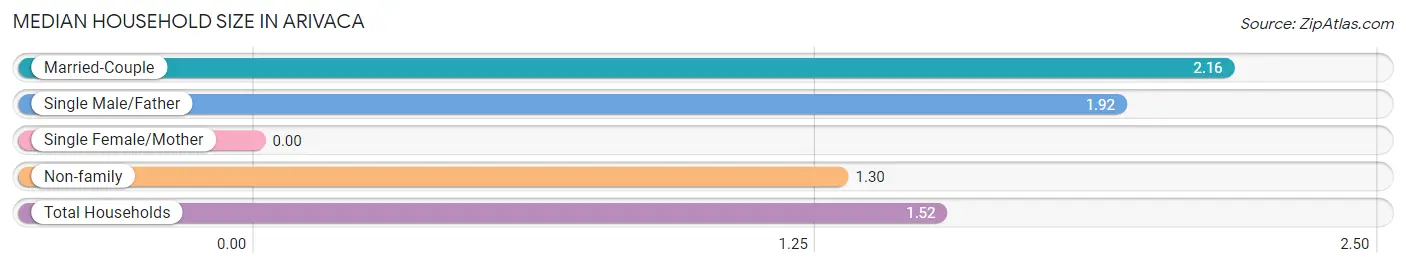
| Household Type | # Households | Household Size |
| Married-Couple | 49 (14.8%) | 2.16 |
| Single Male/Father | 52 (15.7%) | 1.92 |
| Single Female/Mother | 0 (0.0%) | - |
| Non-family | 231 (69.6%) | 1.30 |
| Total Households | 332 (100.0%) | 1.52 |
Household Size by Marriage Status in Arivaca
Out of a total of 332 households in Arivaca, 101 (30.4%) are family households, while 231 (69.6%) are nonfamily households. The most numerous type of family households are 2-person households, comprising 101, and the most common type of nonfamily households are 1-person households, comprising 185.
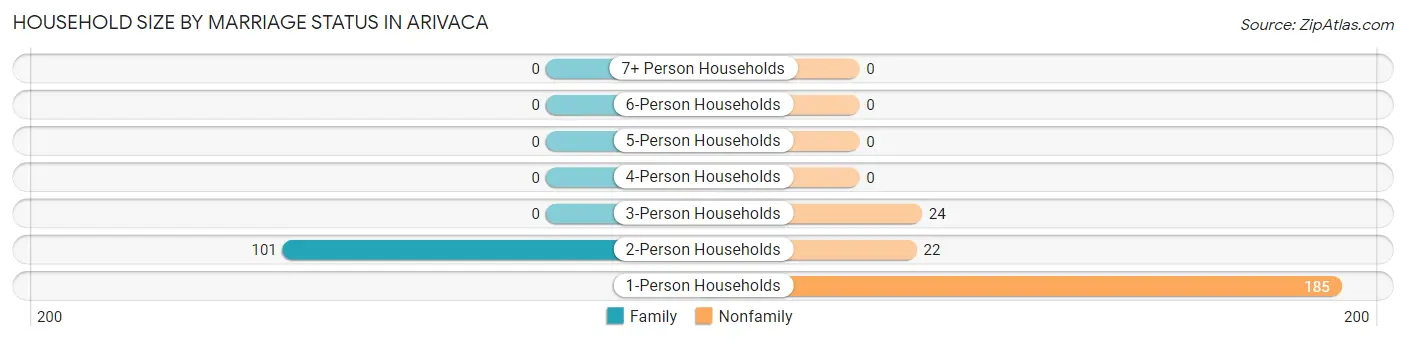
| Household Size | Family Households | Nonfamily Households |
| 1-Person Households | - | 185 (55.7%) |
| 2-Person Households | 101 (30.4%) | 22 (6.6%) |
| 3-Person Households | 0 (0.0%) | 24 (7.2%) |
| 4-Person Households | 0 (0.0%) | 0 (0.0%) |
| 5-Person Households | 0 (0.0%) | 0 (0.0%) |
| 6-Person Households | 0 (0.0%) | 0 (0.0%) |
| 7+ Person Households | 0 (0.0%) | 0 (0.0%) |
| Total | 101 (30.4%) | 231 (69.6%) |
Female Fertility in Arivaca
Fertility by Age in Arivaca
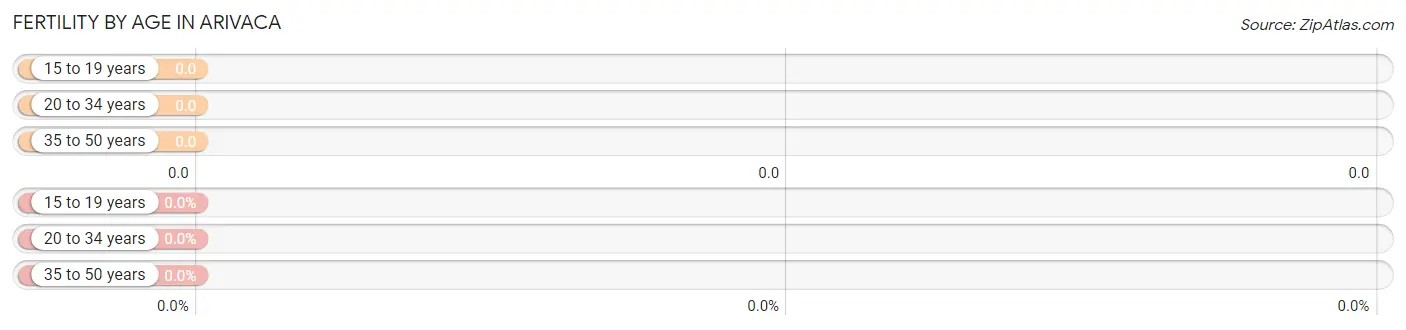
| Age Bracket | Women with Births | Births / 1,000 Women |
| 15 to 19 years | 0 (0.0%) | 0.0 |
| 20 to 34 years | 0 (0.0%) | 0.0 |
| 35 to 50 years | 0 (0.0%) | 0.0 |
| Total | 0 (0.0%) | 0.0 |
Fertility by Age by Marriage Status in Arivaca
| Age Bracket | Married | Unmarried |
| 15 to 19 years | 0 (0.0%) | 0 (0.0%) |
| 20 to 34 years | 0 (0.0%) | 0 (0.0%) |
| 35 to 50 years | 0 (0.0%) | 0 (0.0%) |
| Total | 0 (0.0%) | 0 (0.0%) |
Fertility by Education in Arivaca
| Educational Attainment | Women with Births | Births / 1,000 Women |
| Less than High School | 0 (0.0%) | 0.0 |
| High School Diploma | 0 (0.0%) | 0.0 |
| College or Associate's Degree | 0 (0.0%) | 0.0 |
| Bachelor's Degree | 0 (0.0%) | 0.0 |
| Graduate Degree | 0 (0.0%) | 0.0 |
| Total | 0 (0.0%) | 0.0 |
Fertility by Education by Marriage Status in Arivaca
| Educational Attainment | Married | Unmarried |
| Less than High School | 0 (0.0%) | 0 (0.0%) |
| High School Diploma | 0 (0.0%) | 0 (0.0%) |
| College or Associate's Degree | 0 (0.0%) | 0 (0.0%) |
| Bachelor's Degree | 0 (0.0%) | 0 (0.0%) |
| Graduate Degree | 0 (0.0%) | 0 (0.0%) |
| Total | 0 (0.0%) | 0 (0.0%) |
Income in Arivaca
Income Overview in Arivaca
Per Capita Income in Arivaca is $29,864, while median incomes of families and households are $47,277 and $31,636 respectively.
| Characteristic | Number | Measure |
| Per Capita Income | 524 | $29,864 |
| Median Family Income | 101 | $47,277 |
| Mean Family Income | 101 | $44,698 |
| Median Household Income | 332 | $31,636 |
| Mean Household Income | 332 | $45,639 |
| Income Deficit | 101 | $0 |
| Wage / Income Gap (%) | 524 | 0.00% |
| Wage / Income Gap ($) | 524 | 100.00¢ per $1 |
| Gini / Inequality Index | 524 | 0.40 |
Earnings by Sex in Arivaca
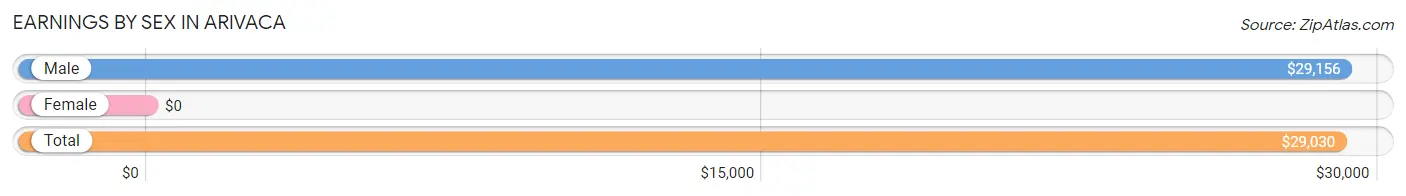
| Sex | Number | Average Earnings |
| Male | 152 (67.6%) | $29,156 |
| Female | 73 (32.4%) | $0 |
| Total | 225 (100.0%) | $29,030 |
Earnings by Sex by Income Bracket in Arivaca
The most common earnings brackets in Arivaca are $25,000 to $29,999 for men (80 | 52.6%) and $25,000 to $29,999 for women (27 | 37.0%).
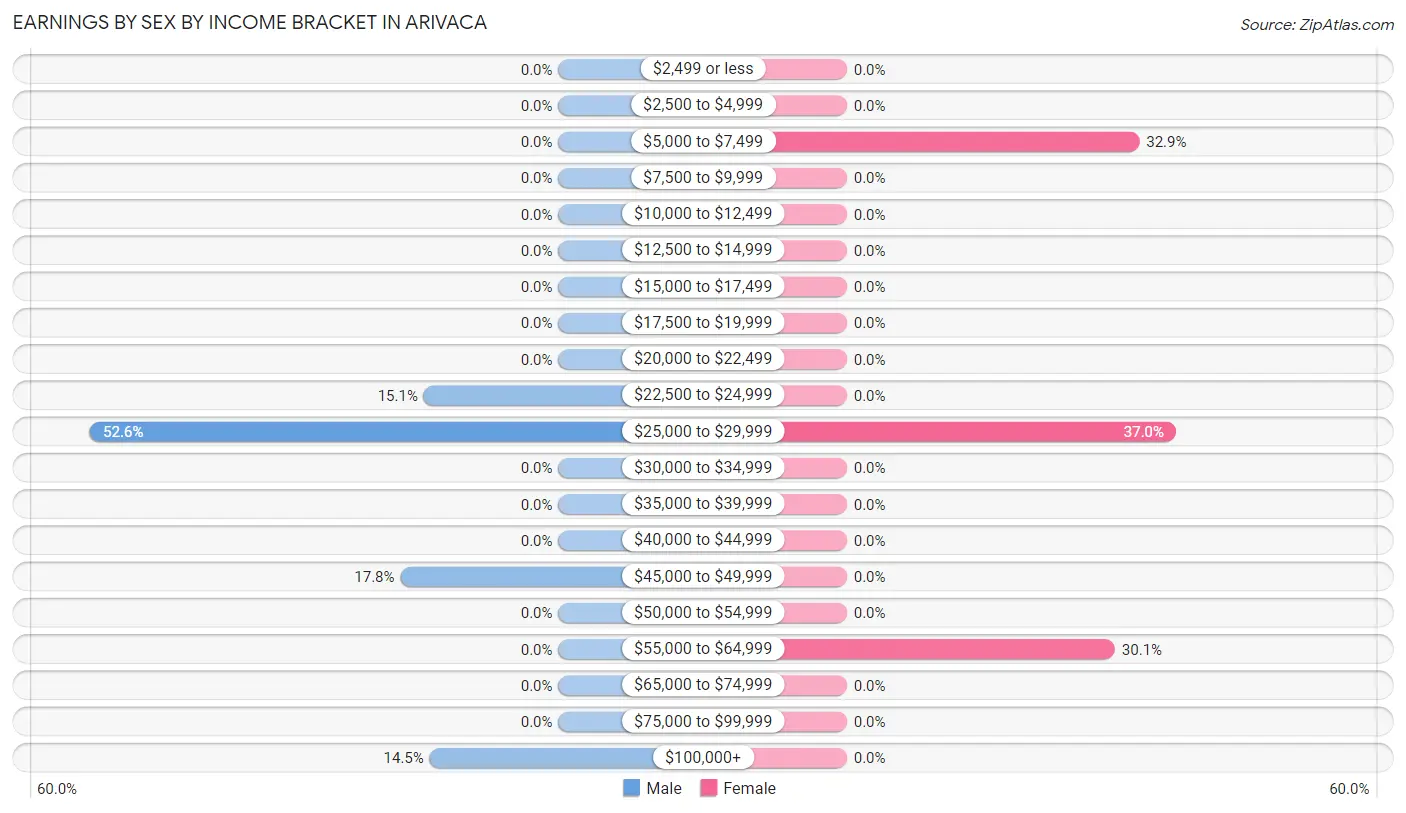
| Income | Male | Female |
| $2,499 or less | 0 (0.0%) | 0 (0.0%) |
| $2,500 to $4,999 | 0 (0.0%) | 0 (0.0%) |
| $5,000 to $7,499 | 0 (0.0%) | 24 (32.9%) |
| $7,500 to $9,999 | 0 (0.0%) | 0 (0.0%) |
| $10,000 to $12,499 | 0 (0.0%) | 0 (0.0%) |
| $12,500 to $14,999 | 0 (0.0%) | 0 (0.0%) |
| $15,000 to $17,499 | 0 (0.0%) | 0 (0.0%) |
| $17,500 to $19,999 | 0 (0.0%) | 0 (0.0%) |
| $20,000 to $22,499 | 0 (0.0%) | 0 (0.0%) |
| $22,500 to $24,999 | 23 (15.1%) | 0 (0.0%) |
| $25,000 to $29,999 | 80 (52.6%) | 27 (37.0%) |
| $30,000 to $34,999 | 0 (0.0%) | 0 (0.0%) |
| $35,000 to $39,999 | 0 (0.0%) | 0 (0.0%) |
| $40,000 to $44,999 | 0 (0.0%) | 0 (0.0%) |
| $45,000 to $49,999 | 27 (17.8%) | 0 (0.0%) |
| $50,000 to $54,999 | 0 (0.0%) | 0 (0.0%) |
| $55,000 to $64,999 | 0 (0.0%) | 22 (30.1%) |
| $65,000 to $74,999 | 0 (0.0%) | 0 (0.0%) |
| $75,000 to $99,999 | 0 (0.0%) | 0 (0.0%) |
| $100,000+ | 22 (14.5%) | 0 (0.0%) |
| Total | 152 (100.0%) | 73 (100.0%) |
Earnings by Sex by Educational Attainment in Arivaca
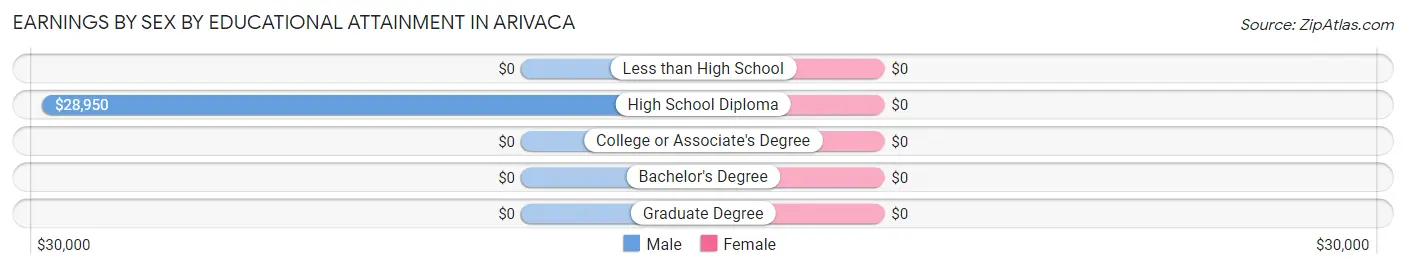
| Educational Attainment | Male Income | Female Income |
| Less than High School | - | - |
| High School Diploma | $28,950 | $0 |
| College or Associate's Degree | - | - |
| Bachelor's Degree | - | - |
| Graduate Degree | - | - |
| Total | $29,156 | $0 |
Family Income in Arivaca
Family Income Brackets in Arivaca
According to the Arivaca family income data, there are 55 families falling into the $35,000 to $49,999 income range, which is the most common income bracket and makes up 54.5% of all families.
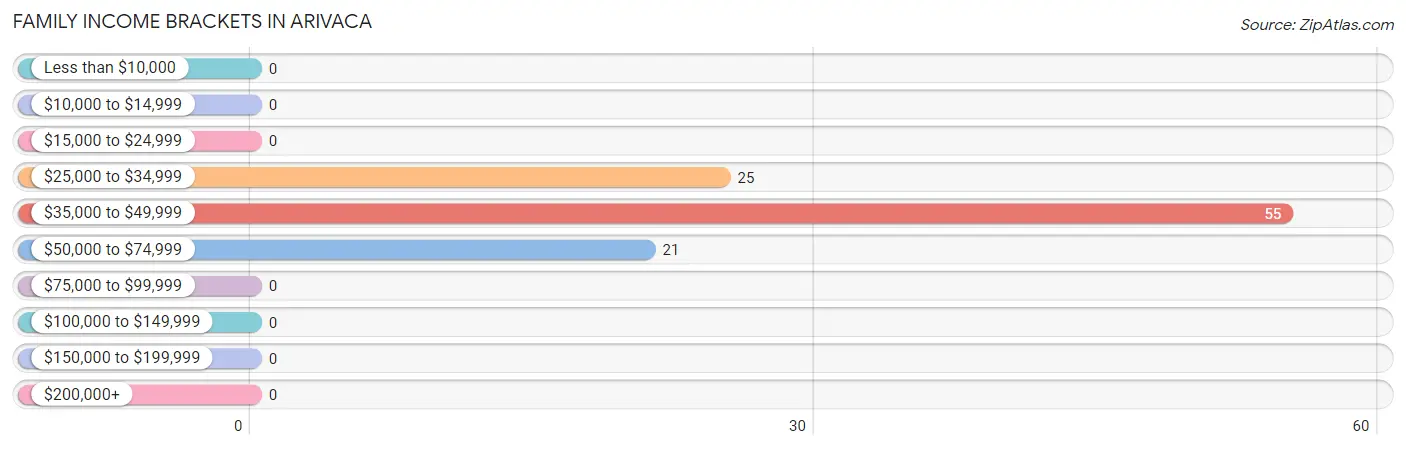
| Income Bracket | # Families | % Families |
| Less than $10,000 | 0 | 0.0% |
| $10,000 to $14,999 | 0 | 0.0% |
| $15,000 to $24,999 | 0 | 0.0% |
| $25,000 to $34,999 | 25 | 24.8% |
| $35,000 to $49,999 | 55 | 54.5% |
| $50,000 to $74,999 | 21 | 20.8% |
| $75,000 to $99,999 | 0 | 0.0% |
| $100,000 to $149,999 | 0 | 0.0% |
| $150,000 to $199,999 | 0 | 0.0% |
| $200,000+ | 0 | 0.0% |
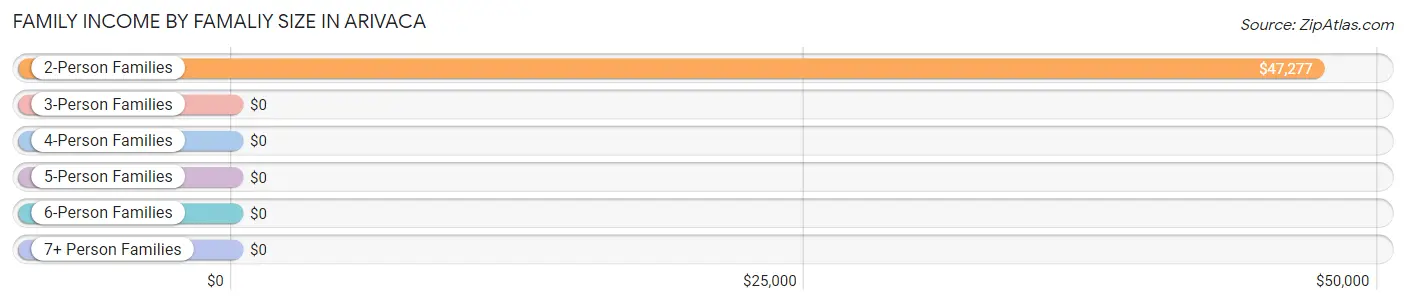
Family Income by Famaliy Size in Arivaca
2-person families (101 | 100.0%) account for the highest median family income in Arivaca with $47,277 per family, while 2-person families (101 | 100.0%) have the highest median income of $23,638 per family member.
| Income Bracket | # Families | Median Income |
| 2-Person Families | 101 (100.0%) | $47,277 |
| 3-Person Families | 0 (0.0%) | $0 |
| 4-Person Families | 0 (0.0%) | $0 |
| 5-Person Families | 0 (0.0%) | $0 |
| 6-Person Families | 0 (0.0%) | $0 |
| 7+ Person Families | 0 (0.0%) | $0 |
| Total | 101 (100.0%) | $47,277 |
Family Income by Number of Earners in Arivaca
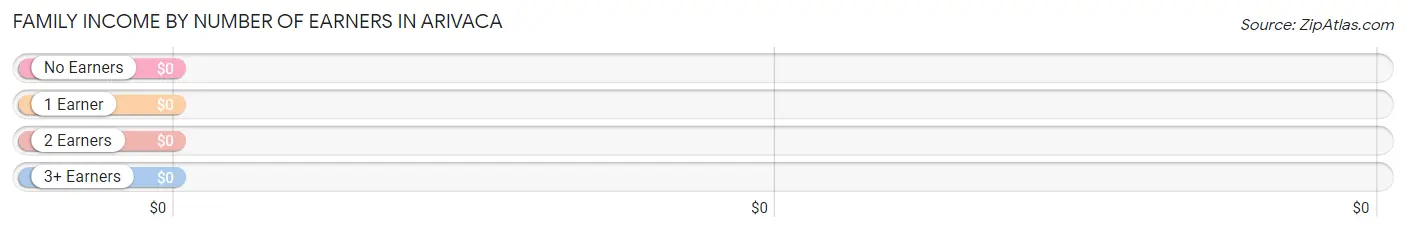
| Number of Earners | # Families | Median Income |
| No Earners | 49 (48.5%) | $0 |
| 1 Earner | 52 (51.5%) | $0 |
| 2 Earners | 0 (0.0%) | $0 |
| 3+ Earners | 0 (0.0%) | $0 |
| Total | 101 (100.0%) | $47,277 |
Household Income in Arivaca
Household Income Brackets in Arivaca
With 128 households falling in the category, the $25,000 to $34,999 income range is the most frequent in Arivaca, accounting for 38.6% of all households.
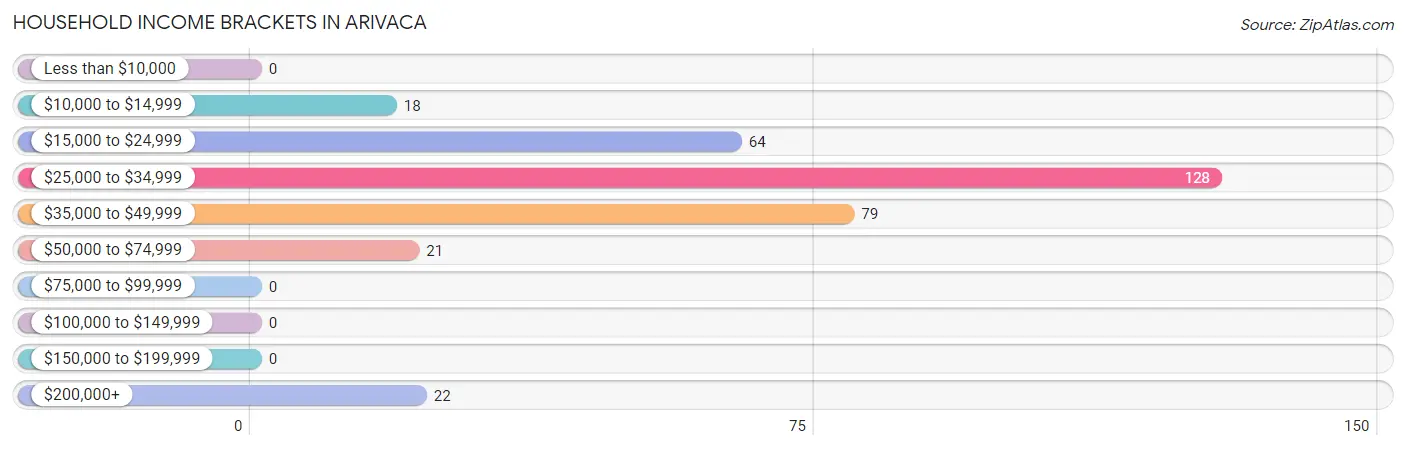
| Income Bracket | # Households | % Households |
| Less than $10,000 | 0 | 0.0% |
| $10,000 to $14,999 | 18 | 5.4% |
| $15,000 to $24,999 | 64 | 19.3% |
| $25,000 to $34,999 | 128 | 38.6% |
| $35,000 to $49,999 | 79 | 23.8% |
| $50,000 to $74,999 | 21 | 6.3% |
| $75,000 to $99,999 | 0 | 0.0% |
| $100,000 to $149,999 | 0 | 0.0% |
| $150,000 to $199,999 | 0 | 0.0% |
| $200,000+ | 22 | 6.6% |
Household Income by Householder Age in Arivaca
The median household income in Arivaca is $31,636, with the highest median household income of $33,800 found in the 45 to 64 years age bracket for the primary householder. A total of 122 households (36.7%) fall into this category.
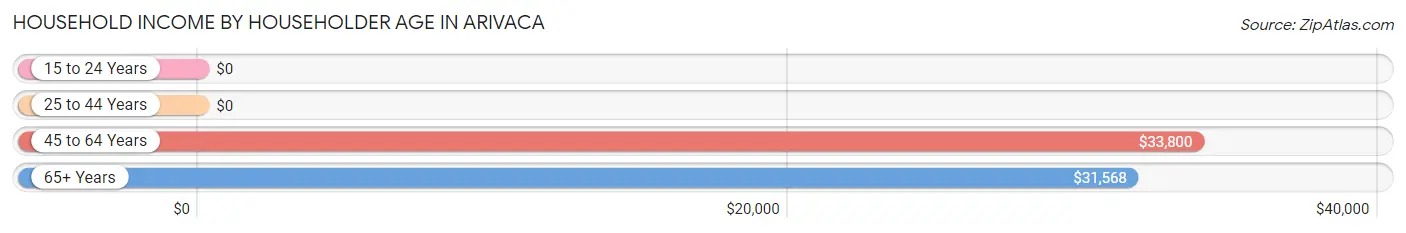
| Income Bracket | # Households | Median Income |
| 15 to 24 Years | 0 (0.0%) | $0 |
| 25 to 44 Years | 23 (6.9%) | $0 |
| 45 to 64 Years | 122 (36.7%) | $33,800 |
| 65+ Years | 187 (56.3%) | $31,568 |
| Total | 332 (100.0%) | $31,636 |
Poverty in Arivaca
Income Below Poverty by Sex and Age in Arivaca
With 6.8% poverty level for males and 19.5% for females among the residents of Arivaca, 65 to 74 year old males and 55 to 64 year old females are the most vulnerable to poverty, with 18 males (24.7%) and 47 females (69.1%) in their respective age groups living below the poverty level.
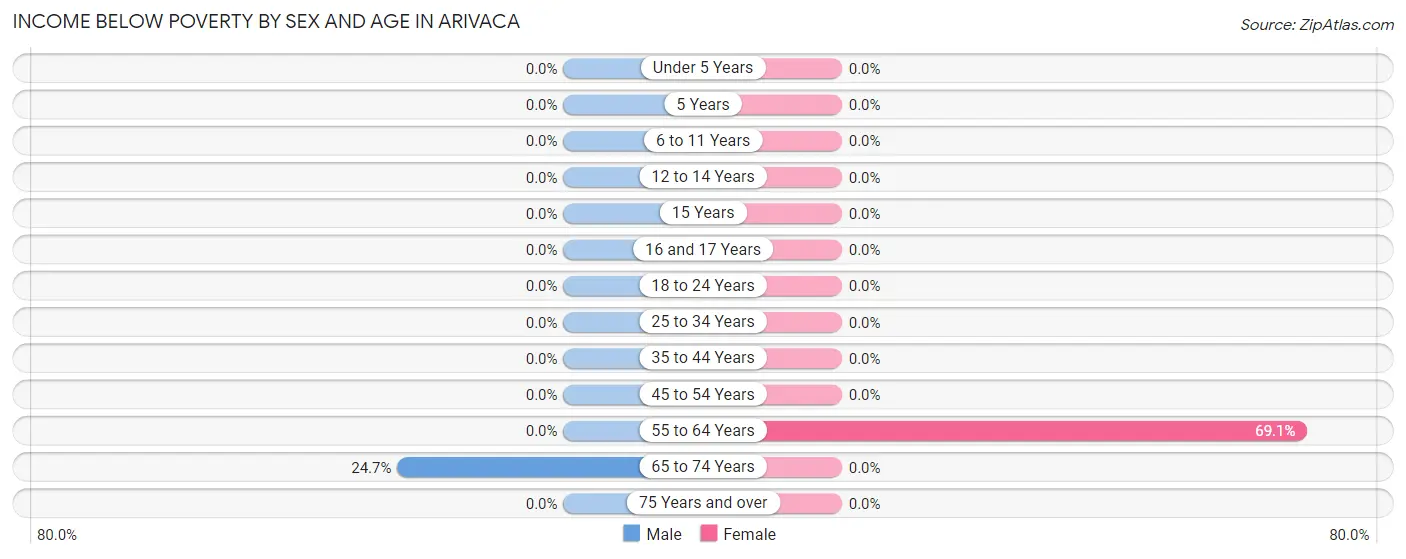
| Age Bracket | Male | Female |
| Under 5 Years | 0 (0.0%) | 0 (0.0%) |
| 5 Years | 0 (0.0%) | 0 (0.0%) |
| 6 to 11 Years | 0 (0.0%) | 0 (0.0%) |
| 12 to 14 Years | 0 (0.0%) | 0 (0.0%) |
| 15 Years | 0 (0.0%) | 0 (0.0%) |
| 16 and 17 Years | 0 (0.0%) | 0 (0.0%) |
| 18 to 24 Years | 0 (0.0%) | 0 (0.0%) |
| 25 to 34 Years | 0 (0.0%) | 0 (0.0%) |
| 35 to 44 Years | 0 (0.0%) | 0 (0.0%) |
| 45 to 54 Years | 0 (0.0%) | 0 (0.0%) |
| 55 to 64 Years | 0 (0.0%) | 47 (69.1%) |
| 65 to 74 Years | 18 (24.7%) | 0 (0.0%) |
| 75 Years and over | 0 (0.0%) | 0 (0.0%) |
| Total | 18 (6.8%) | 47 (19.5%) |
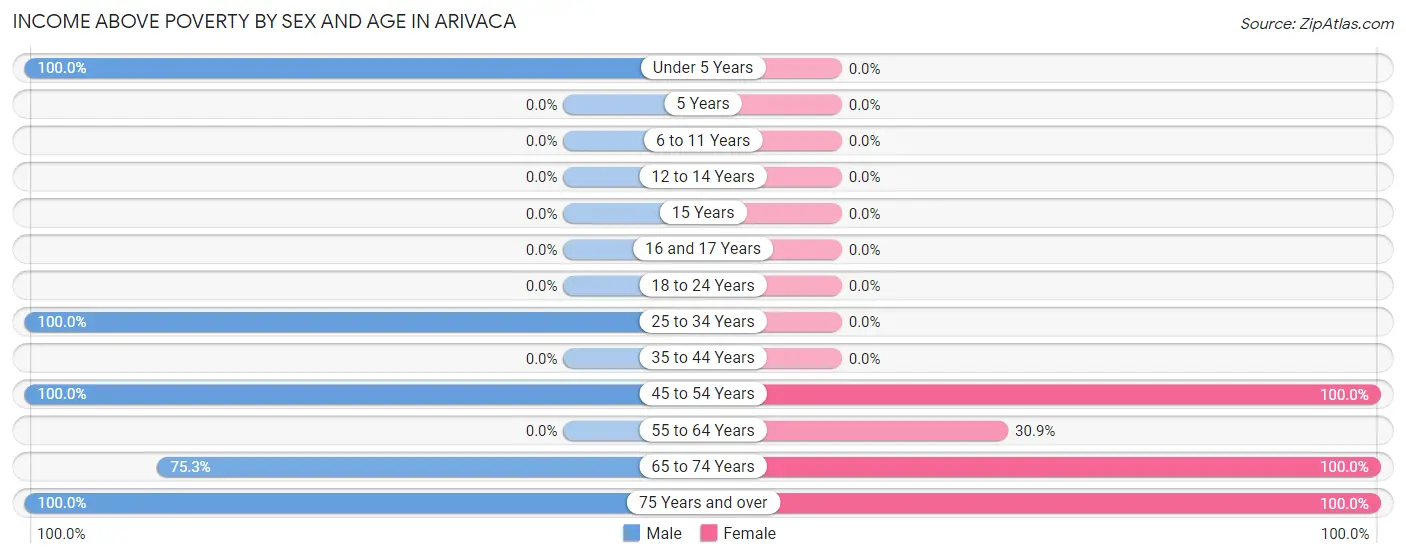
Income Above Poverty by Sex and Age in Arivaca
According to the poverty statistics in Arivaca, males aged under 5 years and females aged 45 to 54 years are the age groups that are most secure financially, with 100.0% of males and 100.0% of females in these age groups living above the poverty line.
| Age Bracket | Male | Female |
| Under 5 Years | 24 (100.0%) | 0 (0.0%) |
| 5 Years | 0 (0.0%) | 0 (0.0%) |
| 6 to 11 Years | 0 (0.0%) | 0 (0.0%) |
| 12 to 14 Years | 0 (0.0%) | 0 (0.0%) |
| 15 Years | 0 (0.0%) | 0 (0.0%) |
| 16 and 17 Years | 0 (0.0%) | 0 (0.0%) |
| 18 to 24 Years | 0 (0.0%) | 0 (0.0%) |
| 25 to 34 Years | 23 (100.0%) | 0 (0.0%) |
| 35 to 44 Years | 0 (0.0%) | 0 (0.0%) |
| 45 to 54 Years | 98 (100.0%) | 49 (100.0%) |
| 55 to 64 Years | 0 (0.0%) | 21 (30.9%) |
| 65 to 74 Years | 55 (75.3%) | 45 (100.0%) |
| 75 Years and over | 47 (100.0%) | 79 (100.0%) |
| Total | 247 (93.2%) | 194 (80.5%) |
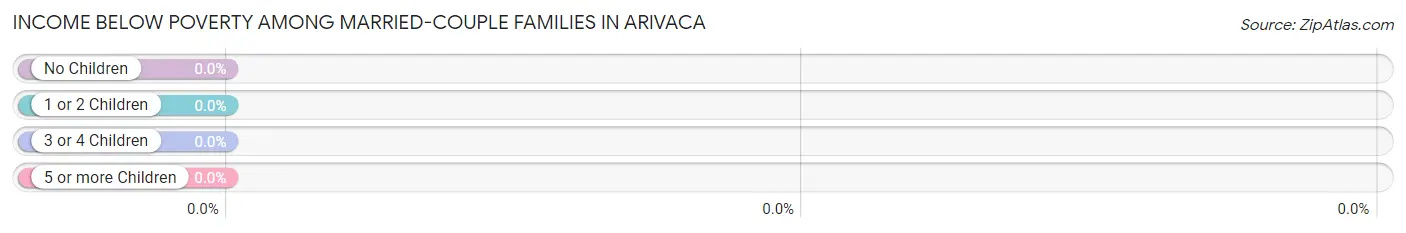
Income Below Poverty Among Married-Couple Families in Arivaca
| Children | Above Poverty | Below Poverty |
| No Children | 49 (100.0%) | 0 (0.0%) |
| 1 or 2 Children | 0 (0.0%) | 0 (0.0%) |
| 3 or 4 Children | 0 (0.0%) | 0 (0.0%) |
| 5 or more Children | 0 (0.0%) | 0 (0.0%) |
| Total | 49 (100.0%) | 0 (0.0%) |
Income Below Poverty Among Single-Parent Households in Arivaca
| Children | Single Father | Single Mother |
| No Children | 0 (0.0%) | 0 (0.0%) |
| 1 or 2 Children | 0 (0.0%) | 0 (0.0%) |
| 3 or 4 Children | 0 (0.0%) | 0 (0.0%) |
| 5 or more Children | 0 (0.0%) | 0 (0.0%) |
| Total | 0 (0.0%) | 0 (0.0%) |
Income Below Poverty Among Married-Couple vs Single-Parent Households in Arivaca
| Children | Married-Couple Families | Single-Parent Households |
| No Children | 0 (0.0%) | 0 (0.0%) |
| 1 or 2 Children | 0 (0.0%) | 0 (0.0%) |
| 3 or 4 Children | 0 (0.0%) | 0 (0.0%) |
| 5 or more Children | 0 (0.0%) | 0 (0.0%) |
| Total | 0 (0.0%) | 0 (0.0%) |
Employment Characteristics in Arivaca
Employment by Class of Employer in Arivaca
Among the 225 employed individuals in Arivaca, private company employees (152 | 67.6%), not-for-profit organizations (27 | 12.0%), and self-employed (not incorporated) (24 | 10.7%) make up the most common classes of employment.
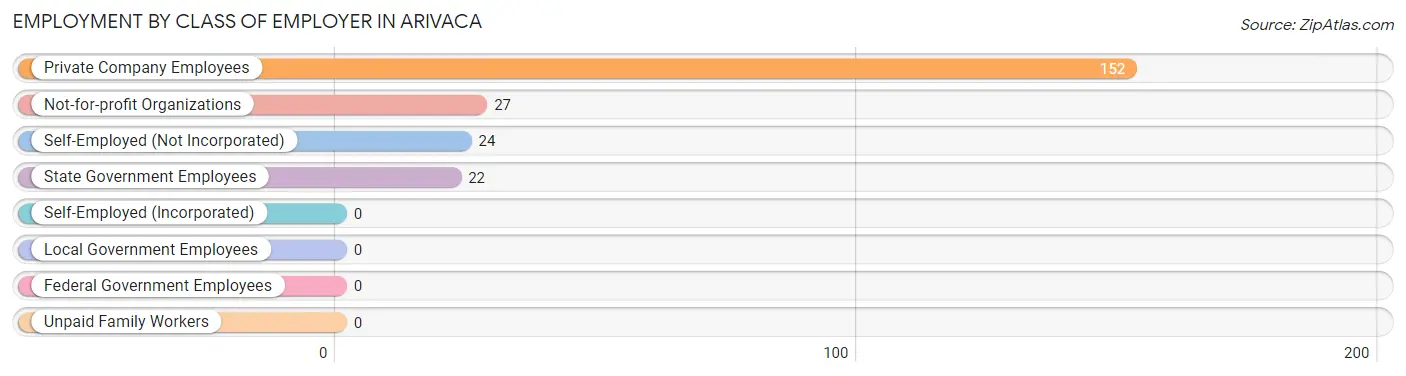
| Employer Class | # Employees | % Employees |
| Private Company Employees | 152 | 67.6% |
| Self-Employed (Incorporated) | 0 | 0.0% |
| Self-Employed (Not Incorporated) | 24 | 10.7% |
| Not-for-profit Organizations | 27 | 12.0% |
| Local Government Employees | 0 | 0.0% |
| State Government Employees | 22 | 9.8% |
| Federal Government Employees | 0 | 0.0% |
| Unpaid Family Workers | 0 | 0.0% |
| Total | 225 | 100.0% |
Employment Status by Age in Arivaca
According to the labor force statistics for Arivaca, out of the total population over 16 years of age (500), 49.2% or 246 individuals are in the labor force, with 8.5% or 21 of them unemployed. The age group with the highest labor force participation rate is 25 to 29 years, with 100.0% or 23 individuals in the labor force. Within the labor force, the 55 to 59 years age range has the highest percentage of unemployed individuals, with 100.0% or 21 of them being unemployed.
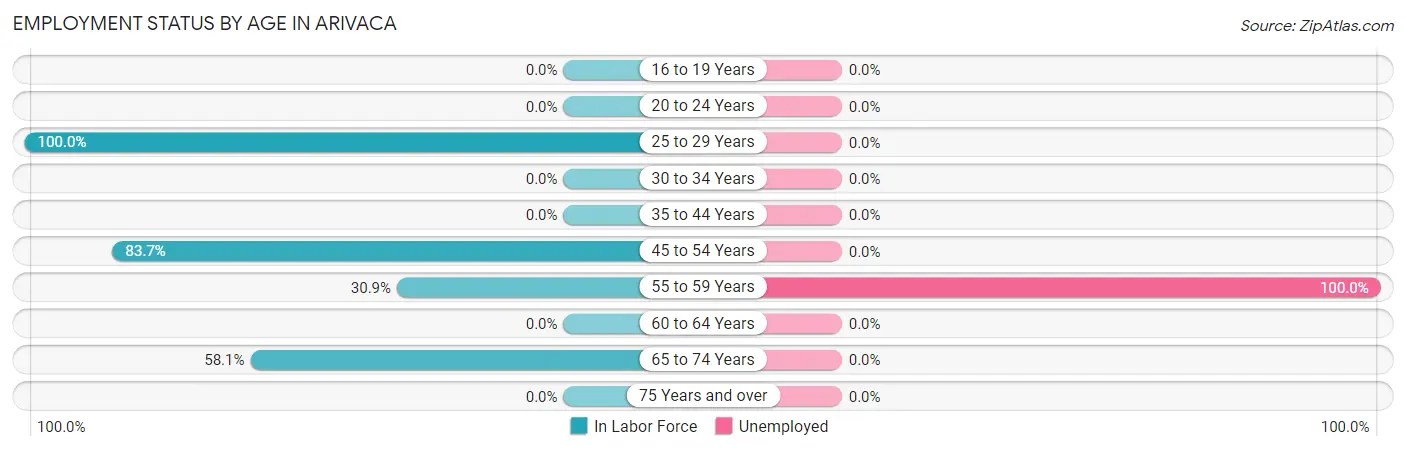
| Age Bracket | In Labor Force | Unemployed |
| 16 to 19 Years | 0 (0.0%) | 0 (0.0%) |
| 20 to 24 Years | 0 (0.0%) | 0 (0.0%) |
| 25 to 29 Years | 23 (100.0%) | 0 (0.0%) |
| 30 to 34 Years | 0 (0.0%) | 0 (0.0%) |
| 35 to 44 Years | 0 (0.0%) | 0 (0.0%) |
| 45 to 54 Years | 123 (83.7%) | 0 (0.0%) |
| 55 to 59 Years | 21 (30.9%) | 21 (100.0%) |
| 60 to 64 Years | 0 (0.0%) | 0 (0.0%) |
| 65 to 74 Years | 79 (58.1%) | 0 (0.0%) |
| 75 Years and over | 0 (0.0%) | 0 (0.0%) |
| Total | 246 (49.2%) | 21 (8.5%) |
Employment Status by Educational Attainment in Arivaca
According to labor force statistics for Arivaca, 70.2% of individuals (167) out of the total population between 25 and 64 years of age (238) are in the labor force, with 12.6% or 21 of them being unemployed. The group with the highest labor force participation rate are those with the educational attainment of high school diploma, with 81.0% or 102 individuals in the labor force. Within the labor force, individuals with college / associate degree education have the highest percentage of unemployment, with 48.8% or 21 of them being unemployed.
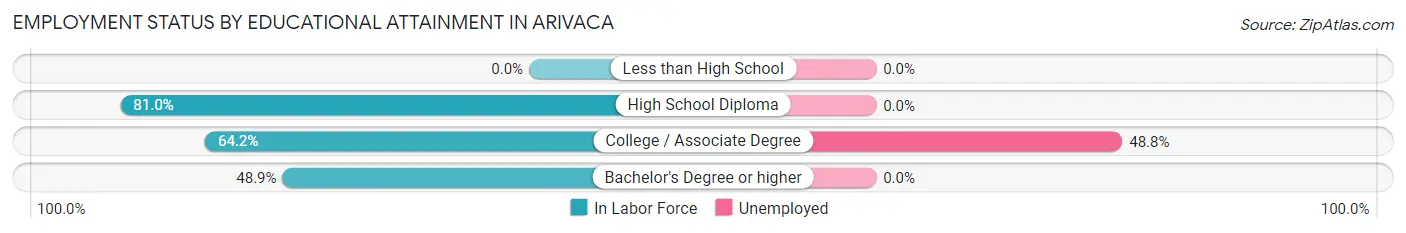
| Educational Attainment | In Labor Force | Unemployed |
| Less than High School | 0 (0.0%) | 0 (0.0%) |
| High School Diploma | 102 (81.0%) | 0 (0.0%) |
| College / Associate Degree | 43 (64.2%) | 33 (48.8%) |
| Bachelor's Degree or higher | 22 (48.9%) | 0 (0.0%) |
| Total | 167 (70.2%) | 30 (12.6%) |
Employment Occupations by Sex in Arivaca
Management, Business, Science and Arts Occupations
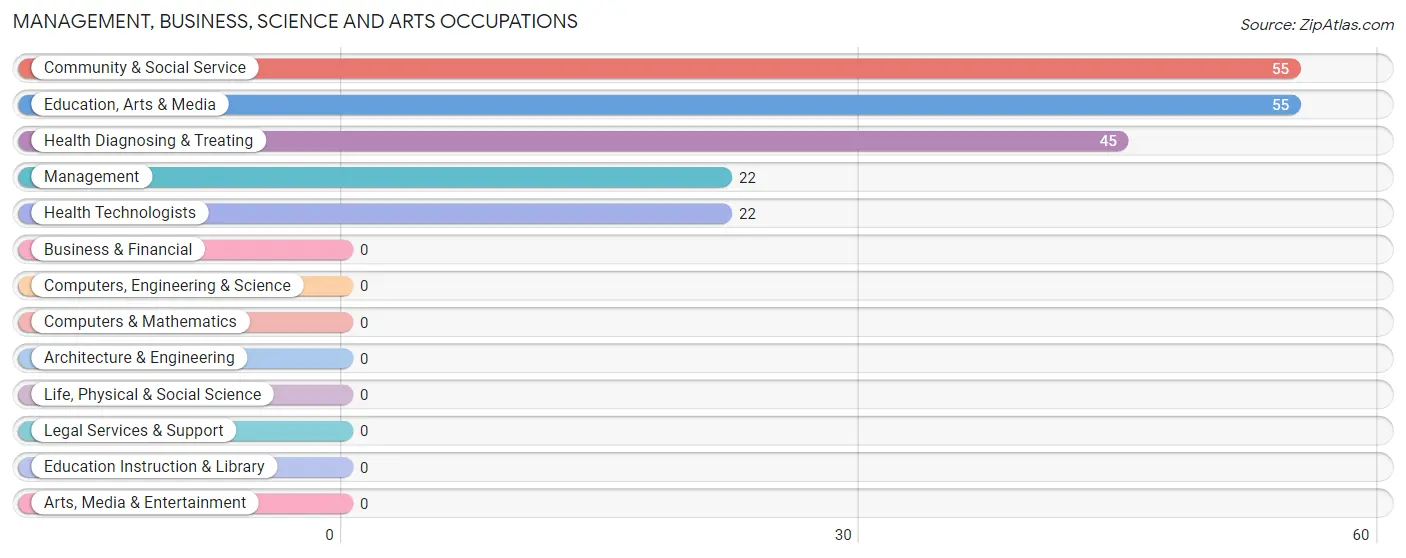
The most common Management, Business, Science and Arts occupations in Arivaca are Community & Social Service (55 | 24.4%), Education, Arts & Media (55 | 24.4%), Health Diagnosing & Treating (45 | 20.0%), Management (22 | 9.8%), and Health Technologists (22 | 9.8%).
Management, Business, Science and Arts Occupations by Sex
Within the Management, Business, Science and Arts occupations in Arivaca, the most male-oriented occupations are Management (100.0%), Community & Social Service (100.0%), and Education, Arts & Media (100.0%), while the most female-oriented occupations are Health Technologists (100.0%), and Health Diagnosing & Treating (48.9%).
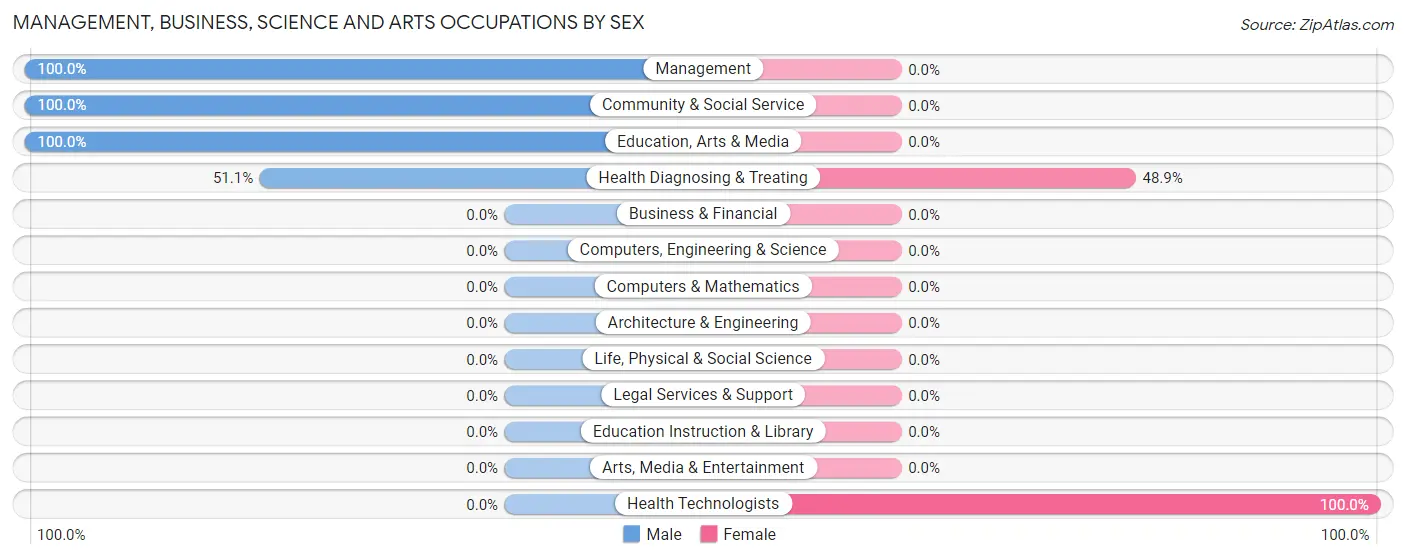
| Occupation | Male | Female |
| Management | 22 (100.0%) | 0 (0.0%) |
| Business & Financial | 0 (0.0%) | 0 (0.0%) |
| Computers, Engineering & Science | 0 (0.0%) | 0 (0.0%) |
| Computers & Mathematics | 0 (0.0%) | 0 (0.0%) |
| Architecture & Engineering | 0 (0.0%) | 0 (0.0%) |
| Life, Physical & Social Science | 0 (0.0%) | 0 (0.0%) |
| Community & Social Service | 55 (100.0%) | 0 (0.0%) |
| Education, Arts & Media | 55 (100.0%) | 0 (0.0%) |
| Legal Services & Support | 0 (0.0%) | 0 (0.0%) |
| Education Instruction & Library | 0 (0.0%) | 0 (0.0%) |
| Arts, Media & Entertainment | 0 (0.0%) | 0 (0.0%) |
| Health Diagnosing & Treating | 23 (51.1%) | 22 (48.9%) |
| Health Technologists | 0 (0.0%) | 22 (100.0%) |
| Total (Category) | 100 (82.0%) | 22 (18.0%) |
| Total (Overall) | 152 (67.6%) | 73 (32.4%) |
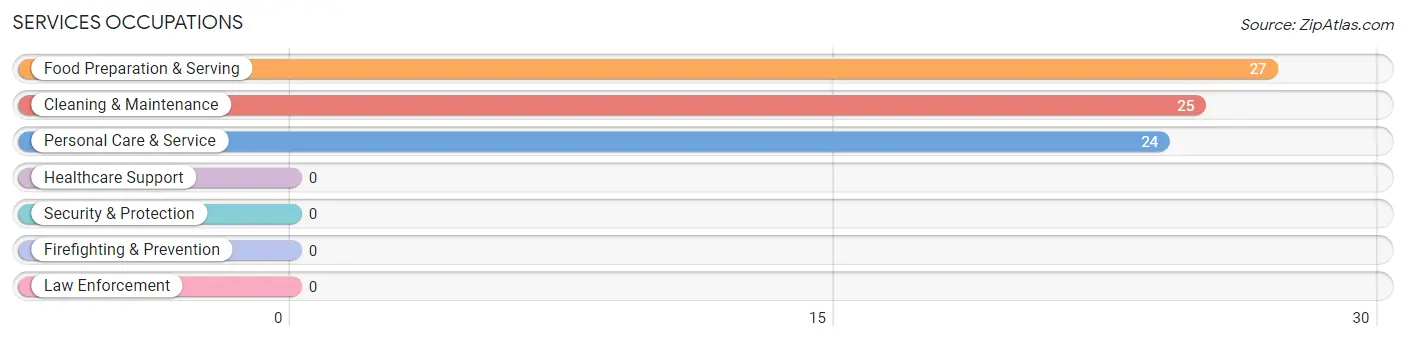
Services Occupations
The most common Services occupations in Arivaca are Food Preparation & Serving (27 | 12.0%), Cleaning & Maintenance (25 | 11.1%), and Personal Care & Service (24 | 10.7%).
Services Occupations by Sex
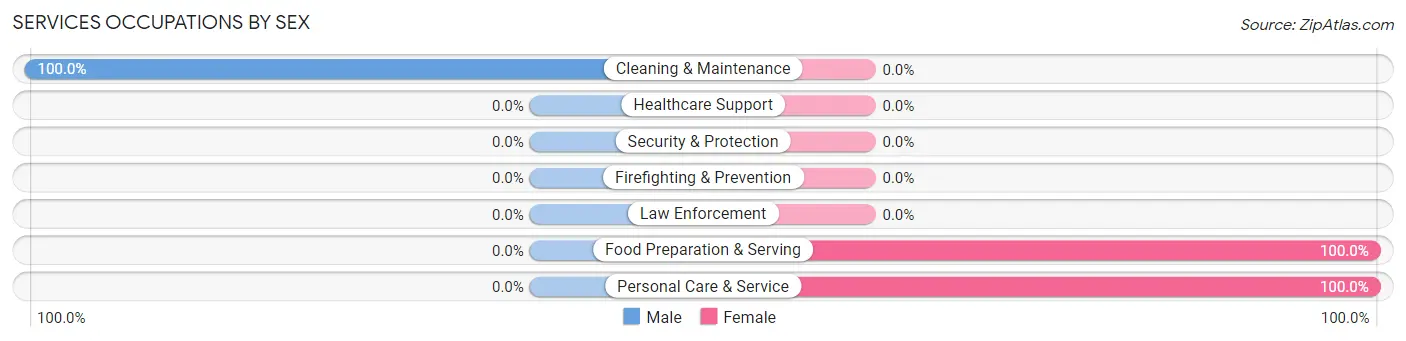
| Occupation | Male | Female |
| Healthcare Support | 0 (0.0%) | 0 (0.0%) |
| Security & Protection | 0 (0.0%) | 0 (0.0%) |
| Firefighting & Prevention | 0 (0.0%) | 0 (0.0%) |
| Law Enforcement | 0 (0.0%) | 0 (0.0%) |
| Food Preparation & Serving | 0 (0.0%) | 27 (100.0%) |
| Cleaning & Maintenance | 25 (100.0%) | 0 (0.0%) |
| Personal Care & Service | 0 (0.0%) | 24 (100.0%) |
| Total (Category) | 25 (32.9%) | 51 (67.1%) |
| Total (Overall) | 152 (67.6%) | 73 (32.4%) |
Sales and Office Occupations
Sales and Office Occupations by Sex
| Occupation | Male | Female |
| Sales & Related | 0 (0.0%) | 0 (0.0%) |
| Office & Administration | 0 (0.0%) | 0 (0.0%) |
| Total (Category) | 0 (0.0%) | 0 (0.0%) |
| Total (Overall) | 152 (67.6%) | 73 (32.4%) |
Natural Resources, Construction and Maintenance Occupations
Natural Resources, Construction and Maintenance Occupations by Sex
| Occupation | Male | Female |
| Farming, Fishing & Forestry | 0 (0.0%) | 0 (0.0%) |
| Construction & Extraction | 0 (0.0%) | 0 (0.0%) |
| Installation, Maintenance & Repair | 0 (0.0%) | 0 (0.0%) |
| Total (Category) | 0 (0.0%) | 0 (0.0%) |
| Total (Overall) | 152 (67.6%) | 73 (32.4%) |
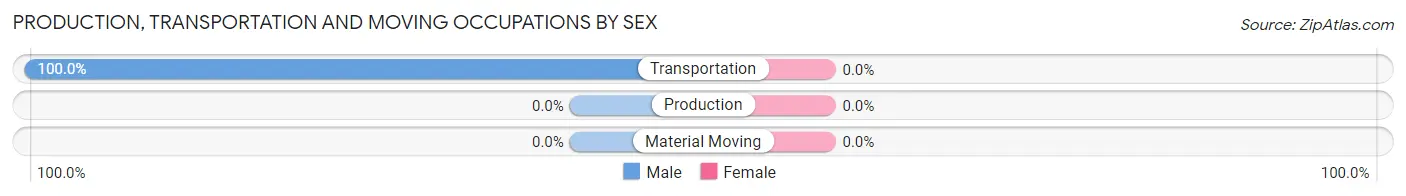
Production, Transportation and Moving Occupations
The most common Production, Transportation and Moving occupations in Arivaca are , and Transportation (27 | 12.0%).
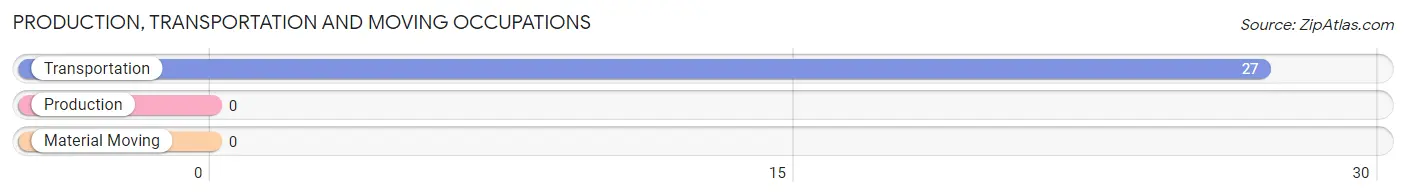
Production, Transportation and Moving Occupations by Sex
| Occupation | Male | Female |
| Production | 0 (0.0%) | 0 (0.0%) |
| Transportation | 27 (100.0%) | 0 (0.0%) |
| Material Moving | 0 (0.0%) | 0 (0.0%) |
| Total (Category) | 27 (100.0%) | 0 (0.0%) |
| Total (Overall) | 152 (67.6%) | 73 (32.4%) |
Employment Industries by Sex in Arivaca
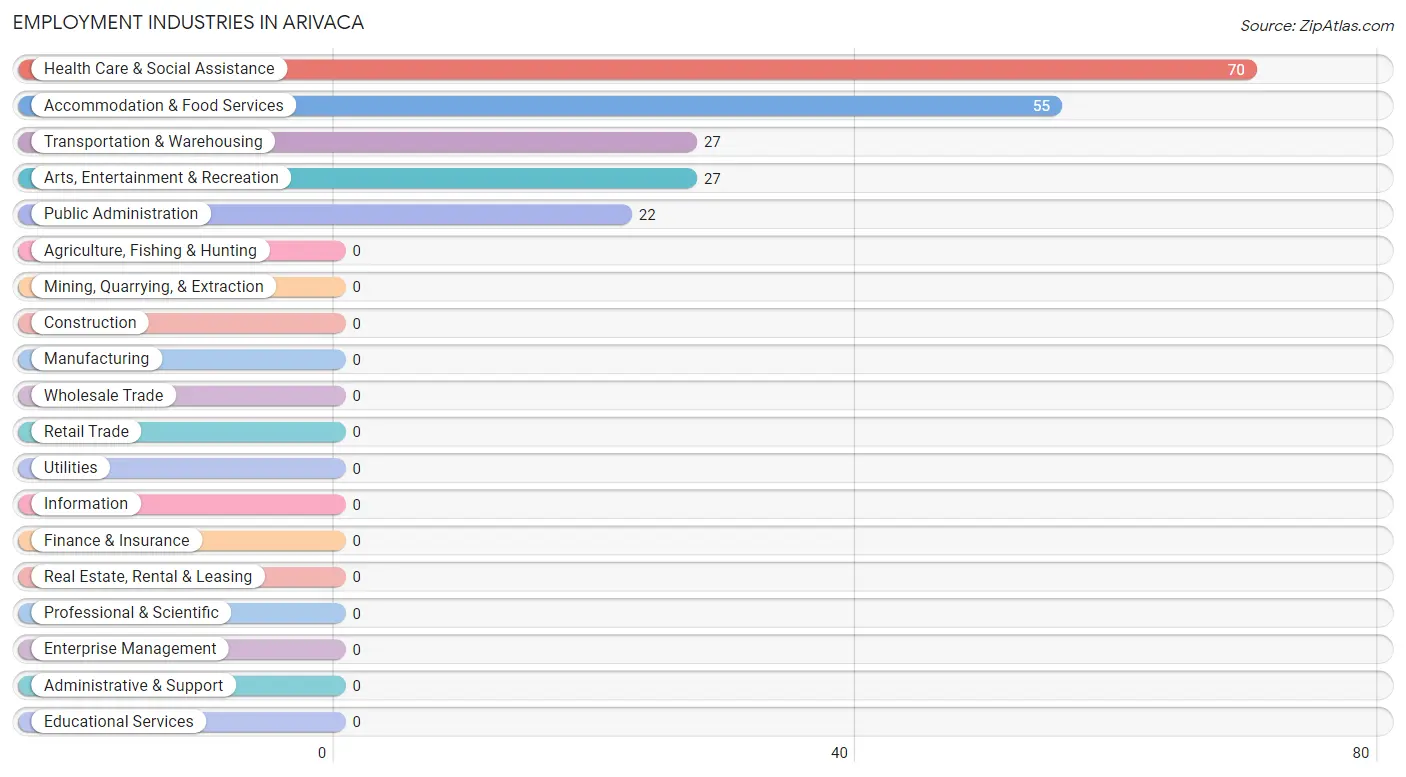
Employment Industries in Arivaca
The major employment industries in Arivaca include Health Care & Social Assistance (70 | 31.1%), Accommodation & Food Services (55 | 24.4%), Transportation & Warehousing (27 | 12.0%), Arts, Entertainment & Recreation (27 | 12.0%), and Public Administration (22 | 9.8%).
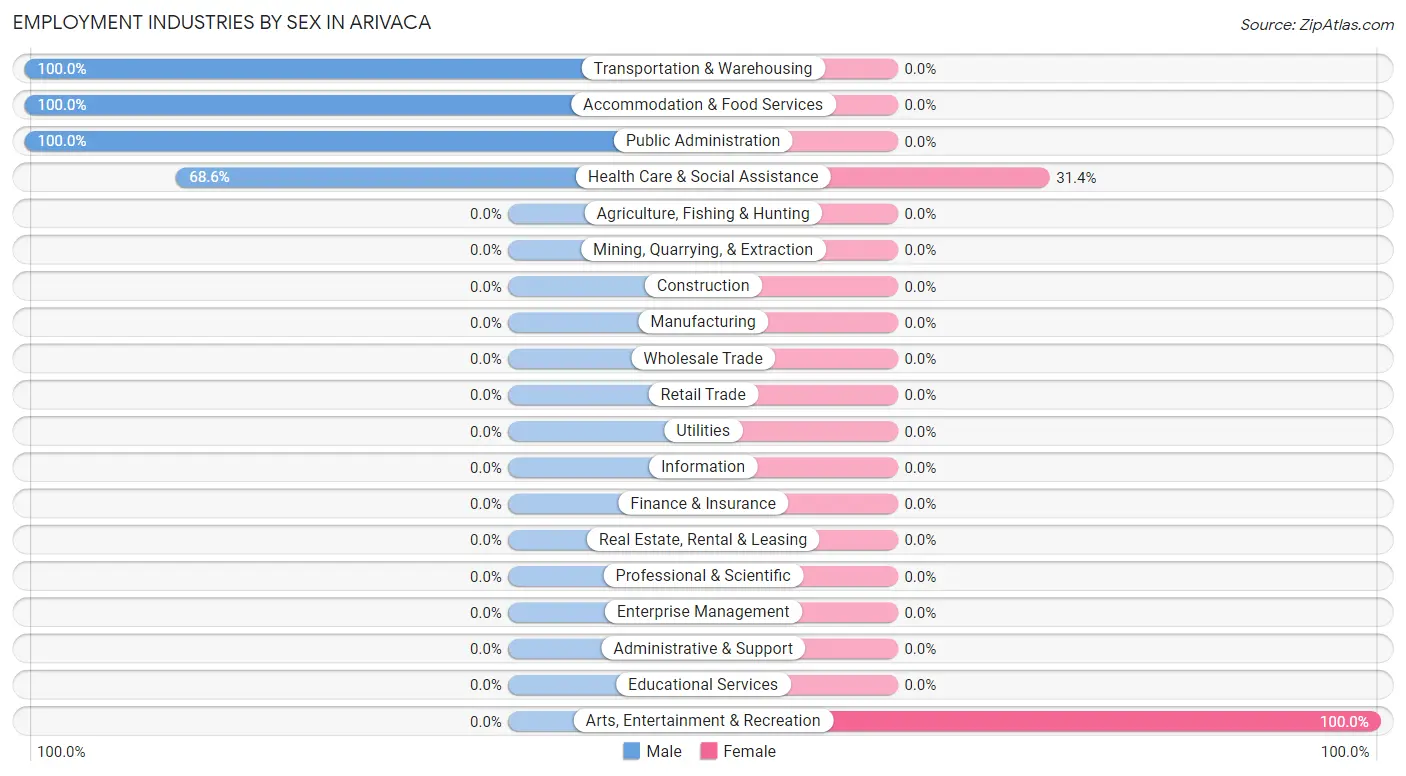
Employment Industries by Sex in Arivaca
The Arivaca industries that see more men than women are Transportation & Warehousing (100.0%), Accommodation & Food Services (100.0%), and Public Administration (100.0%), whereas the industries that tend to have a higher number of women are Arts, Entertainment & Recreation (100.0%), and Health Care & Social Assistance (31.4%).
| Industry | Male | Female |
| Agriculture, Fishing & Hunting | 0 (0.0%) | 0 (0.0%) |
| Mining, Quarrying, & Extraction | 0 (0.0%) | 0 (0.0%) |
| Construction | 0 (0.0%) | 0 (0.0%) |
| Manufacturing | 0 (0.0%) | 0 (0.0%) |
| Wholesale Trade | 0 (0.0%) | 0 (0.0%) |
| Retail Trade | 0 (0.0%) | 0 (0.0%) |
| Transportation & Warehousing | 27 (100.0%) | 0 (0.0%) |
| Utilities | 0 (0.0%) | 0 (0.0%) |
| Information | 0 (0.0%) | 0 (0.0%) |
| Finance & Insurance | 0 (0.0%) | 0 (0.0%) |
| Real Estate, Rental & Leasing | 0 (0.0%) | 0 (0.0%) |
| Professional & Scientific | 0 (0.0%) | 0 (0.0%) |
| Enterprise Management | 0 (0.0%) | 0 (0.0%) |
| Administrative & Support | 0 (0.0%) | 0 (0.0%) |
| Educational Services | 0 (0.0%) | 0 (0.0%) |
| Health Care & Social Assistance | 48 (68.6%) | 22 (31.4%) |
| Arts, Entertainment & Recreation | 0 (0.0%) | 27 (100.0%) |
| Accommodation & Food Services | 55 (100.0%) | 0 (0.0%) |
| Public Administration | 22 (100.0%) | 0 (0.0%) |
| Total | 152 (67.6%) | 73 (32.4%) |
Education in Arivaca
School Enrollment in Arivaca
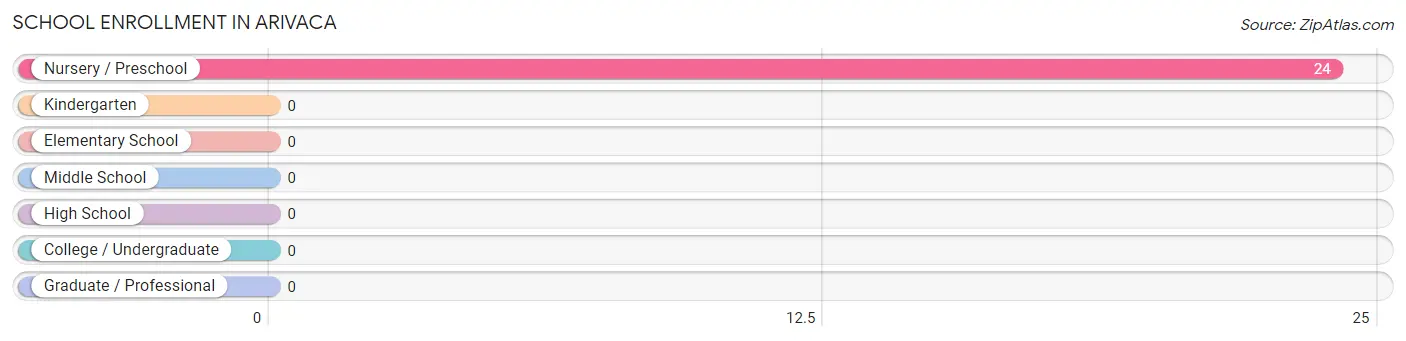
| School Level | # Students | % Students |
| Nursery / Preschool | 24 | 100.0% |
| Kindergarten | 0 | 0.0% |
| Elementary School | 0 | 0.0% |
| Middle School | 0 | 0.0% |
| High School | 0 | 0.0% |
| College / Undergraduate | 0 | 0.0% |
| Graduate / Professional | 0 | 0.0% |
| Total | 24 | 100.0% |
School Enrollment by Age by Funding Source in Arivaca
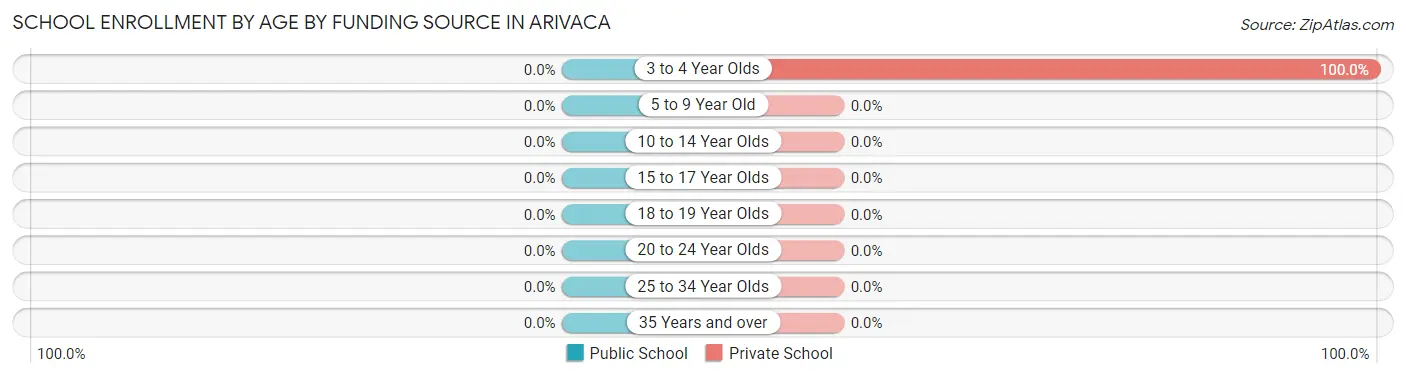
| Age Bracket | Public School | Private School |
| 3 to 4 Year Olds | 0 (0.0%) | 24 (100.0%) |
| 5 to 9 Year Old | 0 (0.0%) | 0 (0.0%) |
| 10 to 14 Year Olds | 0 (0.0%) | 0 (0.0%) |
| 15 to 17 Year Olds | 0 (0.0%) | 0 (0.0%) |
| 18 to 19 Year Olds | 0 (0.0%) | 0 (0.0%) |
| 20 to 24 Year Olds | 0 (0.0%) | 0 (0.0%) |
| 25 to 34 Year Olds | 0 (0.0%) | 0 (0.0%) |
| 35 Years and over | 0 (0.0%) | 0 (0.0%) |
| Total | 0 (0.0%) | 24 (100.0%) |
Educational Attainment by Field of Study in Arivaca
Business (55 | 45.5%), computers & mathematics (23 | 19.0%), engineering (22 | 18.2%), and communications (21 | 17.4%) are the most common fields of study among 121 individuals in Arivaca who have obtained a bachelor's degree or higher.
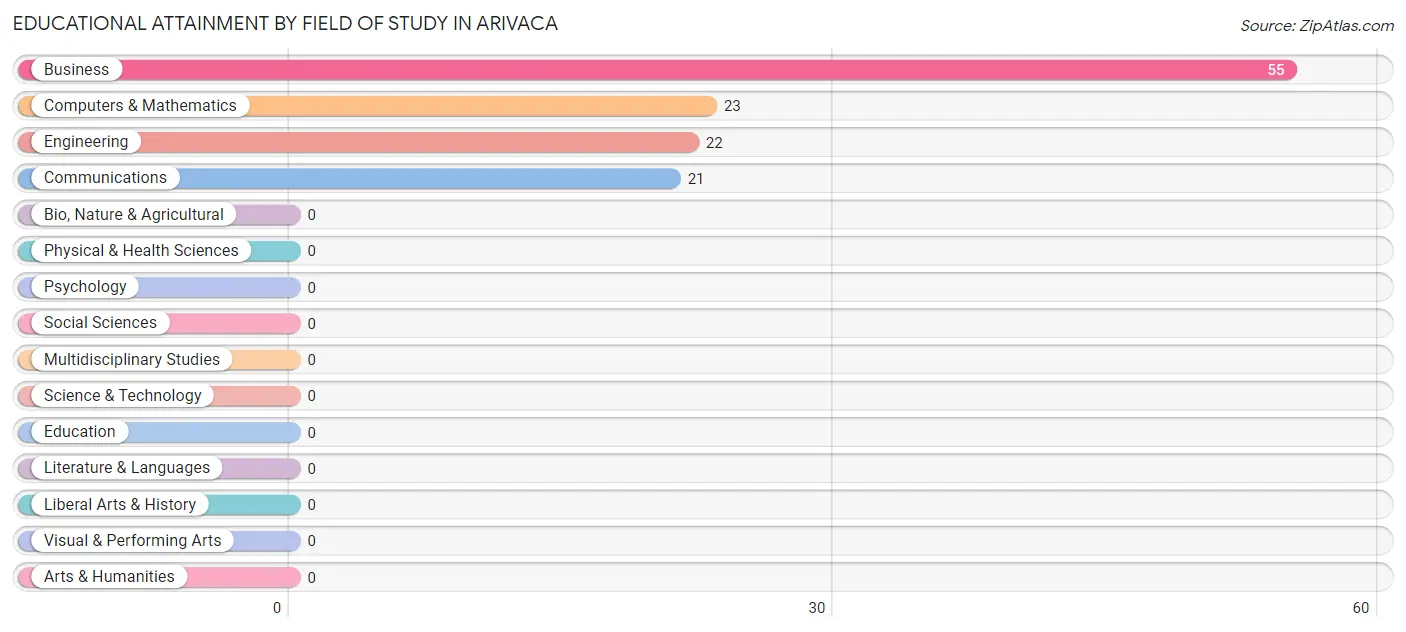
| Field of Study | # Graduates | % Graduates |
| Computers & Mathematics | 23 | 19.0% |
| Bio, Nature & Agricultural | 0 | 0.0% |
| Physical & Health Sciences | 0 | 0.0% |
| Psychology | 0 | 0.0% |
| Social Sciences | 0 | 0.0% |
| Engineering | 22 | 18.2% |
| Multidisciplinary Studies | 0 | 0.0% |
| Science & Technology | 0 | 0.0% |
| Business | 55 | 45.5% |
| Education | 0 | 0.0% |
| Literature & Languages | 0 | 0.0% |
| Liberal Arts & History | 0 | 0.0% |
| Visual & Performing Arts | 0 | 0.0% |
| Communications | 21 | 17.4% |
| Arts & Humanities | 0 | 0.0% |
| Total | 121 | 100.0% |
Transportation & Commute in Arivaca
Vehicle Availability by Sex in Arivaca
The most prevalent vehicle ownership categories in Arivaca are males with 2 vehicles (104, accounting for 68.4%) and females with 2 vehicles (46, making up 142.5%).
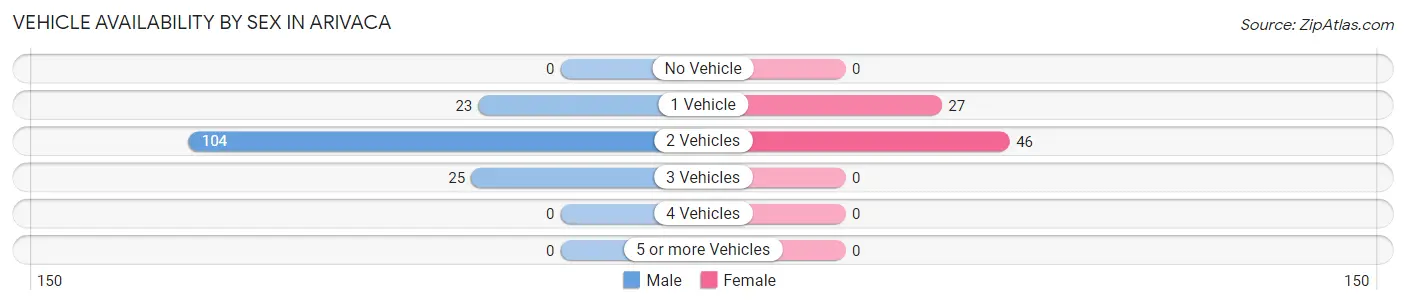
| Vehicles Available | Male | Female |
| No Vehicle | 0 (0.0%) | 0 (0.0%) |
| 1 Vehicle | 23 (15.1%) | 27 (37.0%) |
| 2 Vehicles | 104 (68.4%) | 46 (63.0%) |
| 3 Vehicles | 25 (16.5%) | 0 (0.0%) |
| 4 Vehicles | 0 (0.0%) | 0 (0.0%) |
| 5 or more Vehicles | 0 (0.0%) | 0 (0.0%) |
| Total | 152 (100.0%) | 73 (100.0%) |
Commute Time in Arivaca
The most frequently occuring commute durations in Arivaca are 5 to 9 minutes (102 commuters, 45.3%), 20 to 24 minutes (27 commuters, 12.0%), and 25 to 29 minutes (27 commuters, 12.0%).
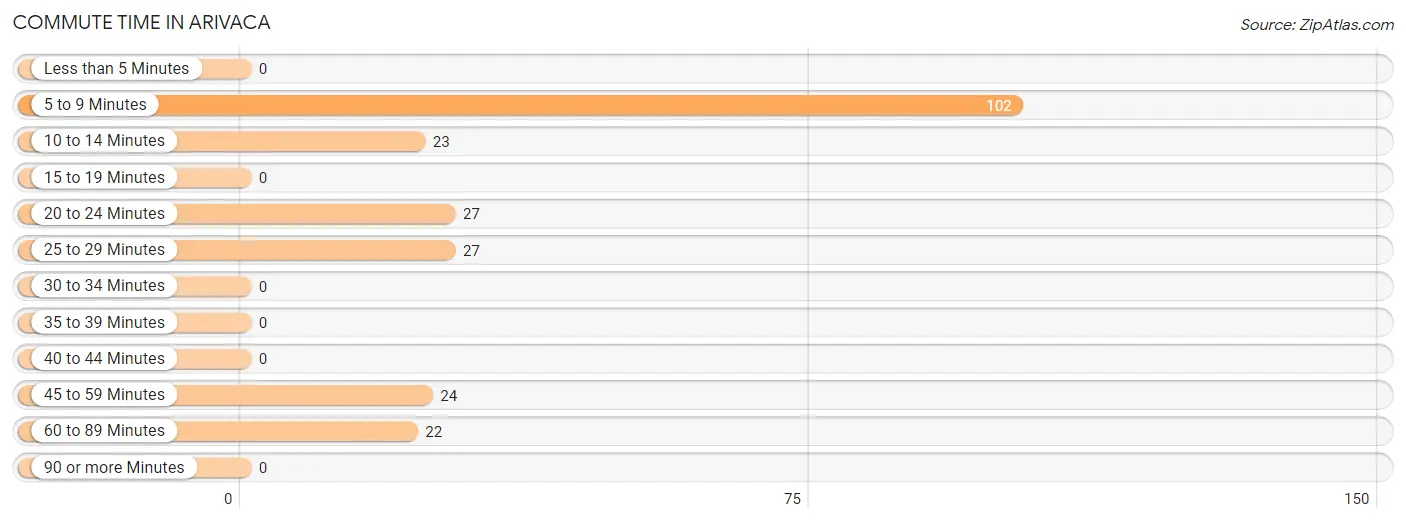
| Commute Time | # Commuters | % Commuters |
| Less than 5 Minutes | 0 | 0.0% |
| 5 to 9 Minutes | 102 | 45.3% |
| 10 to 14 Minutes | 23 | 10.2% |
| 15 to 19 Minutes | 0 | 0.0% |
| 20 to 24 Minutes | 27 | 12.0% |
| 25 to 29 Minutes | 27 | 12.0% |
| 30 to 34 Minutes | 0 | 0.0% |
| 35 to 39 Minutes | 0 | 0.0% |
| 40 to 44 Minutes | 0 | 0.0% |
| 45 to 59 Minutes | 24 | 10.7% |
| 60 to 89 Minutes | 22 | 9.8% |
| 90 or more Minutes | 0 | 0.0% |
Commute Time by Sex in Arivaca
The most common commute times in Arivaca are 5 to 9 minutes (102 commuters, 67.1%) for males and 25 to 29 minutes (27 commuters, 37.0%) for females.
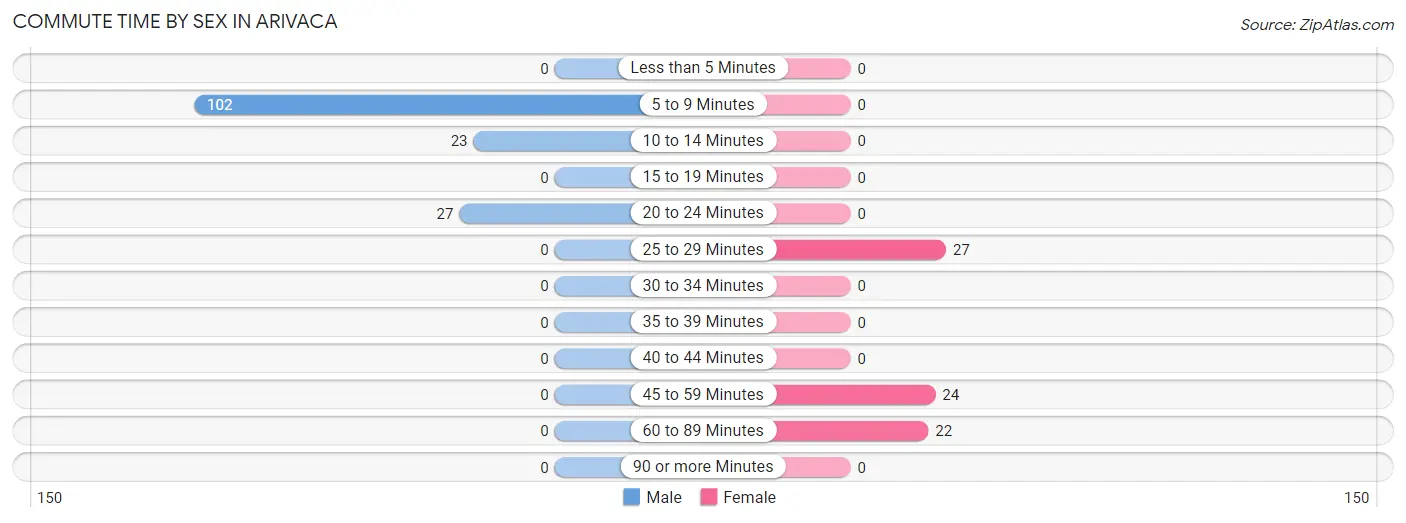
| Commute Time | Male | Female |
| Less than 5 Minutes | 0 (0.0%) | 0 (0.0%) |
| 5 to 9 Minutes | 102 (67.1%) | 0 (0.0%) |
| 10 to 14 Minutes | 23 (15.1%) | 0 (0.0%) |
| 15 to 19 Minutes | 0 (0.0%) | 0 (0.0%) |
| 20 to 24 Minutes | 27 (17.8%) | 0 (0.0%) |
| 25 to 29 Minutes | 0 (0.0%) | 27 (37.0%) |
| 30 to 34 Minutes | 0 (0.0%) | 0 (0.0%) |
| 35 to 39 Minutes | 0 (0.0%) | 0 (0.0%) |
| 40 to 44 Minutes | 0 (0.0%) | 0 (0.0%) |
| 45 to 59 Minutes | 0 (0.0%) | 24 (32.9%) |
| 60 to 89 Minutes | 0 (0.0%) | 22 (30.1%) |
| 90 or more Minutes | 0 (0.0%) | 0 (0.0%) |
Time of Departure to Work by Sex in Arivaca
The most frequent times of departure to work in Arivaca are 4:00 PM to 11:59 PM (78, 51.3%) for males and 8:30 AM to 8:59 AM (51, 69.9%) for females.
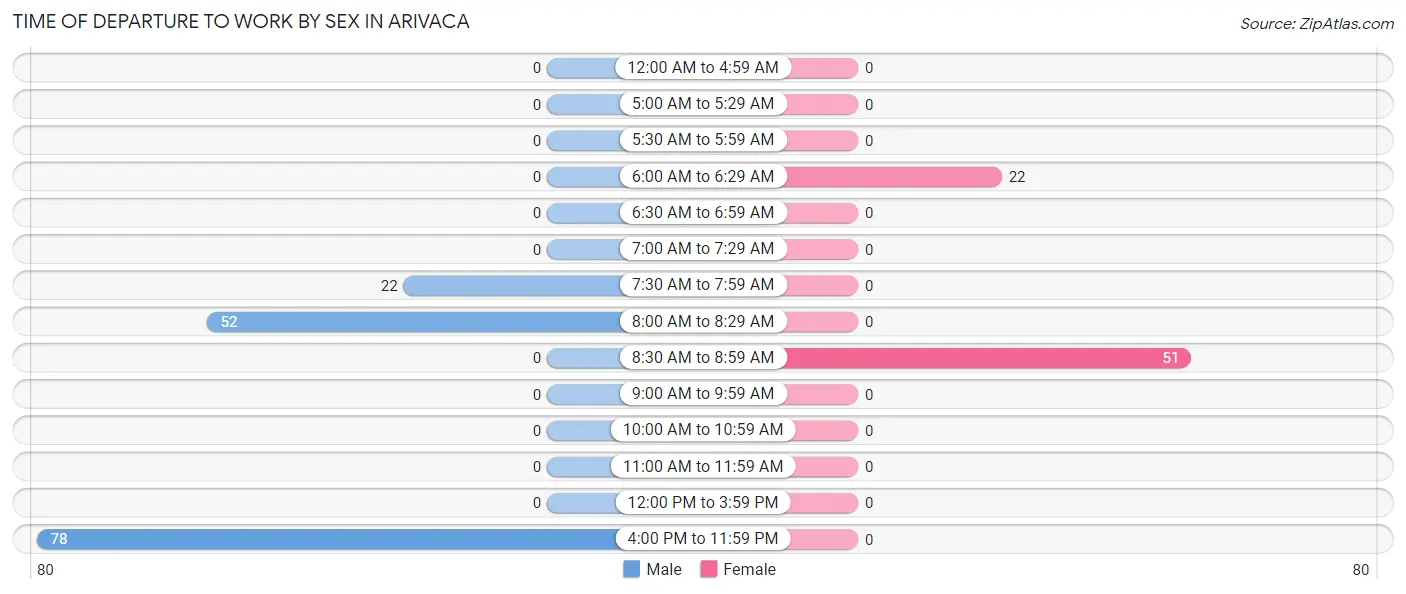
| Time of Departure | Male | Female |
| 12:00 AM to 4:59 AM | 0 (0.0%) | 0 (0.0%) |
| 5:00 AM to 5:29 AM | 0 (0.0%) | 0 (0.0%) |
| 5:30 AM to 5:59 AM | 0 (0.0%) | 0 (0.0%) |
| 6:00 AM to 6:29 AM | 0 (0.0%) | 22 (30.1%) |
| 6:30 AM to 6:59 AM | 0 (0.0%) | 0 (0.0%) |
| 7:00 AM to 7:29 AM | 0 (0.0%) | 0 (0.0%) |
| 7:30 AM to 7:59 AM | 22 (14.5%) | 0 (0.0%) |
| 8:00 AM to 8:29 AM | 52 (34.2%) | 0 (0.0%) |
| 8:30 AM to 8:59 AM | 0 (0.0%) | 51 (69.9%) |
| 9:00 AM to 9:59 AM | 0 (0.0%) | 0 (0.0%) |
| 10:00 AM to 10:59 AM | 0 (0.0%) | 0 (0.0%) |
| 11:00 AM to 11:59 AM | 0 (0.0%) | 0 (0.0%) |
| 12:00 PM to 3:59 PM | 0 (0.0%) | 0 (0.0%) |
| 4:00 PM to 11:59 PM | 78 (51.3%) | 0 (0.0%) |
| Total | 152 (100.0%) | 73 (100.0%) |
Housing Occupancy in Arivaca
Occupancy by Ownership in Arivaca
Of the total 332 dwellings in Arivaca, owner-occupied units account for 270 (81.3%), while renter-occupied units make up 62 (18.7%).
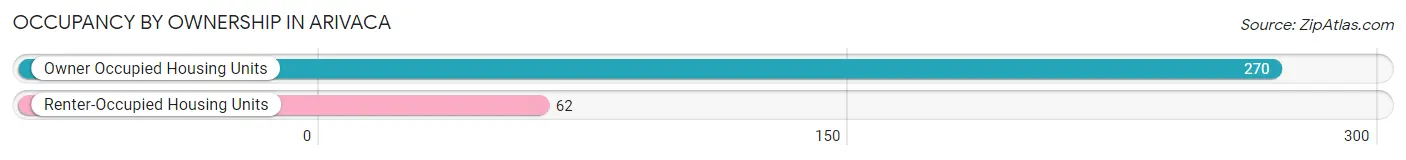
| Occupancy | # Housing Units | % Housing Units |
| Owner Occupied Housing Units | 270 | 81.3% |
| Renter-Occupied Housing Units | 62 | 18.7% |
| Total Occupied Housing Units | 332 | 100.0% |
Occupancy by Household Size in Arivaca
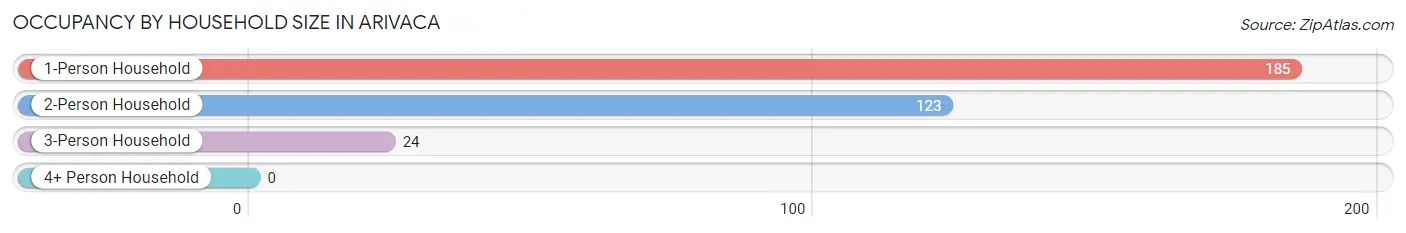
| Household Size | # Housing Units | % Housing Units |
| 1-Person Household | 185 | 55.7% |
| 2-Person Household | 123 | 37.0% |
| 3-Person Household | 24 | 7.2% |
| 4+ Person Household | 0 | 0.0% |
| Total Housing Units | 332 | 100.0% |
Occupancy by Ownership by Household Size in Arivaca
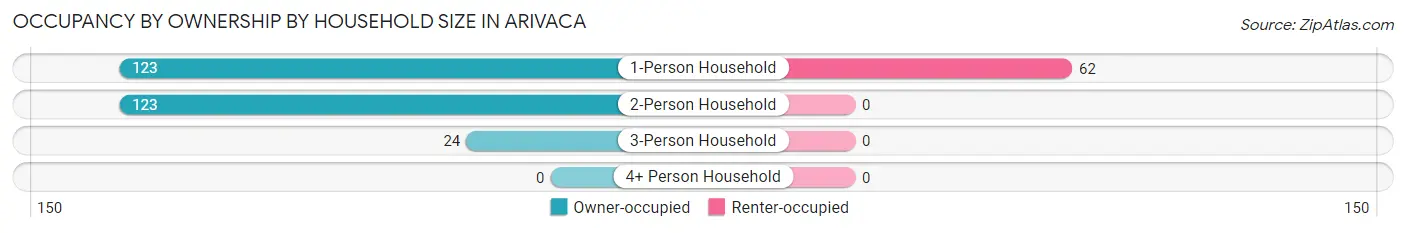
| Household Size | Owner-occupied | Renter-occupied |
| 1-Person Household | 123 (66.5%) | 62 (33.5%) |
| 2-Person Household | 123 (100.0%) | 0 (0.0%) |
| 3-Person Household | 24 (100.0%) | 0 (0.0%) |
| 4+ Person Household | 0 (0.0%) | 0 (0.0%) |
| Total Housing Units | 270 (81.3%) | 62 (18.7%) |
Occupancy by Educational Attainment in Arivaca
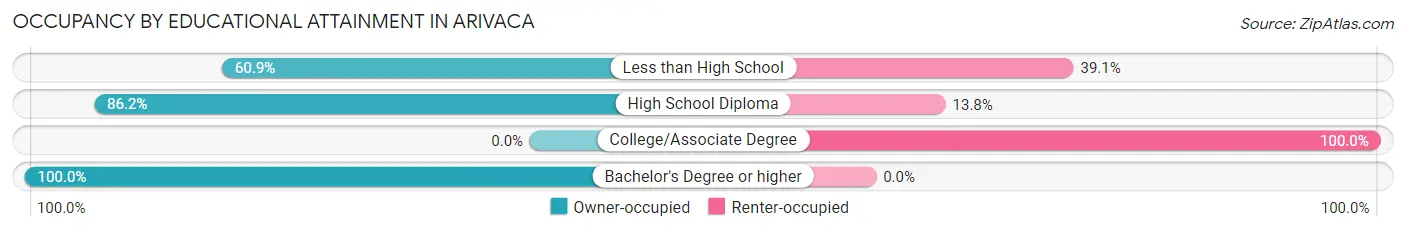
| Household Size | Owner-occupied | Renter-occupied |
| Less than High School | 28 (60.9%) | 18 (39.1%) |
| High School Diploma | 144 (86.2%) | 23 (13.8%) |
| College/Associate Degree | 0 (0.0%) | 21 (100.0%) |
| Bachelor's Degree or higher | 98 (100.0%) | 0 (0.0%) |
Occupancy by Age of Householder in Arivaca
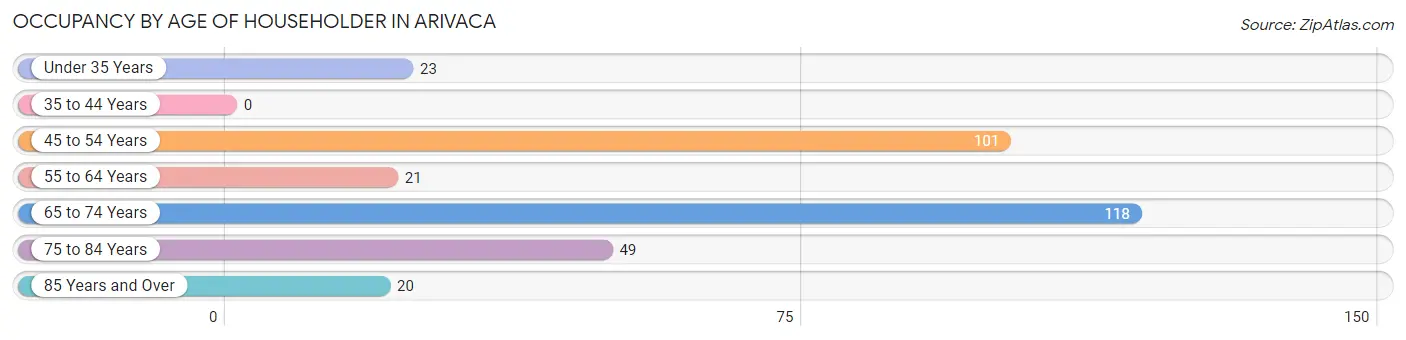
| Age Bracket | # Households | % Households |
| Under 35 Years | 23 | 6.9% |
| 35 to 44 Years | 0 | 0.0% |
| 45 to 54 Years | 101 | 30.4% |
| 55 to 64 Years | 21 | 6.3% |
| 65 to 74 Years | 118 | 35.5% |
| 75 to 84 Years | 49 | 14.8% |
| 85 Years and Over | 20 | 6.0% |
| Total | 332 | 100.0% |
Housing Finances in Arivaca
Median Income by Occupancy in Arivaca
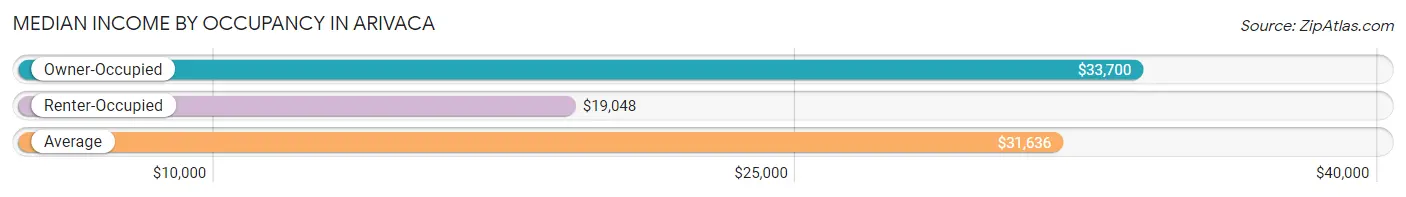
| Occupancy Type | # Households | Median Income |
| Owner-Occupied | 270 (81.3%) | $33,700 |
| Renter-Occupied | 62 (18.7%) | $19,048 |
| Average | 332 (100.0%) | $31,636 |
Occupancy by Householder Income Bracket in Arivaca
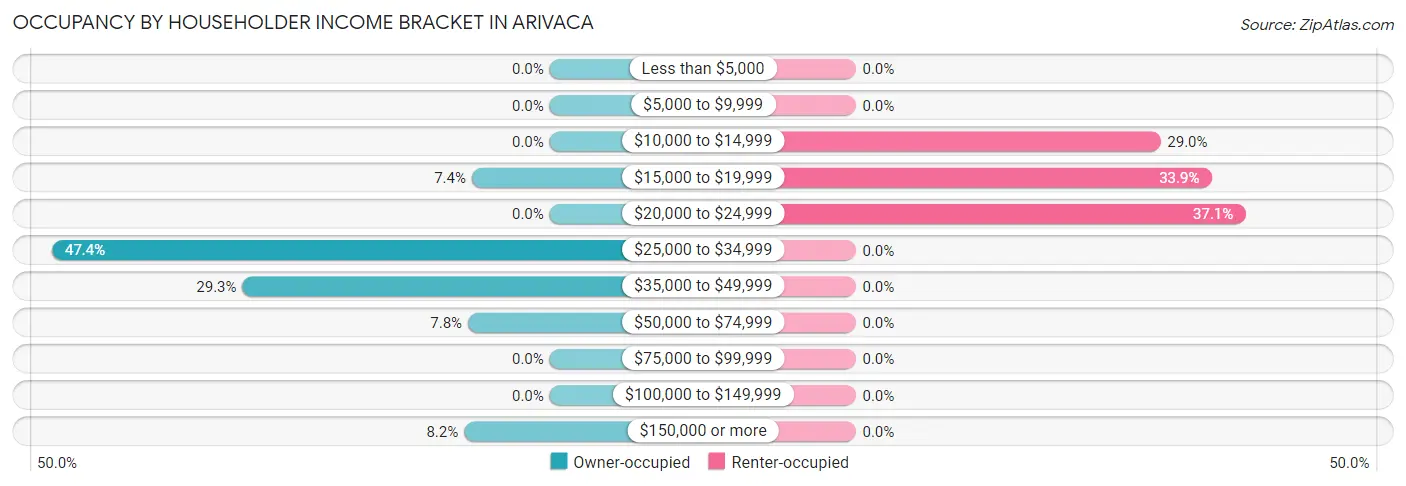
| Income Bracket | Owner-occupied | Renter-occupied |
| Less than $5,000 | 0 (0.0%) | 0 (0.0%) |
| $5,000 to $9,999 | 0 (0.0%) | 0 (0.0%) |
| $10,000 to $14,999 | 0 (0.0%) | 18 (29.0%) |
| $15,000 to $19,999 | 20 (7.4%) | 21 (33.9%) |
| $20,000 to $24,999 | 0 (0.0%) | 23 (37.1%) |
| $25,000 to $34,999 | 128 (47.4%) | 0 (0.0%) |
| $35,000 to $49,999 | 79 (29.3%) | 0 (0.0%) |
| $50,000 to $74,999 | 21 (7.8%) | 0 (0.0%) |
| $75,000 to $99,999 | 0 (0.0%) | 0 (0.0%) |
| $100,000 to $149,999 | 0 (0.0%) | 0 (0.0%) |
| $150,000 or more | 22 (8.2%) | 0 (0.0%) |
| Total | 270 (100.0%) | 62 (100.0%) |
Monthly Housing Cost Tiers in Arivaca
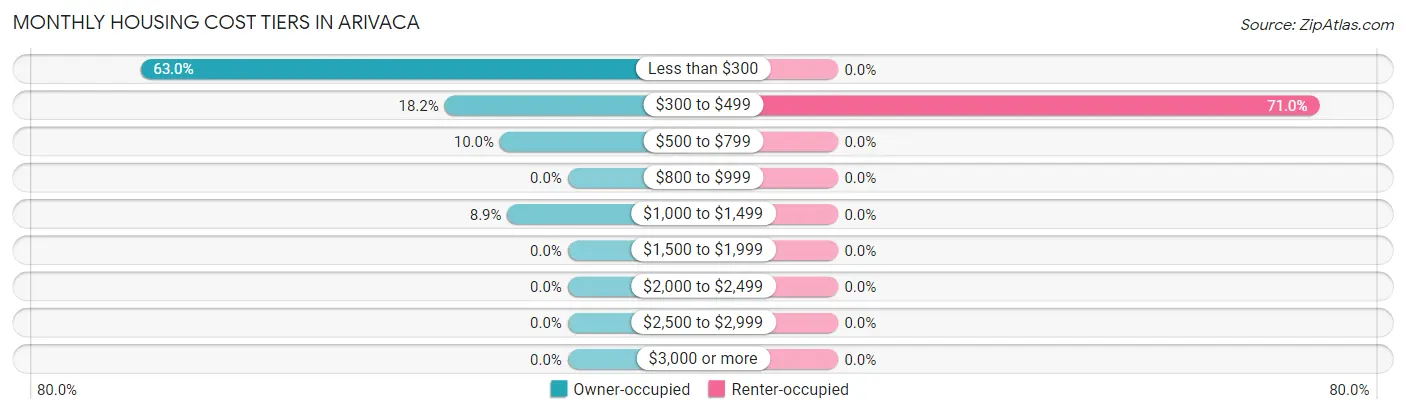
| Monthly Cost | Owner-occupied | Renter-occupied |
| Less than $300 | 170 (63.0%) | 0 (0.0%) |
| $300 to $499 | 49 (18.1%) | 44 (71.0%) |
| $500 to $799 | 27 (10.0%) | 0 (0.0%) |
| $800 to $999 | 0 (0.0%) | 0 (0.0%) |
| $1,000 to $1,499 | 24 (8.9%) | 0 (0.0%) |
| $1,500 to $1,999 | 0 (0.0%) | 0 (0.0%) |
| $2,000 to $2,499 | 0 (0.0%) | 0 (0.0%) |
| $2,500 to $2,999 | 0 (0.0%) | 0 (0.0%) |
| $3,000 or more | 0 (0.0%) | 0 (0.0%) |
| Total | 270 (100.0%) | 62 (100.0%) |
Physical Housing Characteristics in Arivaca
Housing Structures in Arivaca
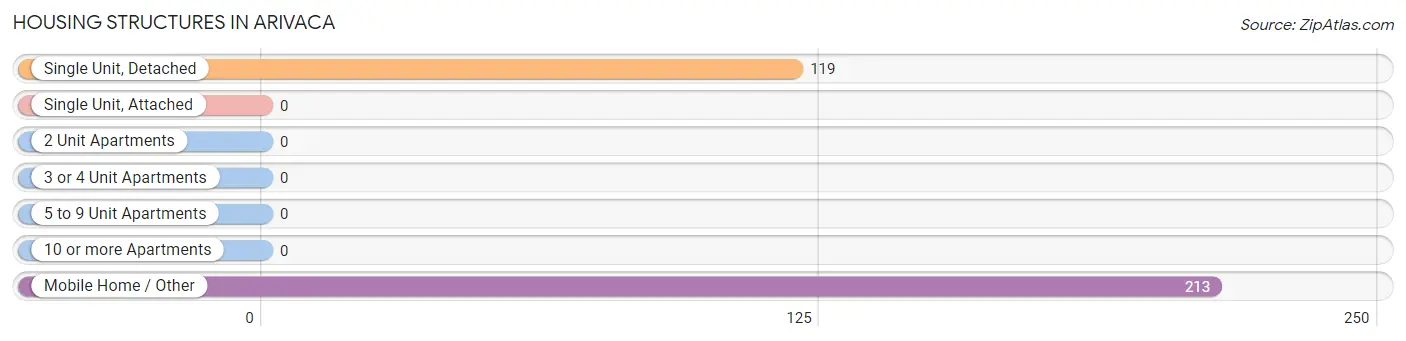
| Structure Type | # Housing Units | % Housing Units |
| Single Unit, Detached | 119 | 35.8% |
| Single Unit, Attached | 0 | 0.0% |
| 2 Unit Apartments | 0 | 0.0% |
| 3 or 4 Unit Apartments | 0 | 0.0% |
| 5 to 9 Unit Apartments | 0 | 0.0% |
| 10 or more Apartments | 0 | 0.0% |
| Mobile Home / Other | 213 | 64.2% |
| Total | 332 | 100.0% |
Housing Structures by Occupancy in Arivaca
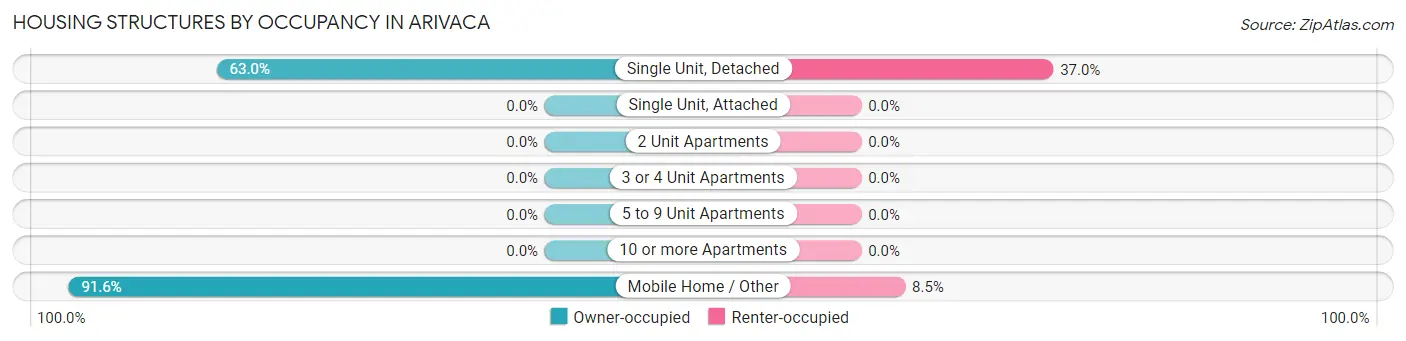
| Structure Type | Owner-occupied | Renter-occupied |
| Single Unit, Detached | 75 (63.0%) | 44 (37.0%) |
| Single Unit, Attached | 0 (0.0%) | 0 (0.0%) |
| 2 Unit Apartments | 0 (0.0%) | 0 (0.0%) |
| 3 or 4 Unit Apartments | 0 (0.0%) | 0 (0.0%) |
| 5 to 9 Unit Apartments | 0 (0.0%) | 0 (0.0%) |
| 10 or more Apartments | 0 (0.0%) | 0 (0.0%) |
| Mobile Home / Other | 195 (91.5%) | 18 (8.5%) |
| Total | 270 (81.3%) | 62 (18.7%) |
Housing Structures by Number of Rooms in Arivaca
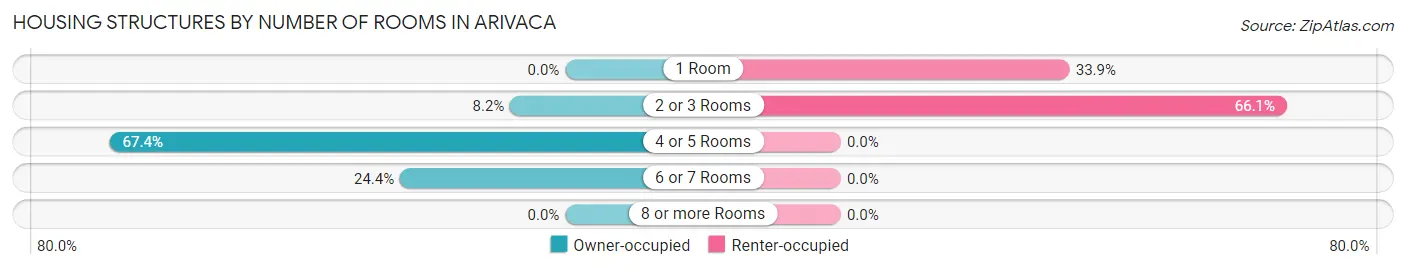
| Number of Rooms | Owner-occupied | Renter-occupied |
| 1 Room | 0 (0.0%) | 21 (33.9%) |
| 2 or 3 Rooms | 22 (8.2%) | 41 (66.1%) |
| 4 or 5 Rooms | 182 (67.4%) | 0 (0.0%) |
| 6 or 7 Rooms | 66 (24.4%) | 0 (0.0%) |
| 8 or more Rooms | 0 (0.0%) | 0 (0.0%) |
| Total | 270 (100.0%) | 62 (100.0%) |
Housing Structure by Heating Type in Arivaca
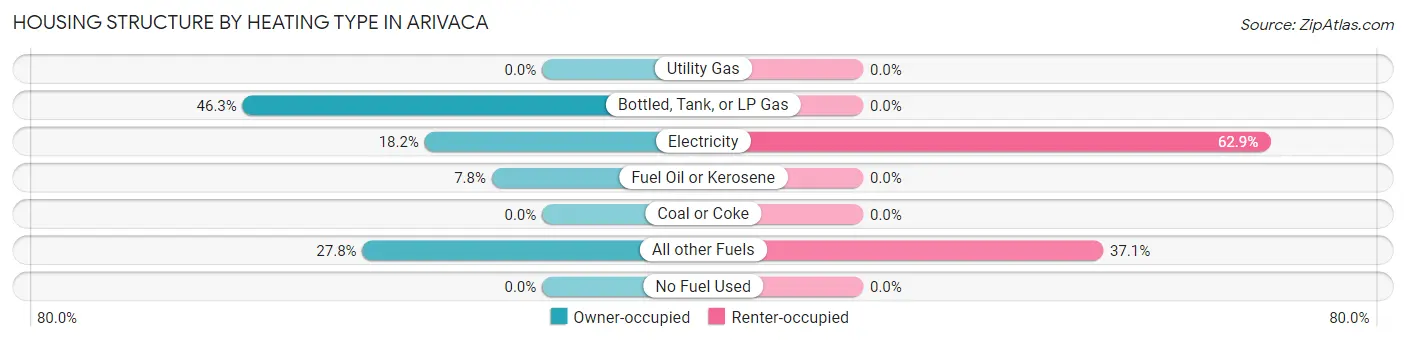
| Heating Type | Owner-occupied | Renter-occupied |
| Utility Gas | 0 (0.0%) | 0 (0.0%) |
| Bottled, Tank, or LP Gas | 125 (46.3%) | 0 (0.0%) |
| Electricity | 49 (18.1%) | 39 (62.9%) |
| Fuel Oil or Kerosene | 21 (7.8%) | 0 (0.0%) |
| Coal or Coke | 0 (0.0%) | 0 (0.0%) |
| All other Fuels | 75 (27.8%) | 23 (37.1%) |
| No Fuel Used | 0 (0.0%) | 0 (0.0%) |
| Total | 270 (100.0%) | 62 (100.0%) |
Household Vehicle Usage in Arivaca
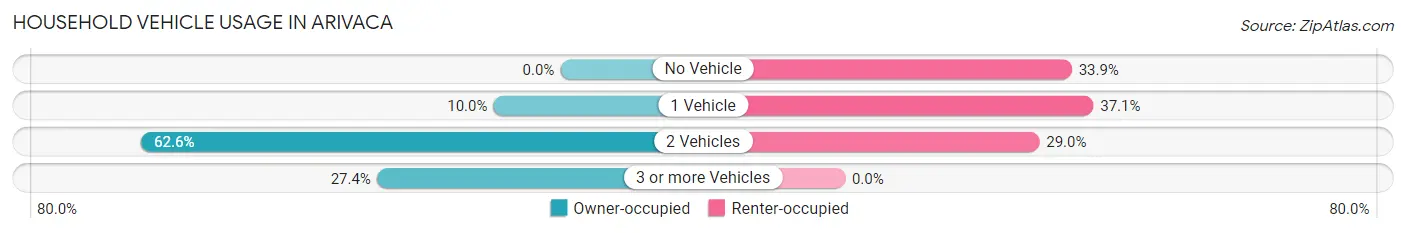
| Vehicles per Household | Owner-occupied | Renter-occupied |
| No Vehicle | 0 (0.0%) | 21 (33.9%) |
| 1 Vehicle | 27 (10.0%) | 23 (37.1%) |
| 2 Vehicles | 169 (62.6%) | 18 (29.0%) |
| 3 or more Vehicles | 74 (27.4%) | 0 (0.0%) |
| Total | 270 (100.0%) | 62 (100.0%) |
Real Estate & Mortgages in Arivaca
Real Estate and Mortgage Overview in Arivaca
| Characteristic | Without Mortgage | With Mortgage |
| Housing Units | 219 | 51 |
| Median Property Value | $73,900 | $0 |
| Median Household Income | $33,850 | $0 |
| Monthly Housing Costs | $225 | $0 |
| Real Estate Taxes | - | - |
Property Value by Mortgage Status in Arivaca
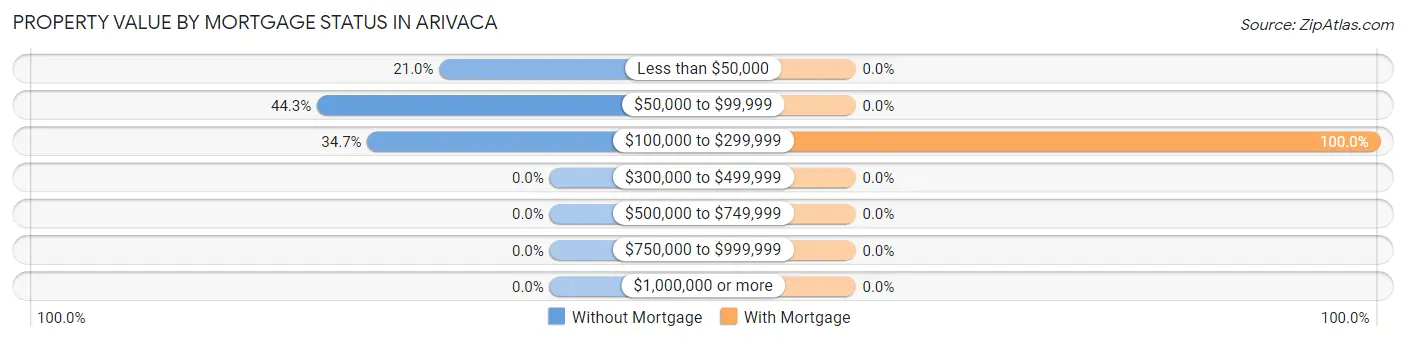
| Property Value | Without Mortgage | With Mortgage |
| Less than $50,000 | 46 (21.0%) | 0 (0.0%) |
| $50,000 to $99,999 | 97 (44.3%) | 0 (0.0%) |
| $100,000 to $299,999 | 76 (34.7%) | 51 (100.0%) |
| $300,000 to $499,999 | 0 (0.0%) | 0 (0.0%) |
| $500,000 to $749,999 | 0 (0.0%) | 0 (0.0%) |
| $750,000 to $999,999 | 0 (0.0%) | 0 (0.0%) |
| $1,000,000 or more | 0 (0.0%) | 0 (0.0%) |
| Total | 219 (100.0%) | 51 (100.0%) |
Household Income by Mortgage Status in Arivaca
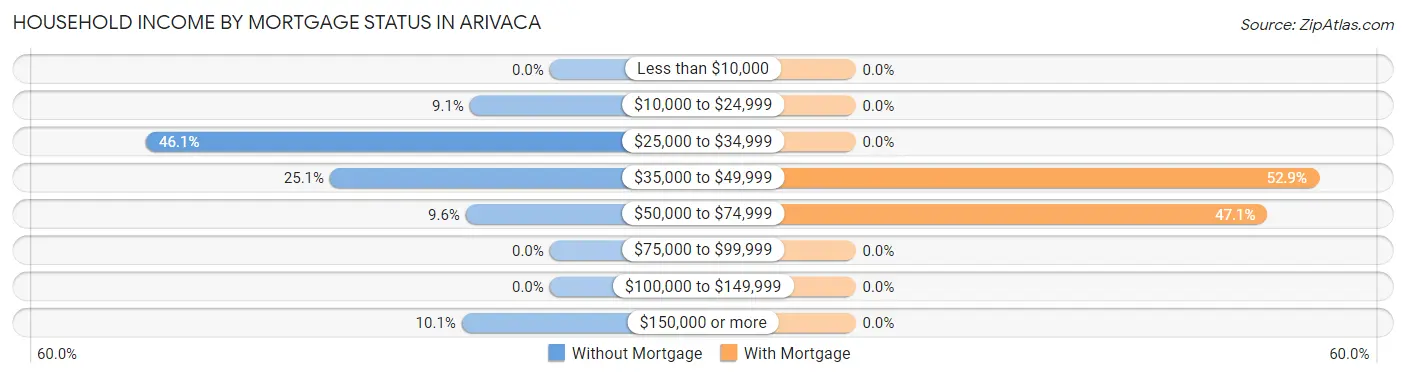
| Household Income | Without Mortgage | With Mortgage |
| Less than $10,000 | 0 (0.0%) | 0 (0.0%) |
| $10,000 to $24,999 | 20 (9.1%) | 0 (0.0%) |
| $25,000 to $34,999 | 101 (46.1%) | 0 (0.0%) |
| $35,000 to $49,999 | 55 (25.1%) | 27 (52.9%) |
| $50,000 to $74,999 | 21 (9.6%) | 24 (47.1%) |
| $75,000 to $99,999 | 0 (0.0%) | 0 (0.0%) |
| $100,000 to $149,999 | 0 (0.0%) | 0 (0.0%) |
| $150,000 or more | 22 (10.1%) | 0 (0.0%) |
| Total | 219 (100.0%) | 51 (100.0%) |
Property Value to Household Income Ratio in Arivaca
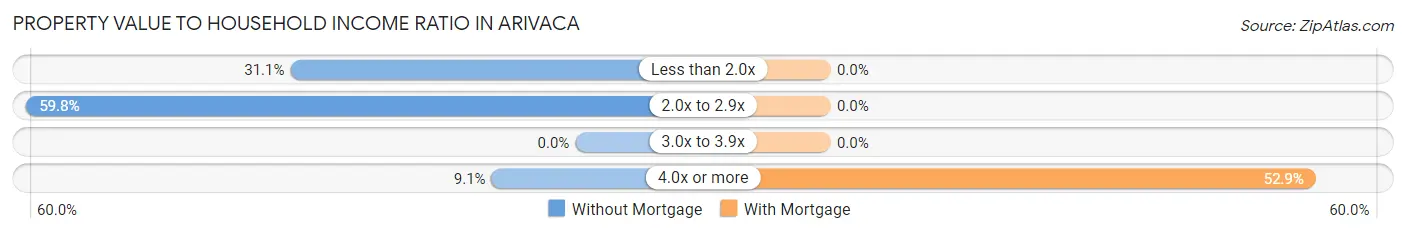
| Value-to-Income Ratio | Without Mortgage | With Mortgage |
| Less than 2.0x | 68 (31.0%) | 0 (0.0%) |
| 2.0x to 2.9x | 131 (59.8%) | 0 (0.0%) |
| 3.0x to 3.9x | 0 (0.0%) | 0 (0.0%) |
| 4.0x or more | 20 (9.1%) | 27 (52.9%) |
| Total | 219 (100.0%) | 51 (100.0%) |
Real Estate Taxes by Mortgage Status in Arivaca
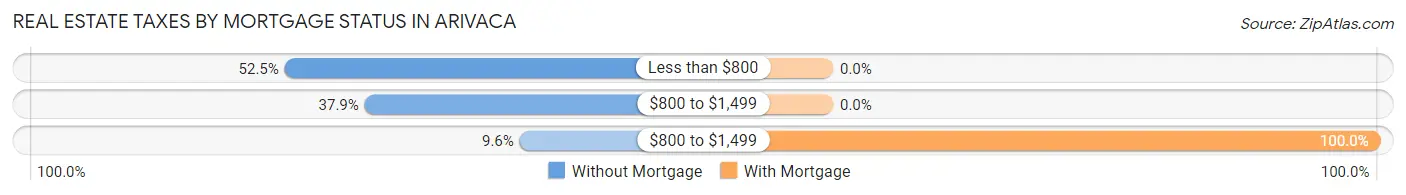
| Property Taxes | Without Mortgage | With Mortgage |
| Less than $800 | 115 (52.5%) | 0 (0.0%) |
| $800 to $1,499 | 83 (37.9%) | 0 (0.0%) |
| $800 to $1,499 | 21 (9.6%) | 51 (100.0%) |
| Total | 219 (100.0%) | 51 (100.0%) |
Health & Disability in Arivaca
Health Insurance Coverage by Age in Arivaca
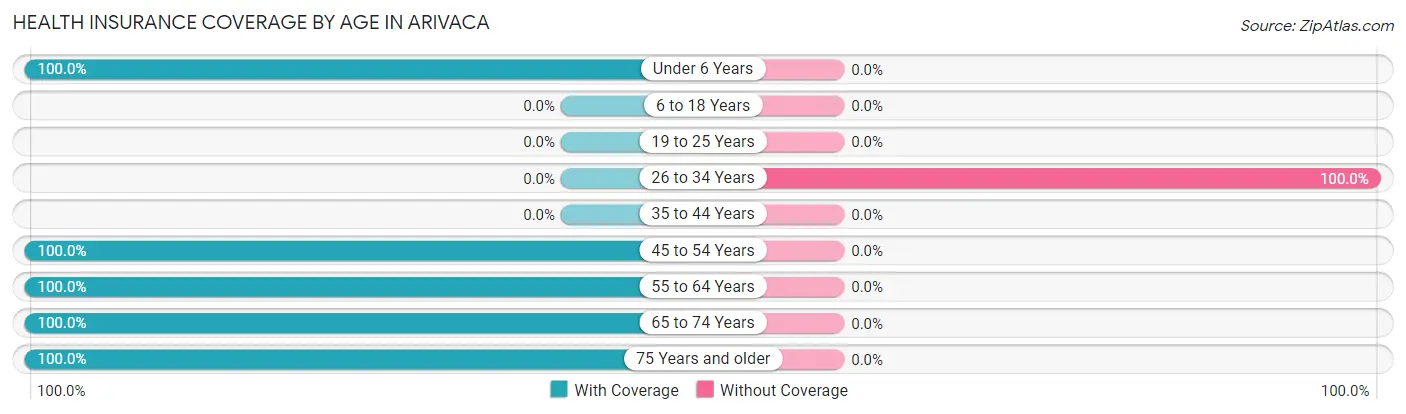
| Age Bracket | With Coverage | Without Coverage |
| Under 6 Years | 24 (100.0%) | 0 (0.0%) |
| 6 to 18 Years | 0 (0.0%) | 0 (0.0%) |
| 19 to 25 Years | 0 (0.0%) | 0 (0.0%) |
| 26 to 34 Years | 0 (0.0%) | 23 (100.0%) |
| 35 to 44 Years | 0 (0.0%) | 0 (0.0%) |
| 45 to 54 Years | 147 (100.0%) | 0 (0.0%) |
| 55 to 64 Years | 68 (100.0%) | 0 (0.0%) |
| 65 to 74 Years | 118 (100.0%) | 0 (0.0%) |
| 75 Years and older | 126 (100.0%) | 0 (0.0%) |
| Total | 483 (95.5%) | 23 (4.5%) |
Health Insurance Coverage by Citizenship Status in Arivaca
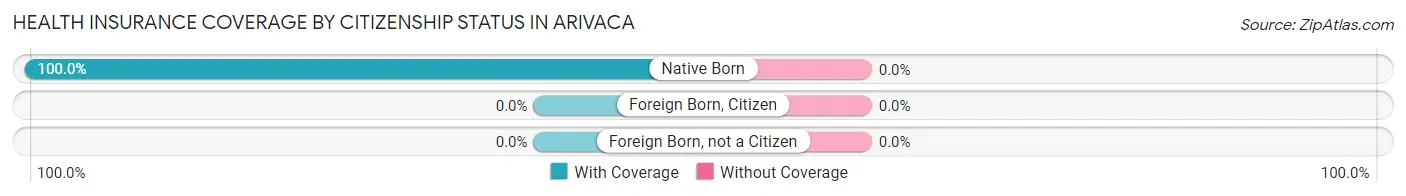
| Citizenship Status | With Coverage | Without Coverage |
| Native Born | 24 (100.0%) | 0 (0.0%) |
| Foreign Born, Citizen | 0 (0.0%) | 0 (0.0%) |
| Foreign Born, not a Citizen | 0 (0.0%) | 0 (0.0%) |
Health Insurance Coverage by Household Income in Arivaca
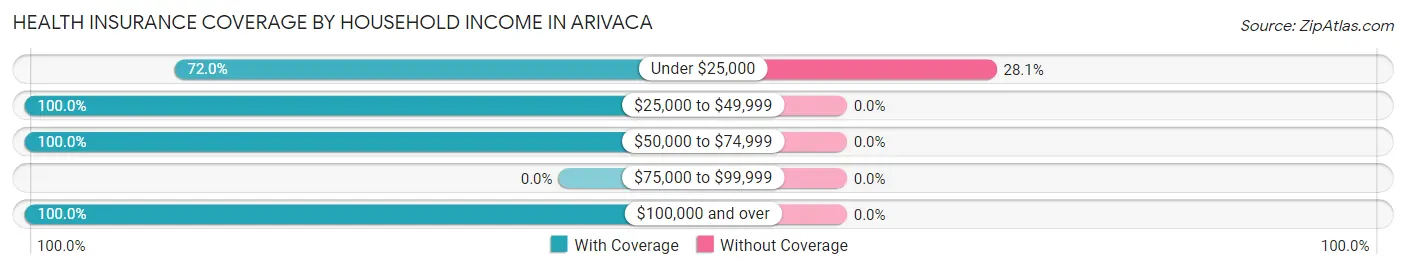
| Household Income | With Coverage | Without Coverage |
| Under $25,000 | 59 (72.0%) | 23 (28.1%) |
| $25,000 to $49,999 | 328 (100.0%) | 0 (0.0%) |
| $50,000 to $74,999 | 52 (100.0%) | 0 (0.0%) |
| $75,000 to $99,999 | 0 (0.0%) | 0 (0.0%) |
| $100,000 and over | 44 (100.0%) | 0 (0.0%) |
Public vs Private Health Insurance Coverage by Age in Arivaca
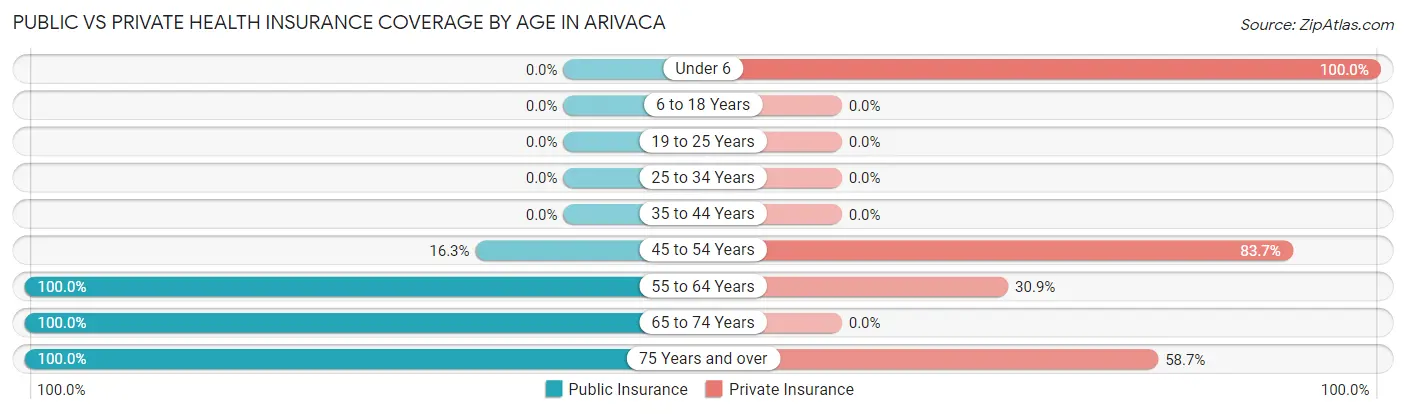
| Age Bracket | Public Insurance | Private Insurance |
| Under 6 | 0 (0.0%) | 24 (100.0%) |
| 6 to 18 Years | 0 (0.0%) | 0 (0.0%) |
| 19 to 25 Years | 0 (0.0%) | 0 (0.0%) |
| 25 to 34 Years | 0 (0.0%) | 0 (0.0%) |
| 35 to 44 Years | 0 (0.0%) | 0 (0.0%) |
| 45 to 54 Years | 24 (16.3%) | 123 (83.7%) |
| 55 to 64 Years | 68 (100.0%) | 21 (30.9%) |
| 65 to 74 Years | 118 (100.0%) | 0 (0.0%) |
| 75 Years and over | 126 (100.0%) | 74 (58.7%) |
| Total | 336 (66.4%) | 242 (47.8%) |
Disability Status by Sex by Age in Arivaca
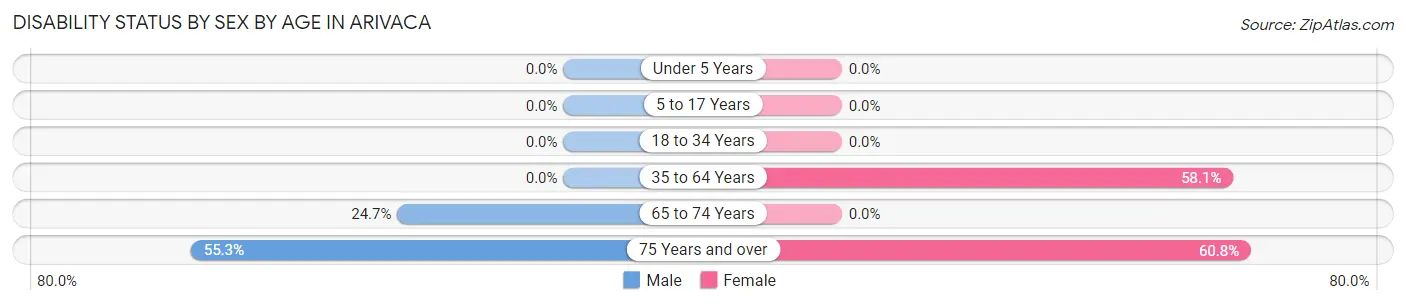
| Age Bracket | Male | Female |
| Under 5 Years | 0 (0.0%) | 0 (0.0%) |
| 5 to 17 Years | 0 (0.0%) | 0 (0.0%) |
| 18 to 34 Years | 0 (0.0%) | 0 (0.0%) |
| 35 to 64 Years | 0 (0.0%) | 68 (58.1%) |
| 65 to 74 Years | 18 (24.7%) | 0 (0.0%) |
| 75 Years and over | 26 (55.3%) | 48 (60.8%) |
Disability Class by Sex by Age in Arivaca
Disability Class: Hearing Difficulty
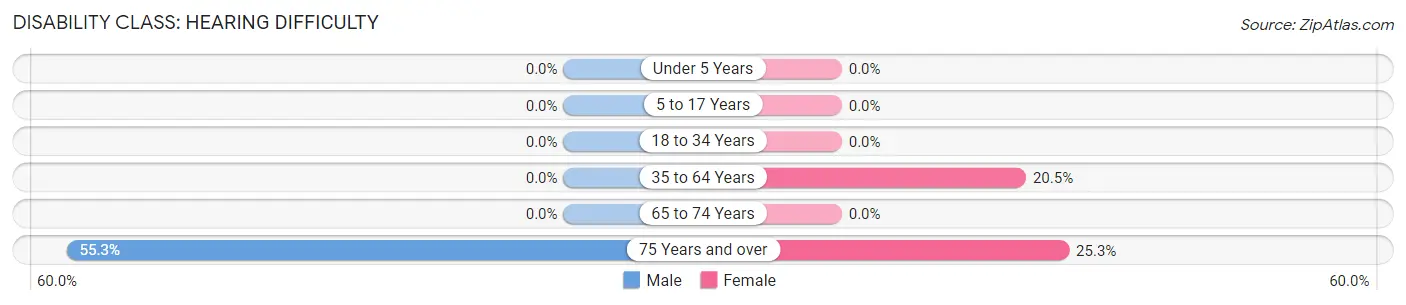
| Age Bracket | Male | Female |
| Under 5 Years | 0 (0.0%) | 0 (0.0%) |
| 5 to 17 Years | 0 (0.0%) | 0 (0.0%) |
| 18 to 34 Years | 0 (0.0%) | 0 (0.0%) |
| 35 to 64 Years | 0 (0.0%) | 24 (20.5%) |
| 65 to 74 Years | 0 (0.0%) | 0 (0.0%) |
| 75 Years and over | 26 (55.3%) | 20 (25.3%) |
Disability Class: Vision Difficulty
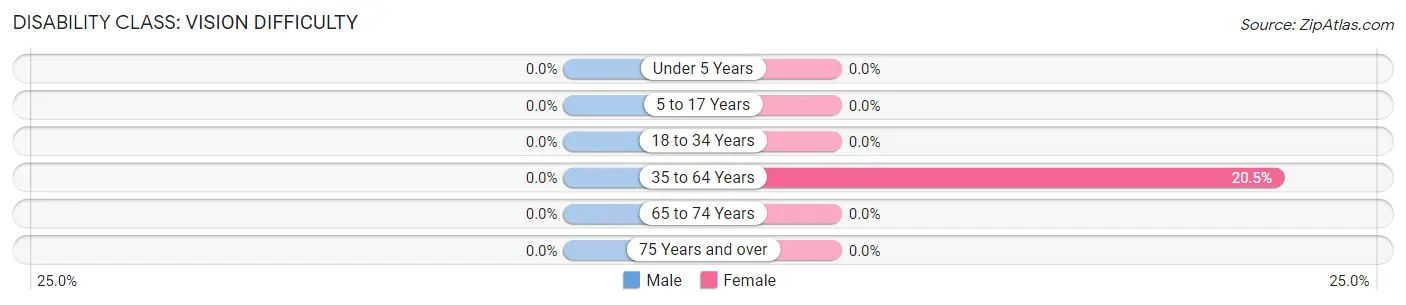
| Age Bracket | Male | Female |
| Under 5 Years | 0 (0.0%) | 0 (0.0%) |
| 5 to 17 Years | 0 (0.0%) | 0 (0.0%) |
| 18 to 34 Years | 0 (0.0%) | 0 (0.0%) |
| 35 to 64 Years | 0 (0.0%) | 24 (20.5%) |
| 65 to 74 Years | 0 (0.0%) | 0 (0.0%) |
| 75 Years and over | 0 (0.0%) | 0 (0.0%) |
Disability Class: Cognitive Difficulty
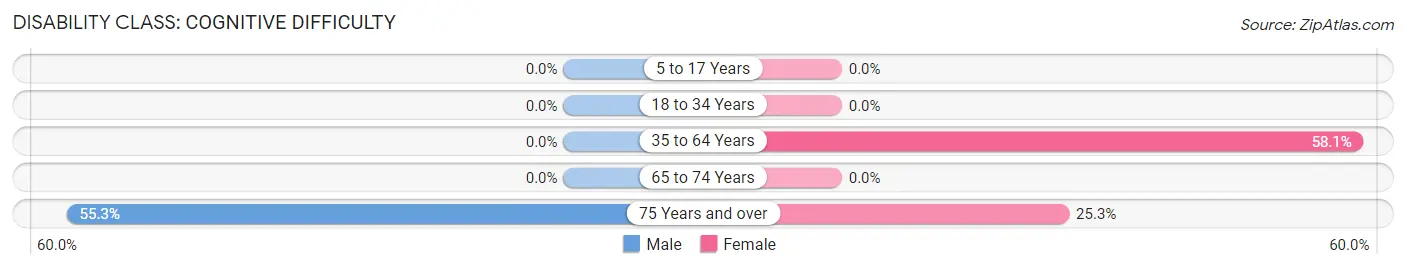
| Age Bracket | Male | Female |
| 5 to 17 Years | 0 (0.0%) | 0 (0.0%) |
| 18 to 34 Years | 0 (0.0%) | 0 (0.0%) |
| 35 to 64 Years | 0 (0.0%) | 68 (58.1%) |
| 65 to 74 Years | 0 (0.0%) | 0 (0.0%) |
| 75 Years and over | 26 (55.3%) | 20 (25.3%) |
Disability Class: Ambulatory Difficulty
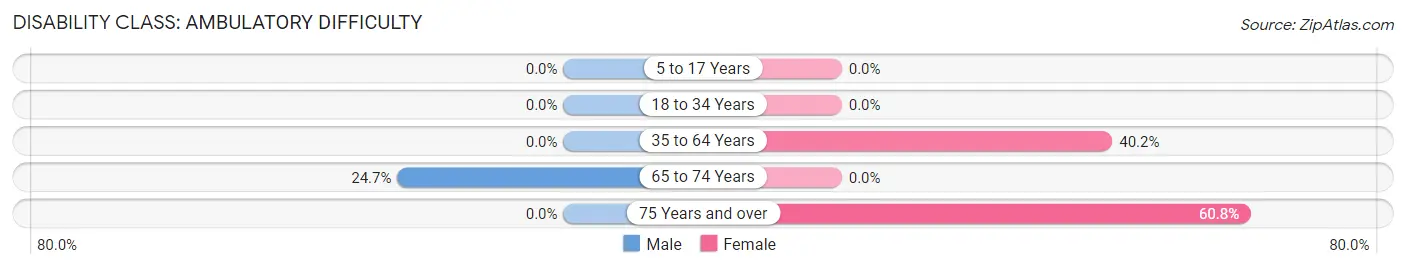
| Age Bracket | Male | Female |
| 5 to 17 Years | 0 (0.0%) | 0 (0.0%) |
| 18 to 34 Years | 0 (0.0%) | 0 (0.0%) |
| 35 to 64 Years | 0 (0.0%) | 47 (40.2%) |
| 65 to 74 Years | 18 (24.7%) | 0 (0.0%) |
| 75 Years and over | 0 (0.0%) | 48 (60.8%) |
Disability Class: Self-Care Difficulty
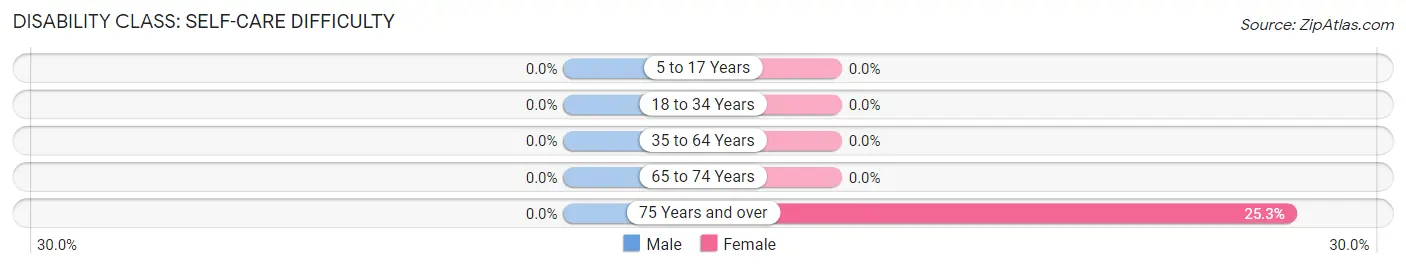
| Age Bracket | Male | Female |
| 5 to 17 Years | 0 (0.0%) | 0 (0.0%) |
| 18 to 34 Years | 0 (0.0%) | 0 (0.0%) |
| 35 to 64 Years | 0 (0.0%) | 0 (0.0%) |
| 65 to 74 Years | 0 (0.0%) | 0 (0.0%) |
| 75 Years and over | 0 (0.0%) | 20 (25.3%) |
Technology Access in Arivaca
Computing Device Access in Arivaca
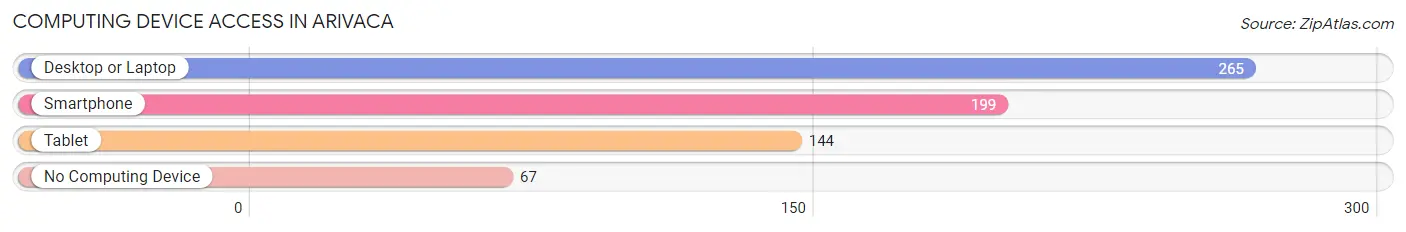
| Device Type | # Households | % Households |
| Desktop or Laptop | 265 | 79.8% |
| Smartphone | 199 | 59.9% |
| Tablet | 144 | 43.4% |
| No Computing Device | 67 | 20.2% |
| Total | 332 | 100.0% |
Internet Access in Arivaca
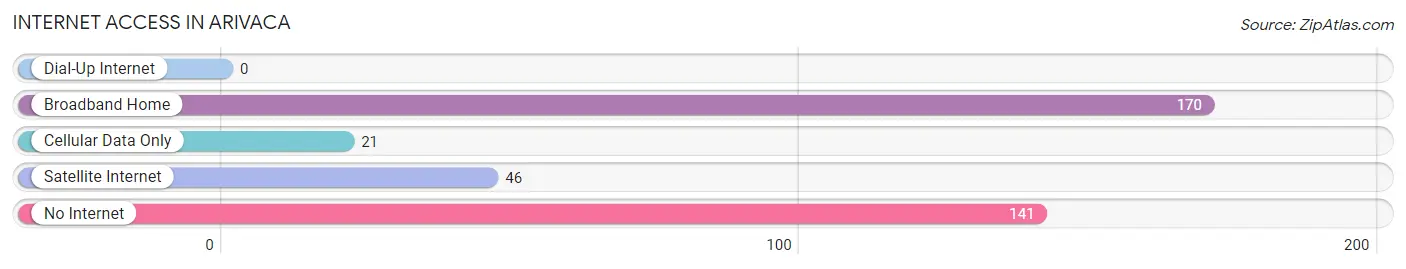
| Internet Type | # Households | % Households |
| Dial-Up Internet | 0 | 0.0% |
| Broadband Home | 170 | 51.2% |
| Cellular Data Only | 21 | 6.3% |
| Satellite Internet | 46 | 13.9% |
| No Internet | 141 | 42.5% |
| Total | 332 | 100.0% |
Arivaca Summary
Arivaca is a small unincorporated community located in Pima County, Arizona, United States. It is situated in the foothills of the Baboquivari Mountains, approximately 11 miles (18 km) north of the Mexican border and 37 miles (60 km) southwest of Tucson. The population of Arivaca was 1,046 at the 2010 census.
History
Arivaca has a long and varied history. The area was first inhabited by the Tohono O’odham people, who lived in the area for centuries before the arrival of Europeans. The first Europeans to settle in the area were Spanish missionaries, who established a mission in the area in 1751. The mission was abandoned in 1767, but the area remained largely undeveloped until the late 19th century.
In 1857, the United States Army established a fort in the area, which was used to protect settlers from Apache raids. The fort was abandoned in 1873, but the area remained largely undeveloped until the early 20th century. In the early 1900s, the area began to be settled by ranchers and farmers, and the town of Arivaca was established in 1910.
Geography
Arivaca is located in the foothills of the Baboquivari Mountains, approximately 11 miles (18 km) north of the Mexican border and 37 miles (60 km) southwest of Tucson. The town is situated at an elevation of 3,000 feet (910 m) above sea level. The area is characterized by rolling hills, grassy plains, and desert vegetation.
Economy
Arivaca’s economy is largely based on agriculture and ranching. The area is home to several large cattle ranches, as well as smaller farms that produce a variety of crops, including alfalfa, cotton, and wheat. The town is also home to several small businesses, including a general store, a gas station, and a restaurant.
Demographics
As of the 2010 census, the population of Arivaca was 1,046. The racial makeup of the town was 94.3% White, 0.7% African American, 0.7% Native American, 0.3% Asian, 0.1% Pacific Islander, 2.2% from other races, and 1.9% from two or more races. Hispanic or Latino of any race were 8.2% of the population.
The median income for a household in the town was $30,000, and the median income for a family was $35,000. The per capita income for the town was $14,000. About 15.3% of families and 18.2% of the population were below the poverty line, including 25.3% of those under age 18 and 8.3% of those age 65 or over.
Arivaca is a small, rural community with a rich history and a diverse population. The town is home to a variety of businesses and industries, and the local economy is largely based on agriculture and ranching. The town is also home to a variety of cultural and recreational activities, making it an attractive destination for visitors and residents alike.
Common Questions
What is the Total Population of Arivaca?
Total Population of Arivaca is 524.
What is the Total Male Population of Arivaca?
Total Male Population of Arivaca is 265.
What is the Total Female Population of Arivaca?
Total Female Population of Arivaca is 259.
What is the Ratio of Males per 100 Females in Arivaca?
There are 102.32 Males per 100 Females in Arivaca.
What is the Ratio of Females per 100 Males in Arivaca?
There are 97.74 Females per 100 Males in Arivaca.
What is the Median Population Age in Arivaca?
Median Population Age in Arivaca is 61.5 Years.
What is the Average Family Size in Arivaca
Average Family Size in Arivaca is 2.0 People.
What is the Average Household Size in Arivaca
Average Household Size in Arivaca is 1.5 People.
What is Per Capita Income in Arivaca?
Per Capita income in Arivaca is $29,864.
What is the Median Family Income in Arivaca?
Median Family Income in Arivaca is $47,277.
What is the Median Household income in Arivaca?
Median Household Income in Arivaca is $31,636.
What is Inequality or Gini Index in Arivaca?
Inequality or Gini Index in Arivaca is 0.40.
How Large is the Labor Force in Arivaca?
There are 246 People in the Labor Forcein in Arivaca.
What is the Percentage of People in the Labor Force in Arivaca?
49.2% of People are in the Labor Force in Arivaca.
What is the Unemployment Rate in Arivaca?
Unemployment Rate in Arivaca is 8.5%.