Aguila, AZ
Aguila Map
Aguila Overview
362
TOTAL POPULATION
153
MALE POPULATION
209
FEMALE POPULATION
73.21
MALES / 100 FEMALES
136.60
FEMALES / 100 MALES
36.2
MEDIAN AGE
4.4
AVG FAMILY SIZE
3.6
AVG HOUSEHOLD SIZE
$21,385
PER CAPITA INCOME
$88,889
AVG FAMILY INCOME
0.45
INEQUALITY / GINI INDEX
167
LABOR FORCE [ PEOPLE ]
65.7%
PERCENT IN LABOR FORCE
12.0%
UNEMPLOYMENT RATE
Aguila Zip Codes
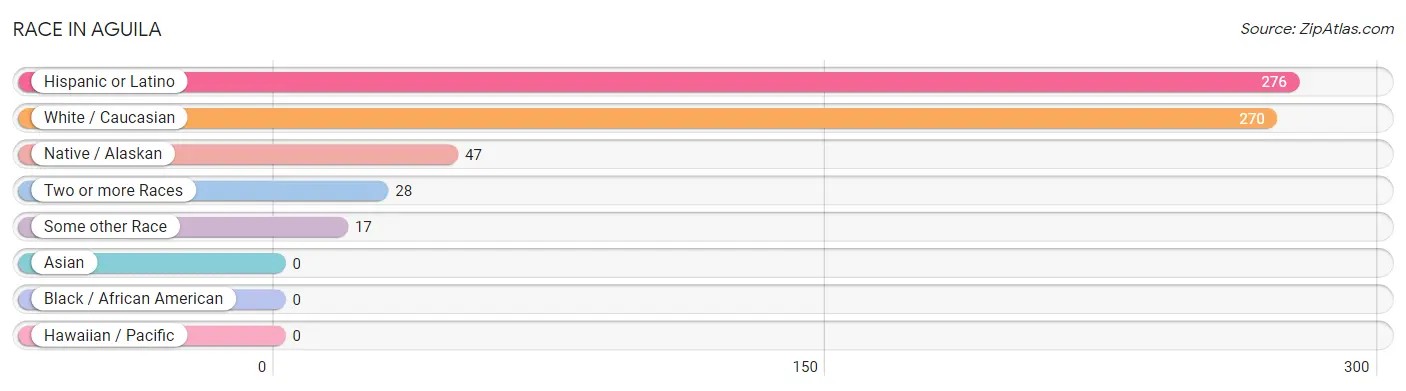
Race in Aguila
The most populous races in Aguila are Hispanic or Latino (276 | 76.2%), White / Caucasian (270 | 74.6%), and Native / Alaskan (47 | 13.0%).
| Race | # Population | % Population |
| Asian | 0 | 0.0% |
| Black / African American | 0 | 0.0% |
| Hawaiian / Pacific | 0 | 0.0% |
| Hispanic or Latino | 276 | 76.2% |
| Native / Alaskan | 47 | 13.0% |
| White / Caucasian | 270 | 74.6% |
| Two or more Races | 28 | 7.7% |
| Some other Race | 17 | 4.7% |
| Total | 362 | 100.0% |
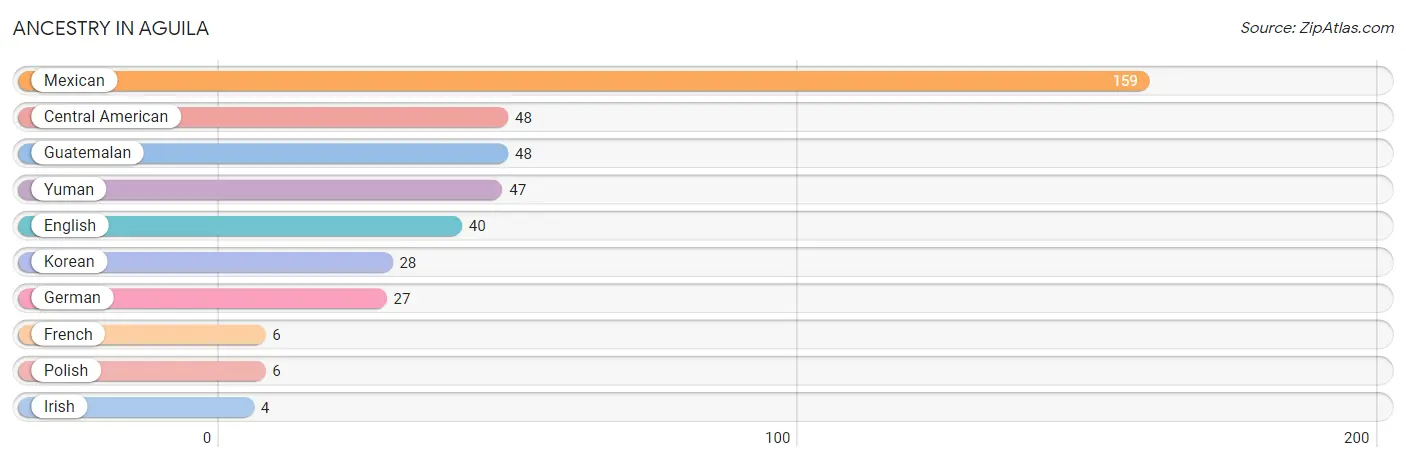
Ancestry in Aguila
The most populous ancestries reported in Aguila are Mexican (159 | 43.9%), Central American (48 | 13.3%), Guatemalan (48 | 13.3%), Yuman (47 | 13.0%), and English (40 | 11.1%), together accounting for 94.5% of all Aguila residents.
| Ancestry | # Population | % Population |
| Central American | 48 | 13.3% |
| English | 40 | 11.1% |
| French | 6 | 1.7% |
| German | 27 | 7.5% |
| Guatemalan | 48 | 13.3% |
| Irish | 4 | 1.1% |
| Korean | 28 | 7.7% |
| Mexican | 159 | 43.9% |
| Polish | 6 | 1.7% |
| Yuman | 47 | 13.0% | View All 10 Rows |
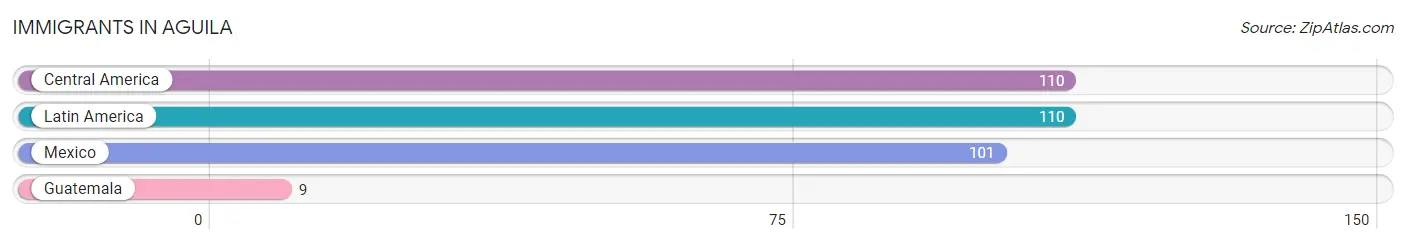
Immigrants in Aguila
The most numerous immigrant groups reported in Aguila came from Central America (110 | 30.4%), Latin America (110 | 30.4%), Mexico (101 | 27.9%), and Guatemala (9 | 2.5%), together accounting for 91.2% of all Aguila residents.
| Immigration Origin | # Population | % Population |
| Central America | 110 | 30.4% |
| Guatemala | 9 | 2.5% |
| Latin America | 110 | 30.4% |
| Mexico | 101 | 27.9% | View All 4 Rows |
Sex and Age in Aguila
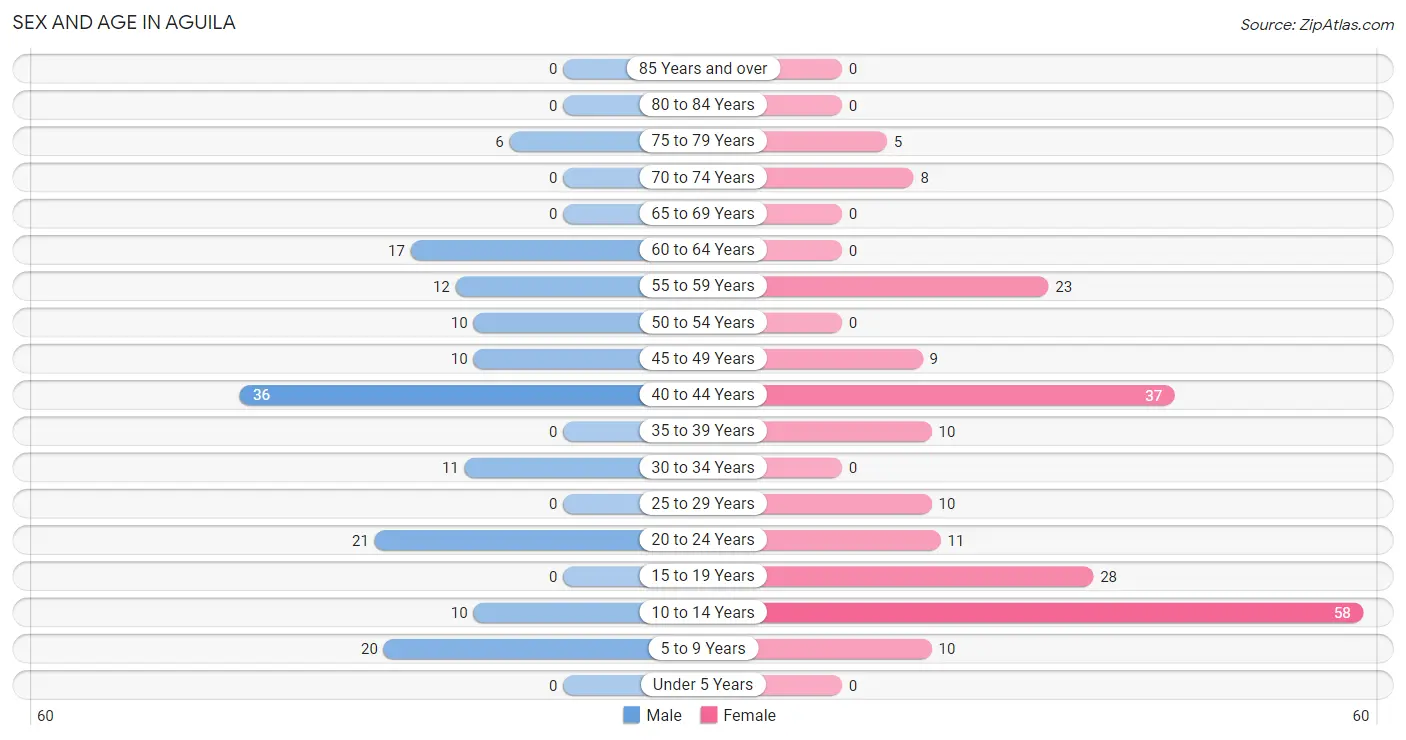
Sex and Age in Aguila
The most populous age groups in Aguila are 40 to 44 Years (36 | 23.5%) for men and 10 to 14 Years (58 | 27.8%) for women.
| Age Bracket | Male | Female |
| Under 5 Years | 0 (0.0%) | 0 (0.0%) |
| 5 to 9 Years | 20 (13.1%) | 10 (4.8%) |
| 10 to 14 Years | 10 (6.5%) | 58 (27.8%) |
| 15 to 19 Years | 0 (0.0%) | 28 (13.4%) |
| 20 to 24 Years | 21 (13.7%) | 11 (5.3%) |
| 25 to 29 Years | 0 (0.0%) | 10 (4.8%) |
| 30 to 34 Years | 11 (7.2%) | 0 (0.0%) |
| 35 to 39 Years | 0 (0.0%) | 10 (4.8%) |
| 40 to 44 Years | 36 (23.5%) | 37 (17.7%) |
| 45 to 49 Years | 10 (6.5%) | 9 (4.3%) |
| 50 to 54 Years | 10 (6.5%) | 0 (0.0%) |
| 55 to 59 Years | 12 (7.8%) | 23 (11.0%) |
| 60 to 64 Years | 17 (11.1%) | 0 (0.0%) |
| 65 to 69 Years | 0 (0.0%) | 0 (0.0%) |
| 70 to 74 Years | 0 (0.0%) | 8 (3.8%) |
| 75 to 79 Years | 6 (3.9%) | 5 (2.4%) |
| 80 to 84 Years | 0 (0.0%) | 0 (0.0%) |
| 85 Years and over | 0 (0.0%) | 0 (0.0%) |
| Total | 153 (100.0%) | 209 (100.0%) |
Families and Households in Aguila
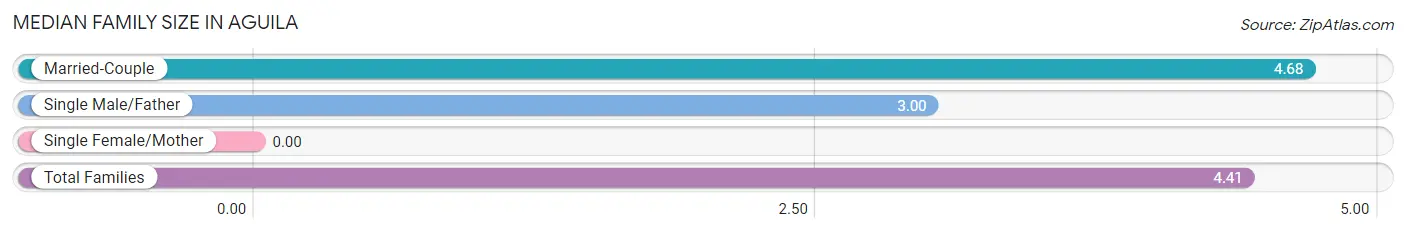
Median Family Size in Aguila
| Family Type | # Families | Family Size |
| Married-Couple | 57 (83.8%) | 4.68 |
| Single Male/Father | 11 (16.2%) | 3.00 |
| Single Female/Mother | 0 (0.0%) | - |
| Total Families | 68 (100.0%) | 4.41 |
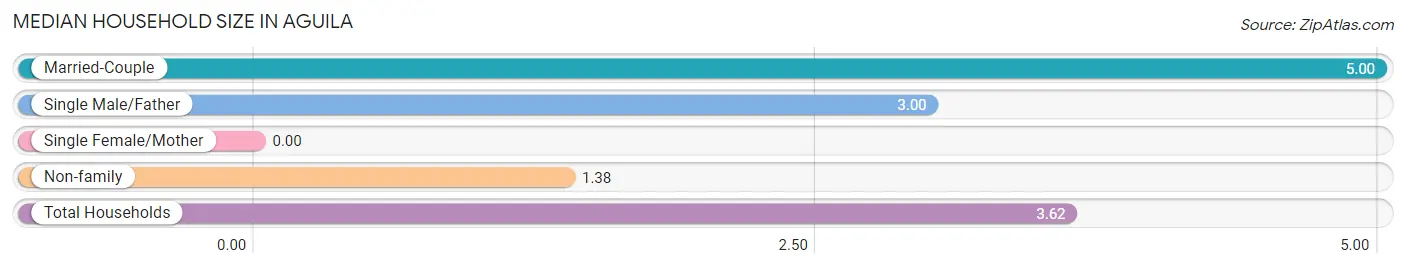
Median Household Size in Aguila
| Household Type | # Households | Household Size |
| Married-Couple | 57 (57.0%) | 5.00 |
| Single Male/Father | 11 (11.0%) | 3.00 |
| Single Female/Mother | 0 (0.0%) | - |
| Non-family | 32 (32.0%) | 1.38 |
| Total Households | 100 (100.0%) | 3.62 |
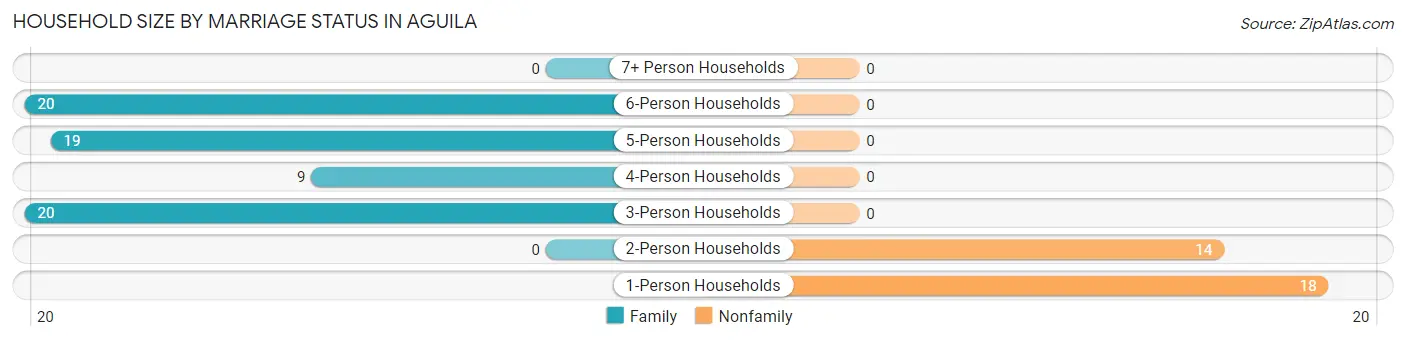
Household Size by Marriage Status in Aguila
Out of a total of 100 households in Aguila, 68 (68.0%) are family households, while 32 (32.0%) are nonfamily households. The most numerous type of family households are 3-person households, comprising 20, and the most common type of nonfamily households are 1-person households, comprising 18.
| Household Size | Family Households | Nonfamily Households |
| 1-Person Households | - | 18 (18.0%) |
| 2-Person Households | 0 (0.0%) | 14 (14.0%) |
| 3-Person Households | 20 (20.0%) | 0 (0.0%) |
| 4-Person Households | 9 (9.0%) | 0 (0.0%) |
| 5-Person Households | 19 (19.0%) | 0 (0.0%) |
| 6-Person Households | 20 (20.0%) | 0 (0.0%) |
| 7+ Person Households | 0 (0.0%) | 0 (0.0%) |
| Total | 68 (68.0%) | 32 (32.0%) |
Female Fertility in Aguila
Fertility by Age in Aguila
| Age Bracket | Women with Births | Births / 1,000 Women |
| 15 to 19 years | 0 (0.0%) | 0.0 |
| 20 to 34 years | 0 (0.0%) | 0.0 |
| 35 to 50 years | 0 (0.0%) | 0.0 |
| Total | 0 (0.0%) | 0.0 |
Fertility by Age by Marriage Status in Aguila
| Age Bracket | Married | Unmarried |
| 15 to 19 years | 0 (0.0%) | 0 (0.0%) |
| 20 to 34 years | 0 (0.0%) | 0 (0.0%) |
| 35 to 50 years | 0 (0.0%) | 0 (0.0%) |
| Total | 0 (0.0%) | 0 (0.0%) |
Fertility by Education in Aguila
| Educational Attainment | Women with Births | Births / 1,000 Women |
| Less than High School | 0 (0.0%) | 0.0 |
| High School Diploma | 0 (0.0%) | 0.0 |
| College or Associate's Degree | 0 (0.0%) | 0.0 |
| Bachelor's Degree | 0 (0.0%) | 0.0 |
| Graduate Degree | 0 (0.0%) | 0.0 |
| Total | 0 (0.0%) | 0.0 |
Fertility by Education by Marriage Status in Aguila
| Educational Attainment | Married | Unmarried |
| Less than High School | 0 (0.0%) | 0 (0.0%) |
| High School Diploma | 0 (0.0%) | 0 (0.0%) |
| College or Associate's Degree | 0 (0.0%) | 0 (0.0%) |
| Bachelor's Degree | 0 (0.0%) | 0 (0.0%) |
| Graduate Degree | 0 (0.0%) | 0 (0.0%) |
| Total | 0 (0.0%) | 0 (0.0%) |
Income in Aguila
Income Overview in Aguila
| Characteristic | Number | Measure |
| Per Capita Income | 362 | $21,385 |
| Median Family Income | 68 | $88,889 |
| Mean Family Income | 68 | $103,222 |
| Median Household Income | 100 | $0 |
| Mean Household Income | 100 | $76,614 |
| Income Deficit | 68 | $0 |
| Wage / Income Gap (%) | 362 | 0.00% |
| Wage / Income Gap ($) | 362 | 100.00¢ per $1 |
| Gini / Inequality Index | 362 | 0.45 |
Earnings by Sex in Aguila
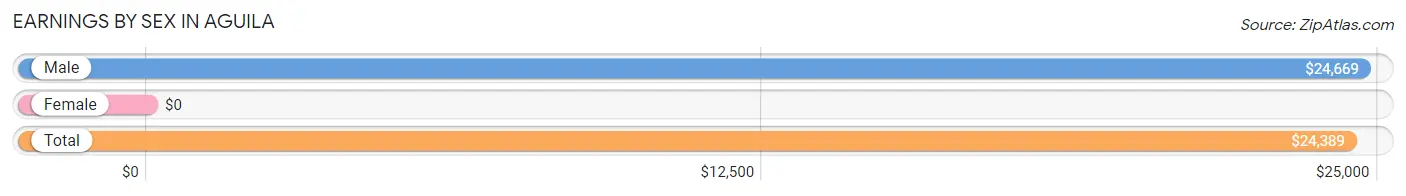
| Sex | Number | Average Earnings |
| Male | 99 (57.6%) | $24,669 |
| Female | 73 (42.4%) | $0 |
| Total | 172 (100.0%) | $24,389 |
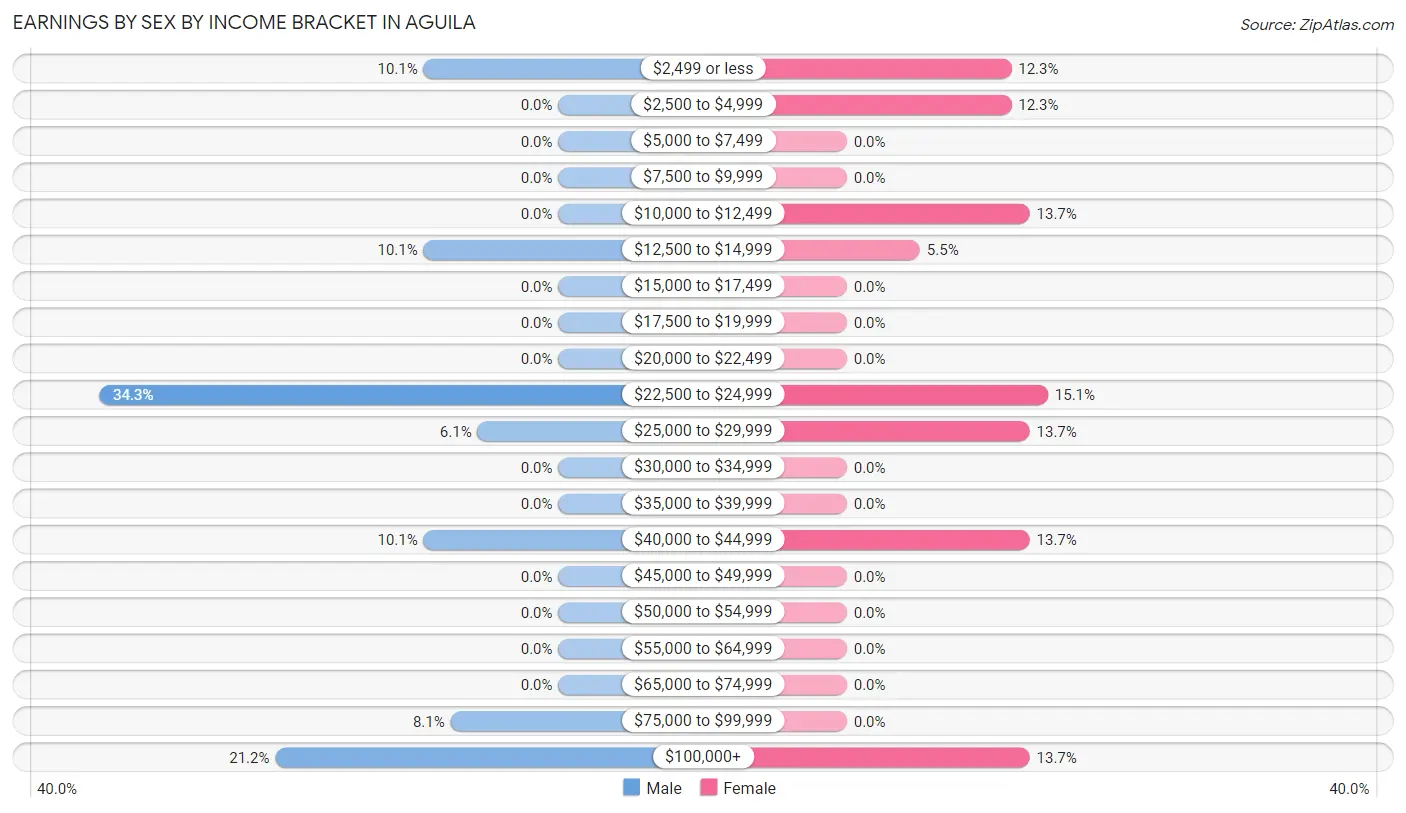
Earnings by Sex by Income Bracket in Aguila
The most common earnings brackets in Aguila are $22,500 to $24,999 for men (34 | 34.3%) and $22,500 to $24,999 for women (11 | 15.1%).
| Income | Male | Female |
| $2,499 or less | 10 (10.1%) | 9 (12.3%) |
| $2,500 to $4,999 | 0 (0.0%) | 9 (12.3%) |
| $5,000 to $7,499 | 0 (0.0%) | 0 (0.0%) |
| $7,500 to $9,999 | 0 (0.0%) | 0 (0.0%) |
| $10,000 to $12,499 | 0 (0.0%) | 10 (13.7%) |
| $12,500 to $14,999 | 10 (10.1%) | 4 (5.5%) |
| $15,000 to $17,499 | 0 (0.0%) | 0 (0.0%) |
| $17,500 to $19,999 | 0 (0.0%) | 0 (0.0%) |
| $20,000 to $22,499 | 0 (0.0%) | 0 (0.0%) |
| $22,500 to $24,999 | 34 (34.3%) | 11 (15.1%) |
| $25,000 to $29,999 | 6 (6.1%) | 10 (13.7%) |
| $30,000 to $34,999 | 0 (0.0%) | 0 (0.0%) |
| $35,000 to $39,999 | 0 (0.0%) | 0 (0.0%) |
| $40,000 to $44,999 | 10 (10.1%) | 10 (13.7%) |
| $45,000 to $49,999 | 0 (0.0%) | 0 (0.0%) |
| $50,000 to $54,999 | 0 (0.0%) | 0 (0.0%) |
| $55,000 to $64,999 | 0 (0.0%) | 0 (0.0%) |
| $65,000 to $74,999 | 0 (0.0%) | 0 (0.0%) |
| $75,000 to $99,999 | 8 (8.1%) | 0 (0.0%) |
| $100,000+ | 21 (21.2%) | 10 (13.7%) |
| Total | 99 (100.0%) | 73 (100.0%) |
Earnings by Sex by Educational Attainment in Aguila
| Educational Attainment | Male Income | Female Income |
| Less than High School | - | - |
| High School Diploma | - | - |
| College or Associate's Degree | - | - |
| Bachelor's Degree | - | - |
| Graduate Degree | - | - |
| Total | - | - |
Family Income in Aguila
Family Income Brackets in Aguila
According to the Aguila family income data, there are 21 families falling into the $150,000 to $199,999 income range, which is the most common income bracket and makes up 30.9% of all families.
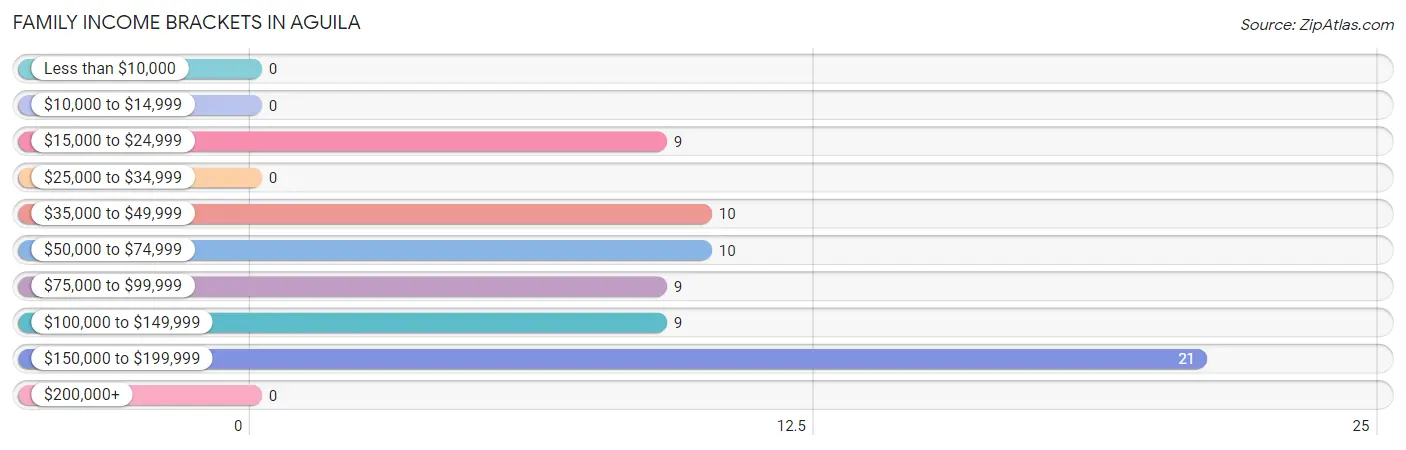
| Income Bracket | # Families | % Families |
| Less than $10,000 | 0 | 0.0% |
| $10,000 to $14,999 | 0 | 0.0% |
| $15,000 to $24,999 | 9 | 13.2% |
| $25,000 to $34,999 | 0 | 0.0% |
| $35,000 to $49,999 | 10 | 14.7% |
| $50,000 to $74,999 | 10 | 14.7% |
| $75,000 to $99,999 | 9 | 13.2% |
| $100,000 to $149,999 | 9 | 13.2% |
| $150,000 to $199,999 | 21 | 30.9% |
| $200,000+ | 0 | 0.0% |
Family Income by Famaliy Size in Aguila
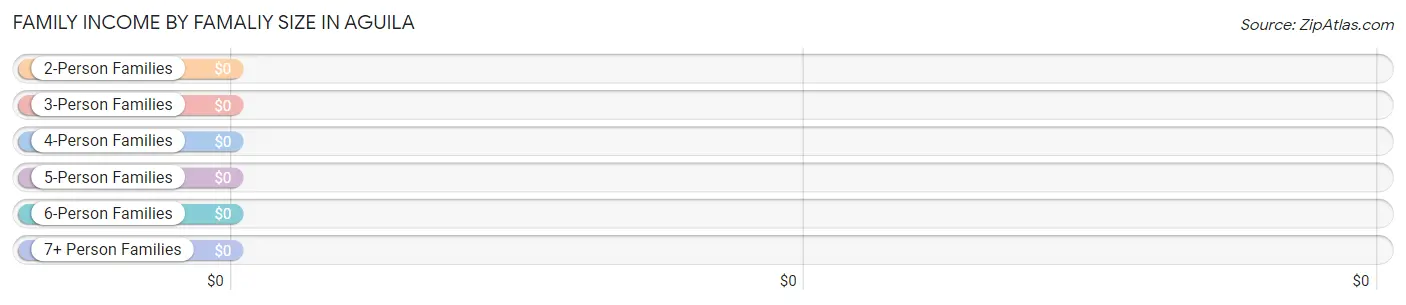
| Income Bracket | # Families | Median Income |
| 2-Person Families | 0 (0.0%) | $0 |
| 3-Person Families | 20 (29.4%) | $0 |
| 4-Person Families | 19 (27.9%) | $0 |
| 5-Person Families | 19 (27.9%) | $0 |
| 6-Person Families | 10 (14.7%) | $0 |
| 7+ Person Families | 0 (0.0%) | $0 |
| Total | 68 (100.0%) | $88,889 |
Family Income by Number of Earners in Aguila
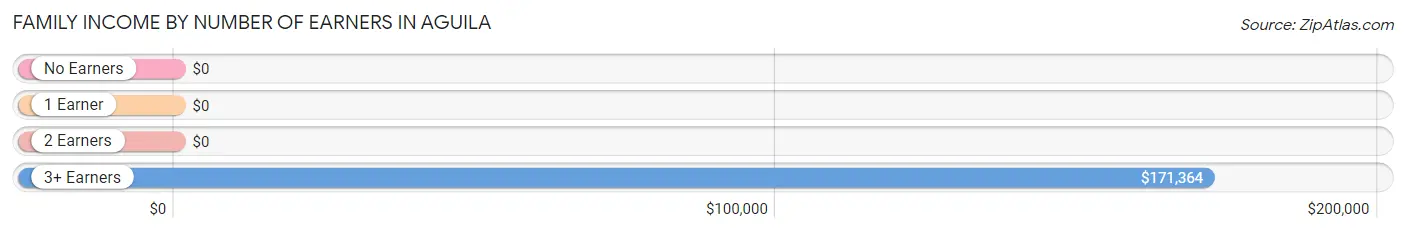
| Number of Earners | # Families | Median Income |
| No Earners | 0 (0.0%) | $0 |
| 1 Earner | 28 (41.2%) | $0 |
| 2 Earners | 10 (14.7%) | $0 |
| 3+ Earners | 30 (44.1%) | $171,364 |
| Total | 68 (100.0%) | $88,889 |
Household Income in Aguila
Household Income Brackets in Aguila
With 23 households falling in the category, the $15,000 to $24,999 income range is the most frequent in Aguila, accounting for 23.0% of all households.
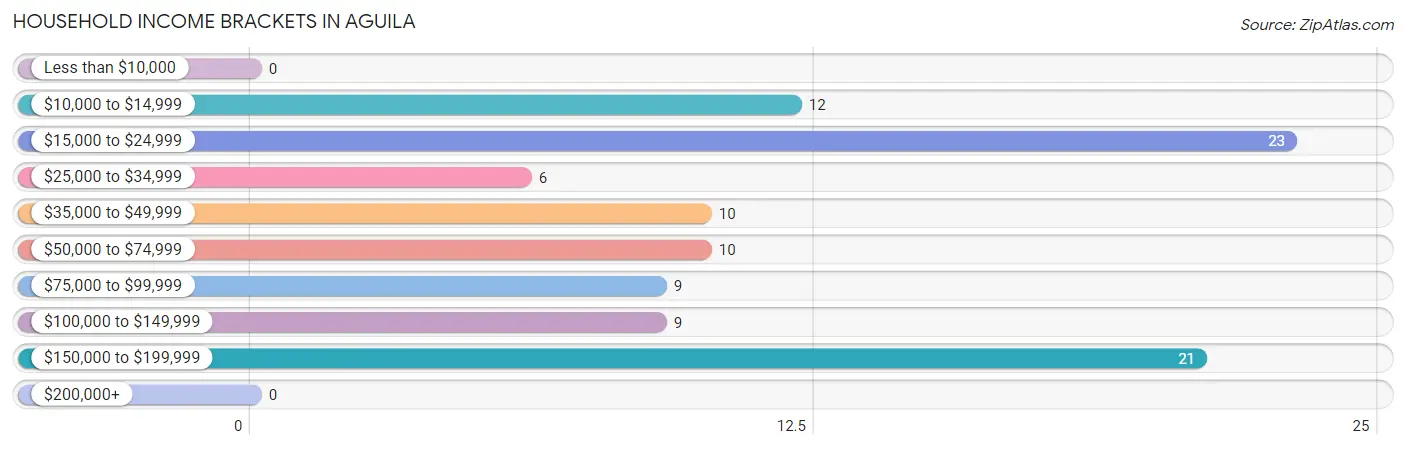
| Income Bracket | # Households | % Households |
| Less than $10,000 | 0 | 0.0% |
| $10,000 to $14,999 | 12 | 12.0% |
| $15,000 to $24,999 | 23 | 23.0% |
| $25,000 to $34,999 | 6 | 6.0% |
| $35,000 to $49,999 | 10 | 10.0% |
| $50,000 to $74,999 | 10 | 10.0% |
| $75,000 to $99,999 | 9 | 9.0% |
| $100,000 to $149,999 | 9 | 9.0% |
| $150,000 to $199,999 | 21 | 21.0% |
| $200,000+ | 0 | 0.0% |
Household Income by Householder Age in Aguila
The median household income in Aguila is $0, with the highest median household income of $121,667 found in the 25 to 44 years age bracket for the primary householder. A total of 48 households (48.0%) fall into this category.
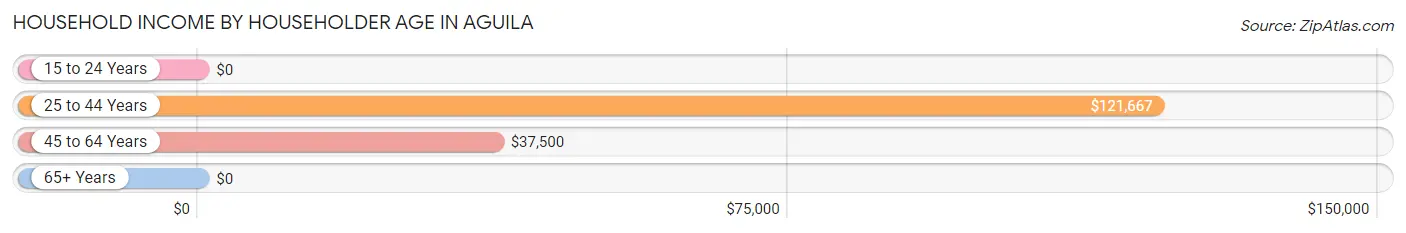
| Income Bracket | # Households | Median Income |
| 15 to 24 Years | 0 (0.0%) | $0 |
| 25 to 44 Years | 48 (48.0%) | $121,667 |
| 45 to 64 Years | 38 (38.0%) | $37,500 |
| 65+ Years | 14 (14.0%) | $0 |
| Total | 100 (100.0%) | $0 |
Poverty in Aguila
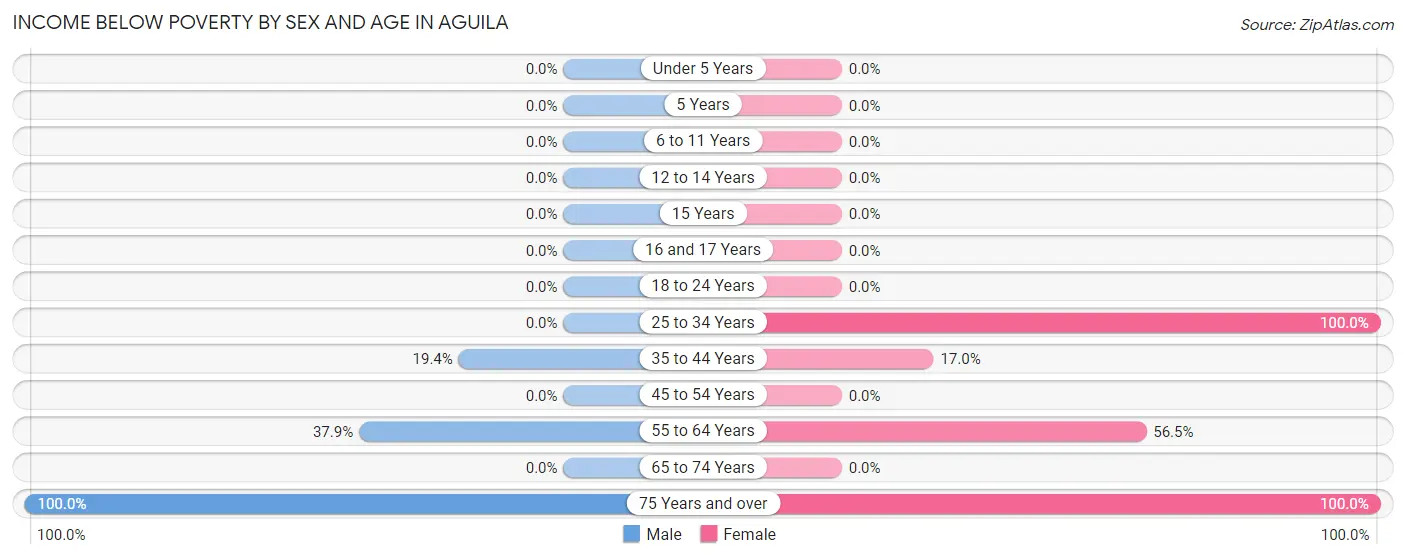
Income Below Poverty by Sex and Age in Aguila
With 16.8% poverty level for males and 17.9% for females among the residents of Aguila, 75 year old and over males and 25 to 34 year old females are the most vulnerable to poverty, with 6 males (100.0%) and 10 females (100.0%) in their respective age groups living below the poverty level.
| Age Bracket | Male | Female |
| Under 5 Years | 0 (0.0%) | 0 (0.0%) |
| 5 Years | 0 (0.0%) | 0 (0.0%) |
| 6 to 11 Years | 0 (0.0%) | 0 (0.0%) |
| 12 to 14 Years | 0 (0.0%) | 0 (0.0%) |
| 15 Years | 0 (0.0%) | 0 (0.0%) |
| 16 and 17 Years | 0 (0.0%) | 0 (0.0%) |
| 18 to 24 Years | 0 (0.0%) | 0 (0.0%) |
| 25 to 34 Years | 0 (0.0%) | 10 (100.0%) |
| 35 to 44 Years | 7 (19.4%) | 8 (17.0%) |
| 45 to 54 Years | 0 (0.0%) | 0 (0.0%) |
| 55 to 64 Years | 11 (37.9%) | 13 (56.5%) |
| 65 to 74 Years | 0 (0.0%) | 0 (0.0%) |
| 75 Years and over | 6 (100.0%) | 5 (100.0%) |
| Total | 24 (16.8%) | 36 (17.9%) |
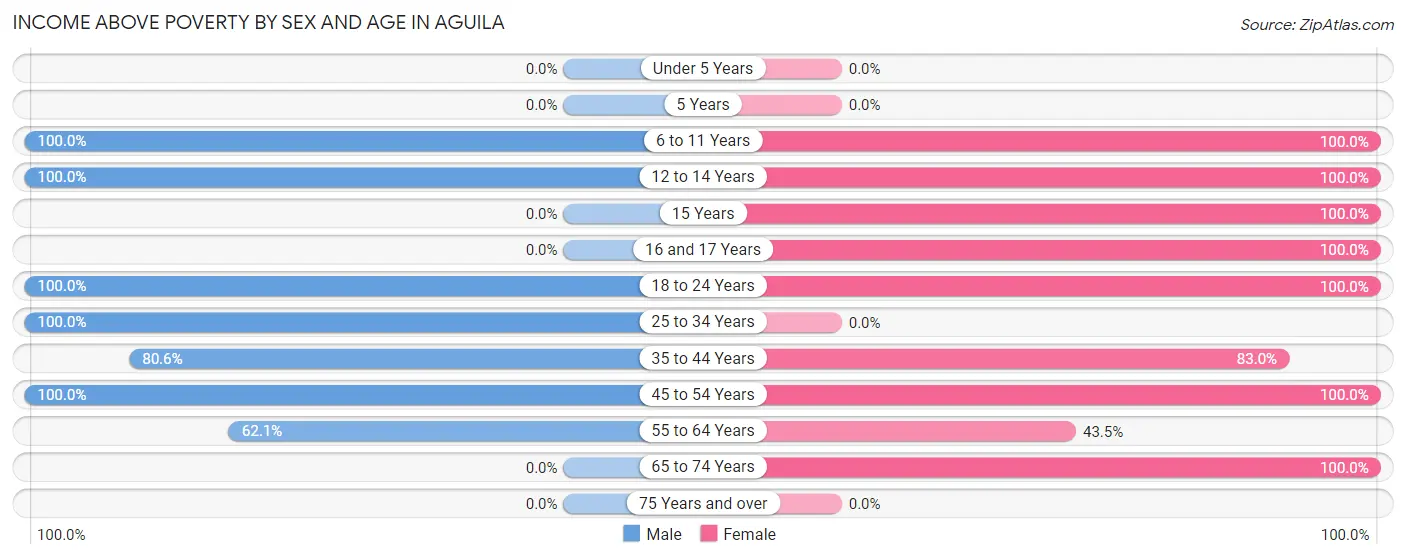
Income Above Poverty by Sex and Age in Aguila
According to the poverty statistics in Aguila, males aged 6 to 11 years and females aged 6 to 11 years are the age groups that are most secure financially, with 100.0% of males and 100.0% of females in these age groups living above the poverty line.
| Age Bracket | Male | Female |
| Under 5 Years | 0 (0.0%) | 0 (0.0%) |
| 5 Years | 0 (0.0%) | 0 (0.0%) |
| 6 to 11 Years | 10 (100.0%) | 29 (100.0%) |
| 12 to 14 Years | 10 (100.0%) | 31 (100.0%) |
| 15 Years | 0 (0.0%) | 10 (100.0%) |
| 16 and 17 Years | 0 (0.0%) | 9 (100.0%) |
| 18 to 24 Years | 21 (100.0%) | 20 (100.0%) |
| 25 to 34 Years | 11 (100.0%) | 0 (0.0%) |
| 35 to 44 Years | 29 (80.6%) | 39 (83.0%) |
| 45 to 54 Years | 20 (100.0%) | 9 (100.0%) |
| 55 to 64 Years | 18 (62.1%) | 10 (43.5%) |
| 65 to 74 Years | 0 (0.0%) | 8 (100.0%) |
| 75 Years and over | 0 (0.0%) | 0 (0.0%) |
| Total | 119 (83.2%) | 165 (82.1%) |
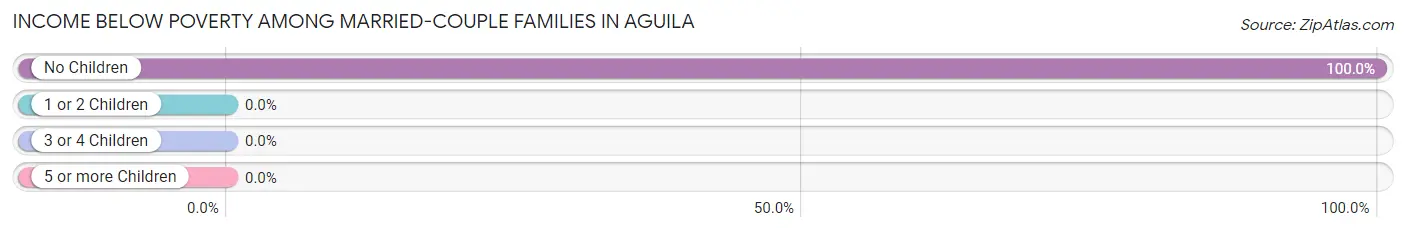
Income Below Poverty Among Married-Couple Families in Aguila
The poverty statistics for married-couple families in Aguila show that 15.8% or 9 of the total 57 families live below the poverty line. Families with no children have the highest poverty rate of 100.0%, comprising of 9 families. On the other hand, families with 1 or 2 children have the lowest poverty rate of 0.0%, which includes 0 families.
| Children | Above Poverty | Below Poverty |
| No Children | 0 (0.0%) | 9 (100.0%) |
| 1 or 2 Children | 38 (100.0%) | 0 (0.0%) |
| 3 or 4 Children | 10 (100.0%) | 0 (0.0%) |
| 5 or more Children | 0 (0.0%) | 0 (0.0%) |
| Total | 48 (84.2%) | 9 (15.8%) |
Income Below Poverty Among Single-Parent Households in Aguila
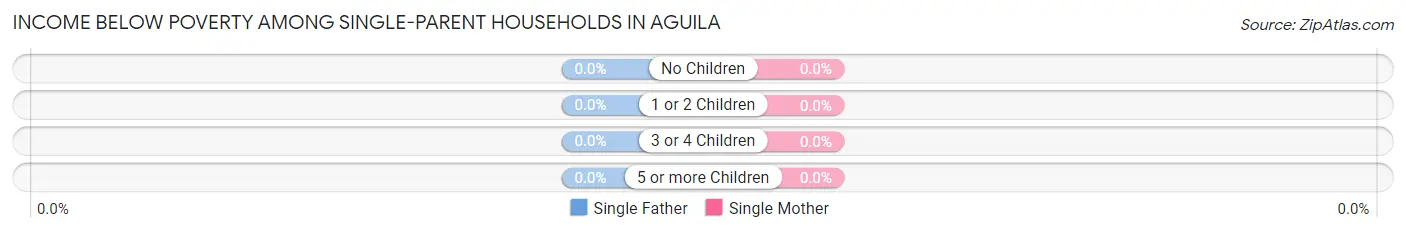
| Children | Single Father | Single Mother |
| No Children | 0 (0.0%) | 0 (0.0%) |
| 1 or 2 Children | 0 (0.0%) | 0 (0.0%) |
| 3 or 4 Children | 0 (0.0%) | 0 (0.0%) |
| 5 or more Children | 0 (0.0%) | 0 (0.0%) |
| Total | 0 (0.0%) | 0 (0.0%) |
Income Below Poverty Among Married-Couple vs Single-Parent Households in Aguila
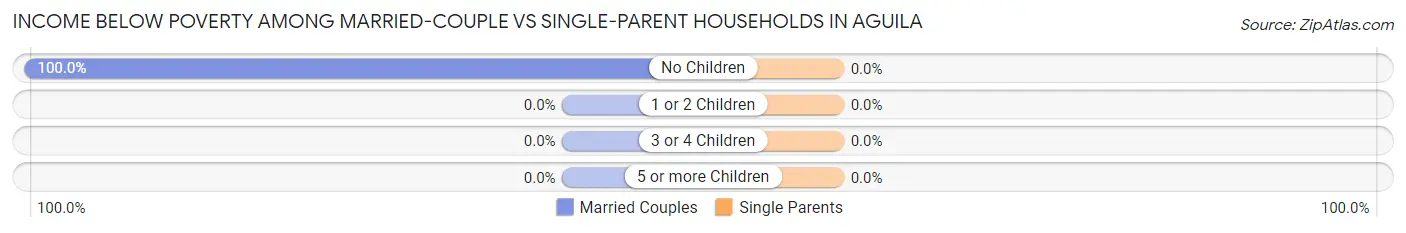
| Children | Married-Couple Families | Single-Parent Households |
| No Children | 9 (100.0%) | 0 (0.0%) |
| 1 or 2 Children | 0 (0.0%) | 0 (0.0%) |
| 3 or 4 Children | 0 (0.0%) | 0 (0.0%) |
| 5 or more Children | 0 (0.0%) | 0 (0.0%) |
| Total | 9 (15.8%) | 0 (0.0%) |
Employment Characteristics in Aguila
Employment by Class of Employer in Aguila
Among the 128 employed individuals in Aguila, private company employees (99 | 77.3%), not-for-profit organizations (21 | 16.4%), and state government employees (8 | 6.2%) make up the most common classes of employment.
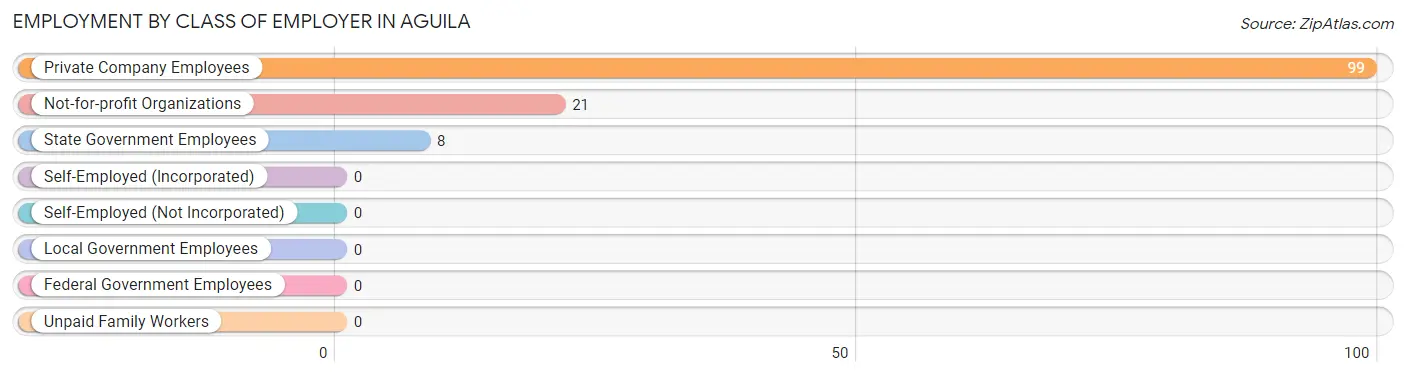
| Employer Class | # Employees | % Employees |
| Private Company Employees | 99 | 77.3% |
| Self-Employed (Incorporated) | 0 | 0.0% |
| Self-Employed (Not Incorporated) | 0 | 0.0% |
| Not-for-profit Organizations | 21 | 16.4% |
| Local Government Employees | 0 | 0.0% |
| State Government Employees | 8 | 6.2% |
| Federal Government Employees | 0 | 0.0% |
| Unpaid Family Workers | 0 | 0.0% |
| Total | 128 | 100.0% |
Employment Status by Age in Aguila
According to the labor force statistics for Aguila, out of the total population over 16 years of age (254), 65.7% or 167 individuals are in the labor force, with 12.0% or 20 of them unemployed. The age group with the highest labor force participation rate is 25 to 29 years, with 100.0% or 10 individuals in the labor force. Within the labor force, the 60 to 64 years age range has the highest percentage of unemployed individuals, with 64.7% or 11 of them being unemployed.
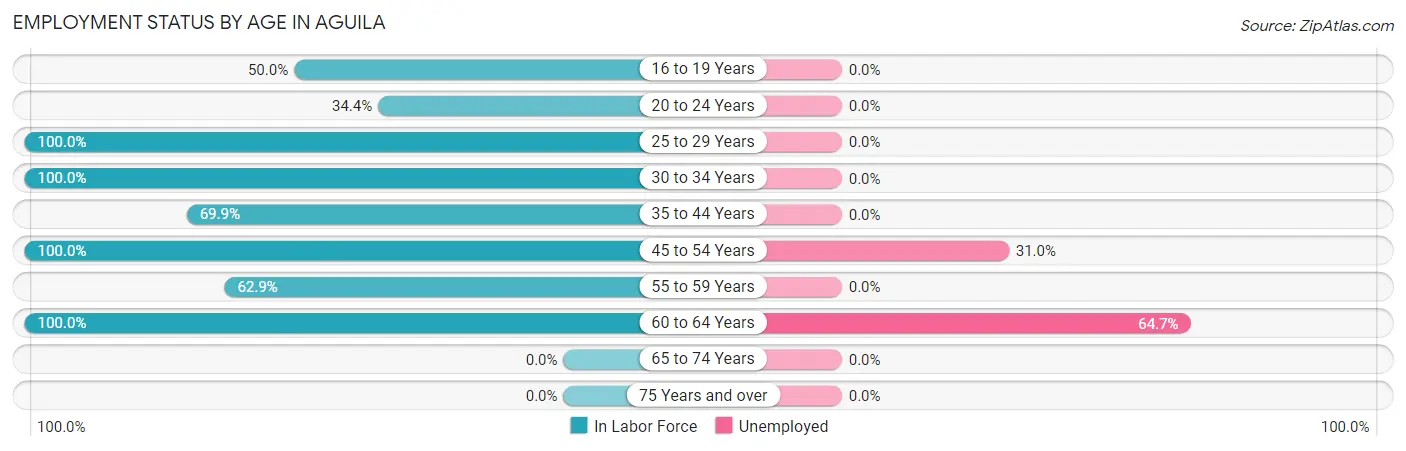
| Age Bracket | In Labor Force | Unemployed |
| 16 to 19 Years | 9 (50.0%) | 0 (0.0%) |
| 20 to 24 Years | 11 (34.4%) | 0 (0.0%) |
| 25 to 29 Years | 10 (100.0%) | 0 (0.0%) |
| 30 to 34 Years | 11 (100.0%) | 0 (0.0%) |
| 35 to 44 Years | 58 (69.9%) | 0 (0.0%) |
| 45 to 54 Years | 29 (100.0%) | 9 (31.0%) |
| 55 to 59 Years | 22 (62.9%) | 0 (0.0%) |
| 60 to 64 Years | 17 (100.0%) | 11 (64.7%) |
| 65 to 74 Years | 0 (0.0%) | 0 (0.0%) |
| 75 Years and over | 0 (0.0%) | 0 (0.0%) |
| Total | 167 (65.7%) | 20 (12.0%) |
Employment Status by Educational Attainment in Aguila
According to labor force statistics for Aguila, 79.5% of individuals (147) out of the total population between 25 and 64 years of age (185) are in the labor force, with 13.6% or 20 of them being unemployed. The group with the highest labor force participation rate are those with the educational attainment of bachelor's degree or higher, with 100.0% or 17 individuals in the labor force. Within the labor force, individuals with bachelor's degree or higher education have the highest percentage of unemployment, with 52.9% or 9 of them being unemployed.
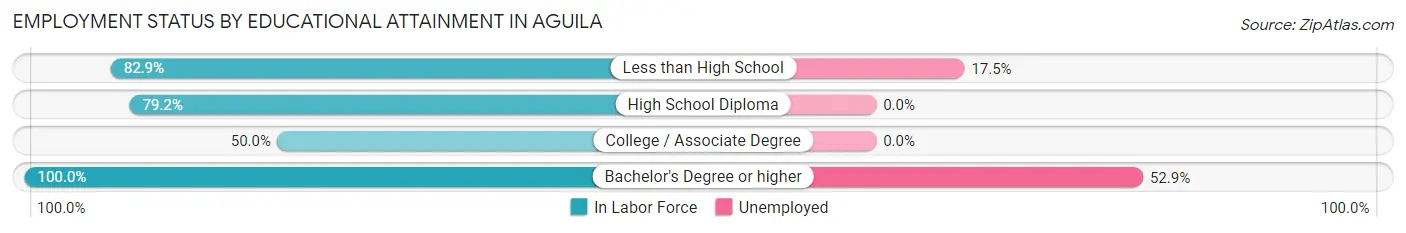
| Educational Attainment | In Labor Force | Unemployed |
| Less than High School | 63 (82.9%) | 13 (17.5%) |
| High School Diploma | 57 (79.2%) | 0 (0.0%) |
| College / Associate Degree | 10 (50.0%) | 0 (0.0%) |
| Bachelor's Degree or higher | 17 (100.0%) | 9 (52.9%) |
| Total | 147 (79.5%) | 25 (13.6%) |
Employment Occupations by Sex in Aguila
Management, Business, Science and Arts Occupations
The most common Management, Business, Science and Arts occupations in Aguila are Business & Financial (8 | 5.4%), and Management (6 | 4.1%).
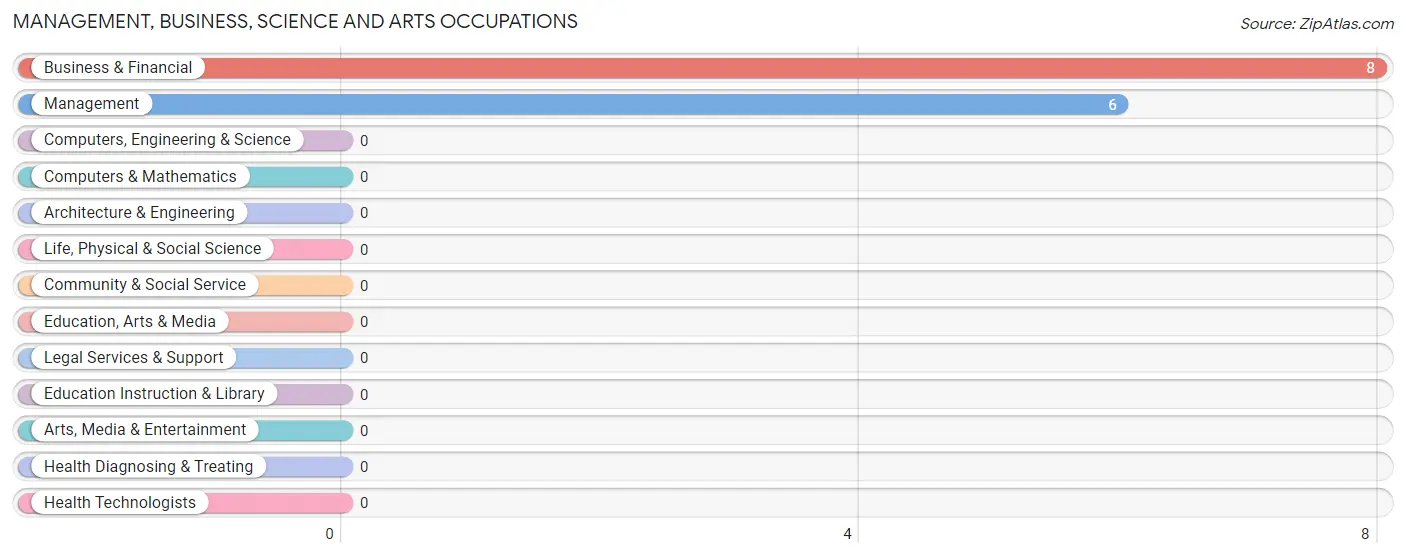
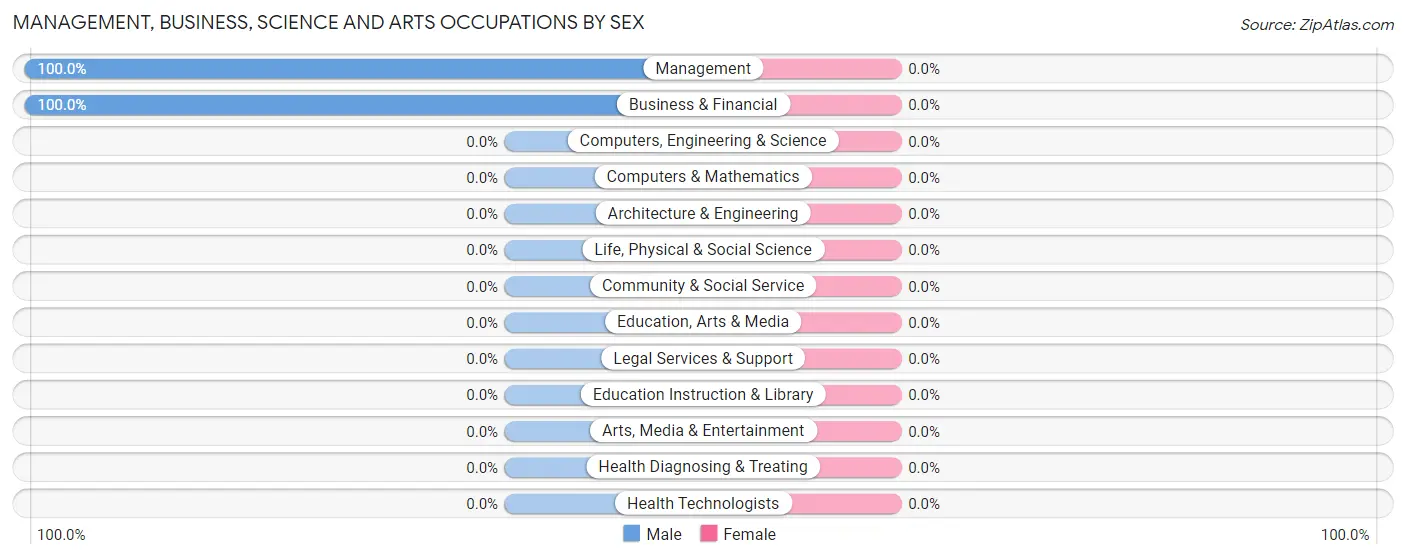
Management, Business, Science and Arts Occupations by Sex
| Occupation | Male | Female |
| Management | 6 (100.0%) | 0 (0.0%) |
| Business & Financial | 8 (100.0%) | 0 (0.0%) |
| Computers, Engineering & Science | 0 (0.0%) | 0 (0.0%) |
| Computers & Mathematics | 0 (0.0%) | 0 (0.0%) |
| Architecture & Engineering | 0 (0.0%) | 0 (0.0%) |
| Life, Physical & Social Science | 0 (0.0%) | 0 (0.0%) |
| Community & Social Service | 0 (0.0%) | 0 (0.0%) |
| Education, Arts & Media | 0 (0.0%) | 0 (0.0%) |
| Legal Services & Support | 0 (0.0%) | 0 (0.0%) |
| Education Instruction & Library | 0 (0.0%) | 0 (0.0%) |
| Arts, Media & Entertainment | 0 (0.0%) | 0 (0.0%) |
| Health Diagnosing & Treating | 0 (0.0%) | 0 (0.0%) |
| Health Technologists | 0 (0.0%) | 0 (0.0%) |
| Total (Category) | 14 (100.0%) | 0 (0.0%) |
| Total (Overall) | 89 (60.5%) | 58 (39.5%) |
Services Occupations
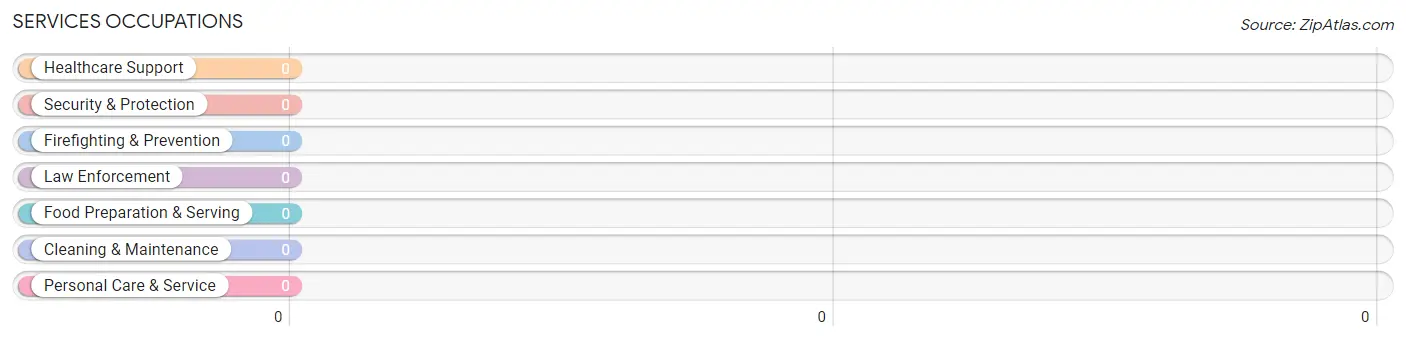
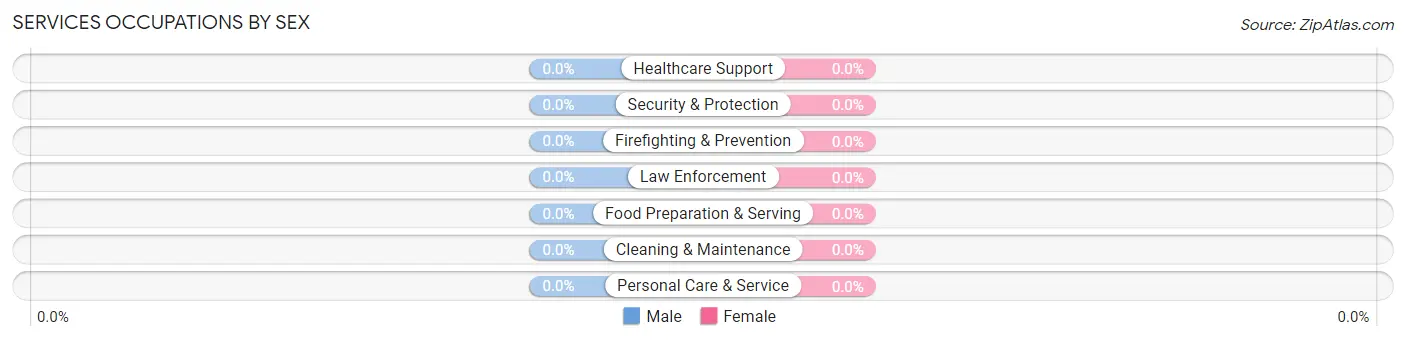
Services Occupations by Sex
| Occupation | Male | Female |
| Healthcare Support | 0 (0.0%) | 0 (0.0%) |
| Security & Protection | 0 (0.0%) | 0 (0.0%) |
| Firefighting & Prevention | 0 (0.0%) | 0 (0.0%) |
| Law Enforcement | 0 (0.0%) | 0 (0.0%) |
| Food Preparation & Serving | 0 (0.0%) | 0 (0.0%) |
| Cleaning & Maintenance | 0 (0.0%) | 0 (0.0%) |
| Personal Care & Service | 0 (0.0%) | 0 (0.0%) |
| Total (Category) | 0 (0.0%) | 0 (0.0%) |
| Total (Overall) | 89 (60.5%) | 58 (39.5%) |
Sales and Office Occupations
The most common Sales and Office occupations in Aguila are Sales & Related (10 | 6.8%), and Office & Administration (10 | 6.8%).
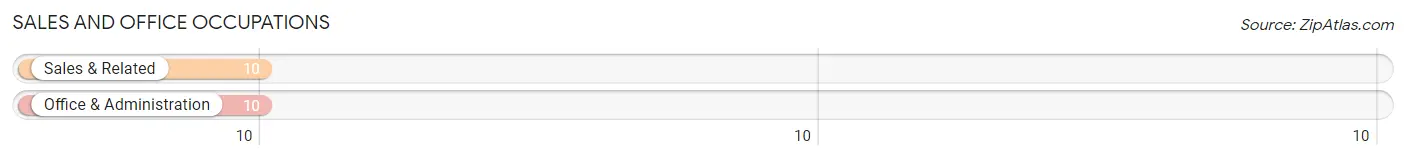
Sales and Office Occupations by Sex

| Occupation | Male | Female |
| Sales & Related | 0 (0.0%) | 10 (100.0%) |
| Office & Administration | 0 (0.0%) | 10 (100.0%) |
| Total (Category) | 0 (0.0%) | 20 (100.0%) |
| Total (Overall) | 89 (60.5%) | 58 (39.5%) |
Natural Resources, Construction and Maintenance Occupations
The most common Natural Resources, Construction and Maintenance occupations in Aguila are Farming, Fishing & Forestry (83 | 56.5%), and Construction & Extraction (11 | 7.5%).
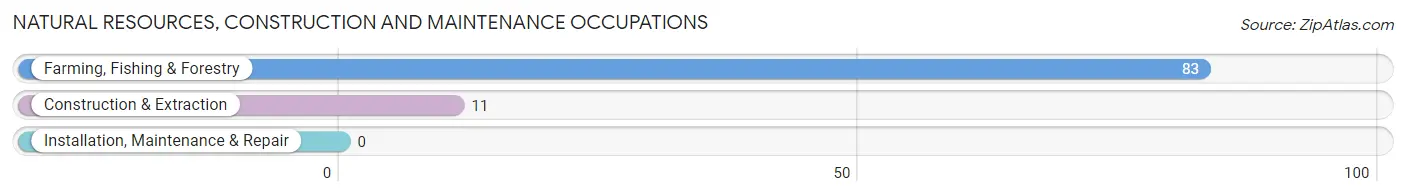
Natural Resources, Construction and Maintenance Occupations by Sex
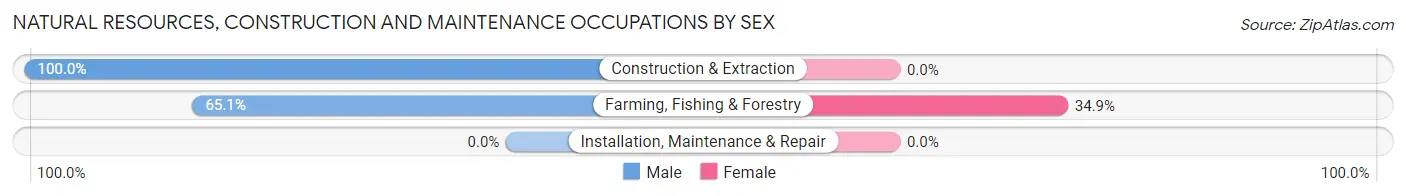
| Occupation | Male | Female |
| Farming, Fishing & Forestry | 54 (65.1%) | 29 (34.9%) |
| Construction & Extraction | 11 (100.0%) | 0 (0.0%) |
| Installation, Maintenance & Repair | 0 (0.0%) | 0 (0.0%) |
| Total (Category) | 65 (69.2%) | 29 (30.8%) |
| Total (Overall) | 89 (60.5%) | 58 (39.5%) |
Production, Transportation and Moving Occupations
The most common Production, Transportation and Moving occupations in Aguila are , and Material Moving (19 | 12.9%).
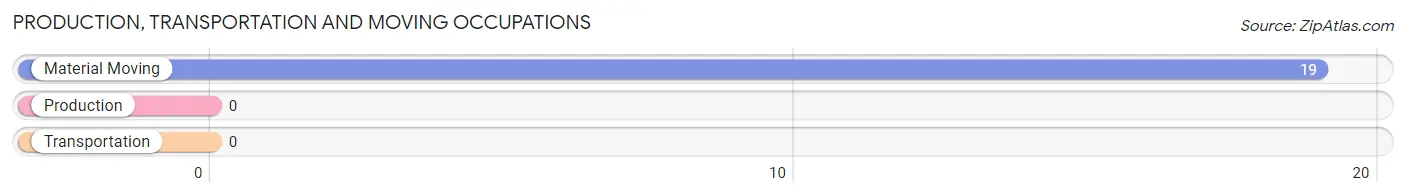
Production, Transportation and Moving Occupations by Sex
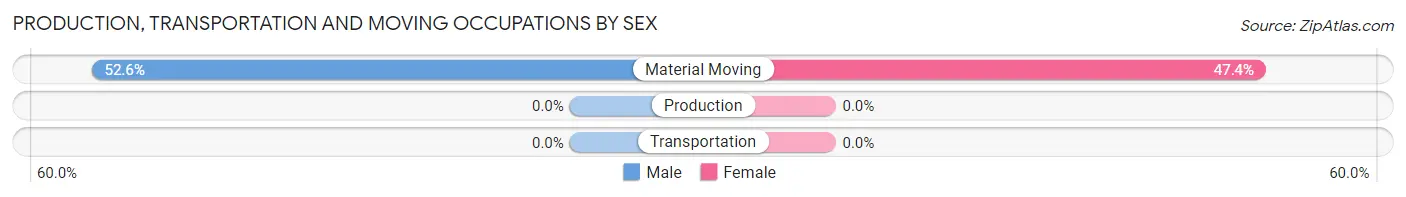
| Occupation | Male | Female |
| Production | 0 (0.0%) | 0 (0.0%) |
| Transportation | 0 (0.0%) | 0 (0.0%) |
| Material Moving | 10 (52.6%) | 9 (47.4%) |
| Total (Category) | 10 (52.6%) | 9 (47.4%) |
| Total (Overall) | 89 (60.5%) | 58 (39.5%) |
Employment Industries by Sex in Aguila
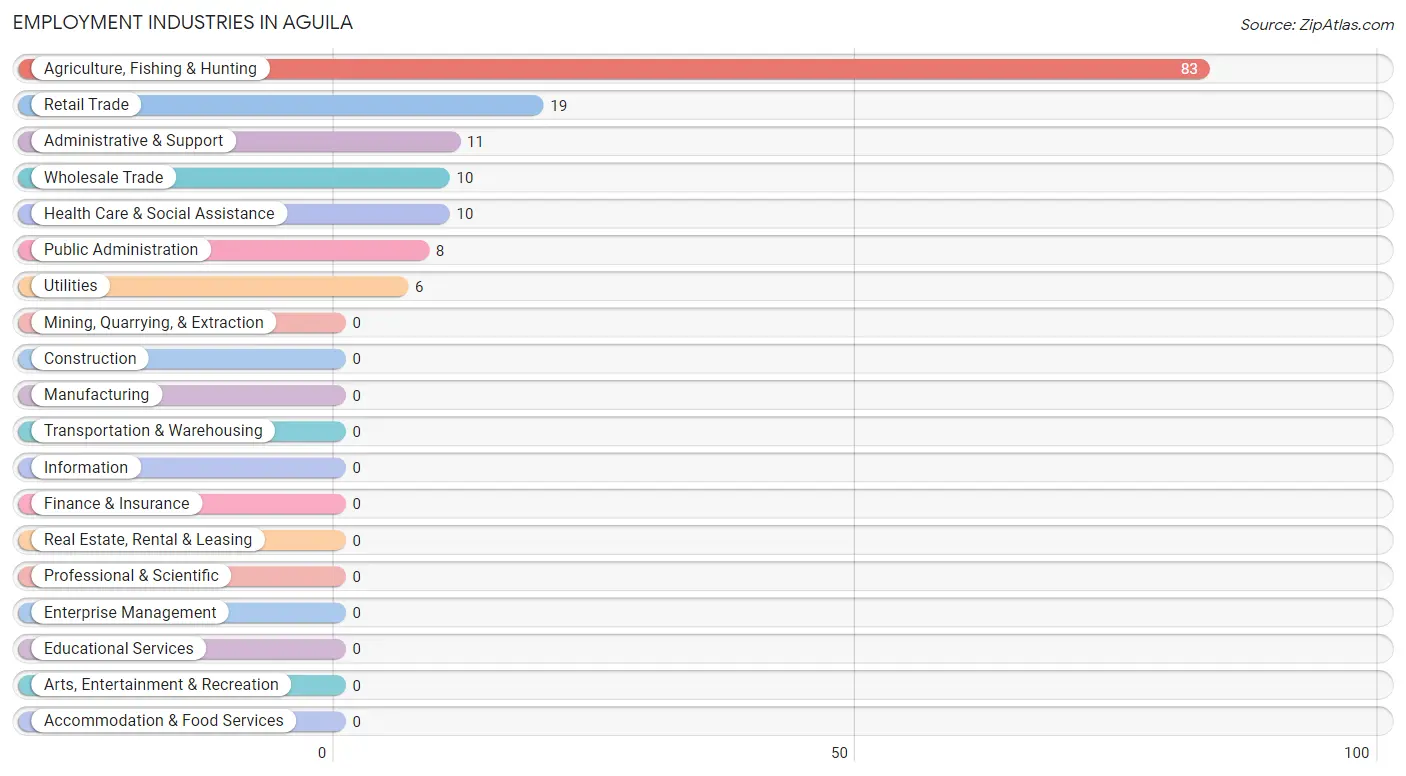
Employment Industries in Aguila
The major employment industries in Aguila include Agriculture, Fishing & Hunting (83 | 56.5%), Retail Trade (19 | 12.9%), Administrative & Support (11 | 7.5%), Wholesale Trade (10 | 6.8%), and Health Care & Social Assistance (10 | 6.8%).
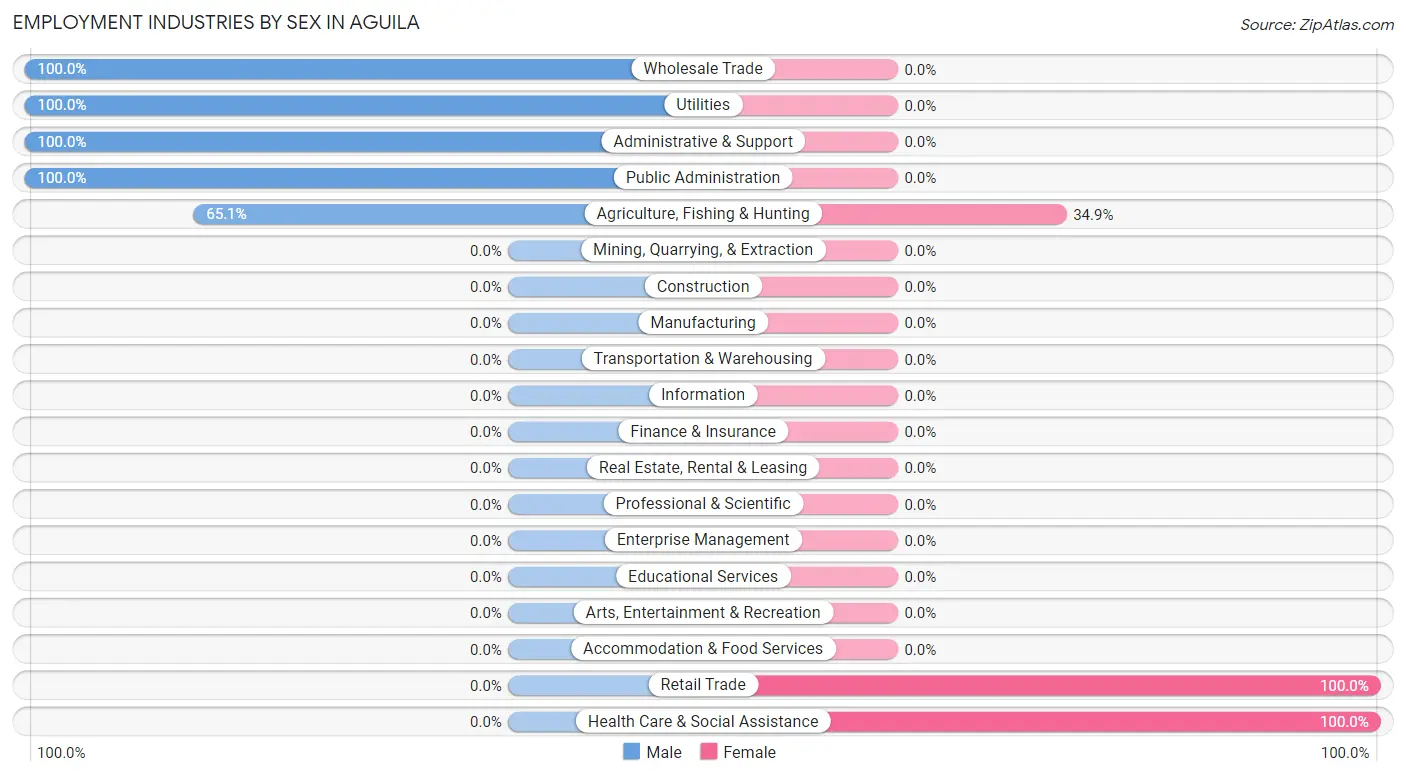
Employment Industries by Sex in Aguila
The Aguila industries that see more men than women are Wholesale Trade (100.0%), Utilities (100.0%), and Administrative & Support (100.0%), whereas the industries that tend to have a higher number of women are Retail Trade (100.0%), Health Care & Social Assistance (100.0%), and Agriculture, Fishing & Hunting (34.9%).
| Industry | Male | Female |
| Agriculture, Fishing & Hunting | 54 (65.1%) | 29 (34.9%) |
| Mining, Quarrying, & Extraction | 0 (0.0%) | 0 (0.0%) |
| Construction | 0 (0.0%) | 0 (0.0%) |
| Manufacturing | 0 (0.0%) | 0 (0.0%) |
| Wholesale Trade | 10 (100.0%) | 0 (0.0%) |
| Retail Trade | 0 (0.0%) | 19 (100.0%) |
| Transportation & Warehousing | 0 (0.0%) | 0 (0.0%) |
| Utilities | 6 (100.0%) | 0 (0.0%) |
| Information | 0 (0.0%) | 0 (0.0%) |
| Finance & Insurance | 0 (0.0%) | 0 (0.0%) |
| Real Estate, Rental & Leasing | 0 (0.0%) | 0 (0.0%) |
| Professional & Scientific | 0 (0.0%) | 0 (0.0%) |
| Enterprise Management | 0 (0.0%) | 0 (0.0%) |
| Administrative & Support | 11 (100.0%) | 0 (0.0%) |
| Educational Services | 0 (0.0%) | 0 (0.0%) |
| Health Care & Social Assistance | 0 (0.0%) | 10 (100.0%) |
| Arts, Entertainment & Recreation | 0 (0.0%) | 0 (0.0%) |
| Accommodation & Food Services | 0 (0.0%) | 0 (0.0%) |
| Public Administration | 8 (100.0%) | 0 (0.0%) |
| Total | 89 (60.5%) | 58 (39.5%) |
Education in Aguila
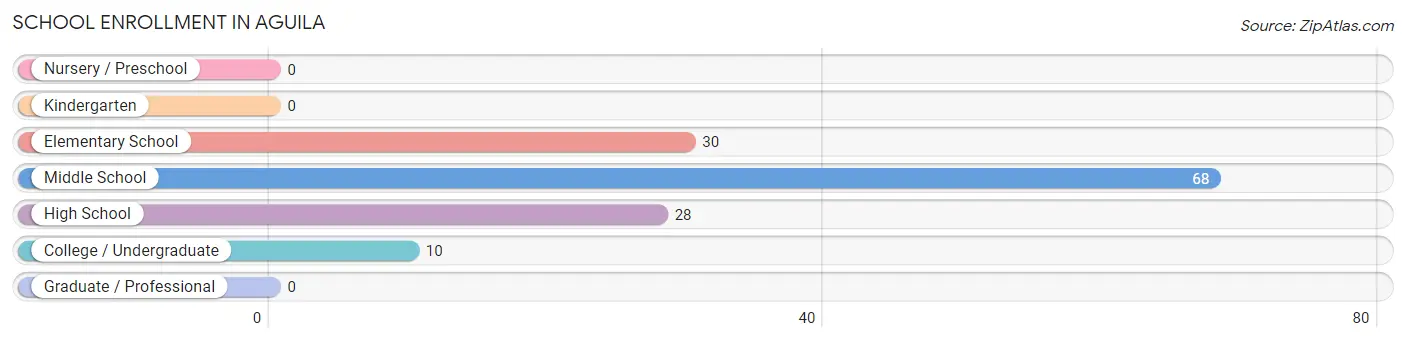
School Enrollment in Aguila
The most common levels of schooling among the 136 students in Aguila are middle school (68 | 50.0%), elementary school (30 | 22.1%), and high school (28 | 20.6%).
| School Level | # Students | % Students |
| Nursery / Preschool | 0 | 0.0% |
| Kindergarten | 0 | 0.0% |
| Elementary School | 30 | 22.1% |
| Middle School | 68 | 50.0% |
| High School | 28 | 20.6% |
| College / Undergraduate | 10 | 7.3% |
| Graduate / Professional | 0 | 0.0% |
| Total | 136 | 100.0% |
School Enrollment by Age by Funding Source in Aguila
Out of a total of 136 students who are enrolled in schools in Aguila, 10 (7.4%) attend a private institution, while the remaining 126 (92.6%) are enrolled in public schools. The age group of 20 to 24 year olds has the highest likelihood of being enrolled in private schools, with 10 (100.0% in the age bracket) enrolled. Conversely, the age group of 5 to 9 year old has the lowest likelihood of being enrolled in a private school, with 30 (100.0% in the age bracket) attending a public institution.
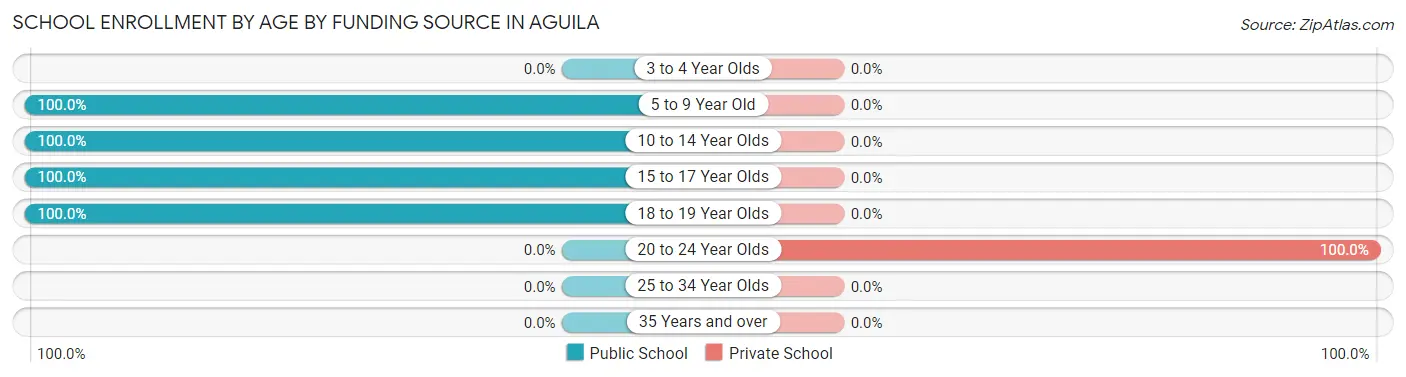
| Age Bracket | Public School | Private School |
| 3 to 4 Year Olds | 0 (0.0%) | 0 (0.0%) |
| 5 to 9 Year Old | 30 (100.0%) | 0 (0.0%) |
| 10 to 14 Year Olds | 68 (100.0%) | 0 (0.0%) |
| 15 to 17 Year Olds | 19 (100.0%) | 0 (0.0%) |
| 18 to 19 Year Olds | 9 (100.0%) | 0 (0.0%) |
| 20 to 24 Year Olds | 0 (0.0%) | 10 (100.0%) |
| 25 to 34 Year Olds | 0 (0.0%) | 0 (0.0%) |
| 35 Years and over | 0 (0.0%) | 0 (0.0%) |
| Total | 126 (92.6%) | 10 (7.4%) |
Educational Attainment by Field of Study in Aguila
Bio, nature & agricultural (9 | 52.9%), and business (8 | 47.1%) are the most common fields of study among 17 individuals in Aguila who have obtained a bachelor's degree or higher.
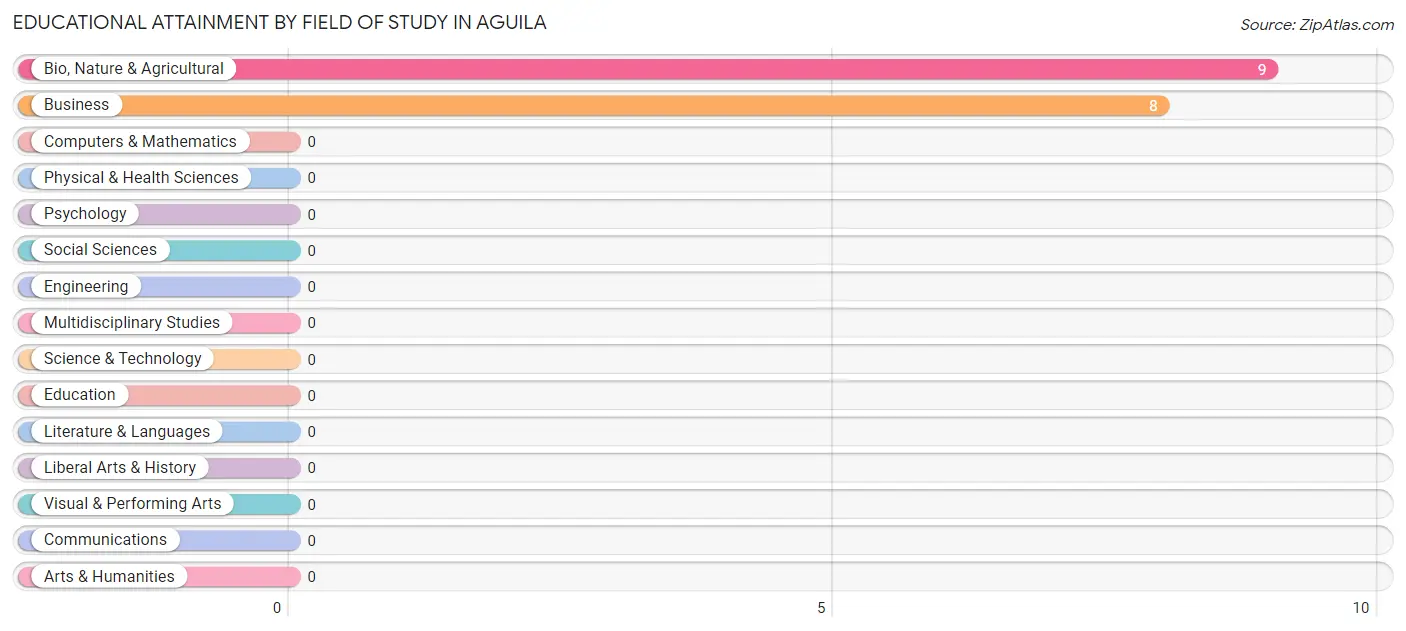
| Field of Study | # Graduates | % Graduates |
| Computers & Mathematics | 0 | 0.0% |
| Bio, Nature & Agricultural | 9 | 52.9% |
| Physical & Health Sciences | 0 | 0.0% |
| Psychology | 0 | 0.0% |
| Social Sciences | 0 | 0.0% |
| Engineering | 0 | 0.0% |
| Multidisciplinary Studies | 0 | 0.0% |
| Science & Technology | 0 | 0.0% |
| Business | 8 | 47.1% |
| Education | 0 | 0.0% |
| Literature & Languages | 0 | 0.0% |
| Liberal Arts & History | 0 | 0.0% |
| Visual & Performing Arts | 0 | 0.0% |
| Communications | 0 | 0.0% |
| Arts & Humanities | 0 | 0.0% |
| Total | 17 | 100.0% |
Transportation & Commute in Aguila
Vehicle Availability by Sex in Aguila
The most prevalent vehicle ownership categories in Aguila are males with 2 vehicles (28, accounting for 31.5%) and females with 2 vehicles (0, making up 71.8%).
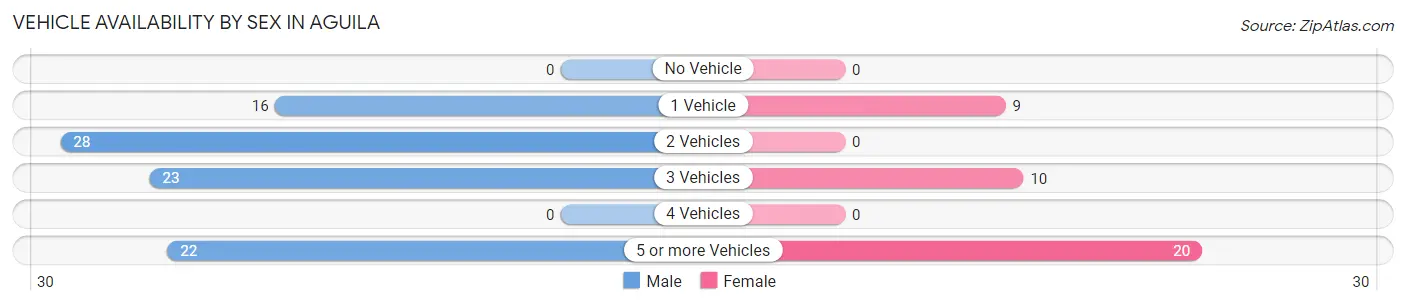
| Vehicles Available | Male | Female |
| No Vehicle | 0 (0.0%) | 0 (0.0%) |
| 1 Vehicle | 16 (18.0%) | 9 (23.1%) |
| 2 Vehicles | 28 (31.5%) | 0 (0.0%) |
| 3 Vehicles | 23 (25.8%) | 10 (25.6%) |
| 4 Vehicles | 0 (0.0%) | 0 (0.0%) |
| 5 or more Vehicles | 22 (24.7%) | 20 (51.3%) |
| Total | 89 (100.0%) | 39 (100.0%) |
Commute Time in Aguila
The most frequently occuring commute durations in Aguila are 10 to 14 minutes (50 commuters, 39.1%), 5 to 9 minutes (42 commuters, 32.8%), and 30 to 34 minutes (19 commuters, 14.8%).
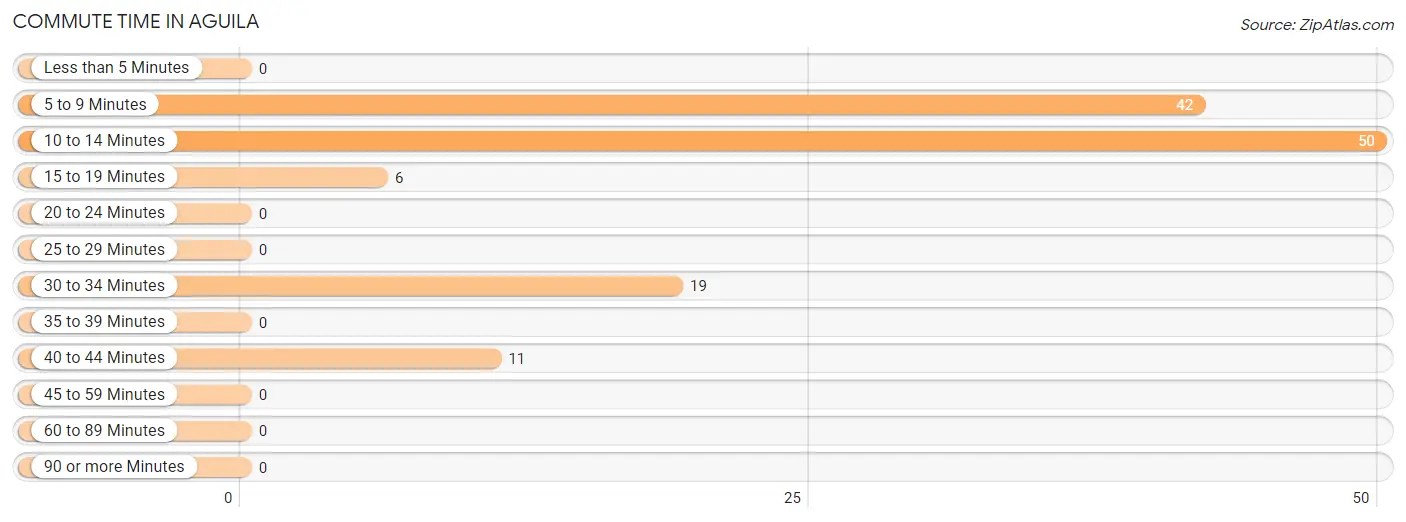
| Commute Time | # Commuters | % Commuters |
| Less than 5 Minutes | 0 | 0.0% |
| 5 to 9 Minutes | 42 | 32.8% |
| 10 to 14 Minutes | 50 | 39.1% |
| 15 to 19 Minutes | 6 | 4.7% |
| 20 to 24 Minutes | 0 | 0.0% |
| 25 to 29 Minutes | 0 | 0.0% |
| 30 to 34 Minutes | 19 | 14.8% |
| 35 to 39 Minutes | 0 | 0.0% |
| 40 to 44 Minutes | 11 | 8.6% |
| 45 to 59 Minutes | 0 | 0.0% |
| 60 to 89 Minutes | 0 | 0.0% |
| 90 or more Minutes | 0 | 0.0% |
Commute Time by Sex in Aguila
The most common commute times in Aguila are 10 to 14 minutes (40 commuters, 44.9%) for males and 30 to 34 minutes (19 commuters, 48.7%) for females.
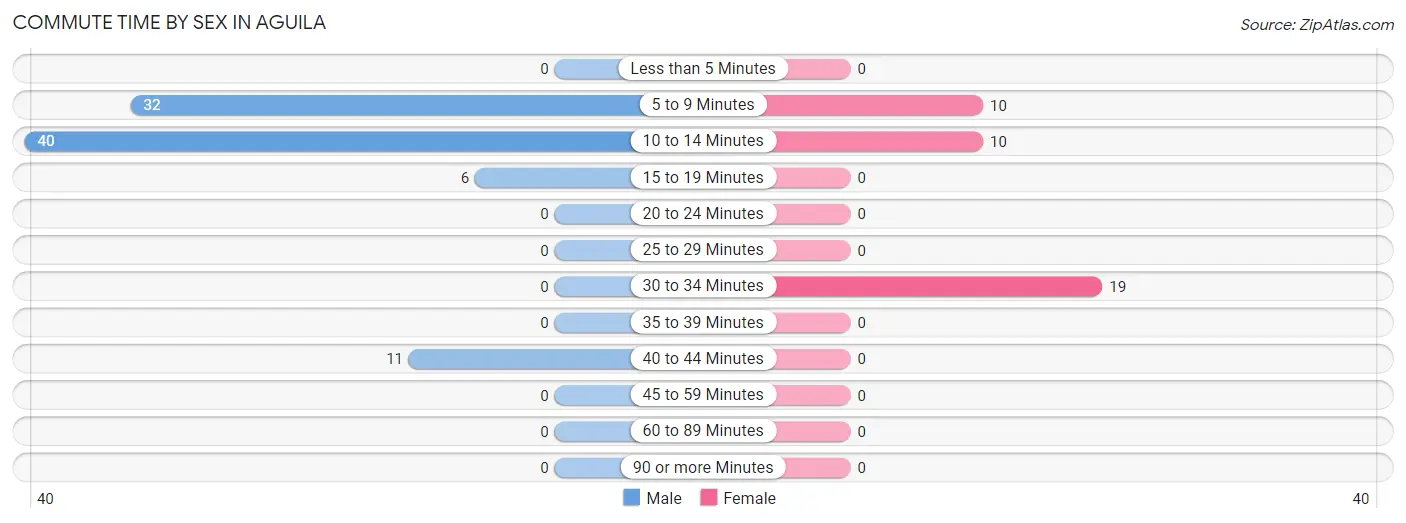
| Commute Time | Male | Female |
| Less than 5 Minutes | 0 (0.0%) | 0 (0.0%) |
| 5 to 9 Minutes | 32 (36.0%) | 10 (25.6%) |
| 10 to 14 Minutes | 40 (44.9%) | 10 (25.6%) |
| 15 to 19 Minutes | 6 (6.7%) | 0 (0.0%) |
| 20 to 24 Minutes | 0 (0.0%) | 0 (0.0%) |
| 25 to 29 Minutes | 0 (0.0%) | 0 (0.0%) |
| 30 to 34 Minutes | 0 (0.0%) | 19 (48.7%) |
| 35 to 39 Minutes | 0 (0.0%) | 0 (0.0%) |
| 40 to 44 Minutes | 11 (12.4%) | 0 (0.0%) |
| 45 to 59 Minutes | 0 (0.0%) | 0 (0.0%) |
| 60 to 89 Minutes | 0 (0.0%) | 0 (0.0%) |
| 90 or more Minutes | 0 (0.0%) | 0 (0.0%) |
Time of Departure to Work by Sex in Aguila
The most frequent times of departure to work in Aguila are 6:00 AM to 6:29 AM (21, 23.6%) for males and 5:30 AM to 5:59 AM (20, 51.3%) for females.
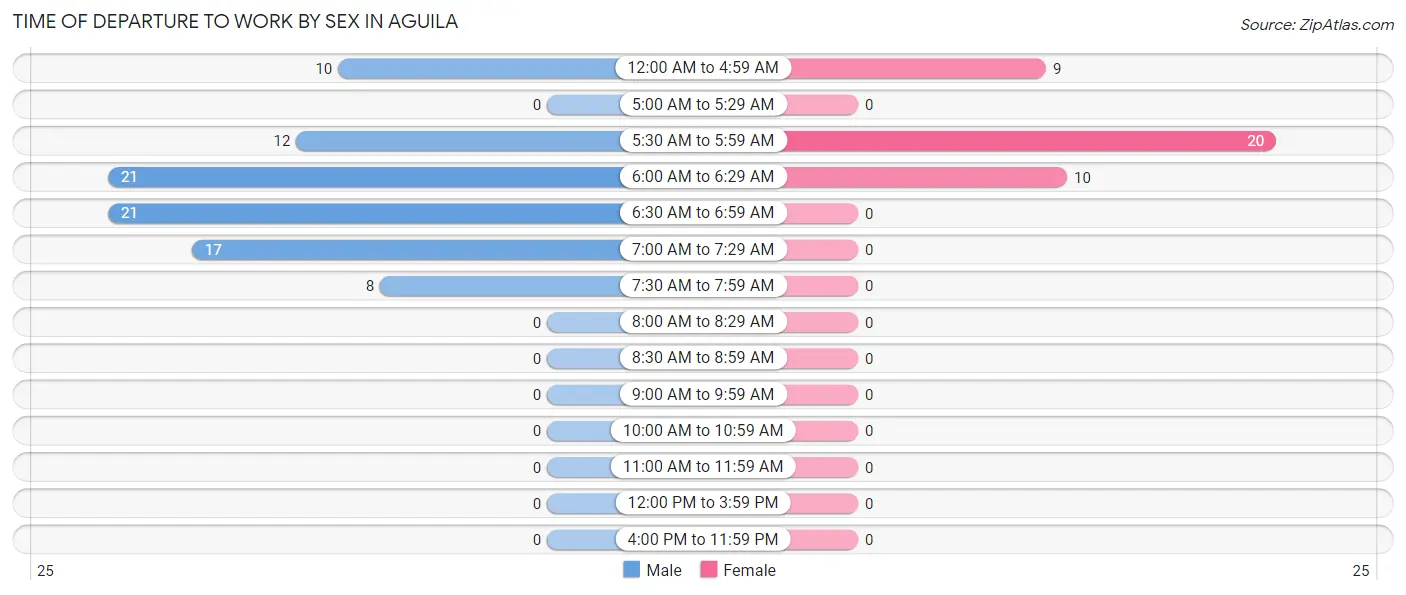
| Time of Departure | Male | Female |
| 12:00 AM to 4:59 AM | 10 (11.2%) | 9 (23.1%) |
| 5:00 AM to 5:29 AM | 0 (0.0%) | 0 (0.0%) |
| 5:30 AM to 5:59 AM | 12 (13.5%) | 20 (51.3%) |
| 6:00 AM to 6:29 AM | 21 (23.6%) | 10 (25.6%) |
| 6:30 AM to 6:59 AM | 21 (23.6%) | 0 (0.0%) |
| 7:00 AM to 7:29 AM | 17 (19.1%) | 0 (0.0%) |
| 7:30 AM to 7:59 AM | 8 (9.0%) | 0 (0.0%) |
| 8:00 AM to 8:29 AM | 0 (0.0%) | 0 (0.0%) |
| 8:30 AM to 8:59 AM | 0 (0.0%) | 0 (0.0%) |
| 9:00 AM to 9:59 AM | 0 (0.0%) | 0 (0.0%) |
| 10:00 AM to 10:59 AM | 0 (0.0%) | 0 (0.0%) |
| 11:00 AM to 11:59 AM | 0 (0.0%) | 0 (0.0%) |
| 12:00 PM to 3:59 PM | 0 (0.0%) | 0 (0.0%) |
| 4:00 PM to 11:59 PM | 0 (0.0%) | 0 (0.0%) |
| Total | 89 (100.0%) | 39 (100.0%) |
Housing Occupancy in Aguila
Occupancy by Ownership in Aguila
Of the total 100 dwellings in Aguila, owner-occupied units account for 81 (81.0%), while renter-occupied units make up 19 (19.0%).
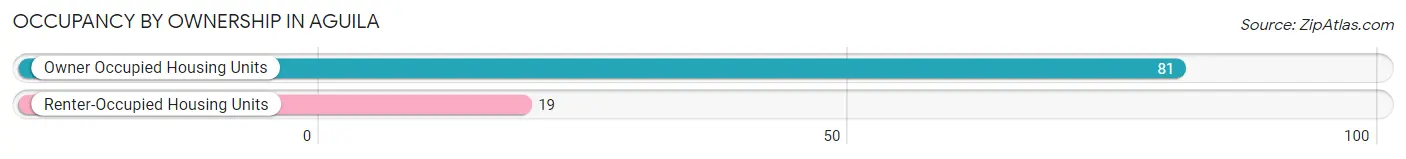
| Occupancy | # Housing Units | % Housing Units |
| Owner Occupied Housing Units | 81 | 81.0% |
| Renter-Occupied Housing Units | 19 | 19.0% |
| Total Occupied Housing Units | 100 | 100.0% |
Occupancy by Household Size in Aguila
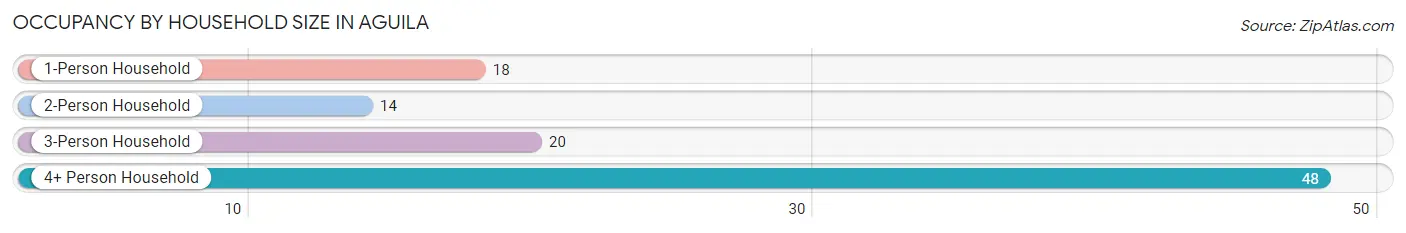
| Household Size | # Housing Units | % Housing Units |
| 1-Person Household | 18 | 18.0% |
| 2-Person Household | 14 | 14.0% |
| 3-Person Household | 20 | 20.0% |
| 4+ Person Household | 48 | 48.0% |
| Total Housing Units | 100 | 100.0% |
Occupancy by Ownership by Household Size in Aguila
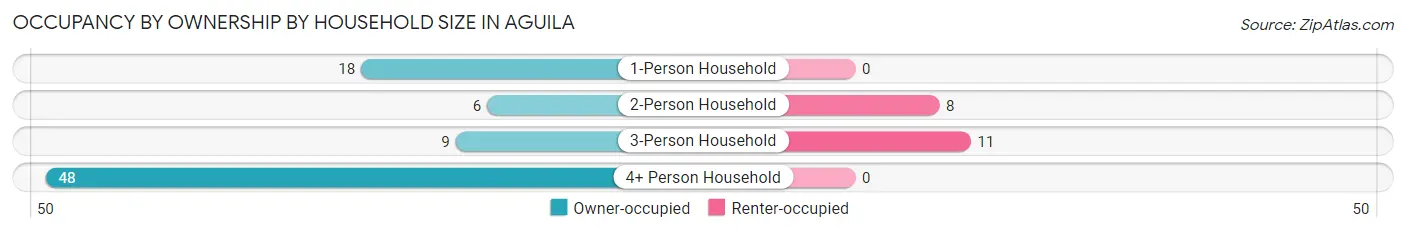
| Household Size | Owner-occupied | Renter-occupied |
| 1-Person Household | 18 (100.0%) | 0 (0.0%) |
| 2-Person Household | 6 (42.9%) | 8 (57.1%) |
| 3-Person Household | 9 (45.0%) | 11 (55.0%) |
| 4+ Person Household | 48 (100.0%) | 0 (0.0%) |
| Total Housing Units | 81 (81.0%) | 19 (19.0%) |
Occupancy by Educational Attainment in Aguila
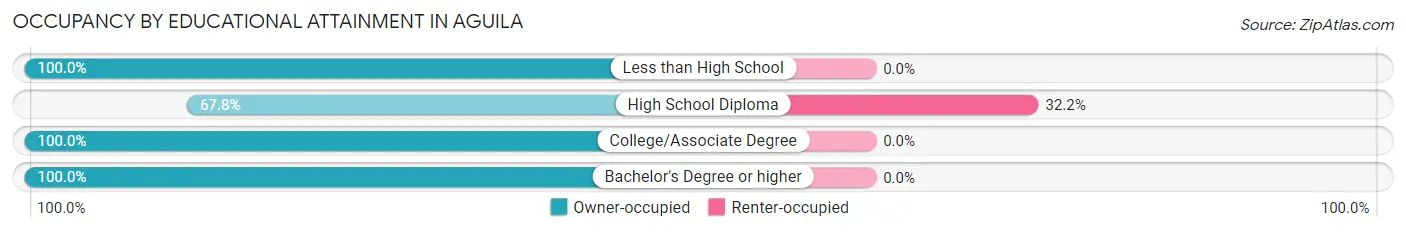
| Household Size | Owner-occupied | Renter-occupied |
| Less than High School | 22 (100.0%) | 0 (0.0%) |
| High School Diploma | 40 (67.8%) | 19 (32.2%) |
| College/Associate Degree | 10 (100.0%) | 0 (0.0%) |
| Bachelor's Degree or higher | 9 (100.0%) | 0 (0.0%) |
Occupancy by Age of Householder in Aguila
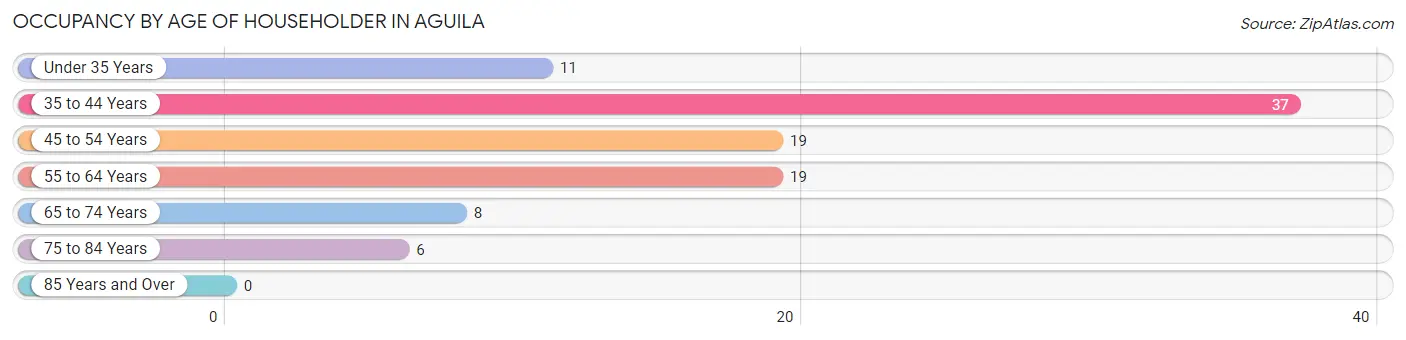
| Age Bracket | # Households | % Households |
| Under 35 Years | 11 | 11.0% |
| 35 to 44 Years | 37 | 37.0% |
| 45 to 54 Years | 19 | 19.0% |
| 55 to 64 Years | 19 | 19.0% |
| 65 to 74 Years | 8 | 8.0% |
| 75 to 84 Years | 6 | 6.0% |
| 85 Years and Over | 0 | 0.0% |
| Total | 100 | 100.0% |
Housing Finances in Aguila
Median Income by Occupancy in Aguila
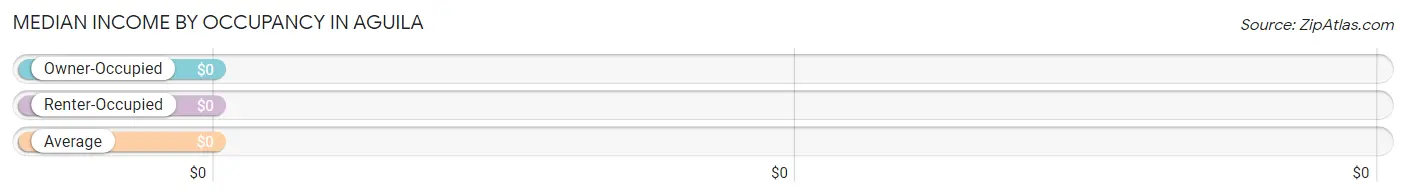
| Occupancy Type | # Households | Median Income |
| Owner-Occupied | 81 (81.0%) | $0 |
| Renter-Occupied | 19 (19.0%) | $0 |
| Average | 100 (100.0%) | $0 |
Occupancy by Householder Income Bracket in Aguila
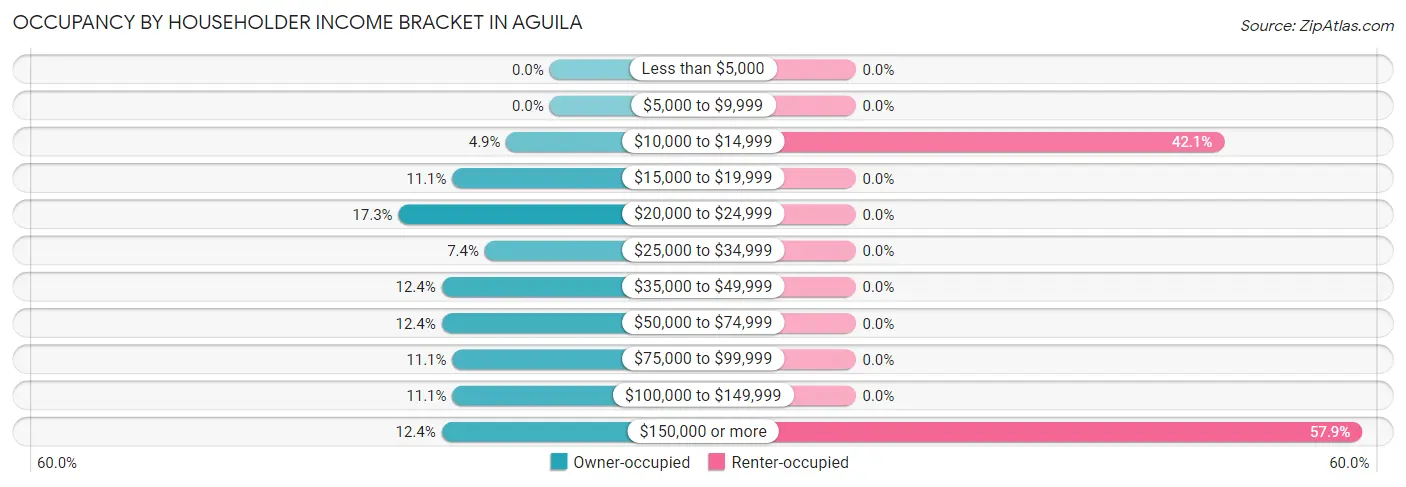
| Income Bracket | Owner-occupied | Renter-occupied |
| Less than $5,000 | 0 (0.0%) | 0 (0.0%) |
| $5,000 to $9,999 | 0 (0.0%) | 0 (0.0%) |
| $10,000 to $14,999 | 4 (4.9%) | 8 (42.1%) |
| $15,000 to $19,999 | 9 (11.1%) | 0 (0.0%) |
| $20,000 to $24,999 | 14 (17.3%) | 0 (0.0%) |
| $25,000 to $34,999 | 6 (7.4%) | 0 (0.0%) |
| $35,000 to $49,999 | 10 (12.3%) | 0 (0.0%) |
| $50,000 to $74,999 | 10 (12.3%) | 0 (0.0%) |
| $75,000 to $99,999 | 9 (11.1%) | 0 (0.0%) |
| $100,000 to $149,999 | 9 (11.1%) | 0 (0.0%) |
| $150,000 or more | 10 (12.3%) | 11 (57.9%) |
| Total | 81 (100.0%) | 19 (100.0%) |
Monthly Housing Cost Tiers in Aguila
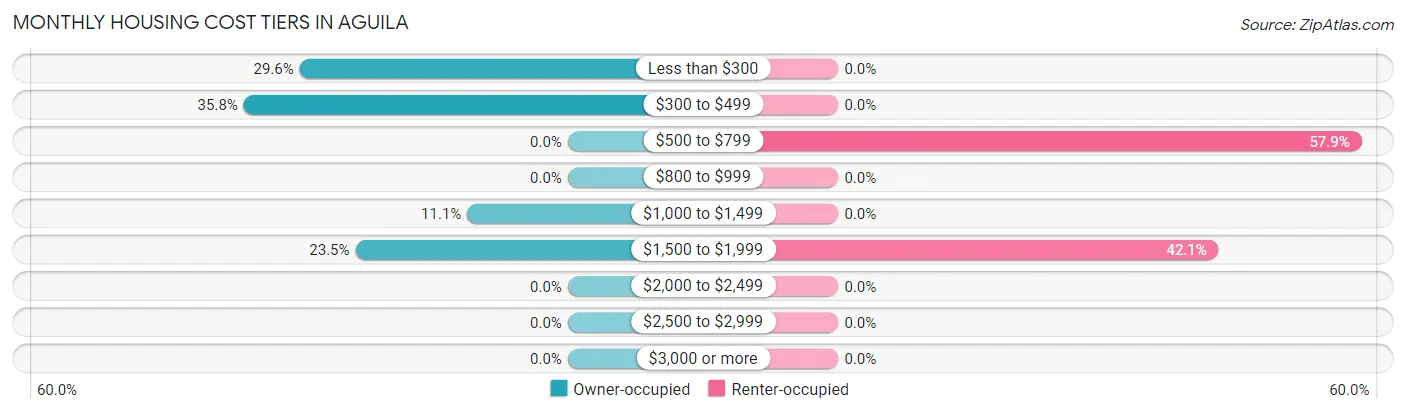
| Monthly Cost | Owner-occupied | Renter-occupied |
| Less than $300 | 24 (29.6%) | 0 (0.0%) |
| $300 to $499 | 29 (35.8%) | 0 (0.0%) |
| $500 to $799 | 0 (0.0%) | 11 (57.9%) |
| $800 to $999 | 0 (0.0%) | 0 (0.0%) |
| $1,000 to $1,499 | 9 (11.1%) | 0 (0.0%) |
| $1,500 to $1,999 | 19 (23.5%) | 8 (42.1%) |
| $2,000 to $2,499 | 0 (0.0%) | 0 (0.0%) |
| $2,500 to $2,999 | 0 (0.0%) | 0 (0.0%) |
| $3,000 or more | 0 (0.0%) | 0 (0.0%) |
| Total | 81 (100.0%) | 19 (100.0%) |
Physical Housing Characteristics in Aguila
Housing Structures in Aguila
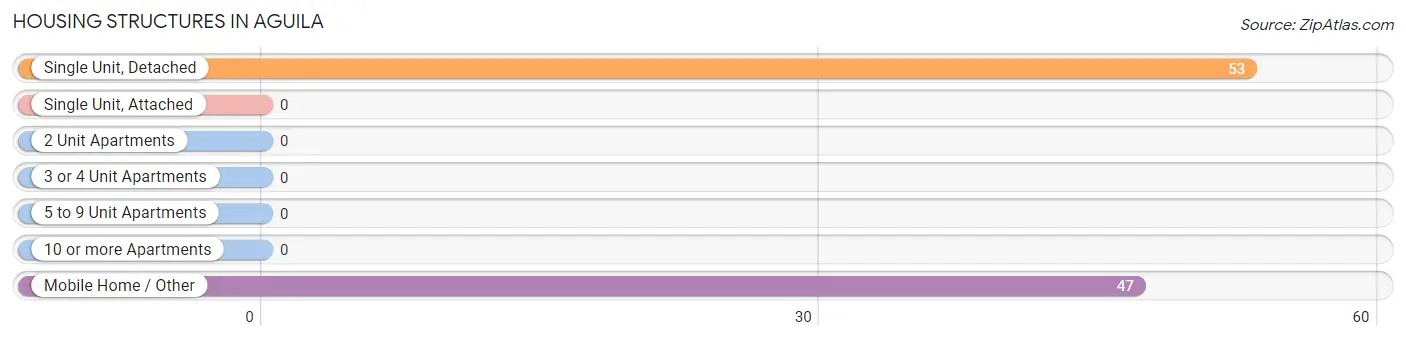
| Structure Type | # Housing Units | % Housing Units |
| Single Unit, Detached | 53 | 53.0% |
| Single Unit, Attached | 0 | 0.0% |
| 2 Unit Apartments | 0 | 0.0% |
| 3 or 4 Unit Apartments | 0 | 0.0% |
| 5 to 9 Unit Apartments | 0 | 0.0% |
| 10 or more Apartments | 0 | 0.0% |
| Mobile Home / Other | 47 | 47.0% |
| Total | 100 | 100.0% |
Housing Structures by Occupancy in Aguila
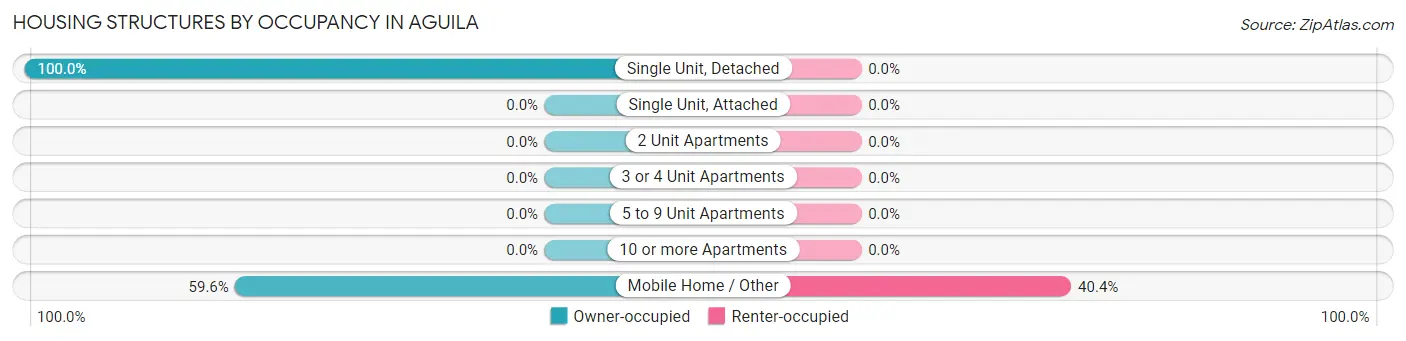
| Structure Type | Owner-occupied | Renter-occupied |
| Single Unit, Detached | 53 (100.0%) | 0 (0.0%) |
| Single Unit, Attached | 0 (0.0%) | 0 (0.0%) |
| 2 Unit Apartments | 0 (0.0%) | 0 (0.0%) |
| 3 or 4 Unit Apartments | 0 (0.0%) | 0 (0.0%) |
| 5 to 9 Unit Apartments | 0 (0.0%) | 0 (0.0%) |
| 10 or more Apartments | 0 (0.0%) | 0 (0.0%) |
| Mobile Home / Other | 28 (59.6%) | 19 (40.4%) |
| Total | 81 (81.0%) | 19 (19.0%) |
Housing Structures by Number of Rooms in Aguila
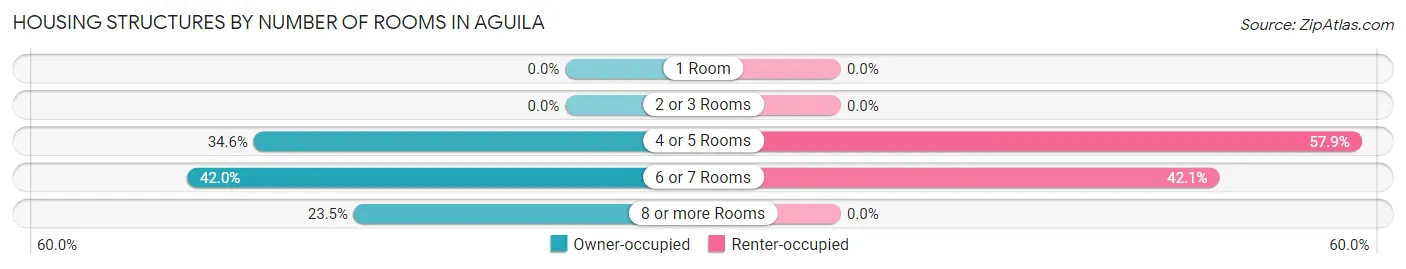
| Number of Rooms | Owner-occupied | Renter-occupied |
| 1 Room | 0 (0.0%) | 0 (0.0%) |
| 2 or 3 Rooms | 0 (0.0%) | 0 (0.0%) |
| 4 or 5 Rooms | 28 (34.6%) | 11 (57.9%) |
| 6 or 7 Rooms | 34 (42.0%) | 8 (42.1%) |
| 8 or more Rooms | 19 (23.5%) | 0 (0.0%) |
| Total | 81 (100.0%) | 19 (100.0%) |
Housing Structure by Heating Type in Aguila
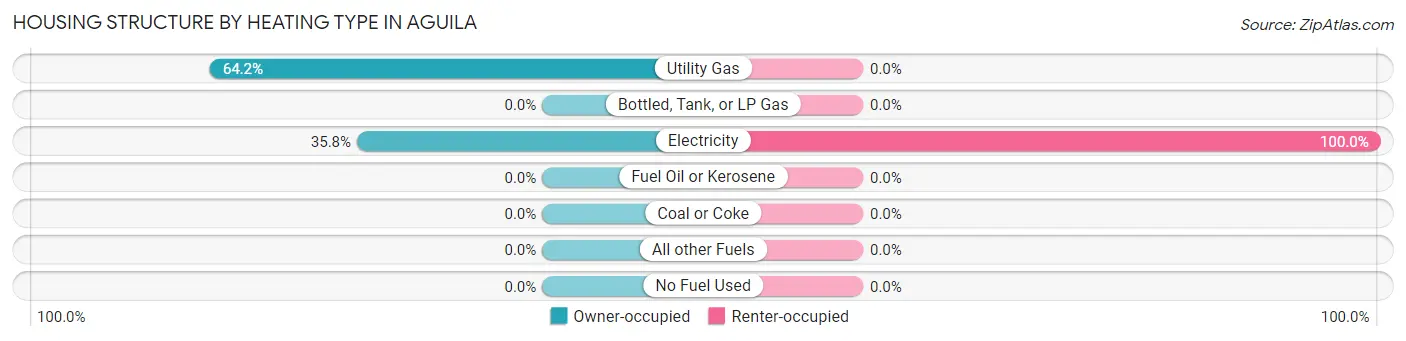
| Heating Type | Owner-occupied | Renter-occupied |
| Utility Gas | 52 (64.2%) | 0 (0.0%) |
| Bottled, Tank, or LP Gas | 0 (0.0%) | 0 (0.0%) |
| Electricity | 29 (35.8%) | 19 (100.0%) |
| Fuel Oil or Kerosene | 0 (0.0%) | 0 (0.0%) |
| Coal or Coke | 0 (0.0%) | 0 (0.0%) |
| All other Fuels | 0 (0.0%) | 0 (0.0%) |
| No Fuel Used | 0 (0.0%) | 0 (0.0%) |
| Total | 81 (100.0%) | 19 (100.0%) |
Household Vehicle Usage in Aguila
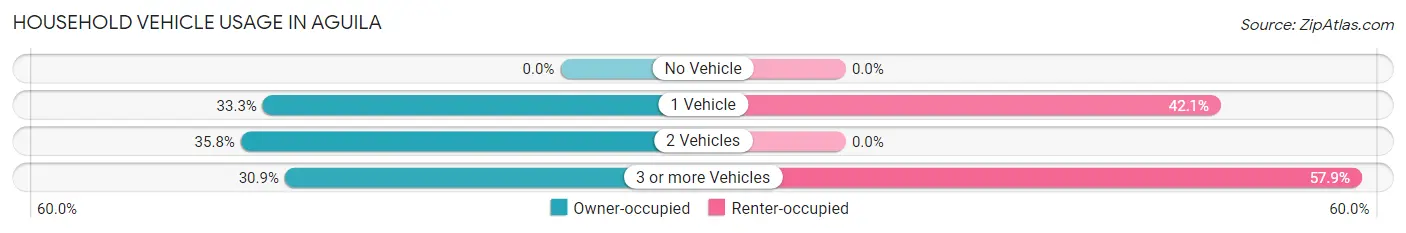
| Vehicles per Household | Owner-occupied | Renter-occupied |
| No Vehicle | 0 (0.0%) | 0 (0.0%) |
| 1 Vehicle | 27 (33.3%) | 8 (42.1%) |
| 2 Vehicles | 29 (35.8%) | 0 (0.0%) |
| 3 or more Vehicles | 25 (30.9%) | 11 (57.9%) |
| Total | 81 (100.0%) | 19 (100.0%) |
Real Estate & Mortgages in Aguila
Real Estate and Mortgage Overview in Aguila
| Characteristic | Without Mortgage | With Mortgage |
| Housing Units | 53 | 28 |
| Median Property Value | $148,600 | $0 |
| Median Household Income | - | - |
| Monthly Housing Costs | $313 | $0 |
| Real Estate Taxes | $783 | $0 |
Property Value by Mortgage Status in Aguila
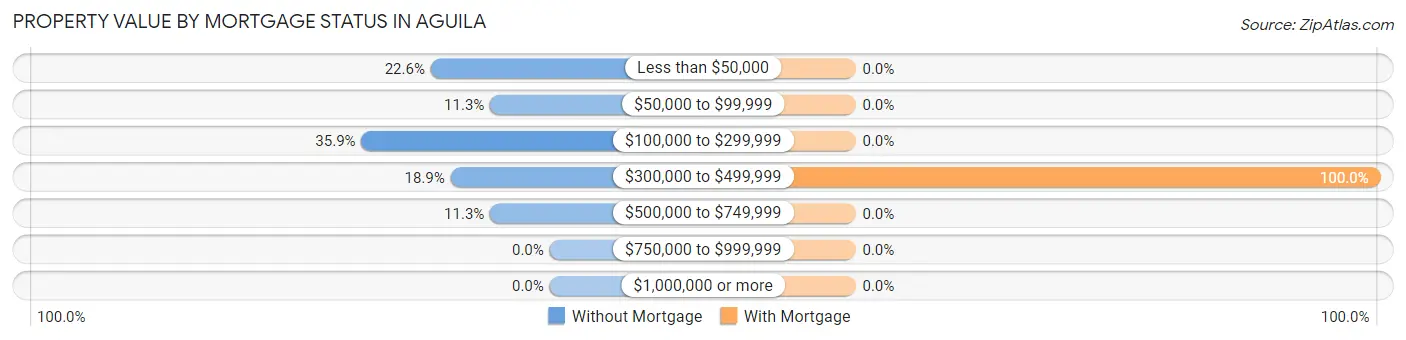
| Property Value | Without Mortgage | With Mortgage |
| Less than $50,000 | 12 (22.6%) | 0 (0.0%) |
| $50,000 to $99,999 | 6 (11.3%) | 0 (0.0%) |
| $100,000 to $299,999 | 19 (35.8%) | 0 (0.0%) |
| $300,000 to $499,999 | 10 (18.9%) | 28 (100.0%) |
| $500,000 to $749,999 | 6 (11.3%) | 0 (0.0%) |
| $750,000 to $999,999 | 0 (0.0%) | 0 (0.0%) |
| $1,000,000 or more | 0 (0.0%) | 0 (0.0%) |
| Total | 53 (100.0%) | 28 (100.0%) |
Household Income by Mortgage Status in Aguila
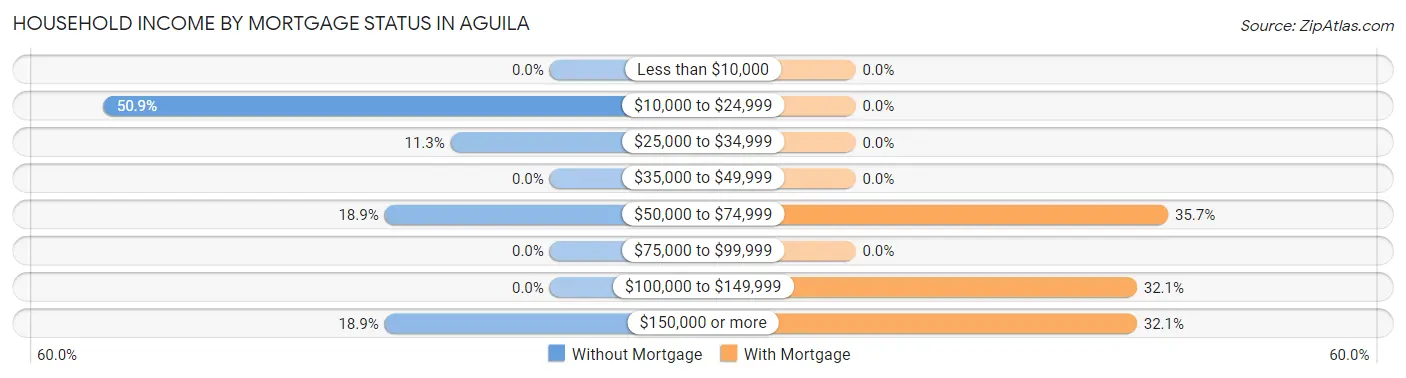
| Household Income | Without Mortgage | With Mortgage |
| Less than $10,000 | 0 (0.0%) | 0 (0.0%) |
| $10,000 to $24,999 | 27 (50.9%) | 0 (0.0%) |
| $25,000 to $34,999 | 6 (11.3%) | 0 (0.0%) |
| $35,000 to $49,999 | 0 (0.0%) | 0 (0.0%) |
| $50,000 to $74,999 | 10 (18.9%) | 10 (35.7%) |
| $75,000 to $99,999 | 0 (0.0%) | 0 (0.0%) |
| $100,000 to $149,999 | 0 (0.0%) | 9 (32.1%) |
| $150,000 or more | 10 (18.9%) | 9 (32.1%) |
| Total | 53 (100.0%) | 28 (100.0%) |
Property Value to Household Income Ratio in Aguila
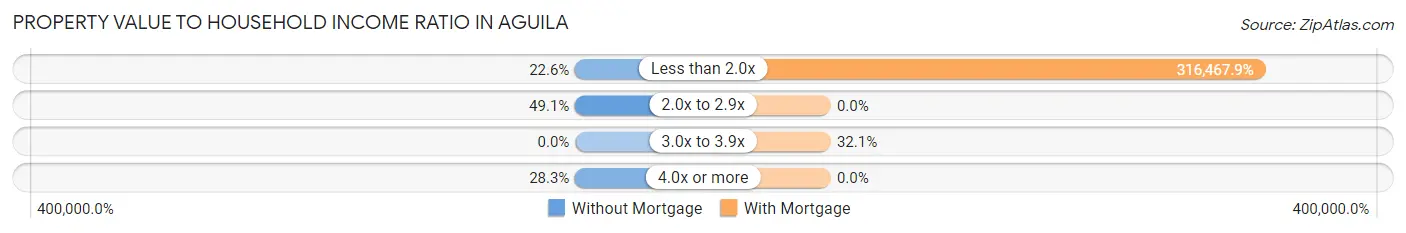
| Value-to-Income Ratio | Without Mortgage | With Mortgage |
| Less than 2.0x | 12 (22.6%) | 88,611 (316,467.9%) |
| 2.0x to 2.9x | 26 (49.1%) | 0 (0.0%) |
| 3.0x to 3.9x | 0 (0.0%) | 9 (32.1%) |
| 4.0x or more | 15 (28.3%) | 0 (0.0%) |
| Total | 53 (100.0%) | 28 (100.0%) |
Real Estate Taxes by Mortgage Status in Aguila
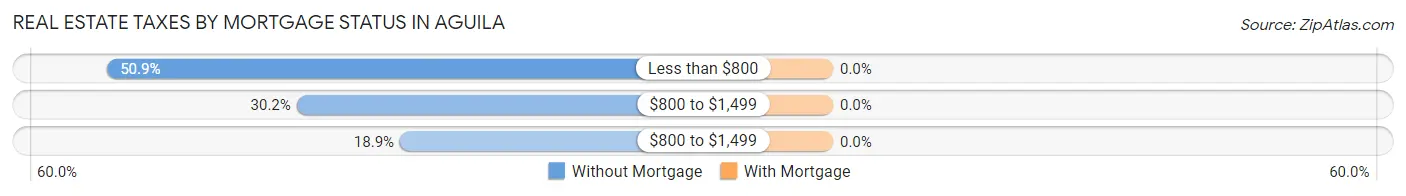
| Property Taxes | Without Mortgage | With Mortgage |
| Less than $800 | 27 (50.9%) | 0 (0.0%) |
| $800 to $1,499 | 16 (30.2%) | 0 (0.0%) |
| $800 to $1,499 | 10 (18.9%) | 0 (0.0%) |
| Total | 53 (100.0%) | 28 (100.0%) |
Health & Disability in Aguila
Health Insurance Coverage by Age in Aguila
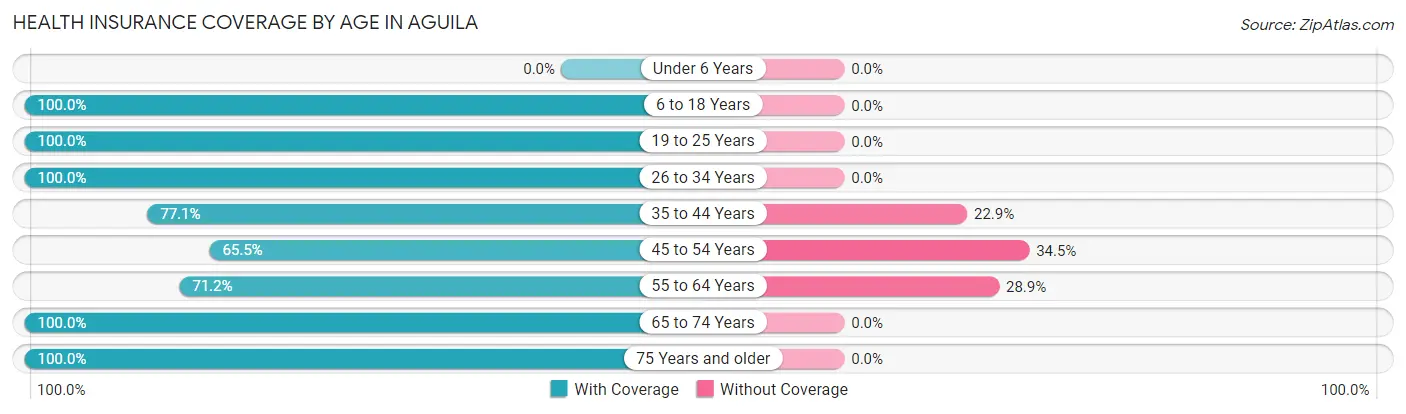
| Age Bracket | With Coverage | Without Coverage |
| Under 6 Years | 0 (0.0%) | 0 (0.0%) |
| 6 to 18 Years | 126 (100.0%) | 0 (0.0%) |
| 19 to 25 Years | 32 (100.0%) | 0 (0.0%) |
| 26 to 34 Years | 21 (100.0%) | 0 (0.0%) |
| 35 to 44 Years | 64 (77.1%) | 19 (22.9%) |
| 45 to 54 Years | 19 (65.5%) | 10 (34.5%) |
| 55 to 64 Years | 37 (71.2%) | 15 (28.8%) |
| 65 to 74 Years | 8 (100.0%) | 0 (0.0%) |
| 75 Years and older | 11 (100.0%) | 0 (0.0%) |
| Total | 318 (87.8%) | 44 (12.1%) |
Health Insurance Coverage by Citizenship Status in Aguila
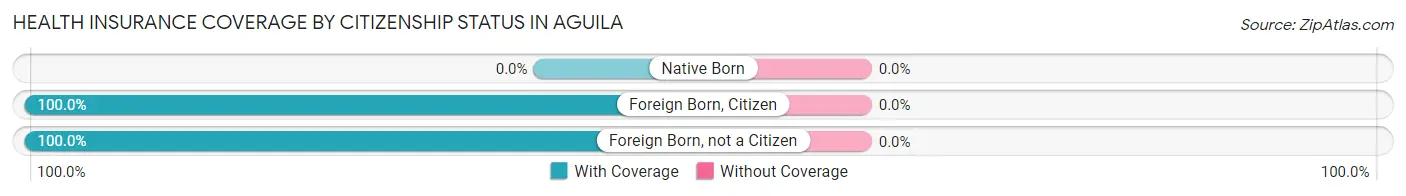
| Citizenship Status | With Coverage | Without Coverage |
| Native Born | 0 (0.0%) | 0 (0.0%) |
| Foreign Born, Citizen | 126 (100.0%) | 0 (0.0%) |
| Foreign Born, not a Citizen | 32 (100.0%) | 0 (0.0%) |
Health Insurance Coverage by Household Income in Aguila
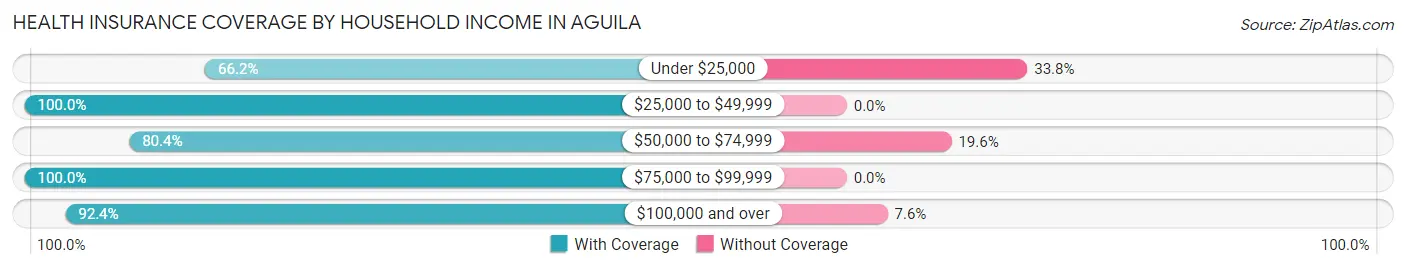
| Household Income | With Coverage | Without Coverage |
| Under $25,000 | 45 (66.2%) | 23 (33.8%) |
| $25,000 to $49,999 | 63 (100.0%) | 0 (0.0%) |
| $50,000 to $74,999 | 41 (80.4%) | 10 (19.6%) |
| $75,000 to $99,999 | 36 (100.0%) | 0 (0.0%) |
| $100,000 and over | 133 (92.4%) | 11 (7.6%) |
Public vs Private Health Insurance Coverage by Age in Aguila
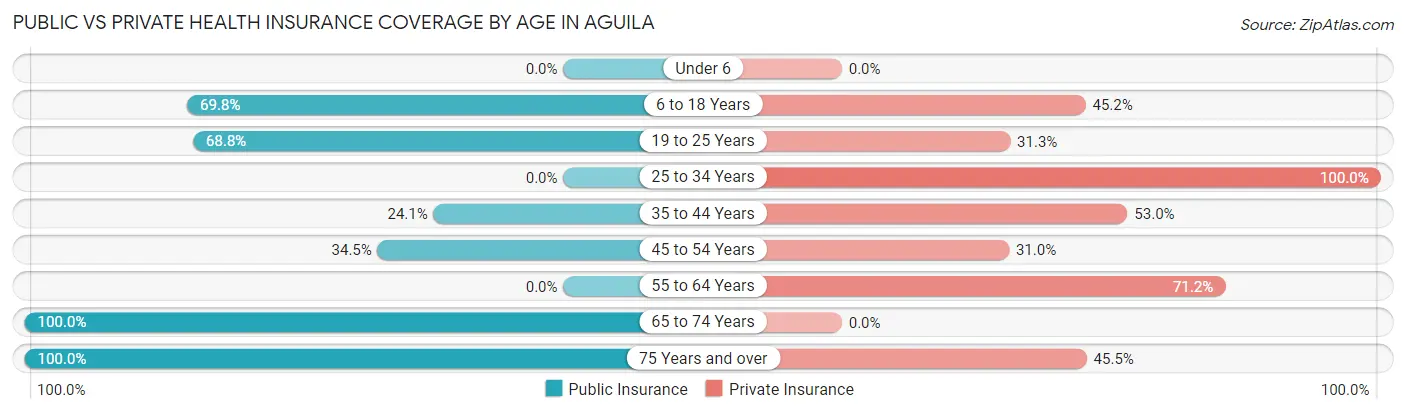
| Age Bracket | Public Insurance | Private Insurance |
| Under 6 | 0 (0.0%) | 0 (0.0%) |
| 6 to 18 Years | 88 (69.8%) | 57 (45.2%) |
| 19 to 25 Years | 22 (68.8%) | 10 (31.2%) |
| 25 to 34 Years | 0 (0.0%) | 21 (100.0%) |
| 35 to 44 Years | 20 (24.1%) | 44 (53.0%) |
| 45 to 54 Years | 10 (34.5%) | 9 (31.0%) |
| 55 to 64 Years | 0 (0.0%) | 37 (71.2%) |
| 65 to 74 Years | 8 (100.0%) | 0 (0.0%) |
| 75 Years and over | 11 (100.0%) | 5 (45.5%) |
| Total | 159 (43.9%) | 183 (50.5%) |
Disability Status by Sex by Age in Aguila
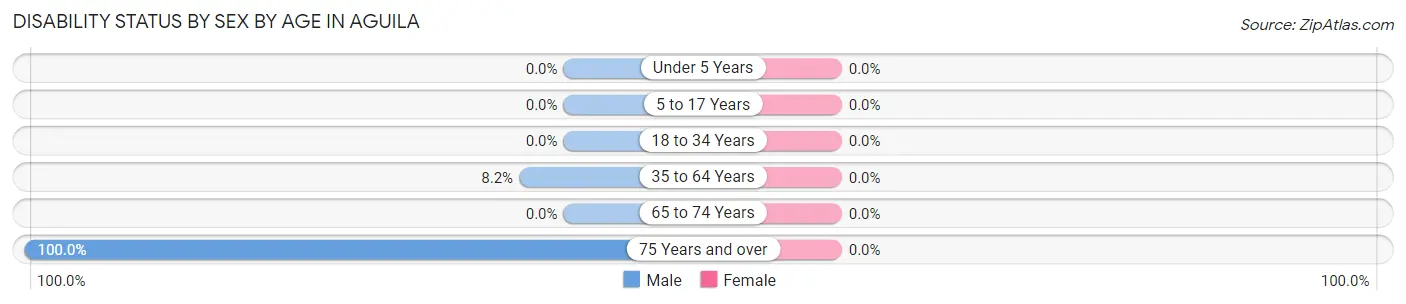
| Age Bracket | Male | Female |
| Under 5 Years | 0 (0.0%) | 0 (0.0%) |
| 5 to 17 Years | 0 (0.0%) | 0 (0.0%) |
| 18 to 34 Years | 0 (0.0%) | 0 (0.0%) |
| 35 to 64 Years | 7 (8.2%) | 0 (0.0%) |
| 65 to 74 Years | 0 (0.0%) | 0 (0.0%) |
| 75 Years and over | 6 (100.0%) | 0 (0.0%) |
Disability Class by Sex by Age in Aguila
Disability Class: Hearing Difficulty
| Age Bracket | Male | Female |
| Under 5 Years | 0 (0.0%) | 0 (0.0%) |
| 5 to 17 Years | 0 (0.0%) | 0 (0.0%) |
| 18 to 34 Years | 0 (0.0%) | 0 (0.0%) |
| 35 to 64 Years | 0 (0.0%) | 0 (0.0%) |
| 65 to 74 Years | 0 (0.0%) | 0 (0.0%) |
| 75 Years and over | 0 (0.0%) | 0 (0.0%) |
Disability Class: Vision Difficulty
| Age Bracket | Male | Female |
| Under 5 Years | 0 (0.0%) | 0 (0.0%) |
| 5 to 17 Years | 0 (0.0%) | 0 (0.0%) |
| 18 to 34 Years | 0 (0.0%) | 0 (0.0%) |
| 35 to 64 Years | 0 (0.0%) | 0 (0.0%) |
| 65 to 74 Years | 0 (0.0%) | 0 (0.0%) |
| 75 Years and over | 6 (100.0%) | 0 (0.0%) |
Disability Class: Cognitive Difficulty
| Age Bracket | Male | Female |
| 5 to 17 Years | 0 (0.0%) | 0 (0.0%) |
| 18 to 34 Years | 0 (0.0%) | 0 (0.0%) |
| 35 to 64 Years | 7 (8.2%) | 0 (0.0%) |
| 65 to 74 Years | 0 (0.0%) | 0 (0.0%) |
| 75 Years and over | 0 (0.0%) | 0 (0.0%) |
Disability Class: Ambulatory Difficulty
| Age Bracket | Male | Female |
| 5 to 17 Years | 0 (0.0%) | 0 (0.0%) |
| 18 to 34 Years | 0 (0.0%) | 0 (0.0%) |
| 35 to 64 Years | 7 (8.2%) | 0 (0.0%) |
| 65 to 74 Years | 0 (0.0%) | 0 (0.0%) |
| 75 Years and over | 0 (0.0%) | 0 (0.0%) |
Disability Class: Self-Care Difficulty
| Age Bracket | Male | Female |
| 5 to 17 Years | 0 (0.0%) | 0 (0.0%) |
| 18 to 34 Years | 0 (0.0%) | 0 (0.0%) |
| 35 to 64 Years | 0 (0.0%) | 0 (0.0%) |
| 65 to 74 Years | 0 (0.0%) | 0 (0.0%) |
| 75 Years and over | 0 (0.0%) | 0 (0.0%) |
Technology Access in Aguila
Computing Device Access in Aguila
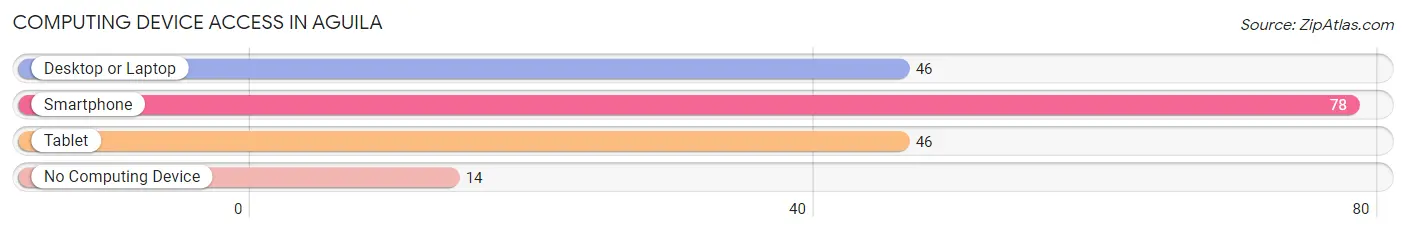
| Device Type | # Households | % Households |
| Desktop or Laptop | 46 | 46.0% |
| Smartphone | 78 | 78.0% |
| Tablet | 46 | 46.0% |
| No Computing Device | 14 | 14.0% |
| Total | 100 | 100.0% |
Internet Access in Aguila
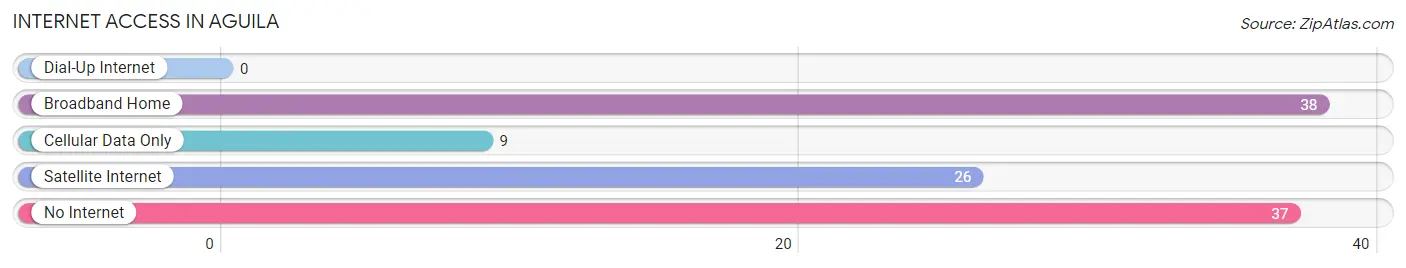
| Internet Type | # Households | % Households |
| Dial-Up Internet | 0 | 0.0% |
| Broadband Home | 38 | 38.0% |
| Cellular Data Only | 9 | 9.0% |
| Satellite Internet | 26 | 26.0% |
| No Internet | 37 | 37.0% |
| Total | 100 | 100.0% |
Aguila Summary
Aguila is a small unincorporated community located in Maricopa County, Arizona. It is situated in the Sonoran Desert, approximately 50 miles northwest of Phoenix. The town is located along the historic U.S. Route 60, which was once a major thoroughfare for travelers heading west. The town is home to a population of approximately 1,000 people, and is known for its rural lifestyle and small-town charm.
History
The area that is now Aguila was first settled by the Hohokam people, who lived in the area for centuries before the arrival of Europeans. The first Europeans to arrive in the area were Spanish explorers, who named the area Aguila, which means “eagle” in Spanish. The area was later settled by ranchers and farmers, who established the town of Aguila in the late 19th century.
The town was officially incorporated in 1910, and the population grew steadily over the next several decades. The town was home to a variety of businesses, including a general store, a post office, a bank, and a hotel. The town also had a school, which was established in 1912.
Geography
Aguila is located in the Sonoran Desert, approximately 50 miles northwest of Phoenix. The town is situated at an elevation of 1,890 feet, and is surrounded by the Harquahala Mountains to the west and the White Tank Mountains to the east. The town is located along the historic U.S. Route 60, which was once a major thoroughfare for travelers heading west.
The climate in Aguila is arid and hot, with temperatures reaching over 100 degrees Fahrenheit in the summer months. The area receives an average of 8 inches of rain per year, and the town is located in a desert environment.
Economy
The economy of Aguila is largely based on agriculture and ranching. The town is home to several farms and ranches, which produce a variety of crops, including alfalfa, cotton, and wheat. The town is also home to a variety of small businesses, including a general store, a post office, a bank, and a hotel.
Demographics
As of the 2010 census, the population of Aguila was 1,000. The town is predominantly white, with approximately 75% of the population identifying as white. The remaining 25% of the population is made up of Hispanic or Latino individuals. The median household income in Aguila is $35,000, and the median age is 37. The town has a poverty rate of 17%, which is higher than the national average.
Common Questions
What is the Total Population of Aguila?
Total Population of Aguila is 362.
What is the Total Male Population of Aguila?
Total Male Population of Aguila is 153.
What is the Total Female Population of Aguila?
Total Female Population of Aguila is 209.
What is the Ratio of Males per 100 Females in Aguila?
There are 73.21 Males per 100 Females in Aguila.
What is the Ratio of Females per 100 Males in Aguila?
There are 136.60 Females per 100 Males in Aguila.
What is the Median Population Age in Aguila?
Median Population Age in Aguila is 36.2 Years.
What is the Average Family Size in Aguila
Average Family Size in Aguila is 4.4 People.
What is the Average Household Size in Aguila
Average Household Size in Aguila is 3.6 People.
What is Per Capita Income in Aguila?
Per Capita income in Aguila is $21,385.
What is the Median Family Income in Aguila?
Median Family Income in Aguila is $88,889.
What is Inequality or Gini Index in Aguila?
Inequality or Gini Index in Aguila is 0.45.
How Large is the Labor Force in Aguila?
There are 167 People in the Labor Forcein in Aguila.
What is the Percentage of People in the Labor Force in Aguila?
65.7% of People are in the Labor Force in Aguila.
What is the Unemployment Rate in Aguila?
Unemployment Rate in Aguila is 12.0%.